Embed Size (px)
Citation preview

THE WORLD BANK GROUP WASHINGTON, D.C.
Monitoring Road Works Contracts and Unit Costs for Enhanced Governance in Sub-Saharan Africa Victoria Alexeeva, Gouthami Padam and Cesar Queiroz
TRANSPORT SECTOR BOARD
TRANSPORT PAPERS TP-21
SEPTEMBER 2008
46728P
ublic
Dis
clos
ure
Aut
horiz
edP
ublic
Dis
clos
ure
Aut
horiz
edP
ublic
Dis
clos
ure
Aut
horiz
edP
ublic
Dis
clos
ure
Aut
horiz
ed


MONITORING ROAD WORKS CONTRACTS AND UNIT COSTS FOR ENHANCED GOVERNANCE IN SUB-SAHARAN AFRICA Victoria Alexeeva, Gouthami Padam and Cesar Queiroz
THE WORLD BANK WASHINGTON, D.C.

© 2008 The International Bank for Reconstruction and Development / The World Bank 1818 H Street NW Washington, DC 20433 Telephone 202-473-1000 Internet: www.worldbank.org This volume is a product of the staff of The World Bank. The findings, interpretations, and conclusions expressed in this volume do not necessarily reflect the views of the Executive Directors of The World Bank or the governments they represent. The World Bank does not guarantee the accuracy of the data included in this work. The boundaries, colors, denominations, and other information shown on any map in this work do not imply any judgment on the part of The World Bank concerning the legal status of any territory or the endorsement or acceptance of such boundaries. Rights and Permissions The material in this publication is copyrighted. Copying and/or transmitting portions or all of this work without permission may be a violation of applicable law. The International Bank for Reconstruction and Development / The World Bank encourages dissemination of its work and will normally grant permission to reproduce portions of the work promptly. For permission to photocopy or reprint any part of this work, please send a request with complete information to the Copyright Clearance Center Inc., 222 Rosewood Drive, Danvers, MA 01923, USA; telephone: 978-750-8400; fax: 978-750-4470; Internet: www.copyright.com. All other queries on rights and licenses, including subsidiary rights, should be addressed to the Office of the Publisher, The World Bank, 1818 H Street NW, Washington, DC 20433, USA; fax: 202-522-2422; e-mail: [email protected]. To order additional copies of this publication, please send an e-mail to the Transport Help Desk [email protected] Transport publications are available on-line at http://www.worldbank.org/transport/
i
CONTENTS FOREWORD .............................................................................................................V ACKNOWLEDGEMENTS ......................................................................................... VII EXECUTIVE SUMMARY ........................................................................................... IX 1 INTRODUCTION: ADDRESSING CORRUPTION RISKS IN THE ROAD SECTOR ........ 1 2 BUILDING A NEW DATASET OF ROAD WORKS CONTRACTS OF BANK- FINANCED
PROJECTS IN SUB-SAHARAN AFRICA............................................................ 3 2.1 OBJECTIVES ............................................................................................................. 3 2.2 DESCRIPTION OF DATA .............................................................................................. 3 2.3 MAIN VARIABLES....................................................................................................... 3 2.4 METHODOLOGY......................................................................................................... 6 2.5 DATA SOURCE........................................................................................................... 7 2.6 OBSERVATIONS ........................................................................................................ 7 2.7 SUGGESTIONS FOR RECORDS MANAGEMENT................................................................. 7
3 ANALYZING TRENDS AND KEY INDICATORS ....................................................... 9 3.1 STATISTICAL TRENDS ................................................................................................ 9 3.2 REHABILITATION & RECONSTRUCTION (2007 US$/KM) .................................................16 3.3 EXAMINATION OF ‘RED FLAGS’....................................................................................24 3.4 COMPARATIVE ANALYSIS...........................................................................................27 3.5 COSTS ANALYSIS .....................................................................................................32
4 EXPLAINING WHAT DRIVES ROAD CONSTRUCTION COSTS: ISSUES ADDRESSED
BY PROJECT IMPLEMENTING AGENCIES ..................................................... 35 4.1 REASONS FOR HIGH BIDS..........................................................................................35 4.2 REASONS FOR LOW RESPONSE TO INVITATION TO BID ..................................................37 4.3 REASONS FOR COST OVERRUNS AND TIME EXTENSIONS ................................................38
5 ENHANCING ACCOUNTABILITY AND CONTROL OF CORRUPTION IN BANK-
FINANCED PROJECTS IN THE ROAD SECTOR IN SUB-SAHARAN AFRICA ...... 41 5.1 RECOMMENDED ACTIONS ..........................................................................................41 5.2 CONCLUSIONS.........................................................................................................42
REFERENCES .........................................................................................................73

ii MONITORING ROAD WORKS CONTRACTS AND UNIT COSTS FOR ENHANCED GOVERNANCE IN SUB-SAHARAN AFRICA
ANNEXES ANNEX A: List of Red Flags ...................................................................................................45 ANNEX B: Comparison of Unit Costs and Engineer’s Estimate .....................................................59 ANNEX C: Results of Statistical Analysis of Unit Costs................................................................63 ANNEX D: Data on Bidding Information...................................................................................65 ANNEX E: Data on Cost Information .......................................................................................67 ANNEX F: Data on Supervision Consultancy Contracts ...............................................................69 ANNEX G: Data on Bridge Works Contracts..............................................................................71 LIST OF TABLES Table 2.1: List of road projects in Sub-Saharan Africa included in the study.................................... 4 Table 2.2: Main variables of the study....................................................................................... 5 Table 3.1: Percentage of contracts with cost overruns of more than 15 percent, by country .............11 Table 3.2: Time elapsed between bid opening and contract signing dates, by country .....................15 Table 3.3: Cost per km of a 2-lane road by type of work for inter-urban roads (2007 US$/km) ........16 Table 3.4: Average cost per km of a 2-Lane road by type of work and type of road, by country........16 Table 3.5: Average unit costs, by country (2007 US$)................................................................17 Table 3.6: Leading contractors by awarded contract totals ..........................................................20 Table 3.7: Statistical averages by geographical groups...............................................................20 Table 3.8: Cost per km a 2-lane road by geographical group and type of work (2007 US$) ..............21 Table 3.9: Average unit costs by geographical groups of contractors (2007 US$) ...........................21 Table 3.10: Average cost of supervision per km a 2-lane road by country (2007 US$).....................23 Table 3.11: Leading supervision consultants .............................................................................24 Table 3.12: Factors influencing unit costs - summary of results ...................................................33 LIST OF FIGURES Figure 3.1: Difference between contract values and engineer’s estimates, averages and ranges .......10 Figure 3.2: Cost overruns, averages and ranges by country ........................................................10 Figure 3.3: Difference between contract values and engineer’s estimates, and cost overruns ...........12 Figure 3.4: Average delay in completion of work in months, by country ........................................12 Figure 3.5: Average number of firms buying bidding documents, bidders,
and bidders accepted for detailed examination, by country .................................................13 Figure 3.6: Average number of pre-qualified firms, bidders, and bidders accepted
for detailed examination, by country................................................................................14 Figure 3.7: Distribution of the number of bidders, by contracts....................................................14 Figure 3.8: Percentage of contractors by geographical group.......................................................19 Figure 3.9: Share of total amounts of contracts awarded, by geographical group............................19 Figure 3.10: Ratio of supervision contract value to road works contract value ................................22 Figure 3.11: Percentage of supervision contracts, by geographical group ......................................23 Figure 3.12: Frequency of different types of red flags in the sample .............................................28 Figure 3.13: Frequency of types of red flags by country..............................................................29 Figure 3.14: Pattern of types of red flags in the contracts with complaints received by INT ..............30 Figure 3.15: Frequency of red flags for unit costs in the contracts with complaints
received by INT in comparison with other contracts in the sample........................................31 Figure 3.16: Control of corruption index and number of red flags
normalized by number of the reviewed contracts per country .............................................32

Contents iii
LIST OF BOXES Box 3.1: Detection of collusion and bid rigging in highway construction contracts...........................26 Box 4.1: Evaluation of the effect of price increase on contract major works items...........................36 Box 4.2: Increases in workload among contractors in East and Southern Africa..............................38 Box 4.3: Termination of contracts due to non-performance of the contractor .................................39 Box 4.4: Reasons for the extension of time to complete road works .............................................39


v
FOREWORD
Scaling up its support for governance and anticorruption, the World Bank aims to ensure that governance issues are addressed in all sectors where it is engaged. The identification of points where the sector is most vulnerable, and prevention of opportunities for corruption, are among key elements of the World Bank’s governance and anticorruption strategy. The transport sector is increasingly targeting its efforts at developing strategies to improve governance and tackle corruption in its operations. Measures have been taken to reduce the risks of corruption in project design and at each stage of the project cycle are applied across the transport units. A number of recommendations have already been developed to synthesize the dimension of sector corruption and identify potential corrupt activities in Bank-financed operations in the transport sector. This study is intended to develop a list of quantitative indicators to recognize and track vulnerabilities to corruption in the roads projects funded by the Bank. It is based on the procurement and implementation of the road works contracts in Sub-Saharan Africa. The study develops a new cross-country database with information on bidding, costs, performance, and other details of the Bank-financed road works contracts. An inventory of risks is performed for each contract using a checklist of alert indicators or red flags, which were defined from the study database. The data analysis captures a pattern of indicators consistent with the presence of allegations of corruption. This is achieved through comparison of the indicators with the road works contracts that had complaints received by the Bank’s Department of Institutional Integrity (INT) and other contracts in the sample. While the findings of the study are specific to the road works contracts in Sub-Saharan Africa, the diagnostic methods developed to recognize and track vulnerabilities to corruption in the road sector could be applied across other countries and regions. As various other task teams have been already using these data, this unique dataset and indicators create an important platform addressing governance concerns in the road sector operations financed by the Bank. Marc H. Juhel Transport Sector Manager
Energy, Transport and Water Department


vii
ACKNOWLEDGEMENTS
This report was prepared by Victoria Alexeeva, Gouthami Padam, and Cesar Queiroz. John Hine was the team leader and provided guidance and advice throughout the preparation of the study. Detailed comments and valuable inputs were received from the peer reviewers: Anil S. Bhandari, Asha Ayoung, Ben Gericke, Charles J. Kenny, Henry G. Kerali, Maria Marcela Silva, and Michel Bellier. Additional contributions to the report were received from Yoshimichi Kawasumi, Marcelo Donolo, and Bobo Lu. Special thanks are extended to the team leaders and their team members of the Africa Transport Unit (AFTTR) for their invaluable support in the data collection process, in particular; Tawia Addo-Ashong, Nina Jones, Shalonda Robinson, Charity Boafo-Portuphy, Justin Runji, Dieter E. Schelling, Yonas E. Mchomvu, England R. Maasamba, Ben Gericke, Ajay Kumar, Desta Wolde Woldeargey, Dave Quarshie, Yoshimichi Kawasumi, Yeshi Gizaw, Yitzhak A. Kamhi, Gifty Sarfo-Mensah, Brahim Ould Abdelwedoud, Moustapha Ould El Bechir, Yahya Ould Aly Jean, Maimouna Toure, Supee Teravaninthorn, Davies Bwalya Makasa. This study has also benefited from discussions with other World Bank colleagues, including Vivien Foster and Atsushi Iimi. The team is particularly grateful to Annie Yau, Nigel M. Bartlett, and Anders H. Agerskov of the Bank’s Department of Institutional Integrity who provided important insights and helpful comments on the data analysis and outputs of this report. Their expertise and experience have been essential to the study. Also their openness, participation and transparency throughout the process have helped the team to achieve its objectives. This study was financed by the Dutch Government through the Bank-Netherlands Partnership Program (BNPP) and administered through the Public Sector Governance Group (PRMPS) and the Transport Unit (ETWTR).


ix
EXECUTIVE SUMMARY
A set of indicators is constructed to perform comparative assessments of the contract procurement and implementation processes in the road sector across 13 countries in Sub-Saharan Africa: Congo, Democratic Republic of Congo (DRC), Ethiopia, Ghana, Kenya, Malawi, Mauritania, Mozambique, Madagascar, Nigeria, Tanzania, Uganda, and Zambia. A new specialized dataset is generated for 109 road and bridge works contracts and 76 supervision consultancy contracts between 1999 and 2007 in 22 projects financed by the World Bank. The road sector contracting of the Bank-financed projects in the reviewed countries is characterized by a limited number of firms dominating large-scale road works contracts. The market is split between the African firms and mainly the Chinese and European contractors. The largest contracts are generally awarded to the international contractors, in particular those from China. The overall number of pre-qualified firms to bid for large works appears to be competitive (more than six firms on average), however, the actual participation in tenders is quite low—only about half of the pre-qualified firms bid. Nigeria and Ghana have the highest number of pre-qualified firms. In Nigeria, however, the number of bidders turns to be one of the lowest. Costs The African firms outperform the Chinese and European contractors in a number of indicators related to the procurement process but underperform in the implementation. For the African firms, the pattern shows a narrower average range between the contract values and their engineer’s estimates, a shorter period to evaluate the bids and sign the contracts, and a higher level of competition. However, they lag behind on the indicators related to the implementation process incurring higher cost overruns and longer delays. The African firms have a cost advantage over the Chinese and European firms. They are in a tight competition with the Chinese firms whose cost to implement road works of similar nature is almost the same. The average cost of road works carried out by the European contractors is considerably higher.This is perhaps a result of their higher initial management and overhead costs. Supervision costs There is a wide range of average cost of supervision per kilometer of similar road works across the countries. The cost to supervise a kilometer of an inter-urban road of the rehabilitation and reconstruction works is US$15,422 in Ghana, and US$28,153 in Kenya. In Nigeria, the average cost of supervision of an urban road is US$38,024. Contract values and engineer’s estimates The bid prices sometimes exceed the engineer’s estimates by an excessive margin. The values of a quarter of the road works contracts in the sample are 30 percent or higher than their estimated costs. These high bid rates are observed in each country in the sample, except Ghana. The contract values in Ghana are consistently lower than their engineer’s estimates. This may be a result of fierce competition, which is traditionally observed in Ghana.

x MONITORING ROAD WORKS CONTRACTS AND UNIT COSTS FOR ENHANCED GOVERNANCE IN SUB-SAHARAN AFRICA
Red flags The data are examined using a number of “red flags,” that is alert indicators of potential presence of fraud and corruption at various stages of the project cycle. The benchmarks for the selected indicators have been proposed by the report team and jointly reviewed with the World Bank’s Procurement Policy and Services Group (OPCPR). The presence of red flags does not prove that corrupt or fraudulent practices take place in the procurement and implementation of a contract. Rather, it is a warning signal of a potential procurement and implementation problem that may justify further investigation. At the same time, the absence of red flags does not imply that fraud or corruption did not occur. Selected red flags examined on the newly generated dataset of the road works contracts in Sub-Saharan Africa are:
• Period between bid opening and contract signing dates is more than seven months; • Cost increases by more than 20 percent during implementation; • Time overrun is more than 30 percent of the originally contracted period; • Contract value is more than 20 percent above its engineer’s estimate;
• Half or more firms buying bidding documents do not bid;
• 20 percent or more of pre-qualified firms do not bid;
• Difference between winning bid and next lowest bid is within 2 percent;
• Difference between contract price and read-out bidding price is more than 10
percent;
• Winning bid is not the lowest bid accepted for detailed examination;
• Only one or two bidders;
• Cost per km for similar work is higher than the 75th percentile. For the four types of work included in the study (rehabilitation/reconstruction, upgrade to paved, re-graveling, and periodic maintenance) a statistical distribution was computed to determine the number of contracts with cost per km above the 75th percentile.
• Unit Road Work Costs are higher than the 75th percentile. For the unit costs included in
the study a statistical distribution was computed to determine the number of contracts with unit costs above the 75th percentile (asphalt concrete, Portland cement concrete, gravel subbase, gravel base, crushed stone base, soft and hard earthworks).
Frequency of red flags in the reviewed road works contracts The most frequent appearances of red flags reflect the overall trends in the procurement and implementation processes in the reviewed countries of Sub-Saharan Africa. The red flags with the highest frequency in road works contracts are: (i) period between bid opening and contract signing dates is more than 7 months; (ii) time overrun is more than 30 percent of the originally

Executive Summary xi
contracted period; (iii) 20 percent or more of pre-qualified firms do not bid; and (iv) contract value is more than 20 percent above its engineer’s estimate. Pattern of red flags in contracts with complaints received by INT The Department of Institutional Integrity (INT) received complaints on 14 contracts from the sample of 109 road works contracts (13 percent of total). The nature of complaints was mainly related to allegations of bidder collusion or bid rigging, paying bribes, and bidding irregularities. The pattern of red flags in the contracts with complaints received by the INT slightly differs from the overall pattern observed across all the contracts in the sample. The most frequent red flags in the contracts with complaints received by the INT are (i) 20 percent or more of prequalified firms do not bid; (ii) period between bid opening and contract signing dates is more than 7 months; (iii) cost per kilometer for similar work is higher than the 75th percentile; and (iv) contract value is more than 20 percent above its engineer’s estimate. The frequency of the “red flag” of time overrun of more than 30 percent from the originally contracted period is lower in the contracts with complaints received by the INT. In comparison with other contracts in the sample, there appears to be a high number of red flags related to gravel among the road works unit costs in the contracts with complaints received by the INT. Other unit costs seem to repeat the trend observed across the road works contracts in the sample. Recommended actions
The following selected recommendations are geared towards enhancing accountability and attaining a higher degree of control of corruption in Bank-financed projects in the road sector in Sub-Saharan Africa:
• Consider establishing a tighter timeframe for contract signing. The extensions of bid
validity period within which the contract should be awarded, should be less flexible. The Bank’s procurement guidelines should be followed more strictly. The guidelines provide for an extension of bid validity “if justified by exceptional circumstances” which could be requested for the minimum period required to complete evaluation, obtain the necessary approvals, and award the contract.1 A delayed process of the contract enforcement could be to some extent a result of the weak roads management capacity, regulatory environment, and administrative burdens. However, this underlying inefficiency is also exacerbated by weak governance providing opportunities for corrupt practices and back-door negotiations.
• Allow using a selection procedure of post-qualification instead of pre-qualification in
bidding for large works. Knowledge of other pre-qualified firms carries a potential risk of collusion. Also, other firms may choose not to bid due to a potential collusion of well-connected companies. This results in unfair competition and market manipulation. In order to facilitate bidder competition and avoid collusion, the proposal of road agencies to use post-qualification for contracts above the pre-qualification threshold values could be endorsed.
1 World Bank 2006.Guidelines: Procurement under IBRD Loans and IDA Credits, Section II, Para 2.57. Washington,
DC: http://go.worldbank.org/RPHUY0RFI0

xii MONITORING ROAD WORKS CONTRACTS AND UNIT COSTS FOR ENHANCED GOVERNANCE IN SUB-SAHARAN AFRICA
• Create a system to monitor and assess contractors’ performance and associated costs of works. Tracking of information on prime contractors in the road industry in the region could mitigate risks of misjudging on qualifications of firms as well as ensure due diligence on poor performers. The system could include a firm’s profile, the number and values of contract awards, unit cost of works, satisfactory completion of the job, completion within the schedule, quality of works, and so on. This database could assist local road agencies to be more efficient in completing evaluations. The rankings of major contractors and consultants could identify strong performers who could be encouraged to bid or hired through direct contracting in case of emergencies. This registry would provide performance incentives as well as facilitate accountability.
• Strengthen monitoring of the procurement and implementation processes to
enhance detection of the risks to integrity. A detailed record and information, if available in the World Bank system, could reduce incentives for firms and other entities to participate in collusion, bid rigging, and other corrupt practices. It is important to generate the data to increase accountability. This study could be replicated in other regions where the World Bank operates as it provides benchmarks and references against which individual projects performance or outcomes can be compared. It also establishes thresholds above which there may be causes for concerns or for further investigations.

1
1 INTRODUCTION: ADDRESSING CORRUPTION RISKS IN THE ROAD SECTOR
The new measures are emerging to strengthen integrity in the transport sector and to address sector-specific vulnerabilities to corruption. Operational practices are moving forward with more effective ways to address governance weaknesses in the design of road projects. The following are selected examples of such initiatives in the roads sector:
• The Paraguay road project team developed a set of alert indicators and red flags together with the Bank’s Department of Institutional Integrity (INT) and offered a control framework to mitigate those risks in the road maintenance project.2 The team received an Infrastructure Networks Anticorruption Award for incorporating innovative anticorruption elements into the project design.
• The Philippines program for the National Roads Improvement and Management (APL, Phase 2)
embedded several anticorruption measures in the various project components and introduced safeguards to deal with collusion and bid-rigging. Specific measures include the computerization of procurement and contract management systems, upgrading of the civil works registry for processing of qualification information, a parallel independent procurement evaluation, the enhanced procurement controls to ensure the reliability of contract cost estimates; detection of over-pricing through bid analysis, enhancement of supervision control over contract variations, and dissemination of complaints mechanisms in bid documents. 3
• In the Orissa State Roads Project of India, the anticorruption action plan is divided in three
categories: (i) preventing corruption, through procurement reforms and business process reengineering in corruption prone sectors and service delivery institutions; (ii) enforcement actions, through establishment of internal vigilance units and new special courts to try corruption offences; and (iii) citizen ‘voice’ and public awareness, through provision of information to communities about their service delivery rights.4
• A roads project is being considered in Indonesia for which the proposed anticorruption plan
would be based on the following pillars: (i) enhanced disclosure, through creation of a webpage on the official website of the implementing agency that provides monthly updated information on project activities; (ii) civil society oversight, through participation of representatives of civil society in public bid openings and other key procurement processes; (iii) mitigation of collusion risks, through tracking key indicators related to procurement and periodic analysis of bids; (iv) mitigation of forgery and fraud risks, through conducting regular interim audits by third parties; (v) complaint handling system, through monitoring of complaints and tracking status of investigations; and (vi) sanctions and remedies, through enforcement of sanctions and remedial actions.
2 World Bank. 2006. Project Appraisal Document for a Road Maintenance Project in Paraguay. Report No. 36421.
Washington, DC: http://go.worldbank.org/4QY224PCT0 3 World Bank.2008. Project Appraisal Document for Phase 2 of the National Roads Improvement and Management
(APL) Program in the Republic of the Philippines. Report No. 40764. Washington, DC:
http://go.worldbank.org/26MJ5YPFA0 4 World Bank 2007. Project Information Document for Orissa State Roads Project. Washington, DC:
http://go.worldbank.org/6GUYHR8AM0

2 MONITORING ROAD WORKS CONTRACTS AND UNIT COSTS FOR ENHANCED GOVERNANCE IN SUB-SAHARAN AFRICA
An analytical framework was established to assess the risks of corruption in transport by Paterson and Chaudhuri.5 The authors synthesize the dimension of the sector corruption, looking specifically at the types of corrupt activities prevalent in the transport sector, the state capture and administrative corruption in the road sector, the mechanics of transport corruption at the project and transaction level, and a preventive strategy for enhancing institutional integrity in transport. A detailed corruption mapping matrix was developed by the India transport team that guides through each step of the project cycle addressing chances of corruption and misuse of funds. The matrix identifies activities where corruption occurs throughout three main project stages: (i) planning and design, (ii) procurement, and (iii) project execution, contract administration, monitoring and evaluation. At each stage it evaluates opportunities for corruption and recommends remedies and appropriate sanctions. The matrix is incorporated in a guidance note for new projects in India.6
The current initiative seeks to develop a list of quantitative indicators to recognize and track vulnerabilities to corruption in the road sector projects of the Bank. The study is based on a new specialized dataset generated for the road sector contracts of Bank-financed projects in Sub-Saharan Africa. It is organized as follows: Chapter 2 describes the data and a set of indicators constructed to perform comparative assessments of the procurement and implementation processes across 13 African countries. Chapter 3 points out the trends in selected key indicators and performs an inventory of risks for each road works contract using a checklist of possible entry points of corrupt activities or red flags. Through comparison of the road works contracts that had complaints received by the Bank’s Department of Institutional Integrity (INT) and other contracts in the sample, it examines if the data exhibit a pattern of indicators consistent with the presence of allegations of corruption or fraud. Chapter 4 looks at selected issues such as high bid rates, low response to invitation to bid, and cost and time overruns as they were addressed by the project implementing agencies. Chapter 5 provides selected recommendations to enhance accountability and control of corruption in the road projects financed by the World Bank.
5 Paterson, W. D. O., and P. Chaudhuri.. 2007. Making Inroads on Corruption in the Transport Sector through
Control and Prevention. In “The Many Faces of Corruption: Tracking Vulnerabilities at the Sector Level,” ed. J.
Edgardo Campos and Sanjay Pradhan. 295-334.Washington, DC: World Bank. http://go.worldbank.org/OZLE95YA50 6 World Bank.2008. Reducing Fiduciary Risk through Increased Transparency and Accountability. A Guidance Note
for New Projects in India. Washington, DC

3
2 NEW DATASET OF ROAD WORKS CONTRACTS OF BANK- FINANCED PROJECTS IN SUB-SAHARAN AFRICA
2.1 OBJECTIVES
The objectives of creating a new database are to establish a framework for cross-country comparisons of the procurement processes and implementation of road works contracts in Bank-funded projects, develop a set of alert indicators or red flags based on quantifiable criteria to recognize and track vulnerabilities to corruption in the roads sector, and facilitate measurement of the performance of road works contracting in projects financed by the Bank. 2.2 DESCRIPTION OF DATA
This specialized dataset is generated for the road sector contracts of Bank-financed projects in Sub-Saharan Africa. It is built upon the data gathered from the contracts procurement and implementation documentation of the roads projects in 13 countries: Congo, Democratic Republic of Congo (DRC), Ethiopia, Ghana, Kenya, Malawi, Mauritania, Mozambique, Madagascar, Nigeria, Tanzania, Uganda, and Zambia. The data sample covers 109 roads and bridges works contracts and 76 supervision consultancy contracts between 1999 and 2007. This is a random sample of completed and on-going road sector contracts in Sub-Saharan Africa. The range of road and bridge works contract values is between US$595,518 (Congo) and US$58,436,429 (Kenya). The time value of contracts is standardized by firstly converting the contract amount into a US dollar amount based on the exchange rate of the date of contract signature, and then inflating this amount with reference to the US Consumer Price index (pro rata in the case of contracts signed in the course of a year). Contracts signed in 2007 are not adjusted further. The list of roads projects and the corresponding number of contracts reviewed for each country is presented in Table 2.1 2.3 MAIN VARIABLES
The dataset builds upon the Road Costs Knowledge System (ROCKS)7 developed by the World Bank’s Transport Unit and goes beyond its scope including more variables. In particular, it includes a more detailed bidding information covering separately contracts with a pre-qualification requirement and without pre-qualification, data on consultants supervising relevant road works contracts, and names and nationalities of bidders participating in tenders. It also adds such road works unit costs as single and double surface treatment (US$/m2), and unit costs of subbase (gravel, crushed stone) and earthworks (soft, hard), both in US$/m3. The present database also distinguishes between contract cost per km (contracted value), its estimated cost (generated by design engineer), and actual cost (taking into account variation orders). The new database classifies roadwork activities into four main categories: rehabilitation/reconstruction, upgrade to paved, re-graveling, and periodic maintenance. The roads are divided into three types: inter-urban, urban, and rural access. This road characteristics method was adapted from the Africa Infrastructure Country Diagnostic Study (AICD).8 A set of main variables and their characteristics is presented in Table 2.2.
7 World Bank. Road Costs Knowledge System (ROCKS): http://go.worldbank.org/NJQG1ABB60 8 World Bank.2008. Evidence of Unit Costs of Infrastructure Projects in Sub Saharan Africa

4 MONITORING ROAD WORKS CONTRACTS AND UNIT COSTS FOR ENHANCED GOVERNANCE IN SUB-SAHARAN AFRICA
Table 2.1: List of road projects in Sub-Saharan Africa included in the study
Country Year Project ID No. of Road and Bridge Works
Contracts
Congo 2004-2005 P074006- Emergency Infrastructure Rehabilitation and Living Conditions Improvement Project
8
1999-2001 P000755- Road Sector Development Program Support
3
2004-2006 P044613- Road Sector Development Support Program Phase Two (RDSP) II (APL I)
6
Ethiopia
2006 P082998- Road Sector Development Support Program II (RSDSP II- APL 2)
2
Mauritania* 2003-2006 P069095- Urban Development Program 3 Zambia 1999-2003 P003236: Roads Sector Investment Program
Support Project 8
2000 P000957- Highway Sector Investment Programme (HSIP)
1 Ghana
2002-2006 P050623- Road Sector Development Programme (RSDP)
9
Malawi 2000-2005 P001666- Road Maintenance and Rehabilitation Project (ROMARP)
7
Mozambique 2004-2006 P001785- Roads and Bridges Management and Maintenance Program
10
Kenya 2006 P082615- Northern Corridor Transport Improvement Project (NCTIP)
4
2004-2006 P069901- Community-Based Urban Development Project
9 Nigeria
2005 P074963- Lagos Urban Transport Project 5 2005 P078387- Central Transport Corridor Project 5 Tanzania
2000-2002 P002770- Integrated Roads Project (02)/TANZANIA ROADS II
5
2002 P057007- ELNINO Emergency Road Repair Project
1
2007 P074079- Road Development Programme Phase III (RDDP III)
1
Uganda
2003-2004 P065436- Road Development Programme Phase II (RDDP II)
5
2003-2006 P057296- Emergency Multisector Rehabilitation and Reconstruction Project
6 Congo (DRC)
2004-2005 P081850- Emergency Economic and Social Reunification Support Project
4
2004-2006 P082806- Transport Infrastructure Investment Project
5 Madagascar
2007 P083351- Integrated Growth Poles 2
Total 1999-2007 22 Projects 109 Contracts
* Mauritania has limited data in the study

New dataset of road works contracts of Bank-financed projects in Sub-Saharan Africa 5
Table 2.2: Main variables of the monitoring road works contracts and unit costs study
ROAD WORKS COSTS (7m wide, 2 lane equivalent road)
Type of work Function Type of cost
Rehabilitation and reconstruction
Upgrade to paved
Periodic maintenance
Re-gravel
Inter-urban
Urban
Rural access
Estimate cost (2007 US$/km)
Contract cost (2007 US$/km)
Actual cost (2007 US$/km)
COSTS PER UNIT OF WORKS EXECUTED
Constituent layer Type of layer
Asphalt concrete (2007US$/ m3)
Portland cement concrete (2007US$/ m3)
Base (2007US$/m3) Gravel, crushed stone, bituminous
Sub-base (2007US$/ m3) Gravel, crushed stone
Earthworks (2007US$/ m3) Soft, hard
Surface treatment (2007US$/ m2) Single, double
BIDDING
Contracts with Pre-qualification Contracts without Pre-qualification
Number of applicants for pre-qualification Number of pre-qualified firms Number of firms buying bidding documents Number of bidders Number of bidders accepted for detailed examination in the evaluation process
Number of firms buying bidding documents Number of bidders Number of bidders accepted for detailed examination in the evaluation process
Bid amounts
Name and nationalities of winning bidders
Name and nationalities of bidders
DATES
Bid opening date
Contract signing date
Delay in completion of works
SUPERVISION CONSULTANCY CONTRACTS
Names and nationalities of supervision consultants
Supervision contract value
Actual supervision contract value

6 MONITORING ROAD WORKS CONTRACTS AND UNIT COSTS FOR ENHANCED GOVERNANCE IN SUB-SAHARAN AFRICA
2.4 METHODOLOGY
The dataset is analyzed by: (i) assessing the statistical trends; (ii) examining the red flags; and (iii) performing a comparative analysis. Statistical trends A set of indicators is constructed to perform comparative assessments of the contract procurement and implementation processes in the road sector across 13 countries in Sub-Saharan Africa. The trends are captured through the following indicators: (i) difference between contract values and their engineer’s estimates, (ii) cost overruns; (iii) time overruns; (iv) bidding statistics for contracts with and without pre-qualification: number of firms that applied for pre-qualification, number of pre-qualified firms, number of firms that bought bidding documents, number of bidders, number of disqualified bidders; (v) time between bid opening and contract signing dates; (vi) cost per km for similar works; (vii) road works unit costs; (viii) cost per km of supervision consultants; and (ix) ratios between supervision contract values and relevant road works contract values. This also includes the statistical trends assessed by the geographical group of contractors implementing the road works contracts financed by the Bank in the reviewed countries of Sub-Saharan Africa. Examination of red flags A set of alert indicators is developed to recognize and track vulnerabilities to corruption in the roads sector. The benchmarks for selected indicators for the road works contracts analysis have been proposed by the team and jointly reviewed with the Procurement Policy and Services Group (OPCPR). The dataset is searched for the following indicators: (i) period between bid opening and contract signing dates is more than 7 months; (ii) cost increases by more than 20 percent during implementation; (iii) time overrun is more than 30 percent of the originally contracted period; (iv) contract value is more than 20 percent above its engineer’s estimate; (v) half or more of firms buying bidding documents do not bid; (vi) 20 percent or more of pre-qualified firms do not bid; (vii) difference between winning bid and next lowest bid is within 2 percent; (viii) difference between contract price and read-out bidding price is more than 10 percent, (ix) winning bid is not the lowest bid accepted for detailed examination; (x) only one or two bidders; (xi) cost per km for similar work is higher than the 75th percentile; and (xii) costs of selected road works units is higher than the 75th percentile. Comparative analysis The analysis is based on the comparison of contracts with the red flags assigned to them. The contracts with complaints received by the Bank’s Department of Institutional Integrity (INT) are examined separately to check if they exhibit a pattern of indicators consistent with the presence of allegations of corruption and fraud.

New dataset of road works contracts of Bank-financed projects in Sub-Saharan Africa 7
2.5 DATA SOURCES
The information and data were obtained from the following source documents and project information systems of the Bank: Source Documents
• Bid Evaluation Reports • Road Works Contracts • Supervision Consultancy Contracts • Progress Reports • Variation Orders
Project Information Systems
• Client Connections • Integrated Records Management System (IRIS3 and IRIS4) • Projects and Operations Database/ Contracts Awards • Archives and Document Management
When not all data sources were available, the data were also retrieved from the correspondence filed in IRIS. A detailed data collection manual was developed by Sachiko Gause; it presents a step-by-step guide of retrieving data on the Bank-financed road works contracts in the internal system of the Bank.9 2.6 OBSERVATIONS
The main documentation related to the procurement and implementation of the road works contracts is not always available in the information systems of the Bank. The bid evaluation reports (BERs) and signed road works contracts are not filed systematically in the Integrated Records Management System (IRIS). The system contains extensive project information and documentation; however, it is often difficult to retrieve both a bid evaluation report and a signed contract for the same section of road works. The progress reports to monitor performance of contractors are often missing in the system. Only a small number of the revised road works contracts have the corresponding progress reports filed in the system, including the final progress report. It seems that the recordkeeping practice across country offices in Sub-Saharan Africa is uneven. Many project documents are often filed manually in the country offices, as there are large documents to scan. Upon request it was possible to receive the documentation by pouch or get it partially scanned into the IRIS (for example, bill of quantities from a contract document). However, not all the offices could respond with a full set of requested documentation. 2.7 SUGGESTIONS FOR RECORDS MANAGEMENT
Some recommendations on improving the records management of road works contracts procurement and implementation documentation of the Bank-financed projects are provided below:
9 Gause, S.2006. Road Sector Contract Cost Study Project: Anticorruption Initiative in Roads and Highways. World
Bank. Washington, DC

8 MONITORING ROAD WORKS CONTRACTS AND UNIT COSTS FOR ENHANCED GOVERNANCE IN SUB-SAHARAN AFRICA
• The records management system of the Bank could be largely improved through a
more systemized practice in filing contracts procurement and implementation documentation. A separate subfolder/file could be created in the Integrated Records Management System (IRIS) to sort out documentation and correspondence related to large contracts or a package of contracts procured together. It would provide an easier and quicker access to contract-related materials to other transport teams for comparative assessments of costs, bidding information, contractors’ performance, and so on. The lack of systemized method of recordkeeping also undermines the efficiency of investigative efforts of the Department of Institutional Integrity (INT). A detailed guide to improve the administration of the procurement and implementation documentation of road works contracts in the Bank’s information systems was developed by S. Gause.10 Also, outsourcing of records management and administration of Bank’s documentation to private firms could be considered as an option to get a more reliable data filing.
• The length of the road section (km) should always be indicated for road works
contracts in the Bank electronic information system. The electronic systems of the Bank do not always contain the length of roads of the awarded contracts, that is Business Warehouse, SAP, Client Connections, Contract Awards Search, and Operations portal. The only way to find the number of km of a road works contract is to look for a signed contract document. A time-consuming process to find and retrieve these data from contracts makes it impossible to keep track of the recent costs. As other procurement data such as contract value, bid opening data, date of contract signature, name and nationality of the contractor, type of road work (contract name) are already in the system, an extra data entry of road length would provide a basis to evaluate costs of road works financed by the Bank. It would be essential to either create a separate data column for the road length or indicate it in the name of the contract entered in the electronic system, for example “Bitumen surfacing of Asempaneye-Kushea feeder road, 12.7 km”.
10 Gause, S. 2006. Road Sector Contract Cost Study Project: Anticorruption Initiative in Roads and Highways. World
Bank. Washington, DC
9
3 ANALYZING TRENDS AND KEY INDICATORS
This section examines the statistical trends and develops a checklist of possible entry points of corrupt activities or red flags based on the selected key indicators. An inventory of risks is performed for each road works contract using the checklist of red flags. The section looks at the frequency of presence of the different types of red flags in the sample and for each country. Based on the comparison of the road works contracts with complaints received by the Bank’s Department of Institutional Integrity (INT) and other contracts in the sample, it examines if the data exhibit a pattern of indicators consistent with the presence of allegations of corruption or fraud. 3.1 STATISTICAL TRENDS
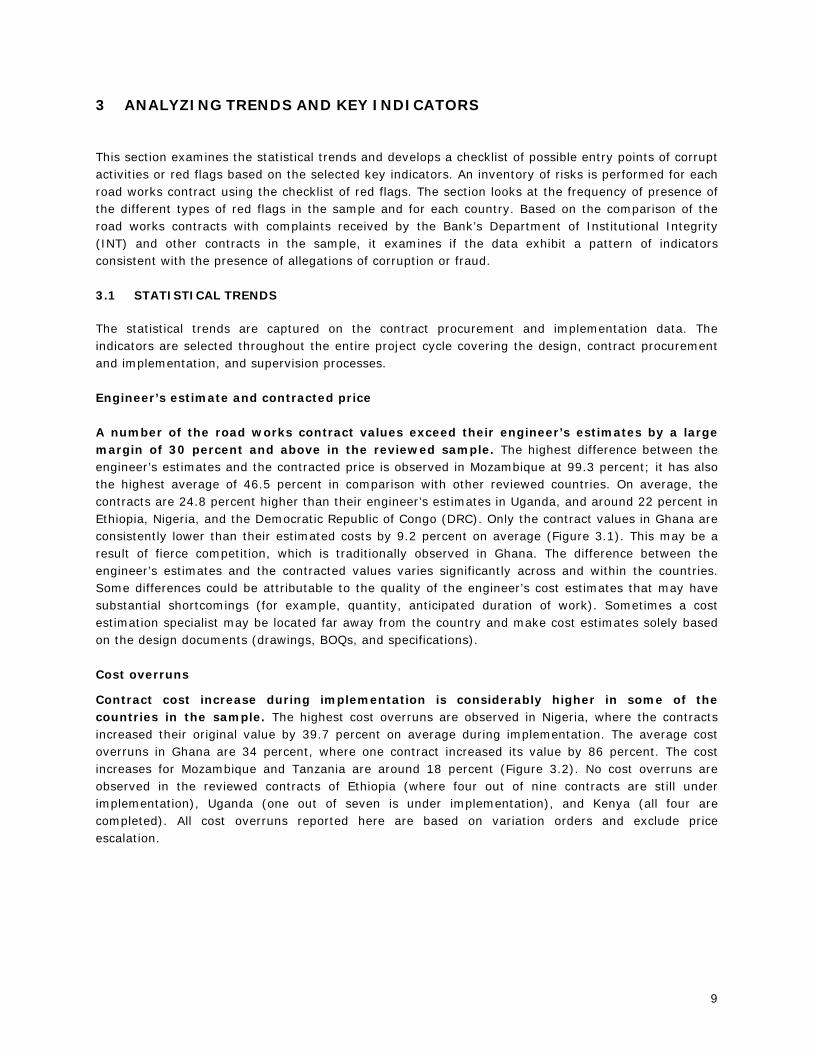
The statistical trends are captured on the contract procurement and implementation data. The indicators are selected throughout the entire project cycle covering the design, contract procurement and implementation, and supervision processes. Engineer’s estimate and contracted price A number of the road works contract values exceed their engineer’s estimates by a large margin of 30 percent and above in the reviewed sample. The highest difference between the engineer’s estimates and the contracted price is observed in Mozambique at 99.3 percent; it has also the highest average of 46.5 percent in comparison with other reviewed countries. On average, the contracts are 24.8 percent higher than their engineer’s estimates in Uganda, and around 22 percent in Ethiopia, Nigeria, and the Democratic Republic of Congo (DRC). Only the contract values in Ghana are consistently lower than their estimated costs by 9.2 percent on average (Figure 3.1). This may be a result of fierce competition, which is traditionally observed in Ghana. The difference between the engineer’s estimates and the contracted values varies significantly across and within the countries. Some differences could be attributable to the quality of the engineer’s cost estimates that may have substantial shortcomings (for example, quantity, anticipated duration of work). Sometimes a cost estimation specialist may be located far away from the country and make cost estimates solely based on the design documents (drawings, BOQs, and specifications). Cost overruns
Contract cost increase during implementation is considerably higher in some of the countries in the sample. The highest cost overruns are observed in Nigeria, where the contracts increased their original value by 39.7 percent on average during implementation. The average cost overruns in Ghana are 34 percent, where one contract increased its value by 86 percent. The cost increases for Mozambique and Tanzania are around 18 percent (Figure 3.2). No cost overruns are observed in the reviewed contracts of Ethiopia (where four out of nine contracts are still under implementation), Uganda (one out of seven is under implementation), and Kenya (all four are completed). All cost overruns reported here are based on variation orders and exclude price escalation.

10 MONITORING ROAD WORKS CONTRACTS AND UNIT COSTS FOR ENHANCED GOVERNANCE IN SUB-SAHARAN AFRICA
Figure 3.1: Difference between contract values and engineer’s estimates, averages and ranges
-2 0 %
-10 %
0 %
10 %
2 0 %
3 0 %
4 0 %
5 0 %
Nig
eria
Moz
ambi
que
Gha
na
Uga
nda
Ethi
opia
DR
C
Tanz
ania
Mal
awi
Mad
agas
car
Ken
ya
Country
Avg
. diff
bet
wee
n co
ntra
ct v
alue
&en
gine
er's
est
imat
e (in
per
cent
)
Figure 3.2: Cost overruns, averages and ranges by country
3.35%
12.06%6.71%
2.13%
-9.79%
12.02%12.05% 14.11%
18.16% 18.63%
34.06%39.72%
35.35%
15.98%
42.50%48.75%
85.70%
56.03%
-20%
0%
20%
40%
60%
80%
100%
DRC Malaw i Tanzania Mozambique Ghana Nigeria
Country
Cos
t Ove
rrun
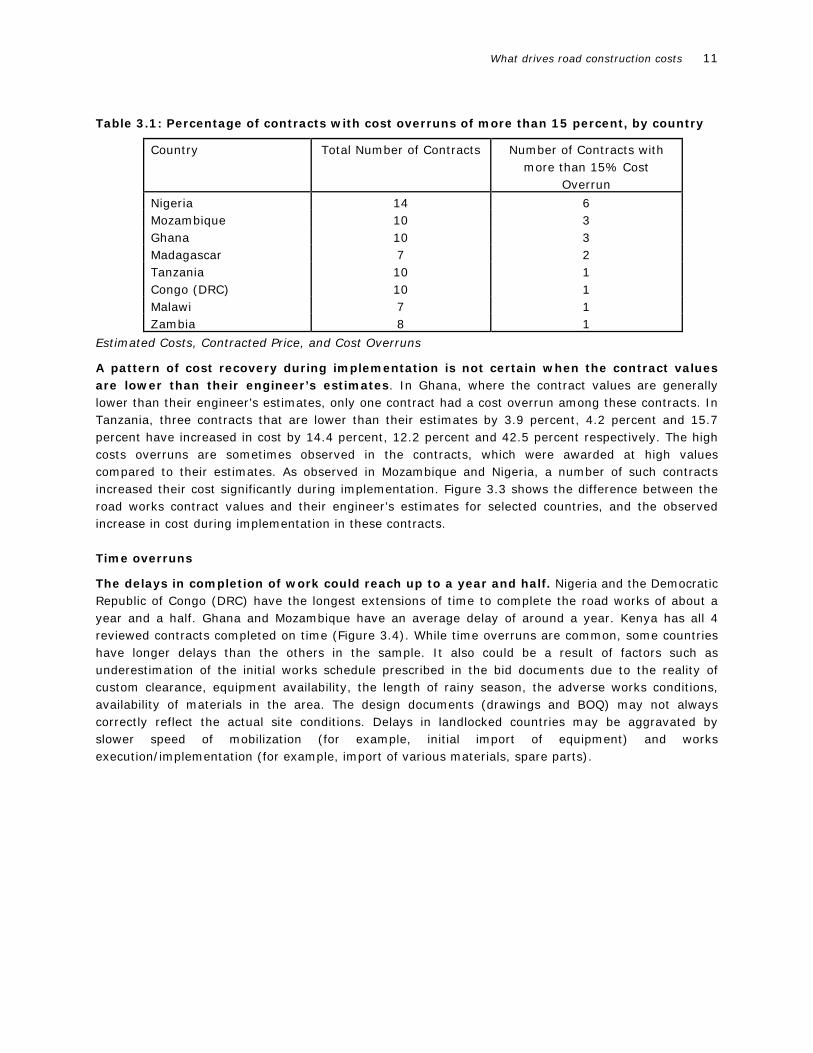
Cost overruns vary across the countries. Table 3.1 shows the percentage of contracts with cost increases of more than 15 percent during implementation, which is the threshold requiring official no-objection letter from the Bank. The highest number of contracts with cost overruns is in Nigeria where almost 43 percent of all the reviewed contracts increased their value by more than 15 percent. Mozambique and Ghana had cost overruns in 30 percent of the reviewed contracts for these countries. The magnitude of cost overruns in these traditional ad-measurement contracts that ranges on average between 15 percent and 25 percent could be a strong incentive to use lump-sum performance-based contracts.
Maximum Average Minimum
(0.9% to 41.6%)
(-24.4% to 99.3)
(-0.8% to -19.5)
(3.6% to 57%)(-9.1% to 64.8%)
(-1.2% to 48.9%)
(-13% to 31.4%)(-15.7% to 69.9%)(-47.1% to 39.5%)
(-18% to 40%)
What drives road construction costs 11
Table 3.1: Percentage of contracts with cost overruns of more than 15 percent, by country
Country Total Number of Contracts Number of Contracts with more than 15% Cost
Overrun
Nigeria 14 6 Mozambique 10 3 Ghana 10 3 Madagascar 7 2 Tanzania 10 1 Congo (DRC) 10 1 Malawi 7 1 Zambia 8 1
Estimated Costs, Contracted Price, and Cost Overruns
A pattern of cost recovery during implementation is not certain when the contract values are lower than their engineer’s estimates. In Ghana, where the contract values are generally lower than their engineer’s estimates, only one contract had a cost overrun among these contracts. In Tanzania, three contracts that are lower than their estimates by 3.9 percent, 4.2 percent and 15.7 percent have increased in cost by 14.4 percent, 12.2 percent and 42.5 percent respectively. The high costs overruns are sometimes observed in the contracts, which were awarded at high values compared to their estimates. As observed in Mozambique and Nigeria, a number of such contracts increased their cost significantly during implementation. Figure 3.3 shows the difference between the road works contract values and their engineer’s estimates for selected countries, and the observed increase in cost during implementation in these contracts. Time overruns
The delays in completion of work could reach up to a year and half. Nigeria and the Democratic Republic of Congo (DRC) have the longest extensions of time to complete the road works of about a year and a half. Ghana and Mozambique have an average delay of around a year. Kenya has all 4 reviewed contracts completed on time (Figure 3.4). While time overruns are common, some countries have longer delays than the others in the sample. It also could be a result of factors such as underestimation of the initial works schedule prescribed in the bid documents due to the reality of custom clearance, equipment availability, the length of rainy season, the adverse works conditions, availability of materials in the area. The design documents (drawings and BOQ) may not always correctly reflect the actual site conditions. Delays in landlocked countries may be aggravated by slower speed of mobilization (for example, initial import of equipment) and works execution/implementation (for example, import of various materials, spare parts).

12 MONITORING ROAD WORKS CONTRACTS AND UNIT COSTS FOR ENHANCED GOVERNANCE IN SUB-SAHARAN AFRICA
Figure 3.3: Difference between contract values and engineer’s estimates, and cost overruns
Ghana
-20%
0%
20%
40%
60%
80%
100%
1 2 3 4 5 6 7 8 9 10
% Difference betw een contract & estimate % Cost overrun
Tanzania
-20%0%
20%40%60%80%
100%
1 2 3 4 5 6 7 8 9 10
% Difference betw een contract & estimate % Cost overrun
Mozambique
-40%
-20%
0%
20%
40%
60%
80%
100%
1 2 3 4 5 6 7 8 9 10
% Difference betw een contract & estimate % Cost overrun
Nigeria
0%
20%
40%
60%
80%
100%
1 2 3 4 5 6 7 8 9 10 11 12 13 14
% Difference betw een contract & estimate % Cost overrun
Figure 3.4: Average delay in completion of work in months, by country
18.2
16.3
13.2
11.4
8.8
8.7
8.3
8.1
4.5
4.0
0.0
0 2 4 6 8 10 12 14 16 18 20
Nigeria
Congo (DRC)
Ghana
M ozambique
Uganda
Ethiopia
M alawi
M adagascar
Tanzania
Congo
Kenya
Number of Months

What drives road construction costs 13
Bidding phase
A detailed analysis of the bidding process is carried out to compare the road works contracts between 13 countries. The bidding data are separately examined for the contracts with pre-qualification and the contracts without pre-qualification. The range of values for the reviewed contracts without pre-qualification is between $595,518 (Congo) and $41,719,78011 (Ethiopia); the range of values for the revised contracts with pre-qualification is $3,713,589 (Nigeria) and $58,436,492 (Kenya).
Contracts without pre-qualification Half or more firms buying bidding documents do not bid in the reviewed contracts in Mozambique, Madagascar, DRC, Zambia, and Malawi. In other countries this difference is smaller. Nigeria and Tanzania have a higher number of bidders compared to the average for other countries. At the same time, almost half of the bidders are getting disqualified during the bid evaluation process in these two countries. The number of firms that purchase bidding documents is the highest in Mozambique and Madagascar with 19-20 firms; however, only around 5-6 firms bid (Figure 3.5). Figure 3.5: Average number of firms buying bidding documents, bidders, and bidders accepted for detailed examination, by country
0
5
10
15
20
25
Congo
Congo
(DRC)
Ethio
pia
Ghana
Madag
asca
r
Malawi
Mozam
bique
Nigeria
Tanza
nia
Zambia
Ave
rage
Num
ber o
f Firm
s
Firms buying bidding documents Bidders Bidders accepted for detailed examination
Contracts with pre-qualification About half of the pre-qualified firms do not bid. This trend is observed in all the reviewed countries. Only half of the pre-qualified firms participate in tenders. Nigeria and Ghana have the highest number of pre-qualified firms. In Nigeria, however, the number of bidders turns to be one of the lowest. In the process of bid evaluation, Uganda, Nigeria, and
11 Two contracts in Ethiopia were re-tendered without a pre-qualification requirement. The initial tender was with
pre-qualification, however, the lowest evaluated price was found to be far higher than the engineer’s estimate, and
it was decided to re-tender the contracts.

14 MONITORING ROAD WORKS CONTRACTS AND UNIT COSTS FOR ENHANCED GOVERNANCE IN SUB-SAHARAN AFRICA
Tanzania tend to disqualify some of their pre-qualified bidders. In other countries almost all the bidders are accepted for detailed examination (Figure 3.6).
Figure 3.6: Average number of pre-qualified firms, bidders, and bidders accepted for detailed examination, by country
0
2
4
6
8
10
12
14
Ethiopia Ghana Kenya Nigeria Tanzania Uganda Congo (DRC)
Ave
rage
Num
ber o
f Firm
s
Pre-qualif ied f irms Bidders Bidders accepted for detailed examination
Distribution of bidders in 109 road works contracts Three to four bidders most commonly bid in the reviewed sample of road works contracts. The number of contracts with one or two bidders is 10 out of 109 (9 percent). In four contracts the number of bidders were between 10 and 15 (Figure 3.7). Figure 3.7: Distribution of the number of bidders by contracts
0
2
4
6
8
10
12
14
16
1 2 3 4 5 6 7 8 9 10 11 12 13 14 15
Number of Bidders
Freq
uenc
y (N
o. o
f Con
tract
s)

What drives road construction costs 15
Time between bid opening and contract signing dates The extensions of the original bid validity period seem to be a norm. Only the DRC, Congo, and Madagascar have the contracts awarded within the original period of validity of bids that is 90 or 120 days for the reviewed contracts in the sample. In Kenya and Uganda it takes almost a year, on average, to award the contracts (Table 3.2). This time gap between bid opening and contracts signing dates could be further disaggregated into (i) the time required for the Bank to issue no-objection, and (ii) the time actually spent solely by the project implementing agency. This breakdown of time would provide an important indicator for the analysis. Table 3.2: Time Elapsed between bid opening and contract signing dates by country (109 contracts)
Average period between bid opening and contract signing
dates (days)
Congo (DRC) 71.2 Congo 88.8 Madagascar 88.8 Nigeria 144.7 Ghana 153.1 Zambia 187.9 Ethiopia 207.4 Mozambique 220.6 Tanzania 253.7 Malawi 261.5 Uganda 326.3 Kenya 348.0
Costs Costs per km are calculated for a 2-lane 7m -wide road equivalent and disaggregated by the type of work (rehabilitation/reconstruction, upgrade to paved, re-gravel, and periodic maintenance) and the type of road (inter-urban, urban and rural access). The reviewed roads works had mainly the following surface types:
(i) Asphalt mix; (ii) Asphalt mix & single treatment; (iii) Asphalt base and single treatment; (iv) Asphalt mix and bituminous base; (v) Bituminous surface treatment; (vi) Double surface treatment; (vii) Single surface treatment; (viii) Single treatment/Otta seal; (ix) Asphalt mix and asphalt base; (x) Gravel.
A wider range of the average costs per km is observed for the re-gravel and periodic maintenance works; the range is relatively narrower for the upgrade to paved and rehabilitation/reconstruction works. The summary statistics for the average costs per km for inter-urban roads is presented in Table 3.3.

16 MONITORING ROAD WORKS CONTRACTS AND UNIT COSTS FOR ENHANCED GOVERNANCE IN SUB-SAHARAN AFRICA
Table 3.3: Cost per km of a 2-lane road by type of work for inter-urban roads (2007 US$/km)
Type of work Q1 Mean Q3
Re-gravel 28,877 66,270 83,973 Rehabilitation/Reconstruction 221,823 397,899 450,801 Periodic maintenance 78,065 133,135 183,838 Upgrade to paved 296,516 360,071 403,830
The countries compare well with each other in cost of the road works of similar nature, except for Kenya. The average cost for the rehabilitation and reconstruction works is particularly high in Kenya in comparison to other countries in the sample (Table 3.4). The data for Kenya in the sample are restricted to four contracts for rehabilitation/reconstruction on the inter-urban roads with an asphalt mix pavement course and bituminous base. The periodic maintenance works in Mozambique cost twice as high as in Zambia for the asphalt mix surface roads.
Table 3.4: Average cost per km of a 2-lane road by type of work and type of road, by country (2007US$/km)
A. Rehabilitation and reconstruction: inter-urban and urban roads
B. Re-gravel: inter-urban road
Re-gravel (2007 US$/km)
Country Inter-urban Congo 68,094 Congo (DRC) 65,750 Madagascar 54,602 Zambia 25,005
C. Upgrade to paved: inter-urban and rural roads
Upgrade to paved (2007 US$/km)
Country Inter-urban Rural Ethiopia 322,373 Ghana 114,566 Malawi 56,874 Tanzania 348,209 Uganda 420,220
Rehabilitation & reconstruction (2007 US$/km)
Country Inter-urban Urban Congo (DRC) 228,872 Ethiopia 388,207 Ghana 261,052 Kenya 955,755 Mozambique 278,661 Malawi 420,838 Nigeria 329,909 1,505,480

What drives road construction costs 17
Table 3.4 (continued): Average cost per km of a 2-lane road by type of work and type of road, by country (2007US$/km)
D. Periodic maintenance: inter-urban road
Periodic maintenance (2007 US$/km)
Country Inter-urban Madagascar 104,992 Mozambique 197,086 Zambia 87,946
Road works unit costs
Large variations are observed in the costs of road works units across the countries in the sample. The unit costs in the Democratic Republic of Congo are consistently high throughout the different types of road works units (Table 3.5).
Table 3.5: Average unit costs by country (2007 US$)
A. Asphalt concrete and Portland cement concrete Asphalt concrete
(US$/ m3) Portland cement
concrete (US$/ m3)
Congo (DRC) 275.9 Ethiopia 131.2 200.2 Ghana 139.2 108.6 Kenya 180.0 170.7 Madagascar 146.2 191.9 Mozambique 154.4 160.6 Malawi 220.6 136.3 Nigeria 290.2 Tanzania 182.8 177.8 Zambia 172.6 Mauritania 212.3
B. Base course
Gravel base (US$/ m3)
Crushed stone base
(US$/ m3)
Congo 67.5 Congo (DRC) 54.1 62.6 Ethiopia 9.3 25.5 Ghana 6.0 32.2 Madagascar 9.2 31.7 Mozambique 7.1 Malawi 9.3 39.4 Tanzania 36.7 Uganda 10.1 51.1 Zambia 12.2

18 MONITORING ROAD WORKS CONTRACTS AND UNIT COSTS FOR ENHANCED GOVERNANCE IN SUB-SAHARAN AFRICA
Table 3.5 (continued): Average unit costs by country (2007 US$)
C. Subbase course
Gravel subbase (US$/ m3)
Crushed stone subbase
(US$/ m3)
Congo (DRC) 23.5 Ethiopia 13.5 20.1 Ghana 6.2 Kenya 9.0 28.0 Madagascar 12.4 Mozambique 7.0 Malawi 7.3 Nigeria 8.8 Tanzania 12.9 Uganda 8.9 Zambia 11.5
D. Earthworks
Soft earthworks (US$/ m3)
Hard earthworks (US$/ m3)
Congo 4.6 Congo (DRC) 5.3 48.4 Ethiopia 3.9 12.7 Ghana 3.0 Kenya 7.7 15.8 Madagascar 5.5 Mozambique 5.1 26.0 Malawi 9.4 Tanzania 3.8 21.3 Uganda 5.3 Zambia 5.7 Mauritania 3.3
C. Surface treatment
Double surface treatment (US$/m2)
Single surface treatment (US$/m2)
Congo (DRC) 5.9 3.5 Ethiopia 3.7 Madagascar 4.8 Mozambique 3.1 1.8 Malawi 3.9 1.3 Nigeria 5.7 3.3 Tanzania 3.2 2.5 Uganda 5.5
What drives road construction costs 19
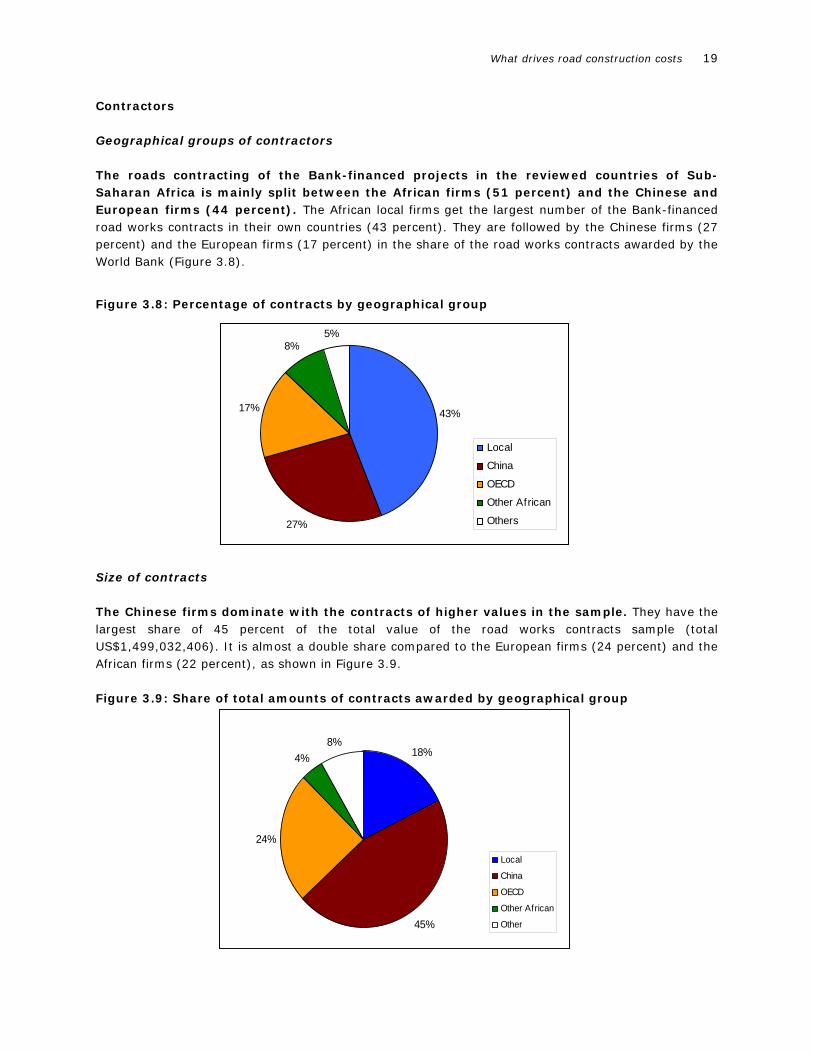
Contractors Geographical groups of contractors The roads contracting of the Bank-financed projects in the reviewed countries of Sub-Saharan Africa is mainly split between the African firms (51 percent) and the Chinese and European firms (44 percent). The African local firms get the largest number of the Bank-financed road works contracts in their own countries (43 percent). They are followed by the Chinese firms (27 percent) and the European firms (17 percent) in the share of the road works contracts awarded by the World Bank (Figure 3.8).
Figure 3.8: Percentage of contracts by geographical group
43%
27%
17%
8%5%
Local
China
OECD
Other African
Others
Size of contracts The Chinese firms dominate with the contracts of higher values in the sample. They have the largest share of 45 percent of the total value of the road works contracts sample (total US$1,499,032,406). It is almost a double share compared to the European firms (24 percent) and the African firms (22 percent), as shown in Figure 3.9. Figure 3.9: Share of total amounts of contracts awarded by geographical group
18%
45%
24%
4%8%
Local
China
OECD
Other African
Other

20 MONITORING ROAD WORKS CONTRACTS AND UNIT COSTS FOR ENHANCED GOVERNANCE IN SUB-SAHARAN AFRICA
Leading contractors The leading contractors are the China Road and Bridge Corporation “China”, the SBI Holdings International “the Netherlands”, and the Synohydro Corporation “China”. They carried out the highest number of the Bank-financed road works contracts with the largest share of total values (Table 3.6).The total of road works contract values in the sample is US$ 1,499,032,406. Table 3.6: Leading contractors by awarded contract totals
Name of Contractor Nationality
Total amount of contracts
signed (2007 US$)
Share of contract values to sample total
Number of road works
contracts
China Road & Bridge Corp. China 279,292,361 18.6% 7 SBI Holdings International Netherlands 179,958,706 12.0% 6 Sinohydro Corporation China 174,563,485 11.6% 8 China Henan International Corp. China 93,543,637 6.2% 6
Statistical trends by geographical groups of contractors The African firms outperform the Chinese and European contractors in a number of the indicators related to the procurement process but underperform in the implementation. For the African firms, the pattern shows a narrower average range between the contract values and their estimates, a shorter period to evaluate the bids and sign the contracts, and a higher level of competition. However, they lag behind on the indicators related to the implementation process, that is, they incur higher cost overruns and longer delays (Table 3.7). Table 3.7: Statistical averages by geographical groups
Difference between
contract value and cost
estimates (%)
Days between bid opening and
contracts signing (days)
Number of
bidders
Cost overruns amount
(% increase)
Delays (months)
Local 14.7 152 5.6 25.0 13.1 China 21.6 253 4.8 15.4 8.8 OECD 21.5 215 4.8 22.7 11.3 Other African 9.7 184 5.3 22.7 8.4 Others 2.9 91 6.4
Cost per km by geographical groups of contractors The African firms have a cost advantage over the Chinese and European firms in the sample. They are in a tight competition with the Chinese firms with almost the same cost to implement road works of similar nature. The average cost of road works carried out by the European contractors is considerably higher (Table 3.8). This is perhaps a result of their higher initial management and overhead costs.

What drives road construction costs 21
Table 3.8: Cost per km of a 2-lane road by geographical group and type of work (2007 US$)
Rehabilitation and reconstruction
Re-gravel Upgrade to paved Periodic maintenance
Inter-urban
Urban Inter-urban Inter-urban
Rural Access Inter-urban
Local 333,003 1,632,225 59,473 105,587 China 357,866 361,167 98,414 OECD 568,817 398,681 137,152 Other African
28,216 285,868
Unit costs by geographical groups The rates for different types of unit costs vary without a particular trend with regards to the geographical group of contractors. The Chinese contractors have among the cheapest rates for asphalt concrete, which is comparatively very expensive in the works inputs of the local firms. The contractors other than from Africa, China, and Europe have consistently lower costs across the selected units of road works (Table 3.9).
Table 3.9: Average unit costs by geographical groups of contractors (2007 US$)
Asphalt concrete ($/m3)
Portland cement concrete ($/m3)
Local 249.0 144.3 China 158.5 170.1 OECD 174.3 159.6 Other African 179.9 263.8 Others 129.0 168.7
Base gravel ($/m3)
Base crushed stone ($/m3)
Local 10.6 44.6 China 11.9 34.4 OECD 7.6 50.7 Other African 28.3 Others 27.1
Subbase gravel ($/m3)
Subbase crushed stone ($/m3)
Local 10.5 18.5 China 11.8 19.7 OECD 7.5 28.0 Other African 16.6 Others 10.1
Soft earthworks ($/m3)
Hard earthworks ($/m3)
Local 5.7 14.4 China 5.0 17.8 OECD 5.3 27.7 Other African 4.3

22 MONITORING ROAD WORKS CONTRACTS AND UNIT COSTS FOR ENHANCED GOVERNANCE IN SUB-SAHARAN AFRICA
Others 3.4
Double surface treatment
($/m2)
Single surface treatment ($/m2)
Local 4.3 4.2 China 4.5 3.7 OECD 4.7 2.2 Other African 1.6 Others
Supervision costs Supervision contract values The ratios of supervision contract values are within 3-13 percent range of their relevant road works contract values in the reviewed countries. The lowest ratios of less than 4 percent are observed in the DRC, Madagascar, and Mozambique. The ratios of more than 10 percent are in the Republic of Congo and Tanzania (Figure 3.10). Figure 3.10: Ratio of supervision contract value to road works contract value
0%
2%
4%
6%
8%
10%
12%
14%
Congo
Tanza
nia
Malawi
Zambia
Kenya
Ghana
Ugand
a
Ethiopia
Nigeria
Mozam
bique
Madaga
scar
Congo
(DRC)R
atio
of S
uper
visi
on C
ontr
act t
o R
oad
Wor
ks
Con
trac
t (%
)
Supervision cost of road construction There is a wide range of average cost of supervision per kilometer of similar road works across the countries. The cost to supervise a kilometer of the rehabilitation and reconstruction works on an inter-urban road is US$15,422 in Ghana and US$28,153 in Kenya. In Nigeria, the average cost of supervision per kilometer of an urban road is US$38,024 (Table 3.10)

What drives road construction costs 23
Table 3.10: Average cost of supervision per km of a 2-lane road by country (2007 US$)
Type of work Type of road
Cost per km(US$/km)
Congo Re-gravel Inter-urban 7,820 Congo (DRC) Re-gravel Inter-urban 1,063
Rehabilitation and reconstruction Inter-urban 15,741 Ethiopia
Upgrade to paved Inter-urban 18,076 Tanzania Upgrade to paved Inter-urban 14,456 Ghana Rehabilitation and reconstruction Inter-urban 15,422 Kenya Rehabilitation and reconstruction Inter-urban 28,153 Malawi Upgrade to paved Rural Access 2,255
Rehabilitation and reconstruction Inter-urban 9,701 Mozambique
Periodic maintenance Inter-urban 7,006 Inter-urban 16,458
Nigeria Rehabilitation and reconstruction
Urban 38,024 Uganda Upgrade to paved Inter-urban 22,076
Geographical groups of supervision contractors The supervision consultancy firms in the sample are mostly from Africa and Europe. The local firms and firms from other African countries share half of the supervision consultancy services (53 percent) with the European firms (42 percent). These also include joint ventures registered in the country. The remaining 5 percent in the sample are from India (Figure 3.11).
Figure 3.11: Percentage of supervision contracts by geographical group
42%
30%
23%
5%
OECDLocalOther AfricanIndian
The leading consultancy firms in the reviewed sample are; BCEOM Societe Francaise D'Ingenierie “France”, GAUFF Ingenieure “Germany”, and the BKS Global Ltd “South Africa”. They were awarded the highest number of supervision consultancy contracts (Table 3.11).

24 MONITORING ROAD WORKS CONTRACTS AND UNIT COSTS FOR ENHANCED GOVERNANCE IN SUB-SAHARAN AFRICA
Table 3.11: Leading supervision consultants
Name of supervision contractor Nationality Number of contracts
BCEOM Societe Francaise D'Ingenierie France 6 GAUFF Ingenieure Germany 5 BKS Global Ltd South Africa 4
3.3 EXAMINATION OF ‘RED FLAGS’
This section looks at the “red flags,” or alert indicators of the potential entry points of corrupt activities in the procurement of road sector projects. The examples of red flags are compiled from various sources.
Overview of red flags in procurement of road sector contracts
The red flags in the procurement of road sector contracts are applicable to the procurement processes in general. The integrity of the procurement process could be undermined by certain schemes that are similar across countries and across different sectors. These include bribes and kickbacks, bid rigging, using front or shell companies, misrepresentation of facts, as well as embezzlement and misuse of public assets. 12 Some of the patterns or red flags that signal the potential existence of these schemes in some way are detailed below:
Bribes and kickbacks:
• Existence of “local agents” that provide generic services and add no obvious value to the performance of the contrac;t
• Close personal relations between the parties involved in procurement or contract execution; • Bidding irregularities in favor of a small group of contractors.
Bid rigging:
• All bids submitted are substantially higher than the unit costs estimates or contract cost estimate;
• Unreasonable prequalification requirements; • A winning bidder subcontracts part of the contracted works to a losing bidder; • There is a wide gap between a winning bid and other bids, or bid prices vary one from another
by the same increment; • Qualified bidders do not bid while applying to pre-qualify (a potential sign of coercion).
Use of front or shell companies
• New or unknown companies serve as subcontractors on a project; • The subcontractor have opaque ownership structure and lacks visible corporate facilities; • Frequent visits of government officials at company headquarters.
12 Ware, G. T., S. Moss, J. E. Campos, and G. P. Noone. 2007. Corruption in Public Procurement: A Perennial
Challenge.. In The Many Faces of Corruption: Tracking Vulnerabilities at the Sector Level. Ed. J. Edgardo Campos
and Sanjay Pradhan, 295-334. Washington, DC: World Bank. http://go.worldbank.org/OZLE95YA50

What drives road construction costs 25
The examples of patterns or red flags identified for each stage of the project cycle are presented below:13
Project Identification and Design:
• Overestimated goods and services and over-dimensioned project components; • Manipulated project design tailored to benefit a particular provider; • Inflated cost estimates.
Bidding Stage
• Improper or insufficiently advertised tender; • Directed or biased technical specifications; • Unreasonable delays in evaluating the bids and selecting the winner; • Same bidders repeatedly participate, or same bidder repeatedly wins; • Weak explanations of disqualification of the lowest bidder; • Unit prices in competing bids are identical, proportional, or vary substantially.
Implementation and Supervision
• Contract specifications or scope of work are altered after the award of the contract; • Delays in the delivery of goods and services; • Lower than specified quality or quantity; • High number of change orders to the contract; • Cost overruns inadequately explained or justified.
Box 3.1 contains a number of red flags developed by the Federal Highway Administration of the U.S. Department of Transportation to detect collusive practices and bid rigging in highway construction contracts.
13 Paterson, W. D. O., and P. Chaudhuri. 2007. “Making Inroads on Corruption in the Transport Sector through
Control and Prevention.” In The Many Faces of Corruption: Tracking Vulnerabilities at the Sector Level, ed. J.
Edgardo Campos and Sanjay Pradhan, 159-189. Washington, DC: World Bank.
http://go.worldbank.org/OZLE95YA50
World Bank.2007. Corruption Warning Signs: Is Your Project at Risk? Good Practices in Latin America and the
Caribbean. Washington, DC

26 MONITORING ROAD WORKS CONTRACTS AND UNIT COSTS FOR ENHANCED GOVERNANCE IN SUB-SAHARAN AFRICA
Box 3.1: Detection of collusion and bid rigging in highway construction contracts
In an effort to detect and prevent contract bid rigging in highway construction contracts, the Federal Highway
Administration of the U.S. Department of Transportation identifies the following bidding patterns that indicated
collusion in the past:
• Failure of qualified bidders to bid; • Certain contractors repeatedly bid against one another or, conversely, certain contractors do not bid
against one another; • The successful bidder repeatedly subcontracts work to companies that submitted higher bids on the same
projects or that picked up bid packages but did not submit bids; • Different groups of contractors appear to specialize in federal, state, or local jobs exclusively; • An unusual disparity in front-end or lump sum payment items among the bidders; • A particular contractor always winning in a certain geographical area; • Contractors who bid frequently, but never win; • Identical bid amounts on a contract line item by two or more contractors. Some instances of identical line
item bids are explainable, as suppliers often quote the same prices to several bidders. But a large number of identical bids, or identical bids on any service-related item, should be viewed critically;
• Contractors previously convicted of bid rigging in other states who are operating in the state under review;
• Joint venture bids where either contractor could have bid individually as a prime; • Failure of original bidders to re-bid, or an identical ranking of the same bidders upon re-bidding, where
original bids were rejected for being too far over estimate; • Discrepancies in similar line items bid by a given firm on different projects in the same general area at the
same letting or on comparable projects at different lettings within a relatively short time period.
Source: U.S. Department of Transportation. Suggestions for the Detection and Prevention of Construction Contract
Bid Rigging. The Interdepartmental Bid Rigging Investigations Coordinating Committee, Federal Highway
Administration, http://www.fhwa.dot.gov/programadmin/contracts/dotjbid.cfm
Selection of red flags for the analysis The data is examined using a number of “red flags,” that is, alert indicators of potential presence of fraud and corruption at various stages of the project cycle or. The benchmarks for the selected indicators have been proposed by the team and jointly reviewed with the World Bank’s Procurement Policy and Services Group (OPCPR).
Types of red flags for the analysis
The following selected red flags are examined in the newly generated dataset of the road works contracts in Sub-Saharan Africa:
• Period between bid opening and contract signing dates is more than seven months; • Cost increases by more than 20 percent during implementation; • Time overrun is more than 30 percent of the originally contracted period; • Contract value is more than 20 percent above its engineer’s estimate; • Half or more firms buying bidding documents do not bid;
• 20 percent or more of pre-qualified firms do not bid;
• Difference between winning bid and next lowest bid is within 2 percent;

What drives road construction costs 27
• Difference between contract price and read-out bidding price is more than 10 percent;
• Winning bid is not the lowest bid accepted for detailed examination;
• Only one or two bidders;
• Cost per km for similar work is higher than the 75th percentile. For the four types of
work included in the study (rehabilitation/reconstruction, upgrade to paved, re-graveling, and periodic maintenance) a statistical distribution was computed to determine the number of contracts with cost per km above the 75th percentile.
• Unit road work costs are higher than the 75th percentile. For the unit costs included in
the study a statistical distribution was computed to determine the number of contracts with unit costs above the 75th percentile (asphalt concrete, Portland cement concrete, gravel subbase, gravel base, crushed stone base, soft and hard earthworks).
3.4 COMPARATIVE ANALYSIS
An inventory of risks is performed for each road works contract using a checklist of red flags. The frequency of the different types of red flags is revealed for each country in the database as well as for the whole set of the reviewed contracts. The data are examined if a pattern of indicators consistent with the presence of allegations of corruption or fraud emerges in the sample by comparing the road works contracts with complaints received by the Bank’s Department of Institutional Integrity (INT) and other road works contracts.14
The presence of red flags does not prove that corrupt or fraudulent practices take place in the procurement and implementation of a contract. Rather, it is a warning signal of a potential procurement and implementation problem that may justify further investigation. At the same time, the absence of red flags does not imply that fraud or corruption did not occur.
Frequency of red flags in the reviewed road works contracts The most frequent appearances of red flags reflect the overall trends in the procurement and implementation processes in the reviewed countries. The red flags with the highest frequency in the road works contracts are: (i) period between bid opening and contract signing dates is more than 7 months; (ii) time overrun is more than 30 percent of the originally contracted period; (iii) 20 percent or more of pre-qualified firms do not bid; and (iv) contract value is more than 20 percent above its engineer’s estimate (Figure 3.12).The “red flag” of half or more firms buying bidding documents do not bid in the contracts without pre-qualification also occurs often largely reflecting the trends observed only in DRC, Madagascar, Mozambique, Zambia, and Malawi as shown in Figure 3.5.
14 The comparative analysis builds upon the methodology used by the Department of Institutional Integrity (INT) in
the Detailed Implementation Review: India Health Sector, 2006-2007.

28 MONITORING ROAD WORKS CONTRACTS AND UNIT COSTS FOR ENHANCED GOVERNANCE IN SUB-SAHARAN AFRICA
Figure 3.12: Frequency of different types of red flags in the sample (109 contracts)
0
5
10
15
20
25
30Nu
mbe
r of R
ed F
lags
More than 7 month period from bid opening to contract signing Delay in completion more than 30% of the contract duration period20% or more of prequalif ied f irms fail to bidContract value more than 20% higher than estimateHalf or more firms buying bidding documents don’t bidWinning bid not the low est bid accepted for detailed examinationDifference betw een contract price and read-out bid price is >10% Cost/km by type of w ork is higher than the 75th percentileVariation order>20%Less than 3 biddersDifference betw een w inning bid and next low est bid is w ithin 2%
The red flags are distributed unevenly across the reviewed countries. Each type of the “red flag” may signal some procurement and implementation irregularities as well as inefficiency or weak implementation capacity. Figure 3.13 presents the most commonly observed weaknesses in the procurement and implementation processes in the reviewed countries. The number of road works contracts for each country in the sample is as follows: Nigeria (14); Ethiopia (11); Mozambique, Ghana, Tanzania, DRC (10); Congo, Zambia (8); Uganda, Malawi, Madagascar (7), and Kenya (4).

What drives road construction costs 29
Figure 3.13: Frequency of types of red flags, by country
0
5
10
15
20
25
30
35
40
45
50
Congo (DRC)
NigeriaCongo
Kenya
ZambiaMalawi
Uganda
MozambiqueEthiopia
Tanzania
MadagascarGhana
Num
ber
of R
ed F
lags
Unit Cost > 75th percentileCost/km by type of w ork is higher than the 75th percentileDifference betw een contract price and read-out bid price is >10% Contract value more than 20% higher than estimateWinning bid not the low est bid accepted for detailed examinationDifference betw een w inning bid and next low est bid is w ithin 2%20% or more of prequalif ied f irms fail to bidHalf or more f irms buying bidding documents don’t bidLess than 3 biddersDelay in completion more than 30% of the contract duration periodMore than 7 month period from bid opening to contract signing Variation order>20%
Pattern of red flags in the contracts with complaints received by INT The Department of Institutional Integrity (INT) received complaints on 14 contracts from the sample of 109 road works contracts (13 percent of total). The nature of complaints was mainly related to allegations of bidder collusion or bid rigging, paying bribes, and bidding irregularities. The pattern of red flags in the contracts with complaints received by the INT slightly differs from the overall pattern observed across all the contracts in the sample. The most frequent red flags in the contracts with complaints received by the INT are (i) 20 percent or more of prequalified firms do not bid; (ii) period between bid opening and contract signing dates is more than 7 months; (iii) cost per kilometer for similar work is higher than the 75th percentile; and (iv) contract value is more than 20 percent above its engineer’s estimate. The frequency of the “red flag” of time overrun of more than 30 percent from the originally contracted period is lower in the contracts with complaints received by the INT (Figure 3.14).

30 MONITORING ROAD WORKS CONTRACTS AND UNIT COSTS FOR ENHANCED GOVERNANCE IN SUB-SAHARAN AFRICA
Figure 3.14: Pattern of types of red flags in the contracts with complaints received by INT
0%
10%
20%
30%
40%
50%
60%
70%
Perc
ent o
f Red
Fla
gs
20% or more of prequalified firms fail to bidM ore than 7 month period from bid opening to contract signing Cost per km by type of work/type of road higher than the 75th percentileContract Value more than 20% higher than the estimateWinning bid not the lowest bid accepted for detailed examinationDelay in completion more than 30% of the contract duration periodLess than 3 biddersVariation order more than 20%Half or more of firms buying bidding documents fail to bidDifference between winning bid and next lowest bid is within 2%Difference between contract price and read-out bid price is within 10%
In comparison to other contracts in the sample, there appears to be a high number of red flags related to gravel among the road works unit costs in the contracts with complaints received by the INT. Other unit costs seem to repeat the trend observed across the road works contracts in the sample (Figure 3.15).

What drives road construction costs 31
Figure 3.15: Frequency of red flags for unit costs in the contracts with complaints received by INT in comparison with other contracts in the sample
0%
5%
10%
15%
20%
25%
SubbaseGravel
PortlandCementConcrete
EarthworksSoft
AsphaltConcrete
BaseGravel
BaseStone
EarthworksHard
Perc
ent o
f Red
Fla
gs
Contracts w ith complaints received by INT Contracts w ithout complaints
WBI Governance Indicators: index for control of corruption The red flags capture potential weak governance environment and risks to integrity. They may also reflect the inefficiency of the procurement and implementation processes. Figure 3.16 presents the number of red flags assigned to each country normalized by the number of contracts reviewed (in each country). Figure 3.16 also includes the WBI governance index for control of corruption.15 The WBI Control of Corruption Index measures the extent to which public power is exercised for private gain, including both petty and grand forms of corruption, as well as “capture” of the state by elites and private interests.16 Probably due to the limited size of the sample of contracts reviewed, no correlation between the normalized number of red flags and the WBI Index was observed at this stage.
15 World Bank. The Worldwide Governance Indicators, 1996-2006. http://info.worldbank.org/governance/wgi2007/ 16 Governance Matters 2008: http://info.worldbank.org/governance/wgi/pdf/WBI_GovInd08-5a.pdf

32 MONITORING ROAD WORKS CONTRACTS AND UNIT COSTS FOR ENHANCED GOVERNANCE IN SUB-SAHARAN AFRICA
Figure 3.16: Control of Corruption Index and number of red flags normalized by number of reviewed contracts per country
0
1
2
3
4
5
Ghana
Madag
asca
r
Tanza
nia
Ethiopia
Mozambique
Zambia
Malawi
Uganda
Kenya
Congo
Nigeria
Congo (D
RC)
Num
ber
of re
dfla
gs
-1.6
-1.4
-1.2
-1.0
-0.8
-0.6
-0.4
-0.2
0.0 Index for control of corruption (2006)
Number of red f lags Index for control of corruption
3.5 COSTS ANALYSIS
This section summarizes an attempt to identify parameters that may influence unit costs outside of the project. We investigate possible relationships between unit cost and the quality of governance in the country as well as other indicators such as GDP and fuel costs. For this we use a simple OLS regression model expressed as follows: Y = a0 + a1GDP per capita + a2 Fuel Cost + a3 Governance Index + e where Y represents the dependent variable (unit cost of selected road work type), ai’s are the coefficients of independent variables and e is the error term, that is, the part left out unexplained by the independent variables. The dependent variable in the analysis is the unit cost of selected road work type. The work activities selected from the sample on the basis of available data, and studied here, are:
• Asphalt concrete; • Portland cement concrete; • Gravel subbase; • Earthworks soft material
The explanatory variables that were used in the model are:
• GDP per capita in 2006 (constant 2000 US$)17 is expected to provide a general idea about the current economic state of a country;
17 Source: World Bank data (WDI Indicators)

What drives road construction costs 33
• Fuel costs (price of diesel oil in 2006 in the United States of America in cents per liter) 18 is expected to explain a large part of project cost in road projects (for example, transport and bitumen costs);
• World Bank’s Governance Indices (Control of Corruption 2006)19 is an estimate of governance measured on a scale from approximately -2.5 to 2.5. Higher values correspond to better governance;
• Transparency International’s Corruption Perceptions Index (CPI)20 relates to perceptions of the degree of corruption as seen by business people and country analysts, and ranges between 10 (highly clean) and 0 (highly corrupt).
The overall effects of the regression have been summed up in Table 3.12. More details are given in Annex C. Table 3.12: Factors influencing unit costs - summary of results
Asphalt concrete Portland cement concrete
Gravel subbase Soft earthworks
GDP per capita Significant (positive)
Significant (negative)
Fuel price 2007 Significant (positive)
Control of Corruption
Significant (negative)
Significant (negative)
TI Corruption Perceptions Index
Significant (negative)
Significant (negative)
Significant (negative)
The quality of governance is shown to be a significant factor on the unit costs for asphalt concrete, Portland cement concrete and gravel subbase. The effect is not significant for earthworks (soft materials). The limited sample size does not allow for a more sophisticated analysis using more parameters. The overall results of the model might come out more significant if we increase the sample size and include more countries (within Africa as well as other regions) and contracts in the analysis.
18 Source: http://www.gtz.de/de/dokumente/en-international-fuelprices-final2007.pdf 19 Source: http://info.worldbank.org/governance/wgi2007/ 20 Source: http://www.transparency.org/policy_research/surveys_indices/cpi/2007


35
4 WHAT DRIVES ROAD CONSTRUCTION COSTS: ISSUES ADDRESSED BY PROJECT IMPLEMENTING AGENCIES
This chapter looks at selected issues, such as high bid rates, low response to invitation to bid, and cost overruns as they were addressed by the agencies administering contracts under the reviewed roads projects. While the implementing agencies are responsible for the procurement, award, administration and implementation of Bank-financed contracts, the Bank’s role is to ensure that the procurement process is carried out in accordance with the agreed procedures. The Bank’s requirements are generally guided by four considerations: economy and efficiency, open competition, development of domestic contracting and manufacturing industries, and transparency in the procurement process.21 While ensuring that established detailed procedures and procurement rules are followed in the implementation of a project, the Bank aims to ensure that contracts are procured and executed diligently and efficiently. In this respect, if there are issues that could affect adversely the fulfillment of these objectives, the Bank requests the project implementing agency to address them before giving the ‘no objection.’ 4.1 REASONS FOR HIGH BIDS
Some contracts have a particularly high difference between the estimated costs of road works and prices offered by the lowest evaluated bidders. While many cost estimates have been revised and updated by the implementing agencies for comparison with the lowest evaluated price, some differences still remained high for several contracts. The implementing agencies have addressed this issue in the bid evaluation reports. Possible reasons that could explain high bids observed across the reviewed countries of Sub-Saharan Africa include:
• The effect of increase in prices of fuel, power, materials, and equipment on major cost items of contracts. Primarily as a result of oil price increases, prices for diesel, bitumen, and other key items are rising significantly. An example of evaluation of such effect on a contract’s cost items is contained in Box 4.1.
• A fixed price contract that is not subject to price adjustment. As the contracts are fixed sum contracts that do not allow for variation, it is possible that the bidders make projections for any increase in price.22 In a contract in Mozambique, a major effect on the bid rates was the bidders’ provision for instability of the Brent oil price, as a part of the contract value (7.7 percent) consisted of asphalt.23
• Supply and demand effect. Providers and suppliers of plant, equipment, and materials, in particular cement and bitumen, may respond with increased prices due the increase in a number of major works let at the same time.24 The simultaneous award of the projects results in significant increases, in particular when the supply is limited and when some contractors have monopoly on the supply of certain materials, for example, crushed stone in Mozambique.25
21 World Bank. 2006. Guidelines: Procurement under IBRD Loans and IDA Credits, Section I, Para 1.11.Washington,
DC. http://go.worldbank.org/RPHUY0RFI0 22 Revised Bid Evaluation Report.2005. 2nd Year Rehabilitation Works Contracts for 5 Lots. Lagos Urban Transport
Project, Nigeria 23 Bid Evaluation Report.2003. The Rehabilitation of the Road EN1 between Muxungue and Inchope. Roads and
Bridges Management and Maintenance Program, Mozambique 24 Bid Evaluation Report. 2003. Periodic Maintenance of the Road EN1 between Marracuene to Manhica. Roads and
Bridges Management and Maintenance Program, Mozambique 25 Bid Evaluation Report.2003. Periodic Maintenance of the Road EN1 between Zandamela and Maxixe, Roads and
Bridges Management and Maintenance Program, Mozambique

36 MONITORING ROAD WORKS CONTRACTS AND UNIT COSTS FOR ENHANCED GOVERNANCE IN SUB-SAHARAN AFRICA
Box 4.1: Evaluation of the effect of price increase on contract major works items The effect of price increase for fuel, power, materials (for example bitumen, cement) and equipment was
evaluated as one of possible reasons that account for a 36 percent difference between the winning bid
price and the engineer’s estimate (80 percent difference from the original estimate dating back three
years). The cost analysis measures this effect on two major cost works items of a road-upgrading
contract: earthworks (65 percent) and bituminous surfacing works (12 percent), as follows:
• Fuel accounts for up to 40 percent of the earthworks cost; • Power (electricity) accounts for up to 5 percent of the cost of earthworks (crusher operation) and
bituminous works (bitumen heating); • Bitumen accounts for up to 35 percent of the cost of bituminous works; • Cement accounts for up to 22 percent of the cost of earthworks; • Power outage level is estimated at 50 percent; • The increase in equipment costs is estimated as 15 percent against foreign currency and as 25
percent of the earthworks and bituminous works costs; • Price escalation is assumed at 10 percent for the period of nine months between the revised
estimate and the time of commencement of work.
Source: Revised Bid Evaluation Report, Annex 11, Contract C010: Upgrading of the Soroti-Dokolo Road.
2007. Road Development Program Phase 3. Uganda
• Potential collusion by bidders. Bidders can collude to agree on prices and inflate costs. The
possibility of collusion of bidders having the benefit of limited competition, was evaluated and dismissed in one of the contracts in Uganda. The bidders ranked two and three were European contractors and their bid amounts were very close to each other, “being only 1–2 percent of each other. This is taken as a confirmation of serious competition for the works by the bidders”.26
• Inadequate prediction of major market forces by the engineer’s estimate. In Uganda,
the bids of similar road works in 2007 showed an emerging trend with median bid prices being 40–50 percent higher than the engineer’s estimates.27 In Mozambique, in a contract which was 56 percent higher than the revised estimate, the examination of the engineer’s estimates showed that the rates were low for significant items, for example, fixed obligations, gravel deviations, de-mining, surfacing, spoil, and sand sub-base. More realistic rates for these estimates would add US$ 4.7 million to the estimate.28
• Miscellaneous perceived risks incorporated by bidders in their bid rates. These include
provisions of extended contract procurement cycle time associated with price inflation risks, security, delayed payment by client, delayed recovery of input VAT refund, pre-financing costs for securities/guarantees, increased insurance premiums.29 In Mozambique, among such risks is also the current method of payment by VAT with a paper transfer (TITULO) that results in under recovery of the input VAT payable by the main contractor to subcontractor/suppliers. 30 Other perceived risks could be attributable to the individual assessment of the situation in the
26 Contract.2007. Section II- Bid Evaluation Report. Upgrading of Soroti-Dokolo Road (62.6km) to Paved
(Bituminous) Standard. Road Development Program Phase 3. Uganda 27 Revised Bid Evaluation Report, Section II, Contract C010: Upgrading of the Soroti-Dokolo Road. 2007. Road
Development Program Phase 3, Uganda 28 Bid Evaluation Report.2003. The Periodic Maintenance of the Road EN1 between Zandamela and Maxixe, Roads
and Bridges Management and Maintenance Program, Mozambique 29 Revised Bid Evaluation Report, Annex 11, Contract C010: Upgrading of the Soroti-Dokolo Road. 2007. Road
Development Program Phase 3, Uganda 30 Bid Evaluation Report.2003. The Rehabilitation of the Road EN1 between Muxungue and Inchope. Roads and
Bridges Management and Maintenance Program, Mozambique
What drives road construction costs 37
country. In Uganda, among such risks is “a delayed delivery of goods through Mombasa Port due to congestion and transport problems in Uganda, loss of fuel through pilfering (the cost of fuel is estimated to be 40 percent of the total earthworks budget), political instability in the project area and the high cost of input taxes.”31
• Other factors. In Mozambique the high unit rates of stabilized sand sub-base could have
contributed to high bid unit rates. As occurred in a number of projects, it was hard to achieve the end specification for this compacted material (absence of natural gravel materials in the area, layer works are constructed from natural sands, cement stabilized- up to 6 percent cement content).32 In the DRC, some significant differences between bids and cost estimates could be attributable to insecurity and post-conflict country environment. The mobilization cost in one of the contracts signed in 2004 was about US$3 million above its estimate. 33
4.2 REASONS FOR LOW RESPONSE TO INVITATION TO BID
Only about half of pre-qualified firms generally bid in contracts with pre-qualification in the reviewed countries. Possible reasons for the relatively low response to the invitation for bids include:
• Increased demand for contractors’ services. Responding to an inquiry initiated by the implementing agencies to identify the reasons for not bidding, pre-qualified firms attributed them to their full commitment of equipment and personnel to other on-going projects in the country34 and new contractual commitments.35 Box 4.2 describes the situation in Uganda.
• Insecure areas in a post-conflict country. In a contract in the Democratic Republic of
Congo (DRC) where only two bids were received from six pre-qualified bidders, the road section was located in the region which was insecure.36
31 Letter from Director of Road Agency Formation Union (RAFU) of April 3, 2007, Contract C010: Upgrading of the
Soroti-Dokolo. Road Development Program Phase 3, Uganda 32 Bid Evaluation Report.2003. The Rehabilitation of the Road EN1 between Muxungue and Inchope. Roads and
Bridges Management and Maintenance Program, Mozambique 33 OPRC Case Recommendation and Review Report.2004. Contract of Rehabilitation of RN4, Section Nia-Nia-Beni.
Emergency Economic and Social Reunification Support Project, DRC 34 Revised Bid Evaluation Report. Letter of Transmittal. 2005. 2nd Year Rehabilitation Works Contracts – Contracts
for 5 Lots. Lagos Urban Transport Project. Nigeria 35 Revised Bid Evaluation Report, Section II. 2007. Contract C010: Upgrading of the Soroti-Dokolo Road.. Road
Development Program Phase 3, Uganda.
Contract 3: Gashena_Woldia. 2006. Section II: Additional Assessment to the original Bid Evaluation Report.
Woreta-Woldiya Road Upgrading Project, Ethiopia
Bid Evaluation Report.2003. Periodic Maintenance of the Road EN1 between Zandamela and Maxixe, Roads and
Bridges Management and Maintenance Program, Mozambique 36 OPRC Case Recommendation and Review Report. 2004. Contract of Rehabilitation of RN4, Section Nia-Nia-Beni.
Emergency Economic and Social Reunification Support Project, DRC

38 MONITORING ROAD WORKS CONTRACTS AND UNIT COSTS FOR ENHANCED GOVERNANCE IN SUB-SAHARAN AFRICA
Box 4.2: Increases in Workload among Contractors in East and Southern Africa The implementing agency describes the situation in the construction industry in the East and Southern
African regions in 2007, which was a decline with slumps in government, commercial and aid spending for
large projects two years earlier. This situation has changed dramatically as a result of the HIPIC initiative,
increases in aid spending resulting from the Millennium Development Initiatives and huge increases in
commercial and government-funded projects arising from large increases in revenue from the mining and
commodities sectors. This general economic upturn has left a set of contractors in the region who have full
order books, are choosier about what work they will take on and are insisting on higher margins and lower
risk from new projects.
Source: Revised Bid Evaluation Report, Section II. 2007. Contract C010: Upgrading of the Soroti-Dokolo
Road. Road Development Program Phase III, Uganda
4.3 REASONS FOR COST OVERRUNS AND TIME EXTENSIONS
Some contracts have particularly high cost overruns and extensions of completion time. Proposing to revise a contract amount, supervision consultants evaluate the reasons and provide a detailed analysis of increase in prices for selected items of work. Some of the factors leading to contract price review might include:
• Global trend of rising oil prices. Its effect on domestic diesel prices is forcing prices of materials, haulage, and transportation to go up. As evaluated in a number of contracts in Nigeria between 2004 and 2005, the prices for bitumen went up by 78.57 percent; cement by 88 percent; crushed stone by57.24 percent; and diesel by 240 percent.37
• Labor cost increase and impact of other regulatory measures (taxation). The examples are the increase in wages introduced by the government legislation in Nigeria38, and a new taxation regime on new contractors in Madagascar39.
• Unsatisfactory contractor performance. Misjudgment on qualifications of a contracted firm can lead to delays in implementation of works and associated cost increases. These generally include cost of extended use of time-related general items in the bill of quantities. Box 4.3 describes a contract in Madagascar, which was terminated due to non-performance of the contractor who incurred costs overruns and was behind the works schedule.
Box 4.3: Termination of contracts due to non-performance of the contractor
In Madagascar, the implementing agency decided to terminate three contracts commenced in September
2004 for a total value of US$ 61.6 million due to non-performance. An independent technical audit found
the contractor’s works to be of an unacceptable quality; the works were terminated in February 2006. The
client decided not to re-bid the contracts as it could result in lower participation, higher prices, and
delayed implementation. The contracts were awarded to the second lowest evaluated bidder applying a
price adjustment of 36.5 percent reflecting the increase of the price of fuel, labor and cement concrete
since the initial bid in May 2004.
Source: OPRC Case Recommendation and Review Report, Transport Infrastructure Investment,
Madagascar, 2006
37 Letter of AIM Consultants of October 21, 2005. Contracts of construction of roads, drains and footpaths
(sidewalk) in Ogbe community and Aduduwa community. Community-Based Urban Development Project. Nigeria 38 Letter of AIM Consultants of October 21, 2005. Contracts of construction of roads, drains and footpaths
(sidewalk) in Ogbe community and Aduduwa community. Community-Based Urban Development Project. Nigeria 39 OPRC Case Recommendation and Review Report, 2006, Transport Infrastructure Investment, Madagascar

What drives road construction costs 39
• Time lag between design and contract execution dates. This factor may result in revision
of the quantities of work items. For example, in several contracts signed in 2005 and 2006 in Nigeria, the supervision consultant requested the increase in quantities substantiating this by the fact that due to such time lag of four years “some ecological factors like erosion and environmental dilapidation have affected the roads thereby necessitating massive earthwork to be executed on the site”.40
• Time extensions. They incur contract extension costs. For example, the contractor’s indirect
costs (time-related costs) that are essentially the site and head office overhead expenditures, and cost of extended use of time-related general items in the bill of quantities. Box 4.5 presents the reasons of delays as described in one of the road works contracts in Tanzania.
Box 4.4: Reasons for the Extension of Time to Complete Road Works In a contract in Tanzania, the request to extend the time of nine months to complete road works puts
forward the following reasons for the delay:
- Delay caused by late issuing of drawings and centerline coordinates of Road A;
- Delay caused by wrong design of alignment of the Road A section;
- Delay and or/disruptions caused by obstructions within the construction corridor;
- Delays in issuing control points for Road B;
- Delays caused by adverse ground conditions on Road B;
- Delay caused by varied (increased) quantities;
- Delay caused by exceptionally adverse weather condition;
- Delay caused by late payment of interim certificate;
- Critical concrete works.
Source: Letter from Spencon Services Ltd of June 13, 2007.Uprading and Reconstruction of Zanzibar Three Main Roads- Package 1, Central Transport Corridor Project, Tanzania
40 Letter of AIM Consultants of October 21, 2005, Contracts of construction of roads, drains and footpaths
(sidewalk) in Ogbe community and Aduduwa community, Nigeria; Letter of August 28,2006, Contract on
construction of roads and drains in Oku/ Ibiaku community. Community-Based Urban Development Project. Nigeria

5 ENHANCING ACCOUNTABILITY AND CONTROL OF CORRUPTION IN WORLD BANK-FINANCED PROJECTS IN THE ROAD SECTOR IN SUB-SAHARAN AFRICA
This chapter comments on the results of the analysis and the main trends observed in the procurement and implementation processes of the road sector contracts reviewed in the study. It provides selected recommendations to enhance accountability and control of corruption in Bank-financed projects in the road sector in Sub-Saharan Africa. In conclusion, it puts forward next steps to sustain the platform fostering governance and integrity in the procurement and implementation of road sector contracts financed by the Bank. The road sector contracting of the Bank-financed projects in the reviewed countries is characterized by a limited number of firms dominating large-scale road works contracts. The market is split between the African firms and mainly the Chinese and European contractors. The largest projects are generally awarded to the international contractors, in particular those from China. The overall rate of the pre-qualified firms to bid for large works appears to be competitive (more than six firms on average), however, the actual participation in tenders is quite low—only about half of the pre-qualified firms bid. The procurement procedures to commence works are lengthy across a number of the reviewed countries. A delayed process of contract start up could be to some extent a result of weak roads management capacity, regulatory environment, and administrative burdens. However, this underlying inefficiency is also exacerbated by weak governance. The bid prices sometimes exceed the engineer’s estimates by an excessive margin. The values of a quarter of the road works contracts in the sample are higher by 30 percent or more than their engineer’s estimates. These high bid rates are observed in each country in the sample, except Ghana. The contract values in Ghana are consistently lower than their estimated costs. 5.1 RECOMMENDED ACTIONS
The following selected recommendations are geared towards enhancing accountability and attaining a higher degree of control of corruption in Bank-financed projects in the road sector in Sub-Saharan Africa:
• Consider establishing a tighter timeframe for contract signing. The extensions of bid
validity period within which the contract should be awarded, should be less flexible. A stricter adherence to the World Bank’s procurement guidelines should be observed. They provide for an extension of bid validity “if justified by exceptional circumstances” that could be requested for the minimum period required to complete evaluation, obtain the necessary approvals, and award the contract.41. A delayed bid evaluation process may provide opportunities for corrupt practices and back-door negotiations.
• Allow using a selection procedure of post-qualification in bidding for large works
instead of pre-qualification. Knowledge of other pre-qualified firms carries a potential risk of collusion. Also, other firms may choose not to bid due to a potential collusion of well-connected companies. This results in unfair competition and market manipulation. In order to
41 World Bank. 2006. Guidelines: Procurement under IBRD Loans and IDA Credits, Section II, Para
2.57.Washington, DC. http://go.worldbank.org/RPHUY0RFI0

42 MONITORING ROAD WORKS CONTRACTS AND UNIT COSTS FOR ENHANCED GOVERNANCE IN SUB-SAHARAN AFRICA
facilitate bidder competition and avoid collusion, the proposal of road agencies to use post-qualification for contracts above the pre-qualification threshold values could be endorsed.
• Create a system to monitor and assess the performance of contractors and
consultants and associated costs. Tracking of information on prime contractors and consultants in the road industry in the region could mitigate risks of misjudging on qualifications of firms as well as ensure due diligence on poor performers. The system could include a firm’s profile, the number and values of contract awards, unit cost of works, satisfactory completion of the job, completion within the schedule, quality of works, and so on. This database could assist local road agencies in being more efficient in completing evaluations. The rankings of major contractors and consultants could identify strong performers who could be encouraged to bid or hired through direct contracting in case of emergencies. This registry would provide performance incentives as well as facilitate accountability.
• Strengthen monitoring of the procurement and implementation processes to
enhance detection of the risks to integrity. A detailed record and information, if available in the World Bank system could reduce incentives for firms and other entities to participate in collusion, bid rigging, and other corrupt practices. It is important to generate the data to increase accountability. This study could be replicated in other regions where the World Bank operates as it provides benchmarks and references against which individual projects performance or outcomes can be compared. It also establishes thresholds above which there may be causes for concerns or for further investigations.
5.2 CONCLUSIONS
It is critical to continue collecting data on the procurement and implementation processes of the road sector contracts to allow comparison of cost trends, bidding competition, and performance in the road sector. A standard framework (including a template) has been developed within this study to provide the platform for monitoring and evaluation of prices, bidding data, and contractor’s information to help improve governance. Capturing costs and unit price information of road works is important for evaluation of the trends across countries and regions. The availability of systematic cost data facilitates monitoring and comparison of the value of road works and bid price trends. Empirical evidence could be built on such indicators as price increases relative to the engineer’s estimates, cost increases, and key roads input costs to investigate the sources of increased costs and possible factors behind the increase in bid prices. It is essential to have timely and accurate data for the analysis of construction costs. Assessing bidding behavior is essential for measuring the level of competition and road works activity financed by the Bank. Verifying the extent of a competitive bidding environment is an important tool for the procurement decisions. This may allow to better plan and determine the size of contracts in a particular area. It is important to correctly evaluate the factors behind a declining number of bidders, the causes of bidding trends, and their potential influence on bid rates for contracts. Detailed bidding data could facilitate measuring if the procurement process is affected by collusion and bid rigging through detection of patterns and red flags in the structure of bids and firms. It is useful to look separately at contracts with pre-qualification and without a pre-qualification requirement. Measuring performance more consistently would help to address inefficiencies that arise in the current procurement and implementation practices. This would ensure that irregularities are properly captured in the observed trends in a specific country or area. This would also help to distinguish if the trends are subject to potential corruption and fraud or rather stem from a weak

What drives road construction costs 43
procurement environment and low capacity. It is important to link the performance measures to contractors and consultants as well as project implementing agencies for accountability. Close monitoring of the procurement and implementation of road works contracts provides the basis for identifying early warnings of potential fiduciary problems and the information to address them. This is critical for enhancing the integrity of the procurement and implementation processes of the road works contracts and strengthening of the overall governance environment in the road sector.


45
ANNEX A: List of red flags
LIST OF RED FLAGS BY TYPE OF REDFLAG
Table 1: Variation order >20% (15 out of 109 contracts or 13.7%)
Country Contract ID Year Contract amount
(2007 US $)
No of variation
orders
Amount of
variation orders
(2007 US $)
Percent of
variation
1 Congo (DRC) 1248681 2004 8,239,794 4 2,912,905 35.35%
2 Congo (DRC) 1235364 2003 9,211,974 1 3,180,001 34.52%
3 Ghana 1227250 2002 28,500,000 1 24,400,000 85.61%
4 Ghana 1227923 2002 9,539,185 1 3,476,683 36.45%
5 Mozambique 1237400 2004 24,300,000 1 11,900,000 48.97%
6 Mozambique 1245218 2004 9,933,107 1 2,768,437 27.87%
7 Mozambique 1237396 2004 29,300,000 4 9,081,348 30.99%
8 Nigeria 1247996 2005 2,074,666 1 642,812 30.98%
9 Nigeria 1243279 2004 1,751,586 2 777,138 44.37%
10 Nigeria 1243278 2004 1,327,938 2 530,919 39.98%
11 Nigeria 1247425 2004 962,896 2 477,065 49.54%
12 Nigeria 1248440 2004 2,506,454 2 1,130,842 45.12%
13 Nigeria 1248443 2004 3,273,496 2 1,834,016 56.03%
14 Tanzania 1249871 2005 13,300,000 2 5,672,856 42.65%
15 Tanzania 1220241 2002 2,579,366 3 5,439,608 210.89%

46 MONITORING ROAD WORKS CONTRACTS AND UNIT COSTS FOR ENHANCED GOVERNANCE IN SUB-SAHARAN AFRICA
6 TABLE 2: DELAYS - CONTRACT SIGNING DATE MORE THAN 7 MONTHS AFTER ORIGINAL BID OPENING (32.1% OF ALL
CONTRACTS)*
Country Contract ID Year Bid opening date Contract
signing date
No. of days
between bid
opening &
contract signing
No. of months
between bid
opening &
contract
signing
1 Ethiopia 1216927 2001 23-Jan-01 10-Oct-01 260 8.7
2 Ethiopia 1246958 2005 18-Mar-04 21-Jan-05 309 10.3
3 Ethiopia 1262535 2006 30-Aug-05 27-Jul-06 331 11.0
4 Ethiopia 1260195 2006 30-Aug-05 4-Jul-06 308 10.3
5 Zambia 1216195 2001 12-Jan-01 14-Aug-01 214 7.1
6 Zambia 1207212 2000 10-Dec-99 5-Sep-00 270 9.0
7 Zambia 1207016 2000 10-Dec-99 5-Sep-00 270 9.0
8 Zambia 1207015 2000 10-Dec-99 5-Sep-00 270 9.0
9 Ghana 1237217 2003 20-Mar-03 15-Dec-03 270 9.0
10 Malawi 1239532 2004 12-Mar-03 28-Apr-04 413 13.8
11 Malawi 1213251 2001 10-Nov-00 27-Jun-01 229 7.6
12 Mozambique 1244436 2004 3-Nov-03 11-Oct-04 343 11.4
13 Mozambique 1244464 2004 3-Nov-03 11-Oct-04 343 11.4
14 Mozambique 1245218 2004 16-Feb-04 11-Nov-04 269 9.0
15 Kenya 1263943 2006 15-Sep-05 29-Aug-06 348 11.6
16 Kenya 1263914 2006 15-Sep-05 29-Aug-06 348 11.6
17 Kenya 1263934 2006 15-Sep-05 29-Aug-06 348 11.6
18 Kenya 1263935 2006 15-Sep-05 29-Aug-06 348 11.6
19 Tanzania 1250519 2005 1-Jul-03 24-Jan-05 573 19.1
20 Tanzania 1222383 2002 30-Apr-01 7-May-02 372 12.4
21 Tanzania 1219975 2002 30-Apr-01 26-Mar-02 330 11.0
22 Tanzania 1217745 2001 30-Apr-01 7-Dec-01 221 7.4
23 Tanzania 1121617 2000 2-Jun-99 14-Jan-00 226 7.5
24 Uganda 1270314 2007 5-Dec-06 13-Sep-07 282 9.4
25 Uganda 1243438 2004 10-Jun-03 21-Jun-04 377 12.6
26 Uganda 1241220 2004 10-Jun-03 21-Jun-04 377 12.6
27 Uganda 1240049 2004 22-Oct-02 25-Mar-04 520 17.3
28 Uganda 1235957 2003 22-Oct-02 19-Nov-03 393 13.1
*Assuming bid validity of 3 months for all contracts.

Annex A 47
Table 3: Delays - More than 30% delay in completion date (28 contracts or 25.7%)
Country
6.1 Contrac
t ID Year Planned work
duration (months)
Delays
(months)
Delays as a % of
duration of the
original
contracted period
1 Congo 1249152 2005 12 4 33%
2 Congo (DRC) 1248681 2004 16 12 75%
3 Congo (DRC) 1248476 2005 22 8 36%
4 Congo (DRC) 1244615 2004 24 24 100%
5 Congo (DRC) 1244617 2004 24 21 88%
6 Ghana 1237217 2003 24 8 33%
7 Ghana 1227250 2002 32 23.6 74%
8 Ghana 1227923 2002 24 9 38%
9 Ghana 1226700 2002 24 12 50%
10 Mozambique 1237417 2004 15 12 80%
11 Mozambique 1237400 2004 15 14 93%
12 Mozambique 1237364 2004 14 14 100%
13 Mozambique 1245218 2004 12 10 83%
14 Mozambique 1237396 2004 14 14 100%
15 Mozambique 1237371 2004 14 16 114%
16 Mozambique 1237344 2004 15 15 100%
17 Malawi 1239532 2004 6 10 167%
18 Malawi 1239555 2004 6 10 167%
19 Malawi 1213251 2001 9 3 33%
20 Malawi 1240987 2004 6 10 167%
21 Nigeria 1247253 2005 12 12 100%
22 Nigeria 1247996 2005 12 14 117%
23 Nigeria 1243279 2004 12 20 167%
24 Nigeria 1243278 2004 12 20 167%
25 Nigeria 1247425 2004 12 25 208%
26 Tanzania 1253712 2005 18 8 44%
27 Uganda 1243438 2004 24 21 88%
28 Madagascar 1265304 2007 4 8 202%

48 MONITORING ROAD WORKS CONTRACTS AND UNIT COSTS FOR ENHANCED GOVERNANCE IN SUB-SAHARAN AFRICA
Table 4: Only one or two bidders (14 out of 109 contracts or 12.8% of all contracts)
Country Contract ID Year
No. of firms that
bought bidding
documents
No. of Bidders
1 Congo 1241248 2004 8 2
2 Congo (DRC) 1248475 2005 1 1
3 Congo (DRC) 1244617 2004 6 2
4 Congo (DRC) 1244616 2004 6 2
5 Ethiopia 1246958 2005 2
6 Ghana 1227250 2002 6 2
7 Ghana 1264688 2006 2 2
8 Mozambique 1257614 2006 20 1
9 Malawi 1239532 2004 6 2
10 Malawi 1253795 2005 6 2
11 Nigeria 1254042 2005 7 2
12 Uganda 1235957 2003 1
13 Zambia 1207015 2000 11 2
14 Madagascar 1265304 2007 8 2
Table 5: Half or more of the firms buying bidding documents fail to bid (24 out of 109 contractors or 22%)
Country Contract ID Year
Number of firms
buying bidding
documents
Number of
bidders
No. of firms
failed to bid
% of firms failed
to bid
1 Congo 1241248 2004 8 2 6 75%
2 Congo (DRC) 1262209 2006 12 6 6 50%
3 Congo (DRC) 1235364 2003 13 3 10 77%
4 Madagascar 1244600 2004 23 7 16 70%
5 Madagascar 1244546 2004 23 7 16 70%
6 Madagascar 1244513 2004 23 7 16 70%
7 Madagascar 1265304 2007 8 2 6 75%
8 Mozambique 1244436 2004 25 8 17 68%
9 Mozambique 1244464 2004 25 9 16 64%
10 Mozambique 1237417 2004 22 8 14 64%
11 Mozambique 1237400 2004 20 7 13 65%
12 Mozambique 1237364 2004 15 4 11 73%
13 Mozambique 1245218 2004 14 4 10 71%
14 Mozambique 1257614 2006 20 1 19 95%
15 Mozambique 1237396 2004 21 10 11 52%
16 Mozambique 1237371 2004 20 6 14 70%
17 Mozambique 1237344 2004 20 5 15 75%
18 Malawi 1239532 2004 6 2 4 67%
19 Malawi 1253795 2005 6 2 4 67%
20 Malawi 1213251 2001 9 4 5 56%
21 Tanzania 1253695 2005 12 4 8 67%
22 Uganda 1228449 2002 14 4 10 71%
23 Zambia 1207016 2000 12 6 6 50%
24 Zambia 1207015 2000 11 2 9 82%

Annex A 49
Table 6: 20% or more of the pre-qualified firms failed to bid (27 out of the 32 contracts where there was pre-
qualification or 84%)
Country Contract ID Year
Number of firms
that were pre-
qualified
Number of
bidders
No. of pre-
qualified firms
failed to bid
1 Congo (DRC) 1248474 2005 8 4 50%
2 Congo (DRC) 1248476 2005 7 3 57%
3 Congo (DRC) 1248475 2005 4 1 75%
4 Congo (DRC) 1244615 2004 8 4 50%
5 Congo (DRC) 1244617 2004 8 2 75%
6 Congo (DRC) 1244616 2004 8 2 75%
7 Congo (DRC) 1251263 2005 8 3 63%
8 Ethiopia 1242074 2004 5 4 20%
9 Ethiopia 1242065 2004 7 3 57%
10 Ethiopia 1262535 2006 8 5 38%
11 Ethiopia 1260195 2006 10 3 70%
12 Ghana 1237217 2003 14 7 50%
13 Ghana 1227250 2002 6 2 67%
14 Kenya 1263943 2006 9 5 44%
15 Kenya 1263934 2006 7 3 57%
16 Kenya 1263935 2006 6 3 50%
17 Nigeria 1254033 2005 13 3 77%
18 Nigeria 1254034 2005 13 4 69%
19 Nigeria 1254295 2005 13 3 77%
20 Nigeria 1254042 2005 13 2 85%
21 Nigeria 1254610 2005 13 3 77%
22 Tanzania 1249871 2005 6 3 50%
23 Tanzania 1251319 2005 7 4 43%
24 Tanzania 1250519 2005 7 3 57%
25 Uganda 1243438 2004 8 4 50%
26 Uganda 1241220 2004 8 4 50%
27 Uganda 1239486 2004 4 3 25%
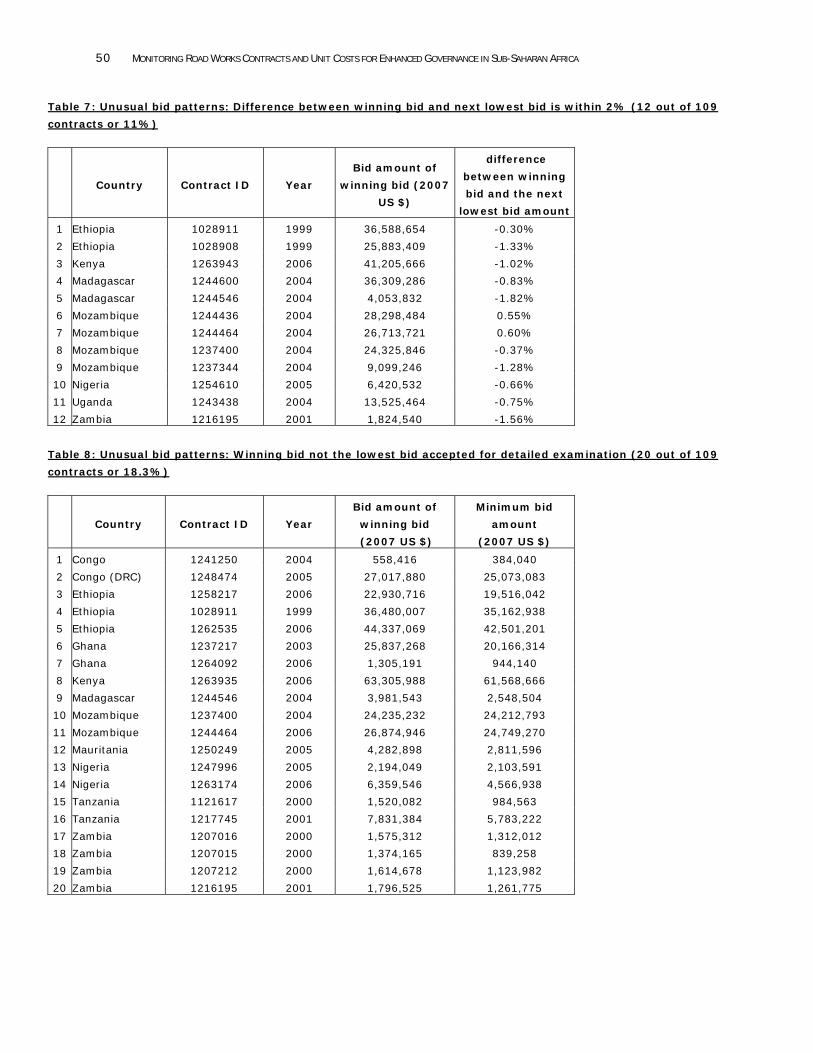
50 MONITORING ROAD WORKS CONTRACTS AND UNIT COSTS FOR ENHANCED GOVERNANCE IN SUB-SAHARAN AFRICA
Table 7: Unusual bid patterns: Difference between winning bid and next lowest bid is within 2% (12 out of 109
contracts or 11%)
Country Contract ID Year
Bid amount of
winning bid (2007
US $)
difference
between winning
bid and the next
lowest bid amount
1 Ethiopia 1028911 1999 36,588,654 -0.30%
2 Ethiopia 1028908 1999 25,883,409 -1.33%
3 Kenya 1263943 2006 41,205,666 -1.02%
4 Madagascar 1244600 2004 36,309,286 -0.83%
5 Madagascar 1244546 2004 4,053,832 -1.82%
6 Mozambique 1244436 2004 28,298,484 0.55%
7 Mozambique 1244464 2004 26,713,721 0.60%
8 Mozambique 1237400 2004 24,325,846 -0.37%
9 Mozambique 1237344 2004 9,099,246 -1.28%
10 Nigeria 1254610 2005 6,420,532 -0.66%
11 Uganda 1243438 2004 13,525,464 -0.75%
12 Zambia 1216195 2001 1,824,540 -1.56%
Table 8: Unusual bid patterns: Winning bid not the lowest bid accepted for detailed examination (20 out of 109
contracts or 18.3%)
Country Contract ID Year
Bid amount of
winning bid
(2007 US $)
Minimum bid
amount
(2007 US $)
1 Congo 1241250 2004 558,416 384,040
2 Congo (DRC) 1248474 2005 27,017,880 25,073,083
3 Ethiopia 1258217 2006 22,930,716 19,516,042
4 Ethiopia 1028911 1999 36,480,007 35,162,938
5 Ethiopia 1262535 2006 44,337,069 42,501,201
6 Ghana 1237217 2003 25,837,268 20,166,314
7 Ghana 1264092 2006 1,305,191 944,140
8 Kenya 1263935 2006 63,305,988 61,568,666
9 Madagascar 1244546 2004 3,981,543 2,548,504
10 Mozambique 1237400 2004 24,235,232 24,212,793
11 Mozambique 1244464 2006 26,874,946 24,749,270
12 Mauritania 1250249 2005 4,282,898 2,811,596
13 Nigeria 1247996 2005 2,194,049 2,103,591
14 Nigeria 1263174 2006 6,359,546 4,566,938
15 Tanzania 1121617 2000 1,520,082 984,563
16 Tanzania 1217745 2001 7,831,384 5,783,222
17 Zambia 1207016 2000 1,575,312 1,312,012
18 Zambia 1207015 2000 1,374,165 839,258
19 Zambia 1207212 2000 1,614,678 1,123,982
20 Zambia 1216195 2001 1,796,525 1,261,775

Annex A 51
Table 9: Contract value more than 20 % higher than engineer’s estimate (26 out of 109 contracts or 23.9%)
Country Contract ID Year
Estimate
Amount
(2007 US $)
Contract
Amount
(2007 US $)
Percent increase
in contract
amount
1 Congo (DRC) 1248474 2005 22,683,998 33,793,964 49.0%
2 Congo (DRC) 1244617 2004 23,540,002 31,807,410 35.1%
3 Ethiopia 1258217 2006 14,206,174 23,412,262 64.8%
4 Ethiopia 1258212 2006 14,332,577 19,787,644 38.1%
5 Ethiopia 1246958 2005 27,219,680 34,320,824 26.1%
6 Ethiopia 1262535 2006 27,488,784 42,936,548 56.2%
7 Ethiopia 1260195 2006 21,296,196 26,502,572 24.4%
8 Kenya 1263934 2006 28,097,190 39,616,412 41.0%
9 Mozambique 1244436 2004 11,908,244 22,489,160 88.9%
10 Mozambique 1244464 2004 11,261,770 19,315,852 71.5%
11 Mozambique 1237417 2004 22,196,040 27,159,710 22.4%
12 Mozambique 1237400 2004 14,521,077 24,310,020 67.4%
13 Mozambique 1237364 2004 8,714,285 17,371,390 99.3%
14 Mozambique 1257614 2006 6,451,201 8,535,337 32.3%
15 Mozambique 1237396 2004 20,015,344 29,252,576 46.2%
16 Malawi 1239532 2004 1,518,382 2,061,287 35.8%
17 Malawi 1239555 2004 1,076,276 1,501,791 39.5%
18 Nigeria 1248440 2004 1,769,486 2,506,454 41.6%
19 Nigeria 1248443 2004 2,602,537 3,273,496 25.8%
20 Nigeria 1254042 2005 3,445,710 4,628,808 34.3%
21 Nigeria 1254610 2005 5,423,610 7,031,490 29.6%
22 Tanzania 1217745 2001 6,658,607 8,927,778 34.1%
23 Tanzania 1121617 2000 1,082,577 1,839,299 69.9%
24 Uganda 1243438 2004 12,084,518 14,516,666 20.1%
25 Uganda 1235957 2003 12,157,228 19,091,146 57.0%
26 Madagascar 1261127 2006 4,064,000 5,338,808 31.4%

52 MONITORING ROAD WORKS CONTRACTS AND UNIT COSTS FOR ENHANCED GOVERNANCE IN SUB-SAHARAN AFRICA
Table 10: The difference between contract price and read-out bidding price is more than 10% (19 out of 109
contracts or 17.43%)
Country Contract ID Year Contract Value
(2007 US$)
Winning Bid
Amount
(2007 US$)
Percent change
1 Congo 1247489 2005 8,613,700 11,773,195 -26.84%
2 Congo (DRC) 1248474 2005 33,793,964 28,638,952 18.00%
3 Congo (DRC) 1248476 2005 32,091,168 27,238,306 17.82%
4 Congo (DRC) 1262209 2006 16,576,219 14,047,643 18.00%
5 Congo (DRC) 1244617 2004 31,807,410 35,341,568 -10.00%
6 Mozambique 1244436 2004 22,489,160 30,505,090 -26.28%
7 Mozambique 1244464 2004 19,315,852 28,809,942 -32.95%
8 Mozambique 1245218 2004 9,933,107 8,873,699 11.94%
9 Mozambique 1237371 2004 15,420,337 17,806,958 -13.40%
10 Malawi 1239555 2004 1,501,791 1,311,559 14.50%
11 Malawi 1253795 2005 2,737,096 5,042,655 -45.72%
12 Malawi 1253820 2005 1,181,461 1,912,534 -38.23%
13 Nigeria 1247996 2005 2,074,666 2,334,468 -11.13%
14 Tanzania 1220241 2002 2,914,684 2,643,361 10.26%
15 Uganda 1240049 2004 15,905,719 14,145,430 12.44%
16 Uganda 1235957 2003 19,091,146 17,033,610 12.08%
17 Zambia 1207212 2000 1,587,419 1,905,320 -16.68%
18 Zambia 1207016 2000 1,546,950 1,858,868 -16.78%
19 Zambia 1207015 2000 1,273,521 1,621,515 -21.46%

Annex A 53
RED FLAGS FOR COSTS
Table 11: Cost per km higher than the 75th percentile by type of work and type of road
Country Contract ID Year
Cost per km
(US$/km)
1 Congo 1238691 2004 146,956
2 Congo 1247489 2005 2,392,695
3 Congo (DRC) 1244617 2004 90,516
4 Ethiopia 1242074 2004 205,835
5 Ghana 1237217 2003 577,280
6 Ghana 1264092 2006 234,934
7 Kenya 1263935 2006 571,786
8 Kenya 1263934 2006 1,277,949
9 Kenya 1263943 2006 737,849
10 Kenya 1263914 2006 1,235,437
11 Malawi 1239555 2004 644,546
12 Mozambique 1237344 2004 196,578
13 Mozambique 1237371 2004 223,580
14 Nigeria 1247425 2004 598,072
15 Nigeria 1254295 2005 2,075,801
16 Tanzania 1249871 2005 421,884
17 Tanzania 1250519 2005 431,366
18 Uganda 1270314 2007 720,320
19 Uganda 1235957 2003 489,015
Table 12: Unit Cost of Asphalt Concrete is higher than the 75th percentile (75th percentile=$230/m3)
Country Contract ID Year
Unit Cost of Asphalt
Concrete (US$/m3)
1 Congo 1247489 2005 332.3
2 Congo (DRC) 1248474 2005 290.7
3 Congo (DRC) 1235364 2003 311.9
4 Kenya 1263934 2006 234.3
5 Malawi 1253820 2005 247.7
6 Malawi 1240987 2004 270.7
7 Nigeria 1263174 2006 282.3
8 Nigeria 1243279 2004 351.7
9 Nigeria 1247425 2004 335.1

54 MONITORING ROAD WORKS CONTRACTS AND UNIT COSTS FOR ENHANCED GOVERNANCE IN SUB-SAHARAN AFRICA
Table 13: Unit Cost of Portland Cement Concrete is higher than the 75th percentile (75th
percentile=$203/m3)
Country Contract ID Year
Unit Cost of Portland
Cement Concrete
(US$/m3)
1 Congo (DRC) 1244616 2004 340.2
2 Ethiopia 1246958 2005 228.2
3 Ethiopia 1028908 1999 206.4
4 Kenya 1263934 2006 216.7
5 Madagascar 1261393 2006 270.0
6 Madagascar 1261127 2006 232.9
7 Mozambique 1237396 2004 230.7
8 Tanzania 1253712 2005 220.6
9 Uganda 1239486 2004 211.3
10 Zambia 1216195 2001 207.0
Table 14: Unit Cost of Gravel Subbase is higher than the 75th percentile (75th percentile=$12/m3)
Country Contract ID Year
Unit Cost of Gravel
Subbase (US$/m3)
1 Congo (DRC) 1248474 2005 15.6
2 Congo (DRC) 1248475 2005 21.1
3 Congo (DRC) 1235364 2003 49.5
4 Ethiopia 1246958 2005 13.5
5 Ethiopia 1242072 2004 13.6
6 Ethiopia 1262535 2006 27.5
7 Ethiopia 1260195 2006 25.2
8 Madagascar 1244513 2004 16.7
9 Nigeria 1247995 2005 13.4
10 Tanzania 1253695 2005 25.8
Table 15: Unit Cost of Gravel Base is higher than the 75th percentile (75th percentile=$12/m3)
Country Contract ID Year
Unit Cost of Gravel
Base (US$/m3)
1 Congo (DRC) 1235364 2003 51.9
2 Congo (DRC) 1244616 2004 56.3
3 Mozambique 1244436 2004 19.2
4 Nigeria 1247995 2005 13.4
5 Uganda 1243438 2004 13.4

Annex A 55
Table 16: Unit Cost of Crushed Stone Base is higher than the 75th percentile (75th percentile=$46/m3)
Country Contract ID Year
Unit Cost of Crushed
Stone Base
(US$/m3)
1 Congo 1247489 2005 55.4
2 Congo 1249152 2005 79.8
3 Congo (DRC) 1248681 2004 71.3
4 Congo (DRC) 1248475 2005 53.9
5 Tanzania 1220241 2002 85.4
6 Uganda 1270314 2007 76.3
Table 17: Unit Cost of Earthworks Soft is higher than the 85th percentile (85th percentile=$7.85m3)
Country Contract ID Year
Unit Cost of
Earthworks Soft
(US$/m3)
1 Kenya 1263935 2006 11.27
2 Madagascar 1271614 2007 7.91
3 Malawi 1253820 2005 17.93
4 Malawi 1239532 2004 8.46
5 Malawi 1253795 2005 11.32
6 Kenya 1263934 2006 9.47
7 Congo (DRC) 1248474 2005 8.21
8 Madagascar 1261393 2006 8.38
9 Uganda 1239486 2004 8.91
Table 18: Unit Cost of Earthworks Hard is higher than the 75th percentile (75th percentile=$26m3)
Country Contract ID Year
Unit Cost of
Earthworks Hard
(US$/m3)
1 Congo (DRC) 1248474 2005 78.7
2 Kenya 1263934 2006 28.3
3 Madagascar 1271614 2007 39.2
4 Tanzania 1253712 2005 31.6
5 Tanzania 1220241 2002 31.4

56 MONITORING ROAD WORKS CONTRACTS AND UNIT COSTS FOR ENHANCED GOVERNANCE IN SUB-SAHARAN AFRICA
Table 19: Total Number of Red Flags by Contract
Country Contract ID Year
Number of Red
Flags
1 Congo 1241248 2004 2
2 Congo 1238691 2004 1
3 Congo 1238687 2004 0
4 Congo 1238865 2004 0
5 Congo 1238863 2004 0
6 Congo 1247489 2005 4
7 Congo 1249152 2005 2
8 Congo 1241250 2004 1
9 Congo (DRC) 1248681 2004 3
10 Congo (DRC) 1248474 2005 9
11 Congo (DRC) 1248476 2005 4
12 Congo (DRC) 1248475 2005 4
13 Congo (DRC) 1262209 2006 2
14 Congo (DRC) 1235364 2003 5
15 Congo (DRC) 1244615 2004 2
16 Congo (DRC) 1244617 2004 7
17 Congo (DRC) 1244616 2004 5
18 Congo (DRC) 1251263 2005 1
19 Ethiopia 1258217 2006 2
20 Ethiopia 1216927 2001 1
21 Ethiopia 1258212 2006 1
22 Ethiopia 1246958 2005 5
23 Ethiopia 1242074 2004 2
24 Ethiopia 1242072 2004 1
25 Ethiopia 1242065 2004 1
26 Ethiopia 1028911 1999 2
27 Ethiopia 1028908 1999 2
28 Ethiopia 1262535 2006 5
29 Ethiopia 1260195 2006 4
30 Ghana 1210549 2000 0
31 Ghana 1237217 2003 5
32 Ghana 1264092 2006 2
33 Ghana 1264389 2006 0
34 Ghana 1227250 2002 5
35 Ghana 1227923 2002 2
36 Ghana 1230703 2003 0
37 Ghana 1264688 2006 1
38 Ghana 1226700 2002 1
39 Ghana 1245560 2004 0
40 Kenya 1263943 2006 4
41 Kenya 1263914 2006 2
42 Kenya 1263934 2006 8
43 Kenya 1263935 2006 5
44 Madagascar 1244600 2004 2
45 Madagascar 1244546 2004 3

Annex A 57
Country Contract ID Year
Number of Red
Flags
46 Madagascar 1244513 2004 2
47 Madagascar 1261393 2006 2
48 Madagascar 1261127 2006 2
49 Madagascar 1271614 2007 2
50 Madagascar 1265304 2007 3
51 Mozambique 1244436 2004 6
52 Mozambique 1244464 2004 6
53 Mozambique 1237417 2004 3
54 Mozambique 1237400 2004 6
55 Mozambique 1237364 2004 3
56 Mozambique 1245218 2004 5
57 Mozambique 1257614 2006 3
58 Mozambique 1237396 2004 5
59 Mozambique 1237371 2004 4
60 Mozambique 1237344 2004 5
61 Mauritania 1250249 2005 1
62 Mauritania 1260156 2006 0
63 Mauritania 1233356 2003 0
64 Malawi 1239532 2004 6
65 Malawi 1239555 2004 4
66 Malawi 1253795 2005 4
67 Malawi 1253820 2005 3
68 Malawi 1207890 2000 0
69 Malawi 1213251 2001 3
70 Malawi 1240987 2004 2
71 Nigeria 1263174 2006 2
72 Nigeria 1247253 2005 1
73 Nigeria 1247996 2005 4
74 Nigeria 1247995 2005 2
75 Nigeria 1243279 2004 3
76 Nigeria 1243278 2004 2
77 Nigeria 1247425 2004 4
78 Nigeria 1248440 2004 2
79 Nigeria 1248443 2004 2
80 Nigeria 1254033 2005 2
81 Nigeria 1254034 2005 1
82 Nigeria 1254295 2005 3
83 Nigeria 1254042 2005 4
84 Nigeria 1254610 2005 4
85 Tanzania 1249871 2005 3
86 Tanzania 1251319 2005 1
87 Tanzania 1250519 2005 3
88 Tanzania 1253712 2005 3
89 Tanzania 1253695 2005 2
90 Tanzania 1220241 2002 4
91 Tanzania 1222383 2002 1
92 Tanzania 1219975 2002 1

58 MONITORING ROAD WORKS CONTRACTS AND UNIT COSTS FOR ENHANCED GOVERNANCE IN SUB-SAHARAN AFRICA
Country Contract ID Year
Number of Red
Flags
93 Tanzania 1217745 2001 3
94 Tanzania 1121617 2000 3
95 Uganda 1228449 2002 1
96 Uganda 1270314 2007 3
97 Uganda 1243438 2004 6
98 Uganda 1241220 2004 2
99 Uganda 1239486 2004 3
100 Uganda 1240049 2004 2
101 Uganda 1235957 2003 5
102 Zambia 1236060 2003 0
103 Zambia 1236103 2003 0
104 Zambia 1236064 2003 0
105 Zambia 1216195 2001 4
106 Zambia 1207212 2000 3
107 Zambia 1207016 2000 4
108 Zambia 1207015 2000 5
109 Zambia 1119368 1999 0

59
ANNEX B: Comparison of Unit Costs and their Estimates
Country Year Contract ID Unit Cost (US$/m3)
Engineer’s Estimate of Unit Cost (US$/m3)
Asphalt concrete(US$/m3)
Ghana 2003 1237217 133.5 172.5
Kenya 2006 1263943 139.9 152.5
Kenya 2006 1263914 175.5 152.5
Kenya 2006 1263934 234.3 177.6
Kenya 2006 1263935 170.2 177.6
Nigeria 2006 1263174 282.3 282.3
Portland Cement concrete(US$/m3)
Ghana 2003 1237217 106.0 121.4
Kenya 2006 1263943 199.0 165.0
Kenya 2006 1263914 137.2 138.9
Kenya 2006 1263934 216.7 186.2
Kenya 2006 1263935 129.9 186.2
Mozambique 2004 1237417 157.8 121.0
Tanzania 2005 1249871 174.4 189.0
Uganda 2004 1239486 211.3 245.3

60 MONITORING ROAD WORKS CONTRACTS AND UNIT COSTS FOR ENHANCED GOVERNANCE IN SUB-SAHARAN AFRICA
Country Year Contract ID Unit Cost (US$/m3)
Engineer’s Estimate of Unit Cost (US$/m3)
Earthworks Soft(US$/m3)
Ethiopia 2006 1258217 6.05 4.45
Ethiopia 2006 1258212 3.47 4.45
Ethiopia 2004 1242074 2.76 3.48
Ethiopia 2006 1260195 2.93 4.44
Kenya 2006 1263943 5.35 4.54
Kenya 2006 1263914 4.78 4.54
Kenya 2006 1263934 9.47 3.19
Kenya 2006 1263935 11.27 3.19
Tanzania 2005 1249871 4.05 5.81
Uganda 2004 1239486 8.91 2.73
Earthworks Hard(US$/m3)
Ethiopia 2006 1258217 16.15 4.69
Ethiopia 2006 1258212 12.74 4.69
Ethiopia 2004 1242074 10.18 12.86
Ethiopia 2006 1260195 9.10 4.67
Kenya 2006 1263943 17.81 26.69
Kenya 2006 1263914 6.97 26.69
Kenya 2006 1263934 28.33 12.75

Annex B 61
Country Year Contract ID Unit Cost (US$/m3)
Engineer’s Estimate of Unit Cost (US$/m3)
Kenya 2006 1263935 10.41 12.75
Mozambique 2004 1237417 26.34 4.68
Tanzania 2005 1249871 16.81 31.45
Gravel Subbase (US$/m3)
Ethiopia 2006 1258217 10.8 11.7
Ethiopia 2006 1258212 10.8 11.7
Ethiopia 2006 1260195 25.2 11.7
Ghana 2003 1237217 7.1 7.0
Kenya 2006 1263934 11.1 10.0
Kenya 2006 1263935 7.0 10.0
Mozambique 2004 1237417 5.4 2.7
Nigeria 2006 1263174 5.1 9.4
Uganda 2004 1239486 9.6 6.5
Gravel Base (US$/m3)
Mozambique 2004 1237417 5.4 2.7
Nigeria 2006 1263174 5.5 11.8
Uganda 2004 1239486 9.6 6.5


ANNEX C: Cost Analysis Table C 1. Regression Results for Unit Costs (US$/m3) by Types of Road Work
Asphalt Concrete Portland Cement
Concrete
Gravel Subbase Earthworks Soft
(1) (2) (1) (2) (1) (2) (1) (2)
GDP per capita 0.07* 0.1* -0.08 -0.08 -0.02** -0.02* -0.0001 0.001
(0.09) (0.06) (0.33) (0.30) (0.01) (0.05) (0.61) (0.58)
0.212 0.44 0.47 0.47 0.01 0.02 0.56** 0.058** Fuel price
2007 (0.52) (0.28) (0.24) (0.21) (0.79) (0.64) (0.001) (0)
-
118.9** -44.9 -5.50** -1.20
Control of
Corruption (WBI) (0) (0.15) (0.04) (0.19)
-56.7** -34.9* -4.36** -0.91 TI Corruption
Perceptions
Index (0.01) (0.05) (0.04) (0.13)
Constant 67.37 276.1 123.8 249.9 11.6 25.35 -0.07 3.18
(0.031) (0) (0.001) (0.001) (0.012) (0.001) (0.96) (0.18)
F value 13.2 4.7 2.44 3.16 3.26 3.41 6.72 7.0
(0) (0.007) (0.08) (0.04) (0.03) (0.02) (0.006) (0.0005
)
No of Obs 39 39 38 38 50 50 58 58
Adjusted R-
squared
0.49 0.225 0.104 0.15 0.12 0.13 0.231 0.24
** Significant at the 5 percent level; * Significant at the 10 percent level
Source: Authors’ analysis based on our database
Note: Numbers in parenthesis are the p-values (level of significance)

64 MONITORING ROAD WORKS CONTRACTS AND UNIT COSTS FOR ENHANCED GOVERNANCE IN SUB-SAHARAN AFRICA
Equation (1): Using WBI Control of Corruption Index
Equation (2): Using Transparency International’s Corruption Perceptions Index
Table C1 summarizes the estimation results for the unit costs of different work types. We find that there is a significant effect of the Governance Indices on the unit cost of Asphalt Concrete and Gravel Subbase. The coefficient is negative as expected meaning that the worse the governance index (lower value of the index), the higher is the unit cost. GDP per capita is also significant for both Asphalt Concrete and Gravel Subbase but the effect is positive for Asphalt Concrete and negative for Gravel Subbase. The reason for the latter cannot be explained at this stage. Fuel price has a positive and significant effect on the unit cost of Earthworks (Soft Material).

65
ANNEX D: Data on bidding information This Annex is available electronically (as an MS Excel spreadsheet). Data is presented with the following categories:
Classification Group
1.1 Country
1.2 Region
1.3 Project ID
1.4 Project Title
1.5 Contract No. (SAP)
1.6 Contract Title
1.7 Road section
1.8 Year
1. Project Information
1.9 Implementing Agency
2.1 Method of Procurement (ICB, NCB)
2.2 Prequalification (yes/no)
2.3 If prequalification, number of applicants
2.4 If prequalification, number of firms pre-qualified
2.5 Number of firms bought bidding documents
2.6 Number of bidders
2.7 Number of bidders passed preliminary exam (Bidders passed detailed examination)
2.8 Name of winning bidder
2.9 Nationality of winning bidder
2.10 Bid amounts in USD
2.11 Names of bidders (for each bid amount)
2.12 Nationality of bidders
2.13 Dummy for winning bidder
2. Bidding
2.14 Dummy for Qualified bidder (passed prelim exam)
3.1 Bid opening date
3.2 Contract signing date
3.3 Days between bid opening & contract signing
3.4 Contracted completion date
3.5 Planned work duration (months)
3. Dates
3.6 Delays (months)


67
ANNEX E: Data on cost information This Annex is available electronically (as an MS Excel spreadsheet). Data is presented with the following categories:
Classification Group
1.1 Country
1.2 Region
1.3 Project ID
1.4 Project Title
1.5 Contract No. (SAP)
1.6 Contract Title
1.7 Road section
1.8 Year
1. Project Information
1.9 Implementing Agency
2 2007 CPI FACTOR = 1
3.1 Estimate (US$)
3.2 Works Contract Value (US$)
3.3 Actual Value of Works Contract (US$)
3.4 Total Value of Works Contract (US$) (from SAP)
3.5 No. of variation Orders
3.6 Variation Orders Amount (US$)
3.7 Road work component with the highest cost
3. Works Contract Costing
3.8 The highest road work cost component as % of contract value (US$ or as %)
4.1 Road length (contract) km
4.2 Pavement width (m)
4.3 Number of lanes 4. Size Descriptors
4.4 Road Length - 2 lane equivalent, 7m wide (km)
5.1 Earthworks (Soft) (US$/m3)
5.2 Earthworks (soft) Engineers Estimate (US$/m3)
5.6 Earthworks (Hard) (US$/m3)
5.4 Earthworks (hard) Engineers Estimate (US$/m3)
5.5 Subbase (Graded crushed stone) (US$/m3)
5.6 Subbase (Graded crushed stone) Engineers Estimate (US$/m3)
5.7 Gravel Subbase (US$/m3)
5.8 Gravel Subbase Engineers Estimate (US$/m3)
5.9 Subbase (Sand) (US$/m3)
5.10 Gravel Base (US$/m3)
5.11 Gravel Base Engineers Estimate (US$/m3)
5. Unit Costs
5.12 Base (Sand) (US$/m3)

68 MONITORING ROAD WORKS CONTRACTS AND UNIT COSTS FOR ENHANCED GOVERNANCE IN SUB-SAHARAN AFRICA
5.13 Crushed stone Base (US$/m3)
5.14 Crushed stone Base Engineers Estimate (US$/m3)
5.15 Bituminous Base (US$/m3)
5.16 Bituminous Base Engineers Estimate (US$/m3)
5.17 Portland Cement Concrete (US$/m3)
5.18 Portland Cement Concrete Engineers Estimate (US$/m3)
5.19 Asphalt Concrete (US$/m3)
5.20 Asphalt Concrete Engineers Estimate (US$/m3)
5.21 Gravel wearing course (US$/m3)
5.22 Gravel wearing course Engineers Estimate (US$/m3)
5.23 Double Surface Treatment(US$/m2)
5.24 Double Surface Treatment Engneers Estimate (US$/m2)
5.25 Single surface treatment (US$/m2)
5.26 Single surface treatment Engineers Estimate (US$/m2)
5.27 Cobble stone for sidewalks
5.28 Patching potholes
6.1 Road Type
6.2 Road Surface (Paved/Unpaved)
6.3 Surface Type
6.4 Base material
6. Type
6.5 Terrain type
7. Activity 7.1 Work type/ Activity

69
ANNEX F: Data on supervision consultancy contracts This Annex is available electronically (as an MS Excel spreadsheet). Data is presented with the following categories:
Classification Group
1.1 Country
1.2 Region
1.3 Project ID
1.4 Project Title
1.5 Contract No. (SAP)
1.6 Contract Title
1.7 Road section
1.8 Year
1. Project Information
1.9 Implementing Agency
2 2007 CPI FACTOR = 1
3.1 Name of supervision consultant
3.2 Nationality of supervision consultant
3.3 Contract signing date
3.4 Consultancy Contract value (US$)
3.5 Amount of variation orders (US$)
3.6 Actual value (US$)
3.7 Procurement method
3.8 Contract No.
3.9 Works Contract Value (If more than 1 lot)
3.10 Works Contract Actual Value (If more than 1 lot)
3. Supervision Consultant
3.11 Total Amount of works supervised


71
ANNEX F: Data on bridge works contracts This Annex is available electronically (as an MS Excel spreadsheet). Data is presented with the following categories:
Country
Contract No
Description
Bridge
Length (m)
Width (m)
Bridge Height (m)
Type of Foundation
Depth of Foundation (m)
Cost of Structures (local)
Estimate cost of structures (US$)
Total Cost (local)
Estimate total cost (US$)
Exchange rate
Total Bridges Cost for a Contract (local)
Estimate of Total Bridges Cost for a Contract (US$)


73
REFERENCES
Paterson, W. D. O., and P. Chaudhuri. 2007. Making Inroads on Corruption in the Transport Sector through Control and Prevention. In “The Many Faces of Corruption: Tracking Vulnerabilities at the Sector Level”, ed. J. Edgardo Campos and Sanjay Pradhan, 159-189. Washington, DC: World Bank. http://imagebank.worldbank.org/servlet/WDSContentServer/IW3P/IB/2007/10/16/000020439_20071016114007/Rendered/PDF/399850REPLACEM101OFFICIAL0USE0ONLY1.pdf U.S. Department of Transportation. Suggestions for the Detection and Prevention of Construction Contract Bid Rigging. The Interdepartmental Bid Rigging Investigations Coordinating Committee, Federal Highway Administration http://www.fhwa.dot.gov/programadmin/contracts/dotjbid.cfm Ware, G. T., S. Moss, J. E. Campos, and G. P. Noone. 2007. Corruption in Public Procurement: A Perennial Challenge. In “The Many Faces of Corruption: Tracking Vulnerabilities at the Sector Level”. Ed. J. Edgardo Campos and Sanjay Pradhan, 295-334. Washington, DC: World Bank. http://imagebank.worldbank.org/servlet/WDSContentServer/IW3P/IB/2007/10/16/000020439_20071016114007/Rendered/PDF/399850REPLACEM101OFFICIAL0USE0ONLY1.pdf World Bank. 2008. Reducing Fiduciary Risk through Increased Transparency and Accountability. A Guidance Note for New Projects in India. Washington, DC __________. 2008. Evidence of Unit Costs of Infrastructure Projects in Sub Saharan Africa. Washington, DC __________. 2008. Project Appraisal Document for Phase 2 of the National Roads Improvement and Management (APL) Program in the Republic of the Philippines. Washington, DC http://imagebank.worldbank.org/servlet/WDSContentServer/IW3P/IB/2008/04/28/000334955_20080428082019/Rendered/PDF/407640PAD0REVI17362B01off0use0only1.pdf __________. 2008. Project Appraisal Document for Orissa State Roads Project in India. Washington, DC. http://wbln1038.worldbank.org/852572430067B82D/DOC_VIEWER?ReadForm&I4_KEY=9EF55438406762FD85256BCE006A1C9A0929B22C44F5A718852570150005946B&I4_UNID=C91FB3B04C8198DA852573E700280259& __________. 2007. Strengthening World Bank Group Engagement on Governance and Anticorruption. Washington, DC http://www.worldbank.org/html/extdr/comments/governancefeedback/gacpaper-03212007.pdf __________.2007.Detailed Implementation Review: India Health Sector 2006-2007. Department of Instructional Integrity. Washington, DC http://siteresources.worldbank.org/EXTDOII/Resources/WB250_Web_Vol1_012408.pdf __________. 2007. Corruption Warning Signs: Is Your Project at Risk? Good Practices in Latin America and the Caribbean. Washington, DC
74 MONITORING ROAD WORKS CONTRACTS AND UNIT COSTS FOR ENHANCED GOVERNANCE IN SUB-SAHARAN AFRICA
___________. 2007. Project Appraisal Document for a Western Indonesia National Roads Improvement Project. Washington, DC http://wbln1037.worldbank.org/852572430067B82D/DOC_VIEWER?ReadForm&I4_KEY=6751DB67383D8B6685256BCF0062F083DB461037EA35481785256ED300059989&I4_UNID=85257332005400F7852573280024272E& ___________. 2006.Guidelines: Procurement under IBRD Loans and IDA Credits, Section II, Para 2.57. Washington, DChttp://web.worldbank.org/WBSITE/EXTERNAL/PROJECTS/PROCUREMENT/0,,contentMDK:20060840~menuPK:93977~pagePK:84269~piPK:60001558~theSitePK:84266,00.html ___________. 2006. Project Appraisal Document for a Road Maintenance Project in Paraguay. Report No: 3642.Washington, DC.http://imagebank.worldbank.org/servlet/WDSContentServer/IW3P/IB/2006/08/08/000090341_20060808104830/Rendered/PDF/36421.pdf ___________. 2006. Guidelines: Procurement under IBRD Loans and IDA Credits, Washington,DC http://web.worldbank.org/WBSITE/EXTERNAL/PROJECTS/PROCUREMENT/0,,contentMDK:20060840~menuPK:93977~pagePK:84269~piPK:60001558~theSitePK:84266,00.html ___________Road Costs Knowledge System (ROCKS) Website. Washington, DC http://intranet.worldbank.org/WBSITE/INTRANET/SECTORS/INTTRANSPORT/INTROADSHIGHWAYS/0,,contentMDK:20485235~isCURL:Y~menuPK:1096864~pagePK:210082~piPK:210098~theSitePK:338994,00.html ___________.Worldwide Governance Indicators Website. Washington, DC http://info.worldbank.org/governance/wgi2007/