Embed Size (px)
Citation preview
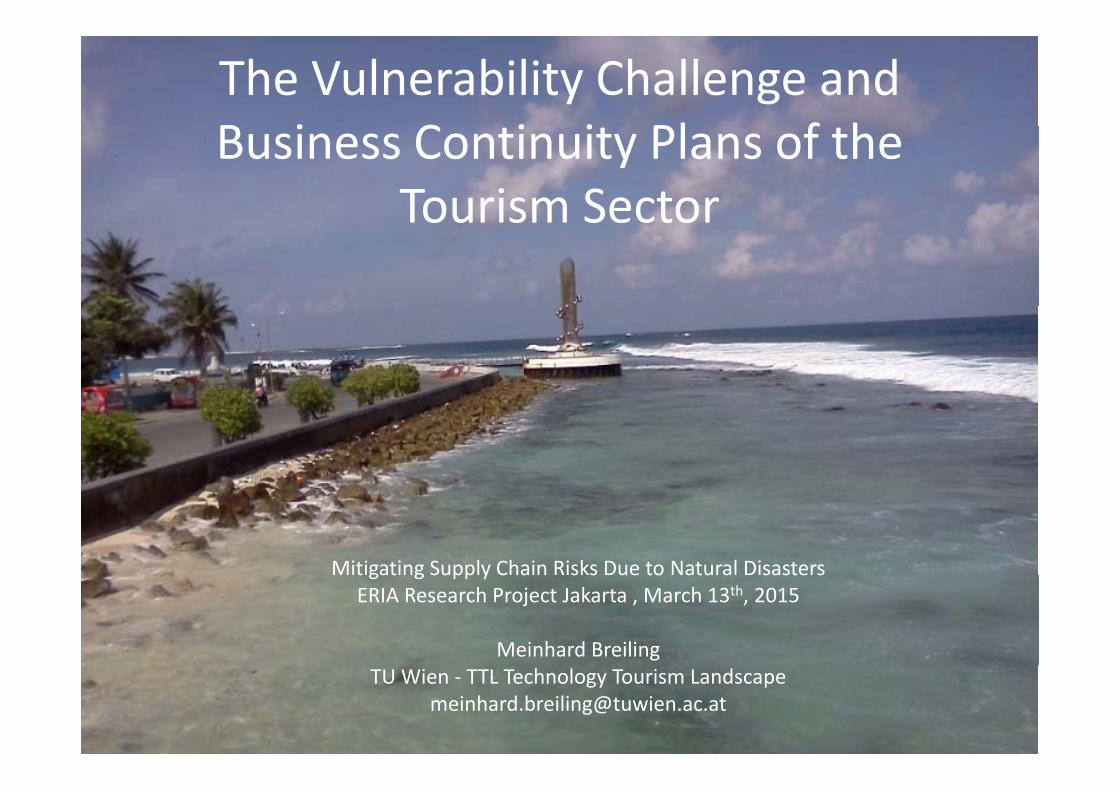
The Vulnerability Challenge and B i C i i Pl f hBusiness Continuity Plans of the
Tourism SectorTourism Sector
Mitigating Supply Chain Risks Due to Natural Disasterst gat g Supp y C a s s ue to atu a saste sERIA Research Project Jakarta , March 13th, 2015
Meinhard BreilingTU Wien ‐ TTL Technology Tourism Landscape

International Tourist Arrivals Worldwide in Million Arrivals 1950 to 2014
1 600
1.400
1.600
1.000
1.200
600
800
200
400
0
200
1950
1955
1960
1965
1970
1971
1972
1973
1974
1975
1976
1977
1978
1979
1980
1981
1982
1983
1984
1985
1986
1987
1988
1989
1990
1991
1992
1993
1994
1995
1996
1997
1998
1999
2000
2001
2002
2003
2004
2005
2006
2007
2008
2009
2010
2011
2012
2013
2014
*2
UNWTO World Tourism Barometer , January 2015

Trends in International Tourist Arrivals in Millions According to World Regions
800
700,
800,• Estimated 5% of global GDP earned in tourism
500,
600,
300,
400, 2010
2013
2030*
200,
300,
0,
100,
Europe Asia Pacific America Africa Near EastRegion
Source: UNWTO, March 2014

International Arrivals in Outbound Tourism in Million Originating from Region
500,
600,
400,
Africa
300,
Africa
Europe
Near East
Asia Pacific
A i
100
200,America
0,
100,
1990 1995 2000 2005 2008 2009 2010 2011 2012 2013

Tourism Expenditures of Major Countries in Billion US$
120
140
• In average over
80
100
In average over US$ 1000 per tourist trip
60
80
2011
2012
tourist trip• Appr. US$ 180 per tourist
20
40 2013*per tourist day/night
0
Source: UNWTO, May 2014

Most Important Countries with International Tourism Arrivals in Million
80,
90,
60,
70,
40,
50,2011
2012
2013*
20,
30,
0,
10,
France USA Spain China Italy Turkey Germany Great Britain
Russia Thailand

International Tourist Arrivals of Asian RegionsInternational Tourist Arrivals of Asian Regions
120,
140,
100,
60,
80,Northeast Asia
Southeast Asia
Oceania
South Asia
40,
0,
20,
2011 2012 2013 2014*
Source: UNWTO, January 2015
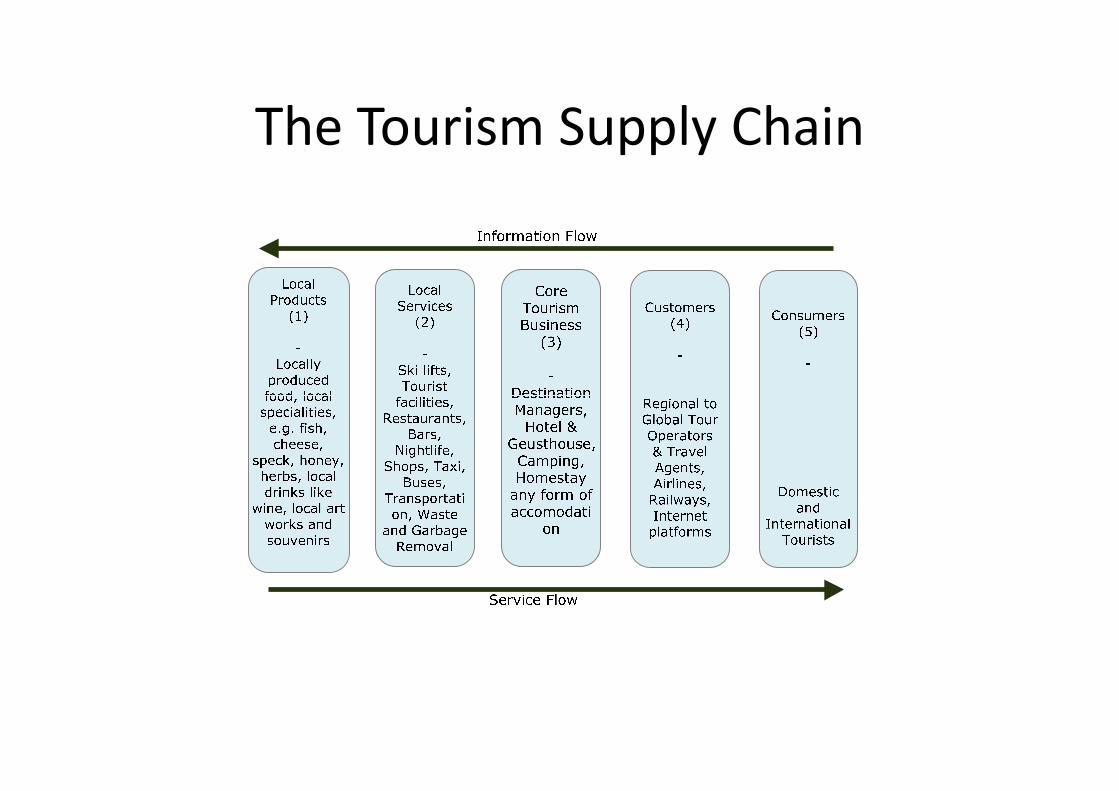
The Tourism Supply ChainThe Tourism Supply Chain

AimsAims• Old: Improvement of information and service• Old: Improvement of information and serviceflow between:
all involved partners related to– all involved partners, related to• supply chain structure, • business processesbusiness processes• management components
• New: Include Disaster and Climate Resilience inNew: Include Disaster and Climate Resilience in Toursim Supply Chain– Through increasing resilience of tourist destinationsThrough increasing resilience of tourist destinations
• Regional programs• Risk financing mechanism

Top five disruption triggers for tourism industry

Natural disastersNatural disasters
• The emphasis on natural disasters and extreme weather is a consequence of events such as the – Floods– Cyclonesy– Drought– Extreme Precipitation– Extreme Precipitation– Snow related risks in case of mountain tourism
• Too much snow avalanches• Too much snow, avalanches• No snow in case of snow based activities
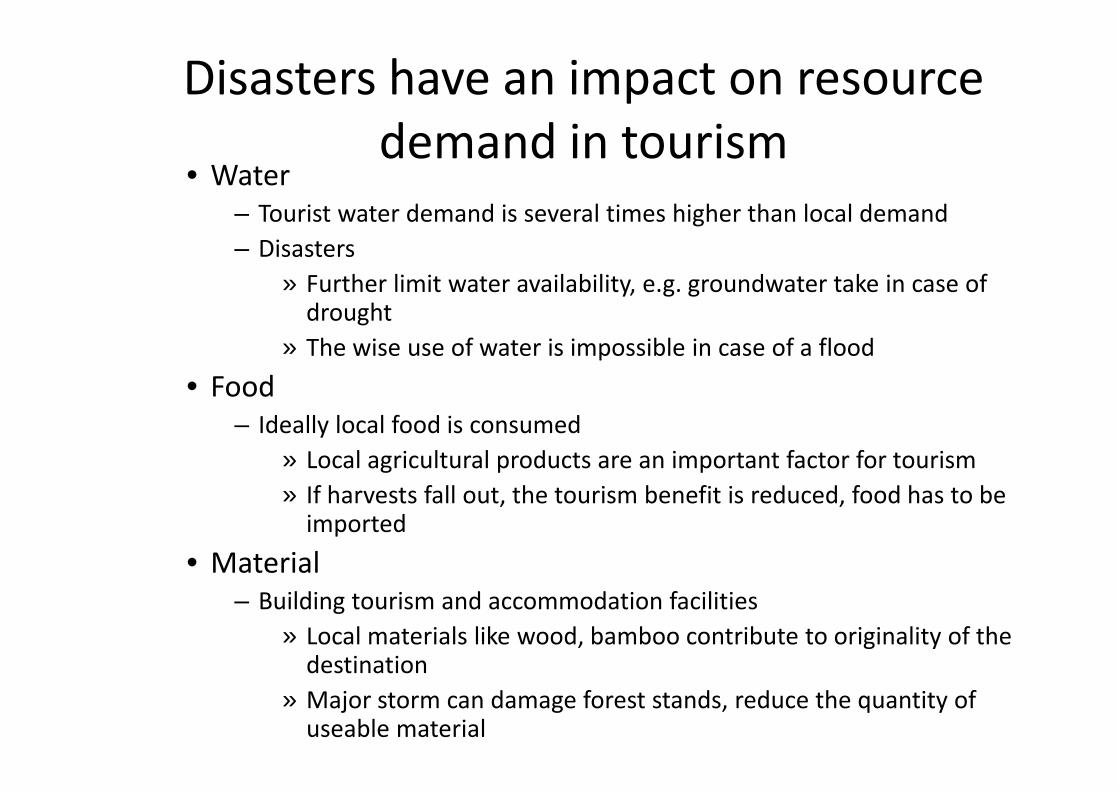
Disasters have an impact on resourced d i idemand in tourism
• Water– Tourist water demand is several times higher than local demandTourist water demand is several times higher than local demand– Disasters
» Further limit water availability, e.g. groundwater take in case of d htdrought
» The wise use of water is impossible in case of a flood• FoodFood
– Ideally local food is consumed» Local agricultural products are an important factor for tourism
f h f ll h b f d d f d h b» If harvests fall out, the tourism benefit is reduced, food has to be imported
• Material– Building tourism and accommodation facilities
» Local materials like wood, bamboo contribute to originality of the destinationdestination
» Major storm can damage forest stands, reduce the quantity of useable material
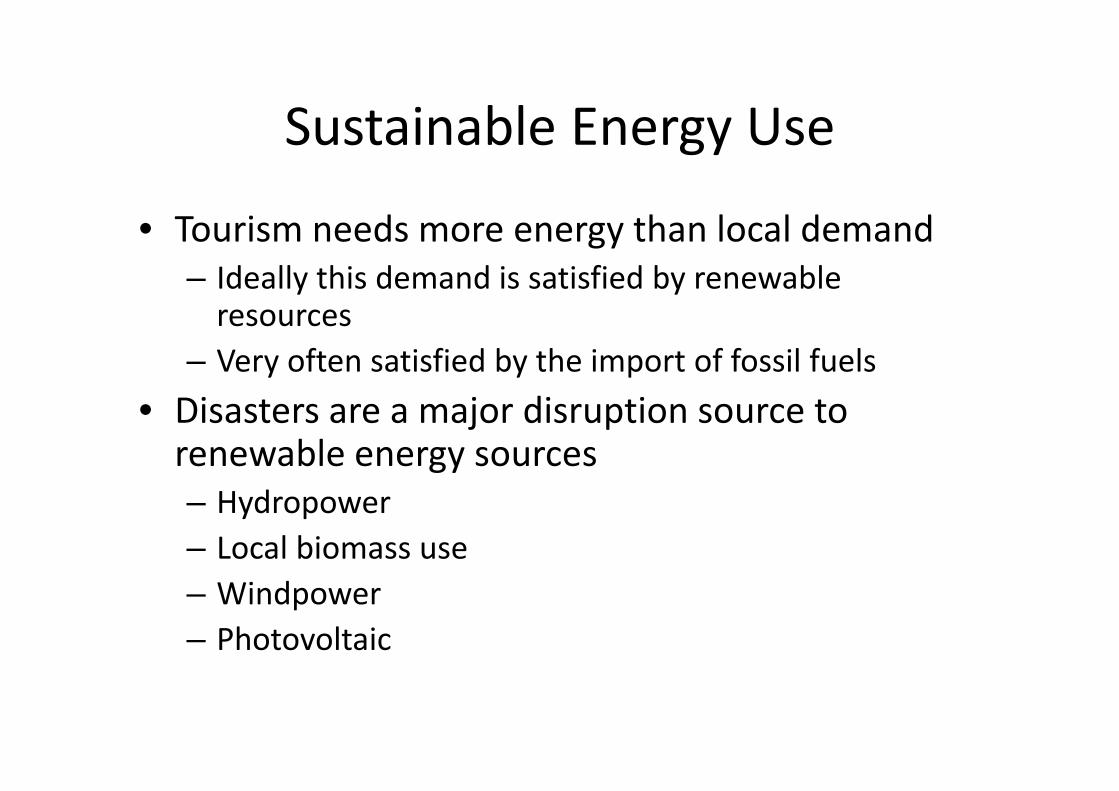
Sustainable Energy UseSustainable Energy Use
i d h l l d d• Tourism needs more energy than local demand– Ideally this demand is satisfied by renewable resources
– Very often satisfied by the import of fossil fuels• Disasters are a major disruption source to renewable energy sources– Hydropower– Local biomass use– Windpower– Photovoltaic

Seasonality in TourismSeasonality in Tourism– Seasonality of tourismSeasonality of tourism
• Peaks are common in tourism• In many countries distinction between summer tourism yand winter tourism (May to October and November to April)
fl f ld b d bl• Continuos flow of tourist would be more desireable– Disasters are an additional burden
• In high peak season the damage is over proportional• A few days or one week loss can take the profit of a whole seasonwhole season
• A regular return of disasters like anticipated in climate change scenarios can ruin destinations if the peak g pseason is affected

Otimizing disaster relief within and outside destination

Theoretical framework of Tourism Supply Chain Management after Zhang et al. 2008 (1) modified
• Objectives– Tourism satisfaction– Tourism sustainability
Monetar al e– Monetary value– Reduce demand uncertainty– Tourist safety– Protection from disasters
• Network structure– Describe key Tourism Supply Chain members
• Include climate and climate risk information members– Analyze the market structure
• Disaster protection measures provide comparative advantagein competitive market
– Figure out the power relationship– Identify what business processes are linked to what TSC
membersmembers
• Management issues– Demand management– Two party relation
l– Supply management– Inventory management
• Outline vulnerabilities within destination– Product development– TSC coordination– Information technology
• Include climate and climate risk information
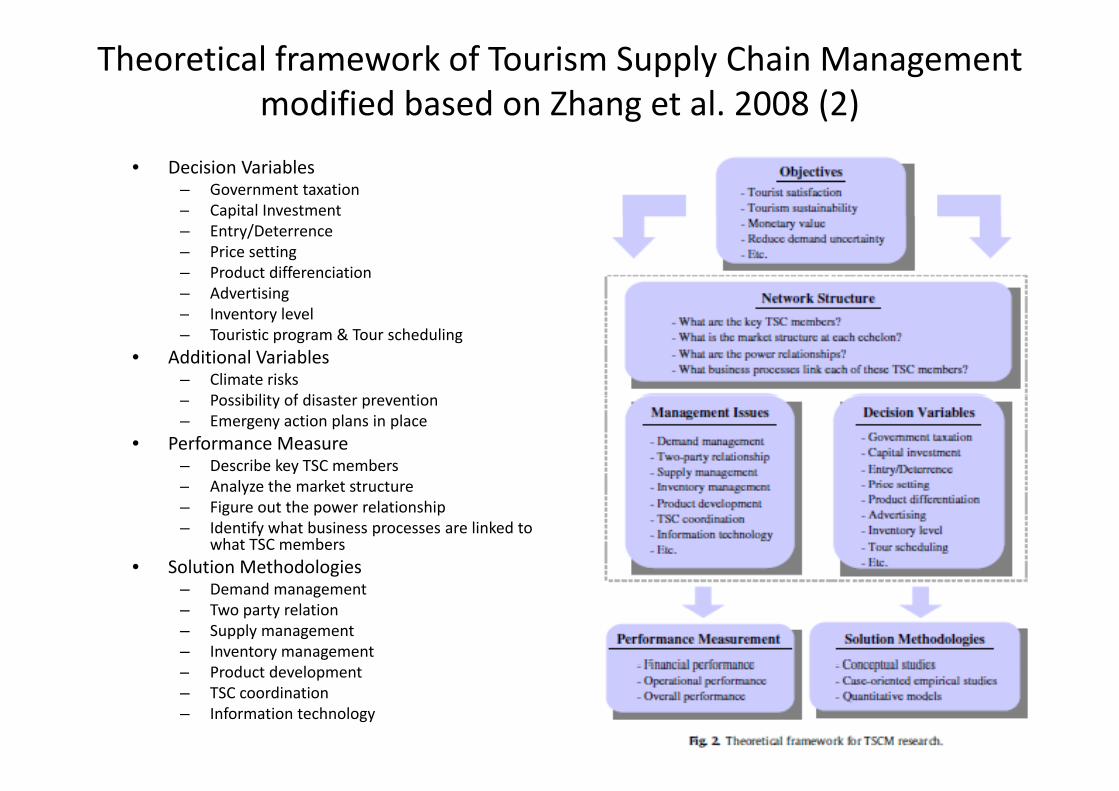
Theoretical framework of Tourism Supply Chain Management modified based on Zhang et al. 2008 (2)
• Decision Variables– Government taxation– Capital Investmentp– Entry/Deterrence– Price setting– Product differenciation– Advertising– Inventory level– Touristic program & Tour scheduling
• Additional Variables– Climate risks
P ibilit f di t ti– Possibility of disaster prevention– Emergeny action plans in place
• Performance Measure– Describe key TSC members
Analyze the market structure– Analyze the market structure– Figure out the power relationship– Identify what business processes are linked to
what TSC members• Solution Methodologiesg
– Demand management– Two party relation– Supply management– Inventory management– Product development– TSC coordination– Information technology

Example from European Tourism Indicator System: Toolkit for sustainable destination (2013)sustainable destination (2013)
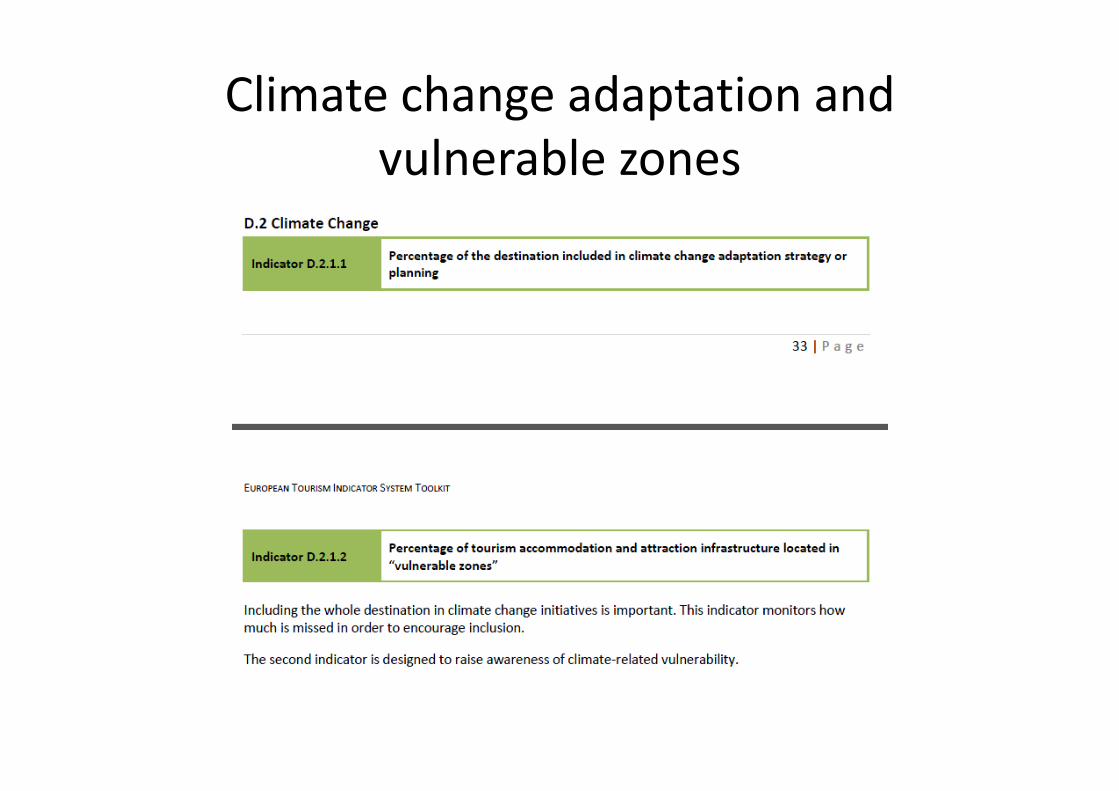
Climate change adaptation and vulnerable zones
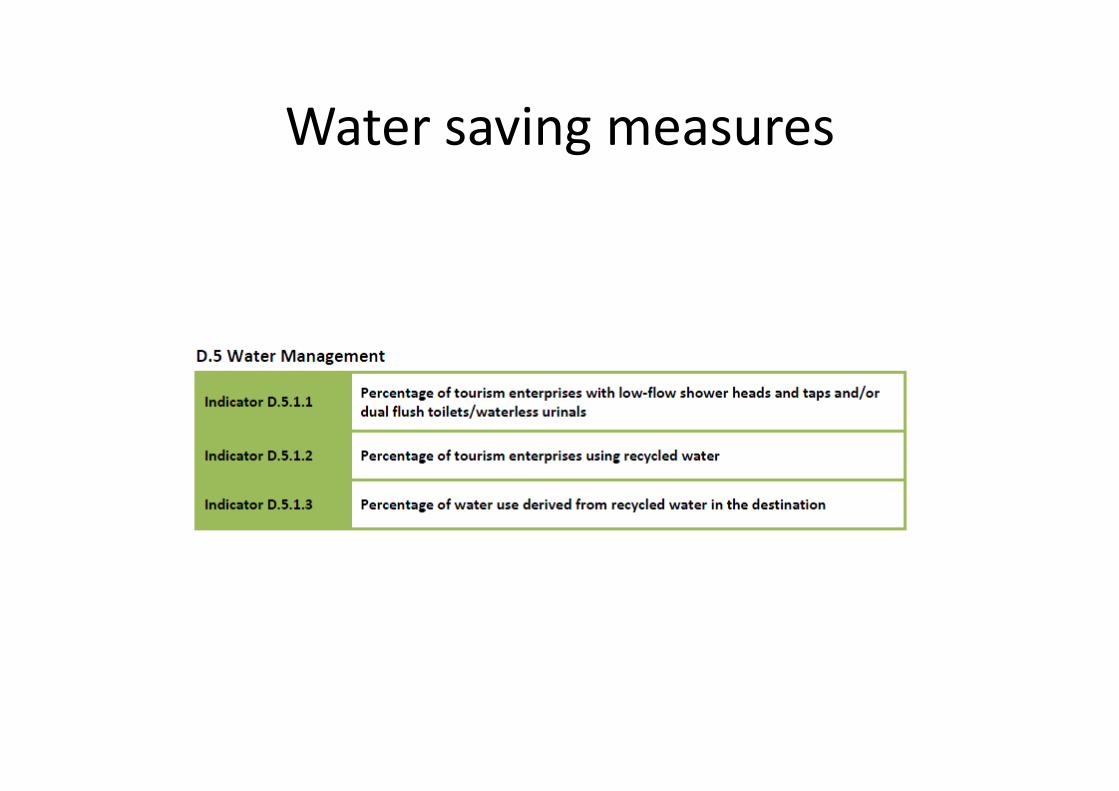
Water saving measuresWater saving measures
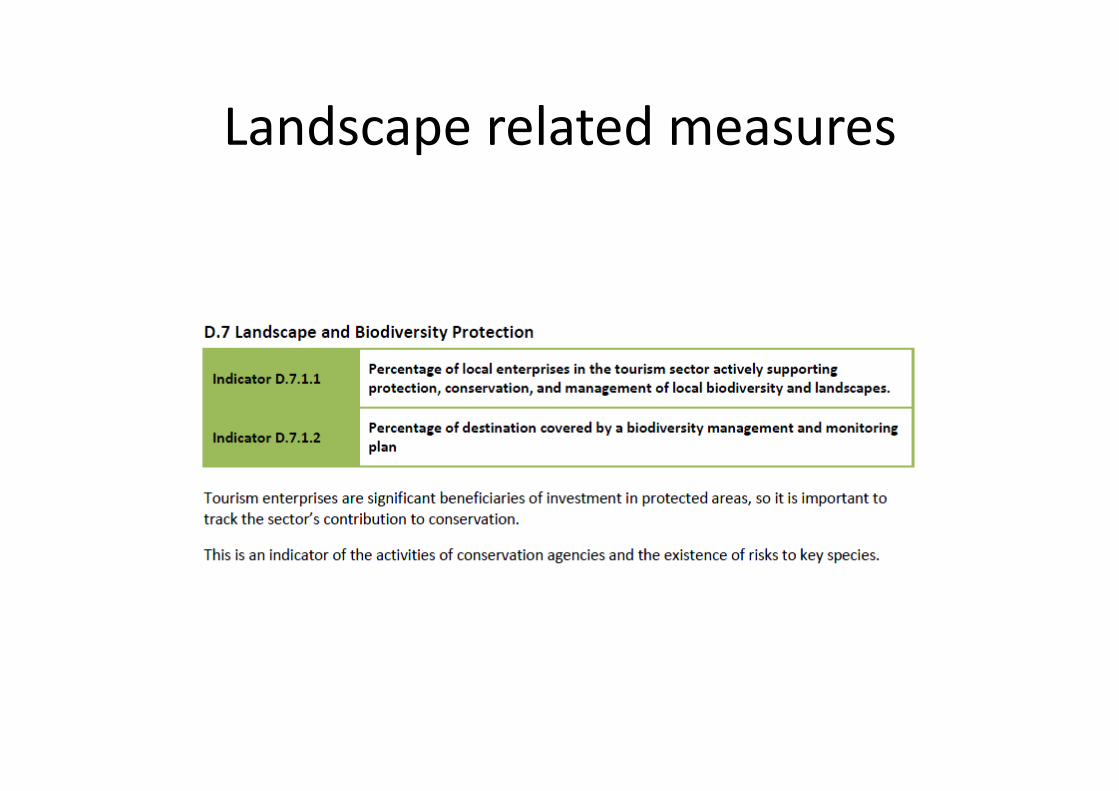
Landscape related measuresLandscape related measures

Example 1: Small island developing states (SIDS)(SIDS)
• Very high to exclusive dependence on tourism– In general over 25% of GDP earned in tourismIn general over 25% of GDP earned in tourism– With multipliers, almost everything is earned in tourism
• Climate risk resilience– mainly coastal destinations– Sea level rise
• Resilience to impacts decreases• Vulnerability increases• Vulnerability increases
– Possible increase in natural disasters• Cyclones• Floods
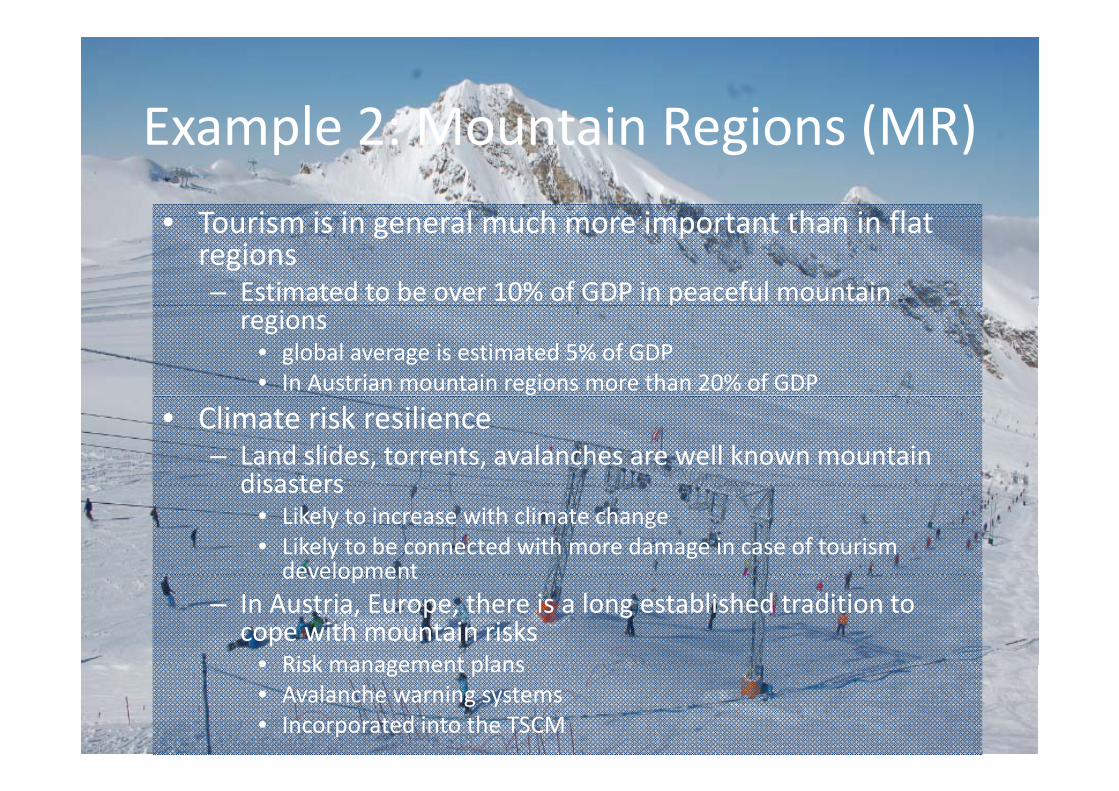
Example 2: Mountain Regions (MR)Example 2: Mountain Regions (MR)T i i i l h i t t th i fl t• Tourism is in general much more important than in flat regions– Estimated to be over 10% of GDP in peaceful mountain p
regions• global average is estimated 5% of GDP• In Austrian mountain regions more than 20% of GDP
• Climate risk resilience– Land slides, torrents, avalanches are well known mountain
disastersdisasters• Likely to increase with climate change• Likely to be connected with more damage in case of tourism developmentdevelopment
– In Austria, Europe, there is a long established tradition to cope with mountain risks
• Risk management plans• Risk management plans• Avalanche warning systems• Incorporated into the TSCM
RecommandationRecommandation
T t t ith t A i t di• To start with one or two Asian case studiesrelated to SCM in the tourism sector
• To analyze all relationships business cases and• To analyze all relationships, business cases andmanagement factors in the TSC
• To make inventories related to climate risk and• To make inventories related to climate risk anddisasters
• Develop a handbook of specific• Develop a handbook of specificrecommandations for firms in coastal andmountain tourist destinations.
• The involved firms develop a business continuityplan for their tourist destinationp