Embed Size (px)
Citation preview
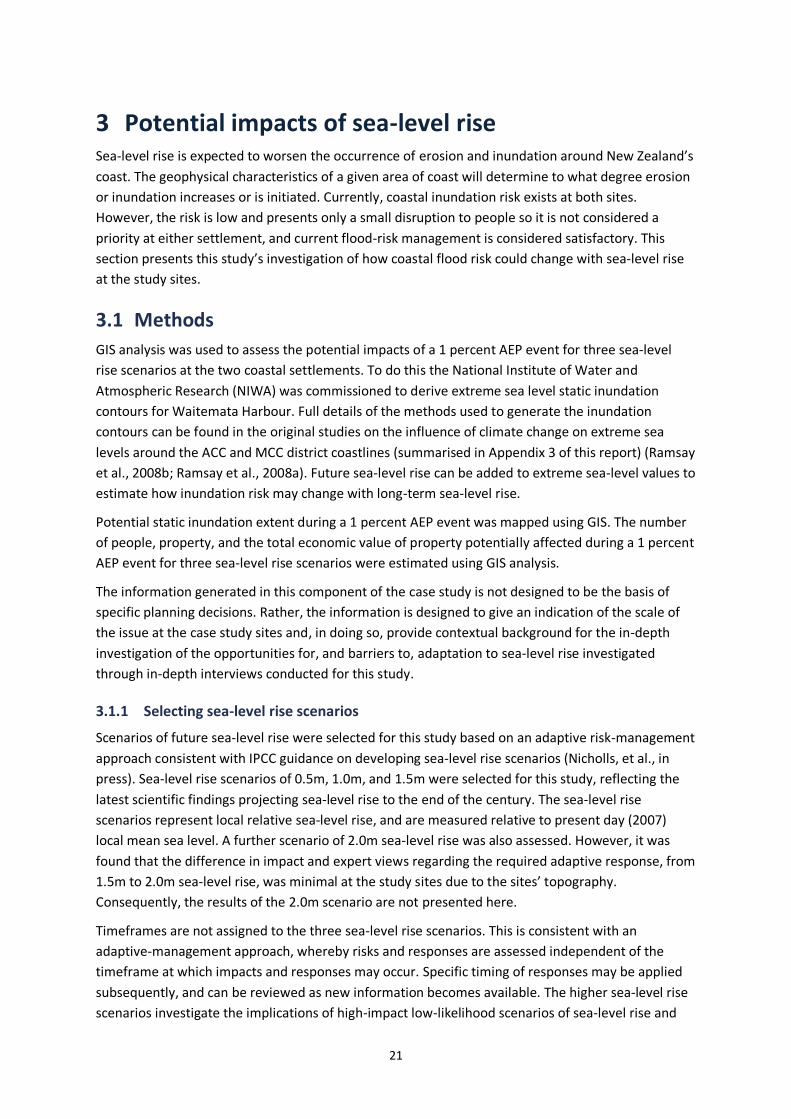
Vulnerability and adaptation to sea-level rise in Auckland, New Zealand
NZCCRI 2011 report 08
October 2011
The New Zealand Climate Change Research Institute Victoria University of Wellington
Georgina Hart
ii
The New Zealand Climate Change Research Institute School of Geography, Environment and Earth Sciences Victoria University of Wellington PO Box 600 Wellington New Zealand Contact: Liz Thomas Phone: (04) 463 5507 Email: [email protected]
Acknowledgements
This research was funded by the Foundation for Research, Science and Technology under contract
VICX0805 Community Vulnerability and Resilience. The research was conducted as a Masters of
Environmental Studies supervised by Associate Professor Ralph Chapman of the School of
Geography, Environment and Earth Sciences at Victoria University of Wellington, and Dr Andy
Reisinger at the New Zealand Climate Change Research Institute, Victoria University of Wellington
(CCRI) now at the New Zealand Agricultural Greenhouse Gas Research Centre. Ongoing support and
review was provided by Judy Lawrence, Adjunct Research Associate (CCRI). Simon Tegg and
Dorothee Quade, research assistants at CCRI, contributed to this document. Professor Martin
Manning (CCRI), as research programme leader, provided invaluable support and reviewed the draft
of this report along with Ann Magee (previously Auckland Regional Council) for which the researcher
is very grateful. Inundation modelling was conducted by Doug Ramsay, Rob Bell, and colleagues at
the National Institute of Water and Atmospheric Research (NIWA), and initial GIS analysis was
conducted by Scott Schimmel (Victoria University of Wellington) Auckland Regional Council.
Auckland and Manukau city councils provided ongoing input and support, including GIS data and
data licences for inundation modelling. The researcher would also like to sincerely thank the
interview participants whose input was crucial to this research.
Contract: E1307
Vulnerability, Resilience, and Adaptation Objective 2 reports, October 2011
NZCCRI-2011-01 Synthesis: Community vulnerability, resilience and adaptation to climate change in New Zealand
NZCCRI-2011-02 Vulnerability and adaptation to increased flood risk with climate change—Hutt Valley summary (Case study: Flooding)
NZCCRI-2011-03 The potential effects of climate change on flood frequency in the Hutt River (SGEES client report)
(Case study: Flooding)
NZCCRI-2011-04 Potential flooding and inundation on the Hutt River (SGEES client report) (Case study: Flooding)
NZCCRI-2011-05 RiskScape: Flood-fragility methodology (NIWA client report) (Case study: Flooding)
NZCCRI-2011-06 Vulnerability and adaptation to increased flood risk with climate change—Hutt Valley household survey (Case study: Flooding)
NZCCRI-2011-07 Perspectives on flood-risk management under climate change—implications for local government decision making (Case study: Flooding)
NZCCRI-2011-08 Vulnerability and adaptation to sea-level rise in Auckland, New Zealand (Case study: Sea-level rise)
NZCCRI-2011-09 Climate resilient water management in Wellington, New Zealand (Case study: Water security)
All reports available on the NZCCRI website: http://www.victoria.ac.nz/climate-change/reports
iii
Contents
Executive summary .......................................................................................................................................... 1
Research purpose......................................................................................................................................... 1
Research questions ...................................................................................................................................... 1
Research findings ......................................................................................................................................... 1
1 Introduction ............................................................................................................................................. 3
1.1 Research purpose ............................................................................................................................ 3
1.2 Research questions .......................................................................................................................... 3
1.3 Research methodology .................................................................................................................... 3
1.4 Research framework ........................................................................................................................ 4
2 Case study background ............................................................................................................................ 9
2.1 Sea-level rise and adaptation options ............................................................................................... 9
2.2 Legislative context ......................................................................................................................... 12
2.3 The study sites ............................................................................................................................... 13
3 Potential impacts of sea-level rise .......................................................................................................... 21
3.1 Methods ........................................................................................................................................ 21
3.2 Changing 1 percent AEP levels and inundation mapping ................................................................. 22
3.3 Results: Potential socioeconomic impacts ...................................................................................... 26
4 Adaptation opportunities and barriers ................................................................................................... 29
4.1 Coastal-hazards management: The current approach ..................................................................... 29
4.2 Preparing for sea-level rise............................................................................................................. 34
4.3 Adaptation response options at the study sites .............................................................................. 42
5 Conclusion ............................................................................................................................................. 47
6 References ............................................................................................................................................. 53
7 Appendices ............................................................................................................................................ 57
Appendix 1: Sea-level rise response options ............................................................................................... 57
Appendix 2: Managed retreat implementation options ............................................................................... 59
Appendix 3: Summary of NIWA extreme sea levels methods and results ..................................................... 61
Appendix 4: Interview schedule .................................................................................................................. 63
Appendix 5: Interview participants ............................................................................................................. 67
iv
List of tables and figures Table 1. Typology of adaptation actions, modified from Smit & Wandel (2006). ........................................ 5
Table 2. Recent scientific projections of sea-level rise by 2100, adapted from The Royal Society (2010) ... 11
Table 3. Predicted water levels above Auckland Vertical Datum (AVD-46) for AEP of 50%, 10%, 2%, and 1%, for Waitemata Harbour, for the present day and with local relative sea-level rise of 0.5m, 1.0m, and 1.5m relative to present day mean sea level (2007 MSL). ........ 23
Table 4. The number of people and percentage of census area population potentially affected during a 1% AEP event for the present day and three sea-level rise scenarios. ...................................... 27
Table 5. Summary of key findings of this study. ....................................................................................... 48
Table 6. Predicted storm tidewater levels in metres above Auckland mean sea level datum (AVD-46) at the Auckland Ports Ltd. gauge site and their approximate AEP (% and approximate ARI) for the present day and for local relative mean sea-level rise of 0.5, 1.0, and 1.5m relative to present day (2007 MSL). ........................................................................................................ 62
Figure 1. Vulnerability and its components (Allen Consulting, 2005) ........................................................... 4
Figure 2. Map showing the case study locations within the Auckland Region. The map also shows the former district and regional council boundaries. The inset map shows Auckland region within the North Island of New Zealand
( Auckland Council, reprinted with permission). ...................................................................... 14
Figure 3. Satellite image of the Eastern Bays area, Mission Bay (left) and Kohimarama (right) are circled (Source: Google Earth, 2010)..................................................................................... 15
Figure 4. Looking east along Kohimarama beach at mid-tide, 2010. ( 2010 Georgina Hart) ..................... 16
Figure 5. Looking east along Kohimarama Beach during the storm of January 23 2011
( 2011 Benjamin Eitelberg. Reprinted with permission) ........................................................... 17
Figure 6. Satellite image of Kawakawa Bay (Source: Google Earth, 2010) .................................................. 18
Figure 7. Change to extreme tide levels and potential static inundation for a 1% AEP event with sea-level rise of 0.5m, 1.0m, and 1.5m (lower bound), at Mission Bay / Kohimarama. ......... 24
Figure 8. Change to extreme tide levels and potential static inundation for a 1% AEP event with sea-level rise of 0.5m, 1.0m, and 1.5m (lower bound), at Kawakawa Bay. ........................... 25
Figure 9. Number of properties potentially affected by coastal inundation during a 1% AEP water level event, for present day local mean sea level and for local relative sea-level rise of 0.5m, 1.0m, 1.5m, and 2.0m sea-level rise (lower bound) at Mission Bay / Kohimarama and Kawakawa Bay. .......................................................................................................................... 28
Figure 10. Total economic value of properties potentially affected by coastal inundation during a 1% AEP water level event, for the present day local mean sea level and for local relative sea-level rise of 0.5m, 1.0m, and 1.5m (lower bound) at Mission Bay / Kohimarama and Kawakawa Bay. ................................................................................................................... 28
Figure 11. 1% AEP event static inundation contour for 0.5, 1.0, 1.5, and 2.0m sea-level rise at Mission Bay / Kohimarama. ........................................................................................................................... 65
Figure 12. 1% AEP event static inundation contours for 0.5, 1.0, 1.5, and 2.0m sea-level rise at Kawakawa Bay. ........................................................................................................................................... 66
v
List of acronyms ACC Auckland City Council
AEP Annual exceedance probability
ARC Auckland Regional Council
ARI Average return interval
CMA Coastal management area
EQS Engineering quality standards
GCM Global climate models
GIS Geographic information system
GNS Geological and Nuclear Sciences
ICZM Integrated coastal zone management
IPCC Intergovernmental Panel on Climate Change
MCC Manukau City Council
MfE Ministry for the Environment
NES National environmental standard
NIWA National Institute of Water and Atmospheric Research
NPS National policy statement
NZCPS New Zealand Coastal Policy Statement
RMA Resource Management Act 1991
RPS Regional policy statement

1
Executive summary
Research purpose
This report sets out the findings of an Auckland-based case study investigating vulnerability and
adaptation to sea-level rise at existing residential settlements. This case study focused on two
coastal settlements, Mission Bay / Kohimarama, and Kawakawa Bay, both part of New Zealand’s
largest city—Auckland. A case study methodology was applied to conduct an in-depth investigation
of the issues related to planning for long-term sea-level rise and coastal-hazards management at the
study sites, and more generally for existing development in the Auckland region.
The study aimed to investigate:
how Auckland may be affected by changing coastal conditions as sea level rises
adaptation options for responding to sea-level rise and barriers to their implementation
the potential that different management options have for reducing vulnerability and increasing resilience of existing coastal settlements.
Research questions
The study was structured around answering the following four research questions:
1. What effect will sea-level rise have on extreme sea levels at the study sites, and how will the impacts related to a 1 percent annual exceedence probability (AEP)1 event vary for a range of sea-level rise scenarios change (in the absence of adaptation)?
2. How are coastal hazards and projected sea-level rise managed in Auckland and at the study sites?
3. What adaptation opportunities and barriers exist at the two study sites?
4. Could managed retreat be implemented at either of the study sites? What are the particular issues for, and barriers to, implementing managed retreat?
Research findings
Participating councils are in the early stages of planning for future sea level rise
This study found that current coastal management at the participating councils was in the early
stages of considering sea-level rise effects, and that in most instances the use of adjusted flood-
mitigation measures (e.g. minimum site levels) was considered adequate for protecting private
property against hazard risk. However, guidance information generated by participating councils has
not taken into account the potential for high rates of sea-level rise by 2100. Recent internationally
published projections (e.g. Pfeffer, et al., 2008; Rahmstorf, 2007) indicate that the rate of sea-level
rise could increase dramatically in the second half of the twenty-first century. This means that if
1 AEP is the probability that a given water level will be exceeded within a 1-year time period, and is usually expressed as either a fraction or a percentage. An alternative way of describing flood risk is in terms of average return intervals (ARI).
2
proactive responses are delayed, responses could be required much more rapidly in the future,
which could have significant structural and economic implications for future generations.
Coastal-hazards risk will increase at Mission Bay / Kohimarama and Kawakawa Bay and adaptation will be required
Mission Bay / Kohimarama and Kawakawa Bay, Auckland will experience increasing coastal-hazard
risk as the numbers of people and property potentially affected by storm events increases as sea
level rises. Findings from the present study suggest that existing settlements in the Auckland region
may already be ‘locked in’ to a coastal adaptation approach focused on maintaining the current
coastline through coastal stabilisation. This approach will decrease community resilience and
increase vulnerability in the long term, even if it is found to be a successful short-term response.
Retreat offers an alternative approach that is strongly aligned with reducing community vulnerability
and increasing resilience. However, strong opposition from communities to any retreat approach is
expected. Developing trusted climate science information, education around coastal hazard risk, and
participatory community-led decision making were identified as central enablers for a retreat
approach to be included as a viable coastal-adaptation option for communities in the Auckland
region.
3
1 Introduction
1.1 Research purpose
This report sets out the findings of an Auckland-based case study investigating vulnerability and
adaptation to sea-level rise at existing residential settlements. This project has been conducted
simultaneously as master’s thesis research and as one of three case studies that form Objective 2 of
the collaborative, interdisciplinary research project on Community Vulnerability, Resilience and
Adaptation to the impacts of climate change. The project is led by Victoria University and funded by
the Foundation for Research, Science and Technology (FRST)2. The aim of the project was to develop
a ‘New Zealand specific framework for the comprehensive identification of community vulnerability,
and options for increasing resilience’ (CCRI, 2008, p. 3).
This case study focused on two coastal settlements, Mission Bay / Kohimarama, and Kawakawa Bay,
both part of New Zealand’s largest city—Auckland. A case study methodology was applied to
conduct an in-depth investigation of the issues related to planning for long-term sea-level rise and
coastal-hazards management at the study sites, and more generally for existing development in the
Auckland region.
The study aimed to investigate:
how Auckland may be affected by changing coastal conditions as sea level rises
adaptation options for responding to sea-level rise and barriers to their implementation
the potential that different management options have for reducing vulnerability and increasing resilience of existing coastal settlements.
1.2 Research questions
The study was structured around answering the following four research questions:
1. What effect will sea-level rise have on extreme sea levels at the study sites, and how will the impacts related to a 1 percent annual exceedence probability (AEP) event vary for a range of sea-level rise scenarios change (in the absence of adaptation)?
2. How are coastal hazards and projected sea-level rise managed in Auckland and at the study sites?
3. What adaptation opportunities and barriers exist at the two study sites?
4. Could managed retreat be implemented at either of the study sites? What are the particular issues for, and barriers to, implementing managed retreat?
1.3 Research methodology
To address the research questions, potential inundation during a 1 percent AEP event was mapped
at the study sites and potential socio-economic impacts were assessed using geographic information
system (GIS) analysis. A series of in-depth interviews were conducted using this information about
changing risk. Impacts and adaptation response information were used in the interviews to discuss
2 FRST was merged in February 2011 with the Ministry of Research, Science and Technology (MoRST) to form the Ministry of Science and Innovation (MSI), which is responsible for the policy and investment functions of both those agencies.
4
experiences of sea-level rise response to date and views regarding options for the future. Qualitative
thematic analysis of the interview transcripts was undertaken to describe the current approach,
issues, and barriers to coastal-hazards management and sea-level rise response; and the views of
interview participants to various sea-level rise response options at the two study sites.
1.4 Research framework
1.4.1 Vulnerability
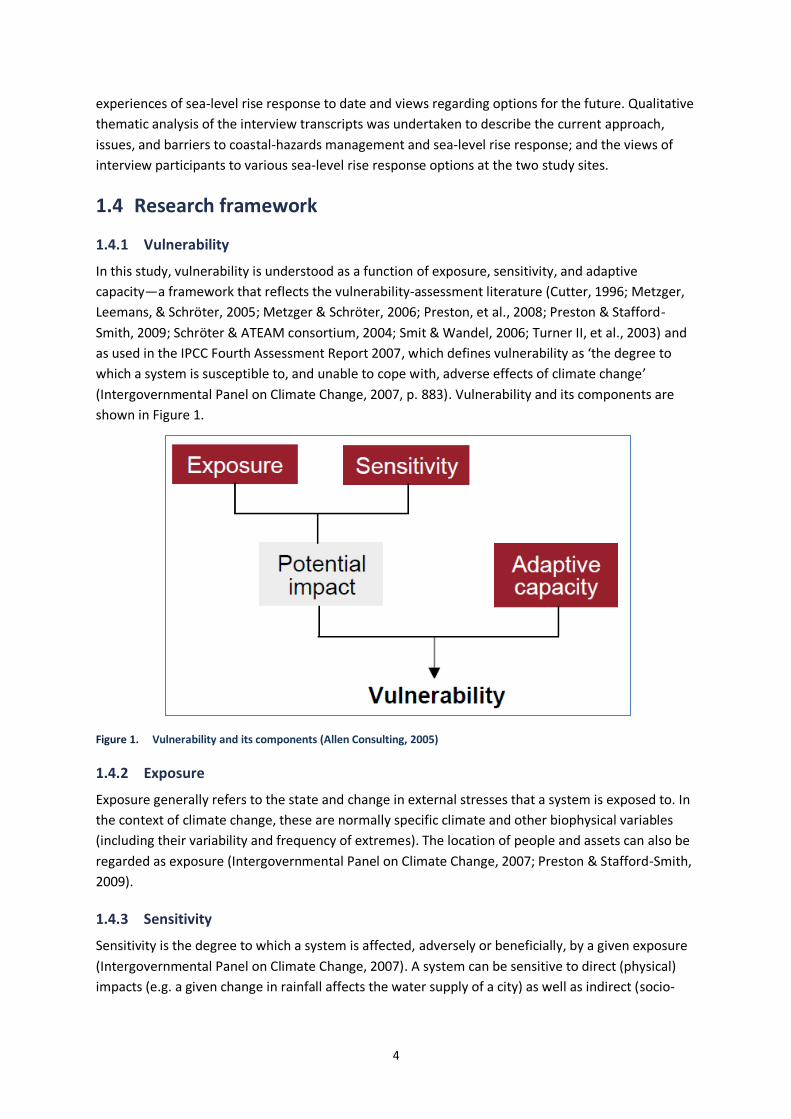
In this study, vulnerability is understood as a function of exposure, sensitivity, and adaptive
capacity—a framework that reflects the vulnerability-assessment literature (Cutter, 1996; Metzger,
Leemans, & Schröter, 2005; Metzger & Schröter, 2006; Preston, et al., 2008; Preston & Stafford-
Smith, 2009; Schröter & ATEAM consortium, 2004; Smit & Wandel, 2006; Turner II, et al., 2003) and
as used in the IPCC Fourth Assessment Report 2007, which defines vulnerability as ‘the degree to
which a system is susceptible to, and unable to cope with, adverse effects of climate change’
(Intergovernmental Panel on Climate Change, 2007, p. 883). Vulnerability and its components are
shown in Figure 1.
Figure 1. Vulnerability and its components (Allen Consulting, 2005)
1.4.2 Exposure
Exposure generally refers to the state and change in external stresses that a system is exposed to. In
the context of climate change, these are normally specific climate and other biophysical variables
(including their variability and frequency of extremes). The location of people and assets can also be
regarded as exposure (Intergovernmental Panel on Climate Change, 2007; Preston & Stafford-Smith,
2009).
1.4.3 Sensitivity
Sensitivity is the degree to which a system is affected, adversely or beneficially, by a given exposure
(Intergovernmental Panel on Climate Change, 2007). A system can be sensitive to direct (physical)
impacts (e.g. a given change in rainfall affects the water supply of a city) as well as indirect (socio-
5
economic) impacts (e.g. age structure of a population influences the degree to which mortality
increases during a heatwave).
1.4.4 Adaptation
Adaptation is change made by a given system in response to expected and / or experienced
exposure and sensitivity to climatic stimuli, and is defined as the ‘adjustment in natural or human
systems in response to actual or expected climatic stimuli or their effects, which moderates harm or
exploits beneficial opportunities’ (IPCC, 2007a, p. 27). Adaptation can be autonomous or planned. It
can be implemented in anticipation of future events, concurrently as events occur, or reactively after
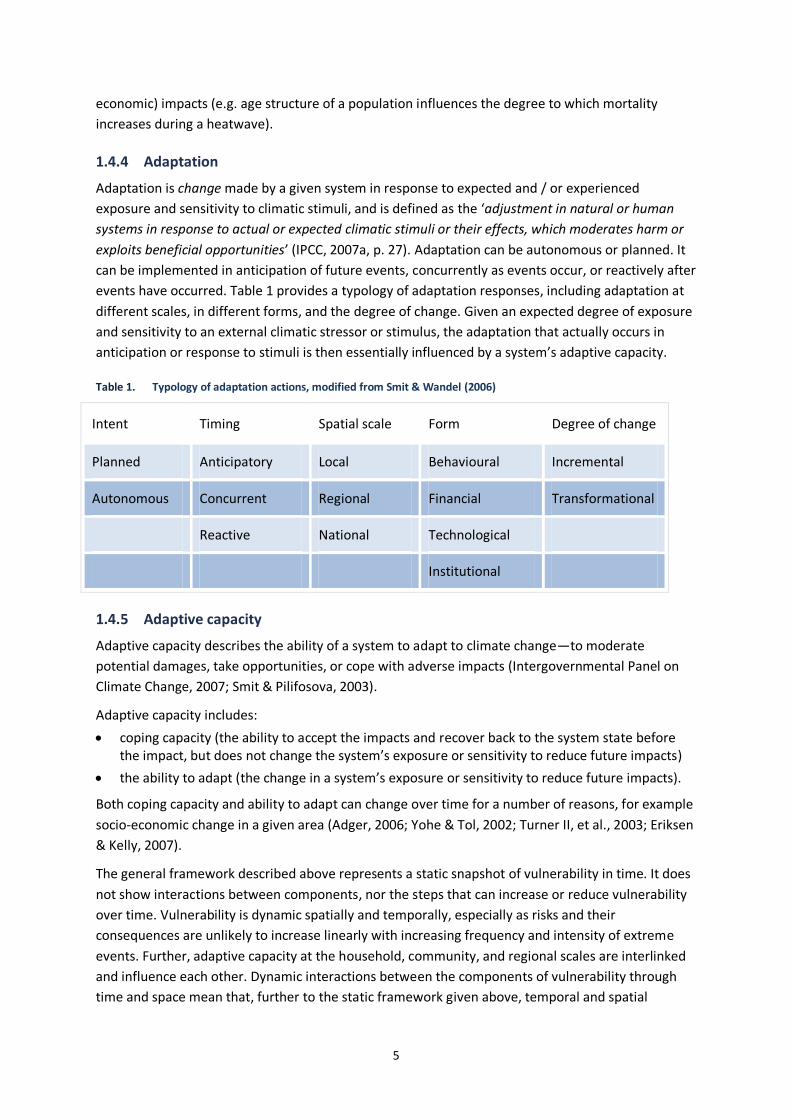
events have occurred. Table 1 provides a typology of adaptation responses, including adaptation at
different scales, in different forms, and the degree of change. Given an expected degree of exposure
and sensitivity to an external climatic stressor or stimulus, the adaptation that actually occurs in
anticipation or response to stimuli is then essentially influenced by a system’s adaptive capacity.
Table 1. Typology of adaptation actions, modified from Smit & Wandel (2006)
Intent Timing Spatial scale Form Degree of change
Planned Anticipatory Local Behavioural Incremental
Autonomous Concurrent Regional Financial Transformational
Reactive National Technological
Institutional
1.4.5 Adaptive capacity
Adaptive capacity describes the ability of a system to adapt to climate change—to moderate
potential damages, take opportunities, or cope with adverse impacts (Intergovernmental Panel on
Climate Change, 2007; Smit & Pilifosova, 2003).
Adaptive capacity includes:
coping capacity (the ability to accept the impacts and recover back to the system state before the impact, but does not change the system’s exposure or sensitivity to reduce future impacts)
the ability to adapt (the change in a system’s exposure or sensitivity to reduce future impacts).
Both coping capacity and ability to adapt can change over time for a number of reasons, for example
socio-economic change in a given area (Adger, 2006; Yohe & Tol, 2002; Turner II, et al., 2003; Eriksen
& Kelly, 2007).
The general framework described above represents a static snapshot of vulnerability in time. It does
not show interactions between components, nor the steps that can increase or reduce vulnerability
over time. Vulnerability is dynamic spatially and temporally, especially as risks and their
consequences are unlikely to increase linearly with increasing frequency and intensity of extreme
events. Further, adaptive capacity at the household, community, and regional scales are interlinked
and influence each other. Dynamic interactions between the components of vulnerability through
time and space mean that, further to the static framework given above, temporal and spatial
6
components are also central to understanding and reducing vulnerability (Smit & Wandel, 2006; Smit
& Pilifosova, 2003).
Adger (2003) demonstrates that adaptive capacity is place and culture-specific and can only be
identified through place and culture specific research. Moser and Ekstrom (2010) highlight the
interconnected structural elements that provide the wider context within which adaptation decision
making takes place. The identification of these structural elements—the actors, the governance
regime in which they operate, and the characteristics of the system exposed to climate change—can
help to diagnose adaptation barriers.
An important insight from the resilience literature (Nelson, et al., 2007) is that adaptation can go
beyond being related to specific (static) risks. Through a resilience lens, adaptation is seen as the
ability to maintain a response capacity in the face of risks that keep changing and evolving. Human
capital, governance structures, and institutional flexibility are salient characteristics of human-
ecological systems that strongly influence successful adaptation to such changing risks. That is,
adaptation in which responses exhibit opportunity taking, and through system feedbacks, adaptation
of the system as a whole over time (Nelson, et al., 2007, p. 199).
1.4.6 Coastal vulnerability
A large body of work has developed specifically focused on vulnerability assessments of coastal
regions (IPCC CZMS, 1992b; Vellinga & Leatherman, 1989; Klein & Nicholls, 1999; Klein & Nicholls,
1999; McFadden, et al., 2007). A number of approaches for conducting coastal vulnerability
assessments have been developed, beginning with top-down approaches that focused on using a
priori vulnerability indicators (IPCC, 1990; IPCC CZMS, 1990; Nicholls, 1994), to more recent top-
down approaches that have built tools to quantitatively model vulnerability and build vulnerability
indices (Hinkel & Klein, 2009).
The Common Methodology for Assessing the Vulnerability of Coastal Areas (IPCC CZMS, 1992a), an
early coastal vulnerability assessment method, has seven analytical steps. The steps outline a
process to identify areas, people, and natural resources that are at risk, and to identify and assess
the costs and feasibility of responses in those instances of high risk, using seven indicators. The
common methodology, and subsequent early studies, developed some useful indicators for
assessing the exposure and sensitivity of coastal systems to sea-level rise and related impacts, some
of which are used in this study.
However, early methodologies have been criticised for not taking into account local social and
cultural contexts in relation to adaptation, among other things. More recently applied ‘bottom-up’
approaches have aimed to increase understanding of the local situational context (physical, social,
institutional factors) to allow the practical application of adaptation activities at the local scale (Smit
& Wandel, 2006). The Intergovernmental Panel on Climate Change (IPCC) (2007a) identified the
importance of development pathways for a community’s vulnerability to climate change, rather than
solely the magnitude of biophysical changes. This approach is consistent with a system / resilience
framework.
Within the context of coastal-hazards management, the legacy of past decisions (e.g. the location of
existing settlements and protection measures) affects today’s management choices, and decisions
made today will in turn affect the pathways taken in the future. Studies using the common
methodology have not typically considered local coastal interactions, nor local constraints and
7
barriers to specific adaptation options. It is this sort of interaction, particularly, between local
government and the communities in the Auckland region, and the local barriers that policies face,
that this case study explores. For example, this study investigated the extent to which the system for
governing coastal hazards is starting to move beyond the legacies of past rather static approaches to
coastal-hazards management, to take a more dynamic view of risks over time and look to processes
to increase community engagement as part of building resilience to changing risks.

9
2 Case study background
2.1 Sea-level rise and adaptation options
2.1.1 Projected sea-level rise
Global mean sea level has risen, and will continue to rise, due to anthropogenic climate change
Global mean sea level is rising as a result of anthropogenic climate change and will continue to rise
for hundreds of years (IPCC, 2007b; The Royal Society of New Zealand, 2010). New Zealand’s mean
sea level rose at an average rate of 1.6mm per year throughout the twentieth century,
corresponding approximately with observations of the global mean (Hannah, 2004). It is expected
that New Zealand’s mean sea level will continue to rise approximately in line with global mean levels
over the coming century (MfE, 2008). An acceleration in the global mean rate of rise that has been
observed in the second half of the twentieth century has not been observed in New Zealand’s tidal
record (Hannah, 2004; Bindoff, et al., 2007). However, New Zealand’s mean sea level is estimated
using just four tide gauge records (Auckland, Wellington, Christchurch and Dunedin), which must be
corrected for land movement (Hannah, 2004), and satellite (altimetry) measurements introduced in
1993, which have recorded higher sea level values around New Zealand (AVISO, 2010), are not yet
included in analysis of mean sea-level change for New Zealand (2004).
For timeframes beyond 2100, sea-level rise of 10cm per decade should be considered
The IPCC’s most recent scientific assessment of climate change presented multiple model-based
projections of sea-level rise that ranged from 18–59cm of sea-level rise to the 2090s, relative to
1990 levels (Meehl, et al., 2007). The range represents outputs from a range of global climate
models (GCM) for six different future emissions scenarios. Observed sea-level rise from 1990 has
been tracking at the upper end of IPCC projections (Bindoff, et al., 2007). To achieve sea-level rise
around the lower end of the projected range, global greenhouse gas emissions would have to be
stabilised in the very near term (Ministry for the Environment, 2008).
Because GCM assumptions include static ice-sheet melt at 1990 rates, the IPCC cautioned that an
additional 10–20cm of sea-level rise could be expected—if the rate of ice-sheet melt increased
linearly with global temperature (Meehl, et al., 2007). Dynamic ice-sheet processes are not currently
included in global climate models. For this reason, the IPCC 2007 report emphasised that the model-
based projections given did not represent an upper limit for sea-level rise over the twenty-first
century, nor could a best estimate for sea-level rise by 2100 be given.
New Zealand’s current guidance on incorporating sea-level rise into long-term council planning and
coastal-hazards management (Ministry for the Environment, 2008) is based on the 2007 IPCC
projections. MfE recommends that for the timeframe to 2100 a base value sea-level rise of 0.5m
relative to 1990 be assessed, as well as:
‘assessment of the potential consequences from a range of possible higher sea-level rises of
at least 0.8m (relative to 1990)’ (Ministry for the Environment, 2008, p. 20).
The 0.8m value takes into account a linear increase in the rate of ice-sheet melt with global
temperature. The MfE guidance also emphasises that sea level will continue rising beyond 2100,
10
even if greenhouse gas emissions are stabilised in the near term. Thus, it is recommended that for
timeframes beyond 2100, sea-level rise of 10cm per decade should be considered.
It is the rate of rise, rather than the total amount, that correlates with global mean temperatures
In the four years since the 2007 IPCC report, projections of sea-level rise have changed dramatically
(The Royal Society of New Zealand, 2010). Significant advances have been made in understanding
the processes contributing to sea-level rise, showing that all sea-level rise observed since 1950 could
be explained by climate change (where previously it could not) (Domingues, et al., 2008); that the
contribution to observed sea-level rise of glacier and ice-sheet melt is much higher than was
previously thought (Velicogna, 2009; Domingues, et al., 2008); and that, in the past, sea level may
have risen more than 2m per century (Rohling, et al., 2008). Recent projections of sea-level rise to
2100 include higher levels of rise than have previously been published, based on semi-empirical
methods used to extrapolate from past temperature and sea-level records (Rahmstorf, 2007;
Horton, et al., 2008). The increase in recent projections of sea-level rise to 2100 is due to the
inclusion of much higher contributions of ice-sheet melt in projections. The IPCC (2007) projections
assumed glacier and ice-sheet melt contributed just 25 percent to sea-level rise to 2100. However,
Domingues et al. (2008) showed that the contribution of glacier and ice-sheet melt to sea-level rise is
now around 60 percent, indicating that the contribution of these factors will continue to increase
over the twenty-first century. Support for the semi-empirical method for projecting sea-level rise
developed by Rahmstorf and others has been supported by recent work (Kemp, et al., 2011) that has
found that it is the rate of sea level rise rather than the total amount of rise that correlates with
global mean temperature over the last 2000 years.
Change will occur much more rapidly in the second half of the twenty-first century
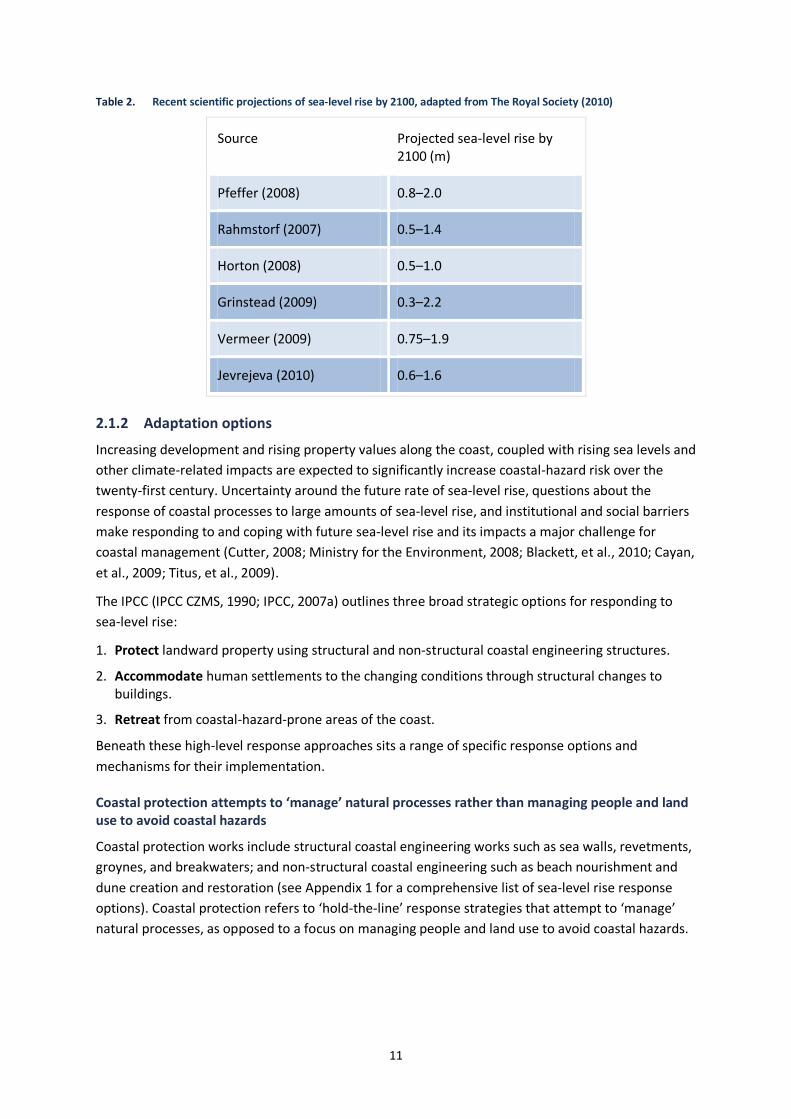
Table 2 shows recent scientific projections of sea-level rise by 2100. Dynamic ice-sheet melt could
result in sea-level rise considerably larger than IPCC model-based projections (2007), with some
studies finding that increases of 1.6 to 2.0m by 2100 cannot be ruled out (Rahmstorf, 2007; Horton,
et al., 2008; Pfeffer, et al., 2008). The serious risks associated with these higher estimates of sea-
level rise by 2100 affirm the need for the full range of plausible sea-level rise projections to be
carefully considered when making decisions in the areas of long-lasting infrastructure and
settlement development (Nicholls, et al., in press). Recent studies have also found that the rate of
sea-level rise is likely to be much higher in the second half of the century than in the first, indicating
that change will occur much more rapidly in the second half of the twenty-first century. This may
result in the need for rapid response measures (with significant economic and structural
implications), especially if inertia in governance structures constrains early proactive adaptation.
11
Table 2. Recent scientific projections of sea-level rise by 2100, adapted from The Royal Society (2010)
Source Projected sea-level rise by 2100 (m)
Pfeffer (2008) 0.8–2.0
Rahmstorf (2007) 0.5–1.4
Horton (2008) 0.5–1.0
Grinstead (2009) 0.3–2.2
Vermeer (2009) 0.75–1.9
Jevrejeva (2010) 0.6–1.6
2.1.2 Adaptation options
Increasing development and rising property values along the coast, coupled with rising sea levels and
other climate-related impacts are expected to significantly increase coastal-hazard risk over the
twenty-first century. Uncertainty around the future rate of sea-level rise, questions about the
response of coastal processes to large amounts of sea-level rise, and institutional and social barriers
make responding to and coping with future sea-level rise and its impacts a major challenge for
coastal management (Cutter, 2008; Ministry for the Environment, 2008; Blackett, et al., 2010; Cayan,
et al., 2009; Titus, et al., 2009).
The IPCC (IPCC CZMS, 1990; IPCC, 2007a) outlines three broad strategic options for responding to
sea-level rise:
1. Protect landward property using structural and non-structural coastal engineering structures.
2. Accommodate human settlements to the changing conditions through structural changes to buildings.
3. Retreat from coastal-hazard-prone areas of the coast.
Beneath these high-level response approaches sits a range of specific response options and
mechanisms for their implementation.
Coastal protection attempts to ‘manage’ natural processes rather than managing people and land use to avoid coastal hazards
Coastal protection works include structural coastal engineering works such as sea walls, revetments,
groynes, and breakwaters; and non-structural coastal engineering such as beach nourishment and
dune creation and restoration (see Appendix 1 for a comprehensive list of sea-level rise response
options). Coastal protection refers to ‘hold-the-line’ response strategies that attempt to ‘manage’
natural processes, as opposed to a focus on managing people and land use to avoid coastal hazards.
12
Accommodation measures adjust human structures and behaviour to minimise risk
Accommodation measures include emergency planning and individual flood-protection measures
such as raising site levels, buildings, and infrastructure; and changing building codes.
Accommodation measures by themselves do not attempt to control natural processes, but rather
adjust human structures and behaviour to minimise risk. Accommodation measures may be an
effective response to periodic inundation, but are unlikely to be an effective response to a trend rise
in the scale or frequency of inundation and erosion.
The availability and affordability of insurance is likely to change
Insurance operates in New Zealand to underwrite risk, but recent disasters have highlighted that its
availability and affordability is likely to change. Increasing limits to the commercial insurability of
coastal property is going to have to be addressed by local government, through a careful long-term
planning process to avoid and minimise risk in which managed retreat will play a part in some
existing settlements.
Retreat adjusts human settlements and structures in response to coastal hazards
Retreat can be reactive (abandonment of property) or planned. Planned retreat refers to the
landward relocation of buildings and infrastructure when they are threatened by coastal hazards,
and can include policies and rules to limit new development and redevelopment in coastal hazard
areas and eventually removing or relocating buildings and assets landward in identified areas.
Retreat adjusts human settlements and structures in response to chronic coastal hazards. Planned
retreat is not considered widely applicable for highly developed urban areas with high levels of sunk
costs. Examples of planned retreat are predominantly cases where the land reclaimed by the sea has
been rural farmland or a natural system (e.g. a wetland or estuary)(Rupp & Nicholls, 2002).
Numerous methods and tools have been developed to assist in making decisions about the most
appropriate type, scale, and timing of adaptation at various scales from the global to the local
(Dickinson, 2008).
2.2 Legislative context
In New Zealand, responsibility for the (sustainable) management of natural and physical resources,
including avoiding or mitigating the effects of coastal hazards, is devolved to local authorities.
National instruments, technical support, and emergency funding come from central government.
New Zealand has a two-tiered local authority structure of regional councils and territorial authorities
(district and city councils) within regional boundaries. Local authorities derive their powers and
responsibilities from a number of statutes that define, support, and guide the management of
coastal hazards and sea-level rise in New Zealand.
The key statutory instruments setting out the roles and responsibilities for the management of
coastal hazards and sea-level rise are the: Local Government Act 2002; Resource Management Act
1991 (RMA); New Zealand Coastal Policy Statement 1994 and 2010 (NZCPS); Building Act 2004; and
the Civil Defence Emergency Management Act 2002. Since 2004, the RMA has empowered
exercising functions under the Act to have particular regard to the effects of climate change and thus
provides for anticipatory planning approaches for sea-level rise risk. The emergency management
legislation addresses reduction, readiness, response, and recovery from hazards—in practice the
emphasis is on the last three components. However, none of the key instruments mentioned here
13
explicitly encourage communities to consider long-term dynamic adaptation to evolving coastal
hazards, or mention concepts such as transformational change, which may be required as changing
risks signal that ‘coping’ will not remain tenable in the future. Two exceptions are the 1994 NZCPS’s
recognition of the need to consider coastal-management options such as ‘abandonment or
relocation of existing structures’3, and the 2010 NZCPS’s mention of managed retreat in the context
of climate change4.
2.3 The study sites
Two study sites were selected to assess and compare adaptation response opportunities and
barriers for existing development. Both areas have been identified as having existing settlements
that may be affected by sea-level rise, primarily due to their low-lying elevation and proximity to the
coast (Ramsay, at al., 2008a; Ramsay, et al., 2008b). The adjacent bays, Mission Bay and
Kohimarama, are considered as one study site, and Kawakawa Bay another site, seen in Figure 2—a
map of the Auckland region and the position of each of the study sites in relation to each other.
Mission Bay / Kohimarama is a centrally located settlement with high-density, high-value
development, existing coastal-defence structures, and very low social deprivation scores (Crampton
& Atkinson, 2007). In contrast, Kawakawa Bay is a small settlement on the fringes of the Auckland
region, with low-levels of development, lower-value property, and mid-to-high-level social
deprivation scores (Crampton & Atkinson, 2007). Until 1 November 2010 they were under the
jurisdiction of different territorial authorities. Mission Bay / Kohimarama was within the Auckland
City Council (ACC) boundary, and Kawakawa Bay was within the Manukau City Council (MCC)
boundary. On 1 November 2010, all the Auckland authorities were amalgamated into one—the
Auckland Council (a unitary authority with both regional and territorial responsibilities and powers),
which is currently developing a spatial plan and a unitary plan for the region.
Auckland is New Zealand’s largest city, home to one third of the country’s population, and is growing
quickly. Auckland’s current population of 1.4 million (Statistics New Zealand, 2010), is projected to
reach two million by 2035, in just 24 years (Auckland Regional Council, 2010). Auckland is a coastal
region with significant areas of existing development at risk from coastal hazards, such as erosion
and episodic inundation, which are expected to be exacerbated by projected sea-level rise (Auckland
Regional Council, 2009).
3 Policy 3.4.6 of the NZCPS 1994.
4 Objective 5 and Policy 25 of the NZCPS 2010.
14
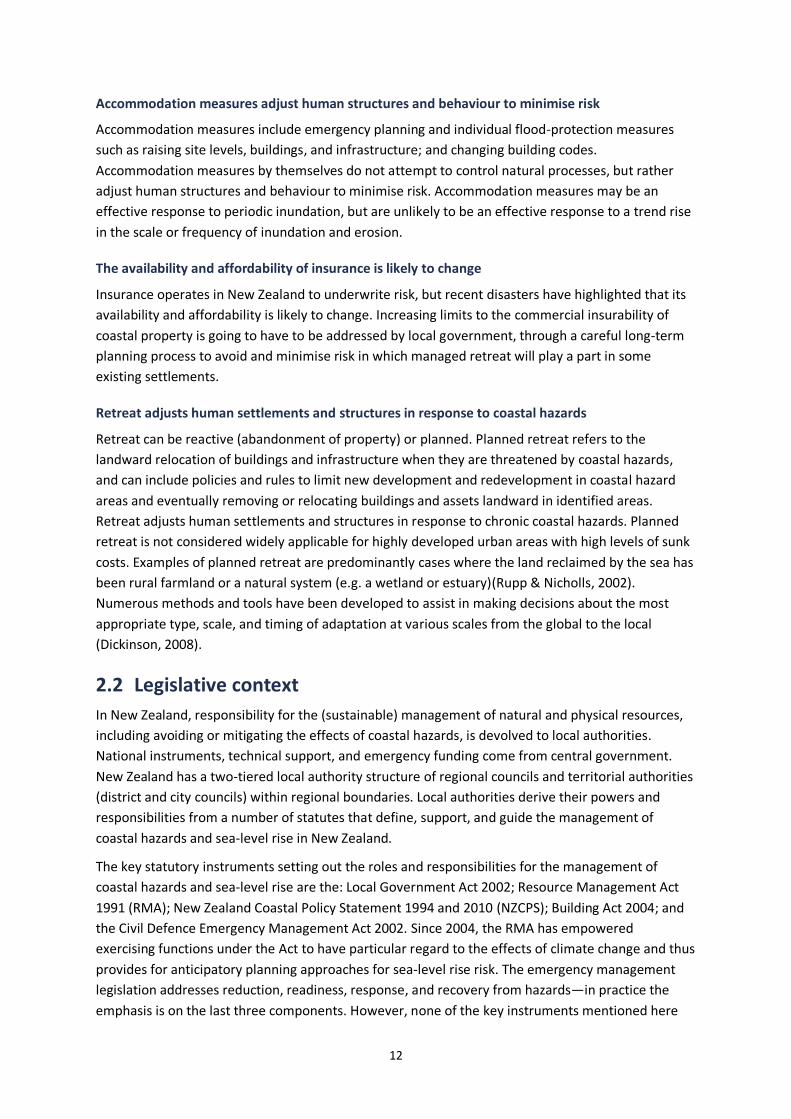
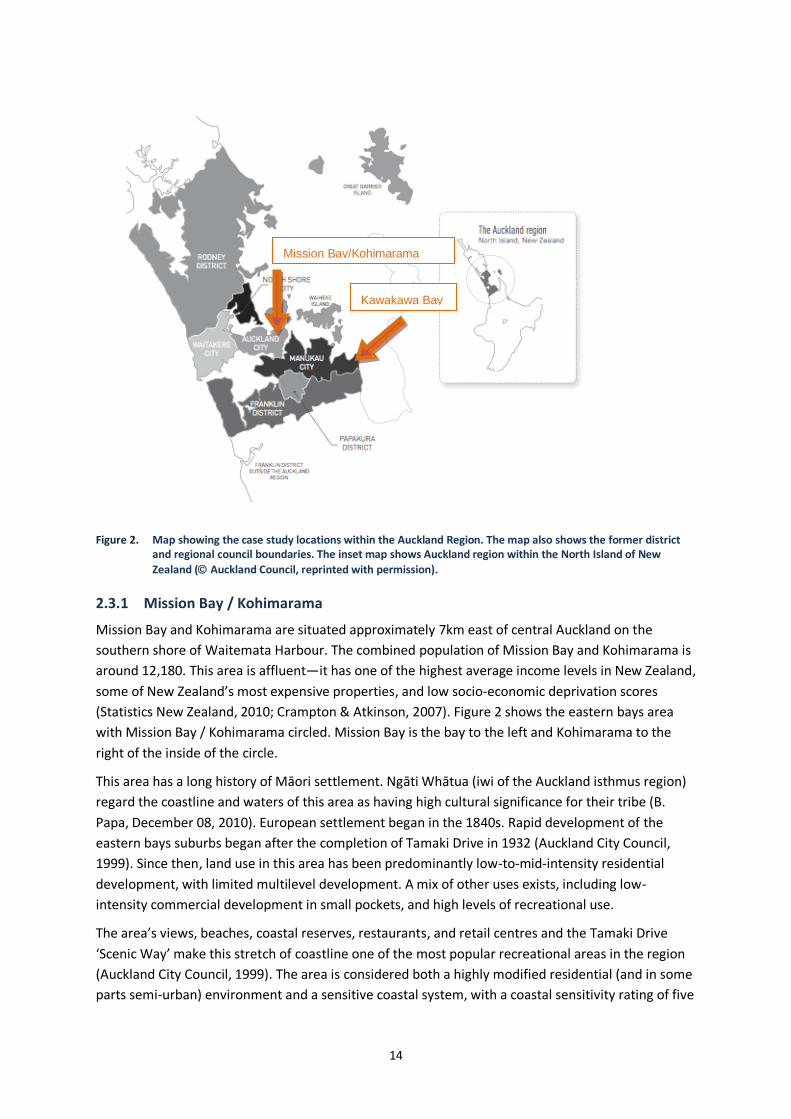
Figure 2. Map showing the case study locations within the Auckland Region. The map also shows the former district and regional council boundaries. The inset map shows Auckland region within the North Island of New
Zealand ( Auckland Council, reprinted with permission).
2.3.1 Mission Bay / Kohimarama
Mission Bay and Kohimarama are situated approximately 7km east of central Auckland on the
southern shore of Waitemata Harbour. The combined population of Mission Bay and Kohimarama is
around 12,180. This area is affluent—it has one of the highest average income levels in New Zealand,
some of New Zealand’s most expensive properties, and low socio-economic deprivation scores
(Statistics New Zealand, 2010; Crampton & Atkinson, 2007). Figure 2 shows the eastern bays area
with Mission Bay / Kohimarama circled. Mission Bay is the bay to the left and Kohimarama to the
right of the inside of the circle.
This area has a long history of Māori settlement. Ngāti Whātua (iwi of the Auckland isthmus region)
regard the coastline and waters of this area as having high cultural significance for their tribe (B.
Papa, December 08, 2010). European settlement began in the 1840s. Rapid development of the
eastern bays suburbs began after the completion of Tamaki Drive in 1932 (Auckland City Council,
1999). Since then, land use in this area has been predominantly low-to-mid-intensity residential
development, with limited multilevel development. A mix of other uses exists, including low-
intensity commercial development in small pockets, and high levels of recreational use.
The area’s views, beaches, coastal reserves, restaurants, and retail centres and the Tamaki Drive
‘Scenic Way’ make this stretch of coastline one of the most popular recreational areas in the region
(Auckland City Council, 1999). The area is considered both a highly modified residential (and in some
parts semi-urban) environment and a sensitive coastal system, with a coastal sensitivity rating of five
Mission Bay/Kohimarama
Kawakawa Bay
15
(significant sensitivity), on a scale of seven—one being low sensitivity and seven being extreme
sensitivity5. Significant natural character, amenity value, and indigenous flora are important issues
highlighted by local authorities in the region (Auckland City Council, 1999).
Coastal environment and processes
The coastline in this area is a sheltered harbour environment with relatively low-energy wave action
(Auckland City Council, 1999). Construction of Tamaki Drive involved considerable modification of
the coastline including the construction of a sea wall that runs from Mechanics Bay to St. Heliers Bay
(this includes the study area). The sea wall altered the natural shape of the coast and coastal
processes. As well as this, the increase in impermeable surface area and development of the
stormwater system draining into the small embayments has resulted in altered sediment and
current patterns.
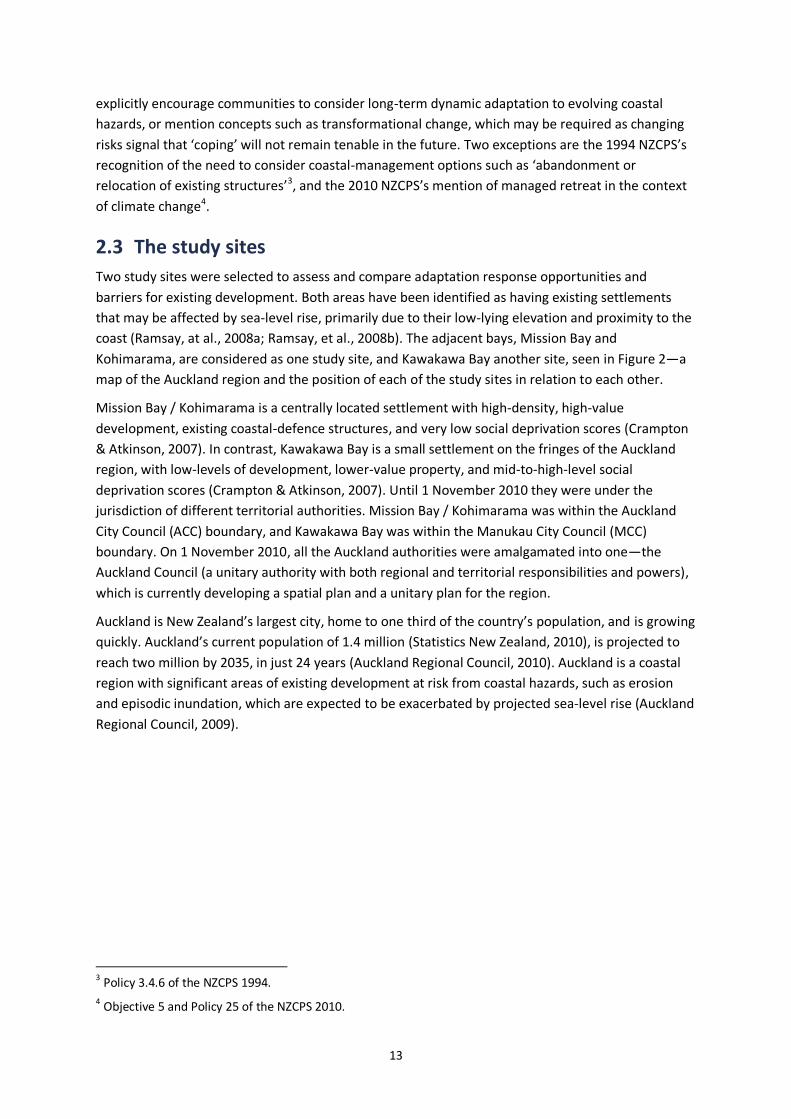
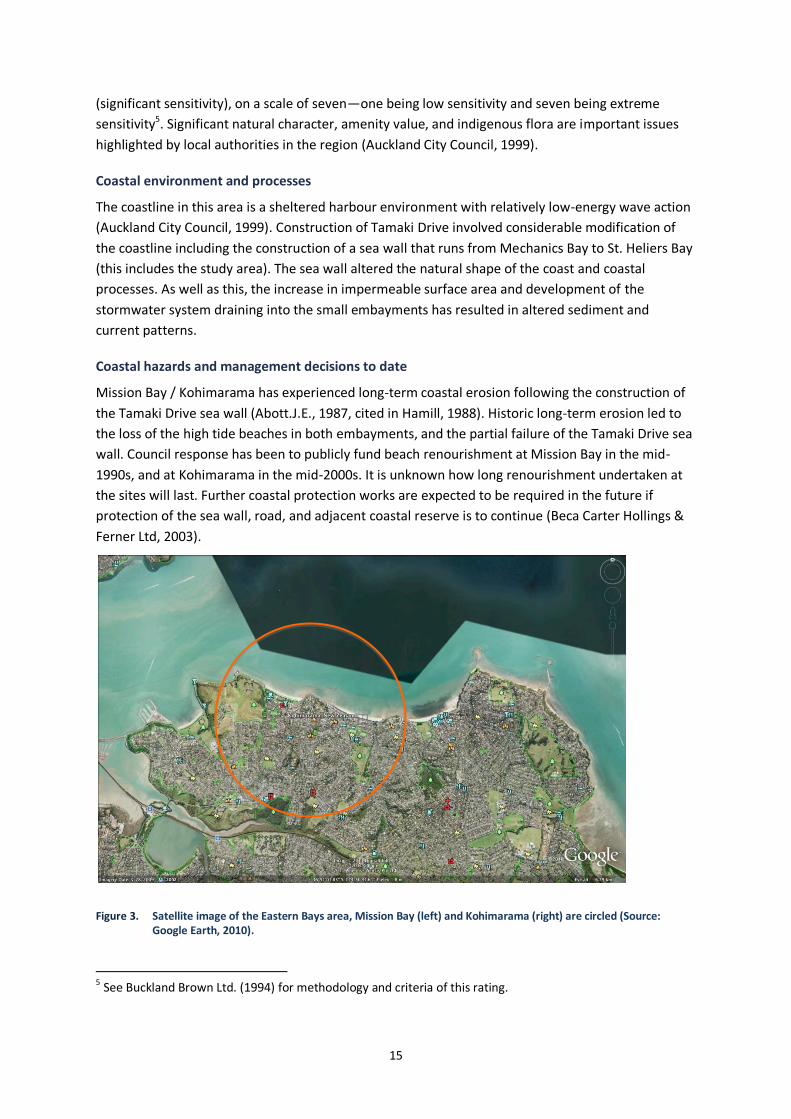
Coastal hazards and management decisions to date
Mission Bay / Kohimarama has experienced long-term coastal erosion following the construction of
the Tamaki Drive sea wall (Abott.J.E., 1987, cited in Hamill, 1988). Historic long-term erosion led to
the loss of the high tide beaches in both embayments, and the partial failure of the Tamaki Drive sea
wall. Council response has been to publicly fund beach renourishment at Mission Bay in the mid-
1990s, and at Kohimarama in the mid-2000s. It is unknown how long renourishment undertaken at
the sites will last. Further coastal protection works are expected to be required in the future if
protection of the sea wall, road, and adjacent coastal reserve is to continue (Beca Carter Hollings &
Ferner Ltd, 2003).
Figure 3. Satellite image of the Eastern Bays area, Mission Bay (left) and Kohimarama (right) are circled (Source: Google Earth, 2010).
5 See Buckland Brown Ltd. (1994) for methodology and criteria of this rating.
16
A small number of houses are believed to be at risk of inundation today for a 1 percent AEP water-
level event (Ramsay et al., 2008a). However, the main disruptions caused by large coastal storms
today would be:
over topping of sea walls and inundation of reserve land and Tamaki Drive
traffic disruption due to the road being inundated
potential damage to the Tamaki Drive sea wall and erosion of beach sediments.
Areas susceptible to current inundation risk up to the 1 percent AEP storm tidewater level are
considered by council to be adequately accounted for by council maps of areas prone to flooding
(Craig, 2010). New development in identified flood-risk areas is subject to minimum freeboard6
standards under section 5D of the Auckland City Council District Plan Isthmus section (Auckland City
Council, 1999). Because current flood risk is managed through minimum freeboard levels for
buildings, no further action has been taken in response to new information showing changing risk of
coastal inundation. Council officers have identified that the new Auckland Council will have to take
considerable steps to plan for changing conditions due to projected sea-level rise (Craig, 2010).
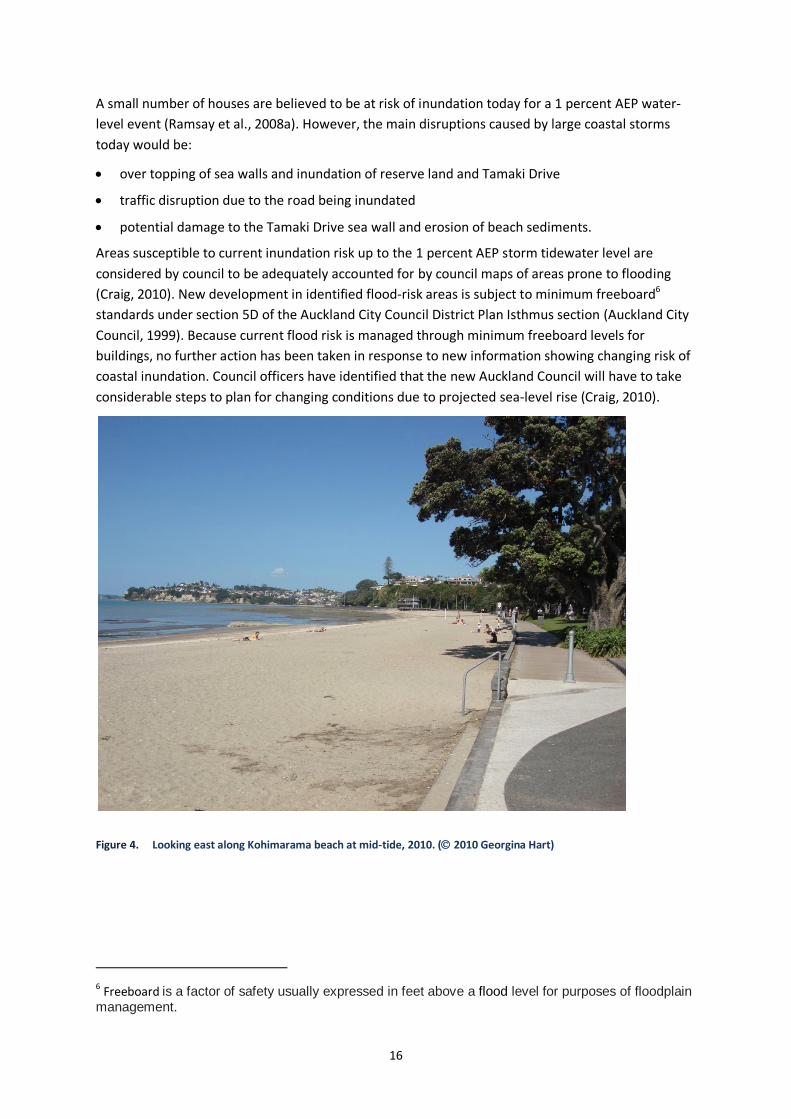
Figure 4. Looking east along Kohimarama beach at mid-tide, 2010. ( 2010 Georgina Hart)
6 Freeboard is a factor of safety usually expressed in feet above a flood level for purposes of floodplain management.
17
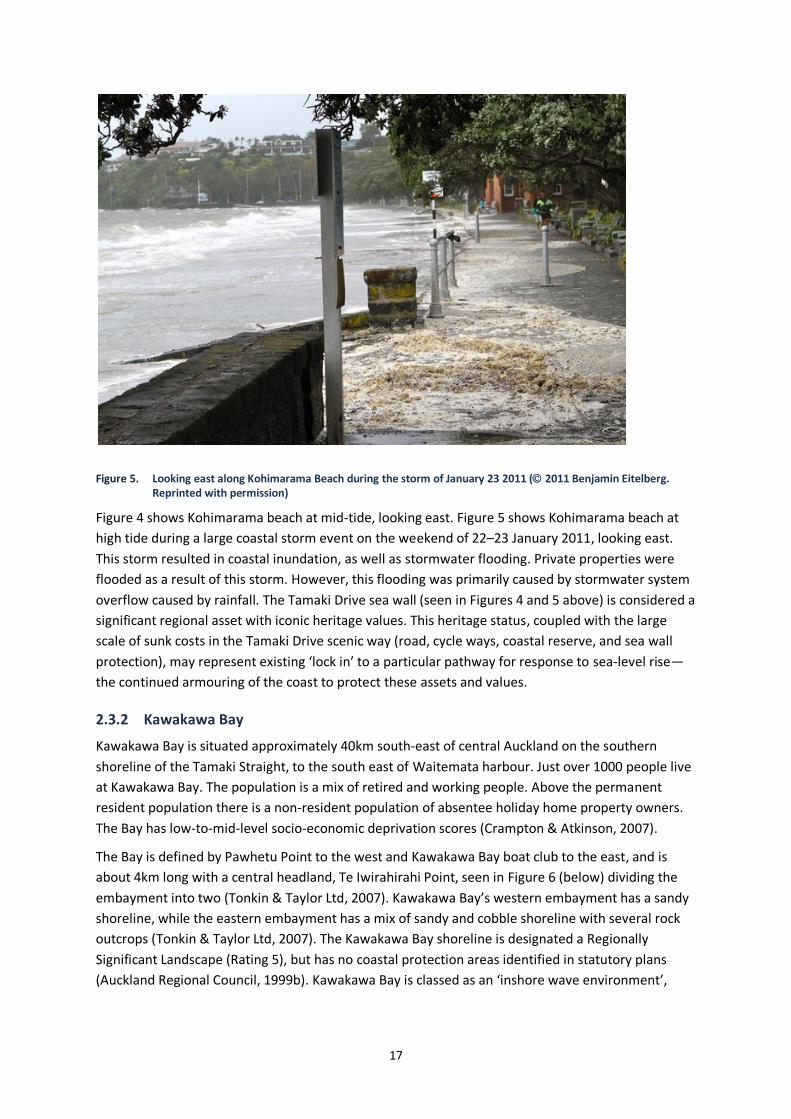
Figure 5. Looking east along Kohimarama Beach during the storm of January 23 2011 ( 2011 Benjamin Eitelberg. Reprinted with permission)
Figure 4 shows Kohimarama beach at mid-tide, looking east. Figure 5 shows Kohimarama beach at
high tide during a large coastal storm event on the weekend of 22–23 January 2011, looking east.
This storm resulted in coastal inundation, as well as stormwater flooding. Private properties were
flooded as a result of this storm. However, this flooding was primarily caused by stormwater system
overflow caused by rainfall. The Tamaki Drive sea wall (seen in Figures 4 and 5 above) is considered a
significant regional asset with iconic heritage values. This heritage status, coupled with the large
scale of sunk costs in the Tamaki Drive scenic way (road, cycle ways, coastal reserve, and sea wall
protection), may represent existing ‘lock in’ to a particular pathway for response to sea-level rise—
the continued armouring of the coast to protect these assets and values.
2.3.2 Kawakawa Bay
Kawakawa Bay is situated approximately 40km south-east of central Auckland on the southern
shoreline of the Tamaki Straight, to the south east of Waitemata harbour. Just over 1000 people live
at Kawakawa Bay. The population is a mix of retired and working people. Above the permanent
resident population there is a non-resident population of absentee holiday home property owners.
The Bay has low-to-mid-level socio-economic deprivation scores (Crampton & Atkinson, 2007).
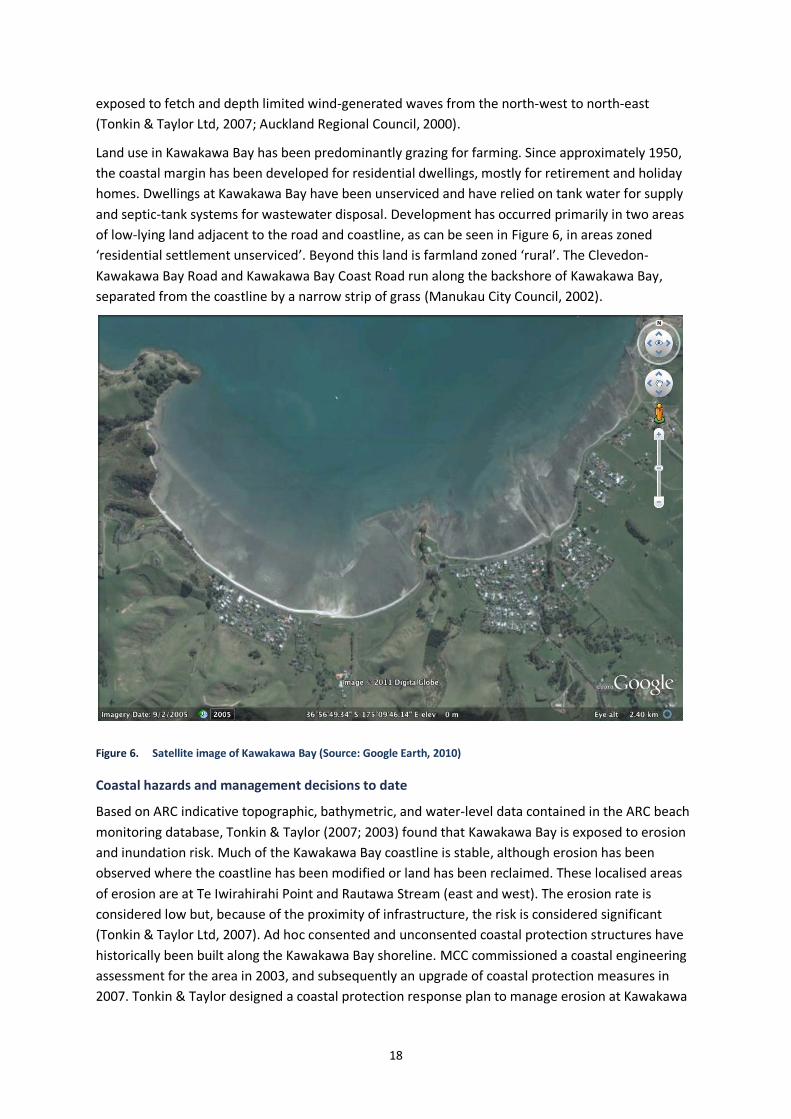
The Bay is defined by Pawhetu Point to the west and Kawakawa Bay boat club to the east, and is
about 4km long with a central headland, Te Iwirahirahi Point, seen in Figure 6 (below) dividing the
embayment into two (Tonkin & Taylor Ltd, 2007). Kawakawa Bay’s western embayment has a sandy
shoreline, while the eastern embayment has a mix of sandy and cobble shoreline with several rock
outcrops (Tonkin & Taylor Ltd, 2007). The Kawakawa Bay shoreline is designated a Regionally
Significant Landscape (Rating 5), but has no coastal protection areas identified in statutory plans
(Auckland Regional Council, 1999b). Kawakawa Bay is classed as an ‘inshore wave environment’,
18
exposed to fetch and depth limited wind-generated waves from the north-west to north-east
(Tonkin & Taylor Ltd, 2007; Auckland Regional Council, 2000).
Land use in Kawakawa Bay has been predominantly grazing for farming. Since approximately 1950,
the coastal margin has been developed for residential dwellings, mostly for retirement and holiday
homes. Dwellings at Kawakawa Bay have been unserviced and have relied on tank water for supply
and septic-tank systems for wastewater disposal. Development has occurred primarily in two areas
of low-lying land adjacent to the road and coastline, as can be seen in Figure 6, in areas zoned
‘residential settlement unserviced’. Beyond this land is farmland zoned ‘rural’. The Clevedon-
Kawakawa Bay Road and Kawakawa Bay Coast Road run along the backshore of Kawakawa Bay,
separated from the coastline by a narrow strip of grass (Manukau City Council, 2002).
Figure 6. Satellite image of Kawakawa Bay (Source: Google Earth, 2010)
Coastal hazards and management decisions to date
Based on ARC indicative topographic, bathymetric, and water-level data contained in the ARC beach
monitoring database, Tonkin & Taylor (2007; 2003) found that Kawakawa Bay is exposed to erosion
and inundation risk. Much of the Kawakawa Bay coastline is stable, although erosion has been
observed where the coastline has been modified or land has been reclaimed. These localised areas
of erosion are at Te Iwirahirahi Point and Rautawa Stream (east and west). The erosion rate is
considered low but, because of the proximity of infrastructure, the risk is considered significant
(Tonkin & Taylor Ltd, 2007). Ad hoc consented and unconsented coastal protection structures have
historically been built along the Kawakawa Bay shoreline. MCC commissioned a coastal engineering
assessment for the area in 2003, and subsequently an upgrade of coastal protection measures in
2007. Tonkin & Taylor designed a coastal protection response plan to manage erosion at Kawakawa
19
Bay that involved a mix of structural and non-structural engineering measures, including
renourishment of some areas and a stone revetment in one area. The management response does
not include a long-term plan and the environmental-effects report for the works acknowledges that
the effects of climate change and sea-level rise will need to be considered for the area. In summary,
current coastal protection at the site can only be considered a short-term response to coastal
erosion and further measures will be required.
Tonkin & Taylor qualitatively assessed that inundation would be likely during a 2 percent AEP event
(50-year average return interval—ARI). From this assessment, Tonkin & Taylor (2007) inferred that
infrastructure and buildings on low-lying land in this area are susceptible to inundation. Riley
Consultants found no major reported flood issues for Kawakawa Bay. However, Riley Consultants
also made the assumption that low-lying coastal areas, where residential properties are situated, are
prone to flooding based on their elevation and proximity to the coast, streams, and the large
catchment area that drains into the coastal area (Riley Consultants Ltd., 2001). MCC managed flood
risk through engineering quality standards (EQS) in its district plan. The EQS prescribes that all
development will have a minimum site level (mAVD-46), and minimum freeboard levels for all
development sites adjacent to open channels and overland flow paths (Manukau City Council, 2002).
The district plan does not directly refer to coastal inundation or coastal areas, but it is assumed that
minimum sites levels adequately protect buildings from coastal inundation up to the 1 percent AEP
level. Adjusted minimum site levels have been recommended to take into account sea-level rise of
up to 0.66m to the 1 percent AEP standard (Ramsay, et al., 2008b).

21
3 Potential impacts of sea-level rise Sea-level rise is expected to worsen the occurrence of erosion and inundation around New Zealand’s
coast. The geophysical characteristics of a given area of coast will determine to what degree erosion
or inundation increases or is initiated. Currently, coastal inundation risk exists at both sites.
However, the risk is low and presents only a small disruption to people so it is not considered a
priority at either settlement, and current flood-risk management is considered satisfactory. This
section presents this study’s investigation of how coastal flood risk could change with sea-level rise
at the study sites.
3.1 Methods
GIS analysis was used to assess the potential impacts of a 1 percent AEP event for three sea-level
rise scenarios at the two coastal settlements. To do this the National Institute of Water and
Atmospheric Research (NIWA) was commissioned to derive extreme sea level static inundation
contours for Waitemata Harbour. Full details of the methods used to generate the inundation
contours can be found in the original studies on the influence of climate change on extreme sea
levels around the ACC and MCC district coastlines (summarised in Appendix 3 of this report) (Ramsay
et al., 2008b; Ramsay et al., 2008a). Future sea-level rise can be added to extreme sea-level values to
estimate how inundation risk may change with long-term sea-level rise.
Potential static inundation extent during a 1 percent AEP event was mapped using GIS. The number
of people, property, and the total economic value of property potentially affected during a 1 percent
AEP event for three sea-level rise scenarios were estimated using GIS analysis.
The information generated in this component of the case study is not designed to be the basis of
specific planning decisions. Rather, the information is designed to give an indication of the scale of
the issue at the case study sites and, in doing so, provide contextual background for the in-depth
investigation of the opportunities for, and barriers to, adaptation to sea-level rise investigated
through in-depth interviews conducted for this study.
3.1.1 Selecting sea-level rise scenarios
Scenarios of future sea-level rise were selected for this study based on an adaptive risk-management
approach consistent with IPCC guidance on developing sea-level rise scenarios (Nicholls, et al., in
press). Sea-level rise scenarios of 0.5m, 1.0m, and 1.5m were selected for this study, reflecting the
latest scientific findings projecting sea-level rise to the end of the century. The sea-level rise
scenarios represent local relative sea-level rise, and are measured relative to present day (2007)
local mean sea level. A further scenario of 2.0m sea-level rise was also assessed. However, it was
found that the difference in impact and expert views regarding the required adaptive response, from
1.5m to 2.0m sea-level rise, was minimal at the study sites due to the sites’ topography.
Consequently, the results of the 2.0m scenario are not presented here.
Timeframes are not assigned to the three sea-level rise scenarios. This is consistent with an
adaptive-management approach, whereby risks and responses are assessed independent of the
timeframe at which impacts and responses may occur. Specific timing of responses may be applied
subsequently, and can be reviewed as new information becomes available. The higher sea-level rise
scenarios investigate the implications of high-impact low-likelihood scenarios of sea-level rise and
22
the potential responses required to cope with the assoiated change. Options can be investigated and
left open for the future. However, if the rate of sea-level rise does not increase rapidly in the twenty-
first century then adaptive responses planned to cope with this can be put off or modified. In the
same way, if sea-level rise rates increase more rapidly than expected, responses planned for the long
term can be brought forward to respond to changing conditions. Such an approach gives decision
makers some flexibility in response.
3.1.2 Limitations
Coastal erosion, permanent inundation, groundwater-level rise, and the interaction of freshwater
flooding and sea-level rise are further processes that may be affected by sea-level rise that lie
outside the scope of this study, but may have significant implications for existing development
around the Auckland region, and warrant further investigation. Climate change may result in local
changes to extreme sea levels, not only through sea-level rise, but also due to changes to the
frequency, intensity, and tracking of low-pressure systems, and the occurrence of stronger winds.
Changes to these phenomena are not assessed in this study, but may have significant implications
for coastal hazard risk along the Auckland region coast, and also warrant further investigation.
Additionally, current rates of erosion; the potential for increased erosion at the study sites; and
potential responses were discussed qualitatively with key informants in the interviews conducted for
this study.
More comprehensive approaches to estimating the impacts of coastal inundation can be undertaken
by various methods. For example, undertaking integrated hydrodynamic modelling of storm events,
deriving damage estimates, and incorporating future socio-economic scenarios into vulnerability
assessments. The Riskscape Tool7 developed by NIWA and Geological and Nuclear Science (GNS) is
an already existing multi-hazard assessment tool that could be used to develop more detailed
vulnerability assessments at the case study sites and for the Auckland region. However, substantial
further hydrodynamic modelling and asset database development would be required to do this
(R.Bell, June 13, 2011). This was beyond the resources available for this case study.
3.2 Changing 1 percent AEP levels and inundation mapping
This section presents the results of the extreme sea level analysis and inundation mapping. To
account for the variance in water levels for each AEP and the confidence limits associated with each
estimate, a ‘lower’ and an ‘upper’ water level and associated contour was derived for the present
day and each sea level scenario (0.5m, 1.0m, and 1.5m). Table 3 shows the upper and lower water
levels for each AEP for the present day and each sea-level scenario for Waitemata Harbour. To
assess potential inundation extent at the study sites, the lower AEP level has been used to create
inundation maps and GIS analysis of people and properties potentially affected. The water levels in
Table 3 were converted to land contours in GIS using Light Detection and Ranging (LIDAR) digital
elevation models of city districts provided by ACC and MCC.
7 http://www.riskscape.org.nz/about
23
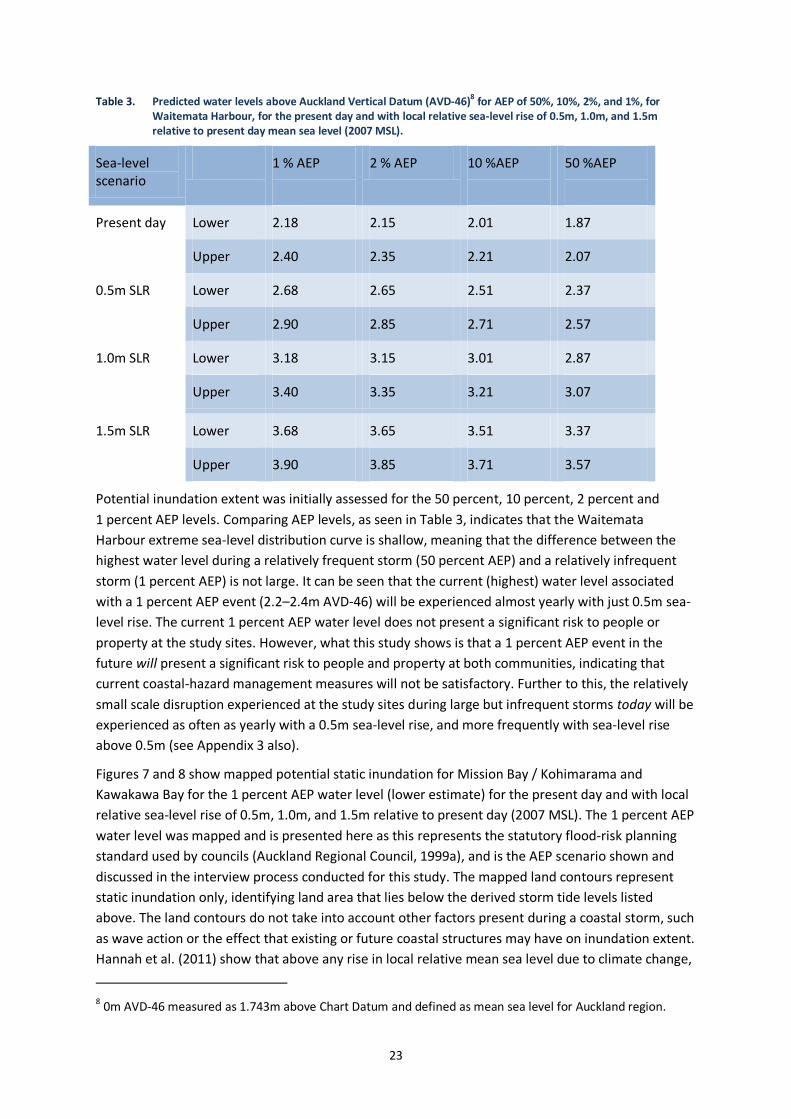
Table 3. Predicted water levels above Auckland Vertical Datum (AVD-46)8 for AEP of 50%, 10%, 2%, and 1%, for Waitemata Harbour, for the present day and with local relative sea-level rise of 0.5m, 1.0m, and 1.5m relative to present day mean sea level (2007 MSL).
Sea-level scenario
1 % AEP
2 % AEP 10 %AEP
50 %AEP
Present day Lower 2.18 2.15 2.01 1.87
Upper 2.40 2.35 2.21 2.07
0.5m SLR Lower 2.68 2.65 2.51 2.37
Upper 2.90 2.85 2.71 2.57
1.0m SLR Lower 3.18 3.15 3.01 2.87
Upper 3.40 3.35 3.21 3.07
1.5m SLR Lower 3.68 3.65 3.51 3.37
Upper 3.90 3.85 3.71 3.57
Potential inundation extent was initially assessed for the 50 percent, 10 percent, 2 percent and
1 percent AEP levels. Comparing AEP levels, as seen in Table 3, indicates that the Waitemata
Harbour extreme sea-level distribution curve is shallow, meaning that the difference between the
highest water level during a relatively frequent storm (50 percent AEP) and a relatively infrequent
storm (1 percent AEP) is not large. It can be seen that the current (highest) water level associated
with a 1 percent AEP event (2.2–2.4m AVD-46) will be experienced almost yearly with just 0.5m sea-
level rise. The current 1 percent AEP water level does not present a significant risk to people or
property at the study sites. However, what this study shows is that a 1 percent AEP event in the
future will present a significant risk to people and property at both communities, indicating that
current coastal-hazard management measures will not be satisfactory. Further to this, the relatively
small scale disruption experienced at the study sites during large but infrequent storms today will be
experienced as often as yearly with a 0.5m sea-level rise, and more frequently with sea-level rise
above 0.5m (see Appendix 3 also).
Figures 7 and 8 show mapped potential static inundation for Mission Bay / Kohimarama and
Kawakawa Bay for the 1 percent AEP water level (lower estimate) for the present day and with local
relative sea-level rise of 0.5m, 1.0m, and 1.5m relative to present day (2007 MSL). The 1 percent AEP
water level was mapped and is presented here as this represents the statutory flood-risk planning
standard used by councils (Auckland Regional Council, 1999a), and is the AEP scenario shown and
discussed in the interview process conducted for this study. The mapped land contours represent
static inundation only, identifying land area that lies below the derived storm tide levels listed
above. The land contours do not take into account other factors present during a coastal storm, such
as wave action or the effect that existing or future coastal structures may have on inundation extent.
Hannah et al. (2011) show that above any rise in local relative mean sea level due to climate change,
8 0m AVD-46 measured as 1.743m above Chart Datum and defined as mean sea level for Auckland region.
24
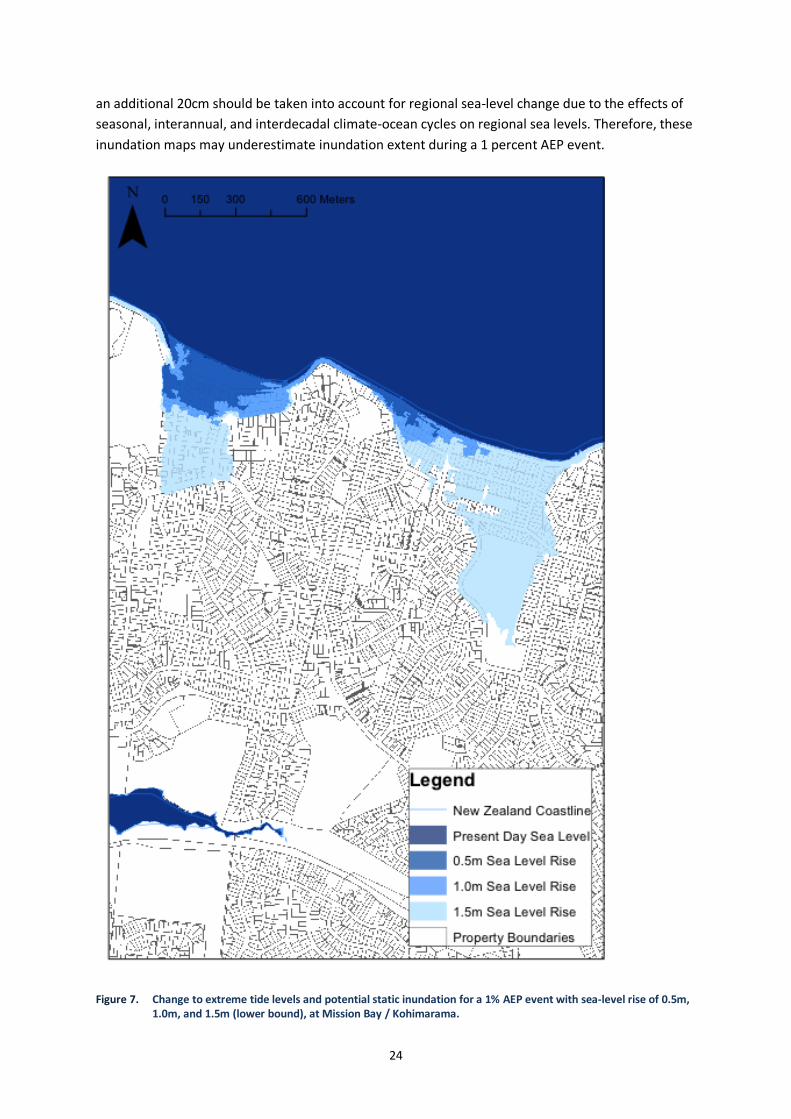
an additional 20cm should be taken into account for regional sea-level change due to the effects of
seasonal, interannual, and interdecadal climate-ocean cycles on regional sea levels. Therefore, these
inundation maps may underestimate inundation extent during a 1 percent AEP event.
Figure 7. Change to extreme tide levels and potential static inundation for a 1% AEP event with sea-level rise of 0.5m, 1.0m, and 1.5m (lower bound), at Mission Bay / Kohimarama.
25
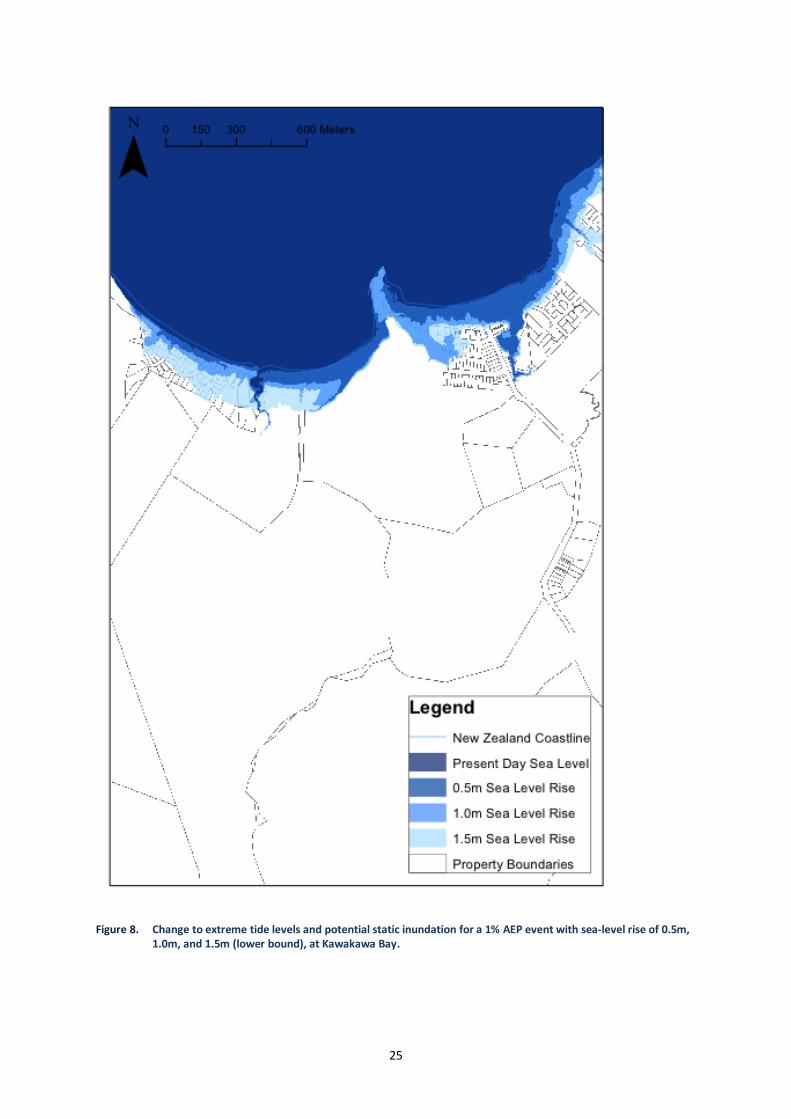
Figure 8. Change to extreme tide levels and potential static inundation for a 1% AEP event with sea-level rise of 0.5m, 1.0m, and 1.5m (lower bound), at Kawakawa Bay.
26
Figures 7 and 8 show the degree to which coastal inundation may affect Mission Bay / Kohimarama
and Kawakawa Bay during a 1 percent AEP event as local relative mean sea level rises. For the
present day, a 1 percent AEP event will result in little inundation, and is not expected to represent
any major disruption to either site. With 0.5m sea-level rise, a significant portion of residential
property at Mission Bay and Kawakawa Bay could be inundated, whereas at Kohimarama the impact
is relatively small. A rise up to 1.0m represents a relatively small increase (from 0.5m) in inundated
area and affected property at all sites. For a rise of 1.5m, a significantly larger area is affected in all
areas, except the eastern Kawakawa Bay embayment where the additional flooding for increased
sea level of 1.5m is relatively small. The maps show that a local mean sea-level rise of 0.5m will
represent a major disruption to the eastern embayment at Kawakawa Bay, and at Mission Bay. A
mean sea-level rise of 1.5m would result in a major disruption at the western embayment at
Kawakawa Bay and Kohimarama. One result of generating vulnerability information such as mapping
inundation risk, is the ability to identify how timing of response will be needed. If response can be
spread over time (e.g. sea wall construction or retreat at Mission Bay could be planned for in the
next 40 years, and at Kohimarama after this) then risks are managed or avoided where they need to
be, at the time they need to be, and adaptation costs can be incurred with appropriate timing
specific to spatially explicit risks rather than more generalised representations of changing risks.
3.3 Results: Potential socioeconomic impacts
Potential socio-economic impacts associated with rising sea level at the study sites were investigated
by estimating the numbers of people and properties, and the total economic value of properties
potentially affected by inundation during a 1 percent AEP event, based on current population and
property value data. These estimates provided an indication of the scale of potential consequences
of inundation at the study sites.
Population data refers to counts of ‘usually resident population’9 and was retrieved from Statistics
New Zealand 2006 national census meshblock10 data. Property information was made available by
ARC, and property value data was based on the most recent available ratings valuation (2007 /
2008). ArcGIS software ArcMap was used to conduct GIS analysis to extract property numbers and
values, and the numbers of people residing seaward of mapped inundation contours.
Table 4 shows the number of people usually resident within the meshblock area units that were at
least 50 percent covered by the related inundation contour. This may under represent the number
of people potentially affected at Mission Bay / Kohimarama for the 1.0m sea-level rise scenario, as
the same number of meshblocks were affected, as for the 0.5m scenario. All were >50 percent, but
to different degrees, meaning that the same count is given even though the number of people
potentially affected differed between these two scenarios. Data at a finer scale than the meshblock
would be required to correct this. The results for the number of properties potentially affected
highlights the difference between the 0.5m and 1.0m scenarios more clearly, as data is at the scale
of individual properties.
9 The census group ‘usually resident population’ is a count of all people who usually live in a given area and are present in New Zealand on census night. This count excludes visitors to the area and usual residents who are temporarily overseas on census night (Statistics New Zealand Census 2006, accessed August 11, 2010).
10 A meshblock is the smallest geographic unit for which statistical data can be accessed. 2006 census data is the most recent census data.
27
Table 4 shows the number of local residents potentially affected by inundation during a 1 percent
AEP event at the study sites will increase with sea-level rise. At Mission Bay / Kohimarama, 0 percent
would be affected by a 1 percent AEP event today. Of the area’s residents, 4.2 percent would be
affected by a 1 percent AEP event with sea-level rise of both 0.5m and 1.0m, and 13.6 percent with
1.5m sea-level rise. At Kawakawa, the proportional impact on the community would be much higher
with numbers potentially affected by inundation reaching more than 50 percent of the area’s
population during a 1 percent AEP event with 1.5m sea-level rise.
Table 4. The number of people and percentage of census area population potentially affected during a 1% AEP event for the present day and three sea-level rise scenarios.
Study area Sea-level scenario (mAVD-46)
Present day
(mAVD-46)
0.5m SLR
(mAVD-46)
1.0m SLR
(mAVD-46)
1.5m SLR
(mAVD-46)
Mission Bay / Kohimarama
Number of people 0 ~518 ~518 ~1653
% of population 0 % 4.2 % 4.2 % 13.6 %
Kawakawa Bay Number of people 0 ~324 ~399 ~525
% of population 0 % 32.4 % 39.9 % 52.5 %
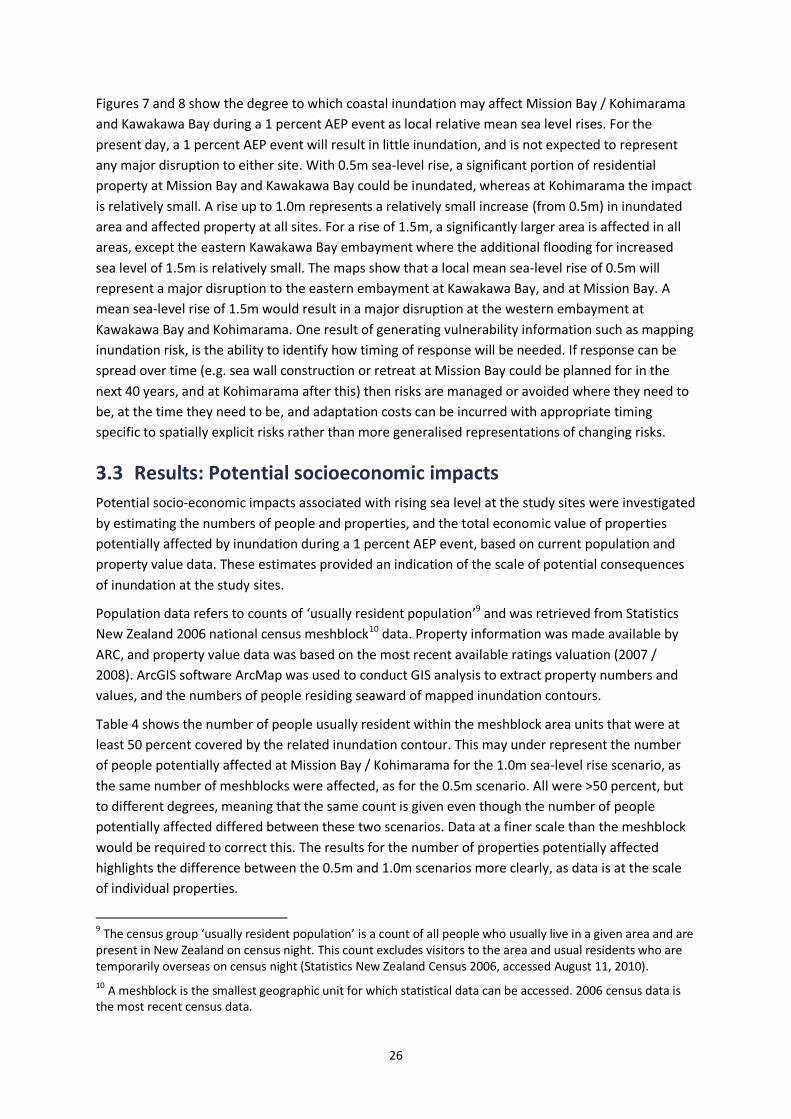
Figure 9 shows the change in the number of properties potentially affected by coastal inundation
during a 1 percent AEP event as sea level rises up to 1.5m above 2007 levels (lower-bound
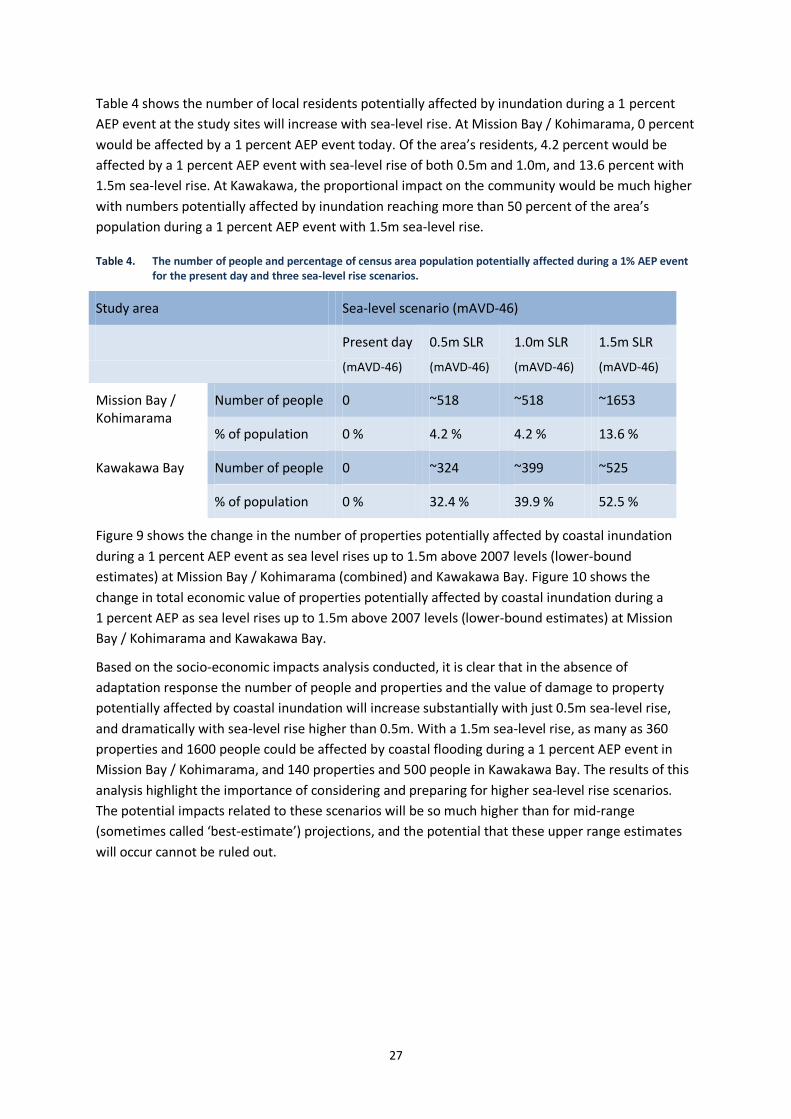
estimates) at Mission Bay / Kohimarama (combined) and Kawakawa Bay. Figure 10 shows the
change in total economic value of properties potentially affected by coastal inundation during a
1 percent AEP as sea level rises up to 1.5m above 2007 levels (lower-bound estimates) at Mission
Bay / Kohimarama and Kawakawa Bay.
Based on the socio-economic impacts analysis conducted, it is clear that in the absence of
adaptation response the number of people and properties and the value of damage to property
potentially affected by coastal inundation will increase substantially with just 0.5m sea-level rise,
and dramatically with sea-level rise higher than 0.5m. With a 1.5m sea-level rise, as many as 360
properties and 1600 people could be affected by coastal flooding during a 1 percent AEP event in
Mission Bay / Kohimarama, and 140 properties and 500 people in Kawakawa Bay. The results of this
analysis highlight the importance of considering and preparing for higher sea-level rise scenarios.
The potential impacts related to these scenarios will be so much higher than for mid-range
(sometimes called ‘best-estimate’) projections, and the potential that these upper range estimates
will occur cannot be ruled out.
28
Figure 9. Number of properties potentially affected by coastal inundation during a 1% AEP water level event, for present day local mean sea level and for local relative sea-level rise of 0.5m, 1.0m, 1.5m, and 2.0m sea-level rise (lower bound) at Mission Bay / Kohimarama and Kawakawa Bay.
Figure 10. Total economic value of properties potentially affected by coastal inundation during a 1% AEP water level event, for the present day local mean sea level and for local relative sea-level rise of 0.5m, 1.0m, and 1.5m (lower bound) at Mission Bay / Kohimarama and Kawakawa Bay.
0
50
100
150
200
250
300
350
400
present day 0.5m 1.0m 1.5m
Nu
mb
er
of
pro
pe
rtie
s
Sea level scenario
Mission Bay and Kohimarama
Kawakawa Bay
0
50
100
150
200
250
300
350
400
present day 0.5m 1.0m 1.5m
Val
ue
(mill
ion
s o
f d
olla
rs)
Sea level scenario
Mission Bay and Kohimarama
Kawakawa Bay
29
4 Adaptation opportunities and barriers Semi-structured in-depth interviews were conducted to investigate adaptation opportunities and
barriers at the study sites. The interview transcripts were analysed thematically, based on the
methodology set out by Braun & Clark (2006). Twenty-five participants were selected from local
government, and relevant fields (e.g. coastal science, coastal engineering, resource management
law). Interviews ranged in length from 60 to 120 minutes. See Appendices 4 and 5 for an indicative
interview schedule and a full list of participants. The interviews were structured around two main
themes, with subsections for discussion.
1. The current approach to coastal hazards management
a. Preparing for sea-level rise
b. Planning timeframes and horizons
c. Response options at the study sites (study site inundation maps and impacts information were introduced and discussed at this point)
2. Including retreat as part of the management toolbox
a. Managed retreat as a potential response option
b. Barriers to managed retreat
4.1 Coastal-hazards management: The current approach
Issues surrounding recent coastal development and coastal-hazards management have been well
documented in New Zealand (Hume & Blackett, 2007; Wilson, 2010; Turbott, 2006; Gregory &
Young, 2002; New Zealand Climate Change Office, 2003; Blackett, et al., 2010; Duthie, 2005; Cheyne,
2007; Hayward, 2008). This case study investigated the current approach to coastal-hazards
management in Auckland to set the context for further discussion of adaptation options for the two
study sites.
4.1.1 The former Auckland Regional Council
The role of the former ARC was to conduct regional scale natural hazards research, and to provide
coordination and support for on-the-ground coastal-hazards management by territorial authorities.
ARC fulfilled its roles predominantly through regional planning documents: The Auckland Regional
Policy Statement (RPS) and The Auckland Regional Plan: Coastal (Auckland Regional Council, 1999a;
Auckland Regional Council, 1999b). The regional plans have provided general policies to guide
district council in coastal-hazards management.
The Auckland RPS establishes the region’s approach to coastal hazards and sets the region’s flood
protection standard at the 1 percent AEP water level. The RPS states that new development should
avoid exposure to coastal hazards and that, where development already exists, measures to mitigate
the adverse effects of coastal hazards should not adversely affect the coastal environment or worsen
coastal-hazards risk. The phenomenon of sea-level rise is acknowledged but no specific guidance is
included, nor is the ongoing and evolving nature of coastal risks highlighted (Auckland Regional
30
Council, 1999a). However, an update of the RPS in respect of climate change effects and adaptation
is overdue, and a review of the RPS is underway11.
From the regional council perspective, interview participants emphasised the variable nature of
coastal-hazards risk along the coast. Therefore, participants felt that to impinge on a property
owner’s development rights by applying development restrictions through generalised hazard zoning
may not be justified, given the site-specific nature of coastal hazards. There was also a view held that
such action by council could be indefensible in the Environment Court, if contested. It is important to
note that in regions where development restrictions have been put in place in coastal-hazard zones
in regional or district plans they have been upheld in the Environment Court in numerous examples
(Ministry for the Environment, 2008).
The regional council participants’ perspectives that coastal-hazards management is best handled
through the case-by-case resource consent process is consistent with the ‘specific-risk’ approach of
conventional risk management, which in turn is well adapted to the largely static structure of the
RMA. The RMA puts considerable emphasis on allowing private property owners to pursue their own
current interests, or ‘wellbeing’, as per the language of Section 5 of the Act. There is little emphasis
on councils pursuing collective action in the public interest, although in principle councils are
empowered to take action that is forward looking and speaks to the collective interests of future
citizens.
4.1.2 Territorial authorities
The approaches taken by the seven territorial authorities that operated in the region until
31 October 2010 varied. For new development, planning tools have been used to manage coastal
hazards. These have included requiring coastal setbacks; setting minimum site levels; setting
minimum freeboard levels within identified floodplains; and requiring resource consent within
identified coastal-flooding areas (controlled activity), which may include attaching conditions to
resource consents requiring hazards be avoided or mitigated.
In Auckland, the need for coastal-hazard management at existing properties exists today due to a
legacy of coastal development that has not taken the dynamic nature of the coast into account. For
existing development, the response by councils has been reactive and driven by affected property
owners’ resource consent applications for structures to protect their property from erosion, or calls
from a community that a public asset is being damaged and requires protection. The result is a
legacy of ad hoc structural coastal protection works (consented and unconsented), which have been
constructed along the region’s coastline to protect both public and private property. Works directly
protecting private property have predominantly been privately funded and executed. Where public
property has been affected (e.g. coastal reserves and roads), district councils have routinely opted
for engineered protection works and, more recently, beach nourishment to protect public assets
from erosion. However, response by the councils to develop and fund coastal-erosion management
to protect public assets has occurred only once significant erosion and damage to property has
occurred. Erosion management has not been planned in anticipation of predicted erosion.
11 A review of the RPS was started in 2008. However, the draft RPS was not publicly notified due to planned changes to the Auckland region governance structure, which took effect on 1 November 2010. The draft RPS was passed on to the new Auckland Council for consideration.
31
Over recent decades, problems associated with structural coastal protection works have arisen, both
nationally and internationally, which has caused a shift in approach to coastal-hazards management
in several countries. In New Zealand, the need to consider alternative response options has been
introduced into coastal-hazards management guidance through the NZCPS (1994 and 2010). The
NZCPS discourages the use of structural coastal protection as a response to coastal hazards. The
NZCPS stipulates that structural protection works should only be constructed if they are the best
practicable option, and that other options including managed retreat should be considered
(Department of Conservation, 2010). This approach has been reflected in Auckland planning
documents including the Auckland RPS and the Auckland Regional Plan: Coastal.
However, at the implementation level, structural-coastal protection continues to be the status quo
response to coastal-hazards management, and no examples of planned retreat of private property
from coastal hazards yet exists in the Auckland region. A number of non-structural (‘soft’) protection
examples exist, most notably Mission Bay / Kohimarama, where the beaches have been renourished
in works funded by council to protect high-value public assets. A number of retreat examples in
other situations exist. ARC and Rodney District Council were involved in a participatory coastal
management process at Muriwai Beach (an open ocean west coast beach), where a public building
was threatened by erosion. After more than a decade of negotiations amongst the community, and
with the councils, the relocation of the surf-lifesaving building back from the coastline was agreed
upon (Blackett, Hume, & Dahm, 2010). Waitakere City Council undertook a comparatively large-scale
voluntary retreat plan involving private residential properties built within a 100-year river floodplain
(Atlas Commnications & Media Ltd., 2010). There are examples of councils adaptively managing
coastal hazards in other areas of New Zealand, for example the Hawke’s Bay and Canterbury regions.
4.1.3 Coastal-hazards management barriers
Existing use rights and the political nature of coastal-hazards management decisions impede progress
Several district council participants said that councils ‘can’t really do anything’ about coastal hazards
on existing properties. Under Section 10 of the RMA, district councils cannot affect land use on
existing development. However, regional councils can override existing use rights in regional plan
policies and rules, which must then be given effect by district councils. In Auckland, no such regional
and district coordination for the management of coastal hazards was initiated. Regional guidance is
broad and does not directly affect existing development.
Participants reported that individuals could exert influence on councils to gain consent to construct
coastal protection, even though these works may be counter to planning guidance. This influence
was related to an individual’s influence within their community, their wealth (i.e. access to
resources), and their personal level of determination to protect their property (i.e. how much time
and resources they were willing to pour into gaining a consent to engineer the coast). Participants
noted the political nature of decision making about coastal-hazards response options, where
decisions about coastal-hazards management at the council level may override regional policy and /
or advice from council officers based on pressure from property owners. Because of this, managing
coastal hazards on existing development was seen predominantly as a political issue that was
beyond the power of advisers.
32
There are conflicting views on approaches to coastal-hazard management
Conflicting views were expressed regarding what approach to coastal-hazards management for
existing property is most appropriate. From the comments of participants, it appears that in
Auckland views differed around: 1) the right of individuals to protect their property, versus the
potential adverse social and environmental effects of coastal-protection works; and 2) who bears
the cost for coastal-hazards management response. For example, costs may be spread across
ratepayers or borne by the individual property owners affected. Conflicting views among key
advisers in relation to these social, environmental, and economic factors increases the complexity of
decision making for coastal-hazards management.
A low-priority status and consequent limited resource allocation have resulted in knowledge and implementation gaps at the regional and local levels
Participants from ARC reported significant regional knowledge gaps in the information held on
coastal hazards. The only monitoring of coastal hazards done regionally is of beach erosion at 16
sites. Sea level is recorded at the Waitemata Harbour tide gauge, administered by the Ports of
Auckland Limited, and incomplete information is kept on coastal storm events. Inundation is not
monitored. This monitoring gap was identified by the former ARC, with the aim of eventually
establishing an inundation component to coastal-hazards monitoring. However, this had not yet
occurred at the time of writing. No regional assessment of future inundation risk exists. In terms of
assessing future risks, a regional coastal-hazards assessment projecting potential erosion for the
twenty-first century, and a regional assessment of potential sea-level rise for the twenty-first
century have been completed.
Significant knowledge gaps include storm event and inundation monitoring; the collation of coastal
hazard information into a (publicly accessible) natural-hazards database; and research into the
potential social, economic, and environmental implications of coastal-hazard impacts and response
options. These matters are currently under discussion in the new Auckland Council in the context of
the spatial and unitary plans being prepared.
Interview participants reported that barriers to improving knowledge around coastal hazards and
their management stemmed from coastal hazards having a low priority in competition with other
issues on councils’ agendas, which results in a lack of resources being allocated for this issue. Several
reasons were given for its low-priority status, including few reports of actual damage to private
property due to coastal hazards; the low frequency of large coastal storms and the length of time
since the last large scale coastal event to impact Auckland’s developed coastal areas. These possible
reasons for a low-priority focus on coastal-hazards management were expanded upon to identify
perceived risk of coastal hazards as low by the public, key management staff, and councillors. Some
regional council interview participants expressed frustration at experiencing limited capacity to
complete important coastal-hazards management functions under the RPS.
33
Working in silos has prevented integrated coastal-hazards management
Managing coastal hazards requires an integrated cross-disciplinary approach to address the multi-
disciplinary and cross-boundary nature of coastal-hazards management. Participants expressed
difficulties in terms of achieving comprehensive or consistent coastal-hazards management due to
the prevalence of silos operating within council organisations. Lack of integration of coastal-hazards
management across areas, vertically and horizontally within councils, was identified as a key limiting
factor to achieving comprehensive coastal-hazards management for the region.
Some interview participants reported lack of clarity regarding the roles and responsibilities of
Auckland regional and territorial authorities in relation to coastal-hazards management. Coastal-
hazards management is the joint responsibility of regional and district councils under the RMA. The
RMA does not make clear distinctions between the roles of regional and territorial authorities in
their similar and sometimes overlapping responsibilities to avoid or mitigate coastal hazards and the
effects of response options on the environment. However, the RMA provides for the RPS to give
high-level planning direction to this effect, and the RPS must be implemented by both regional and
district councils.
The Auckland RPS Proposed Plan Change 10, notified in 2005, aimed to define more clearly the
distinct roles of the regional and territorial authorities in this area. However Plan Change 10 only
became operative at the end of October 2010, several days before the establishment of the new
Auckland Council. How this more clearly defined natural-hazards management approach is to be
adopted, modified, and carried out under the new governance structure of the Auckland Council is
yet to be seen.
Organisational restructuring and turnover can result in shifting approaches and loss of knowledge
ACC and ARC developed an integrated coastal management strategy for the eastern bays area
(including Mission Bay / Kohimarama) in the mid-1990s (Auckland City Council, 1999). This non-
statutory management strategy comprehensively detailed the various issues for the area in an
integrated manner, as well as establishing strategies for achieving community goals and council
responsibilities. An ACC adviser reported that, although some of the strategies within the document
were taken up and funded by various operational arms of ACC, the approach outlined by the
strategy now appears to be overlooked and operational arms of council have reverted to working in
‘silos’. No known monitoring or review of the strategy has taken place since it was published in 1999.
This lack of follow-through or a consistent approach was characterised as being commonplace and
typically caused by council leadership changes, staff turnover, and / or organisational restructuring.
Leadership and higher-level support for the Eastern Bays Coastal Management Strategy was a key
enabler for developing the strategy. However, since its completion council teams have been
restructured, leadership has changed, and employees have moved on. Subsequently, other issues
have been given priority and this comprehensive strategy and the process for its achievement has
essentially been lost.
34
4.2 Preparing for sea-level rise
Coastal-hazards management presents significant challenges to local government and communities,
as discussed above. Sea-level rise adds a further dimension to the challenges of coastal-hazards
management that had yet to be fully addressed by councils in the Auckland region before council
amalgamation. The legislative amendment introducing consideration of the effects of climate change
as a local government responsibility in 2004, together with general increased attention to the issue
of sea-level rise, has seen coastal hazards take on greater significance for council natural-hazards
staff. However, the interviews carried our in this study suggest that sea-level rise response was seen
as being in its very early stages in the Auckland region and involved significant barriers to
progression. This study assessed how consideration of sea-level rise is being incorporated into the
participating councils’ activities by investigating:
use of and views on MfE’s national guidance (Ministry for the Environment, 2009) on incorporating sea-level rise into coastal-hazards management
research and policy relating to sea-level rise
perceived issues and barriers to incorporating sea-level rise into coastal-hazards management, and opportunities to improve adaptive response to projected sea-level rise.
4.2.1 Ministry for the Environment guidance on sea-level rise for local government
MfE first published guidance on sea-level rise for local government in 2004. This information was
updated in 2008 (Ministry for the Environment, 2008; Ministry for the Environment, 2009). The MfE
guidance focuses on coastal-hazards management, recommends and outlines the use of a risk-
management approach for decision making in response to increased coastal hazard risk, and
recommends projections of sea level for use in coastal-hazards assessment. The MfE guidance has
been used widely to begin incorporating consideration of sea-level rise effects into council long-term
planning, but several issues emerged from discussion of the guidance with participants.
Several participants expressed a lack of trust in information from MfE—those participants were
resistant to using the MfE guidance to guide work in this area, or to trust the outcomes of applying
the guidance for coastal-hazards management. Misinterpretation of the guidance was also an issue.
One participant felt that the guidance recommended a national blanket approach to considering sea-
level rise and to developing coastal policy, as opposed to conducting regional and local assessments,
and developing local policy based on these. This misinterprets the guidance, which allows
organisations to set the parameters of the risk assessment being undertaken, and places emphasis
on the local nature of sea-level rise impacts. Finally, positive responses were narrowly focused upon
participants’ (or organisations’) use of the report’s sea-level rise projections, and not the overall
approach suggested by the guidance. In some cases, only the lower-level projection had been
adopted, without consideration of the higher-level projection included in the guidance document.
This presents a significant potential for maladaptive planning, if higher levels and faster rates of sea-
level rise continue not to be considered.
35
4.2.2 Research and planning responses at Auckland councils
Auckland’s regional planning documents do not provide detailed guidance on sea-level rise. ARC was
in the process of developing specific guidance for district councils on sea-level rise in its review of
the RSP. Specific sea-level rise figures were to be included, based upon the MfE guidance. The
review process was stopped before completion as a result of the council amalgamation and this
work was passed onto the new Auckland Council. The RPS review and update of information and
guidance on sea-level rise was positioned to provide support to district councils on sea-level rise and
coastal-hazards management.
To meet legislative requirements regarding climate change, and because of concerns regarding sea-
level rise, councils assessed in this study have been commissioning research to assess the effects of
sea-level rise (and other climate change effects) on coastal hazards over century-scale timeframes
(e.g. the next 50–140 years). The aim of this work has been that knowledge generated can be the
basis for evidence-based decision making for long-term planning by council. This section reviews
studies that were completed by ARC, ACC, and MCC. This review was limited to councils officially
participating in this study, although Rodney District Council and North Shore City Council
commissioned similar studies.
ARC completed a regional assessment of likely sea-level rise to 2100 but used projections that underestimated sea-level rise
In 2010, ARC commissioned a technical study (Hannah, et al., 2011) to assess the most likely regional
rate of mean sea-level rise for the twenty-first century. Conflict over what sea-level rise to plan for is
a key issue for sea-level rise adaptation, discussed below. The findings of Hannah et al. (2011)
provide an evidence base for selecting a regional rate of sea-level rise that could underpin impacts
assessment and planning decisions, in the absence of statutory guidance. However, Hannah et al.
(2011) under-emphasise important components in sea-level rise projections such as the effect of
dynamic ice-sheet melt (Nicholls & Cazenave, 2010; Church, et al., 2008; Vermeer & Rahmstorf,
2009).
Hannah et al. (2011) conclude that the MfE guidance provides an adequate mean sea-level rise rate
(0.5–0.8m by 2100) for the Auckland region based on the Auckland long-term tide gauge record, the
short term (10 year) digital sea level record, Holocene period sea-level data, and projections of
future sea-level rise. Hannah et al. argue that, based on sea levels for the Auckland region derived
from geological records, a low-probability upper limit of sea-level rise for next 90 years is no more
than 0.8m. This demonstrates that New Zealand is not adopting the latest international science on
sea-level rise, which shows that the potential for sea-level rise to 2100 is much higher than this
(Meehl, et al., 2007). Recent studies from the international scientific community emphasise that
global mean sea-level rise of 1.5–2.0m by 2100, based on recent observations of ice-sheet melt and
the potential for dynamic ice-sheet melt over the twenty-first century, cannot be ruled out.
Furthermore, the practice of setting an ‘upper limit’ for sea-level rise to 2100 also perpetuates the
current static approach to coastal risk, which underestimates the higher end of the range of
projections, and increasing rates of change. This approach also indicates that the uncertain nature of
sea-level rise and the dynamic nature of coastal risk over the coming century are not being
communicated fully to decision makers. Risk-based decision making and proactive adaptation will
continue to be limited as long as decision makers are not made fully aware of the potential for
dynamic and ongoing change in coastal risk due to sea-level rise and other climate change effects.
36
ARC did not comprehensively investigate the potential regional effects of climate change and sea-level rise on coastal hazards
Significant gaps exist in the current knowledge regarding the potential effect of sea-level rise on
coastal hazards for the Auckland region. A regional study assessing potential coastal erosion over the
twenty-first century was completed in 2006 (Reinan-Hamill, et al., 2009). The study includes the
potential effect of a linear rate of sea-level rise of 0.5m by 2100 on beach erosion rates, based on
the Bruun Rule12 (Bruun, 1988). The study does not consider the potential for more rapid rates of
sea-level rise, the continued effect of sea-level rise beyond 2100, or other climate change effects on
erosion (i.e. increased frequency and intensity of storm events).
ACC and MCC commissioned NIWA to investigate sea-level rise along their jurisdictional coasts
The former ACC and MCC both commissioned the NIWA to investigate the effects of sea-level rise on
mean and extreme sea levels along each council’s jurisdictional coast (Ramsay, et al., 2008a;
Ramsay, et al., 2008b). Sea-level rise scenarios were developed based on MfE guidance on sea-level
rise (Ministry for the Environment, 2009). However, the two studies used different approaches to
assess sea-level rise. ACC assessed ranges of sea-level rise for each of three future time periods:
0.18–0.27m (2050s), 0.47–0.81m (2100s), and 0.97–1.31m (2150s). MCC assessed sea-level rise of
0.33m to the 2050s, and 0.66m to the 2080s.
In response to Ramsay et al.’s (2008a) findings, the former ACC was advised that no immediate
action was required due to current storm surge risk being adequately accounted for through ACC’s
information systems, which identified properties at risk of stormwater flooding, and required
minimum freeboard within those areas. Therefore, it was noted that the new Auckland Council
would be best positioned to plan for sea-level rise and other climate change effects at the coast,
which would need to include a strategic consideration of if, when, and where retreat options would
be adopted (Craig, 2010).
Recommendations have not been implemented yet due to the reorganisation of Auckland councils
Based on Ramsay et al.’s (2008b) findings, the former MCC was advised to manage increasing coastal
inundation risk through EQS minimum site levels set in the district plan. To ensure that building site
levels were above the 1 percent AEP water level with 0.66m sea-level rise, its was recommended
that minimum site levels be adjusted up by several tens of centimetres. The adjustment was not
adopted because of the Auckland Council amalgamation process. The new Auckland Council was
considered the most appropriate body to make changes in response to the new information
regarding sea-level rise and coastal hazards. Participants from both councils noted that the results of
the reports (indication of areas potentially at risk of coastal inundation in the future) should be
already being applied in the resource-consent process. However, how they would be applied is
unclear, without guidance for interpreting the results of the studies being available to consenting
officers and decision makers. Further to this, the consenting process does not generally apply to
existing settlements, except where significant changes to existing uses are proposed.
12 The ‘Bruun Rule’: an empirical model that provides a formula for estimating shoreline erosion for a given rise in sea level. The rule suggests that for a given rise in sea level there is a corresponding landward and upward movement of the coastline (Reinan-Hamill, R., et al., 2009).
37
The assessments were developed as the basis for long-term council planning, but recommendations
derived from the study’s findings did not acknowledge and create a ‘buffer’ for some important
components not assessed in the studies. For example, wave action, and the combined effect of
coastal erosion, groundwater level change, and storm water flooding. Likewise, neither council
considered sea-level rise of more than 0.8m by 2100. MCC did not consider continued sea-level rise
beyond the 2080s.
Participants from the former MCC asserted that current flood-risk management approaches
(minimum site and freeboard levels) would be adequate for managing increased coastal inundation
risk. However, the Council did not assess the socio-economic or health impacts of flooding; or any
comparative study of the implications of responses. For example, using adjusted EQS minimum site
levels alone relies heavily on property redevelopment cycles to affect flood protection of existing
buildings. This may leave a significant number of properties unprepared for increased coastal-
inundation risk in the future. This approach also makes no effort to limit development in coastal-
hazard areas, which, in the Auckland context, is likely to lead to increasing numbers (and value) of
properties at risk of erosion and inundation. In addition, there is increased risk to coastal and
intertidal ecosystems as their landward migration is constrained by impermeable human structures
(coastal squeeze).
Response to the inundation studies was sensitive within the councils
Response to the above inundation studies was sensitive within both councils. Reluctance to make
the information publicly available was reported by interview participants. The reports are publicly
available on request, but have not been widely acknowledged or accessed. ARC staff reported not
being able to obtain a copy of the ACC report 3 years on from its completion.
Interview participants identified at least three implications of the experienced sensitivity around
new information about changing inundation risk.
1. Some perceived inundation mapping to be emotive and controversial.
2. For this reason, information such as changing flood risk affecting private property needs to be carefully managed.
3. A serious plan to manage the release of new information such as this, and to use it to begin a conversation with potentially affected communities, had not been initiated at the time the interviews took place.
Coastal-hazards assessments at the study sites did not consider sea-level rise
Studies assessing coastal hazards and protection response options at Mission Bay / Kohimarama and
Kawakawa Bay did not directly assess the potential impacts of sea-level rise on coastal hazards.
However, sea-level rise was noted as an important factor that will require consideration in the
future, and is likely to mean that the current works will only provide a short-term response to
coastal hazards (Tonkin & Taylor Ltd, 2007).
38
4.2.3 Timeframes and planning horizons
Regional and district plans are essentially long-term resource management tools that are reviewed
and updated once every 10 years. Assessments of coastal-erosion hazards typically employ a 100-
year time horizon, within which the progression of coastal change is predicted. Regional and district
policies and rules in an operative plan may then take into account coastal change over a 100-year
time horizon, and make restrictions or allowances for land use (or other) accordingly. Financial
planning is implemented through 1-year operational plans, although these must be based on longer-
term financial planning. Councils complete long-term planning for a 10-year timeframe through the
long-term plan process. Councils also use long-term asset management plans over long time periods
(e.g. 60 years). There are thus opportunities for coastal change to be managed effectively using the
range of tools and processes already employed by the Auckland Council, as long as the Council
continues to incorporate evidence from new studies and new scientific information as it changes
over time, and as long as it looks forward to rates of projected sea-level rise, and the interaction of
sea-level rise with other phenomena such as increased storm severity.
4.2.4 Incorporating sea-level rise into coastal-hazards management: Barriers and opportunities
Participants identified a number of issues and barriers that limited response to sea-level rise and
increased coastal-hazards risk. In the first instance, the issues that already exist for coastal-hazards
management have impacted on the capacity of councils to incorporate sea-level rise.
These include:
coastal hazards being a low-priority issue
lack of leadership
limited resource allocation
information gaps
development pressures
existing use rights under the RMA makes district council officers feel powerless to plan for changes to land use that reflects the risk to these properties.(implementation gaps between policy and the resource consenting level
the political nature of responses when property is affected by a coastal hazard
tensions between regional and district responsibilities, roles, and relationships—with lack of coordination and integration being identified as key issues.
Further to this, participants discussed barriers and opportunities specific to incorporating sea-level
rise into coastal-hazards management practices, outlined below.
The focus is on climate change mitigation not adaptation
Climate change response has to date focused on efforts to reduce greenhouse gases (mitigation),
and not on adaptation. Although a co-benefit of any mitigation efforts will be the reduced need for
adaptation, especially if greenhouse gas emissions reductions are achieved globally, this lack of focus
on adaptation has left a gap in the area of developing and understanding adaptation responses.
39
The long timeframes involved make it difficult to maintain issue saliency
The impacts of worsening coastal erosion and inundation are expected to occur decades from now.
This long timeframe acts as a disincentive for advancing potentially unpopular policy or expenditure
to prepare for sea-level rise. Long timeframes can also act to validate prioritising attention and
expenditure on more pressing near-term issues.
There are differing levels of acceptance and prioritisation of sea-level rise as an issue
All participants personally believed that sea-level rise is happening, and agreed that adaptation to
sea-level rise is an important issue for local government attention. However, participants reported
that climate change science, including sea-level rise, is not always accepted with high levels of
confidence at upper levels within councils and this presents an ongoing barrier to progress on
adaptation. It was highlighted that it may only be one or two councillors (or managers within an
organisation) who hold these views, but this opposition to accepting the reality of climate change
can reduce the priority given to adaptation. For example, one participant explained how in a recent
district plan review the explicit mention of sea-level rise was removed by decision makers from draft
new rules to limit development at the coast in anticipation of sea-level rise effects.
This was reported as not uncommon when it comes to climate change issues. Another participant
explained that discussing climate change adaptation is avoided in their team. They noted a
preference for framing issues and responses in ways that do not engage directly in climate change
and climate adaptation language, as this can be more acceptable to decision makers (who may be
opposed to engaging on climate change issues). This can work because many climate change issues
already arise in other areas, such as coastal-hazards management, meaning that explicit reference to
‘climate change’ may not need to be engaged in to achieve results with the aim of reducing climate
change impacts in the future.
Even though all participants accepted the occurrence of sea-level rise, they gauged the relative
importance of the risks differently. Some felt that sea-level rise was one of the most important
climate change impacts for the Auckland region. Others viewed the risks as relatively small, far into
the future, and / or manageable with adjustment to current flood-risk measures. Some noted that
sea-level rise research is in competition with other issues and that managing it is not important
enough to warrant serious effort at this point in time.
Experts reported that public perceptions of coastal-hazards risk are low
Participants reported that public perceptions of coastal-hazards risk in the Auckland region are low
because coastal inundation is infrequent, rarely affects private property or damages buildings, and is
localised when it occurs. Recent coastal inundation around Auckland may have heightened
awareness of coastal-hazards risk, although the occurrence of damaging coastal events remains
infrequent and few people would ever have experienced damage to their property due to a coastal
storm event. Participants saw low perceptions of coastal-hazards risk (by the public and councillors)
as a barrier to introducing new coastal-hazards management practices. Some participants took the
view that because the perceived risk is low, members of the public or council will be unwilling to
accept changes to status quo coastal management. Interview participants emphasised the
importance of actual erosion or flooding events as drivers of action and change, noting that until
several significant damaging events occurred in the region it would be hard to progress policy that
might limit development.
40
There is debate over what level of sea-level rise to prepare for
There are large uncertainties regarding the rate at which sea level will rise this century and beyond.
This has led to considerable debate within local government over what level of sea-level rise to plan
for, and the call for a ‘best-estimate’ figure for sea-level rise has been made. The MfE guidance has
been prepared to guide councils through a process of risk management, identifying specific sea-level
rise values for every decade out to 2100, as well as advice for considering sea-level rise beyond 2100
for land uses and assets that will be long lived. However, because the guidance is not statutory,
interview participants expressed concerns that planning based on the MfE guidance may not stand
up to being contested in the Environment Court. The 2010 NZCPS (Department of Conservation,
2010) may change this perception. This statutory NPS gives quite specific guidance to councils on
how to consider sea-level rise, which, in addition to the MfE guidance, is an opportunity to consider
sea-level rise more specifically in plans. However, even if Auckland Council adopts a more
comprehensive approach to addressing sea-level rise based on the MfE guidance and the 2010
NZCPS, the issue of potentially faster rates of sea-level rise this century would still not have been
addressed, nor would the static risk-management approach have been expanded to include
changing risk over time or the potential for surprises.
Local government leaders have called on central government to produce a national environmental
standard (NES) specifically on sea-level rise. Although a draft was apparently produced to this effect
in 2009, further progress on a sea-level rise NES has stalled. Interview participants noted that
adaptation work at their councils has been hindered by uncertainties regarding sea-level rise
projections. Confronting decision makers with information that is uncertain as to timing and levels of
sea-level rise is perceived as providing no clear answers regarding change and consequently can
result in the issue being disregarded. In some cases decision makers have seen uncertainty as a
reason for inaction. There is also a lack of understanding that there is no ‘best estimate’ of sea-level
rise, and that one is unlikely to be predicted.
National-level leadership could strengthen local adaptation planning
Climate change mitigation, rather than adaptation, has been the main focus at central government
level. Resourcing of adaptation work is currently minimal at central government level. This appears
to have impacted upon the progress of local government in managing this relatively new and
complex set of issues. An opportunity exists to enable climate change adaptation at the regional and
local levels through national-level leadership. This could be achieved a number of ways, including a
climate adaptation strategy and research agenda, a NES framing sea-level rise and coastal
management, and more specific guidance on the dynamic and ongoing nature of coastal risks and
the need for long-term adaptive management approaches.
There are leadership, strategic planning, and integration opportunities for the new Auckland Council
The council amalgamation process emerged in this study as a limiting factor, as multiple work
streams on sea-level rise management discussed in this study were put off by the Auckland councils
in anticipation of amalgamation. How work in this area is to be continued under the new Council and
governance structure was unknown, but the view of participants was generally that the new
Auckland Council could not afford to ignore this issue and would need to make decisions regarding
response to the latest sea-level rise projections and increasing coastal-hazards risk.
41
Leadership and support for adaptation to sea-level rise is required at a political level to progress
proactive responses: to fill knowledge gaps, develop policy and response options, and to engage in
participatory decision-making processes in affected areas. However, leadership to drive sea-level rise
adaptation was identified as lacking within the Auckland councils that participated. Some
participants noted that a strategic approach from a management level is required to overcome some
of the identified barriers to progressing coastal adaptation.
Auckland Council is a unitary authority with joint regional and district council roles and
responsibilities, and is developing a 30-year spatial plan and unitary plan for the region. These long-
term planning documents offer a significant opportunity to develop specific objectives, policies, and
rules regarding sea-level rise and coastal change for the Auckland region that have not previously
been developed for much of the region. It has been shown in a number of case studies that to do
this successfully through the planning process requires high-quality coastal-hazards mapping and a
participatory community decision-making process. It seems unlikely that Auckland Council will
achieve either of these, given the short timeframes allowed for the development of the present
round of spatial and unitary plans (1 and 2 years respectively). However, the Auckland Council’s
spatial and unitary plans could include providing for the separate development of a strategic
Auckland region climate change adaptation strategy, which could provide the regional leadership
called for by participants in this study. A risk with a separate adaptation strategy is that it may not be
sufficiently integrated with other aspects of planning, such as land use and transport infrastructure
planning. However, a key purpose of such an approach would be to resource adaptation planning,
which could then be integrated into the spatial and unitary plans through reviews processes, but of
course this would require ongoing political support and follow-through.
Shift the focus from reactive coastal-hazards management to integrated coastal-zone management
Currently the focus is on reactively managing coastal hazards affecting existing property. A balance
will need to be struck between protecting private property and maintaining natural and social
(amenity etc.) values at the coast. It is clear that the balance can end up favouring private property
needs at the expense of the natural coastal system or long-term community interests. A shift of
focus from coastal hazards being a private property protection issue to being a coastal systems and
sustainable-management issue could better enable proactive adaptation to coastal change. This
approach is already implicit within the legislation (e.g. the RMA and Local Government Act), but does
not appear to have gained acceptance from individual private property owners in many instances, as
reported by interview participants.
The new Auckland Council coastal land and water team could provide the framework for integrating
coastal-hazards management into a comprehensive coastal management approach. Coastal issues
and management differ in some respects from other areas of natural-hazard management in that
erosion and inundation are typically geographically limited and, compared to other natural hazards
such as earthquakes, can—to some degree—be estimated. However, as with other natural hazards,
managing coastal hazards involves a complex nexus of social, environmental, and economic trade-
offs relating to private property. Introducing sea-level rise further differentiates coastal hazards from
some other major natural hazards (e.g. earthquakes and volcanoes) as coastal-hazards risk is
progressively increasing over time. Incorporating this dynamic view of coastal hazards management
into integrated coastal zone management (ICZM) for the Auckland region could provide an
42
important means to identifying these developing issues and engaging in a public conversation on
sea-level rise response options.
4.3 Adaptation response options at the study sites
Participants were asked a series of questions regarding the implications of, and potential for,
response options at the study sites. One percent AEP static inundation maps (Appendix 4) were
shown to the participants, and coastal-hazard issues and management-response options at the study
sites were discussed to set the context for this section of the interview.
Participants in this study viewed council involvement in adaptation for existing settlements as
particularly complex, including interactions and conflicts between high-value properties, public
expectations, risk perception, property rights beliefs, and environmental risks. Most of the interview
participants felt that coastal protection and accommodation measures would offer the most
practicable, acceptable options to respond to increasing coastal hazards in the future. Managed
retreat was seen as a prohibitively expensive and unpopular response, making it untenable at highly
developed high-value settlements. Most participants also felt that retreat could potentially be
achievable at smaller, low-value settlements.
Participants emphasised the importance of the new Auckland Council in:
developing and disseminating information on changing coastal risk
ensuring that further development in areas susceptible to coastal hazards is minimised
educating private property owners regarding the joint responsibility of property owners and the Council for adaptive response at existing sites
using a participatory process for decision making in response to coastal hazards for existing settlements.
4.3.1 Limits to current measures for managing coastal hazards
For both study sites, most participants felt that for changing coastal inundation risk up to 0.5m sea-
level rise, the current approach and / or relatively small scale, incremental adjustments to current
structural protection and accommodation measures would adequately manage risks, in combination
with emergency planning and private insurance. Some interview participants raised the issue of
changing insurability for coastal property and a number of views were expressed regarding this
issue. One view was that insurance companies would continue to insure properties, but with higher
premiums, and that properties may become uninsurable. The issue of insuring coastal properties
needs to be considered in decision making for adaptation assessment and development. However,
little information is currently available in New Zealand on how insurability may change with climate
change.
The change in inundation risk from a 1.0m sea-level rise or more was expected to require a
significant shift in response. Many participants identified the existence of a threshold somewhere
between 0.5–1.0m of sea-level rise, where the response approach would need to shift dramatically.
These responses were based on the participants’ judgements of inundation maps shown in the
interviews.
Richard Reinan-Hamill (Senior Coastal Engineer, Tonkin & Taylor) anticipated that structural coastal
protection works would be able to protect coastal settlements, and in particular the two study sites,
43
with substantial rises in sea level (e.g. the scenarios discussed in the interviews went up to 2m sea-
level rise and corresponding change to static inundation extent during a 1 percent AEP storm).
Reinan-Hamill referred to the Netherlands, where land as much as 3m below sea level is protected
from inundation to a 1000-year event standard, as an example of the technological and physical
ability to engineer the coast against erosion and inundation. Reinan-Hamill estimated that any
technological or physical limits to coastal protection would be very far off in the future (i.e. not this
century). From this it can be inferred that economic and social limits are more likely to be met
before any physical limits to coastal engineering and individual flood protection (and
accommodation) works are reached. For example, several participants noted that high sea walls or
houses on stilts might be unacceptable to some people, perhaps due to a perceived negative change
to visual amenity.
4.3.2 Mission Bay / Kohimarama
Participants considered that Auckland Council would be likely to continue protecting Tamaki Drive
from erosion by maintaining and adjusting (raising) the current sea wall and renourishing beaches.
Reasons given for this included the high value of Council-owned assets along this coastline, the
area’s high amenity value for the Auckland region, the high value of development in the area, that
Mission Bay / Kohimarama is home to some of Auckland’s wealthiest and most powerful residents,
Council aversion to loss of rating income under a retreat strategy, and a general aversion to
attempting retreat in this area. It was widely assumed that the cost-benefit analysis for response
options at Mission Bay / Kohimarama would weigh in favour of protection or accommodation works.
Erosion beyond the current sea wall is not expected to affect Mission Bay / Kohimarama because it is
expected that the current coastline will be maintained. In the absence of maintaining the current
coastline, erosion could occur at Mission Bay / Kohimarama once the Tamaki Drive sea wall is being
regularly overtopped at high tide and during storms.
A number of issues and concerns were raised relating to coastal protection for this coastal area.
These included: the equity issues around general rates paying for engineered protection for a small
number of (wealthy) coastal residents, safety issues around major storm events overtopping sea
walls and causing severe damage, the financial costs of coastal protection for council, and the
environmental implications of further structural coastal protection.
A variety of response measures were seen as feasible
Various strategies to deal with the above issues were considered plausible. Targeted rating attached
to flood-prone properties was suggested, to direct the costs of protection to those who are being
protected. Targeted rates are just one example of a funding mechanism to enable an adaptive
response and it was considered that further research into the specifics of financial tools for response
options is needed. Flood-protection measures, such as pumping stations, were widely seen as being
required if the Tamaki Drive sea wall was to be progressively raised.
In light of the negative associations now held about structural coastal engineering, suggestions were
made regarding non-structural coastal protection works and accommodation measures being used
at Kohimarama / Mission Bay. Beach renourishment, dune restoration, and individual flood-
protection measures were all seen as viable options for the area. However, concerns were raised
about the costs of recontouring the land and of how individuals might afford the additional costs of
flood proofing their homes.
44
Some felt that adjusting the sea wall would not be acceptable to Auckland Council or the public, due
to reasons like the degradation of environmental values that may result from this approach, or the
high cost of ongoing protection works. In these cases, accommodation responses were seen as the
most appropriate response option. Accommodation measures to protect individual property, such as
raising minimum site and freeboard levels, floodable basements, creating additional water storage
areas, and redirecting traffic during flood events were all viewed as appropriate and achievable
responses that would adequately protect against increased inundation risk due to sea-level rise.
Retreat at Mission Bay / Kohimarama was not considered economically feasible
Retreat at Mission Bay / Kohimarama was not considered as economically feasible due to the very
high value of coastal property in this area and due to perceived community resistance to this
response approach. It was widely considered that residents would live with (accept) the risk of
flooding, rather than leave their home, and would strongly resist any financial or psychological loss
that may result from a retreat response. Compensation for land abandoned was not considered
economically feasible for council, but even if compensation were available, it was felt that many
residents would continue to resist leaving their homes.
Ngāti Whātua involvement in decision making is important
Several participants noted the importance of this area to Ngāti Whātua (local iwi), particularly the
co-managed tribal land at Okahu Bay (adjacent to Mission Bay). No participants felt able to give
comment on issues for Ngāti Whātua relating to sea-level rise and coastal management in the area,
except Bernadette Papa (Ngāti Whātua ) who was asked to participate to specifically discuss issues
for Ngāti Whātua. Papa noted the importance of progress made towards positive environmental
outcomes for water quality and ecosystem health in Waitemata Harbour through the co-
management of Okahu Bay and involvement with ARC in coastal marine area (CMA) management.
Papa emphasised the importance of Ngāti Whātua participation in decision making for the coast in
response to sea-level rise. Papa expressed concern at the idea of the area undergoing any further
environmental degradation. The area has been modified to such a significant degree already, and
recent (slow and minimal) ecological restoration progress achieved through the efforts of Ngāti
Whātua would represent a significant loss to the iwi. However, conflict could emerge around this
issue as a burial ground sits close to the Okahu Bay coastline, which may result in protection being a
preferred option by some Ngāti Whātua leaders.
4.3.3 Kawakawa Bay
Coastal protection works were not considered economically feasible at Kawakawa Bay
In contrast to Mission Bay / Kohimarama, it was generally considered that coastal protection works
would not be economically feasible at Kawakawa Bay because of the low value and low density of
property at the settlement. This highlights the potential for bias in conclusions reached on the basis
of cost-benefit analysis alone, where lower-value areas show lower benefit to cost ratios (Cooper &
McKenna, 2008). Accommodation measures to protect dwellings from floodwaters were considered
the most likely response option. The role of council in enabling individual-scale accommodation
measures was considered (for both sites). The resource-management process was considered
onerous or ‘punishing’ for these types of alterations and the costs on individuals can be high.
45
Councils could look at removing potential barriers to individuals flood proofing their homes, such as
providing funding assistance for affected property owners to make alterations.
Retreat was considered to be more economically feasible at Kawakawa Bay
The comparatively low number of properties affected, and numerous areas of undeveloped land at
Kawakawa Bay, lend merit to considering a planned retreat approach. Even given these favourable
conditions, participants felt that there would be a lack of community acceptance for any retreat
scheme. However, the small size of the settlement and the potential for local land being made
available for relocation of property or new development for displaced residents were confirmed as
making retreat more readily envisaged in this area. The distance of Kawakawa Bay from central
Auckland (and its location outside the metropolitan urban limits) means that property values are
lower than in central suburbs. This implies a significantly lower potential economic loss to property
owners in this area, and concurrently a lower cost to the council for any compensation offered.
Issues concerning specific retreat implementation options were discussed with interview
participants and the results of this discussion are summarised in Appendix 2.
Retreat would require a long-term approach and a suite of responses to address relocation, compensation, and equity issues
Interview participants noted that, to achieve retreat, councils would need to employ a combination
of policies and measures. A suite of response options would be needed that address issues such as:
relocation to another site, a long-term approach to retreat if a large number of dwellings are
involved, and the potential for some financial assistance for those being relocated. Participants also
emphasised that a retreat decision would have to be supported by the affected property owners to
be implemented successfully. This is why both participatory decision making for voluntary retreat,
and strong national and regional direction are seen as fundamental to achieving a shift from the
coastal-hazards management status quo of structural coastal protection. The 2010 NZCPS
(Department of Conservation, 2010) provides clearer direction than the previous NZCPS (1994) for
councils regarding sea-level rise and coastal-hazards management, but does not include quantitative
ranges for planning for sea-level rise. However, there is statutory provision in the RMA for NES,
which could include such guidance.
Lower-income areas that do not have existing structural protection are vulnerable to inundation and will require assistance
The situation for Kawakawa Bay, described by participants, highlights the potential for inequitable
coastal-management outcomes occurring as coastal risk increases over the twenty-first century.
Coastal-hazards management responses are predominantly determined through cost-benefit
analysis of response options on a short-term time scale (with net benefit seen as avoided loss of
property today less costs of building protection today), with urgency proportional to the potential
property values concerned. Other economic considerations, such as difficult-to-quantify non-
economic values, and long-term costs and benefits, are rarely taken into account. Small, lower-socio-
economic status communities are less likely to be afforded public intervention for coastal-hazards
management. If Auckland Council decides not to protect its assets through structural or non-
structural coastal engineering at Kawakawa Bay, coastal residents will be left exposed to worsening
erosion and inundation of their properties over time. Some property owners in these areas may not
be able to afford flood-protection works, and could then lose the ability to insure their property as
46
sea levels rise and inundation becomes a certainty. This could leave lower socio-economic
households more vulnerable to sea-level rise and coastal hazards as local and central government
affords protection to high value assets and leave individuals in lower-value areas to fend for
themselves. Alternative responses need to be investigated and developed for areas not protected by
structural coastal engineering (structural and non-structural).
4.3.4 Existing use rights
Existing use rights are commonly identified as a barrier to attempting planned retreat from coastal
hazards. However, this assumes that the approach taken would be one of ‘compulsory’ retreat
without prior community buy-in. Participants in this study have identified the requirement of
community buy-in for any coastal-hazards management response. Any coastal-hazards management
approach will have to go through, at the very least, a public consultation process. For managed
retreat, a more involved participatory process has been advised. This implies that retreat would be
agreed to before the introduction of any specific rules by Council to require retreat. Experience with
retreat in the Auckland region (Atlas Commnications & Media Ltd., 2010) shows that if a
participatory planning approach is undertaken along with financial assistance, planned retreat can
be successfully implemented. Further to this, the RMA allows regional councils to expunge existing
use rights (compulsory) in response to natural-hazards risk.
4.3.5 Local infrastructure
In the case of any of the three key response approaches being followed, local infrastructure will
need to follow suit to ensure the success of the approach. This highlights the need for a strategic
approach to managing changing coastal risk. If resource consenting at the individual development
scale is relied upon, serious adverse social and environment effects could be incurred, that could
result in a maladaptive (Barnett & O'Neill, 2009) response incurring future costs through inflexibility.
4.3.6 Regional implications
There are a significant number of low-lying settlements in the Auckland region that will be affected
similarly to the two settlements considered in this study. Mission Bay / Kohimarama and Kawakawa
Bay represent contrasting situations for the Auckland region in terms of their proximity to the city
centre, population, and intensity and value of existing property development. The Auckland Council
is faced with a range of critical issues related to sea-level rise in different areas and for different
types of land uses across the region (e.g. the CBD, the international airport, Tamaki Scenic Drive,
culturally significant coastal sites, and regionally significant roads). These will pose competition for
resources with potential damage avoidance in existing residential areas. There will be limits to rates
increases to cover the many other pressing issues. This may mean that accommodation measures
will be preferred as an incremental approach. However, this would ignore the potential for
maladaptation, especially for assets and settlements that will be around beyond 2050 or 2100. Such
an approach could be viewed as short term and purely interim, thus longer term strategic planning
for response to sea-level rise will be required.
47
5 Conclusion This study presents site-specific results of the potential impacts of coastal inundation as sea-level
rises. It analyses adaptation opportunities and barriers for two coastal communities on the east
coast of New Zealand’s largest city, Auckland, and draws on the views of local government officers,
coastal issues consultants, and community members as critical stakeholders. The views expressed in
interviews with these stakeholders highlight that significant social and institutional barriers continue
to constrain responses to this emerging challenge. Limited options for managing sea-level rise are
seen within existing coastal-hazards management avenues. This suggests that wider perspectives
and alternative avenues need to be considered and developed. For example, a strategic regional
perspective; Māori, social justice, and equity-focused perspectives; and non-economic values
assessments could assist in reframing the needs for, and implications of, a range of response
options, and the values associated with specific areas.
Table 5 summarises the key findings of this study and relates them to the research questions
investigated. This study found that current coastal management at the participating councils is in the
early stages of taking sea-level rise effects into consideration, and that in most instances the use of
adjusted flood-mitigation measures (e.g. minimum site levels) is considered adequate by many
participants for protecting private property against hazard risk. However, guidance information
generated by participating councils has not taken into account the potential for high rates of sea-
level rise by 2100. When asked to consider the implications and responses required for higher sea-
level rise scenarios, opinions expressed during interviews in this study shifted considerably and more
substantial, costly, and controversial management responses were considered as being necessary.
Recent internationally published projections (e.g. Pfeffer, et al., 2008; Rahmstorf, 2007) indicate that
the rate of sea-level rise could increase dramatically in the second half of the twenty-first century.
This means that responses could be required much more rapidly in the future, if proactive responses
are delayed. This could have significant structural and economic implications for future generations.
5.1.1 Planning under uncertainty
Uncertainty surrounding sea-level rise projections, climate change scepticism, the low priority of
coastal hazards, and the perceived unpopular nature of sea-level rise information and adaptation
options have favoured responding to near-term development pressures rather than attempting
long-term thinking to manage Auckland’s coastal environment and development. Uncertainty
surrounding sea-level rise appears to particularly provoke ongoing debate within local authorities.
Some confusion appears to exist around the physical science basis, where uncertainties stem from,
that uncertainties are unlikely to be ‘resolved’; the interpretation and use of the MfE guidance on
sea-level rise and approaches for decision making under conditions of uncertainty. Numerous
scholarly works and practical examples of decision making and planning under conditions of
uncertainty exist. However, it seems unlikely that many of these issues will be resolved without
central government guidance, which was announced in the form of a forthcoming NES in early 2009,
but is yet to eventuate. However, the recent release of the updated NZCPS (Department of
Conservation, 2010) does provide some important direction, and could provide much of the national
guidance required if proactively implemented.
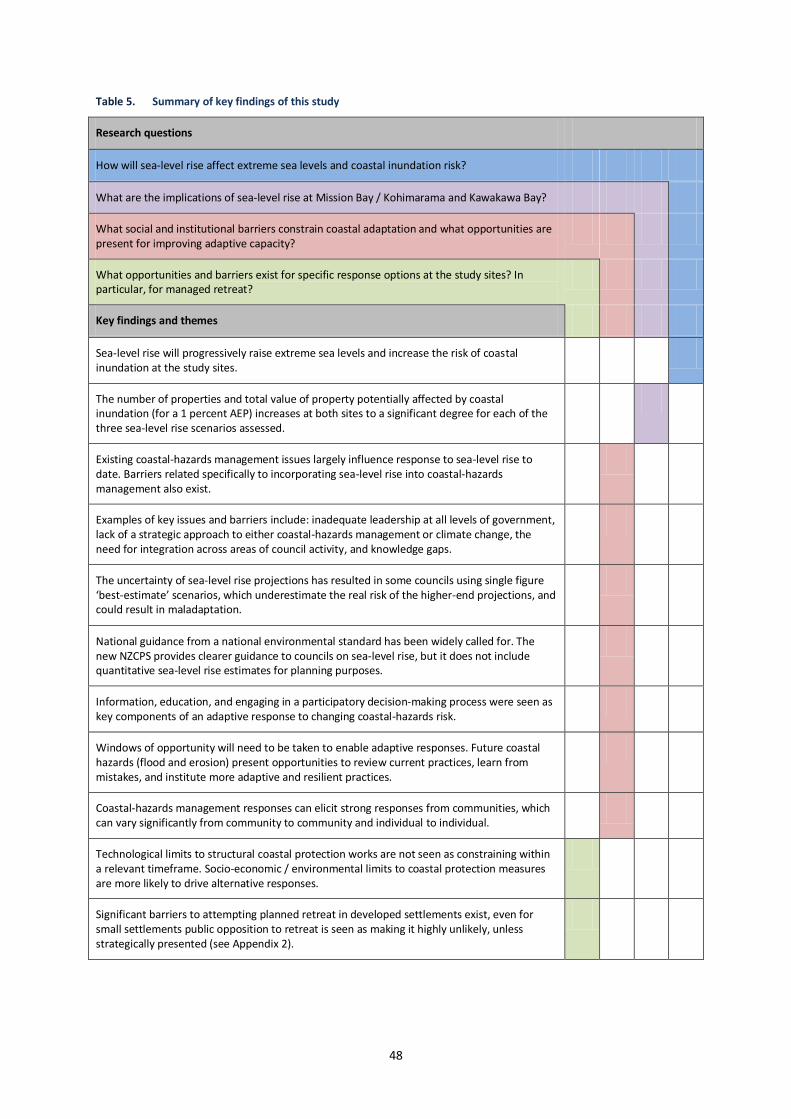
48
Table 5. Summary of key findings of this study
Research questions
How will sea-level rise affect extreme sea levels and coastal inundation risk?
What are the implications of sea-level rise at Mission Bay / Kohimarama and Kawakawa Bay?
What social and institutional barriers constrain coastal adaptation and what opportunities are present for improving adaptive capacity?
What opportunities and barriers exist for specific response options at the study sites? In particular, for managed retreat?
Key findings and themes
Sea-level rise will progressively raise extreme sea levels and increase the risk of coastal inundation at the study sites.
The number of properties and total value of property potentially affected by coastal inundation (for a 1 percent AEP) increases at both sites to a significant degree for each of the three sea-level rise scenarios assessed.
Existing coastal-hazards management issues largely influence response to sea-level rise to date. Barriers related specifically to incorporating sea-level rise into coastal-hazards management also exist.
Examples of key issues and barriers include: inadequate leadership at all levels of government, lack of a strategic approach to either coastal-hazards management or climate change, the need for integration across areas of council activity, and knowledge gaps.
The uncertainty of sea-level rise projections has resulted in some councils using single figure ‘best-estimate’ scenarios, which underestimate the real risk of the higher-end projections, and could result in maladaptation.
National guidance from a national environmental standard has been widely called for. The new NZCPS provides clearer guidance to councils on sea-level rise, but it does not include quantitative sea-level rise estimates for planning purposes.
Information, education, and engaging in a participatory decision-making process were seen as key components of an adaptive response to changing coastal-hazards risk.
Windows of opportunity will need to be taken to enable adaptive responses. Future coastal hazards (flood and erosion) present opportunities to review current practices, learn from mistakes, and institute more adaptive and resilient practices.
Coastal-hazards management responses can elicit strong responses from communities, which can vary significantly from community to community and individual to individual.
Technological limits to structural coastal protection works are not seen as constraining within a relevant timeframe. Socio-economic / environmental limits to coastal protection measures are more likely to drive alternative responses.
Significant barriers to attempting planned retreat in developed settlements exist, even for small settlements public opposition to retreat is seen as making it highly unlikely, unless strategically presented (see Appendix 2).
49
5.1.2 Considering sea-level rise in regional planning
It was found that ARC, ACC, and MCC generally acknowledged the serious implications that sea-level
rise may have for the region, and have begun to consider sea-level rise within council activities.
However, a number of issues were identified regarding this.
Existing coastal-hazards management issues are central to issues and barriers to preparing for coastal change due to climate change and sea-level rise.
Current understanding and research is limited. There has been limited assessment of the effects of sea-level rise and climate change. The Auckland region lacks comprehensive or integrated assessment. There has been no assessment of potential socio-economic impacts and no analysis of response options.
Issues specific to sea-level rise—such as its long-term progressive nature, uncertainty surrounding projections, and the inability to establish a ‘best estimate’—have not been adequately considered.
No comprehensive strategic approach, or process, has been established regionally or locally to prepare for projected coastal change or climate change more generally.
A process (such as the risk-management framework in the MfE guidance) has not yet been adopted. However, several natural-hazards guidance notes exist that recommend the same or similar risk-based management.
The issue of existing development had yet to be addressed.
5.1.3 Preparing for coastal change today
Participants in this study emphasised four key points relating to the response of local government in
preparing for coastal change today.
The importance of making coastal hazard information available to the public.
The importance of understanding and framing the issues for communicating and educating the public about the risks and response options.
The importance of local decision making for specific responses to coastal change for existing development (i.e. a participatory decision-making processes for existing development threatened by coastal hazards).
The importance of avoiding further coastal development and intensification of existing coastal development (avoiding further increase in numbers of properties that will be affected).
5.1.4 Costs of flooding and flood-protection measures
The costs of coastal engineering and flood-protection measures to avoid loss of land and damage to
property will continue to increase over time, and (if employed) would transform the Auckland
coastline into a highly modified, engineered, and high-risk coastal hazard area, even though coastal-
engineering protection aims to mitigate hazard risks. The risks of damage to property and loss of
human life associated with engineering and other flood-mitigation measures have been
demonstrated by catastrophic flooding in the Netherlands; and more recently in the United States,
particularly in New Orleans and along the Mississippi River; and in Queensland, Australia. The
impacts of flooding are well-recorded and not only damage property, but include lasting
psychological impacts, erosion of social capital, and loss of confidence in government.
50
5.1.5 Response options
No matter what response approach is adopted, participants emphasised the importance of a
strategic regional approach and community involvement in decision making. A regional approach to
estimating the costs of adapting to sea-level rise may also significantly modify benefit-to-cost ratios,
and in any case a static benefit-cost analysis approach is unlikely to be the most appropriate
decision-making tool for dynamic coastal-hazards management.
The need to consider managed retreat from the coast has been signalled in New Zealand through
the recently revised NZCPS (Department of Conservation, 2010). However, none of the councils that
participated in this study had considered retreat options before engaging in this study. Council
participants had limited knowledge of retreat concepts, options, and implementation, which limited
the breadth of discussions in this study. The regional implications of widespread impacts of
increasing coastal inundation indicate that public intervention to engineer the coast to protect both
public and private assets is unlikely to be feasible at all sites affected, and that alternatives to
‘protection’ need to be actively investigated by Auckland Council. Accommodation measures are
seen as a likely response. However, given the ongoing nature of sea-level rise it is likely that flood-
protection measures will eventually become ineffective. Retreat is likely to be needed in at least
some areas. This poses two significant issues: the first will be the equity issues involved in opting to
protect some areas and not others, especially if protected areas have high socio-economic status
and unprotected areas do not. The second will be the significant social barriers to planned retreat
responses. It is likely that these two issues will pose lesser barriers if the longer-term dynamics of
sea-level rise are better understood, and early consideration of options and their long-term merits, is
undertaken.
A top-down response from any council is likely to elicit strong resistance from local communities.
Adaptation strategies developed at the local scale with community buy-in are more likely to be
successful. This means that decisions about a process for developing an adaptive response and
investing in and starting that process are needed at the outset. Based on the input of participants,
the following requirements for an effective adaptation strategy are summarised below.
A regional strategic approach.
A physical and social scientific evidence base.
Identification of at-risk areas of all types (residential, commercial, rural, and natural ecological systems; including areas with exposed long-term public infrastructure such as bridges and coastal amenities) and their respective socio-economic vulnerability.
An initial analysis of response options for each affected area, with priority accorded to the most vulnerable areas;.
Council coordination and provision of information.
Local-scale community plan development and decision making.
Restriction of further development in ‘coastal change’ zones.
Planning approaches that signal dynamic coastal hazard risk for at-risk properties, assets and infrastructure.
Acknowledgement of the long-term nature of adaptation and strategies for ensuring that adaptation efforts are not short lived (i.e. follow-through).
51
Auckland Council has access to a range of New Zealand and Auckland-specific tools and guidance for
assessing coastal hazards over long time periods, including sea-level rise and other climate effects
(Auckland Regional Council, 2000; Auckland Local Authority Hazard Liaison Group, 2002; Ministry for
the Environment, 2008). Requirements to comprehensively prepare for increasing coastal-hazards
risk are well documented in the New Zealand and international literature (Dawe, 2008), and areas
more critically affected by coastal hazards (today) than Auckland offer important examples of the
process and potential pitfalls for coastal-hazards management in New Zealand (Blackett, et al.,
2010). Auckland Council has recently been in a process of establishment, but is now positioned as
the authority empowered to lead the Auckland region to prepare for adaptation to sea-level rise and
other climate change effects.

53
6 References Adger, N. (2003). Social capital, collective action, and adaptation to climate change. Economic Geography , 79 (4), 387-404.
Adger, N. (2006). Vulnerability. Global Environmental Change , 268-281.
Allen Consulting. (2005). Climate change risk and vulnerability: Promoting an efficient adaptation response in Australia. Australian Government, Department of Environment and Heritage. Canberra: The Australian Greenhouse Office.
Atlas Commnications & Media Ltd. (2010). Large-scale property purchase without recourse to cumpulsory purchase: A project Twin Streams case study. Wellington: Ministry for the Environment.
Auckland City Council. (1999). District Plan: Isthmus section. Auckland: Auckland City Council.
Auckland City Council. (1999). Eastern Bays coastal management strategy. Environmental Planning Division. Auckland: Auckland City Council.
Auckland Local Authority Hazard Liaison Group. (2002). Guidelines for hazard management. Auckland: Auckland Regional Council.
Auckland Regional Council. (1999b). Auckland Regional Plan: Coastal. Auckland: Auckland Regional Council.
Auckland Regional Council. (1999a). Auckland Regional Policy Statement. Auckland: Auckland Regional Council.
Auckland Regional Council. (2000). Coastal Hazard Strategy & Coastal Erosion Management Manual. Auckland Regional Council.
Auckland Regional Council. (2009). Natural Hazards and their impacts: Auckland Region. Auckland: Auckland Regional Council.
Auckland Regional Council. (2010). State of the Auckland region 2009: Our region, our future. Auckland Regional Council. Auckland: Auckland Regional Council.
AVISO. (2010). News: Ocean indicators: Mean Sea Level: Products & images. http://www.aviso.oceanobs.com.
Barnett, J., & O'Neill, S. (2009). Maladpatation. Global Environmental Change .
Beca Carter Hollings & Ferner Ltd. (2003). Kohimarama Beach seawall protection project: Coastal engineering report. Auckland City Council, Auckland.
Bindoff, N., Willebrand, J., Artale, V., Cazenave, A., Gregory, J., Gulev, S., et al. (2007). Observations: Oceanic climate change and sea level. In S. Solomon, D. Qin, M. Manning, Z. Chen, M. Marquis, K. B. Averyt, et al., Climate change 2007: The physical science basis. Contribution of Working Group I to the fourth assessment report of the Intergovernmental Panel on Climate Change. Cambridge, UK: Cambridge University Press.
Blackett, P., Hume, T., & Dahm, J. (2010). Exploring the social context of coastal erosion management in New Zealand: What factors drive particular environmental outcomes? The Australian Journal of Disaster and Trauma Studies , 1, NA.
Braun, V., & Clarke, V. (2006). Using thematic analysis in psychology. Qualtative Research in Psychology , 3, 77-101.
Bruun, P. (1988). The Bruun rule of erosion by sea-level rise: A discussion on large-scale and two- and three-dimensional usages. Journal of Costal Research , 4, 627-648.
54
Cayan, D., Tyree, M., Dettiger, M., Hidalgo, H., Das, T., Maurer, E., et al. (2009). Climate Change scenarios and sea level rise estimates for the California 2009 climate change scenarios assessment. California Climate Change Centre.
CCRI. (2008). Community Vulnerability, Resilience and Adaptation to Climate Change Research Proposal Application Report. Victoria University of Wellington, Climate Change Research Institute. Wellington: unpublished.
Church, J., White, N., Aarup, T., Wilson, W., Woodworth, P., Domingues, C., et al. (2008). Understanding global sea levels: Past, present and future. Sustainability Science , 3, 9-22.
Cooper, J., & McKenna, J. (2008). Social justice in coastal erosion management: The temporal and spatial dimensions. Geoforum , 39 (1), 294-306.
Craig, C. (2010). The effects of sea level rise in coastal environments. Auckland City Council.
Crampton, P., & Atkinson, J. (2007). NZDep2006 Index of Deprivation. Wellington: Department of Public Health University of Otago.
Cutter, S. (2008). A framework for measuring coastal hazard resilience in New Jersey communities. Urban Coast Institute.
Cutter, S. (1996). Vulnerability to environmental hazards. Progress in Human Geography , 20 (4), 529-539.
Dawe, I. (2008). Sea level rise: A New Zealand context. In P. (. Ranade, Melting glaciers and rising sea levels: Impacts and implications. ICFAI University Press.
Department of Conservation. (2010). New Zealand Coastal Policy Statement. Wellington: Department of Conservation.
Department of Conservation. (2010). New Zealand Coastal Policy Statement 2010. New Zealand Government, Department of Conservation. Wellington: Deparment of Conservation.
Dickinson, T. (2008). The compendium of adaptation models for climate change (1st Ed). Adaptation and Impacts Research Division. Environment Canada.
Domingues, C., Church, J., White, N., Gleckler, P., Wijffels, S., Barker, P., et al. (2008). Improved estimates of upper-ocean warming and multi-decadal sea-level rise. Nature , 453, 1090-1093.
Eriksen, S., & Kelly, P. (2007). Developing credible vulnerability indicators for adaptation policy assessment. Mitigation and Adaptation Strategies for Global Change , 12 (4), 495-524.
Hannah, J. (2004). An updated analysis of long-term sea level change in New Zealand. Geophysical Research Letters , 31.
Hannah, J., Bell, R., & Paulik, R. (2011). Auckland: A case study in the regional assessment of long-term sea level change. Proceedings of the FIG 34th General Assembly - Bridging the gap between cultures. Marrakech, Morocco, 18-20 May 2011.
Hinkel, J., & Klein, R. (2009). Integrating knowledge to assess coastal vulnerability to sea-level rise: The development of the DIVA tool. Global Environmental Change , 19, 384-395.
IPCC. (2007a). Climate Change 2007: Impacts, adaptation and vulnerability. Contribution of working group II to the fourth assessment report of the Intergovernmental Panel on Climate Change. (M. Parry, O. Canziani, J. Palutikof, P. van der Linden, & C. Hansen, Eds.) Campbridge. U.K.: Cambridge Univeristy Press.
IPCC. (2007b). Climate change 2007: Synthesis report: Summary for policy makers. Contribution of working groups I, II, and III to the fourth assessment report. Intergovernmental Panel on Climate Change.
55
IPCC. (1990). Climate Change: The IPCC Impacts Assessment. Intergovernmental Panel on Climate Change. Canberra: Australian Government Publishing Service.
IPCC CZMS. (1992a). A common methodology for assessing vulnerability to sea level rise (Appendix C IPCC CZMS 1990b). Intergovernmental Panel on Climate Change. The Hague , The Netherlands: Ministry of Transport, Public Works and Water Management.
IPCC CZMS. (1990). Strategies for adaptation to sea level rise. Report of the Coastal Zone Management Subgroup. Intergovernmental Panel on Climate Change.
Jevrejeva, S., Moore, J., & Grinsted, A. (2010). How will sea level respond to changes in natural and anthropogenic forcings by 2100? Geophysical Resource Letter , 37, L07703.
Manukau City Council. (2002). Manukau operative district plan 2002. Manukau City: Manukau City Council.
Meehl, G., Stocker, T. F., Collins, W. D., Friedlingstein, P., Gaye, A. T., Gregory, J. M., et al. (2007). Global Climate Projections. In S. Solomon, M. Manning, D. Qin, Z. Chen, M. Marquis, K. B. Averyt, et al., Climate Change 2007: The Physical Science Basis. Contribution of Working Group I to the Fourth Assessment report of the Intergovenrmental Panel on Climate Change (pp. 749-844). Cambridge, United Kingdom: Cambridge University Press.
Metzger, M., Leemans, R., & Schröter, D. (2005). A multidisciplinary multi-scale framework for assessing vulnerabilities to global change. International Journal of Applied Earth Observation and Geoinformation , 7 (4), 253-267.
MfE. (2008). Coastal hazards and climate change: A guidance manual for local government in New Zealand. Ministry for the Environment. Wellington: Ministry for the Environment.
Ministry for the Environment. (2008). Coastal hazards and climate change: A guidance manual for local government in New Zealand. Wellington: Ministry for the Environment.
Ministry for the Environment. (2009). Coastal hazards and climate change: A guidance manual for local government in New Zealand. Wellington: Ministry for the Environment.
Moser, S., & Ekstrom, J. (2010). A framework to diagnose barriers to climate change adaptation. Proceedings of the National Academy of Sciences , 107 (51), 22026-22031.
Nicholls, R. (1994). Synthesis of vulnerability analysis studies. Proceedings of World Coast '93. University of Maryland, Department of Geography. Rijkswaterstaat, The Netherlands: Coastal Zone Management Centre.
Nicholls, R., & Cazenave, A. (2010). Sea-level rise and its impact on coastal zones. Science , 328, 1517-1520.
Nicholls, R., Hanson, S. E., Lowe, J. A., Warrick, R. A., Lu, X., Long, A. J., et al. (in press). Constructing sea-level scenarios for impact and adaptation assessment of coastal areas: a guidance document. Intergovernmental Panel on Climate Change, Task Group on Data and Scenario Support for Impacts and Climate Analysis. Intergovernmental Panel on Climate Change.
Pfeffer, W., Harper, J., & O'Neel, S. (2008). Kinematic constraints on glacier contributions to 21st-century sea-level rise. Science , 25 (1), 19-25.
Preston, B., & Stafford-Smith, M. (2009). Framing vulnerability and adaptive capacity assessment: Discussion paper. CSIRO Climate Adaptation National Research Fliaghsip. Working Paper Numebr 2. Aspendale, Victoria, Australia: CSIRO Climate Adaptation Flagship.
Rahmstorf, S. (2007). A semi-empirical approach to projecting future sea-level rise. Science , 315, 368-370.
56
Riley Consultants Ltd. (2001). Kawakawa Bay Catchments: Comprehensive catchment discharge consent application. Prepared for Manukau City Council. Auckland: Manukau City Council.
Rohling, E., Grant, K., Hemleben, C., Siddall, M., HooGakker, B., Bolshaw, M., et al. (2008). High rates of sea-level rise during the last interglacial period. Nature geoscience , 1 (8), 38-42.
Rupp, S., & Nicholls, R. (2002). Managed realignment of coastal flood defences: A comparison between England and Germany. Flood hazard research centre. Enfield, United Kingdom: Flood Hazard Research Centre.
Smit, B., & Pilifosova, O. (2003). From adaptation to adaptive capacity and vulnerability reduction. In J. Smith, R. Klein, & S. Huq, Climate change, adaptive capacity and vulnerability (pp. 9-28). Imperial College Press.
Smit, B., & Wandel, J. (2006). Adaptation, adaptive capacity and vulnerability. Global Environmental Change , 16, 282-292.
Statistics New Zealand. (2010 йил 07-August). Census 2006 Meshblock dataset. Wellington, New Zealand: Statistics New Zealand.
Statistics New Zealand. (2010). Subnational population estimates as 30 June 2010. Wellington: Statistics New Zealand.
The Royal Society of New Zealand. (2010). Sea Level Rise: Emerging Issues. Wellington.
Titus, J., Anderson, K., Cahoon, D., Gesch, D., Gill, S., Gutierrez, B., et al. (2009). Coastal sensitivity to sea-level rise: A focus on the Mid-Atlantic region. U.S. Climate Change Science Program.
Tonkin & Taylor Ltd. (2007). Kawakawa Bay shoreline protection and enhancement assessment on environmental effects. Prepared for Manukau City Council, Auckland.
Tonkin & Taylor Ltd. (2003). Kawakawa Bay coastal erosion scoping study: Issues and options. Prepared for Manukau City Council, Auckland.
Turner II, B., Kasperson, R., Matson, P., McCarthy, J., Corell, R., Christensen, L., et al. (2003). A framework for vulnerability analysis in sustainability science. Proceedings of the National Academy of Sciences of the United States of America , 100 (14), 8074-8079.
Velicogna, I. (2009). Increasing rates of ice sheet mass loss from the Greenland and Antartic ice sheets revealed by GRACE. Geophysical Research Letters , 36, L19503.
Vermeer, M., & Rahmstorf, S. (2009). Global sea level linked to global temperature. Proceedings of the National Academy of Sciences , 106, 21527-21532.
Yohe, G., & Tol, R. (2002). Indicators for social and economic coping capacity: Moving toward a working definition of adaptive capacity. Global Environmental Change , 12 (1), 25-40.
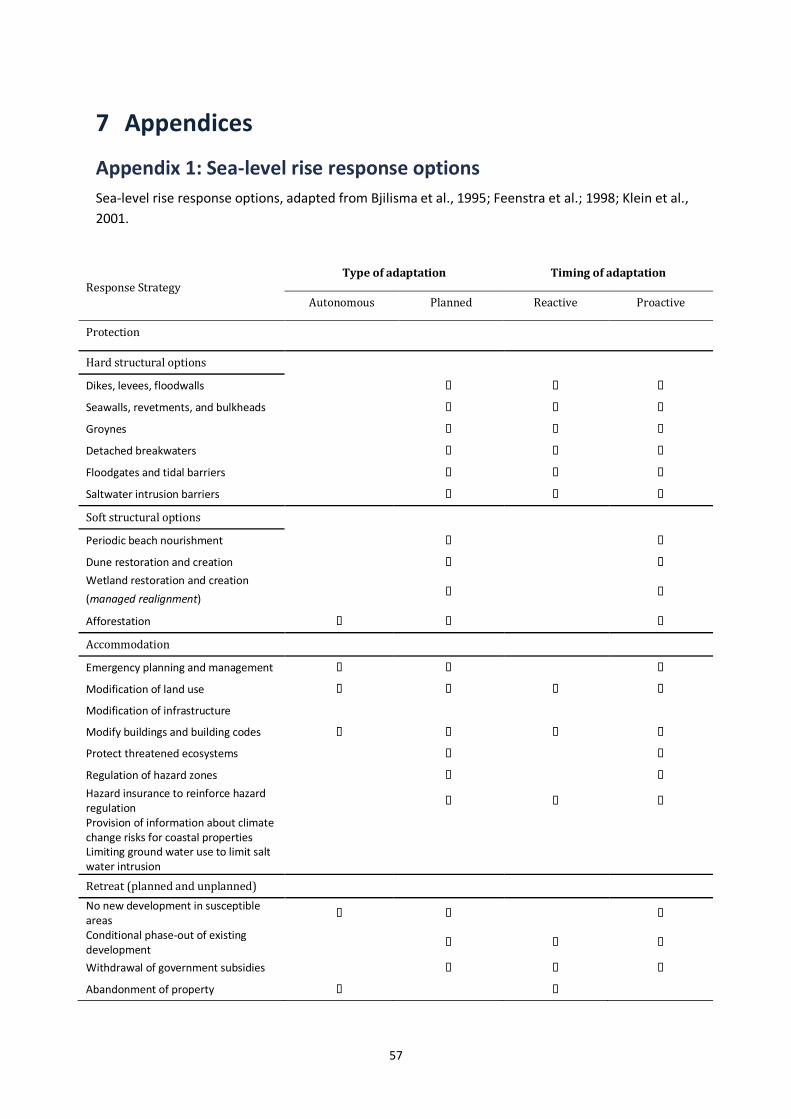
57
7 Appendices
Appendix 1: Sea-level rise response options
Sea-level rise response options, adapted from Bjilisma et al., 1995; Feenstra et al.; 1998; Klein et al.,
2001.
Response Strategy Type of adaptation Timing of adaptation
Autonomous Planned Reactive Proactive
Protection
Hard structural options
Dikes, levees, floodwalls � � �
Seawalls, revetments, and bulkheads � � �
Groynes � � �
Detached breakwaters � � �
Floodgates and tidal barriers � � �
Saltwater intrusion barriers � � �
Soft structural options
Periodic beach nourishment � �
Dune restoration and creation � �
Wetland restoration and creation
(managed realignment)
�
�
Afforestation � � �
Accommodation
Emergency planning and management � � �
Modification of land use � � � �
Modification of infrastructure
Modify buildings and building codes � � � �
Protect threatened ecosystems � �
Regulation of hazard zones � �
Hazard insurance to reinforce hazard regulation
� � �
Provision of information about climate change risks for coastal properties
Limiting ground water use to limit salt water intrusion
Retreat (planned and unplanned)
No new development in susceptible areas
� � �
Conditional phase-out of existing development
� � �
Withdrawal of government subsidies � � �
Abandonment of property � �

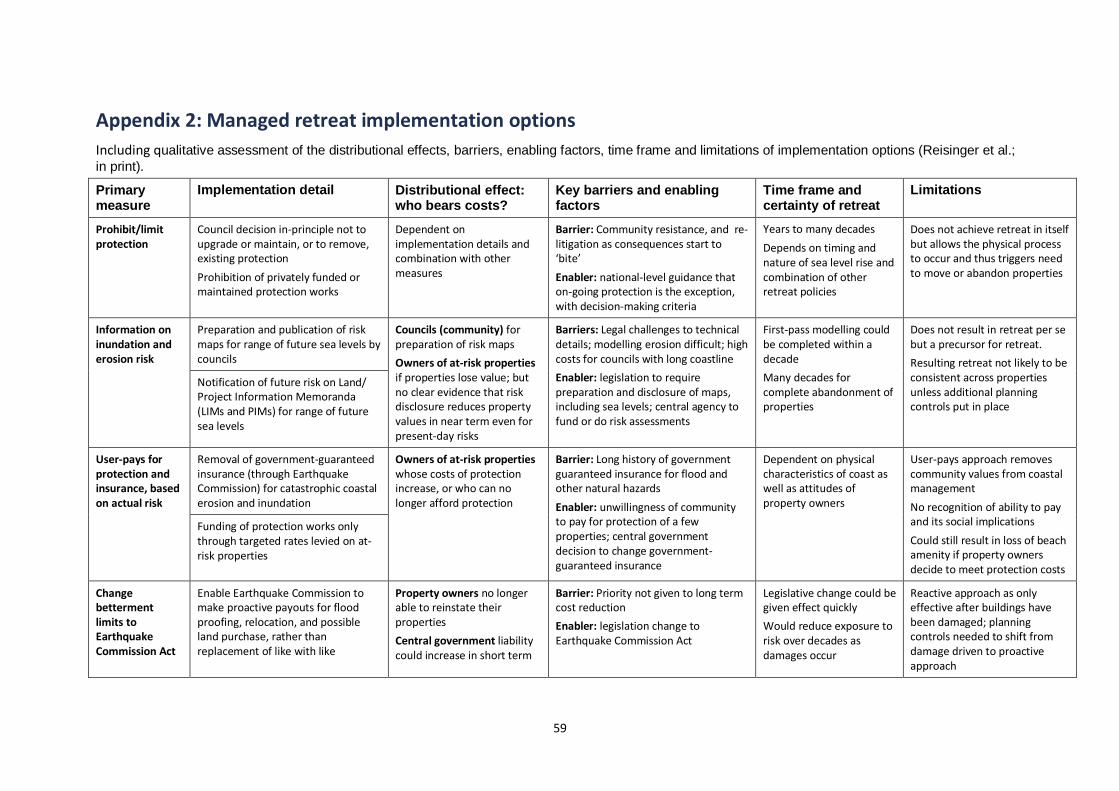
59
Appendix 2: Managed retreat implementation options
Including qualitative assessment of the distributional effects, barriers, enabling factors, time frame and limitations of implementation options (Reisinger et al.;
in print).
Primary measure
Implementation detail Distributional effect: who bears costs?
Key barriers and enabling factors
Time frame and certainty of retreat
Limitations
Prohibit/limit protection
Council decision in-principle not to upgrade or maintain, or to remove, existing protection
Prohibition of privately funded or maintained protection works
Dependent on implementation details and combination with other measures
Barrier: Community resistance, and re-litigation as consequences start to ‘bite’
Enabler: national-level guidance that on-going protection is the exception, with decision-making criteria
Years to many decades
Depends on timing and nature of sea level rise and combination of other retreat policies
Does not achieve retreat in itself but allows the physical process to occur and thus triggers need to move or abandon properties
Information on inundation and erosion risk
Preparation and publication of risk maps for range of future sea levels by councils
Councils (community) for preparation of risk maps
Owners of at-risk properties if properties lose value; but no clear evidence that risk disclosure reduces property values in near term even for present-day risks
Barriers: Legal challenges to technical details; modelling erosion difficult; high costs for councils with long coastline
Enabler: legislation to require preparation and disclosure of maps, including sea levels; central agency to fund or do risk assessments
First-pass modelling could be completed within a decade
Many decades for complete abandonment of properties
Does not result in retreat per se but a precursor for retreat.
Resulting retreat not likely to be consistent across properties unless additional planning controls put in place
Notification of future risk on Land/ Project Information Memoranda (LIMs and PIMs) for range of future sea levels
User-pays for protection and insurance, based on actual risk
Removal of government-guaranteed insurance (through Earthquake Commission) for catastrophic coastal erosion and inundation
Owners of at-risk properties whose costs of protection increase, or who can no longer afford protection
Barrier: Long history of government guaranteed insurance for flood and other natural hazards
Enabler: unwillingness of community to pay for protection of a few properties; central government decision to change government-guaranteed insurance
Dependent on physical characteristics of coast as well as attitudes of property owners
User-pays approach removes community values from coastal management
No recognition of ability to pay and its social implications
Could still result in loss of beach amenity if property owners decide to meet protection costs
Funding of protection works only through targeted rates levied on at-risk properties
Change betterment limits to Earthquake Commission Act
Enable Earthquake Commission to make proactive payouts for flood proofing, relocation, and possible land purchase, rather than replacement of like with like
Property owners no longer able to reinstate their properties
Central government liability could increase in short term
Barrier: Priority not given to long term cost reduction
Enabler: legislation change to Earthquake Commission Act
Legislative change could be given effect quickly
Would reduce exposure to risk over decades as damages occur
Reactive approach as only effective after buildings have been damaged; planning controls needed to shift from damage driven to proactive approach
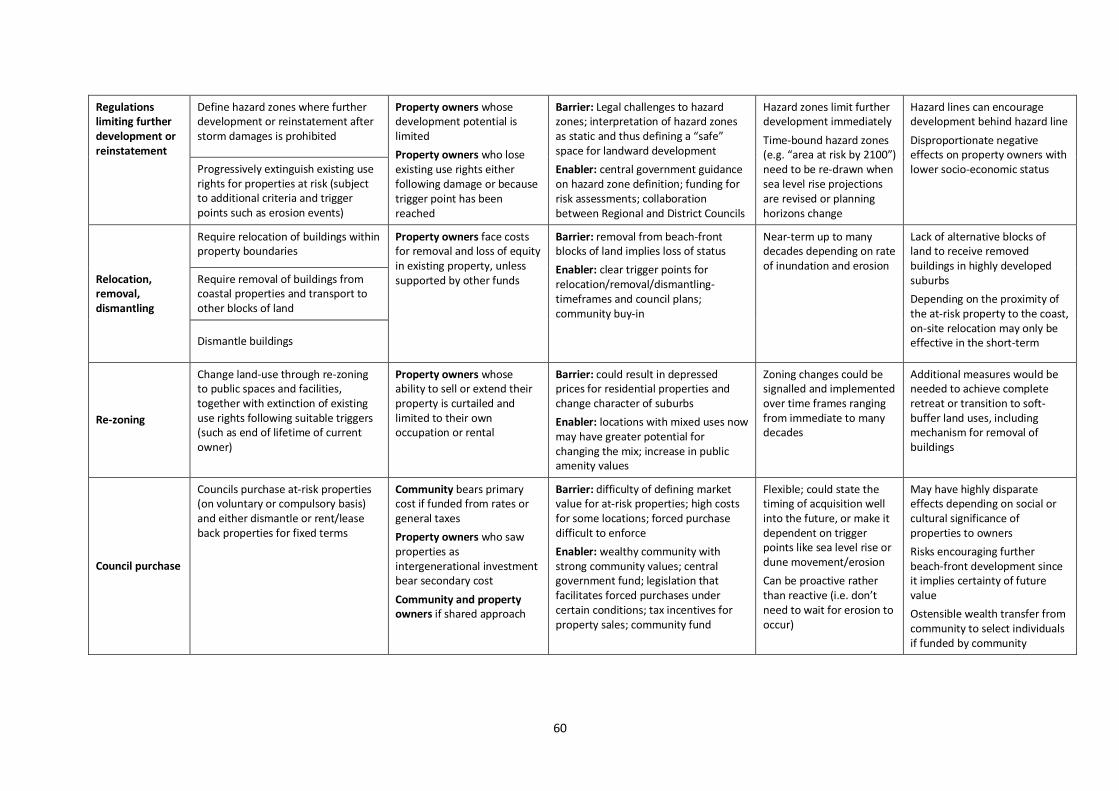
60
Regulations limiting further development or reinstatement
Define hazard zones where further development or reinstatement after storm damages is prohibited
Property owners whose development potential is limited
Property owners who lose existing use rights either following damage or because trigger point has been reached
Barrier: Legal challenges to hazard zones; interpretation of hazard zones as static and thus defining a “safe” space for landward development
Enabler: central government guidance on hazard zone definition; funding for risk assessments; collaboration between Regional and District Councils
Hazard zones limit further development immediately
Time-bound hazard zones (e.g. “area at risk by 2100”) need to be re-drawn when sea level rise projections are revised or planning horizons change
Hazard lines can encourage development behind hazard line
Disproportionate negative effects on property owners with lower socio-economic status Progressively extinguish existing use
rights for properties at risk (subject to additional criteria and trigger points such as erosion events)
Relocation, removal, dismantling
Require relocation of buildings within property boundaries
Property owners face costs for removal and loss of equity in existing property, unless supported by other funds
Barrier: removal from beach-front blocks of land implies loss of status
Enabler: clear trigger points for relocation/removal/dismantling-timeframes and council plans; community buy-in
Near-term up to many decades depending on rate of inundation and erosion
Lack of alternative blocks of land to receive removed buildings in highly developed suburbs
Depending on the proximity of the at-risk property to the coast, on-site relocation may only be effective in the short-term
Require removal of buildings from coastal properties and transport to other blocks of land
Dismantle buildings
Re-zoning
Change land-use through re-zoning to public spaces and facilities, together with extinction of existing use rights following suitable triggers (such as end of lifetime of current owner)
Property owners whose ability to sell or extend their property is curtailed and limited to their own occupation or rental
Barrier: could result in depressed prices for residential properties and change character of suburbs
Enabler: locations with mixed uses now may have greater potential for changing the mix; increase in public amenity values
Zoning changes could be signalled and implemented over time frames ranging from immediate to many decades
Additional measures would be needed to achieve complete retreat or transition to soft-buffer land uses, including mechanism for removal of buildings
Council purchase
Councils purchase at-risk properties (on voluntary or compulsory basis) and either dismantle or rent/lease back properties for fixed terms
Community bears primary cost if funded from rates or general taxes
Property owners who saw properties as intergenerational investment bear secondary cost
Community and property owners if shared approach
Barrier: difficulty of defining market value for at-risk properties; high costs for some locations; forced purchase difficult to enforce
Enabler: wealthy community with strong community values; central government fund; legislation that facilitates forced purchases under certain conditions; tax incentives for property sales; community fund
Flexible; could state the timing of acquisition well into the future, or make it dependent on trigger points like sea level rise or dune movement/erosion
Can be proactive rather than reactive (i.e. don’t need to wait for erosion to occur)
May have highly disparate effects depending on social or cultural significance of properties to owners
Risks encouraging further beach-front development since it implies certainty of future value
Ostensible wealth transfer from community to select individuals if funded by community
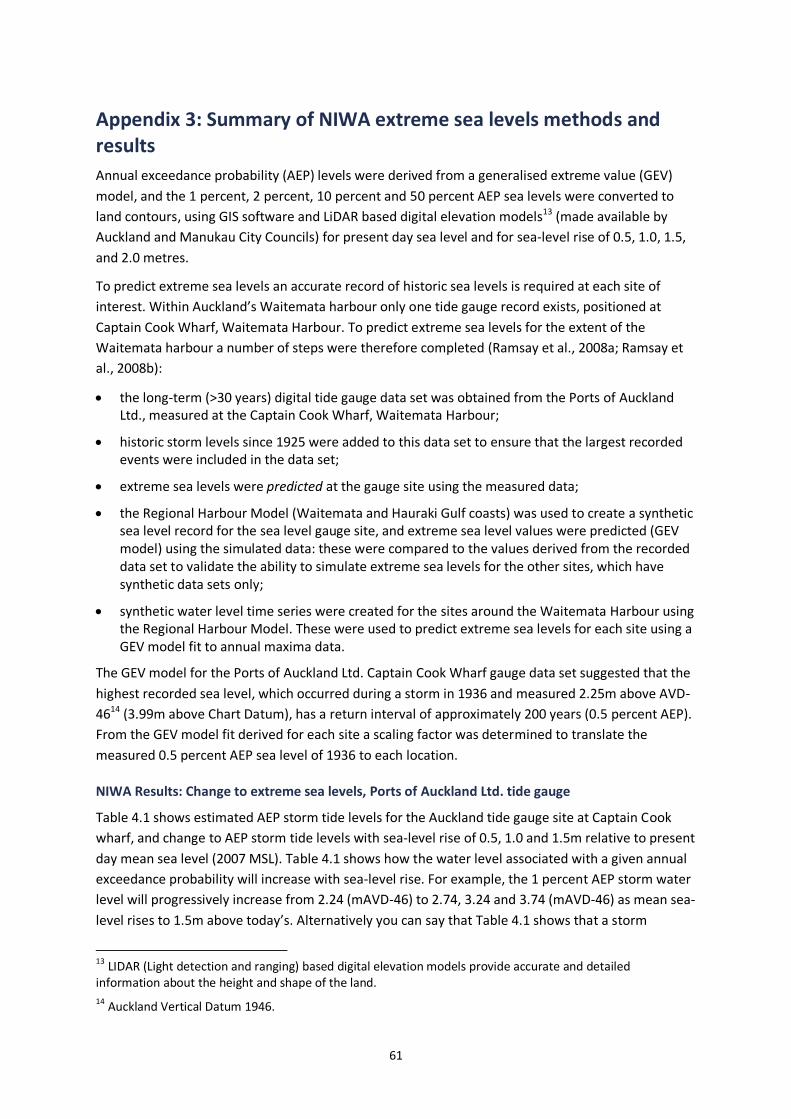
61
Appendix 3: Summary of NIWA extreme sea levels methods and results
Annual exceedance probability (AEP) levels were derived from a generalised extreme value (GEV)
model, and the 1 percent, 2 percent, 10 percent and 50 percent AEP sea levels were converted to
land contours, using GIS software and LiDAR based digital elevation models13 (made available by
Auckland and Manukau City Councils) for present day sea level and for sea-level rise of 0.5, 1.0, 1.5,
and 2.0 metres.
To predict extreme sea levels an accurate record of historic sea levels is required at each site of
interest. Within Auckland’s Waitemata harbour only one tide gauge record exists, positioned at
Captain Cook Wharf, Waitemata Harbour. To predict extreme sea levels for the extent of the
Waitemata harbour a number of steps were therefore completed (Ramsay et al., 2008a; Ramsay et
al., 2008b):
the long-term (>30 years) digital tide gauge data set was obtained from the Ports of Auckland Ltd., measured at the Captain Cook Wharf, Waitemata Harbour;
historic storm levels since 1925 were added to this data set to ensure that the largest recorded events were included in the data set;
extreme sea levels were predicted at the gauge site using the measured data;
the Regional Harbour Model (Waitemata and Hauraki Gulf coasts) was used to create a synthetic sea level record for the sea level gauge site, and extreme sea level values were predicted (GEV model) using the simulated data: these were compared to the values derived from the recorded data set to validate the ability to simulate extreme sea levels for the other sites, which have synthetic data sets only;
synthetic water level time series were created for the sites around the Waitemata Harbour using the Regional Harbour Model. These were used to predict extreme sea levels for each site using a GEV model fit to annual maxima data.
The GEV model for the Ports of Auckland Ltd. Captain Cook Wharf gauge data set suggested that the
highest recorded sea level, which occurred during a storm in 1936 and measured 2.25m above AVD-
4614 (3.99m above Chart Datum), has a return interval of approximately 200 years (0.5 percent AEP).
From the GEV model fit derived for each site a scaling factor was determined to translate the
measured 0.5 percent AEP sea level of 1936 to each location.
NIWA Results: Change to extreme sea levels, Ports of Auckland Ltd. tide gauge
Table 4.1 shows estimated AEP storm tide levels for the Auckland tide gauge site at Captain Cook
wharf, and change to AEP storm tide levels with sea-level rise of 0.5, 1.0 and 1.5m relative to present
day mean sea level (2007 MSL). Table 4.1 shows how the water level associated with a given annual
exceedance probability will increase with sea-level rise. For example, the 1 percent AEP storm water
level will progressively increase from 2.24 (mAVD-46) to 2.74, 3.24 and 3.74 (mAVD-46) as mean sea-
level rises to 1.5m above today’s. Alternatively you can say that Table 4.1 shows that a storm
13 LIDAR (Light detection and ranging) based digital elevation models provide accurate and detailed information about the height and shape of the land.
14 Auckland Vertical Datum 1946.
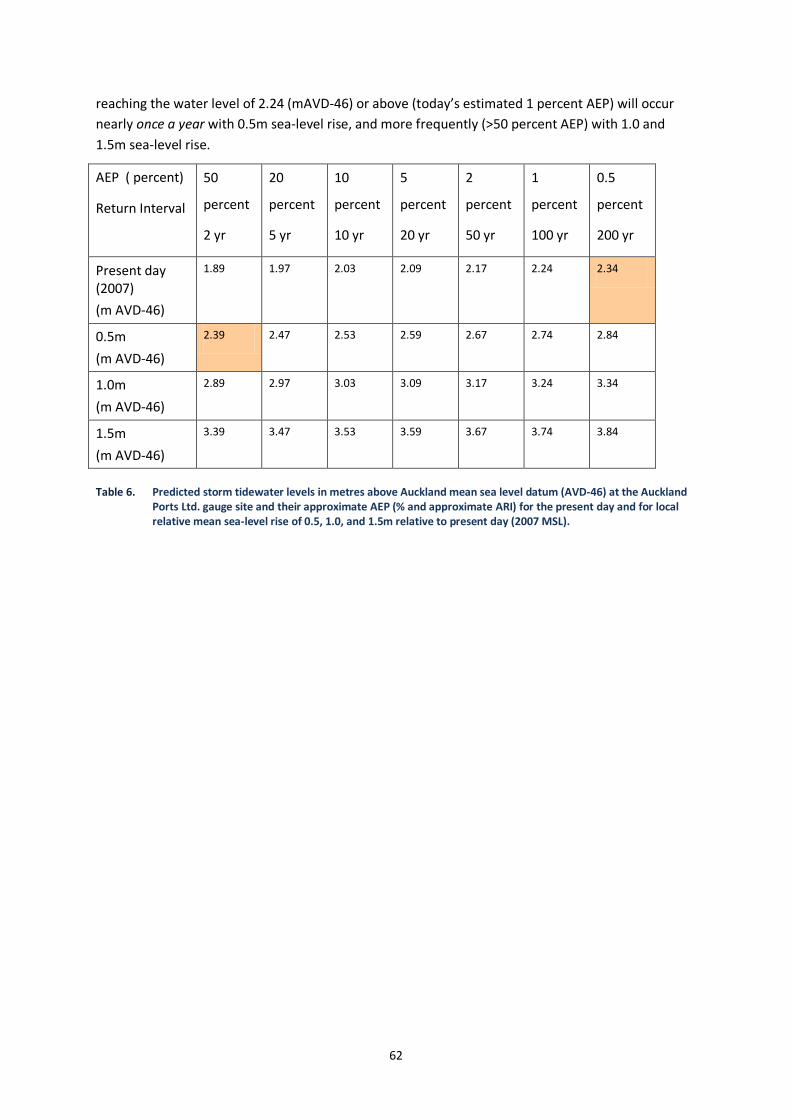
62
reaching the water level of 2.24 (mAVD-46) or above (today’s estimated 1 percent AEP) will occur
nearly once a year with 0.5m sea-level rise, and more frequently (>50 percent AEP) with 1.0 and
1.5m sea-level rise.
AEP ( percent)
Return Interval
50
percent
2 yr
20
percent
5 yr
10
percent
10 yr
5
percent
20 yr
2
percent
50 yr
1
percent
100 yr
0.5
percent
200 yr
Present day (2007)
(m AVD-46)
1.89 1.97 2.03 2.09 2.17 2.24 2.34
0.5m
(m AVD-46)
2.39 2.47 2.53 2.59 2.67 2.74 2.84
1.0m
(m AVD-46)
2.89 2.97 3.03 3.09 3.17 3.24 3.34
1.5m
(m AVD-46)
3.39 3.47 3.53 3.59 3.67 3.74 3.84
Table 6. Predicted storm tidewater levels in metres above Auckland mean sea level datum (AVD-46) at the Auckland Ports Ltd. gauge site and their approximate AEP (% and approximate ARI) for the present day and for local relative mean sea-level rise of 0.5, 1.0, and 1.5m relative to present day (2007 MSL).
63
Appendix 4: Interview schedule
This interview schedule was designed for interviewing participants from councils and was adapted for non-council participants.
Adaptation of existing settlements to the impacts of sea level rise: A case study of two Auckland communities Introduction (10min)
Greetings & introduction, overview of information sheet and consent form
Overview of the research goal and structure of the interview
Interview questions (60 – 75 min)
A. The current approach – limits and trade-offs:
1) Introductory questions. a. Name, position, role & responsibilities. b. In a few words - how would you describe your council’s current approach to coastal hazards
management; c. and your council’s approach to sea level rise?
2) What specific regulatory and other tools does your council use to identify areas along the coast that
may be affected by future sea level rise?
3) Has the recently revised Ministry for the Environment guidance been used? Does the MfE guidance made a difference to the coastal management your council undertakes already?
4) a) What planning timeframes does your council use for: 1) coastal residential development, 2) coastal commercial development, 3) coastal infrastructure, 4) coastal hazards, 5) climate change and 6) sea level rise?
b) What consideration is given to events beyond each of these timeframes?
5) Your council has recently carried out detailed inundation studies into the impacts of sea level rise in terms of extreme coastal events (1% AEP), sea level rise, and coastal inundation for your district.
a. What action has council taken in response to the information generated by that report? b. Have any external responses regarding the reports been received? c. Manukau City and Auckland City have both had similar reports completed but considered different
levels of sea level rise and different time frames: Why did your council select the time frames and sea level rise scenarios that were used in its NIWA report?
6) Kawakawa Bay and the Eastern Bays - Kohimarama & Mission Bay:
[An introduction will be given here to the sea level rise contours this research project has had modelled for the case study sites; the extent of sea level rise considered; what the contours represent; and the numbers of people and value of assets at risk under each sea level rise scenario, looking at the imagery for each of the study sites and inundation contours for four sea level rise scenarios – 0.5, 1.0, 1.5 and 2.0 metres.]
Under the described scenarios of sea level rise:
a. What management approach would be required under each scenario of sea level rise described? (e.g. When approximately would the current protection fail to protect the community, and a new approach have to be adopted?)
b. What type and scale of protection would likely be needed, under each of these scenarios of sea level rise?
64
c. What would be a rough estimate of the costs of this type and scale of protection be? (For each of the scenarios)
d. How have costs of coastal protection been covered in the past? e. Would another method of spreading the costs be likely to be needed in future? If so, what approach
might be most acceptable? f. What changes to the current management approach would need to occur to allow for that level of
protection (we have discussed being needed) to be enabled? g. Could the social amenity value of the beach (particularly beach access) be retained if the beach is to
be protected to the level required, as discussed above? h. To what extent might upscaling protection affect the social and environmental values at the coast for
the two sites?
B. Including ‘managed retreat’ as part of the management toolbox:
Managed retreat is sometimes cited as an important potential response option for exposed coastal suburbs as sea level continues to rise.
1) Considering managed retreat as part of the local government toolbox:
a. Could a managed retreat approach feasibly overcome the sorts of limits we have discussed (in Part 1 of interview) as sea level continues to rise?
b. What difficulties might arise for implementation of retreat for existing properties as sea level rises? c. At each of the three study sites, who would be most affected by retreat, and who would benefit? d. How would the adoption of managed retreat at the three study sites (need to) differ? e. Over what time frames could implementation options be effective?
2) Barriers to managed retreat:
Some barriers to managed retreat being included as a potential response option to sea level rise impacts (i.e. increased coastal hazards) have been suggested.
Private property rights
Councils can modify private property rights. Private property rights are not enshrined in New Zealand law; however, some citizens espsouse a private property rights perspective and this can exert considerable influence on council activities.
a. How does your council approach the issue of private property rights in relation to coastal hazards? b. How could perceived private property rights be addressed to enable discussion and planning of
managed retreat as a response option?
Costs a. What cost considerations might constitute significant barriers? b. Can you please indicate the approximate costs of a managed retreat approach at the three sites? c. Who would bear these costs?
i. How could costs be spread across the community? ii. How could the distribution of costs affect the feasibility of managed retreat?
Responsibilities of council and property owners
The mandate for and responsibility of local government to mitigate the adverse impacts of coastal hazards for its constituents, is clearly set out in the Resource Management Act and NZ Coastal Policy Statement. This is also reflected in Auckland’s Regional Policy Statement and District Plans.
a. Where do you think responsibility should lie for reducing and mitigating coastal hazards? b. In what ways could councils be adversely affected by not addressing coastal hazard impacts under
rising sea level scenarios? c. How could councils protect against liability while still meeting their responsibilities as sea level rises? d. How does the current regulatory framework support or hinder the consideration of managed retreat
as a response option?
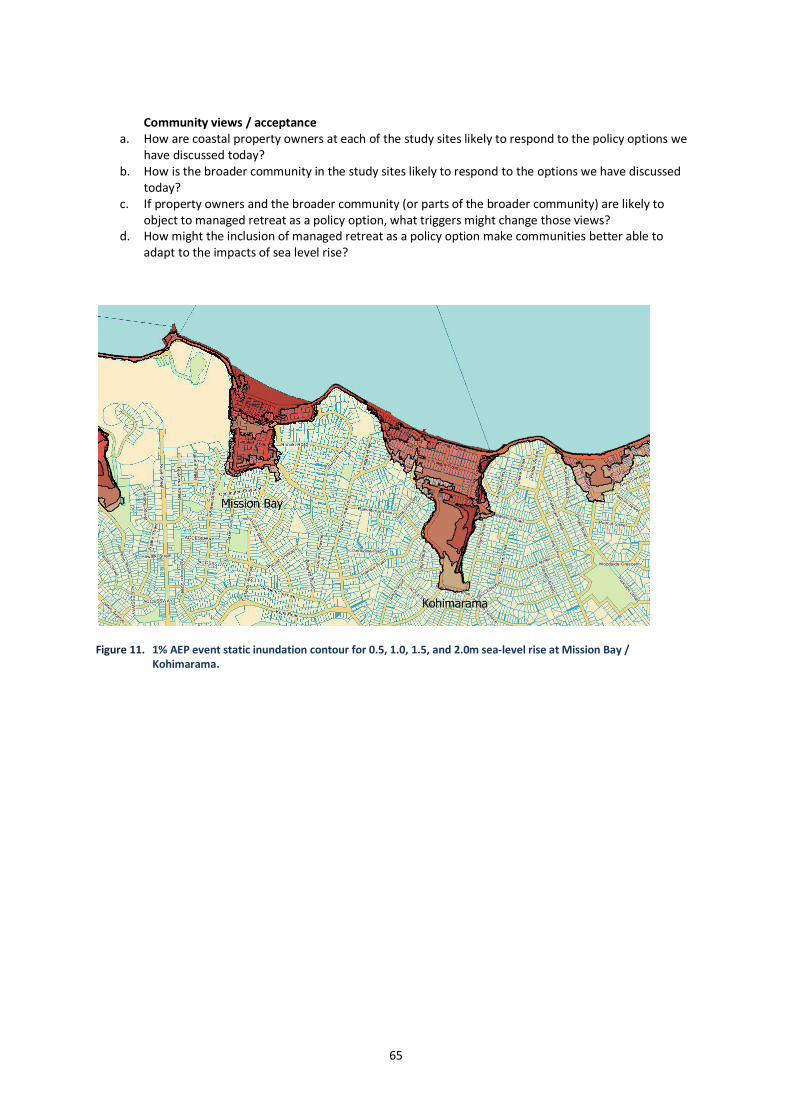
65
Community views / acceptance a. How are coastal property owners at each of the study sites likely to respond to the policy options we
have discussed today? b. How is the broader community in the study sites likely to respond to the options we have discussed
today? c. If property owners and the broader community (or parts of the broader community) are likely to
object to managed retreat as a policy option, what triggers might change those views? d. How might the inclusion of managed retreat as a policy option make communities better able to
adapt to the impacts of sea level rise?
Figure 11. 1% AEP event static inundation contour for 0.5, 1.0, 1.5, and 2.0m sea-level rise at Mission Bay / Kohimarama.
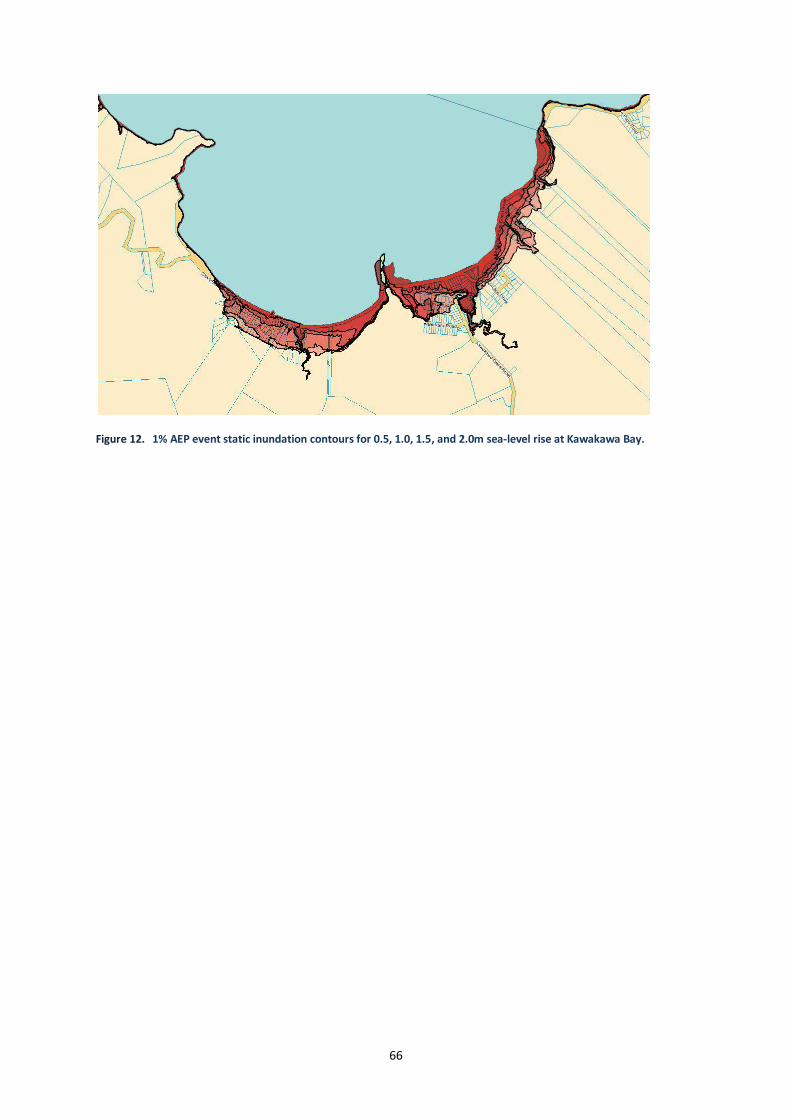
66
Figure 12. 1% AEP event static inundation contours for 0.5, 1.0, 1.5, and 2.0m sea-level rise at Kawakawa Bay.
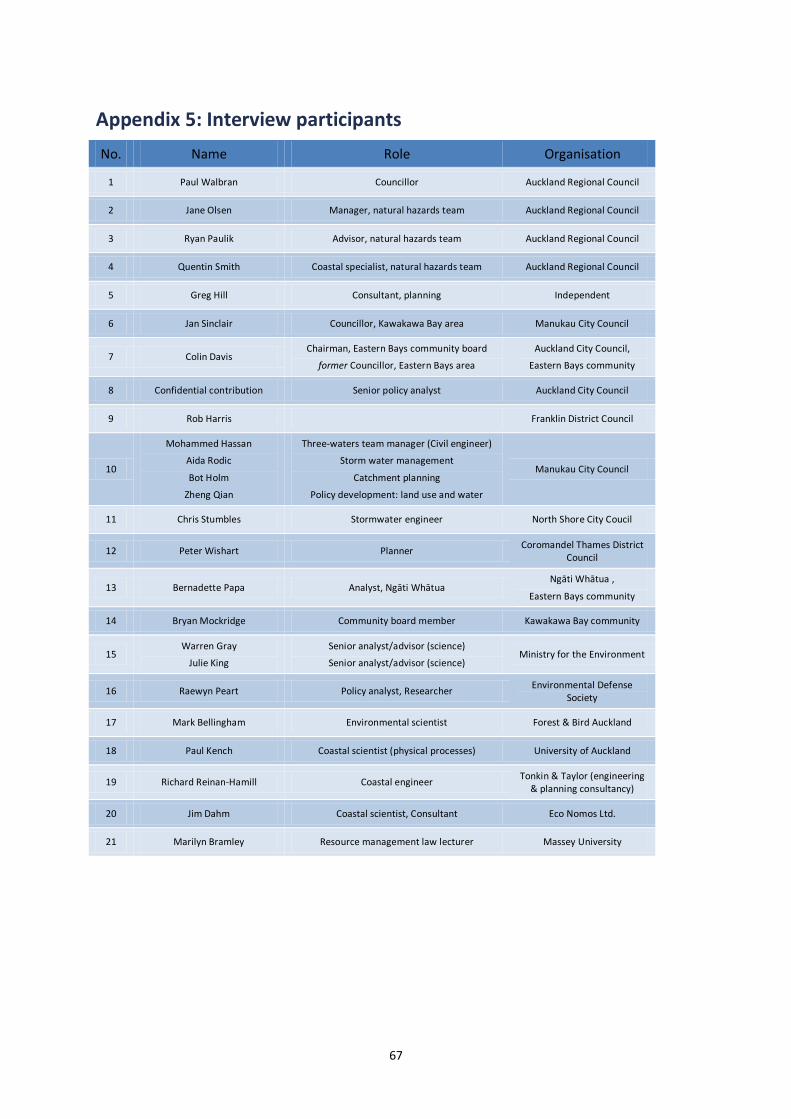
67
Appendix 5: Interview participants
No. Name Role Organisation
1 Paul Walbran Councillor Auckland Regional Council
2 Jane Olsen Manager, natural hazards team Auckland Regional Council
3 Ryan Paulik Advisor, natural hazards team Auckland Regional Council
4 Quentin Smith Coastal specialist, natural hazards team Auckland Regional Council
5 Greg Hill Consultant, planning Independent
6 Jan Sinclair Councillor, Kawakawa Bay area Manukau City Council
7 Colin Davis Chairman, Eastern Bays community board
former Councillor, Eastern Bays area
Auckland City Council,
Eastern Bays community
8 Confidential contribution Senior policy analyst Auckland City Council
9 Rob Harris Franklin District Council
10
Mohammed Hassan
Aida Rodic
Bot Holm
Zheng Qian
Three-waters team manager (Civil engineer)
Storm water management
Catchment planning
Policy development: land use and water
Manukau City Council
11 Chris Stumbles Stormwater engineer North Shore City Coucil
12 Peter Wishart Planner Coromandel Thames District
Council
13 Bernadette Papa Analyst, Ngāti Whātua Ngāti Whātua ,
Eastern Bays community
14 Bryan Mockridge Community board member Kawakawa Bay community
15 Warren Gray
Julie King
Senior analyst/advisor (science)
Senior analyst/advisor (science) Ministry for the Environment
16 Raewyn Peart Policy analyst, Researcher Environmental Defense
Society
17 Mark Bellingham Environmental scientist Forest & Bird Auckland
18 Paul Kench Coastal scientist (physical processes) University of Auckland
19 Richard Reinan-Hamill Coastal engineer Tonkin & Taylor (engineering
& planning consultancy)
20 Jim Dahm Coastal scientist, Consultant Eco Nomos Ltd.
21 Marilyn Bramley Resource management law lecturer Massey University