Embed Size (px)
Citation preview
VULNERABILITY ANALYSIS FOR
ADDRESSING PLUVIAL FLOOD RISK IN
DENSELY URBANIZED AREA IN OSAKA
Kansai University: T. Ozaki, T. Ishigaki, N. Asano
Kyoto University : K. Toda 1
International Conference on Flood Resilience:
Experiences in Asia and Europe
5-7 September 2013, Exeter, United Kingdom
Outline of presentation
Introduction
Background and Objectives
Methodology
Study area
Simulation model
Observed rainfall
Results & Discussion
Validating the model
Improving the model
Identifying new weak areas in urban area for flooding
Conclusion
Ozaki et al. 2 5-7 September 2013, Exeter, UK
Outline of presentation
Introduction
Background and Objectives
Methodology
Study area
Simulation model
Observed rainfall
Results & Discussion
Validating the model
Improving the model
Identifying new weak areas in urban area for flooding
Conclusion
Ozaki et al. 3 5-7 September 2013, Exeter, UK
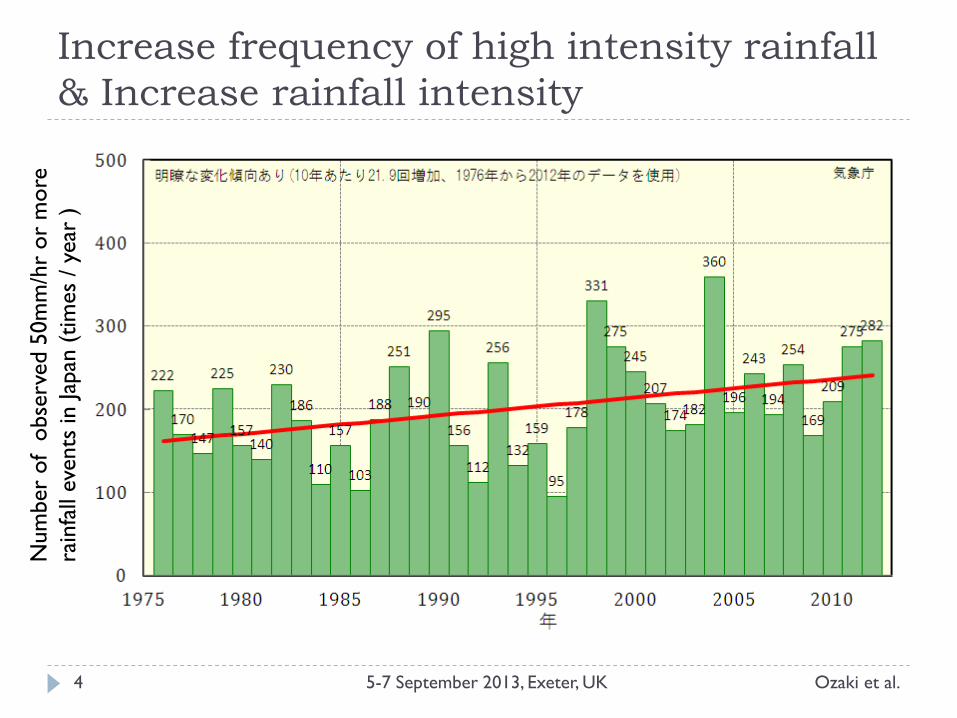
Increase frequency of high intensity rainfall
& Increase rainfall intensity
Ozaki et al. 5-7 September 2013, Exeter, UK 4
Num
ber
of o
bse
rved 5
0m
m/h
r or
more
rain
fall
eve
nts
in Jap
an (
tim
es
/ ye
ar )
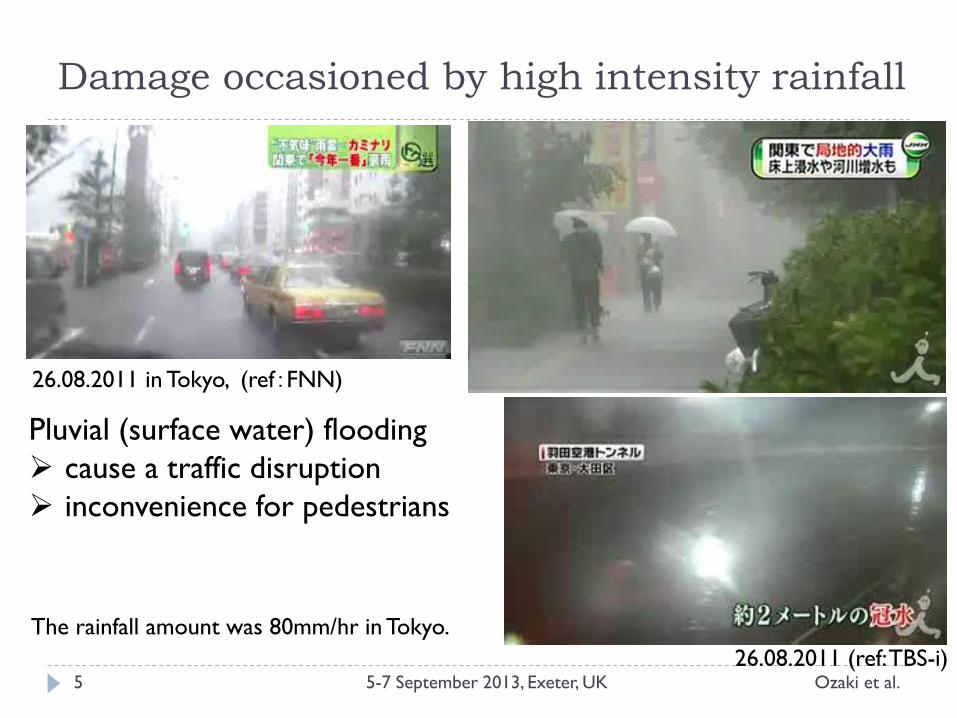
Damage occasioned by high intensity rainfall
Ozaki et al. 5-7 September 2013, Exeter, UK 5
26.08.2011 in Tokyo, (ref:FNN)
26.08.2011 (ref: TBS-i)
Pluvial (surface water) flooding
cause a traffic disruption
inconvenience for pedestrians
The rainfall amount was 80mm/hr in Tokyo.
Ozaki et al. 5-7 September 2013, Exeter, UK 6
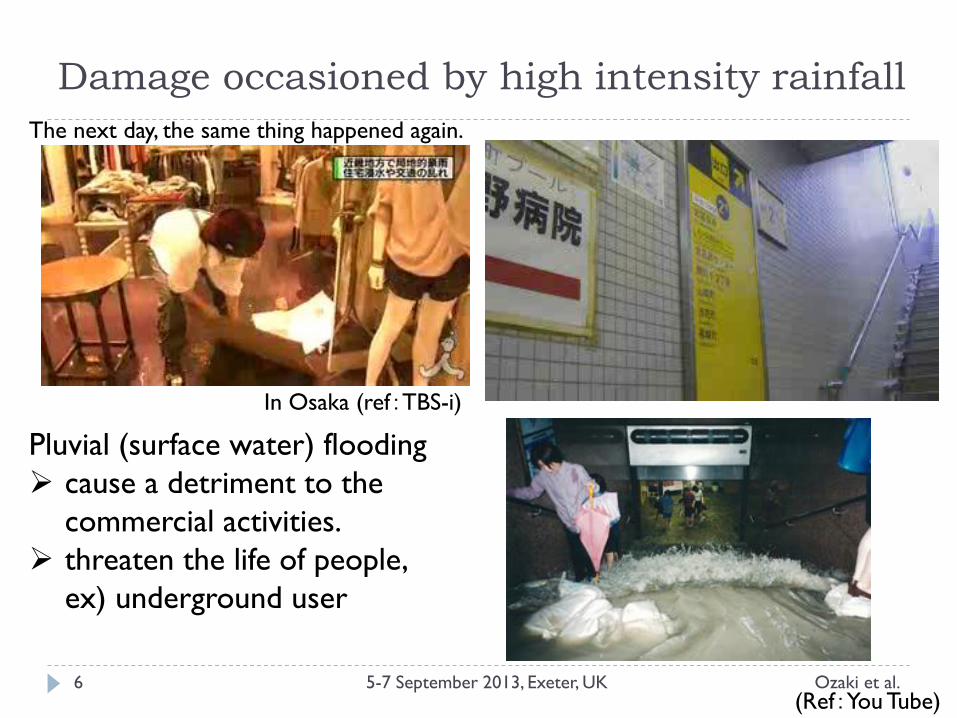
In Osaka (ref:TBS-i)
(Ref:You Tube)
Pluvial (surface water) flooding
cause a detriment to the
commercial activities.
threaten the life of people,
ex) underground user
The next day, the same thing happened again.
Damage occasioned by high intensity rainfall
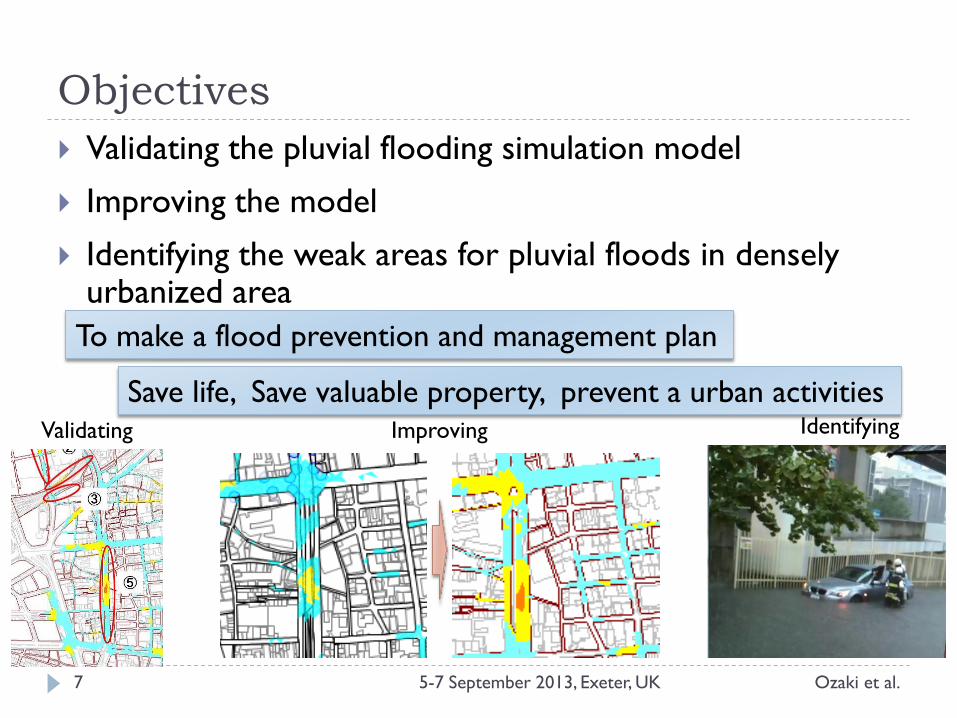
Objectives
Ozaki et al. 5-7 September 2013, Exeter, UK 7
Validating the pluvial flooding simulation model
Improving the model
Identifying the weak areas for pluvial floods in densely urbanized area
Validating Identifying Improving
To make a flood prevention and management plan
Save life, Save valuable property, prevent a urban activities
Outline of presentation
Introduction
Background and Objectives
Methodology
Study area
Simulation model
Observed rainfall
Results & Discussion
Validating the model
Improving the model
Identifying new weak areas in urban area for flooding
Conclusion
Ozaki et al. 8 5-7 September 2013, Exeter, UK
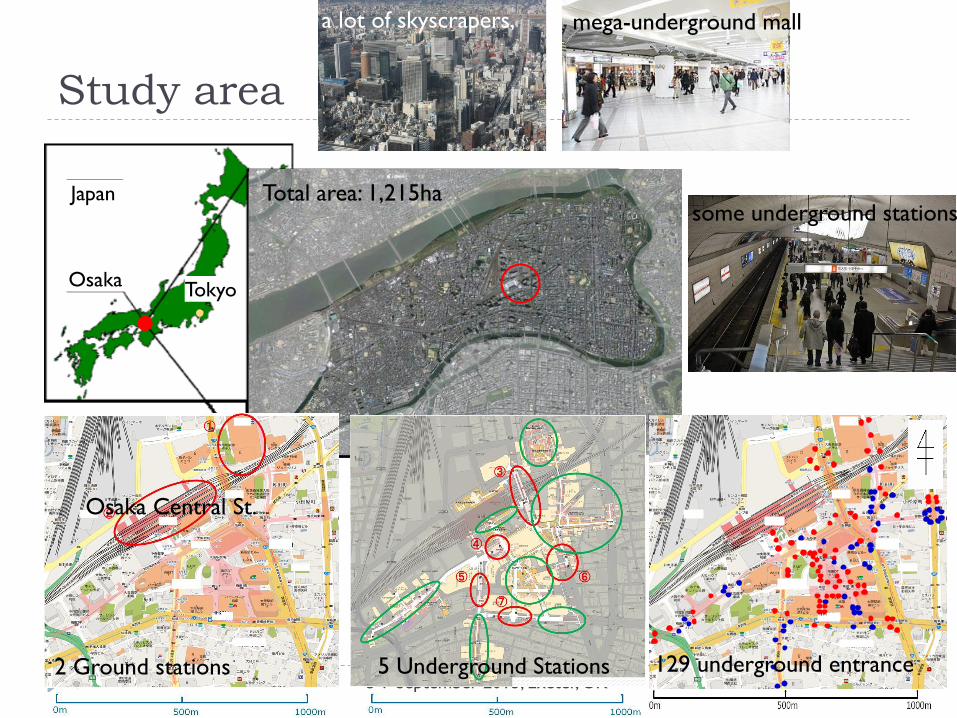
Study area
9
Tokyo Osaka
Japan
a lot of skyscrapers, mega-underground mall
some underground stations
Ozaki et al. 5-7 September 2013, Exeter, UK
Osaka Central St.
Total area: 1,215ha
2 Ground stations 5 Underground Stations 129 underground entrance
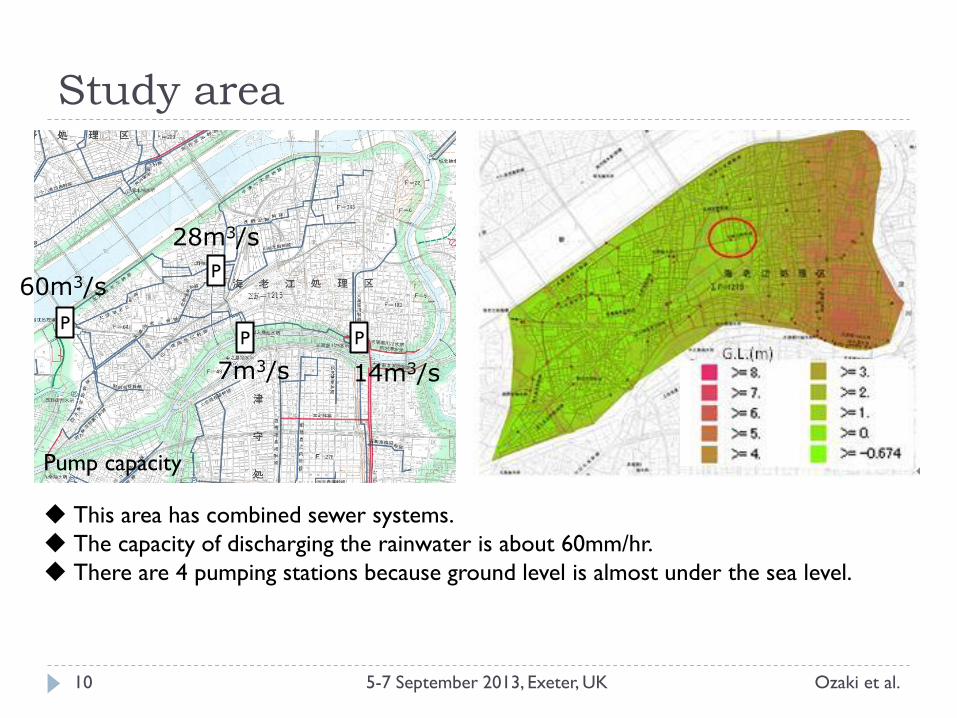
Study area
Ozaki et al. 5-7 September 2013, Exeter, UK 10
P
P P P
This area has combined sewer systems.
The capacity of discharging the rainwater is about 60mm/hr.
There are 4 pumping stations because ground level is almost under the sea level.
60m3/s
28m3/s
7m3/s 14m3/s
Pump capacity
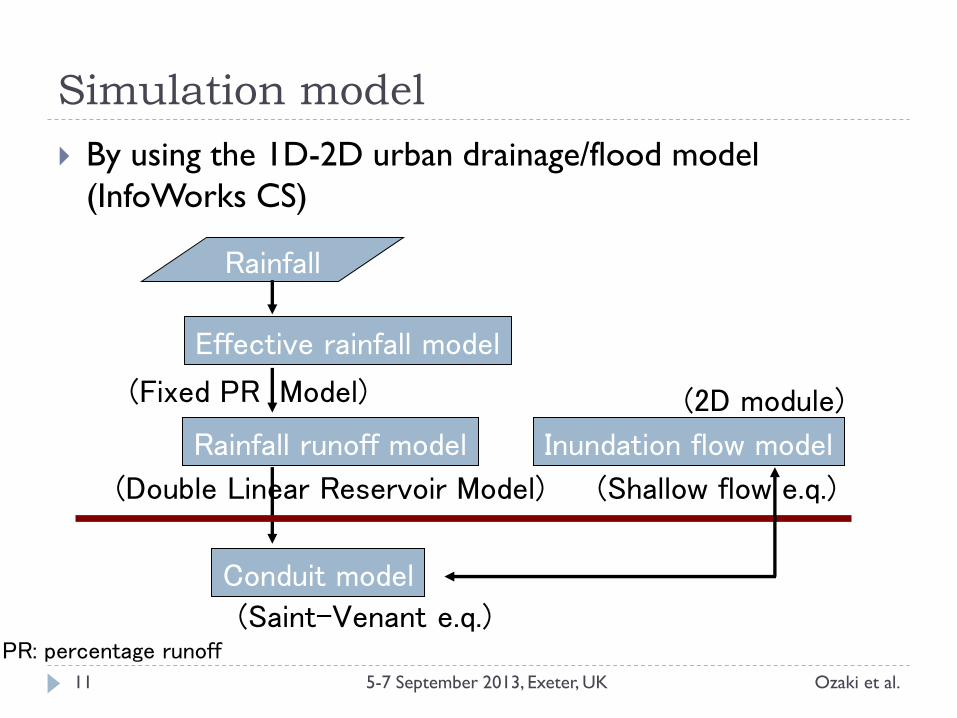
Simulation model
Ozaki et al. 5-7 September 2013, Exeter, UK 11
By using the 1D-2D urban drainage/flood model
(InfoWorks CS)
Rainfall
Effective rainfall model
Rainfall runoff model
Conduit model
Inundation flow model
(Saint-Venant e.q.)
(Double Linear Reservoir Model) (Shallow flow e.q.)
(2D module) (Fixed PR Model)
PR: percentage runoff
1D-2D Model
Ozaki et al. 5-7 September 2013, Exeter, UK 12
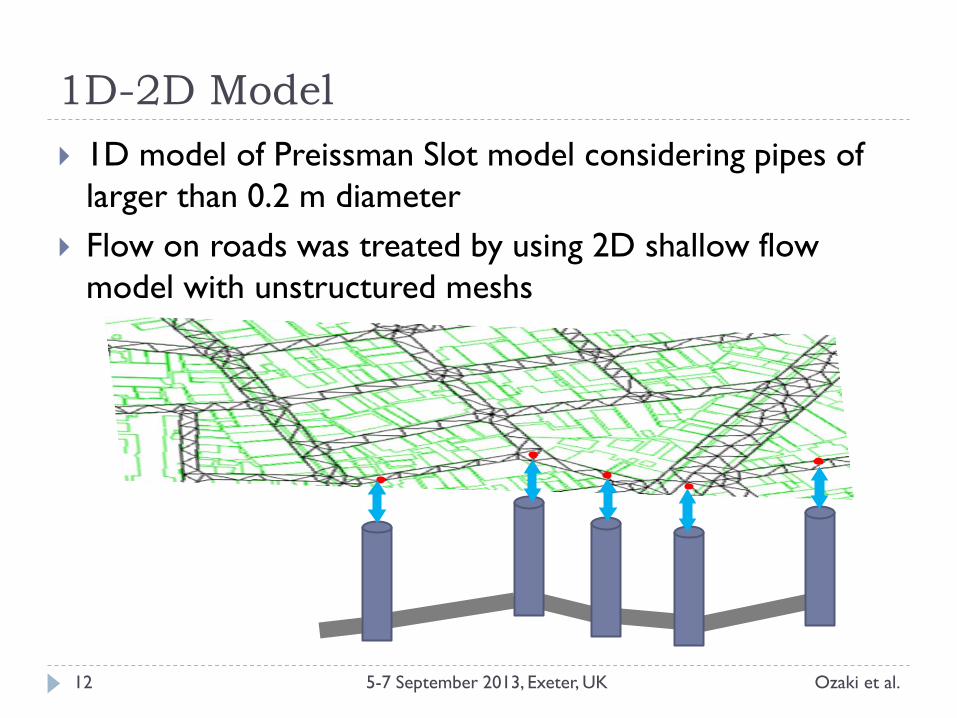
1D model of Preissman Slot model considering pipes of
larger than 0.2 m diameter
Flow on roads was treated by using 2D shallow flow
model with unstructured meshs
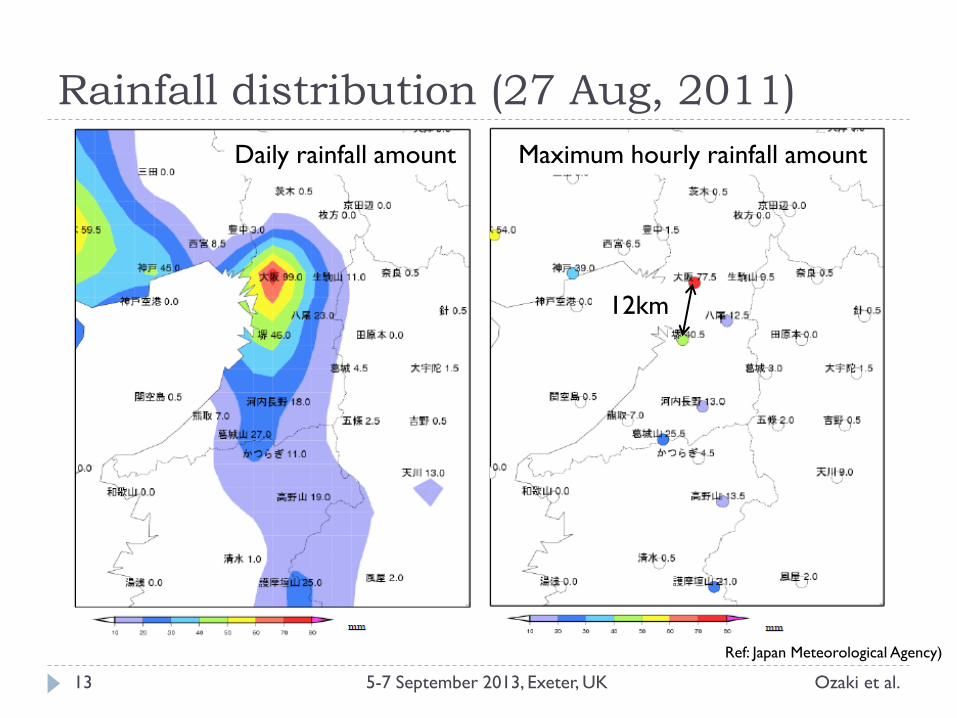
Rainfall distribution (27 Aug, 2011)
Ozaki et al. 5-7 September 2013, Exeter, UK 13
Ref: Japan Meteorological Agency)
Daily rainfall amount Maximum hourly rainfall amount
12km
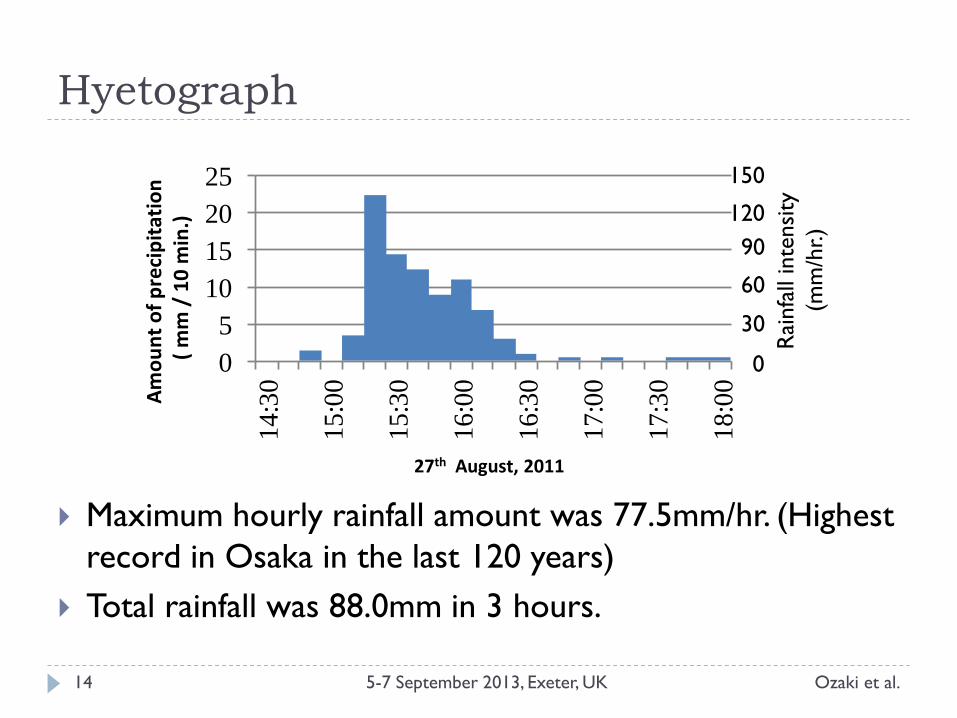
Hyetograph
Ozaki et al. 5-7 September 2013, Exeter, UK 14
Maximum hourly rainfall amount was 77.5mm/hr. (Highest
record in Osaka in the last 120 years)
Total rainfall was 88.0mm in 3 hours.
0
5
10
15
20
25
14:3
0
15:0
0
15:3
0
16:0
0
16:3
0
17:0
0
17:3
0
18:0
0
10分間雨量
(mm
/10m
in.)
27th August, 2011
Am
ou
nt
of
pre
cip
itat
ion
(
mm
/ 1
0 m
in.)
Rai
nfa
ll in
tensi
ty
(mm
/hr.)
0
30
60
90
120
150
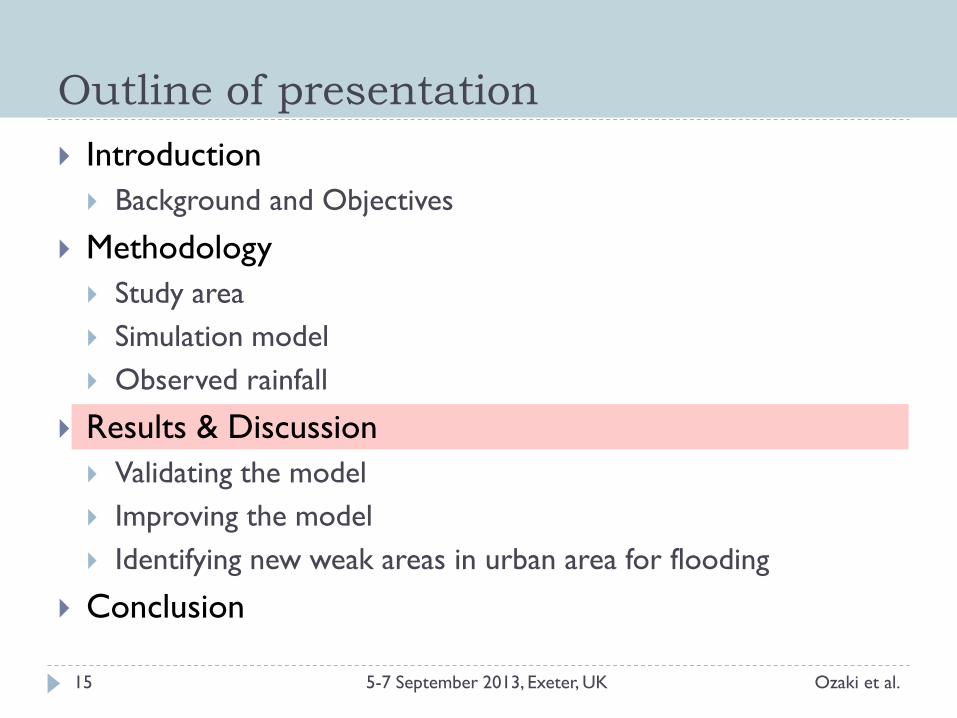
Outline of presentation
Introduction
Background and Objectives
Methodology
Study area
Simulation model
Observed rainfall
Results & Discussion
Validating the model
Improving the model
Identifying new weak areas in urban area for flooding
Conclusion
Ozaki et al. 15 5-7 September 2013, Exeter, UK
Validating the model
Ozaki et al. 5-7 September 2013, Exeter, UK 16
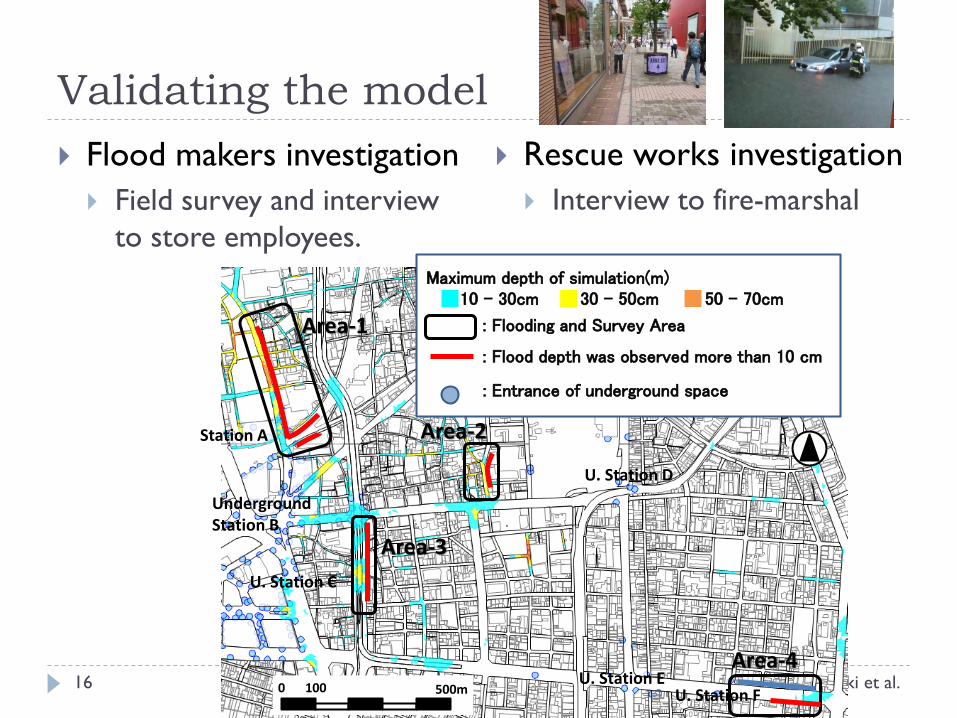
Flood makers investigation
Field survey and interview
to store employees.
Rescue works investigation
Interview to fire-marshal
地下街
Station A
地下街0 500m100
Area-1
Area-3
Area-2
Area-4
10 - 30cm 30 - 50cm 50 - 70cmMaximum depth of simulation(m)
: Flooding and Survey Area
: Flood depth was observed more than 10 cm
: Entrance of underground space
UndergroundStation B
U. Station C
U. Station E
U. Station D
U. Station F
Validating the model
Ozaki et al. 5-7 September 2013, Exeter, UK 17
Station A
地下街0 500m100
Area-1
Area-3
Area-2
UndergroundStation B
U. Station C
10 - 30cm
30 - 50cm
50 - 70cm
Maximum depth of simulation(m)
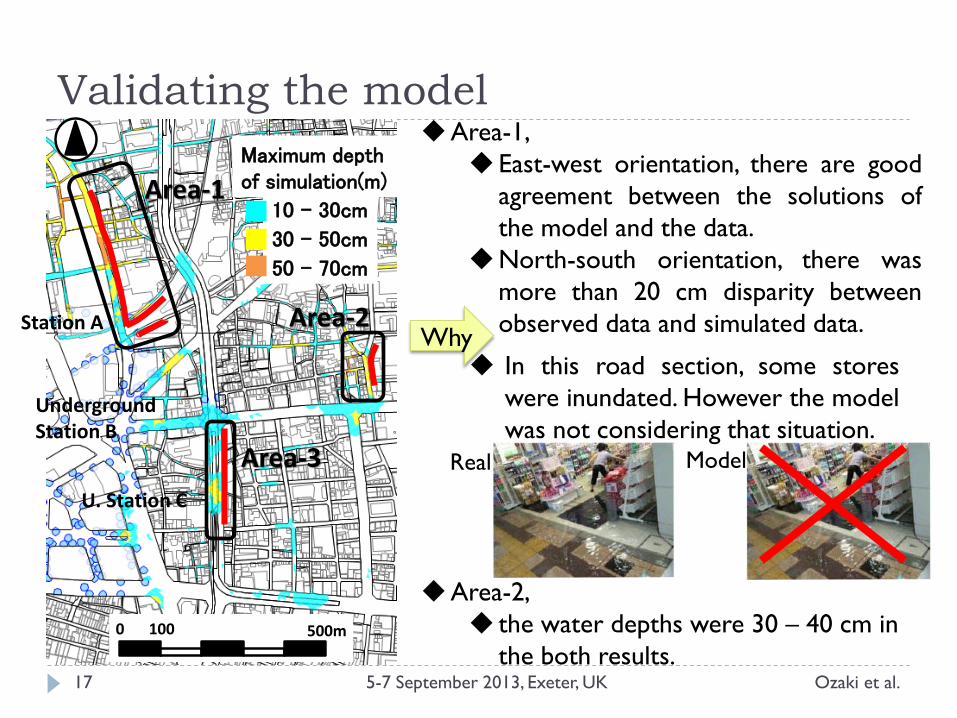
Area-1,
East-west orientation, there are good
agreement between the solutions of
the model and the data.
North-south orientation, there was
more than 20 cm disparity between
observed data and simulated data.
In this road section, some stores
were inundated. However the model
was not considering that situation.
Why
Real Model
Area-2,
the water depths were 30 – 40 cm in
the both results.
Validating the model
Ozaki et al. 5-7 September 2013, Exeter, UK 18
地下街0 500m100
Area-3
Area-4
UndergroundStation B
U. Station C
U. Station EU. Station F
10 - 30cm
30 - 50cm
50 - 70cm
Maximum depth of simulation(m)
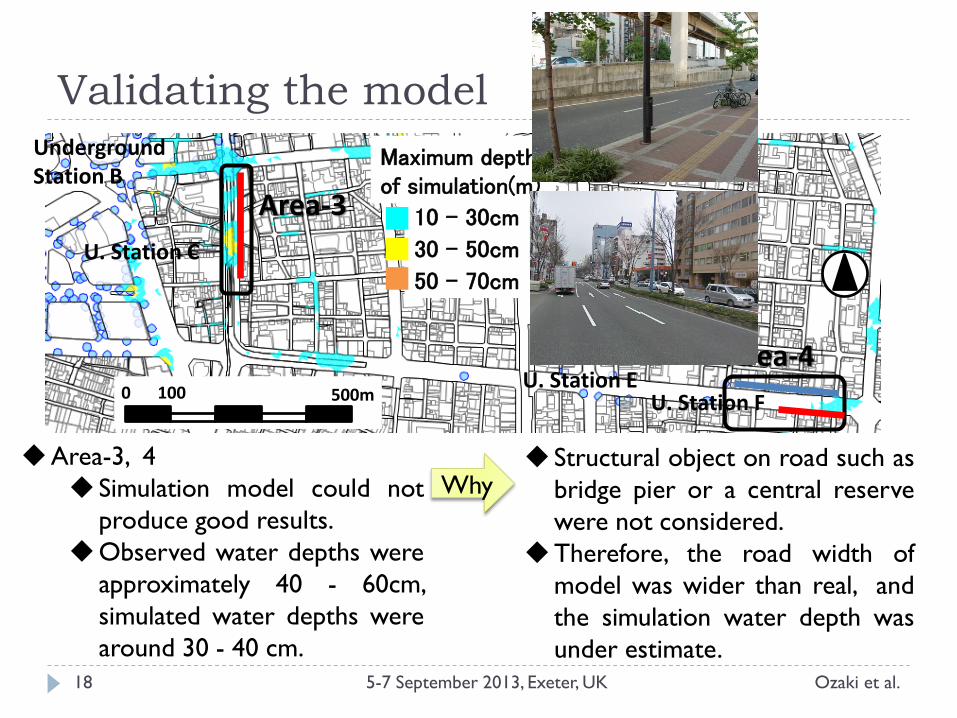
Area-3, 4
Simulation model could not
produce good results.
Observed water depths were
approximately 40 - 60cm,
simulated water depths were
around 30 - 40 cm.
Why Structural object on road such as
bridge pier or a central reserve
were not considered.
Therefore, the road width of
model was wider than real, and
the simulation water depth was
under estimate.
Improving the model
Ozaki et al. 5-7 September 2013, Exeter, UK 19
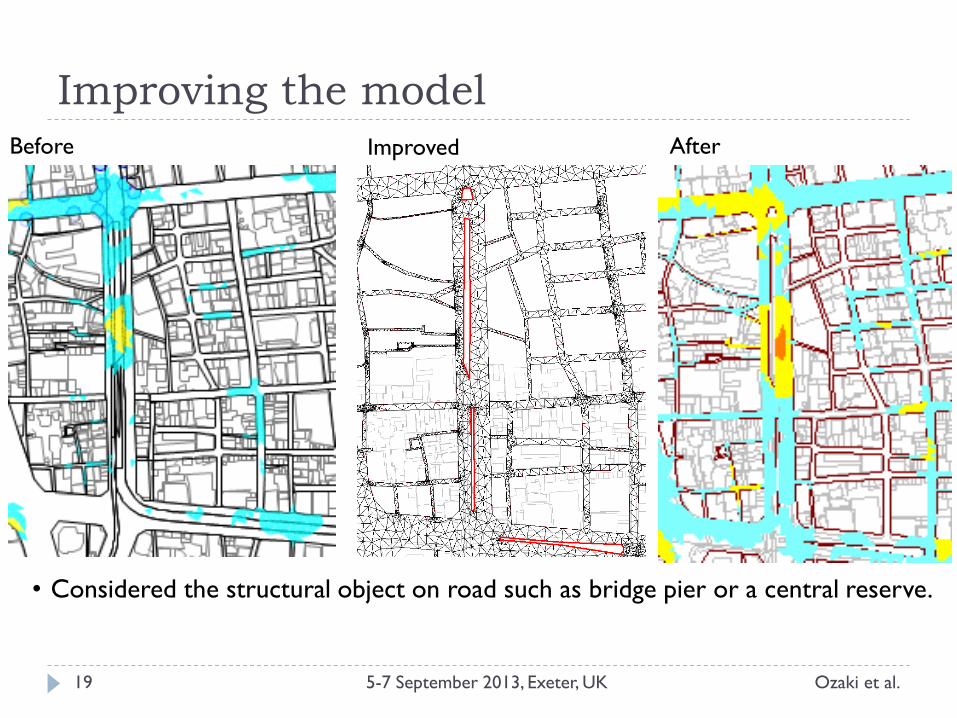
Before After Improved
• Considered the structural object on road such as bridge pier or a central reserve.
Identifying the weak areas
Ozaki et al. 5-7 September 2013, Exeter, UK 20
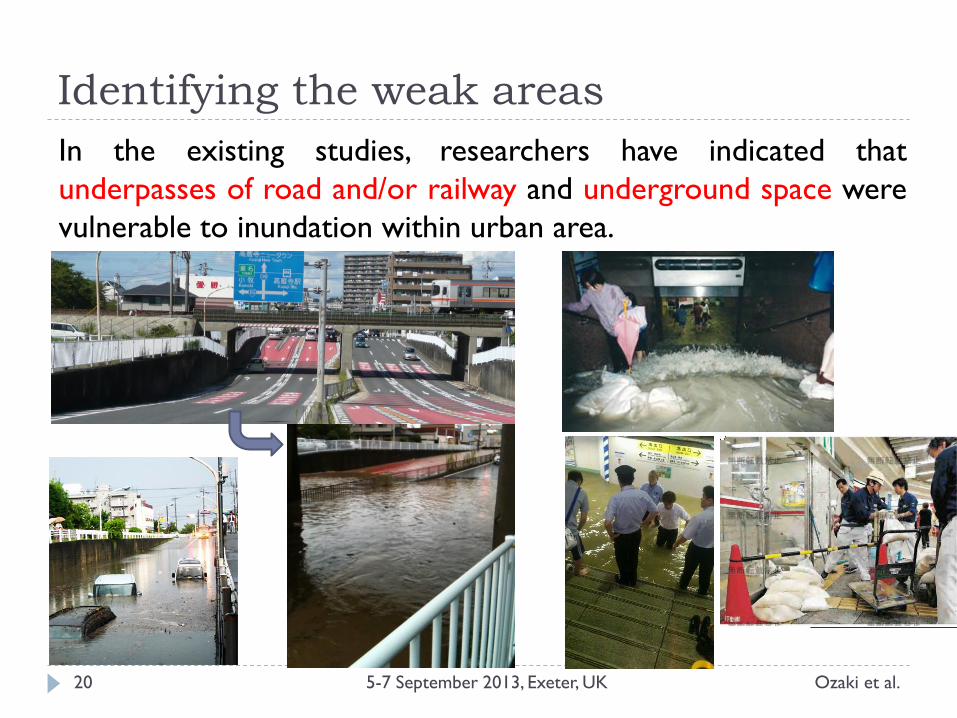
In the existing studies, researchers have indicated that
underpasses of road and/or railway and underground space were
vulnerable to inundation within urban area.
Identifying the weak areas
Ozaki et al. 5-7 September 2013, Exeter, UK 21
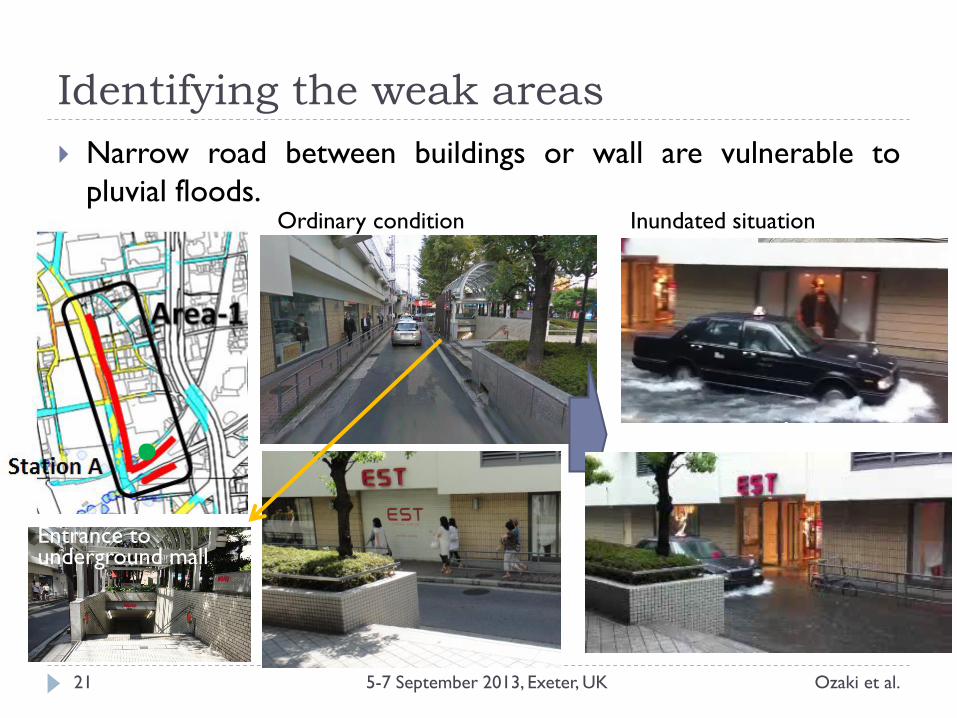
Narrow road between buildings or wall are vulnerable to
pluvial floods. Ordinary condition Inundated situation
Entrance to underground mall
Identifying the weak areas
Ozaki et al. 5-7 September 2013, Exeter, UK 22
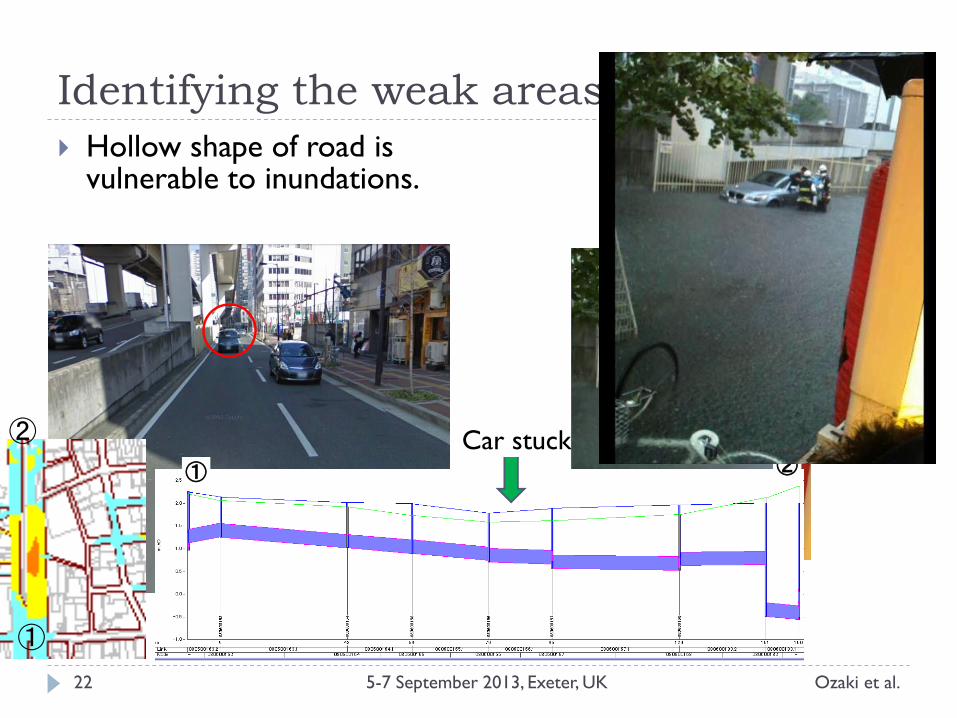
Hollow shape of road is vulnerable to inundations.
①
②
① ②Car stuck
①
②
Identifying the weak areas
Ozaki et al. 5-7 September 2013, Exeter, UK 23
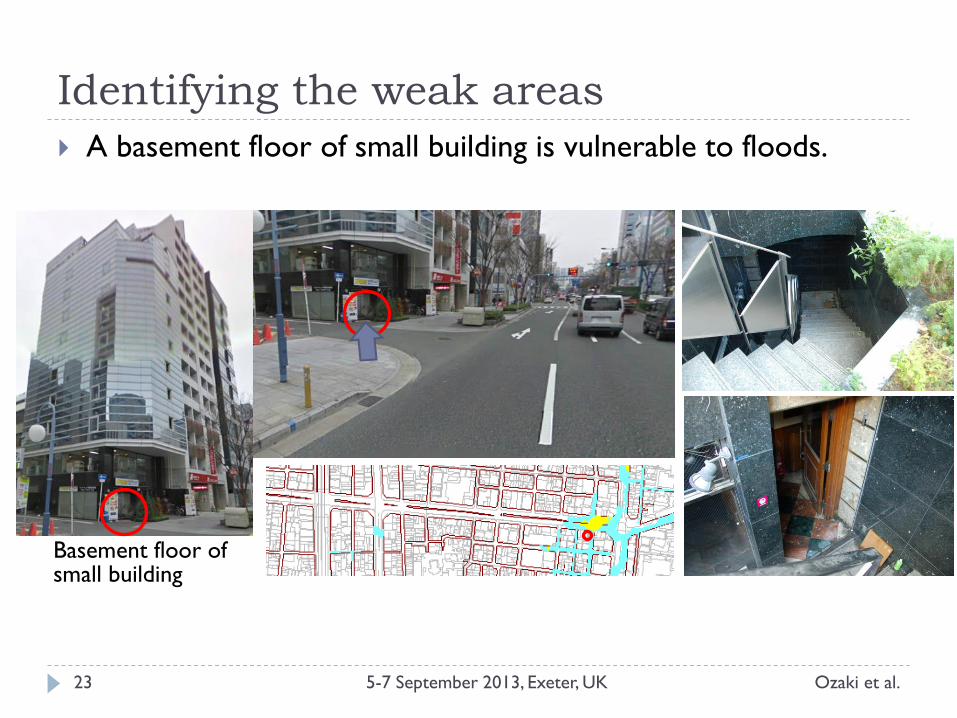
A basement floor of small building is vulnerable to floods.
Basement floor of small building
Conclusion
Ozaki et al. 5-7 September 2013, Exeter, UK 24
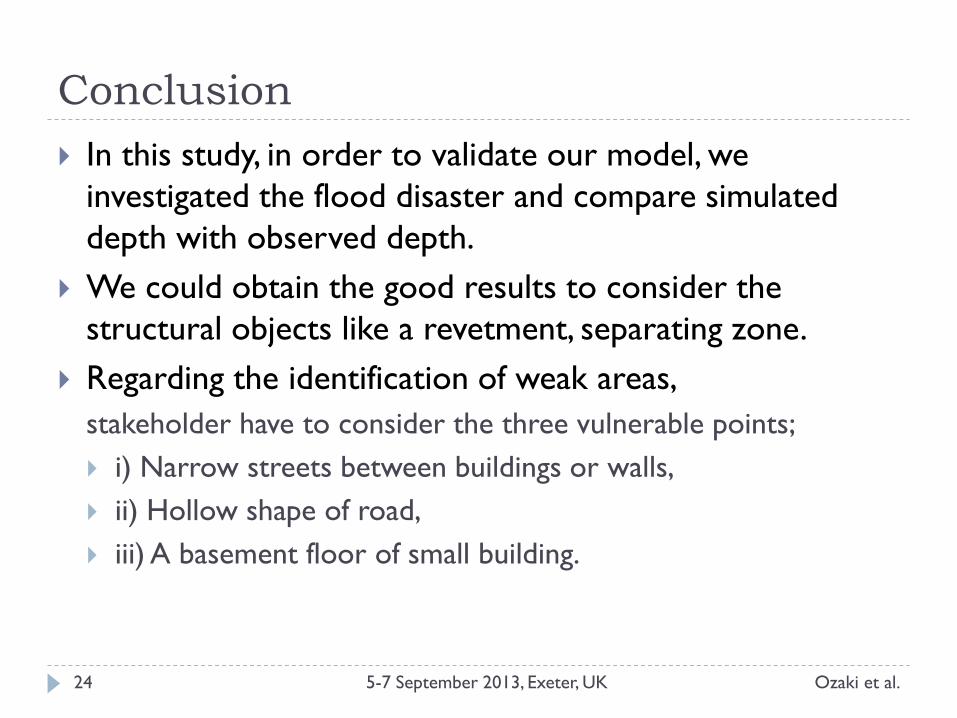
In this study, in order to validate our model, we
investigated the flood disaster and compare simulated
depth with observed depth.
We could obtain the good results to consider the
structural objects like a revetment, separating zone.
Regarding the identification of weak areas,
stakeholder have to consider the three vulnerable points;
i) Narrow streets between buildings or walls,
ii) Hollow shape of road,
iii) A basement floor of small building.

Ozaki et al. 5-7 September 2013, Exeter, UK 25
Thank you for your attention !
TOKYO SKYTREE
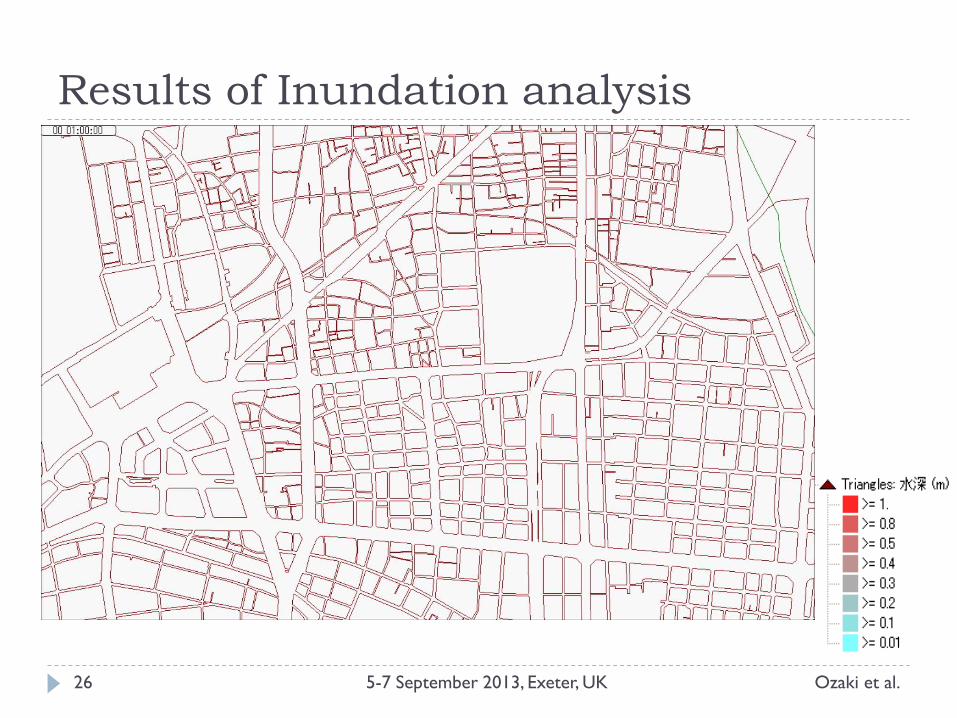
Results of Inundation analysis
Ozaki et al. 5-7 September 2013, Exeter, UK 26
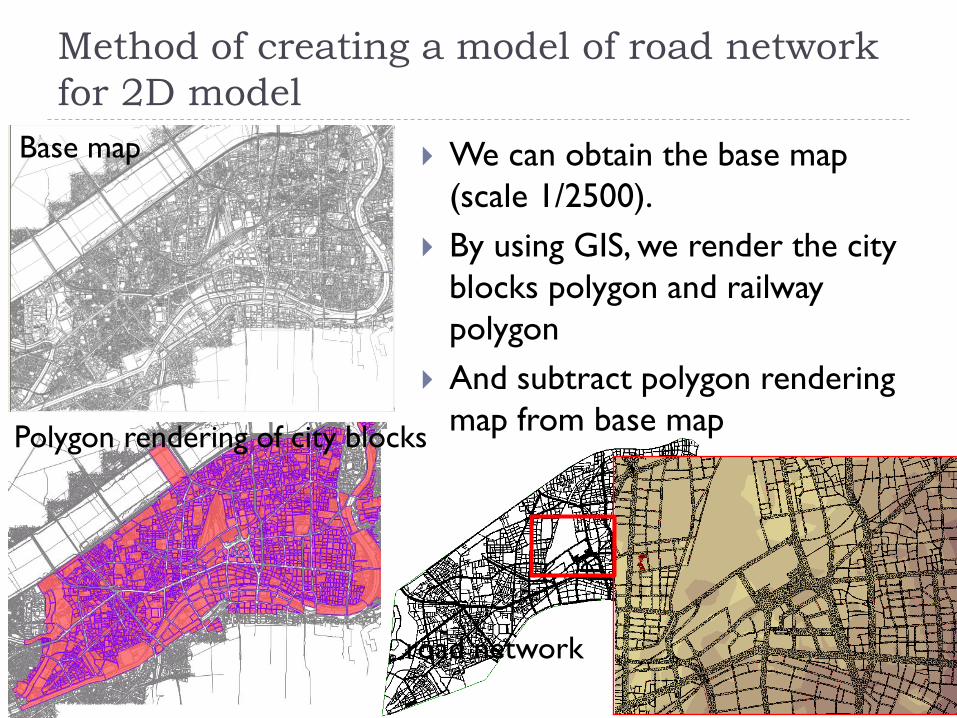
Method of creating a model of road network
for 2D model
Ozaki et al. 5-7 September 2013, Exeter, UK 27
We can obtain the base map
(scale 1/2500).
By using GIS, we render the city
blocks polygon and railway
polygon
And subtract polygon rendering
map from base map
Base map
Polygon rendering of city blocks
road network
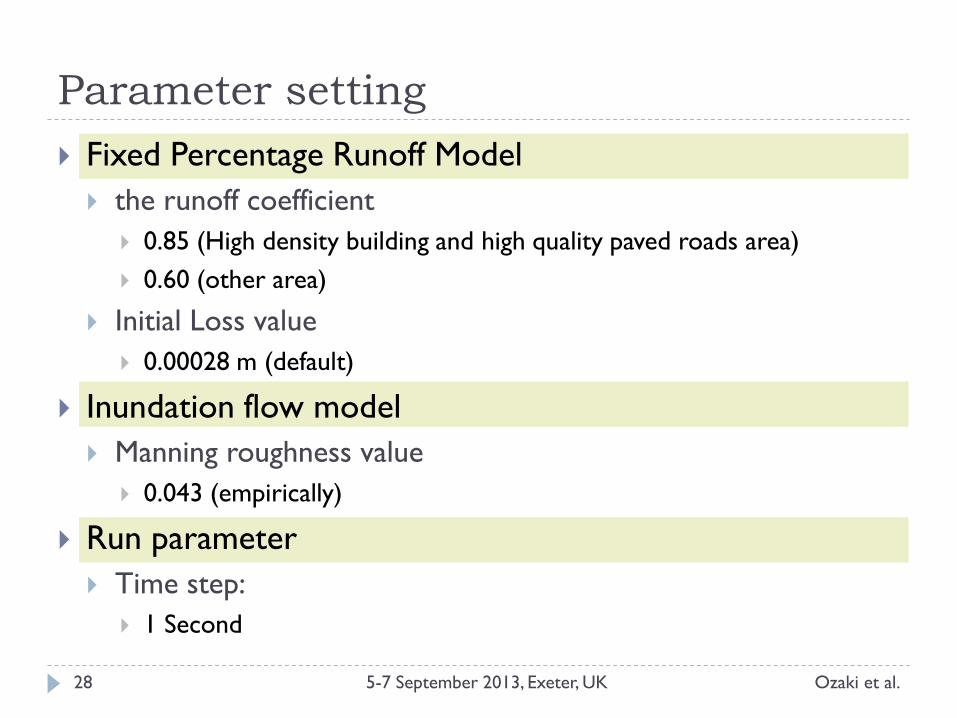
Parameter setting
Ozaki et al. 5-7 September 2013, Exeter, UK 28
Fixed Percentage Runoff Model
the runoff coefficient
0.85 (High density building and high quality paved roads area)
0.60 (other area)
Initial Loss value
0.00028 m (default)
Inundation flow model
Manning roughness value
0.043 (empirically)
Run parameter
Time step:
1 Second