Embed Size (px)
Citation preview

Proceedings of the 8th Conf. Int. Forum Urban., E005, doi:10.3390/ifou-E005.
8th Conference of theInternational Forum on Urbanism
True Smart and Green City?
Conference Proceedings Paper
Quantitative Analysis of Urban Pluvial Flood Alleviation by Open Surface Water Systems in New Towns: Comparing Almere and Tianjin Eco-City
Zhengnan Zhou 1,*, Lei Qu 2 and Tao Zou 3
1 School of Architecture, Tsinghua University & Key Laboratory of Eco Planning and Green
Building, Ministry of Education, Tsinghua University, Beijing, China; School of Architecture,
Tsinghua University, 100084 Beijing, China
2 Faculty of Architecture, Delft University of Technology, 2600 GA Delft, The Netherlands
3 Tsinghua Tongheng Urban Planning and Design Institute, Tsinghua Tongheng Urban Planning and
Design Institute, 100085 Beijing, China
* Author to whom correspondence should be addressed; Tel.: +86-10-62773094; Fax: +86-10-
62770314; E-mail: [email protected]
Abstract: Increased surface runoff generated in urban areas due to larger proportion of
impervious surfaces has, in many cases, exceeded the capacity of urban drainage systems. In
response to such challenge, this paper introduces the quantitative analysis of pluvial flood
alleviation by open surface water systems in the case of Almere in the Netherlands and
compares it with Tianjin Eco-city in China, with the aim of optimising land use planning
and urban design for new urban districts. The methodology is a combination of quantitative
and qualitative analysis. With the analytical tool of ArcGIS, the authors have investigated
the influence of spatial distribution of surface water system on the reduction of pluvial flood
risks. The conclusions include some preliminary principles: (1) a densely distributed surface
water network is preferable; (2) areas farther away from water body require water sensitive
spatial intervention; (3) optimizing the allocation of different types of ground surface could
contribute to pluvial flood alleviation. An alternative design proposal for a typical urban
block in Tianjin Eco-city has been put forward to illustrate these principles.
Keywords: Pluvial flood; runoff coefficient; surface water; ground surface

Proceedings of the 8th Conf. Int. Forum Urban. E005
1. Introduction
Although there is still considerable uncertainty about global climate change, it is clear that an
increasing intensity of extreme weather events, such as heavy storms, will be a result. (Karl, T.R. and
Trenberth, K.E., 2003). This will increase the risks of pluvial flooding in city regions that are
undergoing a fast urbanization, where vast urban construction has generated growing impervious
surfaces. In recent years, cities in China have experienced a higher intensity and frequency of heavy
rainfalls. For instance, the total precipitation during a rainfall event on July 26th 2012 in Tianjin
metropolitan area reached 300mm, which amounts highest in local history. Just several days earlier
than that, on July 21st and 22nd 2012, the heaviest storm in 61 years just hit Beijing. Severe water
logging appeared throughout the urban area, with numerous cars drawn and damaged, 61 citizens died,
costing 11.64 billion RMB economic loss in total. Ever since then, the municipal governments have
taken great effort to seek for more climate adaptive urban development strategies.
Currently, most Chinese cities are managing storm water with technical solutions based on
underground drainage systems. As defined in the <Code for design of outdoor wastewater
engineering> (GB 50014-2006, 2006), storm water sewer systems shall be designed for a return period
from 0.5 to 3 years. A higher standard of 3 to 5 years’ return period is applied in areas of higher
importance or higher flooding risks. These systems can typically manage 30 to 50 mm of precipitation
per hour without prominent risks of pluvial flooding. However, once it exceeds 50 mm per hour,
serious water logging problems are very likely to occur. The latest <Code for design of outdoor
wastewater engineering> (GB 50014-2006, 2011) encourages choosing the upper limits of design
standards. However, it is still much lower than European standards, which require storm water sewer
systems designed for a return period from 5 to 10 years, in accordance with the European standard for
planning, design and operation of drain and sewer systems outside buildings (EN 752, 2008).
Raising the standard is not the only concern in Europe. Increased pressures on water resources, and
increasing awareness of the environmental impact of storm water discharge on quality of receiving
water has led to alternative approaches in managing the urban water cycle. It is expected that extreme
weather events usually generate a great amount of surface runoff in urban built up areas. What is now
being found is that, due to the high percentage of impervious surfaces created by the urbanization
process, even small storm events can generate large amounts of surface runoff. During extreme
weather events, surface runoff must be removed from built up areas rapidly enough to prevent water
logging. Usually this is accomplished by means of underground drainage, which conveys surface
runoff away more rapidly than natural drainage paths. However, such rapid convey of runoff can lead
to flooding of the streams that receive the runoff. This can occur much more frequently in an urbanized
setting, due to the excessive amount of runoff production (U.S. EPA. 1999).
There is increasing awareness in Europe that to cope with the heightened urban flood risks, both
underground and above ground water systems should be developed (Ashley et al. 2007, Price and
Vojinovic 2008, Tait et al. 2008, Fratini et al., 2012). An alternative way of thinking is to manage
rainwater as a resource rather than a waste stream. With this in mind, runoff could be controlled at the
point of generation, instead of simply being discharged (U.S. EPA. 1999). For example, in the
Netherlands, creating an increased amount of space for containing water in the built up areas has
become the new spatial policy, with concepts of ‘living with water’ well promoted in the latest policy

Proceedings of the 8th Conf. Int. Forum Urban. E005
documents (the Dutch National Water Plan 2009-2015). In the same line, the Netherlands has also
developed the ‘strategy for sustainable water management in the 21st century’. One of the main
concepts of the strategy is to reduce, as much as possible, the discharge of (comparably clean)
rainwater. Priority is given to decentralized retention, collection of rainwater, and on-site storage in
surface water bodies like ditches, ponds, lakes, or water facilities, such as tanks. Only surplus water
that can neither be retained nor stored is discharged to rivers or canals. This strategy is supported by
the fact that, for new urban developments in the Dutch lowlands, the integration of open surface water
bodies is compulsory, being required by district water boards. There is a regulation making sure that a
specific portion (e.g., 5% or 10%) of the land surface of new urban developments is left for open water
bodies (Schuetze and Chelleri, 2013).
Besides the general principles and qualitative approaches, storm water management also requires
quantitative data and methods for making decisions in investments (Spekkers et al., 2011). One of the
most important research approaches is computer simulation by means of software tools developed for
hydrological engineers. For instance, the EPA (US Environmental Protection Agency) Storm Water
Management Model (SWMM), a dynamic rainfall-runoff simulation model used for single event or
long-term (continuous) simulation of runoff quantity and quality from primarily urban areas, can be
used for evaluating LID (Low Impact Development) interventions, such as permeable pavement, low-
lying grass swale, etc. In addition to these, storm water management BMPs (Best Management
Practices) have also been widely studied and referred to, as control measures to mitigate changes to
both quantity and quality of urban runoff, caused by land use transformations. There are a variety of
BMPs available, and EPA has published a list of storm water BMPs for local governments, builders
and property owners ("National Menu of Storm water Best Management Practices"). However, the
BMPs approach is highly case sensitive. Knowledge and experience of the engineer is essential for the
proper use of it.
The remaining questions include, for instance, how could urban planners have a better
understanding on the quantitative relationship between planning interventions and pluvial flood
alleviation? What kind of correlated principles and guidelines could be used for planning interventions
in practice? Is there an analytical tool for such quantitative study?
This paper tries to answer these questions, by comparing the quantitative and qualitative analysis of
two study cases: a Dutch and a Chinese new town. A conceptual framework has been setup, integrating
spatial planning of open surface water systems, LID strategies and BMPs. The basic idea is in line with
the above-mentioned concepts of ‘living with water’: considering the balance of water retention and
discharge in different scales, stagnant water generated by heavy rainfall in built up areas can be
collected on site, and retained in a nearby surface water system, where water retention and recycling
within the neighborhood could be implemented when needed. This is based on the precondition that
space could be created along the surface water system for the purpose of water retention during
extreme weather events. Within such a conceptual framework, the focus of this research is more on
optimizing the spatial structure of the surface water system for pluvial flood alleviation.

Proceedings of the 8th Conf. Int. Forum Urban. E005
2. Method
In order to achieve this goal, quantitative analysis on runoff coefficient of the water front areas is
made. ArcGIS is used as the analytical tool, with two mathematical formulas embedded in it: Kerby
formula and another one calculating weighted average runoff coefficient.
2.1. The range of overland flow distance in Kerby formula
In the waterfront areas, rainwater collected by roof, road, pavement, and other types of ground
surfaces during a heavy rainstorm could be directed into the surrounding surface water system, thus
reducing the water volume that enters the underground sewer system. Normally, such waterfront areas
include those within a certain distance from the water body. In order to get a rough idea of the range of
such distances that involves overland flow, calculations are made based on the Kerby formula (Kerby,
1959), which is normally used to estimate the time of concentration for a plane with sheet flow (Wong
and Chen, 1997). In the Kerby formula, the length of overland flow (L) was roughly defined as less
than 400 meters, which is considered as an upper limit in practice, and generally shorter values are
expected (Cleveland et al. 2012, Zhou et al., 1994).
tc=1.45(NL/√s)0.467
In this formula, tc is the overland flow time of concentration in minutes; N is a dimensionless
retardance coefficient, a parameter related to the type of land surface; L is the overland flow length in
meters, S is the dimensionless slope of terrain conveying the overland flow. Since this formula does
not account for the rainfall intensity, it is only valid for a limited range of rainfall intensities (Wong,
2005). Nevertheless, to define the precise length of overland flow in built up areas during heavy
rainfall is nearly impossible, neither is it the purpose of this calculation. Instead, the aim is to get a
rough idea of its range, so as to further define water front areas that may benefit from a surface water
system, in order to provide a solution to the problem of water logging.
According to the <Code for design of outdoor wastewater engineering> (GB 50014-2006, 2011) in
China, time of concentration should be approximately 5-15min. This is in reference to the rainwater
runoff from the furthest point to the drainage inlet, indicating the time range before water stagnation
occurs (depends on the type of ground surface and slope of the terrain). Such a standard was used here
to calculate the overland flow into the water body, instead of the drainage inlet. For calculating the
overland flow length ‘L’, the average of 10 min was adopted for ‘tc’; an empirical data of 1 % was
used for ‘S’; and according to table 1 (Cleveland et al. 2012), the data of paved surface (0.02) was
chosen for ‘N’ (since urban districts are the focus). Thus, the resulting overland flow length L is 300
m. This refers to an ideal situation in the Chinese context of a fully paved and relatively flat waterfront
area, where open surface water system could collect the surface runoff within 300 m.
2.2. ‘Equivalent’ weighted average runoff coefficient
In this research, the term ‘runoff coefficient’ is often mentioned, which means the ratio of total
stream flow volume to the total precipitation over a certain ground area and time (Kadioglu and Sen,
2001). Weighted average calculation on the runoff coefficient of an urban block with various types of

Proceedings of the 8th Conf. Int. Forum Urban. E005
land surface is also made to indicate the general pluvial flood risks of the block. According to the
<Code for design of outdoor wastewater engineering> (GB 50014-2006, 2011), methods such as
increasing permeable surfaces and storing water onsite will be implemented in areas with weighted
average runoff coefficient of more than 0.7. This helps to frame the methodology of this research.
Table 1. Typical values of retardance coefficient N of Kerby formula (1959).
Generalized terrain description Dimensionless retardance coefficient (N)
Pavement 0.02
Smooth, bare, packed soil 0.10
Poor grass/ cultivated row crops/ rough packed surfaces
0.20
Pasture/ average grass 0.40
Deciduous forest 0.60
Dense grass/ coniferous forest litter/ deciduous forest with deep litter
0.80
As mentioned earlier, with a precondition of enough space for water retention, the surface water
system contributes to collecting and containing rainwater from the waterfront areas within a certain
distance, reducing the amount of water discharge during heavy rainfall. Thus, considering the effects
of pluvial flood alleviation, having this type of surface water system within an urban area is equivalent
to a reduced runoff coefficient of the whole block, compared to the scenario of having no such surface
water system in it. In other words, during extreme weather events, the surface water system within the
urban block would function more as a series of water retention ponds, than part of a water drainage
system. In this case, although the total amount of surface runoff stays the same, the amount of storm
water that needs to be discharged has been largely reduced. Of course, such influence varies according
to the distance to the surface water body: the longer the distance is, the smaller the influence would be.
To make it easier for calculation, study areas are classified into four ranges: 0 to 100m, 100 to
200m, 200 to 300m, and above 300m away from the main water body (waterways, ditches, lakes, etc.).
Due to the fact that roadbeds of highways and railways, as well as the canal embankment, are all
higher than the ground level, the influence of the surface water system that is on the other side and
blocked by highways, railways or canals is not considered. Based on this approach, the ‘equivalent’
weighted average runoff coefficient of an urban block can be calculated with the following formula:
Ψ '= [m1μ (B 1ΨB +R1ΨR +P1Ψ P +G 1ΨG )+ m2μ (B 2ΨB +R 2ΨR +P2Ψ P +G 2ΨG )+
m3μ (B 3ΨB +R 3ΨR +P3Ψ P +G 3ΨG )+ (B4ΨB +R 4ΨR +P4Ψ P +G 4ΨG )] / A
Ψ': the ‘equivalent’ weighted average runoff coefficient of the whole area, considering the influence of the surface
water system on water retention;
A: the total land use area;
B1/B2/B3/B4: total roof area within the zones that are 0-100m/ 100-200m/ 200-300m/ above 300m away from the water
body respectively;

Proceedings of the 8th Conf. Int. Forum Urban. E005
R1/R2/R3/R4: total road surface area within the zones that are 0-100m/ 100-200m/ 200-300m/above 300m away from
the water body respectively;
P1/P2/P3/P4: total pavement area within the zones that are 0-100m/ 100-200m/ 200-300m/ above 300m away from the
water body respectively;
G1/G2/G3/G4: total green space area within the zones that are 0-100m/ 100-200m/ 200-300m/ above 300m away from
the water body respectively;
ΨB/ ΨR/ ΨP/ ΨG: runoff coefficient of roof / road / pavement / green space respectively;
m1/m2/m3: reduction factors within the zones that are 0-100m/100-200m/200-300m away from the water body
respectively; and
μ: correction factors for the stagnation conditions.
The ground surface is classified into four major types: roof, road surface, pavement, and green
space. With reference to the <Code for design of outdoor wastewater engineering> (GB 50014-2006,
2011), values of the runoff coefficient are defined as: ΨB (roof) =0.95; ΨR (road surface) =0.85; ΨP
(pavement) =0.55; ΨG (green space) =0.2. The value of μ is the correction factor for the stagnation
conditions, which is defined as 1.2 in this research, considering the stagnation effect of the terrain and
buildings (in typical urban blocks) on the rainwater runoff. The reduction factors of the three zones
that are 0-100m/ 100-200m/ 200-300m away from the waterfront (m1/m2/m3) are 0.25/ 0.5/ 0.75
respectively.
2.3. ArcGIS statistics
The model is simplified for practical reason, which is based on the following conditions: (1) the two
formulas can be correlated, since the difference between the amount of surface runoff and overland
flow within such a fine scale is very small and can be ignored, although it might become quite an issue
in larger hydrological regions; (2) the purpose of calculating the weighted average runoff coefficient is
to indicate the risks of pluvial flooding caused by an urban block, but not the actual amount of
overland flow, therefore the influence of gutters, sidewalk and sewer systems can be neglected.
With the application of GIS tools, it is possible to use these two formulas for quantitative analysis,
and generate geographic information or statistics on runoff coefficient or land use typologies. Such a
method could be used for different scenarios, with or without the influence of the surface water
system. Comparing different scenarios in ArcGIS can, on the one hand, quantify the contribution of
open surface water system in reducing water discharge, while on the other hand, optimize spatial
planning and design for surface water system towards a desired scenario.
3. Case Study Description: Almere and Tianjin Eco-city
In order to demonstrate the above mentioned method, this paper introduces two study cases:
Almere in the Netherlands and Tianjin Eco-city in China (Figure 1, Figure 2), which are both fast
developing new towns in embanked areas, facing the challenge of pluvial flood risks. Two urban
blocks have been chosen to conduct the quantitative analysis, Almere Stad and Tianjin Animation
Park, representing the two new towns respectively.

Proceedings of the 8th Conf. Int. Forum Urban. E005
Figure 1. The location of Almere.
Figure 2. The location of Tianjin Eco-city.
3.1. The case of Almere
The surface water system
Due to constraints in the drainage of the polders, the lower lying parts of the Netherlands are more
vulnerable to flood risks. This was reflected in damages caused by the heavy rainfall in the
Netherlands in 1998 (Jak and Kok, 2000). Being developed on reclaimed land from the sea, Almere
has been facing such risks since its early phase of development. Because of this, its water system was
designed mainly for a safe and well-functioning living environment. Currently, the city is seeking for
an integrated water management and spatial development model in line with the national policy of
‘living with water’.
Following the Dutch water culture and urban development tradition, Almere has a very densely
distributed surface water system, carefully managed, with diversified functions related to it. Such a
surface water system has contributed to the creation of urban space and identity of landscape, while at
the same time, has offered a solution to many of the water related problems that the city is facing. The
surface water system of Almere consists of lakes, canals, watercourses and ditches (Figure 3).
The ground surface typologies
In this research, Almere Stad was chosen as the focus area of the Almere case (area within the
dashed line in Figure 3, which is 30 km² in total). It is surrounded by highway (A6) and provincial
road (N702), with a railway line running through it. Its surface water system includes the Weerwater
lake, Leeghwaterplas lake, part of the Hoge Vaart canal, and a relatively dense watercourse network,
Proceedings of the 8th Conf. Int. Forum Urban. E005
which defines the spatial borders of urban blocks in Almere Stad. Since the lakes and watercourses
have relatively low water levels and a large capacity for retaining water, they could collect and retain
rainwater from the surrounding urban areas during rainstorms.
Figure 3. Spatial distribution of the surface water system in Almere.
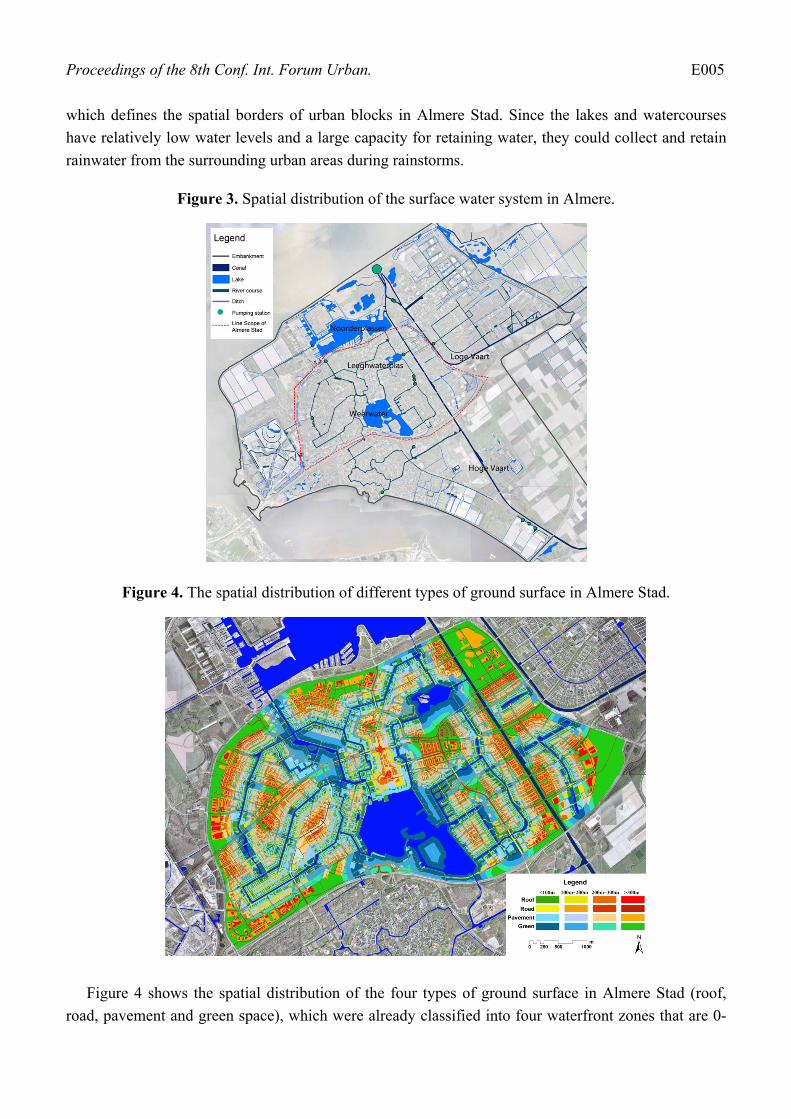
Figure 4. The spatial distribution of different types of ground surface in Almere Stad.
Figure 4 shows the spatial distribution of the four types of ground surface in Almere Stad (roof,
road, pavement and green space), which were already classified into four waterfront zones that are 0-

Proceedings of the 8th Conf. Int. Forum Urban. E005
100m, 100-200m, 200-300m, and above 300m away from the water body respectively. As a result,
percentage of the four main types of ground surface is shown in Figure 5.
Figure 5. Statistics on ground surface in Almere Stad.
In general, there is more green space than any other types of ground surface in the whole district;
while in each zone, the percentage of each ground surface varies slightly. In the ‘above 300m zone’,
green space occupies around 49% of the total ground surface, which is the highest compared to the
other zones. There is also a high percentage of green space (43%) in the ‘0- 100m zone’. Building roof
and pavement are mainly distributed in the ‘100-200m zone’ and ‘200-300m zone’, where urban space
is mainly composed of buildings, streets and squares. The ‘100-200m zone’ has the highest percentage
of roof and pavement (around 20% and 35% respectively), and the lowest percentage of green space
(around 33%), indicating the most densely built area in Almere Stad.
3.2. The case of Tianjin Eco-city
The Surface water system
Unlike the Almere case where the surface water system has been developed over the past three
decades, Tianjin Eco-city is still under large-scale construction. According to the master plan, a new
surface water system has been planned for this Eco New Town, including one lake (Qingjing Lake),
four artificial streams (Huifeng Stream, Ganlu Stream, Hupo Stream and Dongfeng Stream) and one
old watercourse (the old course of Ji Canal) (Figure 6).
Compared to Almere, Tianjin Eco-city has waterways that are much wider but a waterway network
that is far less dense in the built up areas. This is partly related to the fact that Tianjin is a city seriously
lacking water resources (as stated in Tianjin Major Functional Zones Planning, 2012).
The ground surface typologies
With the same method, ground surface typologies in Tianjin eco-city was also examined.
Considering the fact that most part of this new town has not yet been built, it is not possible to fully

Proceedings of the 8th Conf. Int. Forum Urban. E005
examine the whole site. Thus one nearly built block, National Animation and Comic Industry
Comprehensive Demonstration Park (Tianjin Animation Park) is chosen as the focus area.
Tianjin Animation Park (area within the dashed line in Figure 6) has a total area around 0.9 km². It
is located on the east bank of Ji canal with the old course of Ji canal on its Northeast border. In the
middle of the block, there is an isolated artificial pond of around 10,000 m², surrounded by high-
density public buildings. Before construction of Tianjin Animation Park, the adjacent Ji canal and the
old course of Ji canal both had dikes along them, separating the site from the watercourses. During the
construction process, the dike along the old course of Ji canal was demolished and replaced with green
space. This has made it possible for the old course of Ji canal to influence the pluvial flood alleviation
for this block (Figure 7).
Figure 6. The planned surface water system in Tianjin Eco-city.
The spatial distribution of the ground surface (Figure 8) in Tianjin Animation Park also shows quite
different characteristics: areas close to water have a rather high percentage of green space, while quite
a low percentage of building roofs. This might lead to a high quality of waterfront landscape.

Proceedings of the 8th Conf. Int. Forum Urban. E005
However, areas far away from water have relatively low percentage of green space, where it might rely
more on the underground drainage system for pluvial flood alleviation.
Figure 7. Spatial distribution of ground surface in Tianjin Animation Park.
Figure 8. Statistics on ground surface in Tianjin Animation Park.

Proceedings of the 8th Conf. Int. Forum Urban. E005
3.3. Similarities and differences
Located in coastal areas, the two cases both have vast open water surface, serving for storm water
retention, but with different spatial structures. On one hand, the surface water network in Almere is far
more densely distributed than in Tianjin Eco-city; while on the other, waterways are better connected
in Almere than the latter.
Comparing the two focus areas, Almere Stad and Tianjin Animation Park are both densely built
areas. The former case embodies the thoughts of interweaving urban space with water network, while
the latter represents urban development strategies of image branding with vast water surface.
Interestingly enough, distribution of four main types of ground surface (building roof, road, pavement,
and green space), concerning distance to waterfront, shows great difference in the two focus areas. In
Tianjin Animation Park, the farther from waterfront, the more building and pavement are allocated
with less green space; while in Almere Stad, it is on the contrary.
4. Determination of runoff coefficients in the two cases
4.1. The 'equivalent' weighted average runoff coefficients in Almere Stad
Most of the areas in Almere Stad have a weighted average runoff coefficient of around 0.45-0.6, a
result that does not consider the influence of surface water system. This is calculated by ArcGIS based
on ground surface typologies, and the results clearly indicate distribution of sealed surfaces (Figure 9).
For instance, the block to the north of Weerwater lake is a commercial area, with a relatively high
density of buildings and sealed surface. Its weighted average runoff coefficient reaches 0.69, the
highest within Almere Stad. In contrast, the block to the south of Weerwater lake is a Yacht Port. It has
a low density of buildings and less proportion of sealed surface. Its weighted average runoff coefficient
is 0.27, the lowest in Almere Stad.
Figure 9. Weighted average runoff coefficient of each block in Almere Stad.

Proceedings of the 8th Conf. Int. Forum Urban. E005
Considering the influence of the surface water systems on pluvial flood alleviation, another ArcGIS
analysis shows the ‘actual’ circumstance (Figure 10). In this case, the ‘equivalent’ weighted average
runoff coefficients of all the urban blocks are within the range of 0.2-0.45. The number of the central
commercial area to the north of the Weerwater Lake is 0.38. Comparing Figure 9 and Figure 10,
without considering the influence of the surface water system, the weighted average runoff coefficient
of each block varies greatly, since the land use pattern and building density of each block in Almere
Stad differs very much. While considering the influence of the surface water system, the ‘equivalent’
weighted average runoff coefficients of the urban blocks become more even.
Figure 10. The ‘equivalent’ weighted average runoff coefficient of each block in Almere
Stad.
4.2. The 'equivalent' weighted average runoff coefficients in Tianjin Eco-city
The same quantitative analysis made for Almere Stad is also applied in the case of Tianjin Eco-city.
The four types of ground surface (roof, green space, pavement and road) were classified according to
the four waterfront zones (0-100m, 100-200m, 200-300m, above 300m away from the water body).
Such classification only included the influence of the old course of Ji canal. Artificial ponds inside the
blocks that are not connected with the surface water system, are not considered when calculating the
‘equivalent’ weighted runoff coefficient. The influence of Ji canal to the west of the site is also not
considered, due to the fact that the flood protection dike has blocked the interaction between the canal
and the site.

Proceedings of the 8th Conf. Int. Forum Urban. E005
Figure 11. Weighted average runoff coefficient of each block in Tianjin Eco-city.
Figure 12. The ‘equivalent’ weighted average runoff coefficient of each block in Tianjin
Eco-city

Proceedings of the 8th Conf. Int. Forum Urban. E005
The calculated result of the weighted average runoff coefficient ranges from 0.38 to 0.62, while
when considering the influence of the surface water system, the number ranges from 0.21 to 0.53.
Figure 11 and Figure 12 show that the level of difference is less in the outer part of the site than in the
central area, which is closely surrounded by the old course of Ji canal. Besides, the general influence
from the surface water system in Tianjin Eco-city is much less than in the case of Almere Stad. For
example, the ‘equivalent’ weighted average runoff coefficient of Tianjin Animation Park is 0.46. It is
slightly lower than the scenario that surface water system is not considered, which is 0.51. Such a
difference is much less than the situation in most of the blocks of Almere Stad.
4.3. Similarities and differences
As for both cases, the ‘equivalent’ weighted average runoff coefficient decreases to certain extent
when considering the influence of the surface water system. However, the level of difference in
Almere Stad is much higher than in Tianjin Eco-city. In the cases of Almere Stad, as water ways are
more densely distributed, most of the urban blocks could benefit from their proximity to water body, in
terms of reducing the problem of water logging; while in Tianjin Eco-city, since waterways are much
wider but less densely distributed, only small parts of the plots share this similar advantage.
5. Recommendations
5.1. A densely distributed open surface water network
As shown in the comparison of the two case studies, spatial structure of the surface water system is
essential in pluvial flood alleviation, with the precondition that there is enough space within the
surface water system for collecting and containing storm water locally. Furthermore, a relatively de-
concentrated morphology of surface water system works better than a concentrated large water surface.
However, generally speaking, urban development driven by market economy is always pursuing for
higher land value and lower cost for public realm, leading to less investment in open space, including
surface water system. On the other hand, brandification of urban space usually leads to the fact that
surface water is planned and designed mainly for creating city image, without much consideration of
flood alleviation. These are contradictory to the notion of sustainable development, especially in the
context of global climate change. Cities need to become more adaptive to such changes, for instance
the intensive precipitation brought by extreme weather events. A densely distributed open surface
water network, with its capacity of containing storm water locally, could be seen as an effective way to
achieve this goal.
5.2. Intervention in areas farther away from water body
As indicated earlier, the proximity to water body might lead to less problems of water logging. For
areas that are farther away from water body, intervention is then needed to reduce the flooding risks.
As shown in Figure 13, a quantitative analysis on the case of Almere stad, the number of ‘equivalent’
runoff coefficient of each waterfront zone (defined by every 100m) differs. Areas with darker colors
have higher runoff coefficient, which are mostly farther away from the water body. These areas might
not be the most vulnerable, suffering from pluvial flooding, but they are the ones generate the most

Proceedings of the 8th Conf. Int. Forum Urban. E005
surface runoff. Having higher standard of underground drainage system, or implementing strategies
like LID or BMPs, might be the options there.
Figure 13. ‘Equivalent’ runoff coefficients of waterfront zones in Almere Stad.
5.3. Optimizing ground surface planning
As stated earlier, the four main types of ground surface in urban areas have different runoff
coefficients, thus different levels of impact on the risks of water logging: ΨB (roof)=0.95; ΨR (road
surface)=0.85; ΨP (pavement)=0.55; ΨG (green space)=0.2. Optimizing the allocation of these four
types of ground surfaces in waterfront areas can contribute to pluvial flood alleviation.
For example, building roof has the highest runoff coefficient, meaning that it generates the most
surface runoff. According to the calculation shown earlier, it is logical to allocate more buildings close
to the surface water system, where surface runoff could be collected and contained. Green space,
having the lowest runoff coefficient, generates the least surface runoff. On the one hand, it is logical to
allocate more green space in areas far away from the water body in order to avoid water ponding. On
the other hand, green area can filter and purify the rainwater runoffs, as well as contribute to the
waterfront landscape. Therefore it would be useful to allocate green space near water as well.
Furthermore, having green space along the water body could help to create more space for water
retention, which is crucial in managing pluvial floods.

Proceedings of the 8th Conf. Int. Forum Urban. E005
6. Alternative Design for Tianjin Animation Park
For demonstrating these recommendations, an alternative design for the case of Tianjin Animation
Park is made. To optimize the land use planning and urban design of Tianjin Animation Park in line
with pluvial flood alleviation, a slightly modified surface water system based on the current layout is
proposed. This optimization is mainly achieved by connecting the landscape pond in the middle of the
block to the old course of Ji canal, so as to increase the density of the waterway network within the
surface water system.
In this way, during a rainstorm, rainwater collected in the middle of the block could be quickly
directed into the old course of Ji canal, which will function as water retention (Figure 14). The
calculation result of the ‘equivalent’ weighted average runoff coefficient based on this modified
proposal for Tianjin Animation Park is 0.36, showing a noticeable difference.
Statistics generated from this proposal show that the spatial distribution of ground surface
typologies is quite comparable to the case of Almere Stad (Figure 15).
Figure 14. Spatial distribution of ground surface typologies (the modified proposal of
Tianjin Animation Park).

Proceedings of the 8th Conf. Int. Forum Urban. E005
Figure 15. Statistics on the spatial distribution of ground surface typologies (the modified
proposal of Tianjin Animation Park).
7. Conclusion and Outlook
Generally speaking, the conventional flood management systems are rather vulnerable when coping
with extreme weather events. On the one hand, the current standard for underground sewer system
forms the ‘bottle neck’ for storm water drainage, which is accordingly not climate adaptive. One the
other hand, the capacity of water retention systems within built up areas is also limited, due to the issue
of space availability. Thus creating largely distributed open surface water system is essential for
pluvial flood alleviation, forming a climate adaptive scheme for urban development.
The quantitative analysis shown in this paper is made to guide planning and design of the urban
surface water system in new towns, concerning pluvial flood alleviation. It also involves optimizing
the allocation of ground surface typologies in waterfront areas. The guidelines and principles have
been introduced in chapter 5, as recommendations.
Other correlated concepts and design methods, such as LID, BMPs and Water Sensitive Urban
Design, which have been largely used in practice worldwide, can be considered as means of pluvial
flood management, and furthermore, contribution to a higher spatial quality of the living environment.
These aspects could be integrated more with the quantitative approaches in further research and
practice, as what this paper has been attempting to demonstrate. Such multi-disciplinary approach
might generate more comprehensive guidelines for urban planners and designers, when dealing with
pluvial flood risks in new town development. With the support of these guidelines, spatial planning
and design might also contribute effectively to the reduction of pluvial flood risks.
Acknowledgments
This paper is supported by the International Science & Technology Cooperation Program of China
(2010DFA74490) and special fund of Key Laboratory of Eco Planning & Green Building, Ministry of
Education (Tsinghua University), China

Proceedings of the 8th Conf. Int. Forum Urban. E005
References and Notes
1. R.M. Ashley et al., Sewer system design moving into the 21st century – a UK perspective, Water
Science & Technology 2007, (55:4) , 273-281.
2. T.G. Cleveland et al., Guidance for Estimation of Time of Concentration in Texas for Low-Slope
Conditions, Texas Department of Transportation, Report #: 0-6382-P1, 2012.
3. Yuwen Zhou et al., Precipitation runoff simulation modeling by isochronal method for urban inlet
basin watershed, Journal of Shenyang Architectural and Civil Engineering Institute 1994, (10:4),
339-344
4. L.S. Coffman, Low Impact Development creating a storm of controversy, Water Resources
Impact, 2001, (3:6), 7-9
5. C.F. Fratini et al., Three Points Approach (3PA) for urban flood risk management: A tool to
support climate change adaptation through transdisciplinarity and multifunctionality, Urban
Water Journal, 2012, (9:5), 317-331
6. M. Jak and M. Kok, A database of historical flood events in the Netherlands. Flood Issues in
Contemporary Water Management, In Watt et al., (eds) NATO Science Series 2, Environmental
Security 71, Dordrecht: Kluwer Academic Publishers, 2000
7. M. Kadioglu and Z. Sen, Monthly precipitation-runoff polygons and mean runoff coefficients,
Hydrological Sciences Journal 2001, (46: 1), 3-11.
8. T.R. Karl and K.E. Trenberth, Modern Global Climate Change, Science 2003, (302:5651), 1719-
1723.
9. W.S. Kerby, Time of concentration for overland flow, Civil Engineering 1959, (29:3), 60.
10. S.D. Lloyd, T.H.F. Wong, and C.J. Chesterfield, Water sensitive urban design : a stormwater
management perspective, Melbourne, 2002
11. R.K. Price and Z. Vojinovic, Urban Flood Disaster Management, Urban Water Journal 2008,
(5 :3), 259–276
12. T. Schuetze and L. Chelleri, Integrating Decentralized Rainwater Management in Urban Planning
and Design: Flood Resilient and Sustainable Water Management Using the Example of Coastal
Cities in The Netherlands and Taiwan, Water 2013, (5:2), 593-616
13. M.H. Spekkers, J.A.E. ten Veldhuis and F.H.L.R. Clemens, Collecting data for quantitative
research on pluvial flooding, In s.n. (Eds.) 12th international conference on urban drainage, Porto
Alegre, 2011, 461-466
14. S.J. Tait et al., Sewer system operation into the 21st century: study of selected responses from a
UK prospective, Urban Water Journal 2008, (5:1), 77–86
15. U.S. EPA., Preliminary data summary of urban storm water best management practices EPA-
821-R-99-012, U. S. Environmental Protection Agency, Washington D.C., 1999.
16. T.H.F. Wong, An Overview of Water Sensitive Urban Design Practices in Australia, In 10th
International Conference on Urban Drainage, IWA Publishing, 2006, 1-8
17. T.S.W. Wong, Assessment of Time of Concentration Formulas for Overland Flow, Journal of
Irrigation and Drainage Engineering 2005, (131:4), 383-387

Proceedings of the 8th Conf. Int. Forum Urban. E005
18. T.S.W. Wong and C.N. Chen, Time of Concentration Formula for Sheet Flow of Varying Flow
Regime, J. Hydrol. Eng.1997, (2:3), 136-139
19. U.S. EPA., National Menu of Stormwater Best Management Practices,
http://cfpub.epa.gov/npdes/stormwater/menuofbmps/
20. Code for design of outdoor wastewater engineering(GB 50014-2006), Beijing: The Ministry of
Housing and Urban-Rural Development, 2006
21. Code for design of outdoor wastewater engineering(GB 50014-2006), Beijing: The Ministry of
Housing and Urban-Rural Development, 2011
22. European standard for planning, design and operation of drain and sewer systems outside
buildings(EN 752). Brussels: European Committee for Stanardization, 2008
23. The Dutch central government National Water Plan 2009-2015, www.nationaalwaterplan.nl,
2009
© 2015 by the authors; licensee MDPI and IFoU, This article is an open access article distributed
under the terms and conditions of the Creative Commons Attribution license.