Embed Size (px)
Citation preview
POVERTYTRACKER.ROBINHOOD.ORG
VULNERABILITIES AND SERVICE NEEDS OF
SINGLE-PARENT HOUSEHOLDS IN NEW YORK CITY
M O N I T O R I N G P O V E R T Y A N D W E L L - B E I N G I N N Y C
SOPHIE COLLYER, CHRISTOPHER WIMER, MATTHEW MAURY, IRWIN GARFINKEL, JENNIFER LAIRD, KATHRYN NECKERMAN, JULIEN TEITLER, AND JANE WALDFOGEL, COLUMBIA UNIVERSITY
POVERTY TRACKER | SINGLE PARENTS REPORT 1
Introduction Launched in 2012, the Robin Hood Poverty Tracker captures a more complete picture of disadvantage in
New York City than is provided by official poverty statistics. The Poverty Tracker collects data on multiple
forms of disadvantage, including poverty, material hardship, health, and a host of other factors that con-
tribute to the well-being of New York City’s households. The Poverty Tracker also follows respondents over
time, tracing the persistence of disadvantage and identifying the events or circumstances that preempt
a movement out of poverty and material hardship. This report uses Poverty Tracker data to zoom in on a
population that is subject to higher levels of poverty and material hardship at the national and local level —
single-parent households.1 There are approximately 250,000 single-parent households in New York City, and
approximately 580,000 (or 32 percent of) New York City children live in a single-parent home. This report
highlights the elevated rates of disadvantage among single-parent households and analyzes the current and
potential role of public policies in improving their well-being.
In Section 1, we look at the demographic characteristics of single-parent households, compared to the pop-
ulation of the city as a whole. In Section 2, we document differences between single-parent households and
the average New York City household in poverty and severe material hardship rates, both important measures
of households’ ability to meet basic needs and well-documented hazards to child development. In Section 3,
we report on the elevated rates of disadvantage that single-parent households face compared to the average
household in terms of other factors related to well-being, including neighborhood functioning, rent burden,
and access to emergency funds. Section 4 compares service needs and utilization among single-parent fami-
lies and households across the city. Finally, in Section 5, we examine the policies that reduce poverty among
single-parent households and estimate the potential impacts that reforms to antipoverty programs would
have on the poverty rate of single-parent households.
1We define single-parent households as those where a parent is living with one or more biological and/or foster children but with no partner or spouse.
POVERTY TRACKER | SINGLE PARENTS REPORT 2
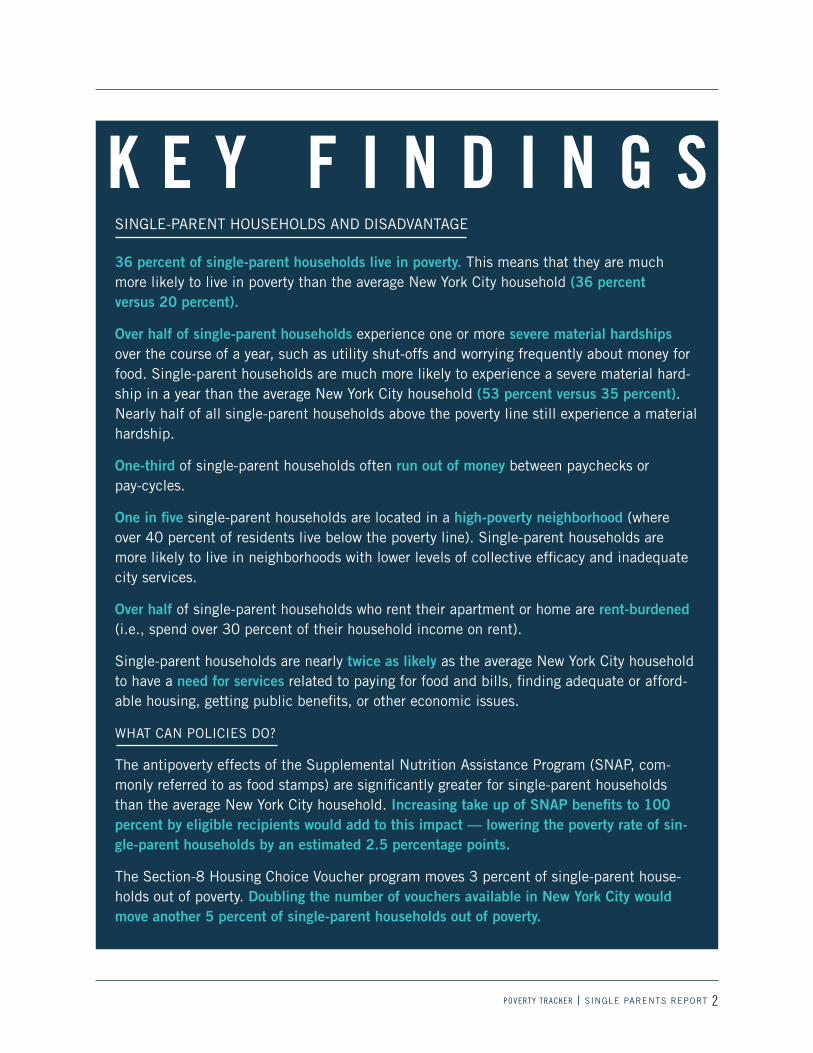
SINGLE-PARENT HOUSEHOLDS AND DISADVANTAGE
36 percent of single-parent households live in poverty. This means that they are much more likely to live in poverty than the average New York City household (36 percent versus 20 percent).
Over half of single-parent households experience one or more severe material hardships over the course of a year, such as utility shut-offs and worrying frequently about money for food. Single-parent households are much more likely to experience a severe material hard-ship in a year than the average New York City household (53 percent versus 35 percent). Nearly half of all single-parent households above the poverty line still experience a material hardship.
One-third of single-parent households often run out of money between paychecks or pay-cycles.
One in five single-parent households are located in a high-poverty neighborhood (where over 40 percent of residents live below the poverty line). Single-parent households are more likely to live in neighborhoods with lower levels of collective efficacy and inadequate city services.
Over half of single-parent households who rent their apartment or home are rent-burdened (i.e., spend over 30 percent of their household income on rent).
Single-parent households are nearly twice as likely as the average New York City household to have a need for services related to paying for food and bills, finding adequate or afford-able housing, getting public benefits, or other economic issues.
WHAT CAN POLICIES DO?
The antipoverty effects of the Supplemental Nutrition Assistance Program (SNAP, com-monly referred to as food stamps) are significantly greater for single-parent households than the average New York City household. Increasing take up of SNAP benefits to 100 percent by eligible recipients would add to this impact — lowering the poverty rate of sin-gle-parent households by an estimated 2.5 percentage points.
The Section-8 Housing Choice Voucher program moves 3 percent of single-parent house-holds out of poverty. Doubling the number of vouchers available in New York City would move another 5 percent of single-parent households out of poverty.
K E Y F I N D I N G S
POVERTY TRACKER | SINGLE PARENTS REPORT 3
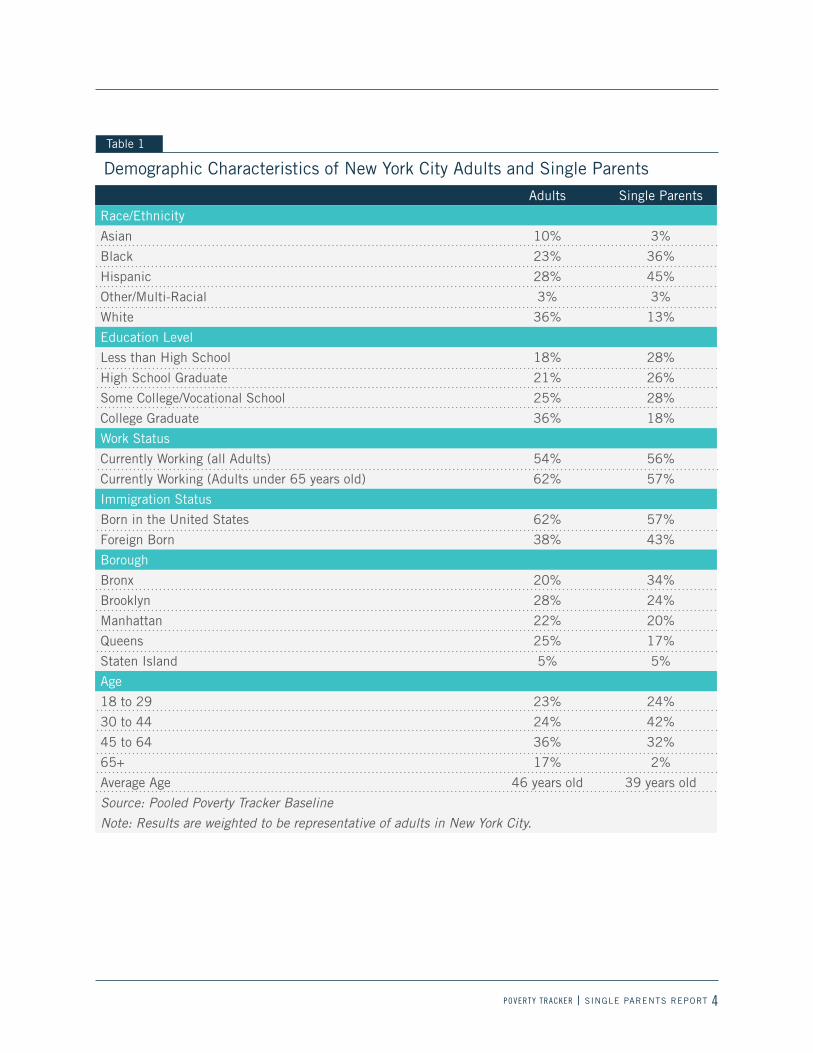
Section 1. Demographic Characteristics of Single-Parent Households Before examining poverty and other forms of disadvantage for single-parent households relative to all
households in New York City, we first present descriptive information on the demographic characteristics
of single parents in the city, compared with the demographics of the city as a whole. Table 1 shows these
demographics.
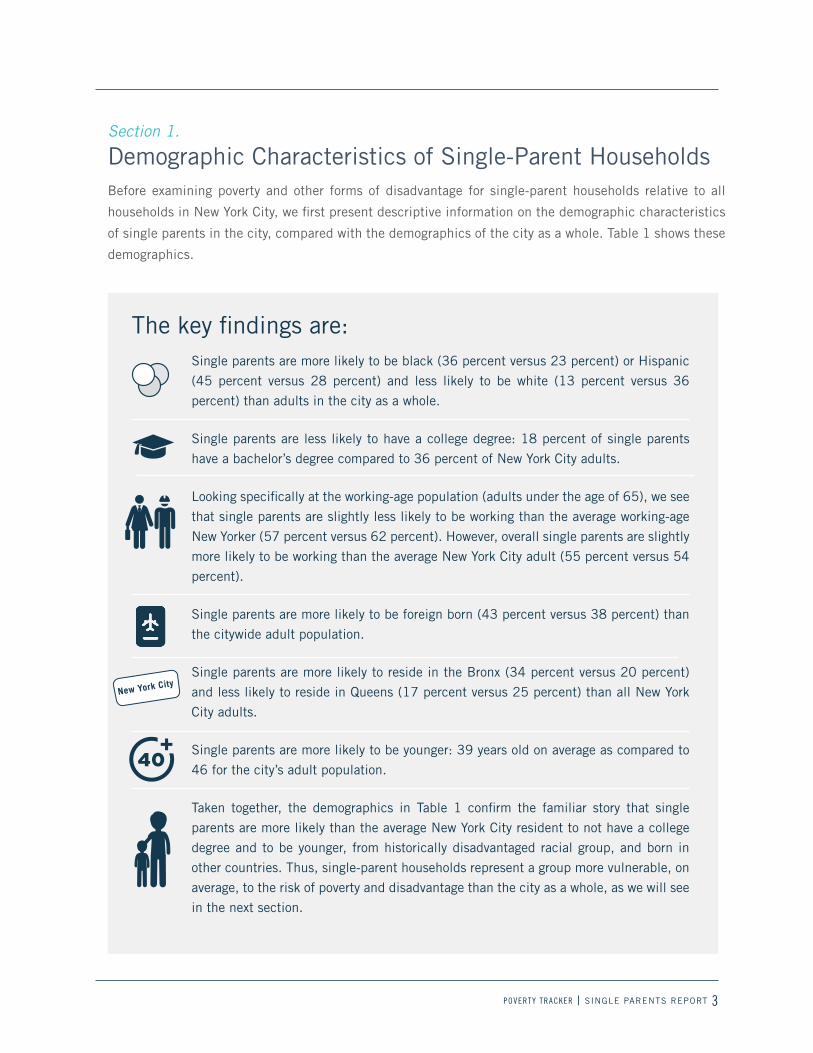
The key findings are:Single parents are more likely to be black (36 percent versus 23 percent) or Hispanic
(45 percent versus 28 percent) and less likely to be white (13 percent versus 36
percent) than adults in the city as a whole.
Single parents are less likely to have a college degree: 18 percent of single parents
have a bachelor’s degree compared to 36 percent of New York City adults.
Looking specifically at the working-age population (adults under the age of 65), we see
that single parents are slightly less likely to be working than the average working-age
New Yorker (57 percent versus 62 percent). However, overall single parents are slightly
more likely to be working than the average New York City adult (55 percent versus 54
percent).
Single parents are more likely to be foreign born (43 percent versus 38 percent) than
the citywide adult population.
Single parents are more likely to reside in the Bronx (34 percent versus 20 percent)
and less likely to reside in Queens (17 percent versus 25 percent) than all New York
City adults.
Single parents are more likely to be younger: 39 years old on average as compared to
46 for the city’s adult population.
Taken together, the demographics in Table 1 confirm the familiar story that single
parents are more likely than the average New York City resident to not have a college
degree and to be younger, from historically disadvantaged racial group, and born in
other countries. Thus, single-parent households represent a group more vulnerable, on
average, to the risk of poverty and disadvantage than the city as a whole, as we will see
in the next section.
New York City
POVERTY TRACKER | SINGLE PARENTS REPORT 4
Adults Single Parents
Race/Ethnicity
Asian 10% 3%
Black 23% 36%
Hispanic 28% 45%
Other/Multi-Racial 3% 3%
White 36% 13%
Education Level
Less than High School 18% 28%
High School Graduate 21% 26%
Some College/Vocational School 25% 28%
College Graduate 36% 18%
Work Status
Currently Working (all Adults) 54% 56%
Currently Working (Adults under 65 years old) 62% 57%
Immigration Status
Born in the United States 62% 57%
Foreign Born 38% 43%
Borough
Bronx 20% 34%
Brooklyn 28% 24%
Manhattan 22% 20%
Queens 25% 17%
Staten Island 5% 5%
Age
18 to 29 23% 24%
30 to 44 24% 42%
45 to 64 36% 32%
65+ 17% 2%
Average Age 46 years old 39 years old
Source: Pooled Poverty Tracker BaselineNote: Results are weighted to be representative of adults in New York City.
Table 1
Demographic Characteristics of New York City Adults and Single Parents
POVERTY TRACKER | SINGLE PARENTS REPORT 5
Section 2.
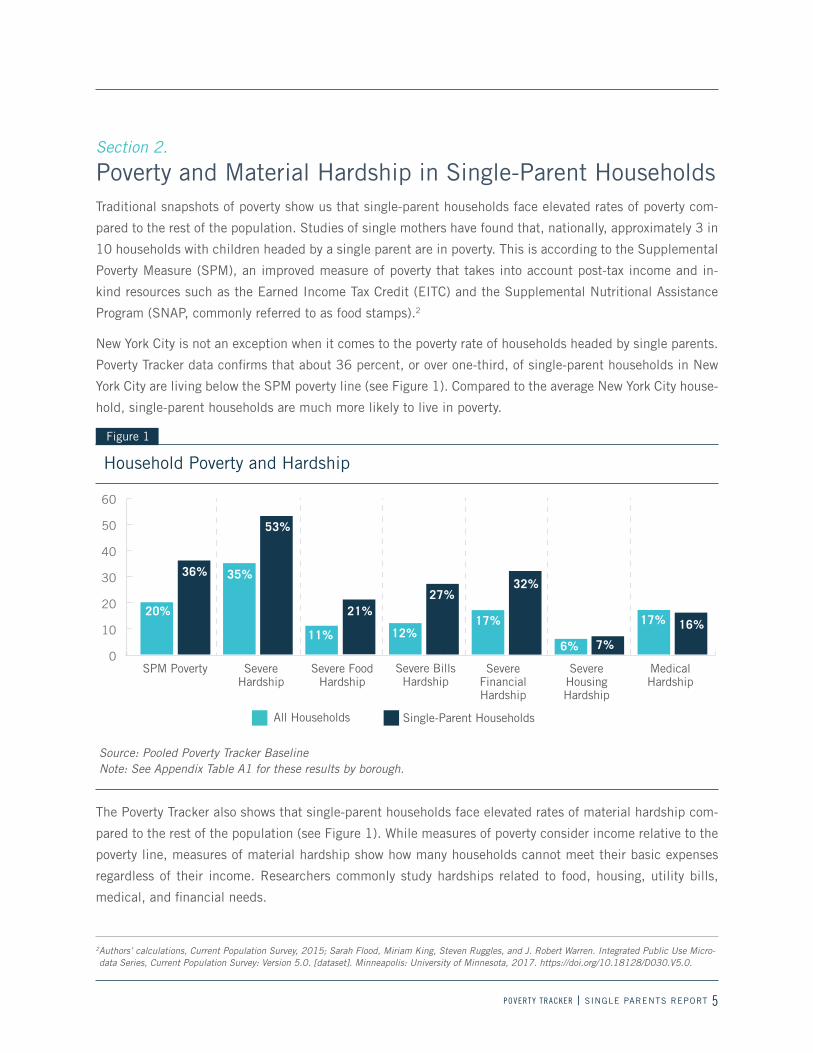
Poverty and Material Hardship in Single-Parent Households Traditional snapshots of poverty show us that single-parent households face elevated rates of poverty com-
pared to the rest of the population. Studies of single mothers have found that, nationally, approximately 3 in
10 households with children headed by a single parent are in poverty. This is according to the Supplemental
Poverty Measure (SPM), an improved measure of poverty that takes into account post-tax income and in-
kind resources such as the Earned Income Tax Credit (EITC) and the Supplemental Nutritional Assistance
Program (SNAP, commonly referred to as food stamps).2
New York City is not an exception when it comes to the poverty rate of households headed by single parents.
Poverty Tracker data confirms that about 36 percent, or over one-third, of single-parent households in New
York City are living below the SPM poverty line (see Figure 1). Compared to the average New York City house-
hold, single-parent households are much more likely to live in poverty.
The Poverty Tracker also shows that single-parent households face elevated rates of material hardship com-
pared to the rest of the population (see Figure 1). While measures of poverty consider income relative to the
poverty line, measures of material hardship show how many households cannot meet their basic expenses
regardless of their income. Researchers commonly study hardships related to food, housing, utility bills,
medical, and financial needs.
Source: Pooled Poverty Tracker Baseline Note: See Appendix Table A1 for these results by borough.
Household Poverty and Hardship
Figure 1
All Households Single-Parent Households
0
10
20
30
40
50
60
SPM Poverty Severe Hardship
Severe FoodHardship
Severe BillsHardship
Severe Financial Hardship
Severe Housing Hardship
Medical Hardship
20%
36% 35%
53%
11%
21%
12%
27%
17%
32%
6% 7%
17% 16%
2 Authors’ calculations, Current Population Survey, 2015; Sarah Flood, Miriam King, Steven Ruggles, and J. Robert Warren. Integrated Public Use Micro-data Series, Current Population Survey: Version 5.0. [dataset]. Minneapolis: University of Minnesota, 2017. https://doi.org/10.18128/D030.V5.0.
POVERTY TRACKER | SINGLE PARENTS REPORT 6
All Households
POOR HOUSEHOLDS
49%
Single-ParentHouseholds
63%
All Households
NON-POOR HOUSEHOLDS
31%
Single-ParentHouseholds
48%
The Poverty Tracker also measures these forms of material hardship and defines them as:
SEVERE FOOD HARDSHIP: Often worrying food would run out without enough money to buy more
SEVERE BILLS HARDSHIP: Having utilities cut off because of a lack of money
SEVERE FINANCIAL HARDSHIP: Often running out of money between paychecks or pay cycles
SEVERE HOUSING HARDSHIP: Having to stay in a shelter or other place not meant for regular housing, or
having to move in with others because of costs
SEVERE MEDICAL HARDSHIP: Not being able to see a medical professional because of cost
Poverty Tracker data show that just over half (53 percent) of single-parent households face some form of
severe material hardship, such as having utilities shut off or often running out of money between paychecks
(see Figure 1). This is well above the rate for the average New York City household (35 percent). Single-par-
ent households are more likely to face all types of material hardship compared to the average household, with
severe financial hardship being the most common among single-parent households.
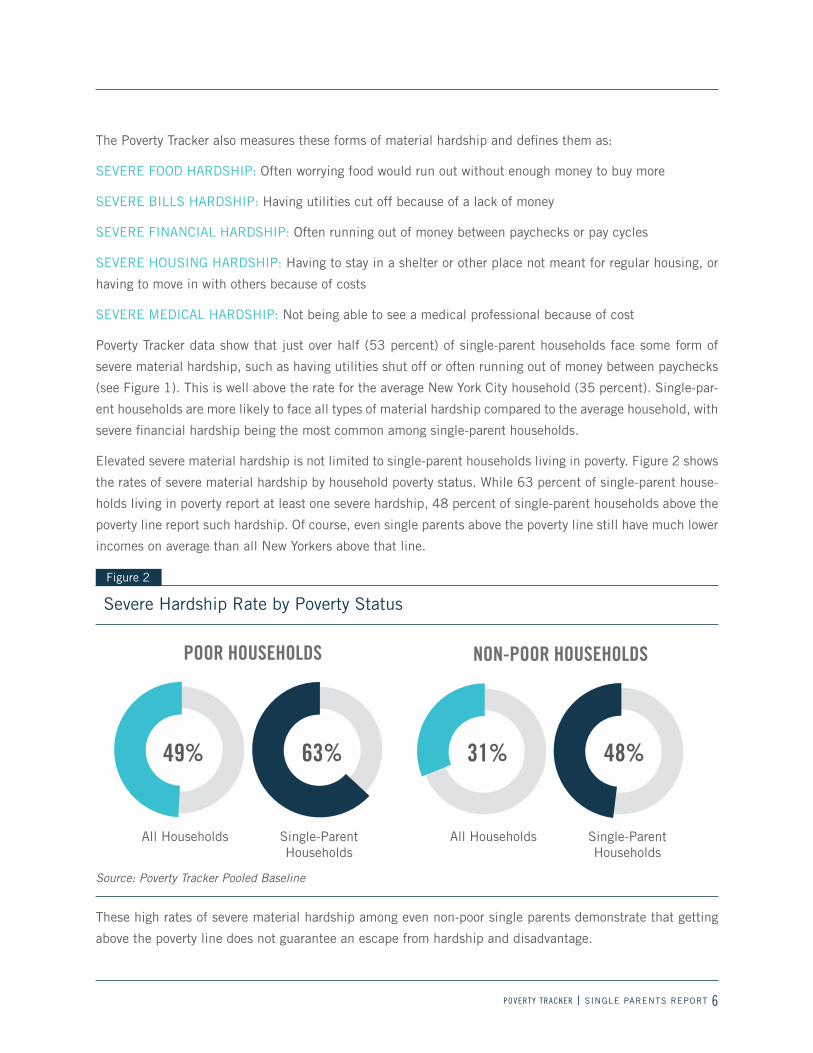
Elevated severe material hardship is not limited to single-parent households living in poverty. Figure 2 shows
the rates of severe material hardship by household poverty status. While 63 percent of single-parent house-
holds living in poverty report at least one severe hardship, 48 percent of single-parent households above the
poverty line report such hardship. Of course, even single parents above the poverty line still have much lower
incomes on average than all New Yorkers above that line.
These high rates of severe material hardship among even non-poor single parents demonstrate that getting
above the poverty line does not guarantee an escape from hardship and disadvantage.
Severe Hardship Rate by Poverty Status
Figure 2
Source: Poverty Tracker Pooled Baseline
POVERTY TRACKER | SINGLE PARENTS REPORT 7
All Households Single-Parent Households
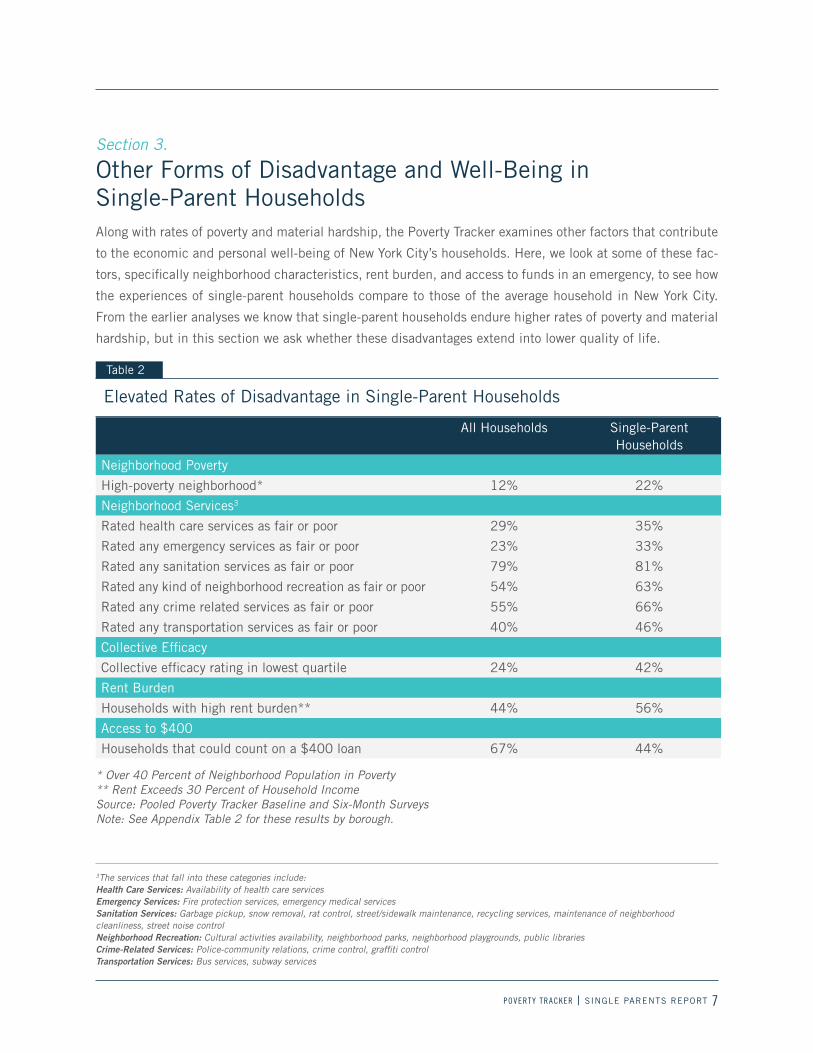
Neighborhood Poverty
High-poverty neighborhood* 12% 22%
Neighborhood Services3
Rated health care services as fair or poor 29% 35%
Rated any emergency services as fair or poor 23% 33%
Rated any sanitation services as fair or poor 79% 81%
Rated any kind of neighborhood recreation as fair or poor 54% 63%
Rated any crime related services as fair or poor 55% 66%
Rated any transportation services as fair or poor 40% 46%
Collective Efficacy
Collective efficacy rating in lowest quartile 24% 42%
Rent Burden
Households with high rent burden** 44% 56%
Access to $400
Households that could count on a $400 loan 67% 44%
Elevated Rates of Disadvantage in Single-Parent Households
Table 2
Section 3. Other Forms of Disadvantage and Well-Being in Single-Parent HouseholdsAlong with rates of poverty and material hardship, the Poverty Tracker examines other factors that contribute
to the economic and personal well-being of New York City’s households. Here, we look at some of these fac-
tors, specifically neighborhood characteristics, rent burden, and access to funds in an emergency, to see how
the experiences of single-parent households compare to those of the average household in New York City.
From the earlier analyses we know that single-parent households endure higher rates of poverty and material
hardship, but in this section we ask whether these disadvantages extend into lower quality of life.
* Over 40 Percent of Neighborhood Population in Poverty** Rent Exceeds 30 Percent of Household IncomeSource: Pooled Poverty Tracker Baseline and Six-Month SurveysNote: See Appendix Table 2 for these results by borough.
3 The services that fall into these categories include:Health Care Services: Availability of health care servicesEmergency Services: Fire protection services, emergency medical servicesSanitation Services: Garbage pickup, snow removal, rat control, street/sidewalk maintenance, recycling services, maintenance of neighborhood cleanliness, street noise controlNeighborhood Recreation: Cultural activities availability, neighborhood parks, neighborhood playgrounds, public librariesCrime-Related Services: Police-community relations, crime control, graffiti controlTransportation Services: Bus services, subway services
POVERTY TRACKER | SINGLE PARENTS REPORT 8
In the 1990s, the United States Department of Housing and Urban Development launched the Moving to
Opportunity experiment, a randomized social experiment designed to answer the question of whether “mov-
ing from a high-poverty neighborhood to a lower-poverty neighborhood improves the social and economic
prospects of low-income families.”4 Results from its data make it clear that neighborhoods matter to child
development, particularly in terms of the opportunities and resources that are available. The latest evidence
from the experiment finds that children who move to a lower-poverty neighborhood when they are young are
more likely to attend college and have higher earnings as adults.5 Single-parent households in New York City,
however, are much more likely to be located in high-poverty neighborhoods with lower levels of collective
efficacy (a measure of social cohesion – see Appendix B) and inadequate city services, such as emergency
services and transportation.
• Over 1 in 5 single-parent households reside in a high-poverty neighborhood (one in which 40 percent of
the population lives under the federal poverty line) (see Table 2). Citywide, only about 1 in 10 house-
holds are in high-poverty neighborhoods.
• And across all types of city services, specifically those related to health care, emergency services, neigh-
borhood recreation, and crime-related services, single-parent households are more likely to rate their
services as fair or poor (see Table 2).
• Nearly 2 in 5 single-parent households are located in low-collective-efficacy neighborhoods, compared
to 1 in 5 households in the city as a whole.
Single-parent households are also more likely to spend a large portion of their household income on rent.
New York City is expensive, especially in terms of housing. The Department of Housing and Urban Develop-
ment considers 30 percent of a household’s income as the appropriate cost burden for rent, defining those
paying over that amount as “rent-burdened.” Using Poverty Tracker data on monthly rent and annual house-
hold income, we are able to measure household rent burden among households that rent. About 44 percent
of New York City households and 56 percent of New York City’s single-parent households are rent-burdened
(see Table 2).6 This suggests that while all New Yorkers struggle with the city’s high rents, single-parent
households are particularly vulnerable.
Some households make use of social services to weather turbulent economic changes, and others turn to
family or friends, but not all households are able to turn to the latter. On the Poverty Tracker survey, respon-
dents are asked, “If you needed help during the next year, could you count on someone to loan you $400?”
Single-parent households are 23 percentage points less likely to be able to rely on their network for this type
of loan compared to the average household (44 percent versus 67 percent; see Table 2). In addition to facing
an elevated risk of a host of disadvantages, single-parent households are also less likely to be able to call on
a friend or family member for financial help in a time of crisis.
4 National Bureau of Economic Research. A Summary Overview of Moving to Opportunity: A Random Assignment Housing Mobility Study in Five U.S. Cities. http://www.nber.org/mtopublic/MTO%20Overview%20Summary.pdf.
5 Chetty, R., Hendren, N., & Katz, L. F. (2016). The effects of exposure to better neighborhoods on children: New evidence from the moving to opportuni-ty experiment. American Economic Review, 106(4), 855-902. https://www.aeaweb.org/articles?id=10.1257/aer.20150572.
6 These citywide estimates are in line with other studies of rent burden in New York City. See Jain, R. (2015). Whose burden is it anyway: Housing afford-ability in New York City by Household Characteristics. https://www.scribd.com/doc/289482478/Report-on-NYC-rent-burden.
POVERTY TRACKER | SINGLE PARENTS REPORT 9
Section 4.
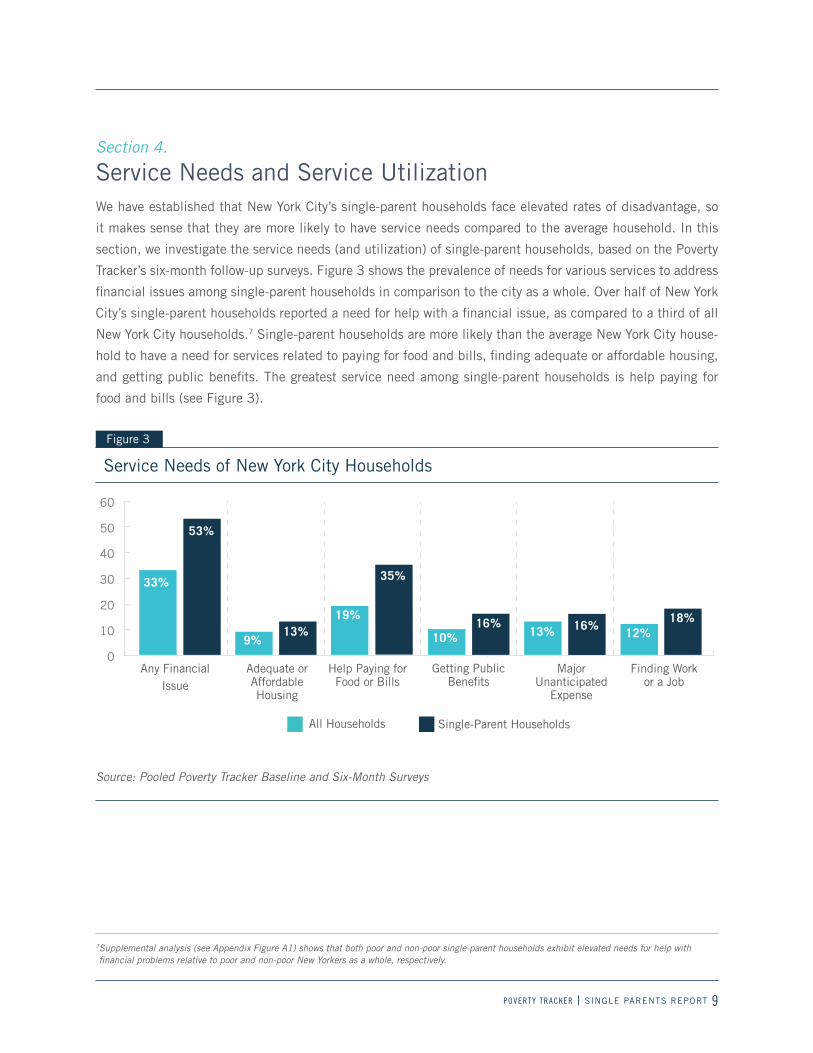
Service Needs and Service Utilization We have established that New York City’s single-parent households face elevated rates of disadvantage, so
it makes sense that they are more likely to have service needs compared to the average household. In this
section, we investigate the service needs (and utilization) of single-parent households, based on the Poverty
Tracker’s six-month follow-up surveys. Figure 3 shows the prevalence of needs for various services to address
financial issues among single-parent households in comparison to the city as a whole. Over half of New York
City’s single-parent households reported a need for help with a financial issue, as compared to a third of all
New York City households.7 Single-parent households are more likely than the average New York City house-
hold to have a need for services related to paying for food and bills, finding adequate or affordable housing,
and getting public benefits. The greatest service need among single-parent households is help paying for
food and bills (see Figure 3).
Service Needs of New York City Households
Figure 3
Source: Pooled Poverty Tracker Baseline and Six-Month Surveys
0
10
20
30
40
50
60
Any Financial Issue
Adequate or Affordable Housing
Help Paying for Food or Bills
Getting Public Benefits
Major Unanticipated
Expense
Finding Work or a Job
33%
53%
9%13%
19%
35%
10%16%
13% 16%12%
18%
All Households Single-Parent Households
7 Supplemental analysis (see Appendix Figure A1) shows that both poor and non-poor single-parent households exhibit elevated needs for help with financial problems relative to poor and non-poor New Yorkers as a whole, respectively.
POVERTY TRACKER | SINGLE PARENTS REPORT 10
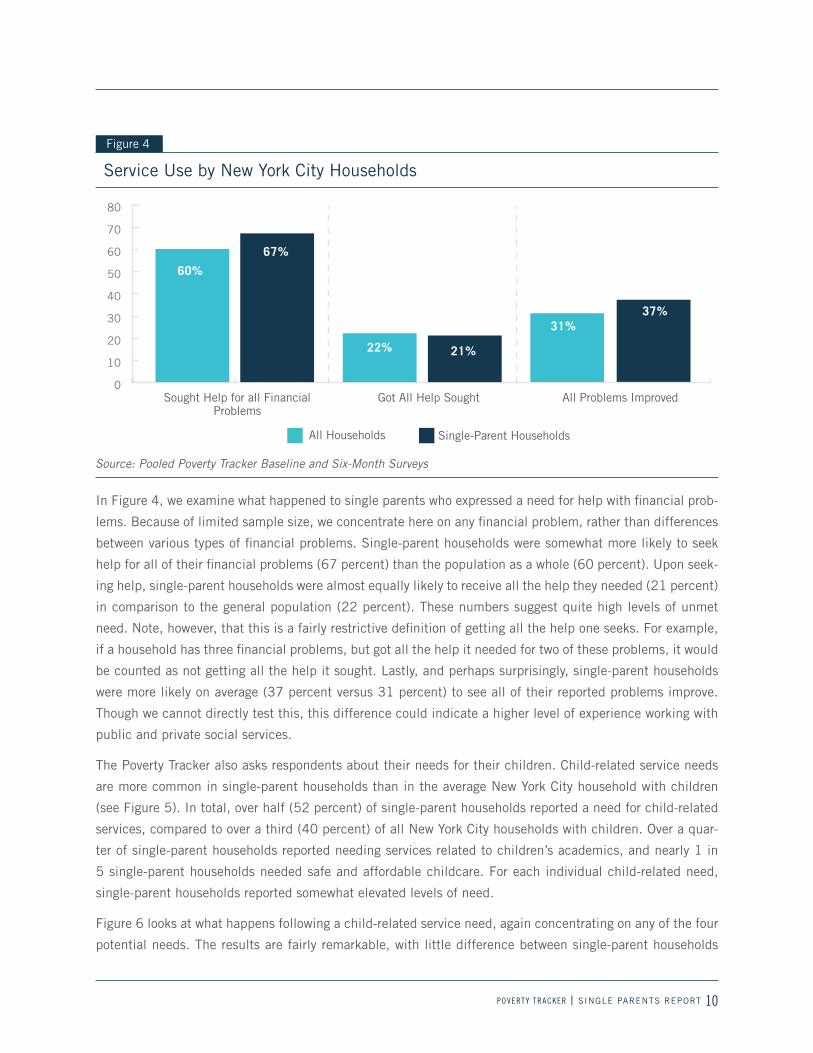
In Figure 4, we examine what happened to single parents who expressed a need for help with financial prob-
lems. Because of limited sample size, we concentrate here on any financial problem, rather than differences
between various types of financial problems. Single-parent households were somewhat more likely to seek
help for all of their financial problems (67 percent) than the population as a whole (60 percent). Upon seek-
ing help, single-parent households were almost equally likely to receive all the help they needed (21 percent)
in comparison to the general population (22 percent). These numbers suggest quite high levels of unmet
need. Note, however, that this is a fairly restrictive definition of getting all the help one seeks. For example,
if a household has three financial problems, but got all the help it needed for two of these problems, it would
be counted as not getting all the help it sought. Lastly, and perhaps surprisingly, single-parent households
were more likely on average (37 percent versus 31 percent) to see all of their reported problems improve.
Though we cannot directly test this, this difference could indicate a higher level of experience working with
public and private social services.
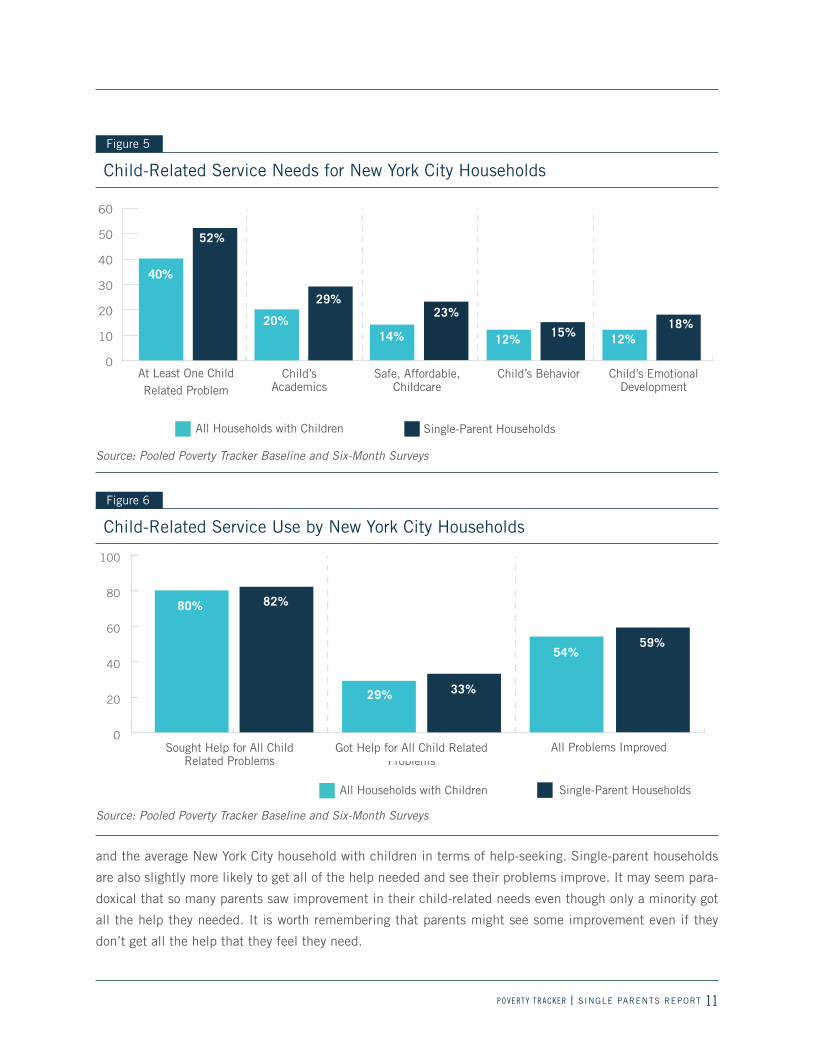
The Poverty Tracker also asks respondents about their needs for their children. Child-related service needs
are more common in single-parent households than in the average New York City household with children
(see Figure 5). In total, over half (52 percent) of single-parent households reported a need for child-related
services, compared to over a third (40 percent) of all New York City households with children. Over a quar-
ter of single-parent households reported needing services related to children’s academics, and nearly 1 in
5 single-parent households needed safe and affordable childcare. For each individual child-related need,
single-parent households reported somewhat elevated levels of need.
Figure 6 looks at what happens following a child-related service need, again concentrating on any of the four
potential needs. The results are fairly remarkable, with little difference between single-parent households
Service Use by New York City Households
Figure 4
Got All Help Sought All Problems Improved
All Households Single-Parent Households
0
10
20
30
40
50
60
70
80
60%
67%
22% 21%
31%37%
Sought Help for all Financial Problems
Source: Pooled Poverty Tracker Baseline and Six-Month Surveys
POVERTY TRACKER | SINGLE PARENTS REPORT 11
and the average New York City household with children in terms of help-seeking. Single-parent households
are also slightly more likely to get all of the help needed and see their problems improve. It may seem para-
doxical that so many parents saw improvement in their child-related needs even though only a minority got
all the help they needed. It is worth remembering that parents might see some improvement even if they
don’t get all the help that they feel they need.
Child-Related Service Needs for New York City Households
Figure 5
0
10
20
30
40
50
60
At Least One Child Related Problem
Child’s Academics
Safe, Affordable,Childcare
Child’s Behavior Child’s Emotional Development
40%
52%
20%
29%
35%
23%
12%14% 15% 12%18%
All Households with Children Single-Parent Households
Child-Related Service Use by New York City Households
Figure 6
Got Help for All Child RelatedProblems
All Households with Children Single-Parent Households
0
20
40
60
80
100
80% 82%
29% 33%
54%59%
Sought Help for All Child Related Problems
All Problems Improved
Source: Pooled Poverty Tracker Baseline and Six-Month Surveys
Source: Pooled Poverty Tracker Baseline and Six-Month Surveys
POVERTY TRACKER | SINGLE PARENTS REPORT 12
Section 5.
Policies that Reduce Poverty in Single-Parent Households Because the Poverty Tracker contains the SPM, a detailed measure of income poverty, the data can be used to
analyze the effects of various policies and programs on the poverty rates of single-parent households. We can
also analyze the potential effects of alternative policies and programs. In this final section, we first present es-
timates of the current effects of policies and programs on the poverty rates of single-parent households in New
York City and compare these effects to those for the population at large. We then present estimates of the po-
tential effects of three possible policy scenarios: (1) Expansion of government housing assistance through the
Section-8 Housing Choice Voucher program, given New York City’s notoriously high housing costs and limited
supply of housing assistance for the poor; (2) Potential increases in uptake of SNAP bene fits under current pol-
icy; and (3) Potential cuts to SNAP benefits, given federal discussions about such cuts in current budget talks.
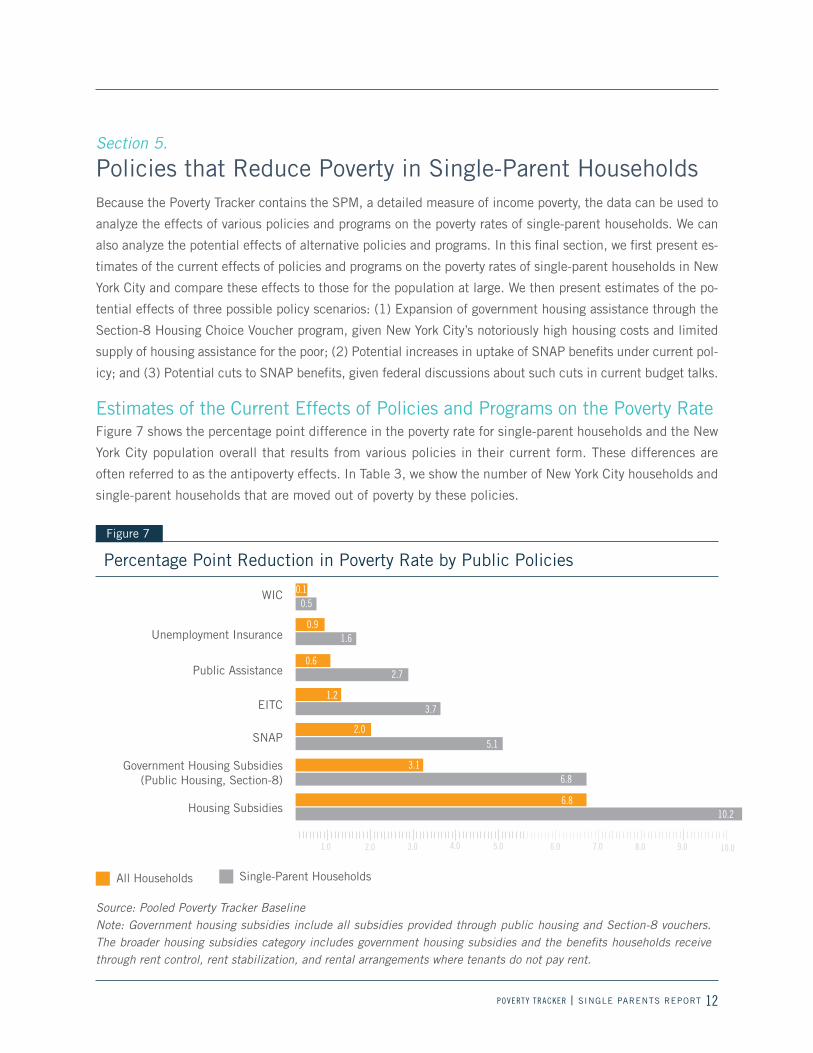
Estimates of the Current Effects of Policies and Programs on the Poverty RateFigure 7 shows the percentage point difference in the poverty rate for single-parent households and the New
York City population overall that results from various policies in their current form. These differences are
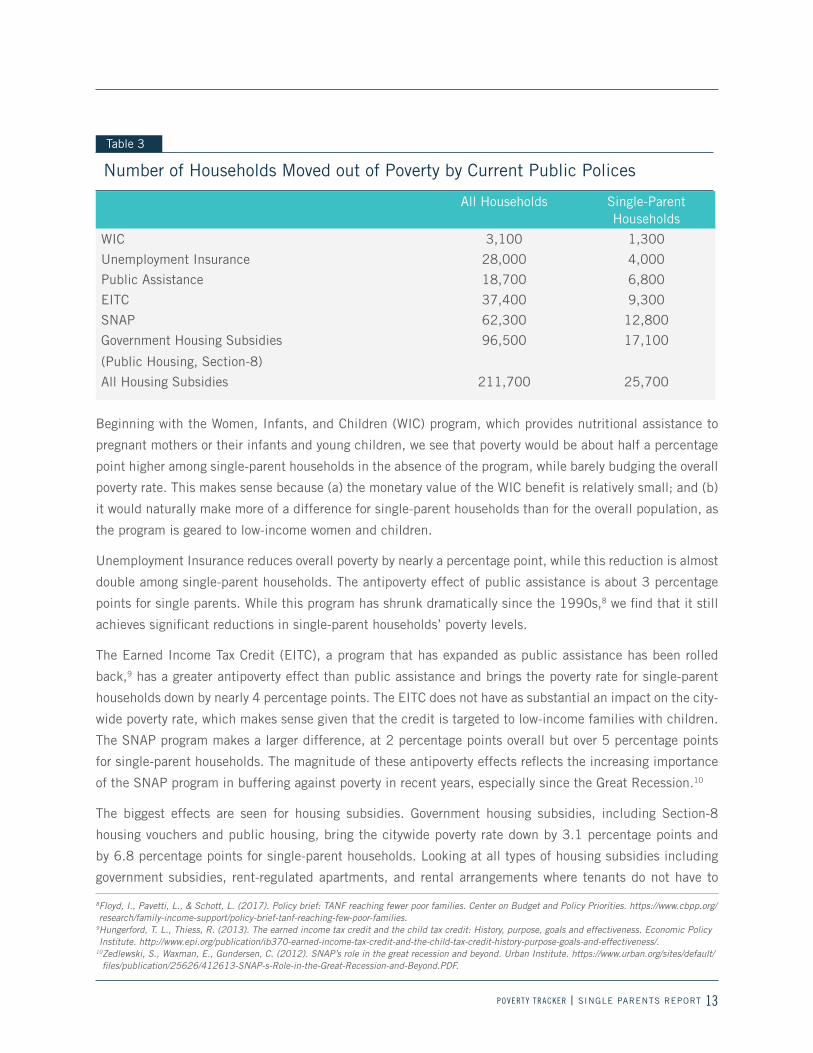
often referred to as the antipoverty effects. In Table 3, we show the number of New York City households and
single-parent households that are moved out of poverty by these policies.
Source: Pooled Poverty Tracker Baseline Note: Government housing subsidies include all subsidies provided through public housing and Section-8 vouchers. The broader housing subsidies category includes government housing subsidies and the benefits households receive through rent control, rent stabilization, and rental arrangements where tenants do not pay rent.
WIC
Unemployment Insurance
Public Assistance
EITC
SNAP
Housing Subsidies
Government Housing Subsidies (Public Housing, Section-8)
Percentage Point Reduction in Poverty Rate by Public Policies
Figure 7
All Households
0.10.5
0.91.6
0.62.7
1.23.7
2.05.1
3.16.8
6.810.2
Single-Parent Households
8.0 9.01.0 2.0 3.0 4.0 5.0 6.0 7.0 10.0
POVERTY TRACKER | SINGLE PARENTS REPORT 13
Beginning with the Women, Infants, and Children (WIC) program, which provides nutritional assistance to
pregnant mothers or their infants and young children, we see that poverty would be about half a percentage
point higher among single-parent households in the absence of the program, while barely budging the overall
poverty rate. This makes sense because (a) the monetary value of the WIC benefit is relatively small; and (b)
it would naturally make more of a difference for single-parent households than for the overall population, as
the program is geared to low-income women and children.
Unemployment Insurance reduces overall poverty by nearly a percentage point, while this reduction is almost
double among single-parent households. The antipoverty effect of public assistance is about 3 percentage
points for single parents. While this program has shrunk dramatically since the 1990s,8 we find that it still
achieves significant reductions in single-parent households’ poverty levels.
The Earned Income Tax Credit (EITC), a program that has expanded as public assistance has been rolled
back,9 has a greater antipoverty effect than public assistance and brings the poverty rate for single-parent
households down by nearly 4 percentage points. The EITC does not have as substantial an impact on the city-
wide poverty rate, which makes sense given that the credit is targeted to low-income families with children.
The SNAP program makes a larger difference, at 2 percentage points overall but over 5 percentage points
for single-parent households. The magnitude of these antipoverty effects reflects the increasing importance
of the SNAP program in buffering against poverty in recent years, especially since the Great Recession.10
The biggest effects are seen for housing subsidies. Government housing subsidies, including Section-8
housing vouchers and public housing, bring the citywide poverty rate down by 3.1 percentage points and
by 6.8 percentage points for single-parent households. Looking at all types of housing subsidies including
government subsidies, rent-regulated apartments, and rental arrangements where tenants do not have to
All Households Single-Parent Households
WIC 3,100 1,300
Unemployment Insurance 28,000 4,000
Public Assistance 18,700 6,800
EITC 37,400 9,300
SNAP 62,300 12,800
Government Housing Subsidies
(Public Housing, Section-8)
96,500 17,100
All Housing Subsidies 211,700 25,700
Number of Households Moved out of Poverty by Current Public Polices
Table 3
8 Floyd, I., Pavetti, L., & Schott, L. (2017). Policy brief: TANF reaching fewer poor families. Center on Budget and Policy Priorities. https://www.cbpp.org/research/family-income-support/policy-brief-tanf-reaching-few-poor-families.
9 Hungerford, T. L., Thiess, R. (2013). The earned income tax credit and the child tax credit: History, purpose, goals and effectiveness. Economic Policy Institute. http://www.epi.org/publication/ib370-earned-income-tax-credit-and-the-child-tax-credit-history-purpose-goals-and-effectiveness/.
10 Zedlewski, S., Waxman, E., Gundersen, C. (2012). SNAP’s role in the great recession and beyond. Urban Institute. https://www.urban.org/sites/default/files/publication/25626/412613-SNAP-s-Role-in-the-Great-Recession-and-Beyond.PDF.
POVERTY TRACKER | SINGLE PARENTS REPORT 14
pay rent (e.g., live-in superintendents), we see that the impact is even greater. These latter groups essen-
tially receive a subsidy and are included when calculating the total antipoverty effect of housing subsidies.
Housing subsidies reduce poverty by almost 7 percentage points overall and by over 10 percentage points
for single-parent households.
While these estimates show that policies make a substantial difference in reducing poverty in New York City,
especially among single-parent households, there is certainly more that could be done. In the remainder
of this section, we examine how expansions of two key programs — housing subsidies and SNAP — could
further reduce the poverty rate of single-parent households. We also examine how potential cuts could exac-
erbate poverty among these households.
POLICY SIMULATION 1: EXPANSION OF THE SECTION-8 HOUSING CHOICE VOUCHER PROGRAMCompared to other public policies, government housing subsidies are very effective at bringing New York City
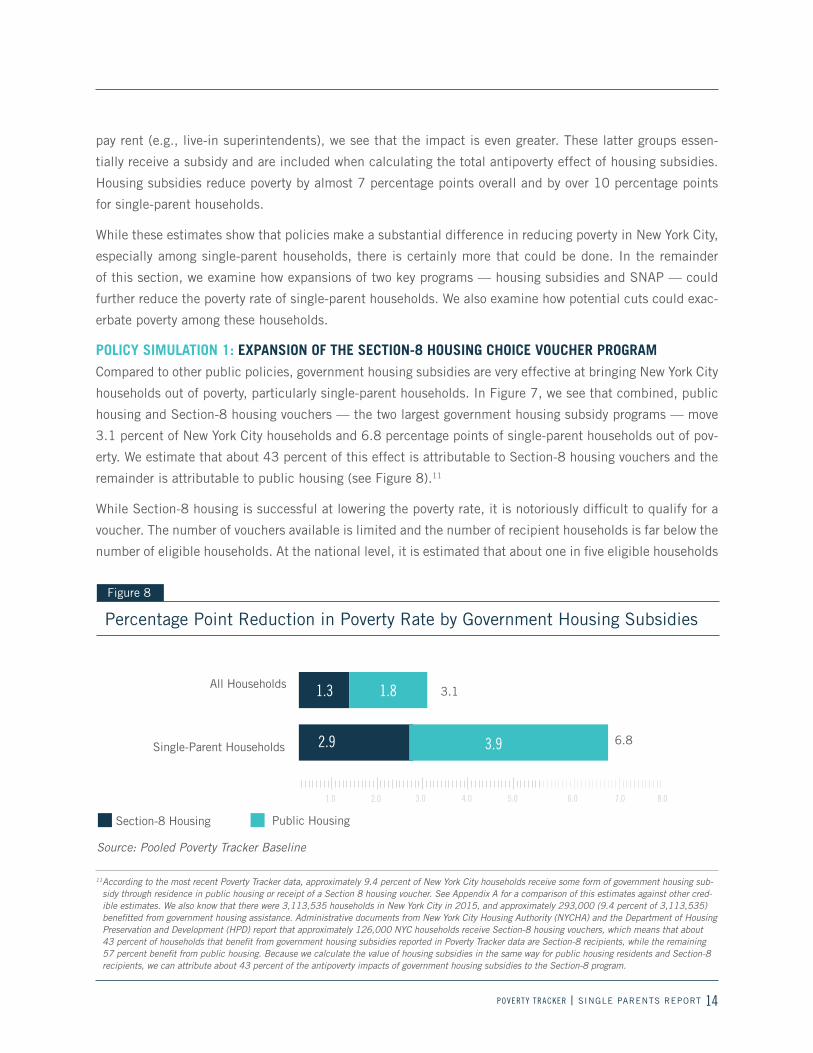
households out of poverty, particularly single-parent households. In Figure 7, we see that combined, public
housing and Section-8 housing vouchers — the two largest government housing subsidy programs — move
3.1 percent of New York City households and 6.8 percentage points of single-parent households out of pov-
erty. We estimate that about 43 percent of this effect is attributable to Section-8 housing vouchers and the
remainder is attributable to public housing (see Figure 8).11
While Section-8 housing is successful at lowering the poverty rate, it is notoriously difficult to qualify for a
voucher. The number of vouchers available is limited and the number of recipient households is far below the
number of eligible households. At the national level, it is estimated that about one in five eligible households
11 According to the most recent Poverty Tracker data, approximately 9.4 percent of New York City households receive some form of government housing sub-sidy through residence in public housing or receipt of a Section 8 housing voucher. See Appendix A for a comparison of this estimates against other cred-ible estimates. We also know that there were 3,113,535 households in New York City in 2015, and approximately 293,000 (9.4 percent of 3,113,535) benefitted from government housing assistance. Administrative documents from New York City Housing Authority (NYCHA) and the Department of Housing Preservation and Development (HPD) report that approximately 126,000 NYC households receive Section-8 housing vouchers, which means that about 43 percent of households that benefit from government housing subsidies reported in Poverty Tracker data are Section-8 recipients, while the remaining 57 percent benefit from public housing. Because we calculate the value of housing subsidies in the same way for public housing residents and Section-8 recipients, we can attribute about 43 percent of the antipoverty impacts of government housing subsidies to the Section-8 program.
7.0 8.0
Percentage Point Reduction in Poverty Rate by Government Housing Subsidies
Figure 8
Section-8 Housing
1.0 2.0 3.0 4.0 5.0 6.0
Public Housing
1.3
2.9
1.8
3.9
All Households
Single-Parent Households
Source: Pooled Poverty Tracker Baseline
3.1
6.8
POVERTY TRACKER | SINGLE PARENTS REPORT 15
receive a voucher.12 In response to the affordable housing crisis facing numerous US cities, many policy
makers, advocates, and other stakeholders have proposed to expand the Section-8 program by making more
vouchers available. Here, we predict the poverty impacts of such a proposal in New York City.
According to the New York City Housing Authority (NYCHA) and the Department of Housing Preservation and
Development (HPD)13, approximately 126,000 New York City households receive housing subsidies through
the Section-8 Housing Choice Voucher program.14 We model a 50 percent increase in the number of vouch-
ers (or 63,000 additional vouchers) and a 100 percent increase (or 126,000 additional vouchers), and then
predict the antipoverty impacts of these expansions.
We select new voucher recipients based on their predicted probability of being selected for a voucher. We use
statistical models to predict the probability that an eligible non-recipient15 would enroll for a voucher based
on how similar the recipient is to current recipients in terms of certain characteristics.16 The characteristics
we use in the model — a measure of income-to-needs, the number of children in the household, and the
number of adults in the household — are all part of the Section-8 voucher application. For each non-recip-
12 Scally, C., Batko, S., Popkin, S., DuBois, N. (2018). The case for more, not less: Shortfalls in federal housing assistance and gaps in evidence for proposed policy changes. Urban Institute. https://www.urban.org/sites/default/files/publication/95616/case_for_more_not_less.pdf.
13 These are the two largest administrations of the program in New York City. 14 See http://www1.nyc.gov/site/hpd/index.page for the estimate of the number of vouchers overseen by HPD and https://www1.nyc.gov/assets/nycha/
downloads/pdf/factsheet.pdf for the estimate of the number of vouchers overseen by NYCHA.15 Renters who qualify for Section-8 under the income requirements and do not receive any form of government housing assistance or protections under
rent controlled or stabilization.16 We used a logit model to calculate the predicted probability of Section-8 receipt. We control for the log of income-to-needs, number of children in the
household, and number of adults in the household. The sample is restricted to households eligible for Section-8 (including recipients and non-recipients).
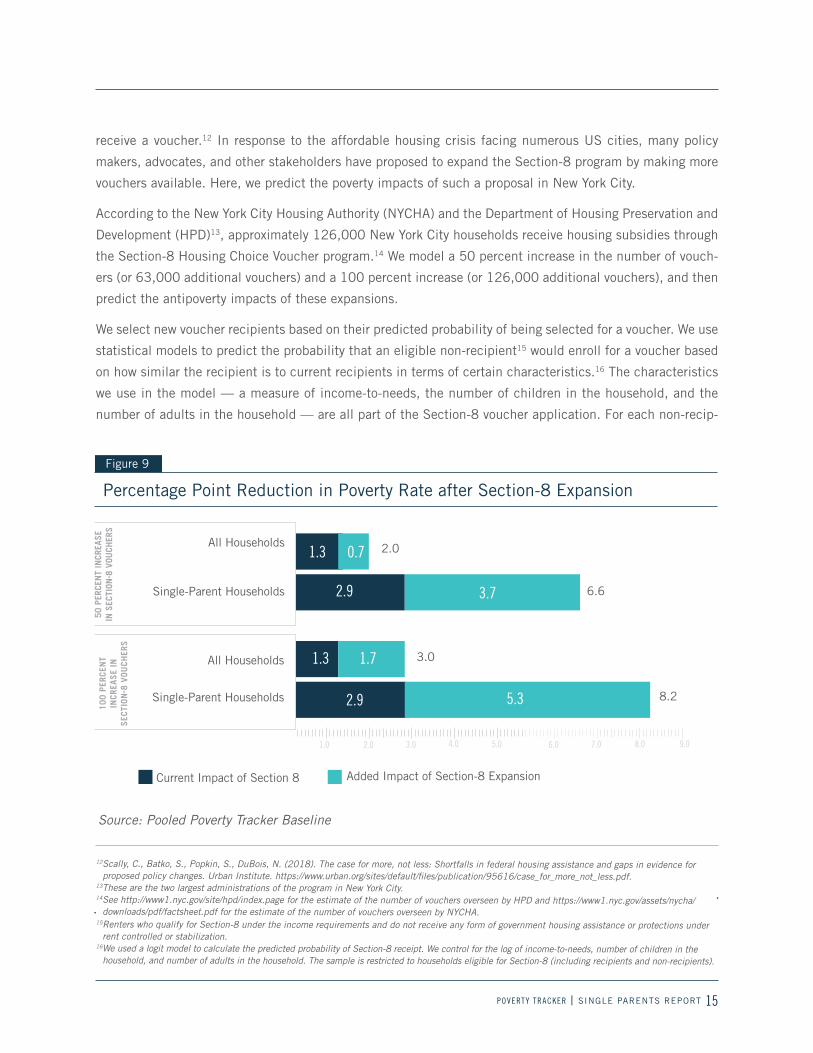
Percentage Point Reduction in Poverty Rate after Section-8 Expansion
Figure 9
1.3
1.3
2.9
1.0 2.0 3.0 4.0 5.0 6.0 7.0 8.0 9.0
Current Impact of Section 8 Added Impact of Section-8 Expansion
0.7
2.9 3.7
1.7
5.3
All Households
Single-Parent Households
All Households
Single-Parent Households
Source: Pooled Poverty Tracker Baseline
2.0
6.6
3.0
8.2
POVERTY TRACKER | SINGLE PARENTS REPORT 16
ient, our model gives us a predicted probability of being selected for the program relative to other eligible
non-recipients — the higher the probability, the more likely they are to be selected. In our first expansion of
Section-8, we rank eligible non-recipients according to these predicted probabilities. Those with the highest
probability of being selected are at the top of the order, and those with the lowest probability are last. We
then select the first 63,000 eligible non-recipients from the top of the order as new recipients. In the second
expansion, we select the first 126,000 as new recipients.
The value of the housing subsidies for new recipients is then calculated using the same methods used when
calculating the housing subsidy values for current recipients: the difference between their annual spending
on rent and the fair market rent for their household size.17
To estimate the antipoverty impacts of the Section-8 expansions, we include the subsidy value for new recip-
ients in their household resources and recalculate the poverty rate.
In Figure 9, we see the additional impact that the expansions of the Section-8 program would have on the
poverty rate. The dark blue bars represent the current impact of the Section-8 program and the light blue
bars represent the additional impact that would result from the Section-8 expansions.
Overall, the poverty rate drops as Section-8 vouchers are made available to more New Yorkers, and each
expansion has a greater impact on single-parent households than the citywide poverty rate. Doubling the
number of households that receive government housing support reduces the single-parent-household poverty
rate by 5.3 percentage points, which is over triple the impact it would have on the citywide poverty rate.18
For policymakers interested in closing the gap in the poverty rate between single-parent households and the
average household, these expansions seem promising. If selection for the vouchers follows the trend that we
modeled, the gap in the poverty rate between the single-parent household and the average household would
shrink. With the 50 percent increase in Section-8 vouchers, we find that the citywide poverty rate would
fall by 0.7 percentage points, from 20.0 percent to 19.3 percent. For single-parent households, however,
the poverty rate would fall by more — from 36 percent to 32.3 percent. The expansion would thus bene-
fit single-parent households at a greater rate, which effectively helps close the gap between single-parent
households and the average. This trend is also true with a 100 percent increase in the number of Section-8
housing vouchers available. Of course, policy impacts would be even larger if Section 8 reached all eligible
recipients, a scenario that we have not modeled given the currently low rate of receipt.
17 Note that the amount of rent that new recipients might be responsible for could decrease once they qualify for Section-8. We do not account for this change in our simulation and thus may underestimate the value of the subsidy for some new recipients.
18 Similar to the SNAP take-up simulations, if we assign these vouchers randomly to eligible non-recipients the decrease in poverty is not as significant as it is when we assigned vouchers based on our probability model. See Appendix A, Figure A2.
POVERTY TRACKER | SINGLE PARENTS REPORT 17
POLICY SIMULATION 2: POTENTIAL INCREASES IN SNAP BENEFIT UPTAKE UNDER CURRENT POLICYWhile SNAP has a significant impact on the poverty rate — moving 5.1 percent of single-parent households
out of poverty — the impact could be even greater. In 2016, approximately 27 percent of those eligible for
SNAP had not received or applied for it.19 It remains clear that New Yorkers are leaving money on the table
when it comes to SNAP benefits.
In January 2017, Robin Hood launched the Start by Asking campaign, an effort to help the many New
Yorkers who do not receive the benefits to which they are entitled — specifically SNAP, the EITC, and WIC
— access these funds. Here, we predict the poverty impacts that would result from enrolling eligible non-re-
cipients in the SNAP program.
Because of the challenges associated with getting every household that’s eligible for SNAP to take up bene-
fits, we look at the change in poverty rate under two scenarios:
(1) half of eligible non-recipient households take up benefits;
(2) and all eligible non-recipient households take up benefits.
For these simulations, we first select new recipients from our pool of eligible non-recipients and then cal-
culate a SNAP income value for each new recipient. The additional income is then included in household
resources of new recipients that we use to estimate the poverty rate under each scenario.
To select the non-recipients who would take up benefits in Scenario 1, we use a statistical model to calculate
the predicted probability that a non-recipient will enroll in the program relative to other eligible non-recipi-
ents. These predicted probabilities are based on how similar non-recipients are to current SNAP recipients in
terms of characteristics that are key in the application process and have been found to influence enrollment
in SNAP.20 The characteristics we include are: the number of adults in the household, the number of children
in the household, and a measure of each household’s income-to-needs ratio. In Scenario 1, we rank eligible
non-recipient households according to their predicted probability of enrolling relative to other non-recipients
and select the top 50 percent as new recipients (i.e., the half that are most likely to enroll are selected). In
Scenario 2, we select all eligible non-recipient households.
When assigning SNAP values to new-recipient households, we give them the median SNAP income value of
families similar to their own in terms of size and yearly resources. For example, a family of four with one to
two times the poverty line in yearly resources will be assigned the median SNAP benefit amount of families
meeting the same criteria.
Figure 10 highlights the impact these expansions would have on the poverty rate for single-parent households
and New York City as a whole. The dark blue bars represent the current impact of the SNAP program and the light
blue bars represent the added impact that would result from the increase in SNAP uptake under each scenario.
19 Rahman, R., Collyer, S., Wimer, C. (2017). Going hungry: Which new Yorkers are leaving food on the table. Robin Hood. https://robinhoodorg-produc-tion.s3.amazonaws.com/uploads/2017/12/PovertyTracker_FULLREPORT.pdf.
20 These predicted probabilities come from a logistic regression model. In the model, we predict SNAP enrollment and control for the number children in the household, the number of adults in the household, and the log of the income-to-needs ratio. The sample is restricted to SNAP-eligible recipients and non-recipients.
POVERTY TRACKER | SINGLE PARENTS REPORT 18
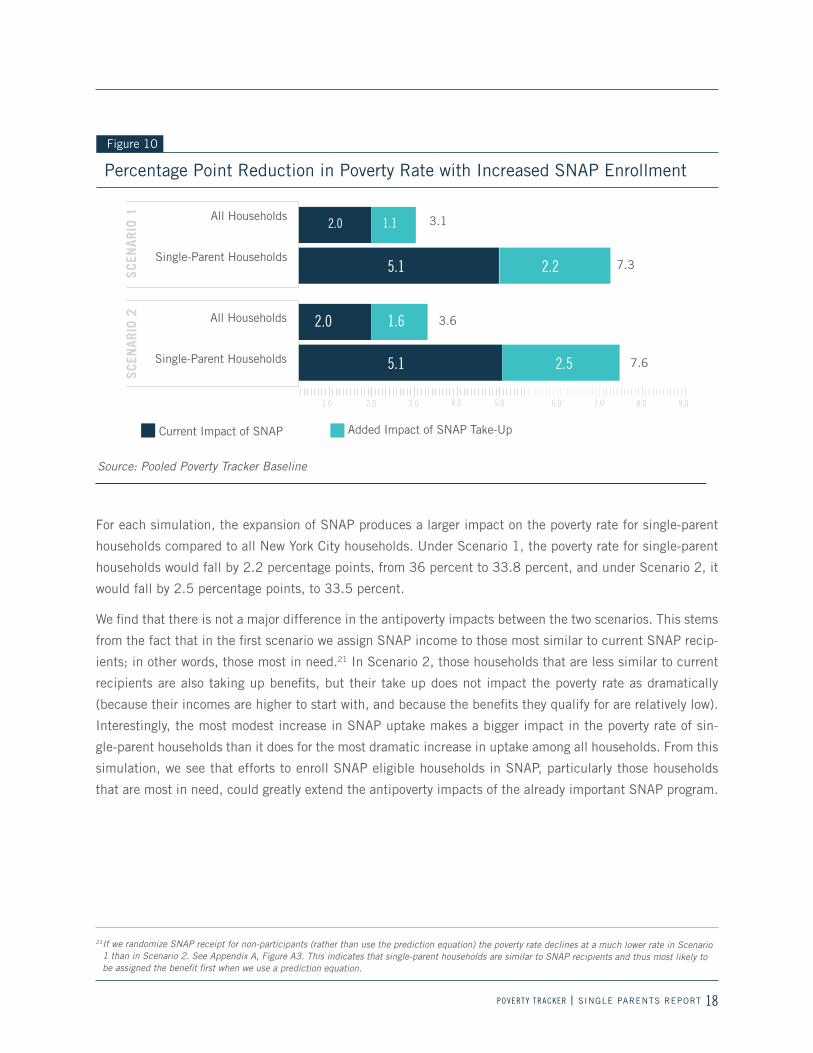
For each simulation, the expansion of SNAP produces a larger impact on the poverty rate for single-parent
households compared to all New York City households. Under Scenario 1, the poverty rate for single-parent
households would fall by 2.2 percentage points, from 36 percent to 33.8 percent, and under Scenario 2, it
would fall by 2.5 percentage points, to 33.5 percent.
We find that there is not a major difference in the antipoverty impacts between the two scenarios. This stems
from the fact that in the first scenario we assign SNAP income to those most similar to current SNAP recip-
ients; in other words, those most in need.21 In Scenario 2, those households that are less similar to current
recipients are also taking up benefits, but their take up does not impact the poverty rate as dramatically
(because their incomes are higher to start with, and because the benefits they qualify for are relatively low).
Interestingly, the most modest increase in SNAP uptake makes a bigger impact in the poverty rate of sin-
gle-parent households than it does for the most dramatic increase in uptake among all households. From this
simulation, we see that efforts to enroll SNAP eligible households in SNAP, particularly those households
that are most in need, could greatly extend the antipoverty impacts of the already important SNAP program.
Percentage Point Reduction in Poverty Rate with Increased SNAP Enrollment
Figure 10
Current Impact of SNAP
2.0
2.0
5.1
Added Impact of SNAP Take-Up
8.0 9.01.0 2.0 3.0 4.0 5.0 6.0 7.0
1.1
5.1 2.2
1.6
2.5
All Households
Single-Parent Households
All Households
Single-Parent Households
Source: Pooled Poverty Tracker Baseline
3.1
7.3
3.6
7.6
21 If we randomize SNAP receipt for non-participants (rather than use the prediction equation) the poverty rate declines at a much lower rate in Scenario 1 than in Scenario 2. See Appendix A, Figure A3. This indicates that single-parent households are similar to SNAP recipients and thus most likely to be assigned the benefit first when we use a prediction equation.
POVERTY TRACKER | SINGLE PARENTS REPORT 19
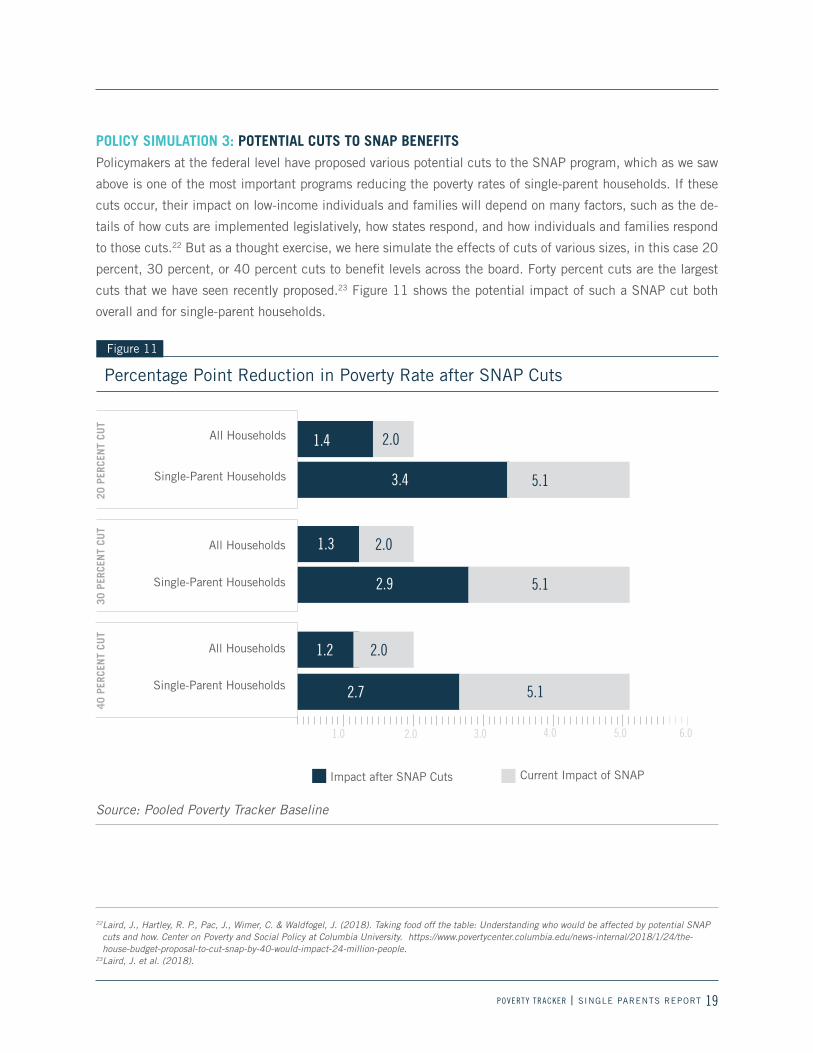
POLICY SIMULATION 3: POTENTIAL CUTS TO SNAP BENEFITSPolicymakers at the federal level have proposed various potential cuts to the SNAP program, which as we saw
above is one of the most important programs reducing the poverty rates of single-parent households. If these
cuts occur, their impact on low-income individuals and families will depend on many factors, such as the de-
tails of how cuts are implemented legislatively, how states respond, and how individuals and families respond
to those cuts.22 But as a thought exercise, we here simulate the effects of cuts of various sizes, in this case 20
percent, 30 percent, or 40 percent cuts to benefit levels across the board. Forty percent cuts are the largest
cuts that we have seen recently proposed.23 Figure 11 shows the potential impact of such a SNAP cut both
overall and for single-parent households.
Percentage Point Reduction in Poverty Rate after SNAP Cuts
Figure 11
1.4
1.3
1.2
2.9
2.7
2.0
3.4 5.1
2.0
2.0
5.1
5.1
All Households
Single-Parent Households
All Households
All Households
Single-Parent Households
Single-Parent Households
Source: Pooled Poverty Tracker Baseline
Impact after SNAP Cuts Current Impact of SNAP
1.0 2.0 3.0 4.0 5.0 6.0
22 Laird, J., Hartley, R. P., Pac, J., Wimer, C. & Waldfogel, J. (2018). Taking food off the table: Understanding who would be affected by potential SNAP cuts and how. Center on Poverty and Social Policy at Columbia University. https://www.povertycenter.columbia.edu/news-internal/2018/1/24/the-house-budget-proposal-to-cut-snap-by-40-would-impact-24-million-people.
23Laird, J. et al. (2018).
POVERTY TRACKER | SINGLE PARENTS REPORT 20
Overall, such cuts would decrease the antipoverty impacts associated with SNAP from 2.0 percentage points
to 1.4 percentage points for a 20 percent cut and to 1.2 percentage points for a 40 percent cut. This would
result in the total household poverty rate in New York City rising by 0.6 to 0.8 percentage points as cuts grow
in magnitude. For single-parent households, the magnitude of such effects would be much larger. The anti-
poverty impacts of SNAP for this group would fall from 5.1 percentage points to 3.4 percentage points with
a 20 percent cut and to 2.7 with a 40 percent cut, pushing between 1.7 and 2.4 percent of single-parent
households into poverty. Such cuts would significantly reduce the antipoverty impact of a program that many
households have turned to since the Great Recession.
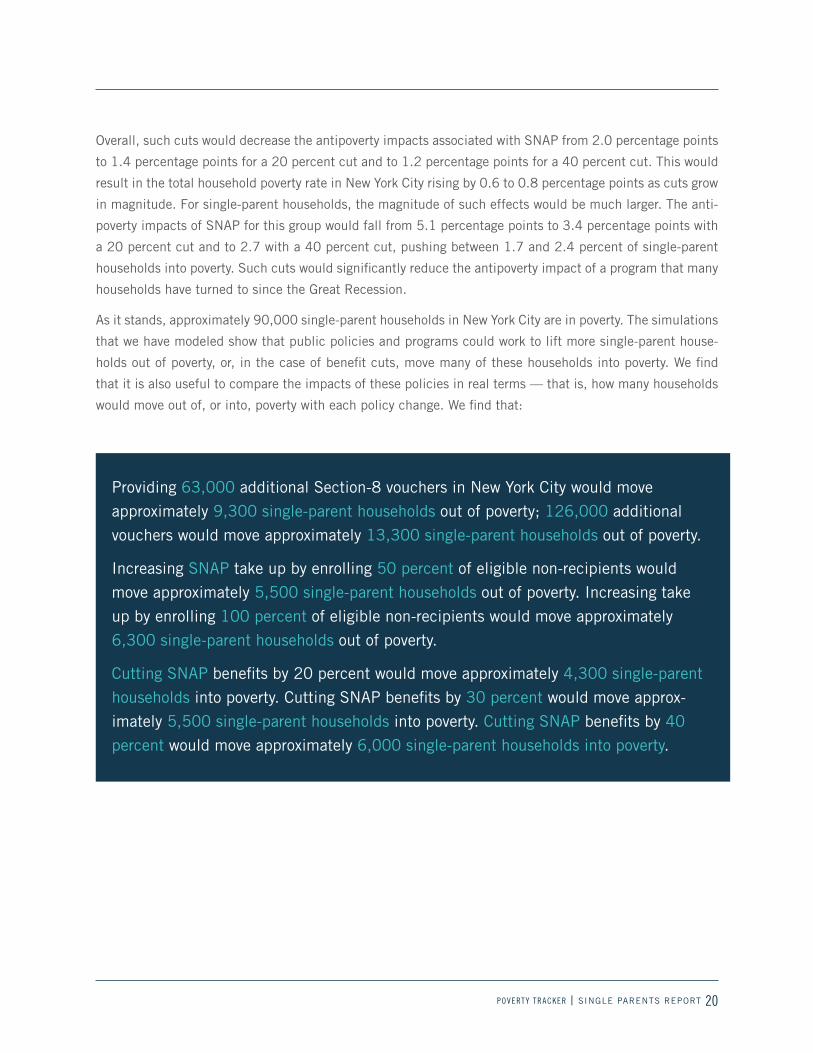
As it stands, approximately 90,000 single-parent households in New York City are in poverty. The simulations
that we have modeled show that public policies and programs could work to lift more single-parent house-
holds out of poverty, or, in the case of benefit cuts, move many of these households into poverty. We find
that it is also useful to compare the impacts of these policies in real terms — that is, how many households
would move out of, or into, poverty with each policy change. We find that:
Providing 63,000 additional Section-8 vouchers in New York City would move
approximately 9,300 single-parent households out of poverty; 126,000 additional
vouchers would move approximately 13,300 single-parent households out of poverty.
Increasing SNAP take up by enrolling 50 percent of eligible non-recipients would
move approximately 5,500 single-parent households out of poverty. Increasing take
up by enrolling 100 percent of eligible non-recipients would move approximately
6,300 single-parent households out of poverty.
Cutting SNAP benefits by 20 percent would move approximately 4,300 single-parent
households into poverty. Cutting SNAP benefits by 30 percent would move approx-
imately 5,500 single-parent households into poverty. Cutting SNAP benefits by 40
percent would move approximately 6,000 single-parent households into poverty.
POVERTY TRACKER | SINGLE PARENTS REPORT 21
ConclusionThis report uses data from the Poverty Tracker to shed new light on single-parent households in New York
City. Demographically and in terms of poverty, hardship, and other dimensions of well-being, single-parent
households represent a particularly vulnerable group. They exhibit higher than average rates of poverty and
material hardship, live in under-served neighborhoods, face higher rent burdens, and have access to less
emergency funds. Single-parent households also report elevated levels of needs, both for their households
and for their children.
Policies, programs, and single parents themselves are doing much to try to reduce this group’s disadvantag-
es. We have focused here on two key government safety net programs, SNAP and housing assistance, though
of course many other types of efforts may stand to benefit single-parent households and their children. For
example, we know that many single parents work, and struggle to balance work and family responsibilities.
Although their effects are harder to quantify, city and state policies like paid family leave, sick leave, and
child care subsidies are potentially important for the many single parents who are employed. Many govern-
ment policies and community programs reach single parents, and there remains much work to be done to
understand how the programs affect single parents, their children, and other households across the city.
POVERTY TRACKER | SINGLE PARENTS REPORT 22
Appendix A. Supplemental Analysis
SPM Poverty
Severe Hardship
Severe Food
Hardship
Severe Bills
Hardship
Severe Financial Hardship
Severe Housing Hardship
Medical Hardship
Bronx All Households 26% 46% 18% 19% 24% 8% 18%
Single-Parent Households 38% 56% 24% 30% 34% 6% 14%
Brooklyn All Households 19% 37% 10% 13% 17% 6% 16%
Single-Parent Households 35% 53% 17% 23% 35% 8% 13%
Manhattan All Households 16% 29% 9% 8% 14% 6% 15%
Single-Parent Households 29% 44% 15% 21% 21% 6% 16%
Queens All Households 21% 30% 10% 10% 14% 5% 18%
Single-Parent Households 42% 60% 26% 35% 31% 11% 32%
Staten Island
All HouseholdsSingle-Parent Households
19%33%
31%57%
6%23%
8% 22%
18% 48%
5% 5%
17%6%
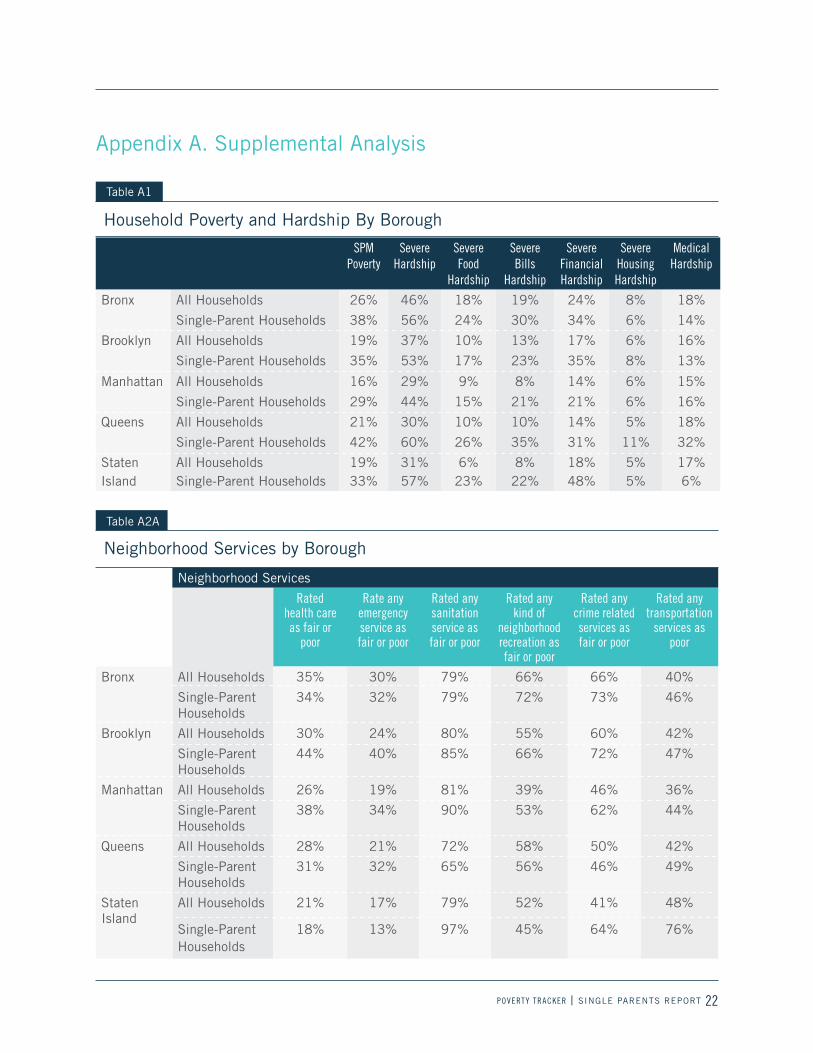
Household Poverty and Hardship By Borough
Table A1
Neighborhood Services
Rated health care as fair or
poor
Rate any emergency service as fair or poor
Rated any sanitation service as fair or poor
Rated any kind of
neighborhood recreation as fair or poor
Rated any crime related services as fair or poor
Rated any transportation
services as poor
Bronx All Households 35% 30% 79% 66% 66% 40%
Single-Parent Households
34% 32% 79% 72% 73% 46%
Brooklyn All Households 30% 24% 80% 55% 60% 42%
Single-Parent Households
44% 40% 85% 66% 72% 47%
Manhattan All Households 26% 19% 81% 39% 46% 36%
Single-Parent Households
38% 34% 90% 53% 62% 44%
Queens All Households 28% 21% 72% 58% 50% 42%
Single-Parent Households
31% 32% 65% 56% 46% 49%
Staten All Households 21% 17% 79% 52% 41% 48%
Single-Parent Households
18% 13% 97% 45% 64% 76%
Neighborhood Services by Borough
Table A2A
Island
POVERTY TRACKER | SINGLE PARENTS REPORT 23
Rent Burden Neighborhood
Poverty
Collective Efficacy
Access to $400
Households with High Rent Burden
(>30% of Household Income)
High Poverty Neighborhoods
(>40%of Neighborhood
Population in Poverty)
Collective Efficacy Rating
in Lowest Quartile
Households that Could Count on a
$400 Loan
Bronx All Households 40% 26% 68% 58%
Single-Parent Households
59% 30% 80% 44%
Brooklyn All Households 32% 13% 20% 68%
Single-Parent Households
49% 26% 25% 45%
Manhattan All Households 28% 7% 19% 75%
Single-Parent Households
39% 17% 35% 40%
Queens All Households 30% 3% 0% 69%
Single-Parent Households
54% 3% 0% 61%
Staten Island All Households 14% 2% 0% 68%
Single-Parent
Households
25% 6% 0% 57%
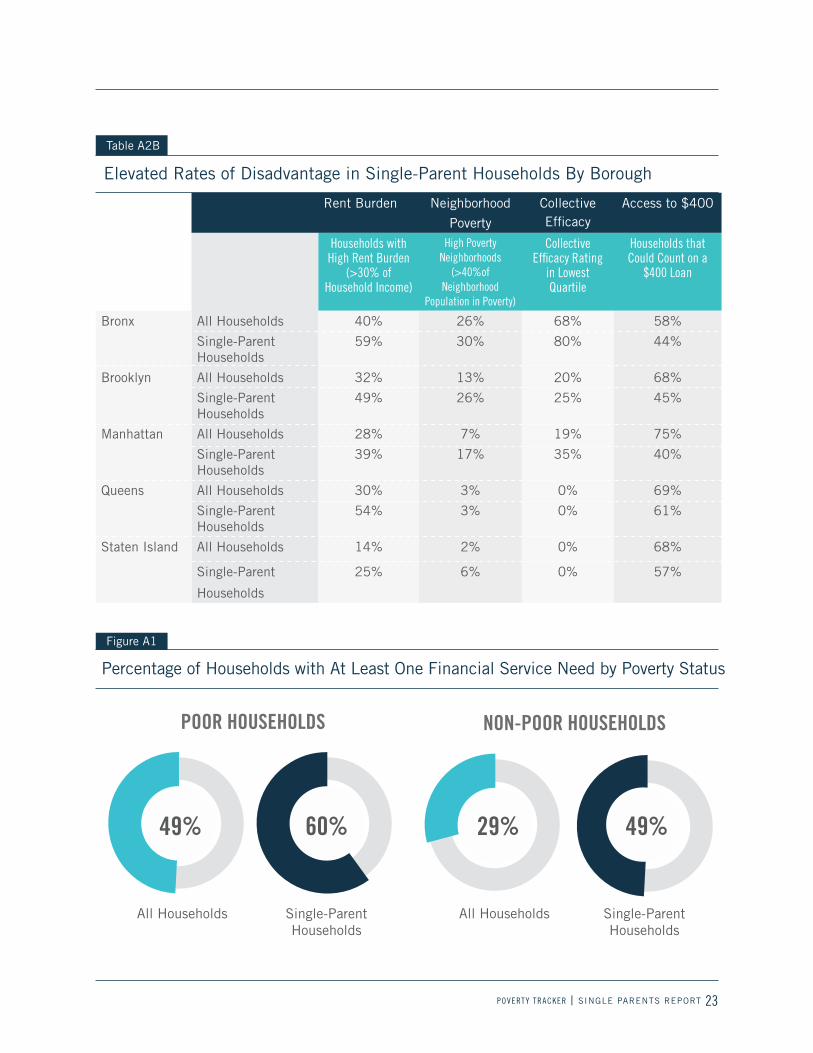
Elevated Rates of Disadvantage in Single-Parent Households By Borough
Table A2B
All Households
POOR HOUSEHOLDS
49%
Single-ParentHouseholds
60%
All Households
NON-POOR HOUSEHOLDS
29%
Single-ParentHouseholds
49%
Percentage of Households with At Least One Financial Service Need by Poverty Status
Figure A1
POVERTY TRACKER | SINGLE PARENTS REPORT 24
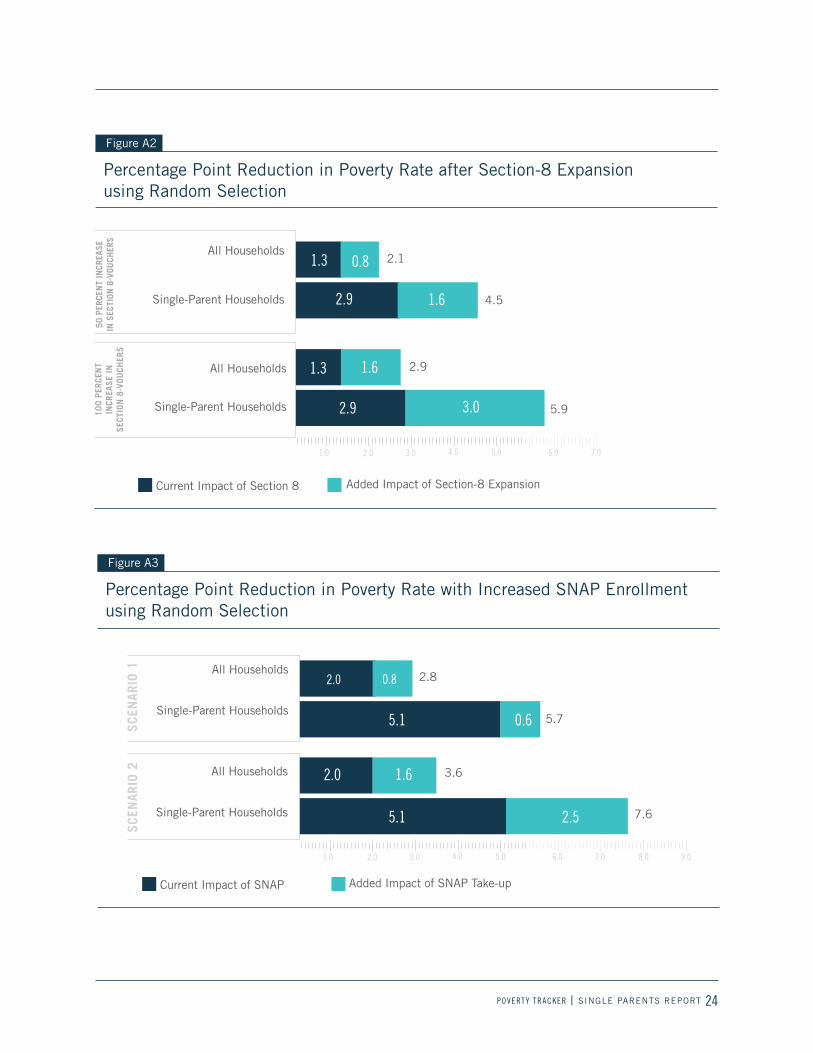
Percentage Point Reduction in Poverty Rate with Increased SNAP Enrollment using Random Selection
Figure A3
Current Impact of SNAP
2.0
2.0
1.0 2.0
5.1
3.0 4.0 5.0 6.0 7.0
Added Impact of SNAP Take-up
8.0 9.0
0.8
5.1 0.6
1.6
2.5
All Households
Single-Parent Households
All Households
Single-Parent Households
2.8
5.7
3.6
7.6
Percentage Point Reduction in Poverty Rate after Section-8 Expansion using Random Selection
Figure A2
1.3
1.3
1.0 2.0
2.9
3.0 4.0 5.0 6.0 7.0
Current Impact of Section 8 Added Impact of Section-8 Expansion
0.8
2.9 1.6
1.6
3.0
All Households
Single-Parent Households
All Households
Single-Parent Households
2.1
4.5
2.9
5.9
POVERTY TRACKER | SINGLE PARENTS REPORT 25
Comparison of the Percentage of Households Receiving Government Housing Subsidies in the Poverty Tracker and Other Estimates
To test the estimate of the percentage of New York City households that benefit from government housing
subsidies against other credible estimates, we looked at the New York City Center for Economic Opportunity’s
(CEO) Poverty Report. According to CEO’s report, 12.9 percent of New York City households live in public
housing or receive a tenant-based subsidy, which includes Section 8 and other, smaller housing subsidy
programs such as the Public Assistance Shelter Allowance the Senior Citizen Rent Increase Exemption, “Jig-
gets” rent supplement program, Employee Incentive Housing Program, Work Advantage Housing program for
the homeless, or some other federal, state, or city subsidy program.24
The Poverty Tracker cannot calculate an exactly comparable estimate to CEO’s with Poverty Tracker data
given that it does not ask about some of these smaller government housing programs, but we attempted to
get a somewhat comparable estimate by including those Poverty Tracker respondents who spent time in a
shelter as government housing beneficiaries and find that 11.2 percent of households benefited from public
housing, Section-8 vouchers, or the shelter system. Given that this estimate is closer to the 12.9 percent es-
timate reported by CEO and the number of small government programs it does not includes, we believe that
our estimate of 9.4 percent of households receiving Section-8 or public housing assistance (the two largest
government housing benefit programs), is close to the true population estimate.
Appendix B. Technical NotesThis appendix provides detailed information on technical aspects of the analysis in this report, including a
brief overview of the structure of the Poverty Tracker, details on the sample, and key measurements employed
to arrive at the findings presented in this report.
THE POVERTY TRACKER TOOL
The first Poverty Tracker survey that respondents complete collects in depth information on their income,
hardship, and health status. Respondents complete this survey again 12 months and 24 months after they
join the panel, and the Poverty Tracker’s yearly estimates of poverty, severe material hardship, and poor
health in New York City come from data collected on these annual surveys. By calculating these measures
annually, the Poverty Tracker is also equipped to chart respondents’ transitions in and out of these states of
disadvantage.
Between the annual surveys, respondents completed shorter surveys every three months that are focused on
specific topics, including assets and debts, health, housing, employment, and service utilization.
24 Krampner, J., Shin, J., Virgin, V., Tran, Q., Studer, E. & Li, C. (2017). New york city government poverty measure, 2005-2015. New York City Mayor’s Office of Economic Opportunity. http://www1.nyc.gov/assets/opportunity/pdf/NYCgovPovMeas2017-WEB.pdf.
POVERTY TRACKER | SINGLE PARENTS REPORT 26
SAMPLE
The Poverty Tracker surveyed a panel of 2,228 respondents from 2012 through 2015. In 2015, the Poverty
Tracker drew a new sample of 3,909 respondents and continues to follow this expanded panel. The second
panel was drawn in partnership with the New York City Department of Health and Mental Hygiene from its
Community Health Survey sample. This report uses data from the first and second Poverty Tracker panels.
When weighted, the sample from each annual survey is representative of the adult population in New York
City. To create sample weights, we post-stratify our data using the New York City sample of the American
Community Survey. For additional details about our weighting procedure, please see Appendix B in the
Spring 2014 Poverty Tracker report.
MEASUREMENTS
Single-Parent Households
For this report we focus on differences between single-parent households compared to New York City house-
holds all together. Single-parent households are defined as those where the respondent is not living with a
spouse or partner and has a biological or foster child present in the home.
Severe Hardship
We created a binary indicator for whether the respondent was in severe material hardship. A household is in
severe material hardship if they reported experiencing any for the following severe hardships:
• Severe Food Hardship: often worrying food would run out without enough money to buy more
• Severe Bills Hardship: having utilities cut off because of lack of money
• Severe Financial Hardship: often running out of money between paychecks or pay cycles
• Severe Housing Hardship: having to stay in a shelter or other place not meant for regular housing, or having
to move in with others because of costs
• Severe Medical Hardship: not being able to see a medical professional because of cost
Race/Ethnicity
We constructed the categorical race/ethnicity variable using responses to two questions on the baseline sur-
vey. The first question is, “What is your race?” with the following possible answers: white/Caucasian, black/
African-American, Asian, American-Indian or Native Alaskan, Native-Hawaiian or Pacific Islander, and Some-
thing Else (which respondents can specify). The second question is, “Are you of Hispanic, Latino, or Spanish
origin?” Responses to these questions were organized into the following groups: white (non-Hispanic), black/
African-American (Non-Hispanic), Asian (non-Hispanic), multiracial/other (non-Hispanic), and Hispanic.
POVERTY TRACKER | SINGLE PARENTS REPORT 27
Educational Attainment
The categorical education attainment variable was constructed using the response to the baseline survey
question, “What was the highest degree or grade or regular school that you have completed?” The possible
response categories were eighth grade or less, some high school, high school diploma, GED credential, some
college or associates degree, vocational/trade school, bachelor’s degree, or graduate degree. These responses
were collapsed into the following categories: less than high school, high school graduate, some college, and
college graduate or more.
Gender
We created a binary indicator variable for whether respondents were female based on the gender that they
reported on the baseline survey.
Age
Respondents were organized into the following categories based on the age they reported on the baseline
survey: 18 to 29, 30 to 44, 45 to 64, and 65 plus.
Immigration Status
Respondents from the first panel of the Poverty Tracker reported their country of birth on the baseline sur-
vey, which was used to identify US-born and foreign-born respondents. Respondents from the second panel
reported their country of birth in the 21-month survey. Those born in a US territory such as Puerto Rico or
Guam were coded as being US born.
Service Needs
We define two areas of service needs based on questions contained in the Poverty Tracker: financial issues
and child related issues. Respondents can identify a number of issues they need help with such as finding
adequate or affordable housing, paying for food or bills, getting public benefits, a major unanticipated ex-
pense, and finding work or a job. If a respondents indicate that they faced any one of these issues, they are
coded as having faced a financial issue.
Respondents with children can also identify a number of child related problems they needed help with such
as academic performance or school readiness, finding safe/affordable child care or after-school care, behav-
ior issues/acting out, emotional/developmental issues, and anything else. If respondents indicate that they
faced any one of these issues, they are coded as having faced a child related issue.
In addition to looking at these specific problems, we look at how the respondents deal with such problems.
To do this we created three variables covering whether they sought help for their problems, got help for their
problems, and whether their problems improved. Respondents are coded as having sought help for all of their
problems if they said they sought help for every problem they had. They are coded as having got help for all
their problems if they said they got all the help needed for every problem they had. If they got some or no
help for even one problem, they are coded as having not gotten all the help needed. Respondents are coded
as having all problems improved if they said every problem they had got better; they are coded as not having
all problems improve if even one problem stayed the same or got worse.
POVERTY TRACKER | SINGLE PARENTS REPORT 28
Collective Efficacy
Neighborhood collective efficacy is a combined measure of social control and social cohesion. The methods
we use to measure collective efficacy and the definitions of collective efficacy, social control, and social
cohesion follow those developed by Robert J. Sampson, Stephen W. Raudenbush and Felton Earls.25 Both
social control and social cohesion were measured on the six-month Poverty Tracker survey using the two
multi-item scales described below.
The social control scale measured each respondents’ belief about their community’s ability to maintain
collectively desired goals by jointly regulating the behavior of community, and the social cohesion scale mea-
sured respondents’ beliefs about the level of trust between neighbors in their community. Social cohesion
has been found to be highly correlated with social control, and it is believed that neighbors are more likely to
perform actions related to social control when there is a higher level of trust between community members.
The social control survey items ask respondents to rank the likelihood (very likely, likely, neither likely or
unlikely, very unlikely), that neighbors would intervene if: (i) children were skipping school and hanging out
on the street corner, (ii) children were spray painting graffiti, (iii) a child was showing disrespect to an adult,
(iv) there was a fight in front of their house and someone was being beaten or threatened, (v) the fire station
closest to their home was going to be closed due to budget cuts.
Similarly, the social cohesion scale asks respondents to rank how strongly they agreed or disagreed with the
following statements: (i) this is a close-knit neighborhood, (ii) people around here are willing to help their
neighbors, (iii) people in this neighborhood generally don’t get along with each other, (iv) people in this
neighborhood do not share the same values, (v) people in this neighborhood can be trusted.
Responses to the items on the social control scale were coded from one to five, with one representing very
likely and five representing very unlikely. Response to items one, two, and five on the social cohesion scale
were also coded from one to five with one representing strongly agree and five representing strongly disagree.
Items three and four on the social cohesion scale were reverse coded so one represented strongly disagree
and five represented strongly agree.
To measure collective efficacy at the neighborhood level, we average the responses to the social control
and social cohesion scales at the respondent level to obtain an average collective efficacy score for each
respondent and then average collective efficacy scores across respondents within each neighborhood. In the
analysis presented in this report, we define neighborhoods as New York City community districts.
25 Sampson, R. J., Raudenbush, S. W., & Earls, F. (1997). Neighborhoods and violent crime: A multilevel study of collective efficacy. Science, 277(5328), 918-924.