Embed Size (px)
Citation preview
Voting Counts: Participation in the Measurement of Democracy*
Final Submission Draft, SCID
15 April 2006
Bruce E. Moon, Jennifer Harvey Birdsall, Sylvia Ciesluk, Lauren M. Garlett, Joshua J. Hermias, Elizabeth Mendenhall, Patrick D. Schmid, and Wai Hong Wong
Department of International Relations
Lehigh University
Abstract: The measures of democracy commonly used in empirical research suffer notable limitations;
primarily the exclusion of participation. As a result, quantitative studies may undervalue the effect
of democracy on important social outcomes or misinterpret the aspect of democracy responsible for
that effect. We respond by introducing and validating two variants of a new indicator, the
Participation Enhanced Polity Score (PEPS), which augments institutional factors with the breadth
of citizen participation. We demonstrate, using statistical evidence on democratic persistence, basic
needs fulfillment, and gender equality, that no measure of democracy can be considered an accurate
representation of its basic character without directly including participation as a core component.
Bruce E. Moon is professor of international relations at Lehigh University in Bethlehem, Pennsylvania. He is the author
of The Political Economy of Basic Human Needs (Cornell University Press, 1991) and two editions of The Dilemmas of International Trade (Westview Press, 1996, 2000).
Jennifer Harvey Birdsall is a researcher for an NGO in Geneva, Switzerland. She received her B.A. in international relations and economics from Lehigh University and her M.S. in global affairs from Rutgers University-Newark.
Sylvia Ciesluk is pursuing an M.A. at the Fletcher School at Tufts University. She received her B.S. in economics from Lehigh University.
Lauren M. Garlett is a geography teacher at Bellamy Middle School in Chicopee, Massachusetts. She received both her B.A in international relations and her M.Ed. in secondary education from Lehigh University.
Joshua J. Hermias is associate director of the Global Young Leaders Conference in Washington, D.C.. He received his B.A. in economics from Lehigh University and his M.A. in international development from the University of East Anglia, Norwich, England.
Elizabeth Mendenhall is pursuing an MIA in economic and political development at Columbia University. She received a B.A. in international relations at Lehigh University.
Patrick D. Schmid is a Ph.D. candidate in computer science at Lehigh University. He received both his B.S. and M.S. in computer science from Lehigh University.
Wai Hong Wong is a research associate at FactSet Research Systems. He received his B.A. in international relations and economics at Lehigh University.
*We are grateful for the helpful suggestions of Frank Davis, Bill Dixon, Chaim Kaufmann, Rajan Menon, Pamela Paxton, Larry Taylor, and the anonymous reviewers.
Voting Counts: Participation in the Measurement of Democracy Page 1 of 36
1. Introduction Democracy earns wide praise for both philosophical and practical reasons. Theorists and
activists alike extol it as an environment in which individuals can realize their capabilities.
Researchers emphasize its implications for peace, prosperity, and equality. However, such claims
are only as strong as the empirical methods that produce these findings. Those methods, in turn,
must rest upon a sound definition and measurement strategy that effectively captures the key
features of democracy.
Measures used in previous studies suffer notable limitations. In particular, democracy
indicators such as Polity and Freedom House, which emphasize institutional arrangements and civil
liberties, neglect citizen participation (Jaggers and Gurr, 1995; Freedom House, 2002). For
example, some countries are coded in the Polity dataset as “pure” democracies despite yawning
gaps in participation, notably the United States during slavery and Switzerland prior to women’s
suffrage. The omission of an adequate measure of participation undermines the practical basis for
claims of democratic superiority and may distort the empirical relationship of democracy and its
postulated outcomes.
We correct this oversight by creating two variants of a new indicator of nations’ democracy
levels, the Participation Enhanced Polity Score (PEPS). The PEPS variants combine institutional
factors with considerations of the breadth of citizen participation. By validating these new
indicators, we demonstrate the necessity of including participation in any robust measure of
democracy. Section two reviews the range of definitions and measures previously offered for
democracy. Section three demonstrates the intuitive validity of our concept of participatory
democracy by contrasting actual political participation with institutional characteristics and suffrage
limitations. In section four we detail our PEPS measures and lay out our validation plan to
Voting Counts: Participation in the Measurement of Democracy Page 2 of 36
demonstrate that they better fit theoretical expectations than existing democracy measures. In
sections five, six, and seven we replicate studies linking democracy with: 1) a variable said to cause
democracy (economic development), 2) one that is internal to the democratic process (the
persistence and durability of institutions), and 3) two important consequences of democracy (the
attainment of basic human needs and gender equality). These replicated studies demonstrate not
only that our new measure is as useful as the existing ones, but, in important respects, it is an
improvement.
2. On Measuring Democracy Both ancient and modern political philosophers have struggled to describe the democratic
‘ideal’, a governance system in which every citizen participates in the political process shaping
society’s fate and, through it, their own. Whatever the problems of capturing such an ideal, the
classification of actual states is more problematic yet. In The Politics, Aristotle (1996: 120) writes
that a form of government “is a question of degree; an oligarchy, for example, may become more or
less oligarchical, and a democracy more or less democratic”. More recently, Lipset (1959:73)
observed “democracy is not a quality of a social system which either does or does not exist, but
rather a complex of characteristics which may be ranked in many different ways”. Indeed,
researchers have operationalized “democracy” by various means, each reflecting a unique view of
what lies at the core of the “ideal democracy”.1
In a review of nine projects gathering data on democracy, Munck and Verkuilen (2002a:9)
warn against “maximalist” or “minimalist” definitions that include either too many or too few
theoretically relevant attributes.2 Maximalist definitions, as exemplified by Freedom House’s
(2000) freedom index, “tend to be so overburdened as to be of little analytical use”, composed more
1 It is rare to find one democracy that is exactly like any another. For the breadth of modern conceptions of democracy, see Pieterse (2002). For empirical variations, see the ACE Project (2003). 2 Because most conceptions acknowledge that complex political systems cannot reach perfection, most scholars eschew a democracy/autocracy dichotomy in favor of a gradation approach to measurement (Elkins, 2000).

Voting Counts: Participation in the Measurement of Democracy Page 3 of 36
of lists of characteristics than a tightly defined essence. Freedom House classifies nations as free,
partly free, and not free on scales encompassing twenty-five conceptions of political rights and civil
liberties. Because some of these attributes – such as “socioeconomic rights”, “property rights” and
“freedom from war” – are certainly not exclusive to democracy, we do not consider them explicit
democracy scales, even though empirical researchers often use them under the implicit assumption
that “free” states are more democratic (Starr, 1991, 1999; Lipset, Seong, and Torres, 1993;
Burkhardt and Lewis-Beck, 1994).
At the other extreme lies the Polity project (Jaggers and Gurr, 1995), which has produced
the most widely used democracy measure. Its intellectual genesis can be traced to Eckstein and
Gurr (1975), who defined the character of a political regime principally in terms of its authority
relations.3 Jaggers and Gurr (1995:471) clarify the conceptual basis of their measurement approach
as:
At its theoretical core, we argue that there are three essential, interdependent elements of democracy
as it is conceived of in Western liberal philosophy. The first is the presence of institutions and
procedures through which citizens can express effective preferences about alternative political
policies and leaders. .... A second component of Western-conceived democracy is the existence of
institutionalized constraints on the exercise of executive power. The third dimension of democracy ...
is the guarantee of civil liberties to all citizens in their daily lives and in acts of political participation.
Polity is an excellent measure in many respects and we have incorporated it into our own
operationalization of democracy. Polity combines annual democracy and autocracy indicators to
create an overall score ranging from -10 (pure autocracy) to +10 (pure democracy). Its broad
coverage, together with open availability and explanatory definitions, makes the various Polity data
sets, most recently version IV, popular among large-N researchers.4 Still, Polity exemplifies the
concern of Munck and Verkuilen (2002a) that a minimalist measurement approach might omit an
3 Specifically, a polity’s authority structure can be analyzed in terms of: (1) the influence relations between super-ordinate and subordinate strata, (2) the degree of inequality between them, (3) the institutional relations among super-ordinates, (4) the competitiveness of recruitment, and (5) the basis of political legitimacy. 4 It codes all independent countries with populations greater than 500,000 and extends from 1801 to 2003.
Voting Counts: Participation in the Measurement of Democracy Page 4 of 36
attribute necessary to a full definition. Dahl’s (1971) iconic formulation specifies that a democracy
must meet the conditions of “contestation” and “inclusiveness” (near-universal participation in that
contestation). Polity effectively captures the competitiveness of elections and limitations on
executive power, but is less successful in tapping the participation dimension.
On the contrary, Marshall et. al. (2002) contend that Polity incorporates participation. They
correctly point out that the measure encompasses suffrage via its inclusion of the “competitiveness
of political participation”. Both Munck and Verkuilen (2002b) and Paxton (2000) note, however,
and we agree; this approach falls short. It adopts a low and arbitrary threshold to identify restricted
participation: 20 percent of the adult male population5. As we will show below, this methodology
allows exclusionary regimes to attain very high democracy scores.6
3. Democracy and Participation The extension of suffrage to all adults, male and female, is an undeniably critical feature of
democratization. Revision of Polity and similar measures is necessary on these grounds alone.
However, our critique goes further. We argue, in the “civic republican” tradition, that it is
profoundly misleading to characterize a political system as strongly democratic without broad (if
not universal) genuine participation, especially in the electoral process where those who are
governed provide approbation to those who govern. It is not enough that citizens have a right to
participate. To make democracy meaningful and different from other governance systems, citizens
must actively exercise that right.
Part of democracy’s normative appeal is its promise to maximize the interests of the
citizenry and further its collective values. But it will do so only if citizens use participation to
convey their influence. As V. O. Key (1949: 527) puts it, “The blunt truth is that officials are under
5 Paxton is particularly, and accurately, condemning, noting that while major measures of democracy claim “universal suffrage as a consideration, women are normally excluded from this definition.” 6 Gleditsch and Ward (1997:380) similarly show that “the extent and competitiveness of participation are not especially powerful in determining the degree of democracy or autocracy in modern polities as reflected by the Polity data set.”
Voting Counts: Participation in the Measurement of Democracy Page 5 of 36
no compulsion to pay much heed to classes and groups of citizens that do not vote.” It is not just
that higher rates of participation make government responsive to a larger share of the population,
even though that itself makes a system more democratic. As Rosenstone and Hansen (1993: 241)
remind us, “When many citizens turn out to vote, they are more representative of the citizenry than
when fewer people vote”. Lipjhart (1997) extensively documents that low participation rates
invariably change the class and ethnic composition of the electorate.
Ballot box power aside, extensive participation transforms the character of the political
system. It is particularly crucial in shaping the collective identity underlying democracy’s most
cherished consequence, achieving social justice and egalitarian outcomes across class, gender, and
ethnic cleavages. Democracy’s intrinsic value extends beyond its effect on policy. Democratic
participation not only enhances the moral legitimacy of the public will, but also allows for the “self-
actualization” of its citizens (Finkel, 1985). It is an extension of the individual’s human capabilities
of freedom, autonomy and political agency, an element of what Amartya Sen (1999) says “what one
can do or be”.7 Yet democracy can empower the individual and sustain the community only if its
processes incorporate the participation of all of those affected by it (Parry, Moyser and Day, 1992).8
Some researchers have responded by emphasizing universal suffrage as central to
democracy. From the participatory perspective, however, it is hardly a sufficient criterion for
achieving the democratic ideal, because participation may be quite narrow wherever citizens have
the legal right to vote.9 Nonetheless, three examples corresponding to the most common means of
7 Thus, participatory democracy shares the ideal of empowerment that pervades the contemporary development literature (Chambers, 1997; Bebbington, 1999; Freire, 1998; Scoones, 1998). 8 Just as democratic institutions can co-exist with restricted participation, high levels of participation can be found without restraints on executive authority or respect for minority rights, as discussed by the literature on “illiberal democracy” (Zakaria, 1997). 9 Breadth measures the horizontal pervasiveness of politics within a governed population, which we conceive as how many people interact with the political system, not how they interact with the system. Our concern with the breadth of citizen participation is reflected in our emphasis upon electoral participation. We do not mean to deny the importance of the depth of citizen participation as manifested in such phenomena as lobbies, special interest groups, etc. These are the social networks, community organizations and civic associations laid out by Robert Putnam (1993) as a part of a state’s social capital. Putnam’s idea of social capital also includes other manifestations of citizen participation that are

Voting Counts: Participation in the Measurement of Democracy Page 6 of 36
020
4060
Ele
ctor
al p
artic
ipat
ion
-10
-8-6
-4-2
02
46
810
-50
510
Dem
ocra
cy (P
olity
)
1800 1850 1900 1950 2000Year
Polity Voting pct.
Figure 1: Democracy in the United Kingdom
suffrage denial illustrate that universal suffrage is a necessary condition for democracy. Polity's
coarse-grained measure misrepresents the level of democracy in each of these polities by neglecting
to adequately reflect its limited degree of participation. Class exclusion (on the basis of property) is
represented most clearly by the evolution of participation in Great Britain. Ethnic exclusion is
demonstrated most vividly by the role of race in South Africa. Switzerland illustrates both gender
exclusion and the broader point that participation levels may reveal previously indiscernible aspects
of a system’s institutional structure.
Figure 1’s sketch of Britain’s political evolution, which has informed so much of the
literature on the theoretical
“requisites” of democracy
(Lipset, 1959), underscores the
limitation of Polity’s treatment of
political participation. Polity’s
21-point democracy/autocracy
scale, illustrated by the dashed
line, tracks the major changes in
British political history, but only roughly. The Reform Bill of 1832 revised a complicated system
of determining the franchise by increasing the number of voters from 500,000 to 813,000. Despite
this modest expansion, changes in the Polity Score for Britain give a sense of greatly expanded
democracy, moving from a -2 (democracy=4, autocracy=6) to a +3 (democracy=6, autocracy=3).
However, as illustrated by the solid line, only six percent of the adult population voted even after
the reform.10 While the male franchise broadened considerably by 1884, “suffrage still excluded
not necessarily political in nature, such as choral societies, sports clubs, and community service organizations. Our decision is based principally upon data availability, but it is also justified by a distinction between activities that are state-centered and those lodged within civil society. 10 Figure 1 shows voter turnout data from Vanhanen (2000) adjusted to reflect voting age population.

Voting Counts: Participation in the Measurement of Democracy Page 7 of 36
agricultural workers…[and] servants.” (Palmer and Colton, 1992:610) Actual voter turnout reached
12% of the population only in the election of 1885 before falling thereafter, and it didn’t return to
that level again until 1918.
All the while, Polity scores for executive recruitment and competition increased while
institutionalized autocracy decreased. In 1880 the Polity democracy score stood at 7 (autocracy=0).
By 1901 the democracy score rose to 8 and by 1922 Polity suggests Britain was a ”perfect 10“
democracy, even though full male suffrage was not achieved until 1918 and full female suffrage
until 1928. Britain has received the highest democracy rating since, although the voting rate has
never exceeded 60% of the adult population. The high scores that Britain receives from 1880 on are
misleading and, with respect to changes in participation, mistimed. As Figure 1 illustrates,
participation doubled during a period Polity records as unchanged and doubled again during a
modest 2 point move in Polity.
The racial exclusion in South Africa also demonstrates the danger of conceiving democracy
without taking account of the breadth of citizen participation. According to Polity, South Africa
was a relatively stable democracy from 1910 until 1989 scoring a +4 (democracy=7, autocracy=3).
A positive score is surprising because it ignores the exclusion of the 90 percent of the population
that did not – most could not – vote. While democracy existed in white South Africa, from the
viewpoint of breadth of participation, the democracy measure is misleading. In particular, one
would hardly expect a political system marked by such rights infringements and participation
restrictions to produce the outcomes usually associated with democracy, especially basic needs
attainment or other dimensions of broad social development.
Switzerland, our final example, has scored a perfect +10 in the Polity dataset since 1848,
even though women – roughly half the population – were not granted the right to vote until 1971,
123 years later. Furthermore, electoral turnout has hovered around 30% recently, despite virtually

Voting Counts: Participation in the Measurement of Democracy Page 8 of 36
universal suffrage. One reason for this might be that Switzerland’s collective executive is an
organizational form that diminishes voter motivation by minimizing the significance of election
outcomes11. Surely such a system should be regarded as less democratic than one in which most
citizens participate in elections and actually make a difference in leadership and policies.
The failure of Polity to record this limitation on democracy is not at all unique to
Switzerland, and Polity’s treatment of gender restrictions is mirrored by other measures. As Paxton
notes (2000:104), “…we should recognize that our current efforts at assessing explanations are
focused on a restrictive form of democratization.” She further observes that if the dates when many
countries transitioned to democracy were adjusted to accurately reflect when the whole voting age
population was granted suffrage, many early examples of democracy would take on a very different
appearance. Indeed, even the “waves of democratization” identified by Huntington (1991) would
be shown to be mistimed.
In response, Bollen and Paxton (2003) have greatly advanced on Polity’s approach by
developing a new dataset explicitly coding actual legal restrictions on the franchise. They compute
a precise index of the extent of legal suffrage grading countries on a scale from zero to 100 percent
(universal suffrage). Their choice of how to code such restrictions, though inevitably subjective, is
reasonable, and the resulting index will allow studies of suffrage not previously possible.12
The major flaw in relying upon the official franchise is suggested by the observation that in
the 1990s all but a handful of countries are coded as having suffrage at 98 percent or more, while
actual voting rates were far lower and varied quite widely. One reason is that the absence of legal
proscriptions does not preclude quite restrictive, but more difficult to quantify, institutional barriers.
Some of the factors that prevent voting, make it difficult, or exact excessive costs for participation
11 Another is that Switzerland, like many other countries, has a high incidence of non-citizens ineligible to vote. 12 For example, refusing the vote to convicts results in a subtraction of .50 whereas a deduction of .25 occurs when a restriction is placed on voting rights of the mentally disabled. McDonald and Popkin (2001) show that such fixed estimates distort conclusions because the percentage of the population that fits these categories varies markedly over time. Cross-sectional variation is probably much larger.
Voting Counts: Participation in the Measurement of Democracy Page 9 of 36
in marginal democracies include political violence, societal pressures, intimidation, procedural
irregularities, illiteracy, language and educational limitations, the absence of transportation, party
boycotts, and more. Even in relatively well-institutionalized political systems, the ease of
participation varies considerably.13 Our caution is lent credibility by a regression analysis revealing
that Bollen and Paxton’s indicator of formal suffrage limitations explains less than 10 percent of the
variance in the percentage of the adult population casting ballots.14 Thus, to assume formal
statutory suffrage limitations accurately measure the myriad of real participation restrictions invites
large measurement error.
Accordingly, to measure the breadth of political participation, we prefer an approach based
on actual voting records. In the process, we do lose the ability to distinguish between informal
restrictions and citizen choice as the explanation for low turnouts, but this distinction is far from
clear-cut and almost impossible to measure. Moreover, since we regard participation itself as the
core of the matter, the explanation for turnout rates is not central to identifying democracy levels.
We do admit it is tempting to label some reasons for non-participation a strength of the political
system (“I am so confident that officials will decide wisely, I do not need to vote”) and others a
weakness (“I don’t vote because the available candidates are all equally unlikely to represent me”).
Even if we could identify the attitudes underlying voter apathy, it would be irrelevant to judging
whether a political system is participatory and, therefore, democratic.
13 Examples of incentives and disincentives built into institutions include registration laws, residency requirements, and the location of polling places (Powell, 1986). Turnout is discouraged by single member districts, disproportionality in translating votes to legislative seats, multipartyism, and bicameralism (Jackman, 1987). Postal voting, absentee and advance voting, weekend elections, and longer poll hours encourage it (Franklin, 1996). Other factors that increase voting – and indicate the breadth of the democracy – include citizen attitudes that reflect political culture and individual experience with the political system, such as partisanship, feelings of efficacy, trust in institutions, and interest in public affairs. The competitiveness of elections and the likelihood of change as a result of elections also spur turnout (Mahler, 2002; Franklin, 1996). 14 The sample was comprised of more than 4,000 nation-years from 1950 to 2000 for which data exists on both measures. The overall Polity score described above explains a considerably higher proportion of the variance in votes cast, a result that also holds in additional analyses with various other predictors included in the estimation equation.
Voting Counts: Participation in the Measurement of Democracy Page 10 of 36
One potential influence on turnout levels merits special mention, the potentially distorting
effect of compulsory voting laws. The cases that introduce the greatest distortions are those
notorious autocracies which statutorily mandate voting and subsequently report nearly 100 percent
turnout. However, they do not affect our analysis since the participation rate of one-party states is
coded as missing data in our principal data source, IDEA (2003). For the vast majority of nations,
compulsory voting legislation is so lightly enforced and prescribes such small sanctions - mostly
relatively modest fines – that it is more accurately considered an incentive to participate than a
requirement to do so.15 Citizens must weigh many incentives and disincentives for voting,
including peer pressure, a desire to influence policy and choose leaders, a sense of obligation, the
hope of economic benefits from some candidates, the opportunity costs of voting, and many others
we cannot identify or measure. As we are not comfortable in judging which of these incentives and
disincentives pass muster as democratic in spirit, those states with compulsory voting have not been
disqualified as democracies.
Our decision in this matter was reinforced by an analysis leading us to doubt that
compulsory voting statutes have enough impact on turnout to warrant singling them out among the
other determinants of participation. To test this effect, we used IDEA data (Pintor and Gratschew,
2002) to construct dummy variables for nations with compulsory voting legislation. IDEA
identified four categories of such nations, according to the level of enforcement. In 2003, 31 of the
159 nations in our sample had some compulsory voting legislation, with nine coded as having
strong enforcement and another ten with weak enforcement.16
The initial analysis found nations with compulsory voting had turnout rates about 1.3
percentage points higher than those which did not, but the effect was not statistically significant.
15 IDEA identifies only four countries that include imprisonment among possible penalties and only one of these – Fiji – is said to have strict enforcement. Also, any imprisonment enforced would be as a result of a failure to pay fines (after given notices and warnings) and not as a result of a failure to vote. IDEA could find no evidence that imprisonment had ever occurred as punishment in any nation. 16 The others were either not enforced, or IDEA could not determine the level of enforcement.
Voting Counts: Participation in the Measurement of Democracy Page 11 of 36
Table 1 - OLS regression of turnout on compulsory voting
Further analysis, reported in Table 1, shows nations with strongly enforced compulsory voting had
an average of 1.1 percent lower voting rates whereas nations with weak enforcement averaged
nearly 11 percent higher rates, though neither effect was statistically significant.
This pattern supports Perez-Linan’s (2001) contention that the effect of compulsory voting
laws are due more to “the sense of duty” they create than to any real coercion. Thus, they fall
within the category of mobilization strategies which vary widely across nations; and hence, those
nations using them do not warrant exclusion.17 We conclude the effect of compulsory voting, if
present at all, is not large enough to threaten the validity and reliability of voting-based measures.
Buoyed by these findings, we create a new
measure retaining the strengths of Polity’s
“institutionalized democracy”, but
augmenting what we see as its significant
weakness, the omission of a sensitive
participation component.
4. The Participation Enhanced Polity Scores (PEPS) In response to the failure of extant measures to adequately encompass participation, we
propose two variants of a new measure of Participatory Democracy, which we call PEPS1 and
PEPS2. Both combine Polity’s institutionalized authority relations with a behavioral dimension, the
percentage of the adult population participating in the electoral process.18 We begin by defining a
voter turnout scalar (VTS), such that at year t for country i:
17 Previous studies have produced various conclusions. IDEA (2003) finds that nations which have some element of compulsion associated with voting have only a small lead in turnout, and that the effects of electoral systems, the competitiveness of elections, and socio-economic factors are larger. Perez-Linan (2001) finds no significant effect within Latin America. Blais and Dobrzynska (1998) find a parameter estimate of between 10 and 12%. Franklin (1996) finds the effect to be about 7%, roughly similar to that of postal voting and Sunday voting, but considerably smaller than the proportionality of the system and the salience of the election. See also the review in Lijphart (1997.) 18 The most rudimentary measure is voter turnout as a percentage of the total population. Vanhanen (2000) uses this measure, but acknowledges that it introduces substantial bias because adults represent a highly variable percentage of
Coefficient Std Error t P > |t|
Strong enforcement -.011 .064 -0.18 0.537 Weak enforcement .110 .061 1.81 0.112 No enforcement -.002 .072 -0.03 0.752 Enforcement n/a -.113 .084 -1.34 0.441 Constant .665 .016 40.63 0.000 r² = 0.034 adjusted r² = .001 probability of F = 0.25 N=159

Voting Counts: Participation in the Measurement of Democracy Page 12 of 36
[1] VTSi,t = Votesi,t/Adult Populationi,t
Our analysis is based principally on the 1950-2003 period, for which our data source was
IDEA (2003), which reports both votes and the adult population.19 IDEA includes only those
elections in which “there was a degree of competitiveness … This criterion excludes one-party
states …” We code any case in which no votes are recorded by IDEA as missing data. In the few
analyses we conducted for the period prior to 1950, we used Vanhanen (2000) as the data source20.
PEPS1 is a simple modification of Polity’s 21-point Democracy score. It is based upon the
principle that institutionalized authority relations and citizens’ electoral participation each give
expression and meaning to the other. Participation is trivial if it does not influence policies via
institutions that transmit the popular will. Authority relations that seemingly convey power to the
electorate are not very meaningful if the electorate is not itself a sizable fraction of the citizenry. To
compute PEPS1 we first multiply the VTS for each state by the Polity IV democracy score. This
reduces the democracy score proportionally as voting turnout falls below 100% of the adult
population. Then, emulating the 21-point Polity scale, we subtract the Polity autocracy variable
from this adjusted democracy score to yield a continuous measure of participatory democracy:
[2] PEPS1i,t = (VTSi,t * Polity Democracy Scorei,t) – Polity Autocracy Scorei,t
the population across nations and over time. Following both IDEA (2003) and Paxton and Bollen (2002), we mark the age of majority at 18, even though the actual voting age varies widely, especially in earlier eras. 19 IDEA reports elections from 1945 to 2003, which leaves no basis on which to code participation for the years between 1945 and the next election; thus, we begin in 1950. Because IDEA’s data is fragmentary after 2000, we updated the records for later years, largely using the same sources as IDEA. IDEA’s estimate of adult population is mostly based on data reported by UN Department of Economic and Social Affairs. 20 The Vanhanen dataset is constructed as a year-by-year profile of each country. When no votes were reported, we treated the case as missing data, but we accepted as valid a zero entry. To achieve some degree of comparability, but lacking demographic data, we multiply Vanhanen’s estimate of total population by 2/3 as a crude estimate of the adult population. Our data treatment procedures are detailed on our project webpage, http://www.lehigh.edu/~bm05/democracy/
Voting Counts: Participation in the Measurement of Democracy Page 13 of 36
010
2030
40E
lect
oral
par
ticip
atio
n
-10
-8-6
-4-2
02
46
810
02
46
810
Dem
ocra
cy
1800 1850 1900 1950 2000Year
Polity Voting pct.PEPS1
Figure 2: Democracy in the United States
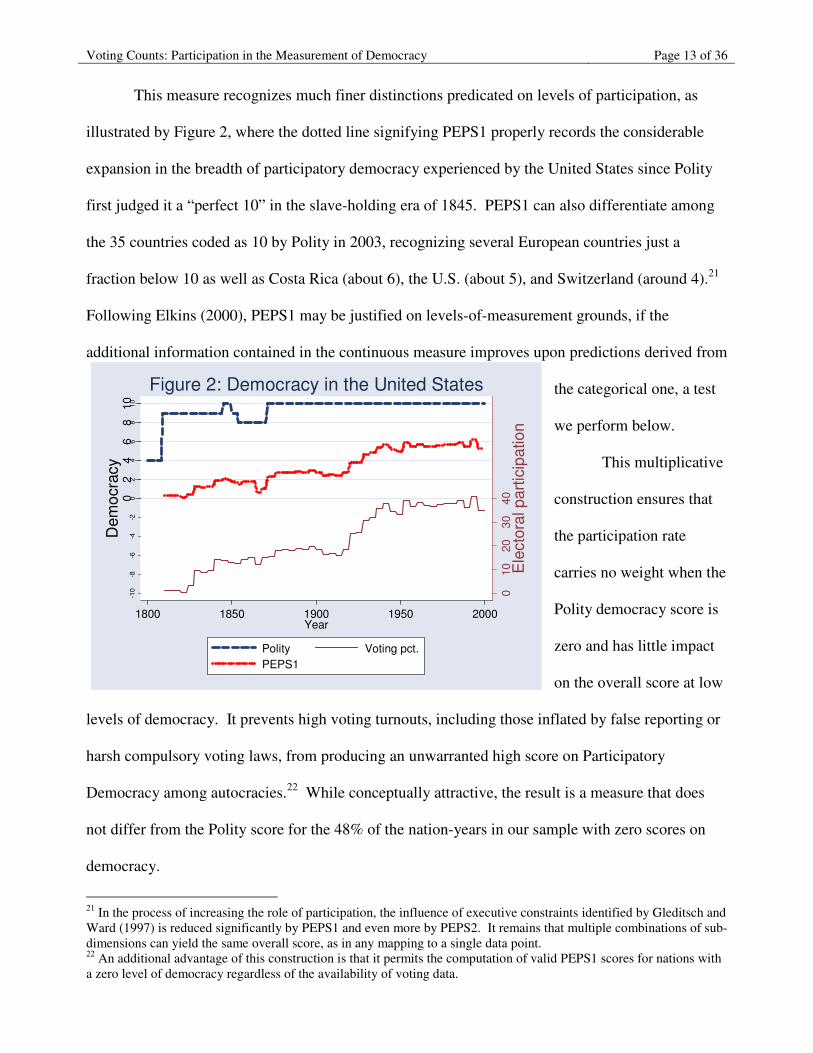
This measure recognizes much finer distinctions predicated on levels of participation, as
illustrated by Figure 2, where the dotted line signifying PEPS1 properly records the considerable
expansion in the breadth of participatory democracy experienced by the United States since Polity
first judged it a “perfect 10” in the slave-holding era of 1845. PEPS1 can also differentiate among
the 35 countries coded as 10 by Polity in 2003, recognizing several European countries just a
fraction below 10 as well as Costa Rica (about 6), the U.S. (about 5), and Switzerland (around 4).21
Following Elkins (2000), PEPS1 may be justified on levels-of-measurement grounds, if the
additional information contained in the continuous measure improves upon predictions derived from
the categorical one, a test
we perform below.
This multiplicative
construction ensures that
the participation rate
carries no weight when the
Polity democracy score is
zero and has little impact
on the overall score at low
levels of democracy. It prevents high voting turnouts, including those inflated by false reporting or
harsh compulsory voting laws, from producing an unwarranted high score on Participatory
Democracy among autocracies.22 While conceptually attractive, the result is a measure that does
not differ from the Polity score for the 48% of the nation-years in our sample with zero scores on
democracy.
21 In the process of increasing the role of participation, the influence of executive constraints identified by Gleditsch and Ward (1997) is reduced significantly by PEPS1 and even more by PEPS2. It remains that multiple combinations of sub-dimensions can yield the same overall score, as in any mapping to a single data point. 22 An additional advantage of this construction is that it permits the computation of valid PEPS1 scores for nations with a zero level of democracy regardless of the availability of voting data.
Voting Counts: Participation in the Measurement of Democracy Page 14 of 36
Thus, we construct an alternative variable, PEPS2, which does not so strongly pre-judge the
democratic character of participation within an autocratic institutional structure. We compute
PEPS2 as the average of the Polity score and the VTS, after the latter’s 0-100 range is scaled to
match the former’s –10 to +10.23 Whereas PEPS1 may be thought of as a fully continuous
extension of Polity’s coarse categorization of participation, PEPS2 is designed as an index
combining the institutional and participation facets of democracy in a more equal weighting.
Specifically,
[3] PEPS2i,t = ( ( (VTSi,t / .05) - 10) + Polityi,t) / 2
In principle, PEPS2 permits much greater differentiation among countries at low levels of
democracy than does PEPS1, whereas the two versions differ from one another only fractionally
among nations with high Polity scores. In practice, IDEA’s exclusion of non-competitive elections
results in a high incidence of missing data among the most autocratic nations. Thus, these cases are
omitted from analyses involving our PEPS2 measure. Because this reduces our sample and
constrains the generality of our results, we have constructed an alternative measure of PEPS2 in
which these countries are assigned a zero score, but we report results using them only in footnotes
and in Table 224.
Table 2 lists all the available scores for 2003. The PEPS2 scores in bold were computed
using a zero participation score for those nations lacking voting data, which would otherwise be
recorded as missing data.25 The results of our new measurement may prove shocking to some. The
traditional democratic leaders of the pack are no longer. The top 35 countries listed all score a
perfect 10 with Polity; however, none score a perfect 10 with PEP1 or PEPS2. The surprisingly low 23 The Polity score is a variant of Polity2 in which nations undergoing an interregnum are treated as missing data points rather than the zero value. See Marshall and Jaggers (2001) and our web site for details. 24 IDEA does not distinguish between a “non-competitive” election and no election at all. Furthermore, it is not clear theoretically whether voting in “non-competitive” elections should be considered to constitute “participation” in any meaningful sense. 25 This process boosts the number of nation-years for which a PEPS2 score can be computed by about 50%, but it adds only about 3% for PEPS1, because most nations without voting data have a zero score on democracy.
Voting Counts: Participation in the Measurement of Democracy Page 15 of 36
scores of well-known established democracies such as the United States and Switzerland are due to
the very low voter turnout in recent elections. While the political institutions of these countries
might set the standard for others to aspire to, we just cannot square turnout rates below 50% with
any reasonable understanding of universal participation.
Table 2 - Voter turnout, Polity, PEPS1 and PEPS2 scores for all countries in 2003
Country Turnout Polity PEPS1 PEPS2 1 Mongolia 97% 10 9.70 9.70 2 Uruguay 95% 10 9.47 9.47 3 Iceland 91% 10 9.08 9.08 4 Greece 89% 10 8.90 8.90 5 Belgium 89% 10 8.88 8.88 6 Italy 85% 10 8.49 8.49 7 Israel 84% 10 8.45 8.45 8 Australia 84% 10 8.38 8.38 9 Denmark 84% 10 8.35 8.35 10 Mauritius 80% 10 7.96 7.96 11 Netherlands 78% 10 7.81 7.81 12 Sweden 78% 10 7.78 7.78 13 Cyprus 78% 10 7.76 7.76 14 Finland 77% 10 7.68 7.68 15 Austria 74% 10 7.38 7.38 16 Spain 74% 10 7.38 7.38 17 Norway 73% 10 7.31 7.31 18 Germany 73% 10 7.26 7.26 19 New Zealand 72% 10 7.25 7.25 20 Slovenia 72% 10 7.23 7.23 21 Portugal 70% 10 7.01 7.01 22 Trinidad 69% 10 6.95 6.95 23 Ireland 67% 10 6.72 6.72 24 Costa Rica 64% 10 6.42 6.42 25 Poland 63% 10 6.26 6.26 26 Czech
Republic 59% 10 5.85 5.85
27 United Kingdom
58% 10 5.76 5.76
28 Luxembourg 57% 10 5.69 5.69 29 Japan 56% 10 5.65 5.65 30 Hungary 56% 10 5.58 5.58 31 Canada 55% 10 5.46 5.46 32 Lithuania 55% 10 5.45 5.45 33 United States 49% 10 4.93 4.93 34 Switzerland 38% 10 3.78 3.78 35 Papua New
Guinea 10 5.00
36 Macedonia 85% 9 7.65 8.00 37 Slovakia 79% 9 7.12 7.42 38 Peru 79% 9 7.07 7.36 39 Taiwan 78% 9 6.98 7.26 40 Panama 76% 9 6.87 7.13 41 Chile 73% 9 6.55 6.78 42 Bulgaria 72% 9 6.49 6.71 43 France 72% 9 6.46 6.68 44 Thailand 70% 9 6.31 6.51 45 India 65% 9 5.89 6.05 46 South Africa 64% 9 5.75 5.89 47 Jamaica 46% 9 4.14 4.10 48 Botswana 42% 9 3.78 3.70 49 Nicaragua 89% 8 7.10 7.87
Country Turnout Polity PEPS1 PEPS2 50 Brazil 83% 8 6.63 7.28 51 Argentina 80% 8 6.36 6.95 52 Korea South 71% 8 5.70 6.12 53 Philippines 69% 8 5.52 5.90 54 Bolivia 67% 8 5.32 5.65 55 Dominican
Republic 65% 8 5.23 5.53
56 Moldova 64% 8 5.10 5.38 57 Romania 62% 8 4.97 5.22 58 Lesotho 60% 8 4.81 5.01 59 Mexico 60% 8 4.80 5.00 60 Latvia 54% 8 4.35 4.44 61 Paraguay 53% 8 4.21 4.26 62 Guatemala 49% 8 3.92 3.90 63 Senegal 41% 8 3.29 3.12 64 Kenya 39% 8 3.15 2.93 65 Albania 100% 7 7.00 8.50 66 Indonesia 86% 7 5.86 7.07 67 Croatia 74% 7 5.20 5.93 68 Ukraine 74% 7 5.16 5.88 69 Turkey 75% 7 5.00 6.00 70 Russia 69% 7 4.82 5.38 71 Honduras 69% 7 4.80 5.36 72 Madagascar 55% 7 3.82 3.96 73 Colombia 44% 7 3.05 2.86 74 El Salvador 38% 7 2.67 2.31 75 East Timor 100% 6 6.00 8.00 76 Malawi 87% 6 5.08 8.00 77 Ecuador 79% 6 4.73 5.88 78 Bangladesh 75% 6 4.52 5.53 79 Sri Lanka 78% 6 4.49 5.85 80 Guyana 73% 6 4.35 5.26 81 Benin 65% 6 3.88 4.47 82 Namibia 62% 6 3.73 4.22 83 Mozambique 59% 6 3.57 3.94 84 Ghana 65% 6 3.52 4.46 85 Venezuela 47% 6 2.80 2.67 86 Serbia &
Montenegro 46% 6 2.77 2.62
87 Estonia 47% 6 2.32 2.74 88 Mali 33% 6 1.96 1.27 89 Sierra Leone 89% 5 4.44 6.38 90 Fiji 78% 5 3.65 5.25 91 Armenia 72% 5 3.59 4.67 92 Georgia 65% 5 3.26 4.02 93 Niger 96% 4 3.85 6.62 94 Nigeria 75% 4 2.99 4.47 95 Comoros 33% 4 1.31 0.27 96 Iran 86% 3 2.46 5.14 97 Malaysia 50% 3 0.98 1.46 98 Cambodia 83% 2 1.50 4.34 99 Tanzania 53% 2 0.59 1.31 100 Djibouti 29% 2 -0.13 -1.10 101 Ethiopia 60% 1 -0.20 1.50 102 Zambia 36% 1 -0.92 -0.91
Voting Counts: Participation in the Measurement of Democracy Page 16 of 36
Country Turnout Polity PEPS1 PEPS2 103 Burkina Faso 47% 0 -1.06 -0.31 104 Guinea 100% -1 -1.00 4.50 105 Cen. African
Rep 89% -1 -1.11 3.36
106 Guinea-Bissau 63% -1 -1.37 0.76 107 Togo 100% -2 -2.00 4.00 108 Yemen 77% -2 -2.23 1.67 109 Chad 70% -2 -2.30 1.00 110 Haiti 61% -2 -2.39 0.05 111 Jordan 49% -2 -3.02 -1.09 112 Singapore 21% -2 -3.57 -3.86 113 Rwanda 100% -3 -3.00 3.50 114 Tajikistan 86% -3 -3.14 2.06 115 Kyrgyzstan 74% -3 -3.26 0.93 116 Algeria 64% -3 -3.36 -0.12 117 Angola -3 -6.50 118 Uganda 74% -4 -4.00 0.42 119 Congo 74% -4 -4.00 0.42 120 Gabon 55% -4 -4.00 -1.52 121 Tunisia 56% -4 -4.44 -1.43 122 Cameroon 55% -4 -4.45 -1.50 123 Gambia 64% -5 -5.00 -1.06 124 Pakistan 41% -5 -5.00 -3.43 125 Eq. Guinea -5 -5.00 -7.50 126 Kazakhstan 71% -6 -6.00 -0.89 127 Mauritania 49% -6 -6.00 -3.07 128 Morocco 41% -6 -6.00 -3.93 129 Egypt 30% -6 -6.00 -4.96 130 Sudan -6 -6.00 131 Nepal 76% -6 -6.24 -0.42 132 Belarus 81% -7 -7.00 -0.37 133 Azerbaijan 61% -7 -7.00 -2.38 134 Zimbabwe 50% -7 -7.00 -3.52 135 Kuwait 7% -7 -7.00 -7.85 136 Myanmar -7 -7.00 -8.50 137 Eritrea -7 -7.00 -8.50 138 Vietnam -7 -7.00 -8.50 139 Laos -7 -7.00 -8.50 140 Cuba -7 -7.00 -8.50 141 Bahrain -7 -7.00 -8.50 142 Libya -7 -7.00 -8.50 143 China -7 -7.00 -8.50 144 Syria -7 -7.00 -8.50 145 UAE -8 -8.00 -9.00 146 Oman -8 -8.00 -9.00 147 Bhutan -8 -8.00 -9.00 148 Swaziland -9 -9.00 -9.50 149 Turkmenistan -9 -9.00 -9.50 150 Uzbekistan -9 -9.00 -9.50 151 Korea North -9 -9.00 -9.50 152 Saudi Arabia -10 -10.00 -10.00 153 Qatar -10 -10.00 -10.00
Voting Counts: Participation in the Measurement of Democracy Page 17 of 36
The discussion above establishes the “face validity” of our measures of Participatory
Democracy. The remainder of the paper spells out the benefits of using those measures and, in the
process, demonstrates their reliability and validity. Several methods of establishing “construct
validity” are available for new measures of well-known concepts whose existing operationalizations
have been used in previous research. The first, “internal construct validation” or “convergent
validity” requires a demonstration that the measures are collinear with existing indicators of the
same concept also widely assumed to have face validity.26
Accordingly, Table 3 presents the correlations of Participatory Democracy scores and their
components with the indexes of democracy and their components from three leading data projects,
the Polity project of Jaggers and Gurr (1995), the Freedom House project originated by Gastil
(1972), and the democracy project of Vanhanen (2000). The convergent validity of the
Participation Enhanced Polity Scores are established by their high correlations with each of the
alternative
measures.27
A
different
approach,
known as
“external
construct
26 Munck and Verkuilen (2002a) contend that comparisons between a new measure and existing ones can establish reliability, but not validity. To be reliable a measure must be fully reproducible by an independent drawing on the same sources. But this position does not take into account the collective validity accorded to these measures by the expert acceptance reflected in their widespread use. 27 The pairwise correlations represent the sample of all available scores for the period 1800 to the present, encompassing a total of 15,785 nation-years. Since Freedom House covers only the period since 1972, most of the correlations involving those variables are computed over about 4000 cases. To avoid confusion over signs, the Freedom House variables have been rescaled so that higher numbers indicate higher levels of democracy.
Pol
ity d
emoc
racy
Pol
ity a
utoc
racy
Pol
ity3
FH p
oliti
cal r
ight
s
FH c
ivil
liber
ties
l
FH fr
eedo
m
V c
ompe
titiv
enes
s
V p
artic
ipat
ion
Van
hane
n in
dex
PE
PS
1
Vot
ing/
Pop
ulat
ion
PE
PS
2
Polity democracy 1.00 Polity autocracy 0.86 1.00 Polity3 0.97 -0.96 1.00 FH political rights 0.92 0.87 0.92 1.00 FH civil liberties 0.86 0.82 0.86 0.92 1.00 FH freedom 0.91 -0.86 0.91 0.98 0.98 1.00 V competitiveness 0.81 -0.74 0.81 0.86 0.81 0.85 1.00 V participation 0.49 -0.38 0.45 0.50 0.47 0.50 0.51 1.00 Vanhanen index 0.77 -0.65 0.74 0.83 0.80 0.83 0.81 0.74 1.00 PEPS1 0.93 -0.94 0.97 0.92 0.88 0.92 0.81 0.57 0.85 1.00 Voting/Population 0.48 -0.38 0.45 0.49 0.46 0.48 0.50 0.98 0.71 0.55 1.00 PEPS2 0.85 -0.79 0.85 0.81 0.76 0.81 0.77 0.84 0.85 0.90 0.85 1.00
Table 3 - Correlations between Participatory Democracy scores and Democracy Indices

Voting Counts: Participation in the Measurement of Democracy Page 18 of 36
validity”, gauges the validity of a measure in terms of its empirical associations with concepts that
are causally linked to it. This causal linkage should be firmly established in the theoretical
literature and supported by uncontested empirical evidence. When the validity of the new measure
is more open to question than the accuracy of the theoretical claim, the finding of a statistical
relationship that is theoretically expected is properly interpreted as affirmation of the validity of the
new measure28. This procedure permits the identification of a stronger form of “predictive
validity”, or whether our measure produces a better prediction than existing ones.
In the next three sections, we choose three sets of phenomena to conduct external construct
validity tests: one a known cause of democracy (development), one an internal attribute of
democracy itself (its persistence over time, i.e. serial correlation that mirrors a “test-retest”
approach to reliability), and two known consequences of democracy (the achievement of basic
needs and gender equality).
5. Democratization and modernization: the historical record Among the most cited correlations in the social sciences is the tendency of rich nations to be
more democratic. The robustness of this finding across numerous indicators, samples, and test
procedures makes this an unusually solid comparison for external and predictive approaches to
validation. The wide array of theoretical perspectives that anticipate an empirical relationship
between democracy and development provides additional confidence. Since Lipset’s (1959)
original formulation, nearly identical predictions have been generated from both refinements of
modernization theory and theoretical challenges to it (Rostow, 1971; Bollen, 1983; Inkeles, 1998;
Huber et. al., 1993). In what has become known as the “endogenous” explanation, a range of
structural conditions that accompany rising incomes are said to undercut autocracy and promote the
28 Adcock and Collier (2000) call this the “AHEM validity test” (Assume the Hypothesis, Evaluate the Measure).
Voting Counts: Participation in the Measurement of Democracy Page 19 of 36
adoption of democracy: education, urbanization, changing class structures, technological growth,
etc. Przeworski and Limongi (1997:156) portray it this way:
A story told about country after country is that as they develop, social structure becomes complex,
labor processes begin to require the active cooperation of employees, and new groups emerge and
organize. As a result, the system can no longer be effectively run by command: the society is too
complex, technological change endows the direct producers with some autonomy and private
information, civil society emerges, and dictatorial forms of control lose their effectiveness. Various
groups, whether the bourgeoisie, workers, or just the amorphous "civil society," rise against the
dictatorial regime, and it falls.29
Countless studies have confirmed the correlation between economic development and
democracy, most using logged GDP per capita as the independent variable (Jackman, 1973; Lipset,
1959, 1994; Bollen, 1983; Huntington, 1987; Bhagwati, 1992; Barro, 1996; Burkhardt and Lewis-
Beck, 1994; Lipset, Seong, Torres 1993). This body of work serves as a control of sorts by
establishing an outcome against which we can compare our new measures. If our measures do not
exhibit the same close relationship with logged GDP, then they should be questioned. By contrast,
if the relationship is closer than other democracy measures we may reasonably conclude that we
have captured essential elements that others have not.
We test this premise in a cross-sectional analysis by estimating equations [4] through [6] on
two different samples.
[4] Polityi,t = α1 + β1 ln(GDPcapi,t ) + ∈t
[5] PEPS1i,t = α2 + β2 ln(GDPcapi,t ) + µ1t
29 Przeworski takes the cross-sectional relationship as a given, but challenges the “endogenous” explanation for it (Przeworski and Limongi, 1997; Przeworski et. al., 2000). His “exogenous” account contends that democracy arises as frequently in poor countries as in rich ones, but that “once established, democracies are likely to die in poor countries and certain to survive in wealthy ones” Przeworski and Limongi (1997:167). This rejection of the endogenous explanation is itself refuted conceptually, theoretically, and empirically by Boix and Stokes (2003) and Hadenius and Teorell (2005). Despite these different explanations, all accept as valid the strong relationship between democracy and development.

Voting Counts: Participation in the Measurement of Democracy Page 20 of 36
[6] PEPS2i,t = α3 + β3 ln(GDPcapi,t ) + µ2t
The first estimation, reported in Table 4, is
conducted over the seven years for which Maddison
(2001) provides GDP data, using turnout data from
Vanhanen (2000). In all seven years, PEPS2 is more
closely related to income than is Polity and, in six of the seven, PEPS1 also fits the data better than
the Polity measure.
We conducted a similar analysis for each year from 1950 through 2000, using IDEA voting
data and Penn World Tables real GDP.30 In 49 of 51 years PEPS1 yields higher r2 values than
Polity, while PEPS2 was more closely related to GDP per capita than Polity in 48 cases. Polity
produced a higher correlation than both in only 2 of the 51 years.31 While not conclusive evidence
for the superiority of the Participation Enhanced Polity Scores, these results lend credence to our
argument by showing that the theoretically-expected and frequently-confirmed cross-sectional
relationship between democracy and income emerges more clearly with PEPS than with Polity. 32
6. The persistence of democracy: Does participation matter? Having shown the greater cross-sectional variance found in PEPS can be accounted for by
accepted theory, we now demonstrate the more frequent cross-time changes in PEPS also measure
real differences rather than merely noise. To do so we take advantage of another well-known
property of political systems: the best prediction of a nation’s level of democracy is invariably its
own lagged value. The internal logic of the complex interlocking changes constituting
30 The results, reported in a table comparable to Table 4 are available from the authors. 31 When the absence of competitive elections is considered zero participation rather than missing data, the sample size for analysis increases markedly and changes character, because it now includes a larger number of very autocratic nations. Measures of PEPS2 computed under that premise show higher r2 values than Polity in 37 of 51 cases while Polity1, much less affected by missing voting data, continues to do so in 48 of 51 cases. 32 Longitudinal analysis was attempted using Prais-Winsten time-series techniques, which are close derivatives of linear regression models. The results were inconclusive, due to problems of collinearity associated with unchanging (i.e., y(t)=y(t+1)) Polity Scores and a tendency for non-convergence in the Prais-Winsten iterations.
Polity PEPS1 PEPS2 Year # of Obs. r² r² r² 1820 12 .053 .034 .055 1870 24 .226 .262 .246 1913 30 .338 .377 .476 1950 74 .324 .417 .441 1973 126 .216 .245 .226 1990 128 .430 .493 .479 1998 144 .210 .273 .300
Table 4 - Cross-Sectional OLS Regression of Democracy on logged GDP
Voting Counts: Participation in the Measurement of Democracy Page 21 of 36
democratization provides a powerful momentum that appears statistically as strong serial
correlation. Following Elkins (2000), we argue the more finely-graded PEPS is superior to Polity if
the additional detail it contains provides useful forecasting information. Challenging the prediction
of serial correlation is surely a daunting task for any alternative indicator.
This measurement stance invokes an underlying theoretical contention: that participation
itself drives change in other components of democracy. We expect participation to be a “leading
indicator” of change in authority relations because broad citizen participation exerts pressure
towards greater institutionalized democracy, whereas low participation allows authority relations to
slide in an authoritarian direction.33 The conviction that empowered citizens will choose
institutions embodying democratic authority relations is central to the utilitarian defense of
democracy as a superior political system. If true, participation is a key component of democracy
not only because it makes democracy more complete at present, but also because it makes it more
likely to endure and even progress in the future.
To test whether electoral participation predicts the future state of authority relations, we
estimate a series of Granger-causality equations defined over various time periods and with
differing lags (Granger 1969; Freeman 1983).34 In our first cross-sectional time-series analysis, the
sample contains 3881 nation-years over the 1950 to 2003 time period, consisting of unbalanced
panels from 4 to 54 years for 142 nations. We assume a lag of one year and estimate:
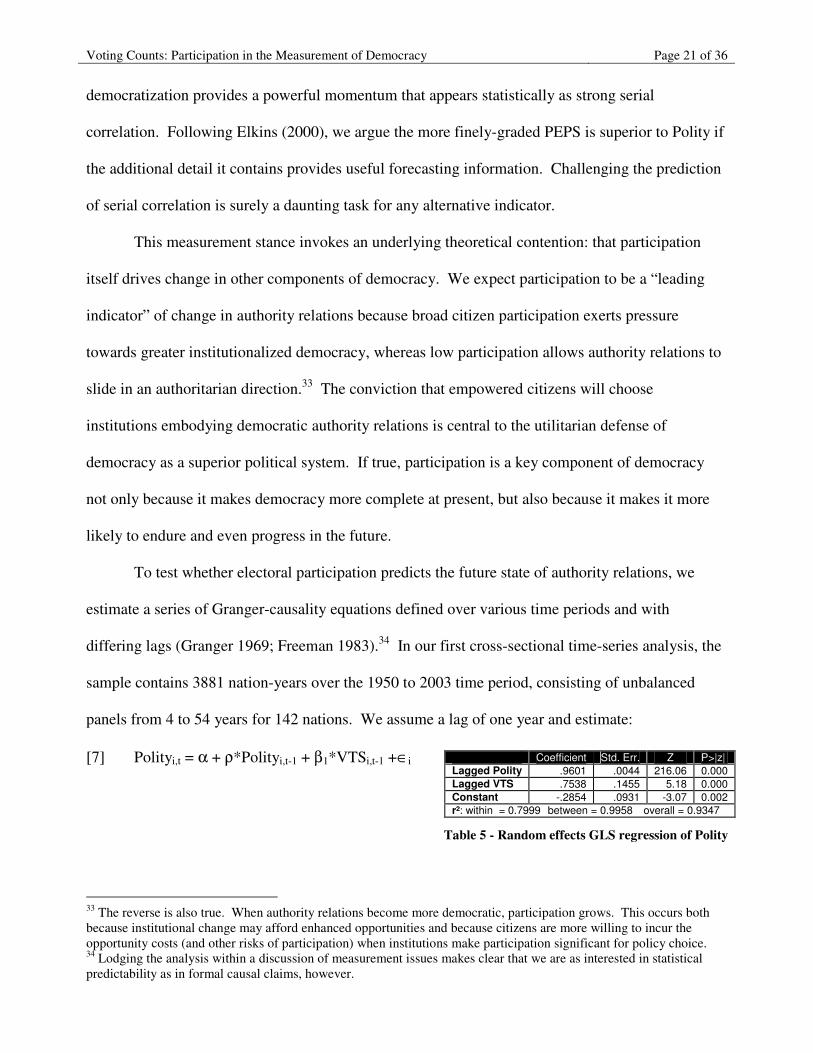
[7] Polityi,t = α + ρ*Polityi,t-1 + β1*VTSi,t-1 +∈i
33 The reverse is also true. When authority relations become more democratic, participation grows. This occurs both because institutional change may afford enhanced opportunities and because citizens are more willing to incur the opportunity costs (and other risks of participation) when institutions make participation significant for policy choice. 34 Lodging the analysis within a discussion of measurement issues makes clear that we are as interested in statistical predictability as in formal causal claims, however.
Coefficient Std. Err. Z P>|z| Lagged Polity .9601 .0044 216.06 0.000 Lagged VTS .7538 .1455 5.18 0.000 Constant -.2854 .0931 -3.07 0.002 r²: within = 0.7999 between = 0.9958 overall = 0.9347
Table 5 - Random effects GLS regression of Polity
Voting Counts: Participation in the Measurement of Democracy Page 22 of 36
We expect to find a large value for ρ but are most interested in whether β1 achieves
statistical significance. Polity is indeed strongly serially correlated, as represented by the
coefficient of .96 and z of 216.06 in the first row of Table 5. However, the coefficient of the lagged
participation variable attains a z of 5.18, significant well past .001.35 Even in the presence of the
lagged dependent variable, participation rates are strongly and positively related to future Polity
scores. Nations with higher participation rates are likely to have more democratic authority
relations a year later.36
To analyze the effect of participation across broader expanses of time we also use a design
with a single discrete panel for each nation. This approach enables us to check the robustness of the
above result across alternative formulations and to determine if a superior prediction can be
obtained from PEPS, which combines the causally intertwined participation and institutional
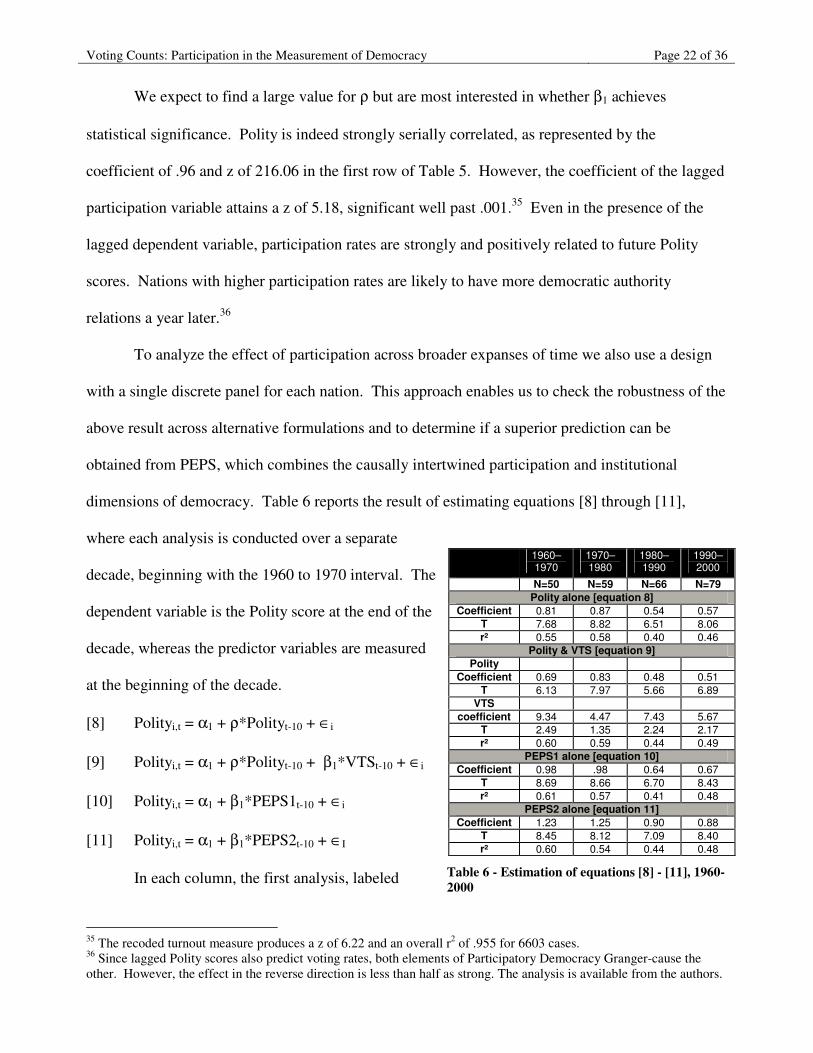
dimensions of democracy. Table 6 reports the result of estimating equations [8] through [11],
where each analysis is conducted over a separate
decade, beginning with the 1960 to 1970 interval. The
dependent variable is the Polity score at the end of the
decade, whereas the predictor variables are measured
at the beginning of the decade.
[8] Polityi,t = α1 + ρ*Polityt-10 + ∈i
[9] Polityi,t = α1 + ρ*Polityt-10 + β1*VTSt-10 + ∈i
[10] Polityi,t = α1 + β1*PEPS1t-10 + ∈i
[11] Polityi,t = α1 + β1*PEPS2t-10 + ∈I
In each column, the first analysis, labeled
35 The recoded turnout measure produces a z of 6.22 and an overall r2 of .955 for 6603 cases. 36 Since lagged Polity scores also predict voting rates, both elements of Participatory Democracy Granger-cause the other. However, the effect in the reverse direction is less than half as strong. The analysis is available from the authors.
1960–1970
1970–1980
1980–1990
1990–2000
N=50 N=59 N=66 N=79 Polity alone [equation 8]
Coefficient 0.81 0.87 0.54 0.57 T 7.68 8.82 6.51 8.06 r² 0.55 0.58 0.40 0.46
Polity & VTS [equation 9] Polity
Coefficient 0.69 0.83 0.48 0.51 T 6.13 7.97 5.66 6.89
VTS coefficient 9.34 4.47 7.43 5.67
T 2.49 1.35 2.24 2.17 r² 0.60 0.59 0.44 0.49
PEPS1 alone [equation 10] Coefficient 0.98 .98 0.64 0.67
T 8.69 8.66 6.70 8.43 r² 0.61 0.57 0.41 0.48
PEPS2 alone [equation 11] Coefficient 1.23 1.25 0.90 0.88
T 8.45 8.12 7.09 8.40 r² 0.60 0.54 0.44 0.48
Table 6 - Estimation of equations [8] - [11], 1960-2000
Voting Counts: Participation in the Measurement of Democracy Page 23 of 36
“Polity alone”, represents the benchmark equation [8]. In an attempt to improve upon the fit of this
point of reference, the remaining analyses include the participation effect in three different ways.
Equation [9], the second analysis reported in each column, adds the Voter Turnout Scalar to the
previous estimation, emulating equation [7] but with a longer lag. Equations [10] and [11] duplicate
[8], but substitute PEPS1 and PEPS2, respectively, for Polity as the predictor.
The results support our thesis. For each decade except the 1970s, VTS is positive and
statistically significant, indicating that past participation rates help predict future Polity scores. For
example, in the 1960s, the Polity score at the beginning of the decade could explain 55 percent of
the variance in Polity at the end of the decade. Adding participation, however, noticeably improved
the r² to .60, with the t value for VTS showing a significant 2.49. In fact, both PEPS1 and PEPS2
alone are superior to Polity in predicting Polity’s future value in every decade except the 1970s.37
Based on these findings, it is undeniable that including participation as an element of an overall
democracy score pays dividends for the analysis of democratic persistence post 1960.
Is the same true for an earlier era, dating to the early 19th century? An analysis of the period
allows us to look at lag times testing democratic persistence over periods far longer than the one-
year and the one-decade intervals in the analyses above. We used the years contained in Maddison
(2001) as our base points: 1820, 1870, 1913, 1950, 1973, 1990 and 1998, allowing a total of twenty
one different intervals ranging from eight to 178 years. 38
37 A similar conclusion follows from an unreported analysis of an extension of equation [7] beyond one year. With higher-order lags, participation attained greater significance and the predictive power of lagged Polity declined. At ten years, the two are about equally good predictors and at twenty years lagged Polity scores make no additional contribution whatever to the prediction offered by participation rates. 38 The participation measure, VTS, is computed from Vanhanen’s turnout data and Maddison’s population estimate.
Voting Counts: Participation in the Measurement of Democracy Page 24 of 36
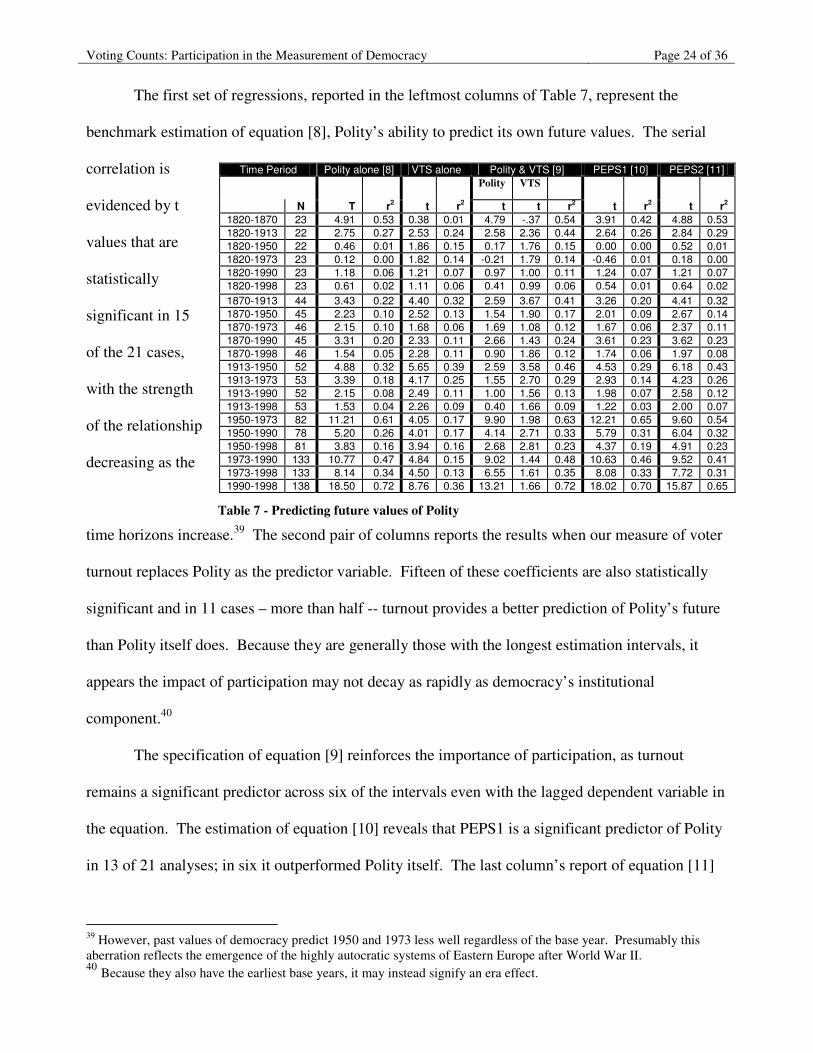
The first set of regressions, reported in the leftmost columns of Table 7, represent the
benchmark estimation of equation [8], Polity’s ability to predict its own future values. The serial
correlation is
evidenced by t
values that are
statistically
significant in 15
of the 21 cases,
with the strength
of the relationship
decreasing as the
time horizons increase.39 The second pair of columns reports the results when our measure of voter
turnout replaces Polity as the predictor variable. Fifteen of these coefficients are also statistically
significant and in 11 cases – more than half -- turnout provides a better prediction of Polity’s future
than Polity itself does. Because they are generally those with the longest estimation intervals, it
appears the impact of participation may not decay as rapidly as democracy’s institutional
component.40
The specification of equation [9] reinforces the importance of participation, as turnout
remains a significant predictor across six of the intervals even with the lagged dependent variable in
the equation. The estimation of equation [10] reveals that PEPS1 is a significant predictor of Polity
in 13 of 21 analyses; in six it outperformed Polity itself. The last column’s report of equation [11]
39 However, past values of democracy predict 1950 and 1973 less well regardless of the base year. Presumably this aberration reflects the emergence of the highly autocratic systems of Eastern Europe after World War II. 40 Because they also have the earliest base years, it may instead signify an era effect.
Time Period Polity alone [8] VTS alone Polity & VTS [9] PEPS1 [10] PEPS2 [11] Polity VTS
N T r2 t r2 t t r2 t r2 t r2 1820-1870 23 4.91 0.53 0.38 0.01 4.79 -.37 0.54 3.91 0.42 4.88 0.53 1820-1913 22 2.75 0.27 2.53 0.24 2.58 2.36 0.44 2.64 0.26 2.84 0.29 1820-1950 22 0.46 0.01 1.86 0.15 0.17 1.76 0.15 0.00 0.00 0.52 0.01 1820-1973 23 0.12 0.00 1.82 0.14 -0.21 1.79 0.14 -0.46 0.01 0.18 0.00 1820-1990 23 1.18 0.06 1.21 0.07 0.97 1.00 0.11 1.24 0.07 1.21 0.07 1820-1998 23 0.61 0.02 1.11 0.06 0.41 0.99 0.06 0.54 0.01 0.64 0.02 1870-1913 44 3.43 0.22 4.40 0.32 2.59 3.67 0.41 3.26 0.20 4.41 0.32 1870-1950 45 2.23 0.10 2.52 0.13 1.54 1.90 0.17 2.01 0.09 2.67 0.14 1870-1973 46 2.15 0.10 1.68 0.06 1.69 1.08 0.12 1.67 0.06 2.37 0.11 1870-1990 45 3.31 0.20 2.33 0.11 2.66 1.43 0.24 3.61 0.23 3.62 0.23 1870-1998 46 1.54 0.05 2.28 0.11 0.90 1.86 0.12 1.74 0.06 1.97 0.08 1913-1950 52 4.88 0.32 5.65 0.39 2.59 3.58 0.46 4.53 0.29 6.18 0.43 1913-1973 53 3.39 0.18 4.17 0.25 1.55 2.70 0.29 2.93 0.14 4.23 0.26 1913-1990 52 2.15 0.08 2.49 0.11 1.00 1.56 0.13 1.98 0.07 2.58 0.12 1913-1998 53 1.53 0.04 2.26 0.09 0.40 1.66 0.09 1.22 0.03 2.00 0.07 1950-1973 82 11.21 0.61 4.05 0.17 9.90 1.98 0.63 12.21 0.65 9.60 0.54 1950-1990 78 5.20 0.26 4.01 0.17 4.14 2.71 0.33 5.79 0.31 6.04 0.32 1950-1998 81 3.83 0.16 3.94 0.16 2.68 2.81 0.23 4.37 0.19 4.91 0.23 1973-1990 133 10.77 0.47 4.84 0.15 9.02 1.44 0.48 10.63 0.46 9.52 0.41 1973-1998 133 8.14 0.34 4.50 0.13 6.55 1.61 0.35 8.08 0.33 7.72 0.31 1990-1998 138 18.50 0.72 8.76 0.36 13.21 1.66 0.72 18.02 0.70 15.87 0.65
Table 7 - Predicting future values of Polity

Voting Counts: Participation in the Measurement of Democracy Page 25 of 36
offers the most striking results: in 16 of 21 intervals, the relationship between Polity and lagged
PEPS2 was significant; and the PEPS2 prediction was also superior to Polity’s in 16 cases.41
In short, we have very strong evidence of a statistical relationship between earlier levels of
participation and later levels of institutional democracy, over lags ranging from one to 178 years,
estimated within three different model specifications, and using two different data sources.
Moreover, we have shown both PEPS measures are at least as effective in predicting future Polity
levels as lagged Polity itself, and frequently superior. Thus, if we adjudicate the question of the
value of the additional detail contained in PEPS on the basis of whether it portends future
democratic change, the conclusion is evident. Since higher participation makes a nation causally
closer to full democracy, the PEPS measures appropriately register it as conceptually closer as
well.42
We know of no formal standard by which to judge whether these results are strong enough
to justify the inclusion of participation in a measure of democracy. However, this analysis surely
adds to the external construct validity established by the demonstration that the PEPS measures
perform closer to theoretical expectations as dependent variables than does Polity.
7. Democracy, basic needs, and gender equality Our final series of tests of the predictive validity of PEPS concerns the effect of democracy,
variously measured, on two social outcomes with a strong distributional component – the
achievement of basic human needs and gender equality. There is little doubt that a democratic state
can and should play a key role in shaping those outcomes; indeed, it is generally acknowledged that
egalitarian outcomes require affirmative state action (Moon, 1991; Lindblom, 1977; Gough, 2000).
Typical is Moon’s (1991: 100) formulation: 41 In analyses not presented, both PEPS1 and PEPS2 are also shown to have higher serial correlation than Polity. 42 Such cross-time inferences are both appropriate and necessary because democracy is not an idea well suited for discrete point estimates at precise instants. Its essence lies in linkages that are revealed only over time, especially that the preferences expressed in elections are reflected in subsequent policies. Nevertheless, statistical testing methods require that we make such simplifying assumptions.
Voting Counts: Participation in the Measurement of Democracy Page 26 of 36
“If the natural propensity to inequality is to be minimized, the productive capacities of the economy
must be directed toward the provision of basic needs. That direction must be accomplished outside a
system dominated by the logic of capital accumulation and microeconomic rationality; that is, it must
occur in the political realm.”
Under what conditions will the state assume the orientation leading it to act in this way? In
what Hewitt (1977) describes as the “simple democratic hypothesis,” the “existence of democratic
institutions – especially the enfranchisement of all citizens – virtually guarantees relatively
egalitarian policies” (1991:132). Underlying the expectation that basic needs and gender equality
will be more fully provided by democracies is the belief that “politicians seek to maximize their
chances of election and thus derive their policy preferences from those of their constituents” (Lake
and Baum, 2001: 589). By contrast, “benevolence among autocrats seems empirically rare.”
All that is required to complete the logic of Mayhew’s (1974) “electoral connection” is the
intuitive assumption that the political agenda of the poor will emphasize basic needs and the agenda
of women will feature gender equality. If so, democratic institutions should translate these
preferences into electoral power affecting state policy. If they do not, democratic states will find it
difficult to maintain their legitimacy and politicians will not retain their authority.
Hewitt (1977: 451) also offers an alternative view when he states, “Political democracy is
not a sufficient condition for the achievement of a more equal society. The crucial matter is what
the mass electorate does with the franchise.” Thus, he anticipates that democracy does not
necessarily promote equality; it does so only when the electorate attaches priority to it.
Although there are certainly preference variations between different electorates, we suspect
the apparently dissimilar effects of democracy in distinct settings are more a product of the degree
of democracy actually present. 43 We contend the breadth of political participation is at least as
important as the presence of democratic institutions in bringing about outcomes benefiting the
43 We recognize that improvements in social welfare will ultimately depend on a combination of political participation, national wealth, state capacity and many other factors not included in this analysis.
Voting Counts: Participation in the Measurement of Democracy Page 27 of 36
citizenry. Unless the poor actually participate, there is no magic in democratic institutions that will
bring about favorable outcomes for them. If women do not participate, democracy is only partial –
and will not engender equality. As Dahl (1971: 29) points out, democracies “are no more
considerate than other regimes toward people who are effectively excluded from the rights of
citizens”. Nor to those who do not exercise them. We test the effect of participation on these social
outcomes by comparing the predictive value of alternative measures of democracy.
First, as a measure of basic needs attainment we select an indicator comprised of the life
expectancy and education indexes used by the United Nations Development Program (UNDP) to
construct its well-known Human Development Index (HDI). We omit the HDI’s third component,
GDP per capita, because we use it on the right-hand side of the estimating equations. The data, for
2003, is taken directly from the UNDP web site.44
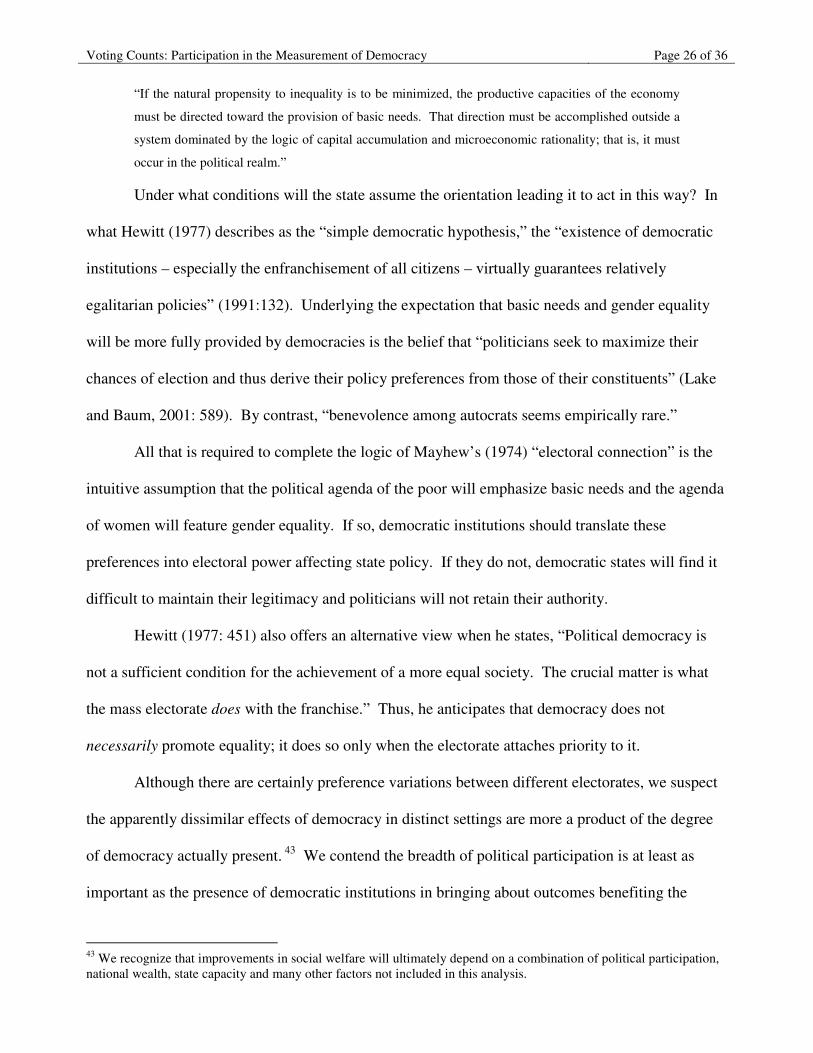
[12] HumanDevelopmenti = α1 + β1*log(GDP per capita)i + β2*Polityi + ∈i
[13] HumanDevelopmenti = α1 + β1*log(GDP per capita)i + β2*Polityi + β3*VTSi + ∈i
[14] HumanDevelopmenti = α1 + β1*log(GDP per capita)i + β2*PEPS1i + ∈i
[15] HumanDevelopmenti = α1 + β1*log(GDP per capita)i + β2*PEPS2i + ∈i
Table 8 reports the results of five regressions, each of which uses logged real GDP per
capita and a different
democracy measure to
predict Human
Development. In
column [12], which uses Polity as the democracy
measure, we see a result common to all previous studies of basic needs: human development rises
44 These three social indicators – life expectancy, adult literacy, and gross school enrollments – are also featured in the Millennium Development goals and two of them enter the venerable Physical Quality of Life Index (PQLI) frequently used in previous basic needs studies.
N=128 equation [12] VTS alone Equation [13] equation [14] equation [15] ββββ t ββββ t ββββ t ββββ t ββββ t LogGDPpc 13.29 15.01 14.04 18.99 13.51 15.39 13.14 15.22 13.18 16.20 Polity .319 1.65 .218 1.12 VTS 12.71 2.55 11.39 2.23 PEPS1 .488 2.15 PEPS2 .712 2.61 r² .739 .747 .750 .743 .748
Table 8 - Democracy and Human Development
Voting Counts: Participation in the Measurement of Democracy Page 28 of 36
along with economic development and increasing levels of democracy, though the latter does not
quite attain statistical significance (Moon, 1991, Gough, 2000; Moon and Dixon, 1985).
The next column replaces Polity with our measure of participation, the Voter Turnout Scalar
(VTS) computed from IDEA data. The results are striking. The t values demonstrate that
participation is a far more significant predictor of Human Development than the Polity measure of
democratic institutions. Column [13], which reports the estimation that includes both these
elements of democracy, confirms that participation does matter – indeed, more so than democratic
institutions, the t value of which is not statistically significant. The remaining columns demonstrate
that our two variants of the Participation Enhanced Polity Score are both better predictors of basic
needs provision than is Polity. These results add empirical evidence to our conceptual argument –
that the full effect of democracy on important social outcomes cannot be appreciated until
participation is incorporated into its measure. The failure to do so risks underestimating
democracy’s positive effects and, perhaps more importantly, misunderstanding the pathway by
which democracy accomplishes them.
Finally, we turn to gender equality.45 Numerous scholars have commented on the
importance of gender in development, demonstrating that when women possess the same social,
political, and economic opportunities as men, many positive development outcomes result (Klasen,
1999; Osmani and Sen, 2003; Nussbaum, 2000). According to Amartya Sen (1999), “Nothing,
arguably, is as important today in the political economy of development as an adequate recognition
of the political, economic, and social participation and leadership of women.” Despite the
importance of gender equality as a value in itself and as a spur to development, few rigorous cross-
45 Gender equality can be assessed along several partially colinear dimensions, including labor force participation, literacy, and office-holding (Marshall, 1985; Pampel and Tanaka, 1986; Miller, 1999). Following UNDP (1995), we focus on education, income, and life chances.
Voting Counts: Participation in the Measurement of Democracy Page 29 of 36
national studies have attempted to uncover its structural determinants.46 Indeed, there is little
agreement on how it should be conceptualized or measured. For the purpose of this study, we select
the UNDP’s gender-development index (GDI), which is more aptly described as a gendered version
of the human development index than as a direct measure of gender equality itself.47 Given the link
between democracy and other forms of equality, we adopt a design identical to that described
above, estimating equations [16] through [19]. We expect that democracy contributes to gender
equality, especially when democracy is properly understood to encompass participation.
[16] GDIi = α1 + β1*log(GDP per capita)i + β2*Polityi + ∈i
[17] GDIi = α1 + β1*log(GDP per capita)i + β2*Polityi + β3*VTSi + ∈i
[18] GDIi = α1 + β1*log(GDP per capita)i + β2*PEPS1i + ∈i
[19] GDIi = α1 + β1*log(GDP per capita)i + β2*PEPS2i + ∈i
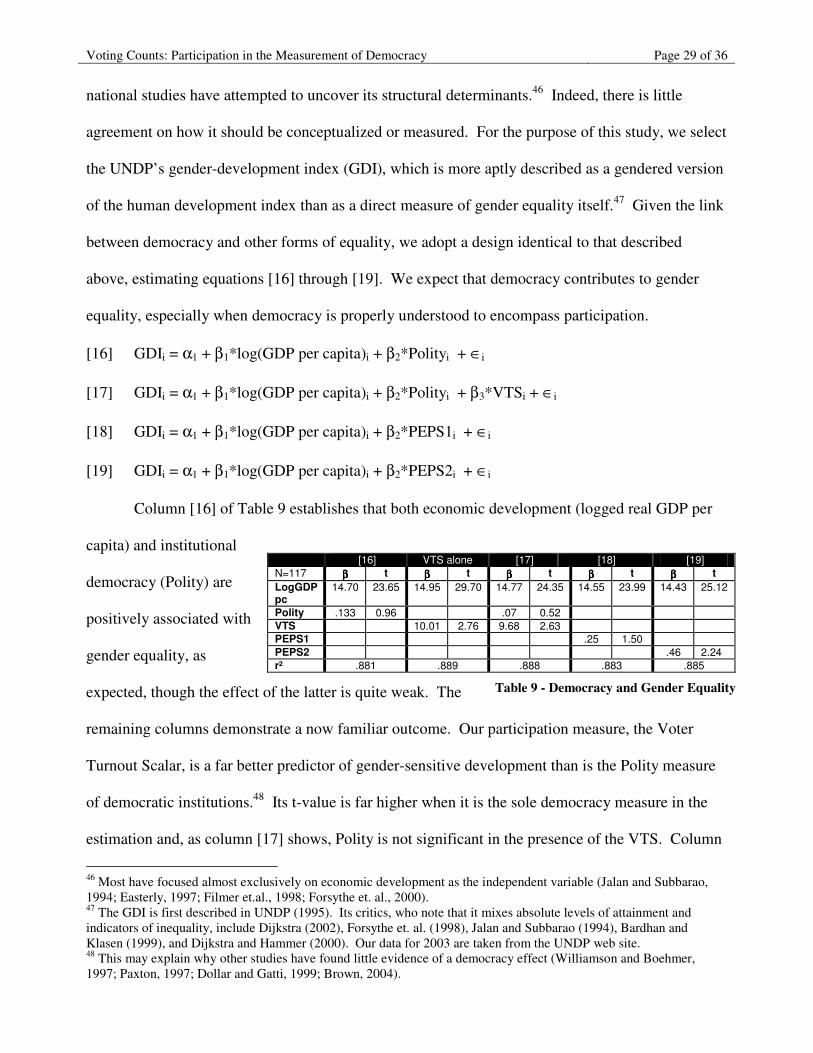
Column [16] of Table 9 establishes that both economic development (logged real GDP per
capita) and institutional
democracy (Polity) are
positively associated with
gender equality, as
expected, though the effect of the latter is quite weak. The
remaining columns demonstrate a now familiar outcome. Our participation measure, the Voter
Turnout Scalar, is a far better predictor of gender-sensitive development than is the Polity measure
of democratic institutions.48 Its t-value is far higher when it is the sole democracy measure in the
estimation and, as column [17] shows, Polity is not significant in the presence of the VTS. Column
46 Most have focused almost exclusively on economic development as the independent variable (Jalan and Subbarao, 1994; Easterly, 1997; Filmer et.al., 1998; Forsythe et. al., 2000). 47 The GDI is first described in UNDP (1995). Its critics, who note that it mixes absolute levels of attainment and indicators of inequality, include Dijkstra (2002), Forsythe et. al. (1998), Jalan and Subbarao (1994), Bardhan and Klasen (1999), and Dijkstra and Hammer (2000). Our data for 2003 are taken from the UNDP web site. 48 This may explain why other studies have found little evidence of a democracy effect (Williamson and Boehmer, 1997; Paxton, 1997; Dollar and Gatti, 1999; Brown, 2004).
[16] VTS alone [17] [18] [19] N=117 ββββ t ββββ t ββββ t ββββ t ββββ t LogGDP pc
14.70 23.65 14.95 29.70 14.77 24.35 14.55 23.99 14.43 25.12
Polity .133 0.96 .07 0.52 VTS 10.01 2.76 9.68 2.63 PEPS1 .25 1.50 PEPS2 .46 2.24 r² .881 .889 .888 .883 .885
Table 9 - Democracy and Gender Equality
Voting Counts: Participation in the Measurement of Democracy Page 30 of 36
[18] demonstrates that PEPS1 is clearly superior to Polity, but column [19] shows that PEPS2 is
better yet. Thus, we see that the most significant consequences of democracy – the welfare of
citizens and the equality of their treatment – follow more from the breadth of political participation
than from the mere presence of institutions.49 Our exercise in construct validation reveals important
causal mechanisms in the effect of democracy on institutional stability and key social outcomes.50
8. Conclusion Broad political participation is a core feature of democracy and crucial for its durability.
Participation helps to shape collective identity, as well as achieve social justice and equality across
class, gender and ethnic cleavages. No measure of democracy can be considered an accurate
representation of its basic character without directly including participation as a significant
component. And while we applaud increased attention to the extent of suffrage in a country, what
matters most is the number of citizens who actually vote.
Our Participation Enhanced Polity Scores (PEPS) have passed the tests appropriate for new
measures. We demonstrated via three examples – Great Britain, South Africa, and Switzerland –
that PEPS offers a more accurate reflection of democratic qualities than existing measures. We
demonstrated the reliability of PEPS by showing its close relationship with accepted alternatives.
We validated it by comparing its empirical correlates in three kinds of studies. First, we confirmed
the story of rising incomes leading to democracy is more vividly captured by PEPS than others.
Second, we confirmed our hypothesis that countries with high levels of participation would be more
likely to be democratic in the future and argued this pattern warrants including participation in a
contemporary measure. Finally, we demonstrated PEPS was a better predictor of the provision of
basic human needs and gender equality, characteristics theoretically associated with democracy. 49 These contrasts are even more dramatic and the generality of the effects increased when the analysis was conducted with the turnout measure that codes the absence of IDEA data as indicative of zero participation. 50 We cannot discount the possibility that reciprocal causation is at work in either the Human Development or Gender Development regressions, but a full econometric specification of the complex dynamics involving growth, distribution, and elements of the political system are beyond the bounds of this article.
Voting Counts: Participation in the Measurement of Democracy Page 31 of 36
Based on these results we can conclude the full effect of democracy on important social outcomes
cannot be appreciated until participation is directly incorporated into its measure.
Our disquiet about measuring democracy is not just about the face validity of concepts. It is
not merely aesthetics inducing our unease at labeling as perfectly democratic those polities
restricting the full exercise of citizenship. It is because the campaign for democratic change must
rely on accurate causal claims that we call on empirical researchers to employ a broader
measurement of democracy than previous studies. We also offer this caution to those who would
seek to build democratic systems in order to achieve the benefits associated with them: The breadth
of political participation must have at least as high a priority as institutional structure. Voting
counts!
Bibliography Adcock, Robert and David Collier (2000) “Connecting Ideas with Facts: The Validity of Measurement.” Annual Meeting of the American Political Science Association (Washington, DC, 2000).
Administration and Cost of Elections (ACE) Project (2003) http://www.aceproject.org/
Aristotle (1996) The Politics, Stephen Everson, ed. Cambridge: Cambridge University Press.
Bardhan, Kalpana and Stephan Klasen (1999) “UNDP’s gender-related indices: a Critical review,” World Development 27: 985-1010.
Barro, Robert (1996) "Democracy and Growth," Journal of Economic Growth 1: 1-27.
Bebbington, Anthony (1999), “Capitals and capabilities,” World Development, 27 (12): 2021-2044.
Bhagwati, Jagdish (1992) "Democracy and Development," Journal of Democracy 3,3: 37-44.
Blais, Andre and Agnieszka Dobrzynska (1998) “Turnout in electoral democracies,” European Journal of Political Research 33: 239-261.
Boix, Carles and Susan C. Stokes (2003) “Endogenous Democratization,” World Politics 55 (July): 517-549.
Bollen, Kenneth A. (1980) “Issues in the Comparative Measurement of Political Democracy” American Sociological Review, Volume 45, pp. 370-390
Bollen, Kenneth (1983) "World System Position, Dependency, and Democracy: The Cross-National Evidence," American Sociological Review 48: 468-479.
Bollen, Kenneth A. and Pamela Paxton (2000), “Subjective Measures of Liberal Democracy,” Comparative Political Studies 33, 1: 58-86.
Voting Counts: Participation in the Measurement of Democracy Page 32 of 36
Brown, David S. (2004), “Democracy and Gender Inequality in Education: A Cross-National Examination,” British Journal of Political Science 34: 137-152.
Brunetti, A. (1997) “Political variables in Cross-Country Growth Analysis,” Journal of Economic Surveys 11: 11163-190.
Burkhardt, Ross E. and Michael Lewis-Beck (1994) “Comparative Democracy: The Economic Development Thesis,” American Political Science Review 88: 903-910.
Chambers, Robert (1997), Whose reality counts? London: Intermediate Technology Publications.
Dahl, Robert A. (1971) Polyarchy: participation and opposition. New Haven: Yale University Press.
Diamond, Larry, Linz, J. Juan. And Lipset, Seymour Martin (eds) (1988-9) Democracy in Developing Countries, 3 vols, Boulder, Colorado: Lynne Rienner.
Dijkstra, A. Geske (2002) “Revisiting UNDP’s GDI and GEM: Towards an Alternative” Social Indicators Research 57: 301-338.
Dijkstra, A. Geske and Lucia Hammer (2000) “Measuring socio-economic gender equality: toward an alternative for UNDP’s GDI,” Feminist Economics 6: 41-75.
Dollar, David and Roberta Gotti (1999) “Gender Inequality, Income, and Growth: Are Good Times Good for Women?” World Bank Research Report.
Easterly, William (1997) “Life During Growth,” World Bank Research Report #428.
Eckstein, Harry & Gurr, Ted R. (1975) Patterns of Authority: A Structural Basis for Political Inquiry. New York: Wiley
Elkins, Zachary (2000) “Gradations of Democracy? Empirical Tests of Alternative Conceptualizations,” American Journal of Political Science 44, 2 (April): 293-300.
Filmer, Deon, Elizabeth M. King, and Lant Pritchett (1998) “Gender Disparity in South Asia: Comparisons between and within Countries,” World Bank Working Paper #1867
Finkel, Steven E. (1985) “Reciprocal effects of participation and political efficacy: a panel analysis,” American Journal of Political Science 29, 4 (November): 891-913.
Forsythe, Nancy, Roberto Patricio Korzeniewicz, and Valerie Durrant (2000) “Gender Inequalities and Economic Growth: A Longitudinal Evaluation,” Economic Development and Cultural Change 573-617.
Franklin, Mark N. (1996) “Electoral Participation,” in Lawrence LeDuc, Ricard Niemi, and Pippa Norris, eds. Comparing Democracies: Elections and Voting in Global Perspective. Thousand Oaks, California: Sage Publications, 216-235.
Freedom House (2000) “Annual Survey of Freedom Country Scores, 1972-73 to 1999-00,” http://freedomhouse.org/rationgs/index.htm.
Freedom House (2002) “Freedom in the World 1999-2000,” http://www.freedomhouse.org/ratings/index.htm
Freire, Pablo (1998), Pedagogy of Freedom Oxford : Rowman & Littlefield
Gastil Raymond D. “The Comparative Survey of Freedom: Experiences and Suggestions” Freedom House.
Voting Counts: Participation in the Measurement of Democracy Page 33 of 36
Gleditsch, Kristian S. and Michael D. Ward (1997) “Double Take: A reexamination of democracy and autocracy in modern politics,” Journal of Conflict Resolution 41, 3 (June): 361-383.
Gough, Ian (2000) Global Capital, Human Needs, and Social Policies New York: St. Martin’s Press.
Haas, Michael (1974) International Conflict New York: Bobbs-Merrill.
Hadenius, Axel and Jan Teorell (2005) “Cultural and Economic Prerequisites of Democracy: Reassessing Recent Evidence,” Studies in Comparative International Development 39, 4 (Winter): 87-106.
Hewitt, Christopher (1977) “The Effect of Political Democracy and Social Democracy on Equality in Industrial States,” American Sociological Review 42: 450-464.
Huber, Evelyn, Dietrich Rueschemeyer, and John Stephens (1993) “The impact of economic development on democracy”, Journal of Economic Perspectives 7, 3 (Summer): 71-87.
Huntington, Samuel (1987) Understanding Political Development Boston: Little, Brown.
Huntington, Samuel (1991) The Third Wave: Democratization in the Late Twentieth Century Norman: University of Oklahoma Press.
IDEA (2003) International Institute for Democracy and Electoral Assistance http://www.idea.int/vt/index.cfm
Jackman, Robert W. (1973) “On the Relation of Economic Development to Democratic Performance” American Journal of Political Science, Volume 17, 611-621
Jackman, Robert W. (1987) “Political Institutions and Voter Turnout in the Industrial Democracies,” American Political Science Review 81, 2 (June): 405-424.
Jaggers, Keith and Ted Robert Gurr (1995) “Tracking Democracy’s Third Wave with the Polity III Data” Journal of Peace Research, Volume 32, 469-482.
Jalan, Jyotsna and K. Subbarao (1994) “Gender Disparity in Human Resource Development: Cross Country Patterns,” Education and Social Policy Department, World Bank, ESP Discussion Paper Series no. 25. (April)
Key, V.O. (1949) Southern Politics in State and Nation (New York: Vintage Books)
Klasen, Stephan. (1999) Does Gender Inequality Reduce Growth and Development? Evidence from Cross-Country Regressions. Working paper no. 7. Washington, DC: The World Bank
Lake, David A. and Matthew A. Baum (2001) “The Invisible Hand of Democracy: Political Control and the Provision of Public Services,” Comparative Political Studies 34, 6 (August): 587-621.
Lijphart, Arend (1997) “Unequal Participation: Democracy’s Unresolved Dilemma,” American Political Science Association 91, 1 (March): 1-14.
Lindblom, Charles (1977) Politics and Markets: The World’s Political-Economic Systems New York: Basic Books.
Lipset, Seymour M. (1959) “Some social requisites of democracy” American Political Science Review 53: 69-105.
Lipset, Seymour M. (1994) “The Social Requisites of Democracy Revisited,” American Sociological Review, 59: 1-22.
Voting Counts: Participation in the Measurement of Democracy Page 34 of 36
Lipset, Seymour Martin, Kyoung-Ryung Seong, and John Charles Torres (1993) “A Comparative Analysis of the Social Requisites of Democracy,” International Social Science Journal 45, 2 (May): 155-176.
Maddison, Angus (2001) “The World Economy: A Millennial Perspective,” Development Centre of the Organisation for Economic Co-operation and Development (OECD) Paris.
Mahler, Vincent (2002) “Exploring the Subnational Dimension of Income Inequality: An Analysis of the Relationship Between Inequality and Electoral Turnout in the Developed Countries,” International Studies Quarterly 46: 117-142.
Mansfield, Edward D. and Rachel Bronson (1997) “Alliances, Preferential Trading Arrangements, and International Trade,” American Political Science Review 91 (March): 94-107.
Mansfield, Edward D., Helen V. Milner, and B. Peter Rosendorff (1998) “Why Democracies Cooperate More: Electoral Control and International Trade Agreements” Paper presented to the annual meeting of the American Political Science Association, Boston.
Mansfield, Edward D., Helen V. Milner, and B. Peter Rosendorff (2000) “Free to Trade: Democracies, Autocracies, and International Trade,” American Political Science Review 94, 2 (June): 305-321.
Maoz, Zeev and Bruce Russett (1993) "Normative and Structural Causes of Democratic Peace, 1946-1986," American Political Science Review 87: 624-638.
Marshall, Monty G., Ted Robert Gurr, Christian Davenport, and Keith Jaggers (2002) “Polity IV, 1800-1999: Comments on Munck and Verkuilen,” Comparative Political Studies 35, 1 (February): 40-45.
Marshall, Monty G. and Keith Jaggers (2001) Polity IV Project: Political Regime Characteristics and Transitions, 1800-1999, Dataset Users Manual http://www.bos.umd.edu/cidcm/polity/
Marshall, Susan E. (1985) “Development, Dependence, and Gender Inequality in the Third World,” International Studies Quarterly 29: 217-240.
Mayhew, David R. (1974) Congress New Haven: Yale University Press.
Miller, Carol D. (1999) “How Did Economic Development and Trade Affect Women’s Share of the Labor Force in the 1980s?,” Journal of World-Systems Research 5, 3 (Fall): 363-374.
Mitchell, Neil J. and James M. McCormick (1988) “Economic and Political Explanations of Human Rights Violations,” World Politics 40.
McDonald, Michael P. and Samuel L. Popkin (2001) “The Myth of the Vanishing Voter,” American Political Science Review 95, 4 (December): 963-974.
Moon, Bruce E. (1991) The Political Economy of Basic Human Needs. Ithaca: Cornell University Press.
Moon, Bruce E. and William J. Dixon (1985) “Politics, the State, and Basic Human Needs: A Cross-National Study,” American Journal of Political Science 29: 661-694.
Munck, Gerardo L. and Jay Verkuilen (2002a) “Conceptualizing and Measuring Democracy: Evaluating Alternative Indices,” Comparative Political Studies 35, 1 (February): 3-34.
Munck, Gerardo L. and Jay Verkuilen (2002b) “Generating Better Data: A Response to Discussants,” Comparative Political Studies 35, 1 (February): 52-57.
Voting Counts: Participation in the Measurement of Democracy Page 35 of 36
Neubauer, D. E. (1967) “Some conditions of democracy” The American Political Science Review 61 (4): 1002-1009.
Nussbaum, Martha. (2000) Women and Human Development: the capabilities approach. Cambridge: Cambridge University Press.
O’Neal, John R. and Bruce M. Russett (1997) “The Classical Liberals were Right: Democracy, Interdependence, and Conflict, 1950-1985,” International Studies Quarterly 41 (June): 267-293.
Osmani, Siddiq and Amartya Sen. (2003) “The hidden penalties of gender inequality: fetal origins of ill-health” Economics and Human Biology vol 1 105-121
Palmer, R. and J. Colton (1992), A History of the Modern World, New York: McGraw-Hill, Inc.
Pampel, Fred C. and Kazuko Tanaka (1986) “Economic Development and Female Labor Force Participation: A Reconsideration,” Social Forces 64, 3: 599-619.
Parry, Moyser and Day (1992) Political Participation and Democracy in Britain, Cambridge UP: Cambridge.
Paxton, Pamela (1997) “Women in National Legislatures: A Cross-National Analysis,” Social Science Research 26: 442-464.
Paxton, Pamela (2000) “Women’s Suffrage in the Measurement of Democracy: Problems of Operationalization” Studies in Comparative International Development Fall 2000 35 (3): 92-111
Paxton, Pamela, Kenneth A. Bollen, Deborah M Lee and HyoJoung Kim (2003) “Research Forum - A Half-Century of Suffrage: New Data and a Comparative Analysis,” Studies in comparative international development. 38, 1: 93.
Perez-Linan, Anibal (2002) “Neoinstitutional Accounts of Voter Turnout: Moving Beyond Industrial Democracies,” Electoral Studies 20: 281-297.
Pieterse, Jan Nederveen (2002) “Participatory Democratization Reconceived,” Futures 33: 407-422.
Pintor, Rafael Lopez and Maria Gratschew (2002) Voter Turnout Since 1945: A Global Report International Institute for Democracy and Electoral Assistance.
Poe, Steven C. and C. Neal Tate (1994) “Repression of Human Rights to Personal Integrity in the 1980s: A Global Analysis,” American Political Science Review 88: 853-72.
Powell, G. Bingham Jr. (1986) “American Voter Turnout in Comparative Perspective,” American Political Science Review 80, 1 (March): 17-43.
Putnam, Robert D. (1993) Making Democracy Work: Civic Traditions in Modern Italy Princeton: Princeton University Press.
Przeworski, Adam and Fernando Limongi (1997) “Modernization: Theories and Facts,” World Politics 49: 155-183.
Przeworski, Adam, Michael E. Alvarez, Jose Antonio Cheibub, and Fernando Limongi (2000) Democracy and Development: Political institutions and well-being in the world, 1950–1990 Cambridge University Press.
Rosenstone, Steven J. and John Mark Hansen (1993) Mobilization, Participation, and Democracy in America (New York: Macmillan)
Rostow, Walter W. (1971) The Stages of Economic Growth: a Non-communist Manifesto 2nd ed. Cambridge University Press.

Voting Counts: Participation in the Measurement of Democracy Page 36 of 36
Sartori, Giovanni (1987) The Theory of Democracy Revisited. Chatham, NJ: Chatham House.
Schumpeter, Joseph A. (1950) Capitalism, Socialism, and Democracy. New York: Harper & Row.
Scoones, Ian (1998) “Sustainable rural livelihoods: a framework for analysis,” Working Paper 72, Institute for Development Studies, Brighton, UK.
Sen, Amartya. (1999) Development as Freedom. New York: Anchor Books.
Sirowy, Larry and Alex Inkeles (1980) "The Effects of Democracy on Economic Growth and Inequality: A Review," Studies in Comparative International Development 25: 126-157.
Starr, Harvey (1991) “Democratic Dominoes: Diffusion Approaches to the Spread of Democracy in the International System,” Journal of Conflict Resolution 35, 2: 356-381.
Starr, Harvey (1999) “Democratic Dominoes Revisited: Democratic Diffusion, 1974-1996,” Paper presented to the Annual Meetings of the International Studies Association, Washington DC.
United Nations Development Program (1995) Human Development Report 1995 (New York: Oxford).
United Nations Development Program (2000) Human Development Report 2000 (New York: Oxford).
Vanhanen, Tatu (1990) The Process of Democratization: A Comparative Study of 147 States, 1980-88. New York: Taylor & Francis.
Vanhanen, Tatu (2000), “A New Dataset for Measuring Democracy, 1810-1998,” Journal of Peace Research 37, 2: 251-265.
Williamson, John B. and Ulrike Boehmer (1997) “Female Life Expectancy, Gender Stratification, Health Status, and Level of Economic Development: A Cross-National Study of Less Developed Countries,” Social Science Medicine 45, 2: 305-317.
Young, Iris (1999), Inclusion and Democracy, Oxford: Oxford University Press.
Zakaria, Fareed (1997) “The Rise of Illiberal Democracy,” Foreign Affairs 76, 6 (Nov/Dec): 22-43.