Embed Size (px)
Citation preview
Voting and ElectionsVoting and Electionsng and nng and nI. Voting
A. Types of ParticipationB. Turnout Trends B. Turnout Trends C. Who Votes?
II El ti II. Elections A. The Election ProcessB. Money and ElectionsC. Variations in Federal ElectionsC. Variations in Federal ElectionsD. How Voters Decide
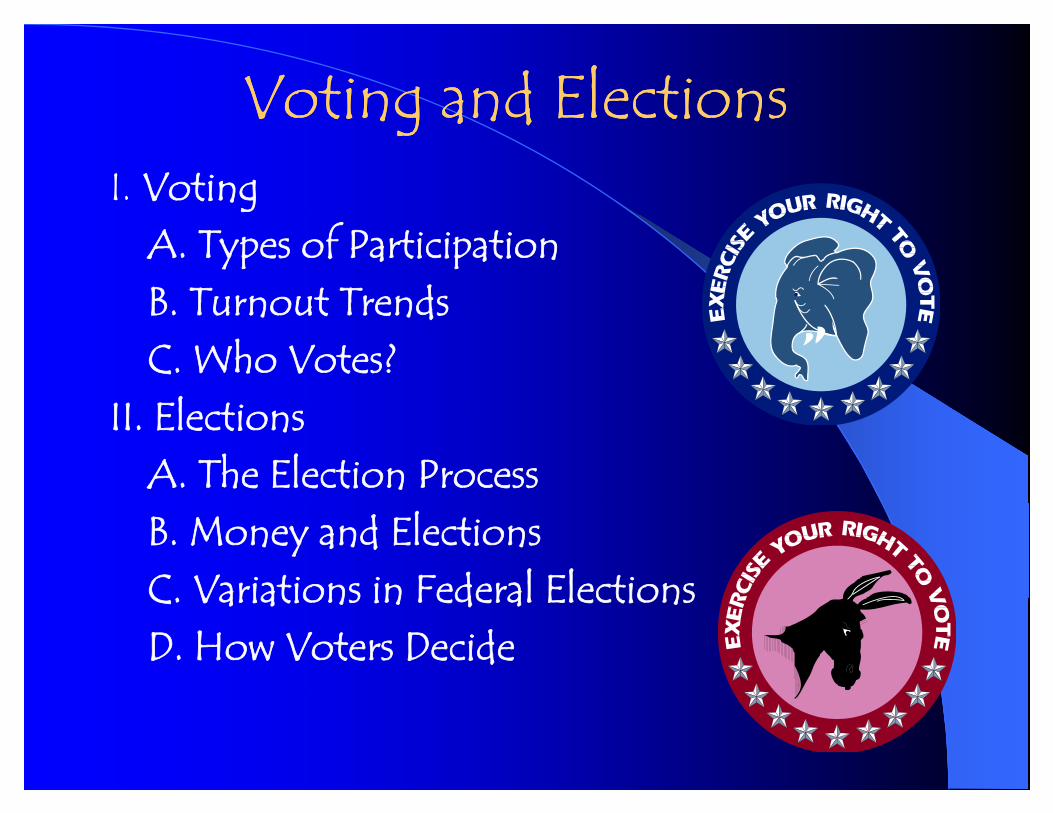
VotingVotingHistorical Expansion of the FranchiseVoting for Multiple Offices at Voting for Multiple Offices at Different LevelsVoting beyond Elections for Office
Referenda– Referenda– Initiatives– Recall
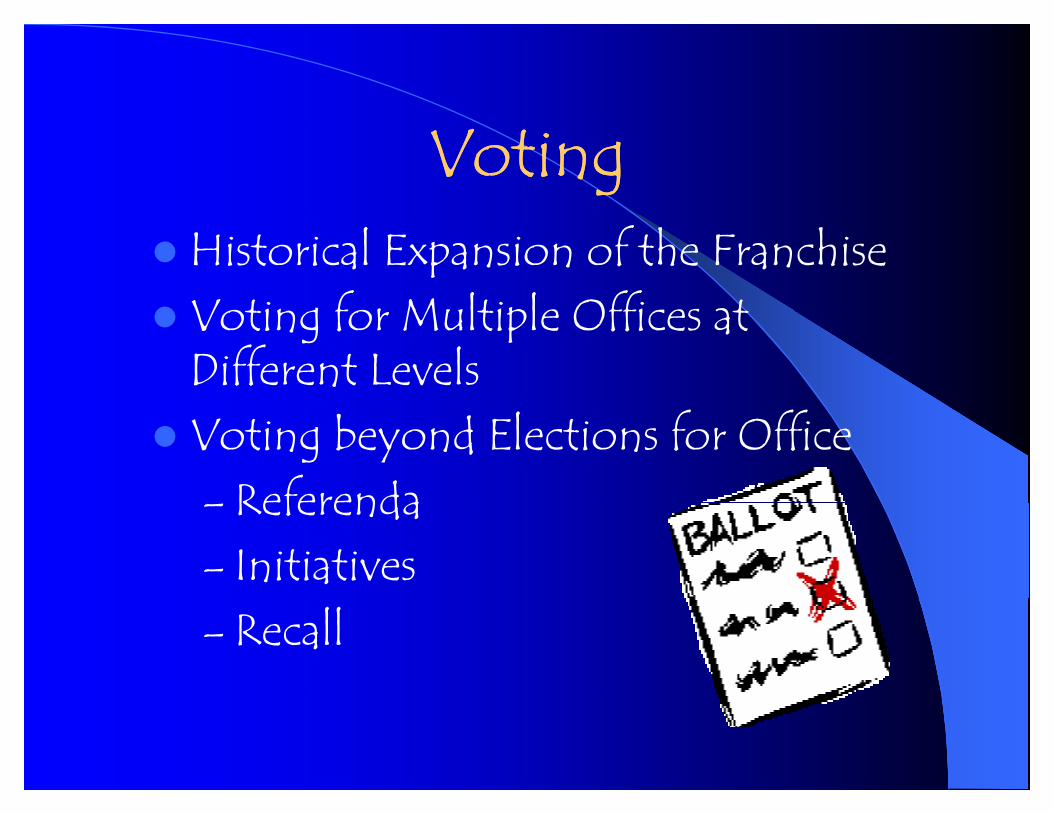
NONNON VOTING VOTING NONNON--VOTING VOTING PARTICIPATIONPARTICIPATION
Conventional: PetitionsLetters to representativesLetters to representativesCampaign Activity (Canvassing; Money)Regular ProtestRegular Protest
Unconventional: Disruptive Protest March (Seattle, Genoa)O i /Bl ki A tOccupying/Blocking Access to
Buildings (Abortion Clinics)Vandalism (Greenpeace)Vandalism (Greenpeace)Political Violence (Oklahoma City, 9-11)
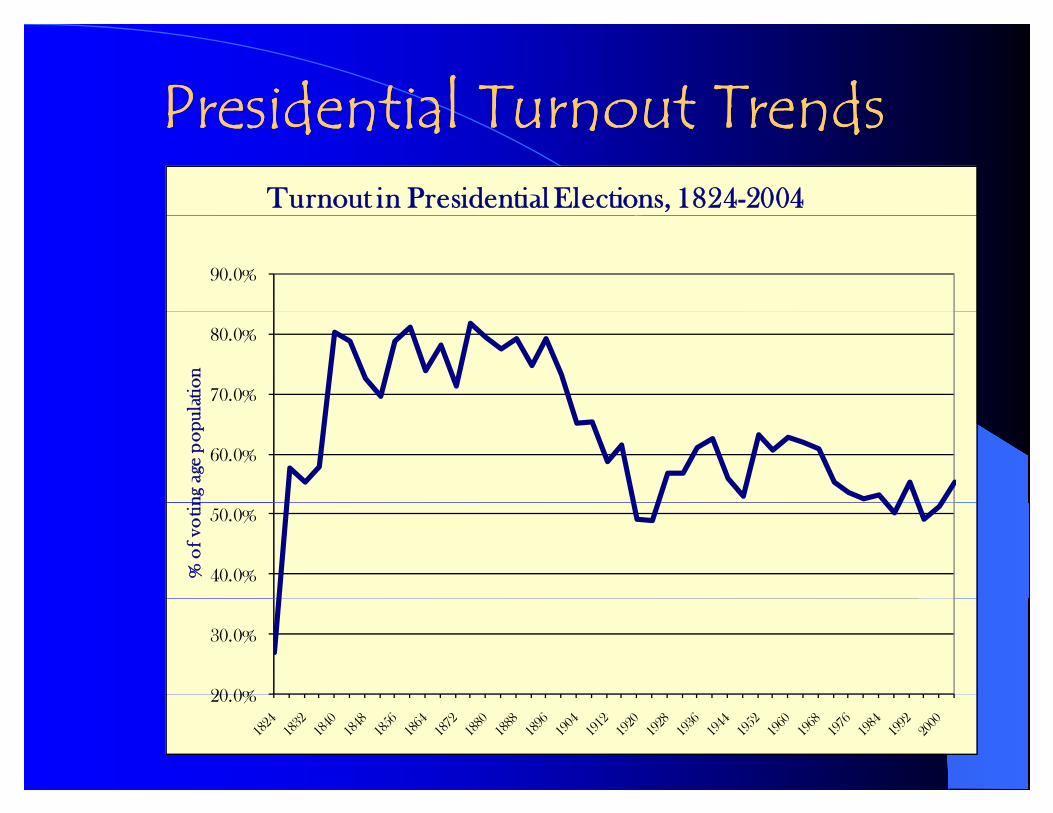
Presidential Turnout TrendsPresidential Turnout TrendsPresidential Turnout TrendsPresidential Turnout TrendsTurnout in Presidential Elections, 1824-2004
90.0%
70.0%
80.0%
latio
n
60.0%
ng a
ge p
opul
40.0%
50.0%
% o
f vo
tin
20 0%
30.0%
20.0%
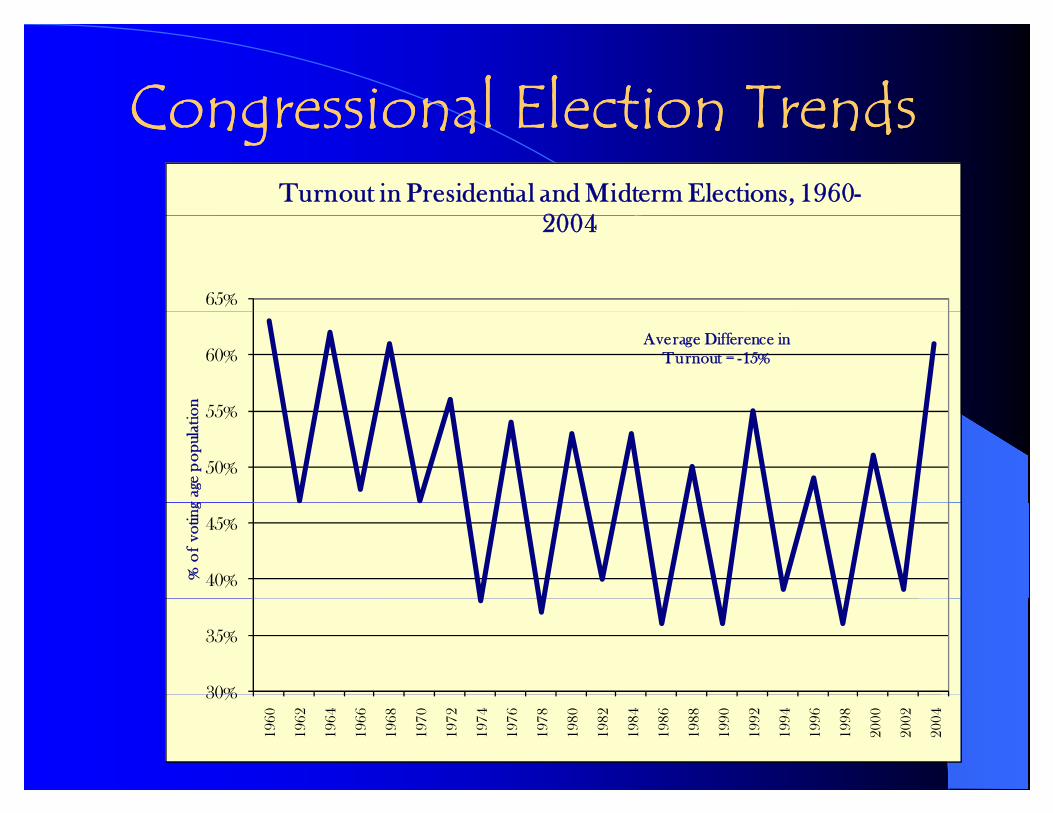
Congressional Election TrendsCongressional Election TrendsCongressional Election TrendsCongressional Election TrendsTurnout in Presidential and Midterm Elections, 1960-
2004
65%
2004
Average Difference in Turnout = -15%
55%
60%
n
50%
55%
g ag
e p
opul
atio
n
40%
45%
% o
f vo
ting
30%
35%
30%
1960
1962
1964
1966
1968
1970
1972
1974
1976
1978
1980
1982
1984
1986
1988
1990
1992
1994
1996
1998
2000
2002
2004
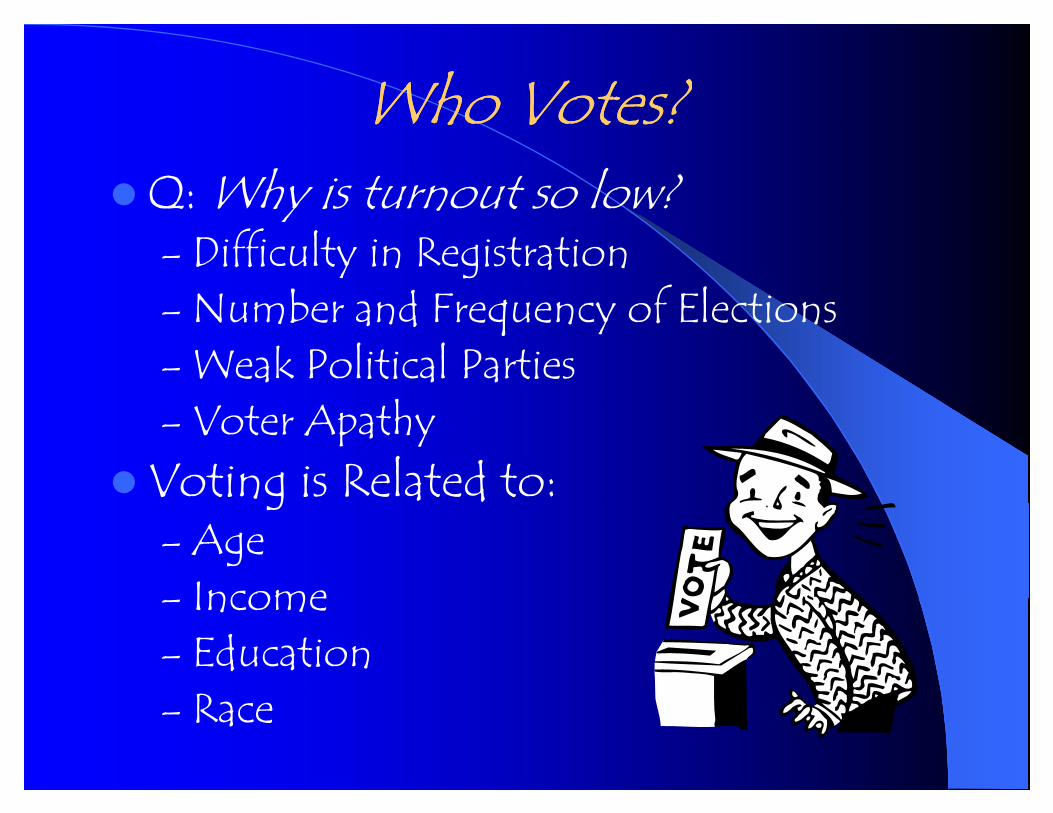
Who Votes?Who Votes?Who Votes?Who Votes?Q: Why is turnout so low?y– Difficulty in Registration
Number and Frequency of Elections– Number and Frequency of Elections– Weak Political Parties
V t A th– Voter ApathyVoting is Related to: g– Age
Income– Income– Education
R– Race
Q: Does it MATTER if lots of Q: Does it MATTER if lots of Q: Does it MATTER if lots of Q: Does it MATTER if lots of people do not vote?people do not vote?p p dp p d
YES: Legitimacy of Systeml lPotential Policy Bias
Functional DisenfranchisementNO: Opportunity for All
Most Informed/Interested are Most Informed/Interested are Participating
Non-voting and ContentmentParticipation and Discontentp
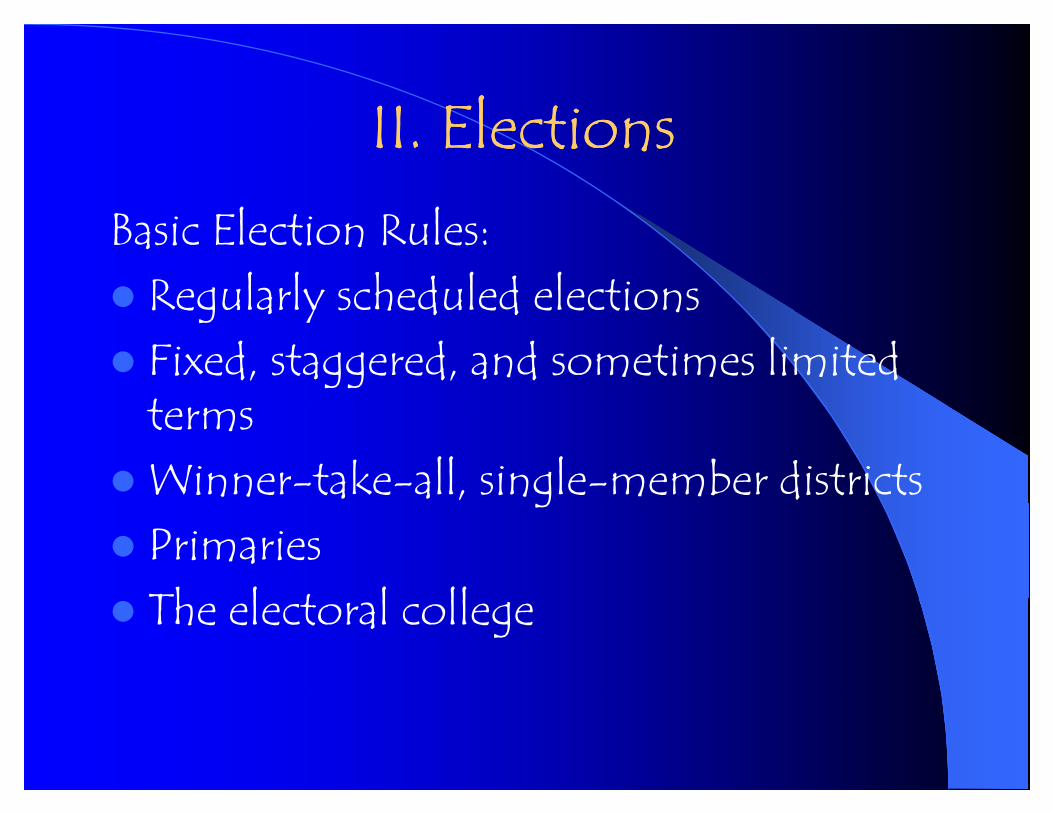
II Electi nsII Electi nsII. ElectionsII. ElectionsB El t R l Basic Election Rules:
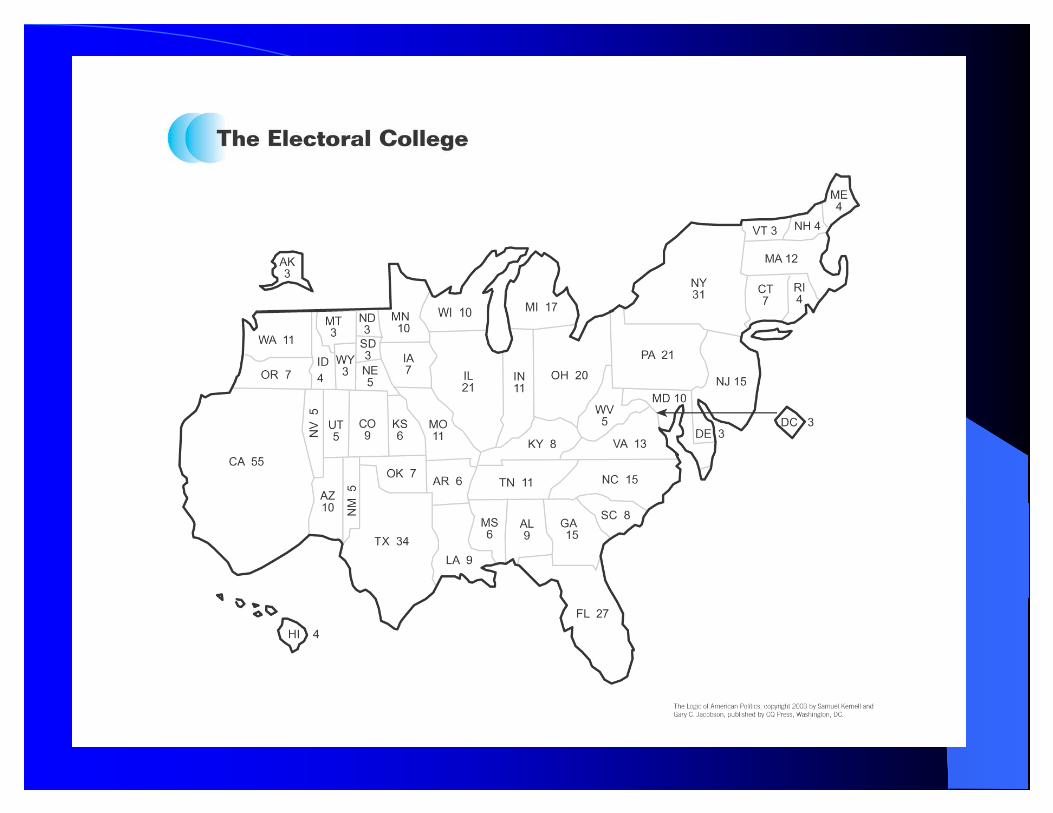
Regularly scheduled electionsg a y d d nFixed, staggered, and sometimes limited ttermsWinner-take-all, single-member districtsgPrimaries Th l t l llThe electoral college
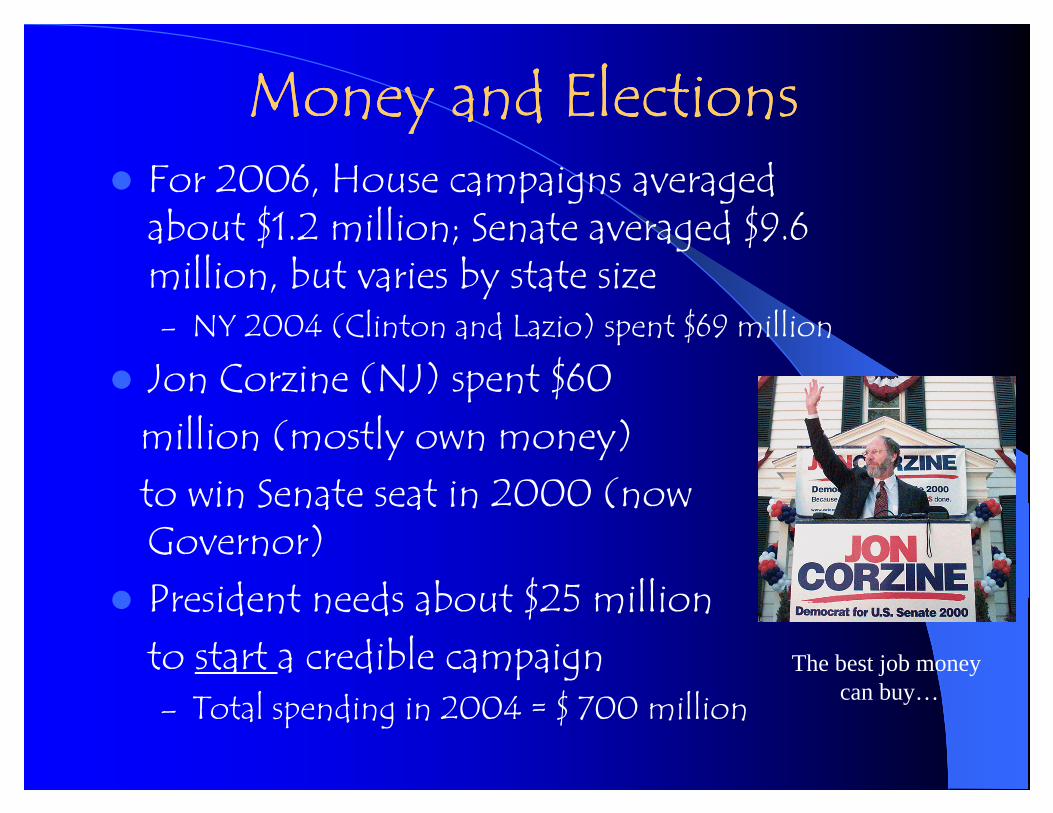
Money and ElectionsMoney and Electionsy a dy a dFor 2006, House campaigns averaged b t $1 2 illi S t d $9 6 about $1.2 million; Senate averaged $9.6
million, but varies by state size l $ ll– NY 2004 (Clinton and Lazio) spent $69 million
Jon Corzine (NJ) spent $60 million (mostly own money) to win Senate seat in 2000 (now to win Senate seat in 2000 (now Governor)President needs about $25 million President needs about $25 million to start a credible campaign
l d $ llThe best job money
can buy– Total spending in 2004 = $ 700 million can buy…
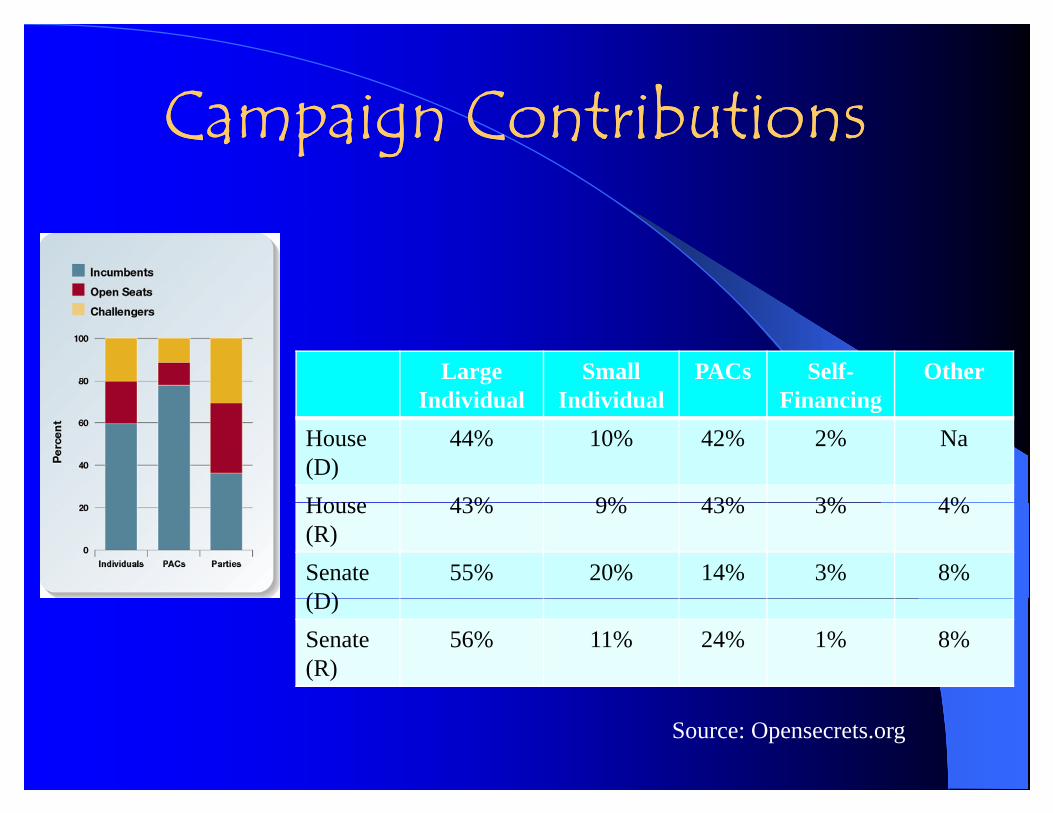
Campaign ContributionsCampaign ContributionsCampaign ContributionsCampaign Contributions
Large Individual
Small Individual
PACs Self-Financing
OtherIndividual Individual Financing
House (D)
44% 10% 42% 2% Na
House 43% 9% 43% 3% 4%House (R)
43% 9% 43% 3% 4%
Senate(D)
55% 20% 14% 3% 8%(D)Senate (R)
56% 11% 24% 1% 8%
Source: Opensecrets.org
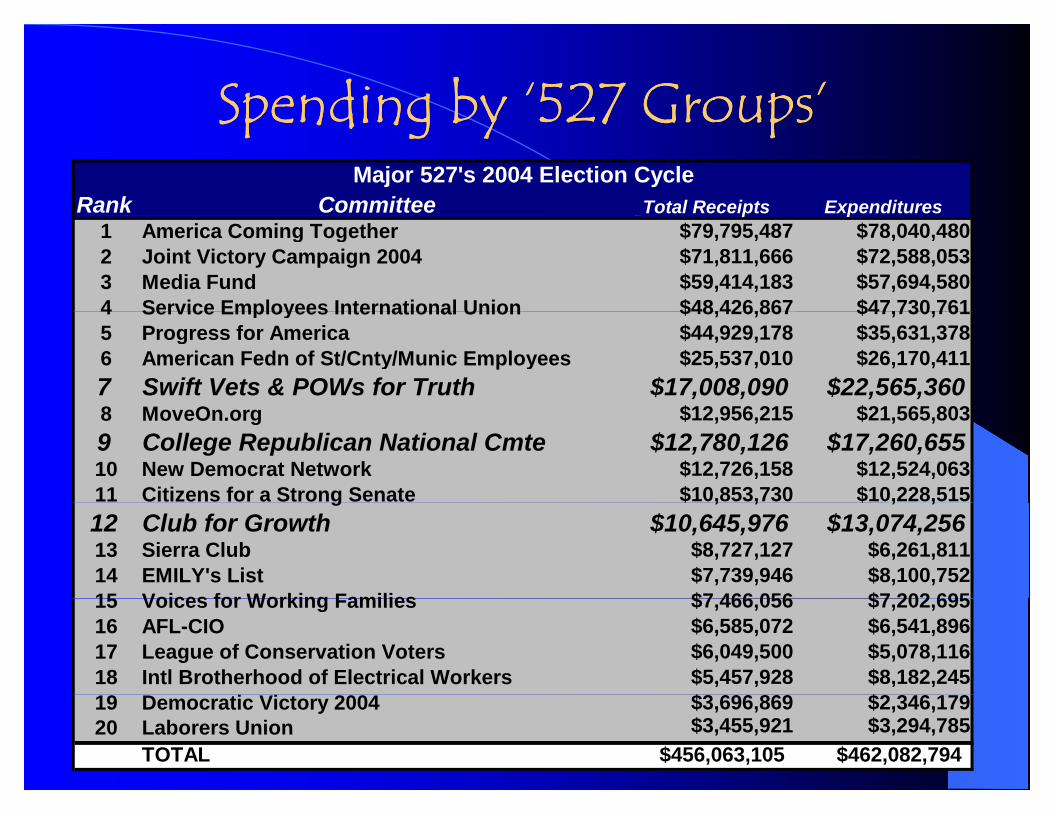
Spending by ‘527 Groups’Spending by ‘527 Groups’Spending by 527 GroupsSpending by 527 GroupsMajor 527's 2004 Election Cycle
Rank Committee Total Receipts Expendituresp p1 America Coming Together $79,795,487 $78,040,480 2 Joint Victory Campaign 2004 $71,811,666 $72,588,053 3 Media Fund $59,414,183 $57,694,580 4 Service Employees International Union $48 426 867 $47 730 7614 Service Employees International Union $48,426,867 $47,730,761 5 Progress for America $44,929,178 $35,631,378 6 American Fedn of St/Cnty/Munic Employees $25,537,010 $26,170,411 7 Swift Vets & POWs for Truth $17,008,090 $22,565,360 8 M O $12 956 215 $21 565 8038 MoveOn.org $12,956,215 $21,565,803 9 College Republican National Cmte $12,780,126 $17,260,655 10 New Democrat Network $12,726,158 $12,524,063 11 Citizens for a Strong Senate $10,853,730 $10,228,515 g $ , , $ , ,12 Club for Growth $10,645,976 $13,074,256 13 Sierra Club $8,727,127 $6,261,811 14 EMILY's List $7,739,946 $8,100,752 15 Voices for Working Families $7 466 056 $7 202 69515 Voices for Working Families $7,466,056 $7,202,695 16 AFL-CIO $6,585,072 $6,541,896 17 League of Conservation Voters $6,049,500 $5,078,116 18 Intl Brotherhood of Electrical Workers $5,457,928 $8,182,245
$ $19 Democratic Victory 2004 $3,696,869 $2,346,179 20 Laborers Union $3,455,921 $3,294,785
TOTAL $456,063,105 $462,082,794
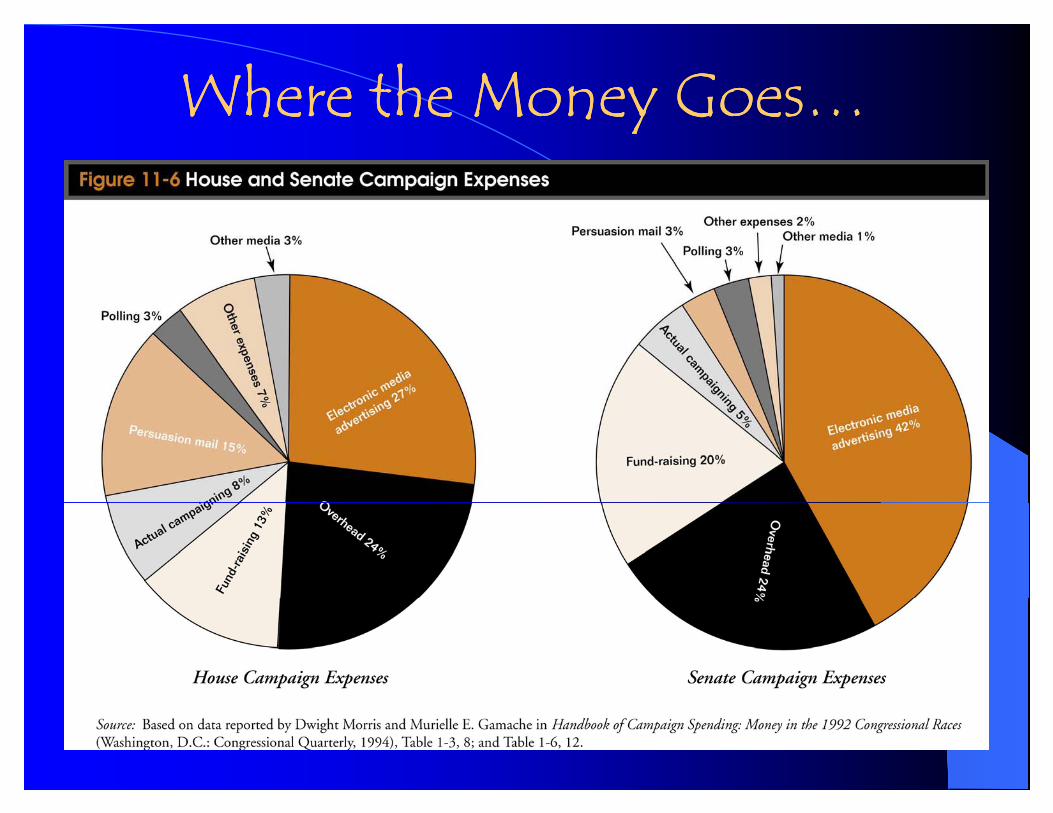
Where the Money Goes…Where the Money Goes…yy
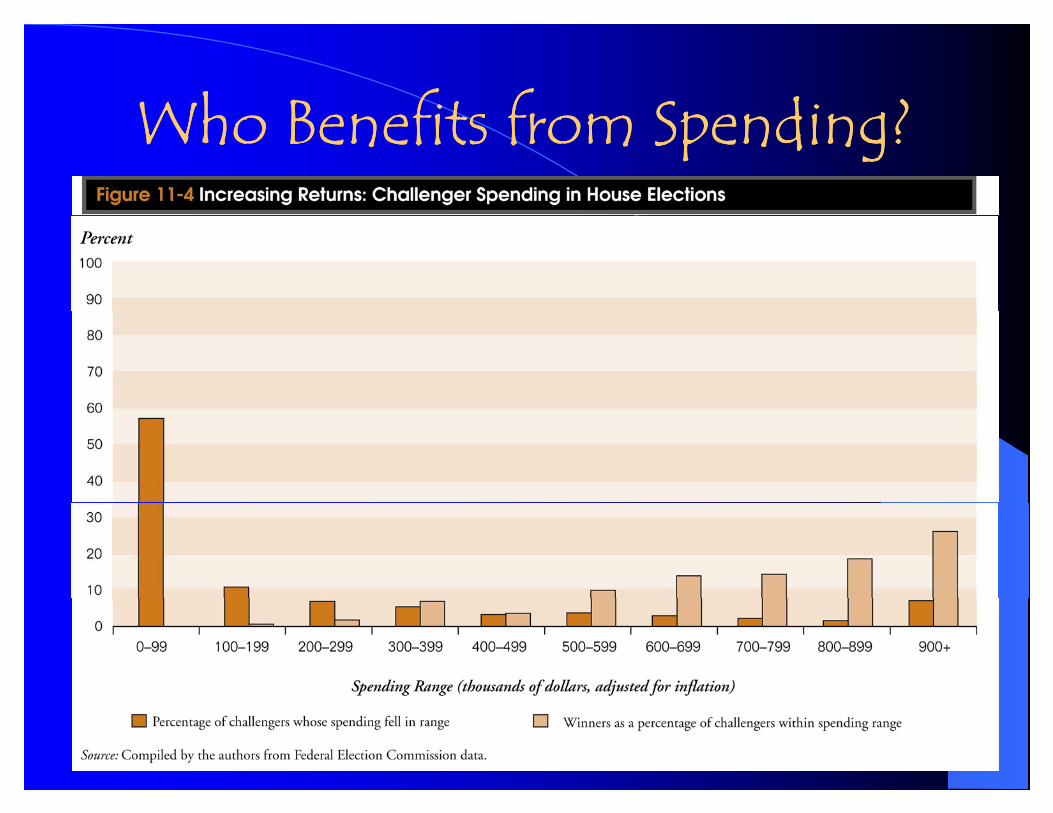
Who Benefits from Spending?Who Benefits from Spending?Who Benefits from Spending?Who Benefits from Spending?
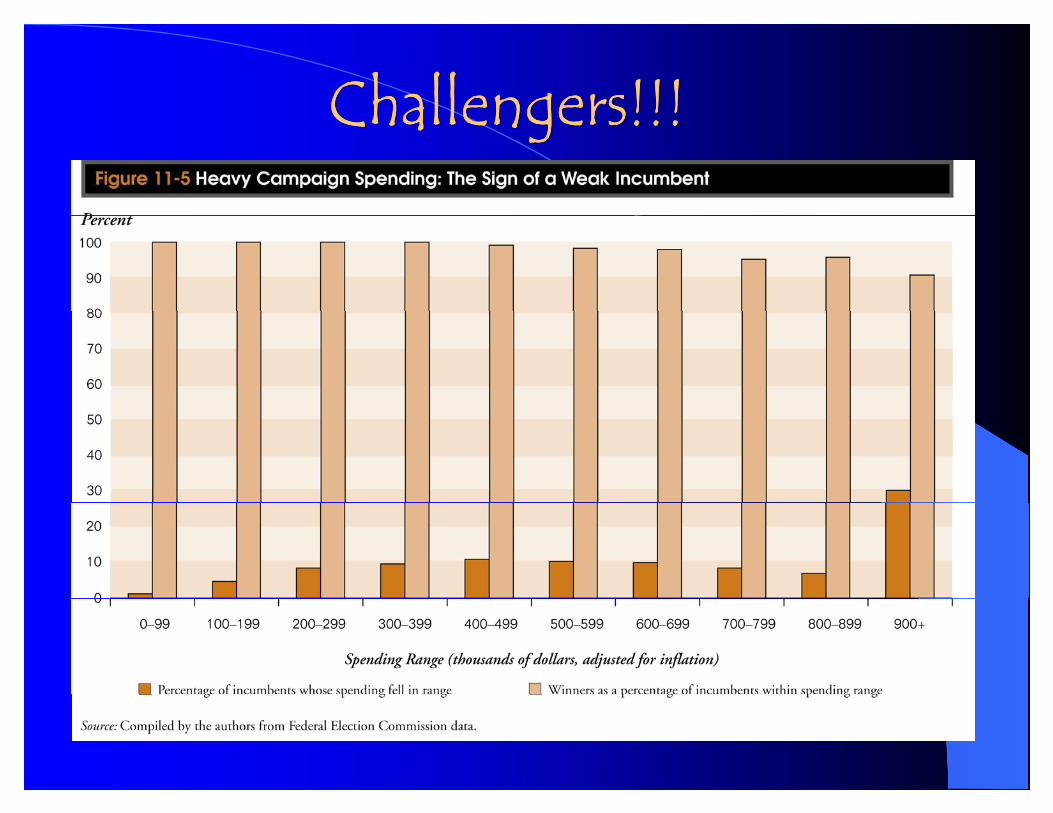
Challengers!!!Challengers!!!Challengers!!!Challengers!!!
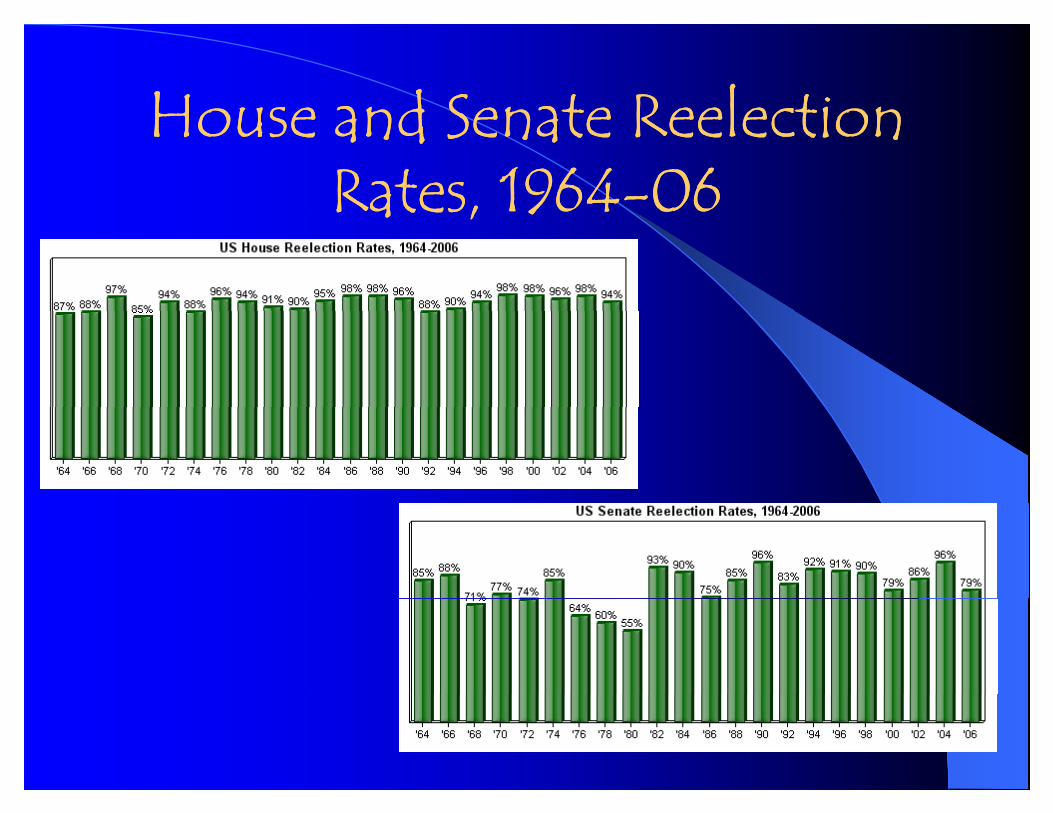
House and Senate Reelection House and Senate Reelection House and Senate Reelection House and Senate Reelection Rates, 1964Rates, 1964--0606a ,a ,
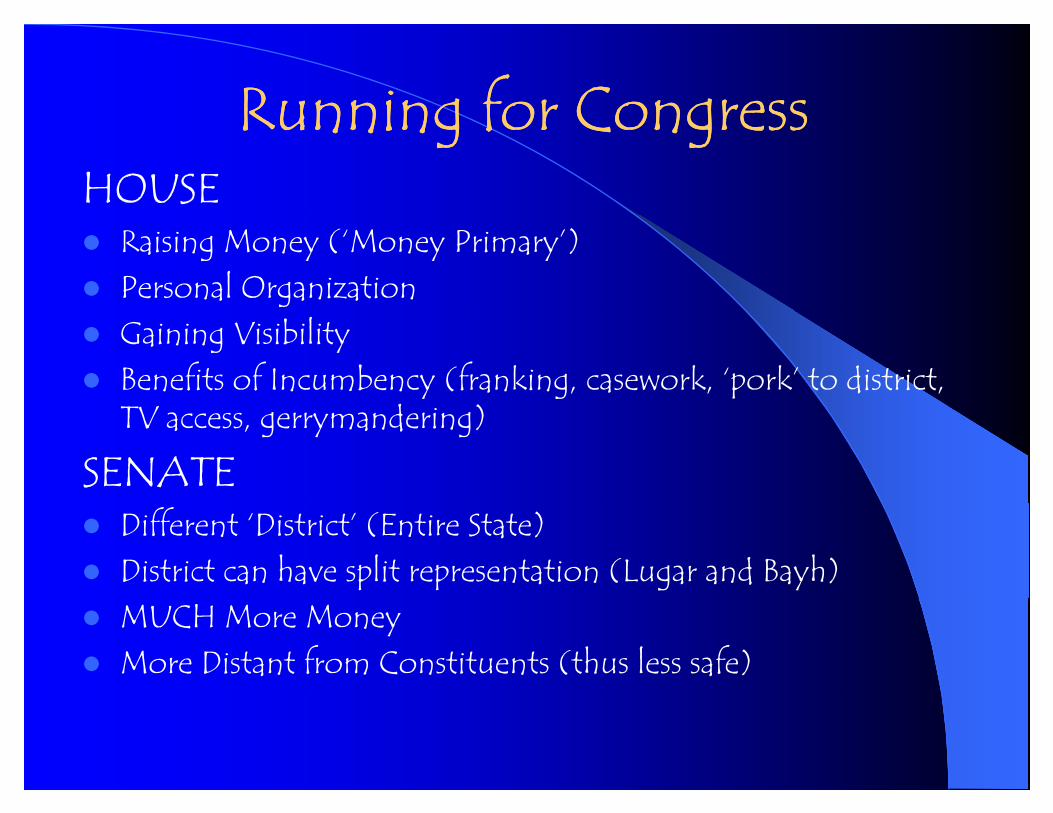
Running for CongressRunning for CongressRunning for CongressRunning for CongressHOUSE
Raising Money (‘Money Primary’)Personal OrganizationGaining VisibilityBenefits of Incumbency (franking, casework, ‘pork’ to district, TV d )TV access, gerrymandering)
SENATEDifferent ‘District’ (Entire State)District can have split representation (Lugar and Bayh)MUCH More MoneyMore Distant from Constituents (thus less safe)
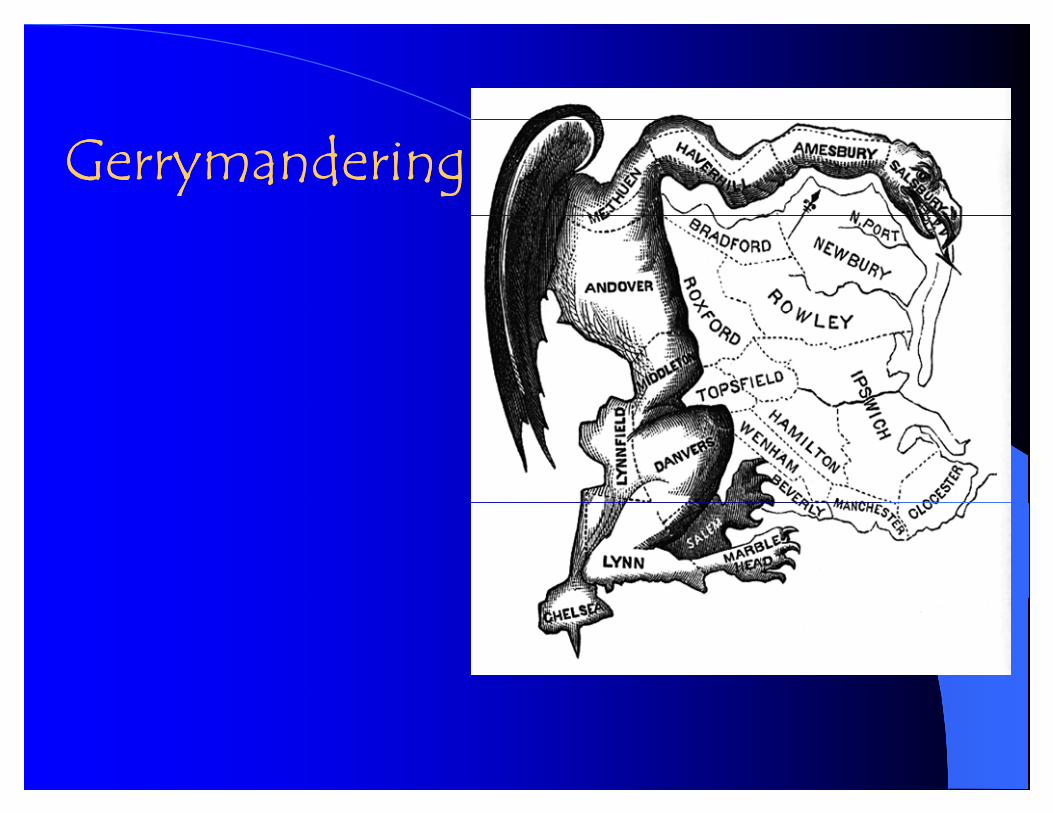
GerrymanderingGerrymandering
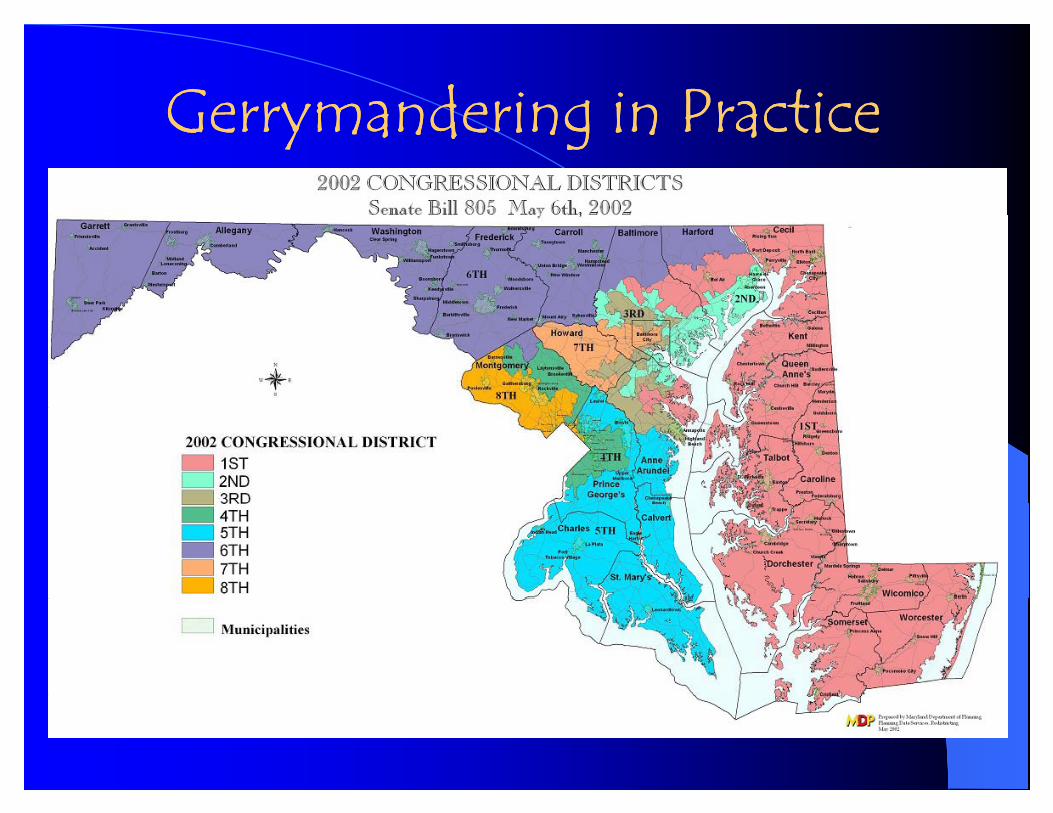
Gerrymandering in PracticeGerrymandering in PracticeGerrymandering in PracticeGerrymandering in Practice
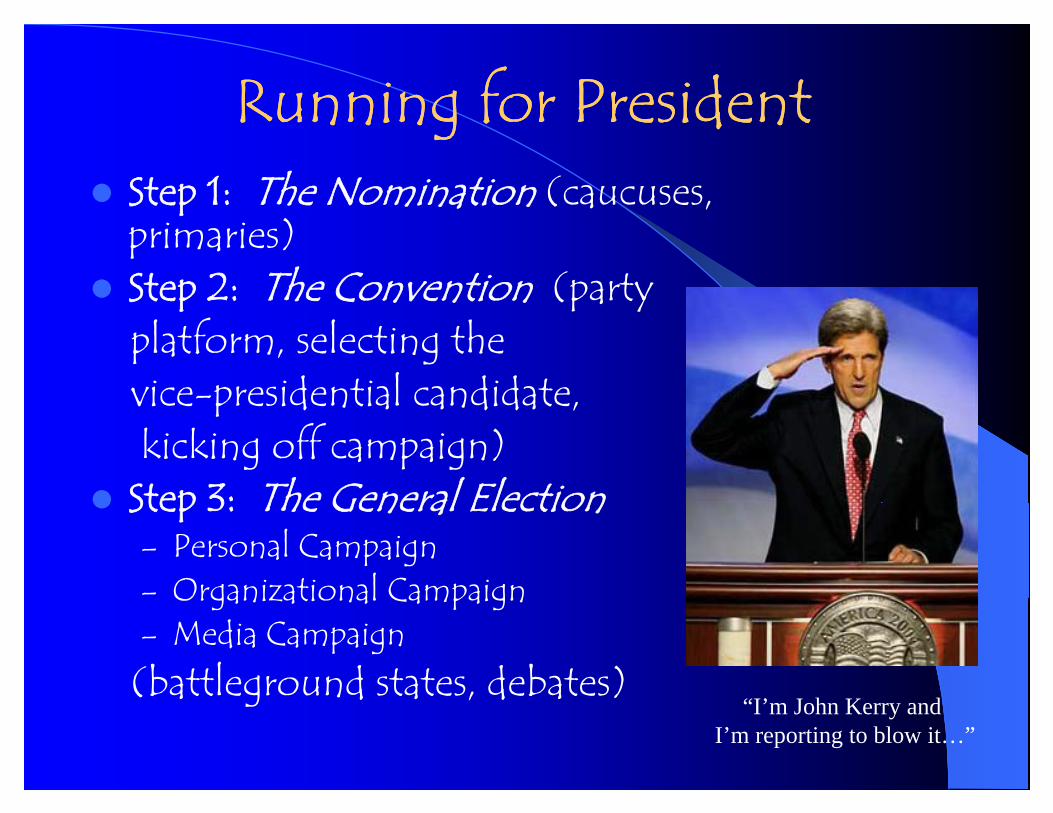
Running for PresidentRunning for PresidentRunning for PresidentRunning for PresidentStep 1: The Nomination (caucuses, pprimaries)Step 2: The Convention (party p p yplatform, selecting the vice-presidential candidate, p d n a and da ,kicking off campaign)
Step 3: The General ElectionStep 3: The General Election– Personal Campaign– Organizational CampaignOrganizational Campaign– Media Campaign(battleground states, debates)(battleground states, debates)
“I’m John Kerry and I’m reporting to blow it…”
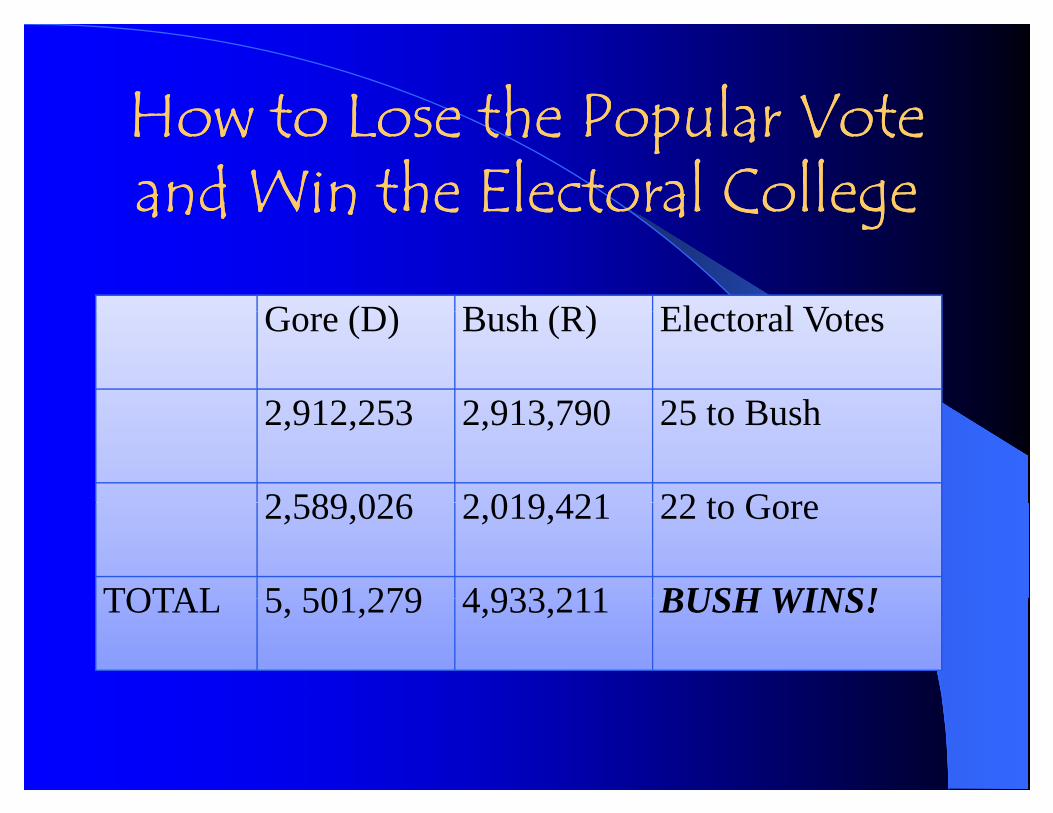
How to Lose the Popular Vote How to Lose the Popular Vote How to Lose the Popular Vote How to Lose the Popular Vote and Win the Electoral Collegeand Win the Electoral Collegea d a ga d a g
G (D) B h (R) El t l V tGore (D) Bush (R) Electoral Votes
2 912 253 2 913 790 25 t B h2,912,253 2,913,790 25 to Bush
2 589 026 2 019 421 22 to Gore2,589,026 2,019,421 22 to Gore
TOTAL 5 501 279 4 933 211 BUSH WINS!TOTAL 5, 501,279 4,933,211 BUSH WINS!
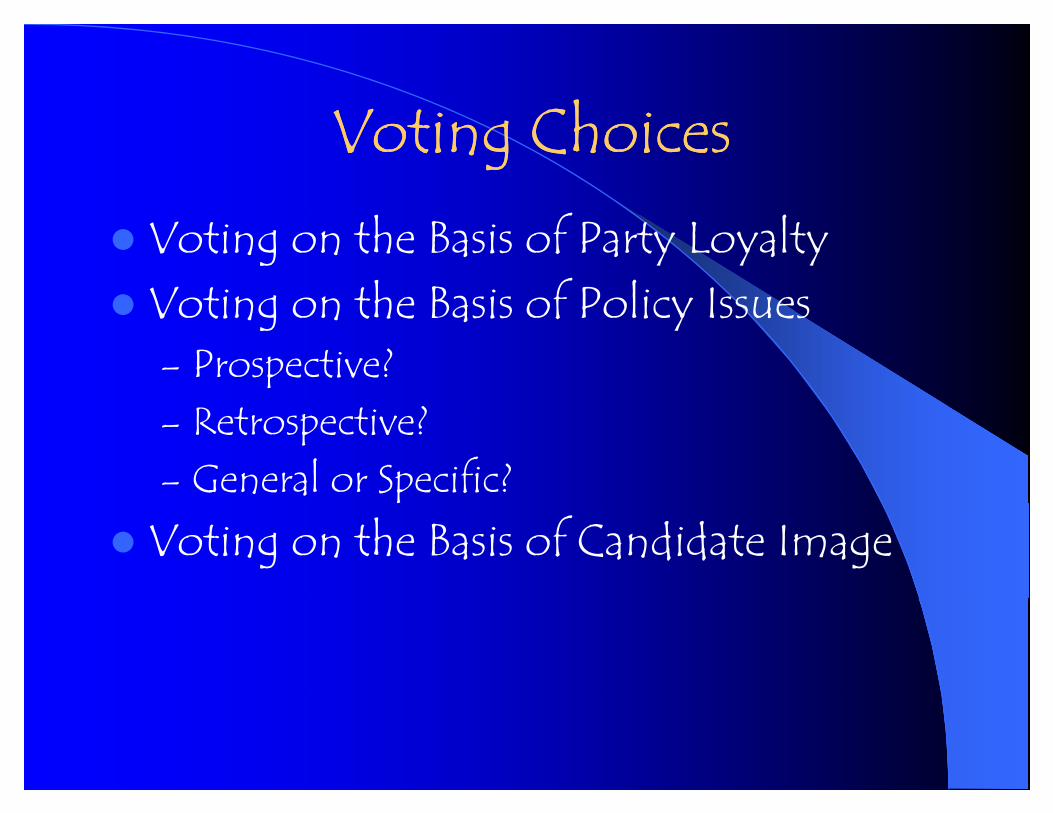
V ti Ch iV ti Ch iVoting ChoicesVoting Choicesh f lVoting on the Basis of Party Loyalty
Voting on the Basis of Policy IssuesVoting on the Basis of Policy Issues– Prospective?
?– Retrospective?– General or Specific?p
Voting on the Basis of Candidate Image
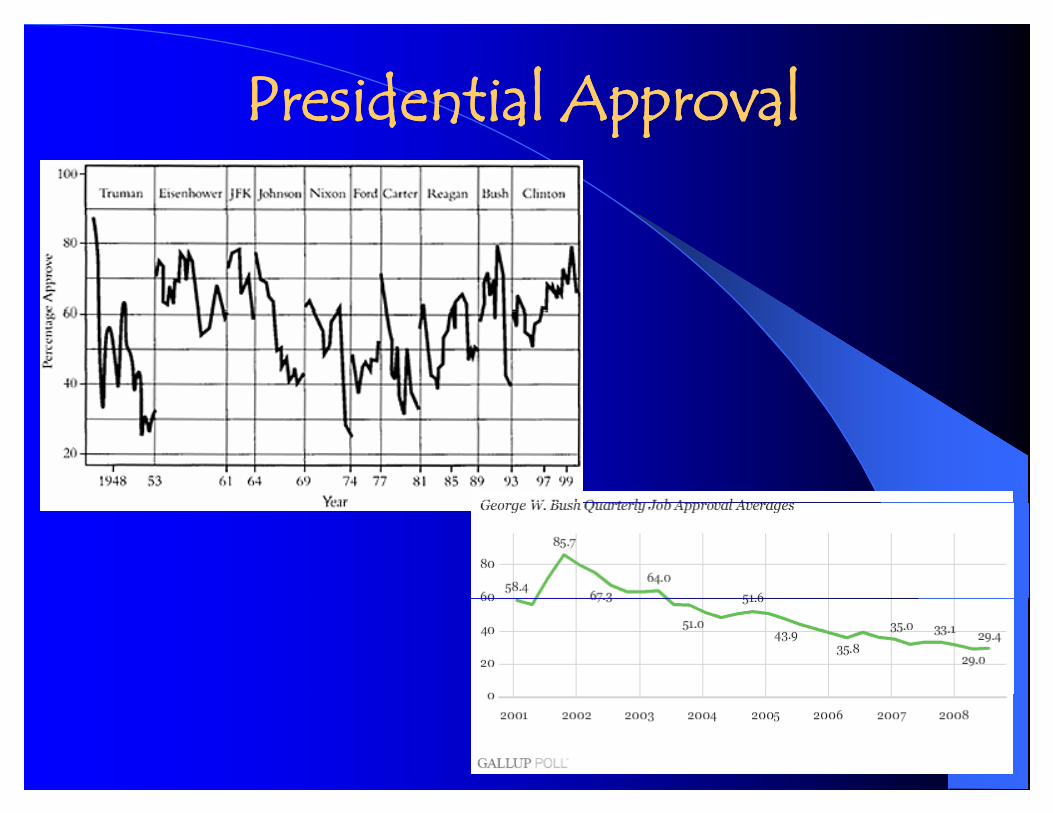
Presidential Approval Presidential Approval Presidential Approval Presidential Approval