Embed Size (px)
DESCRIPTION
Voters with Disabilities and the 2014 Elections November 10, 2014. Methodology and Overview. This presentation is based on a survey conducted by Greenberg Quinlan Rosner for Democracy Corps and Respectability. - PowerPoint PPT Presentation
Citation preview
Voters with Disabilities and the 2014 Elections
November 10, 2014
2
Methodology and Overview
This presentation is based on a survey conducted by Greenberg Quinlan Rosner for Democracy Corps and Respectability.
The survey included 1030 2014 voters nationwide was conducted from November 3-5, 2012.
Results among are weighted to reflect election results and Exit Poll demographic results publicly posted by Edison Research. Overall results are weighted to the demographic characteristics of the likely 2016 electorate.
Unless otherwise noted, margin of error= +/-3.10 percentage points at 95% confidence.
50 percent of respondents were reached by cell phone, in order to account for ever-changing demographics and trying to accurately sample the full American electorate.
November 15, 2011Four in Ten 2014 Voters Part of Disability Community
3
23
5
1059
2
Family memberClose friendMyselfNoDon't know
Do you, a family member, or a close friend have a disability?
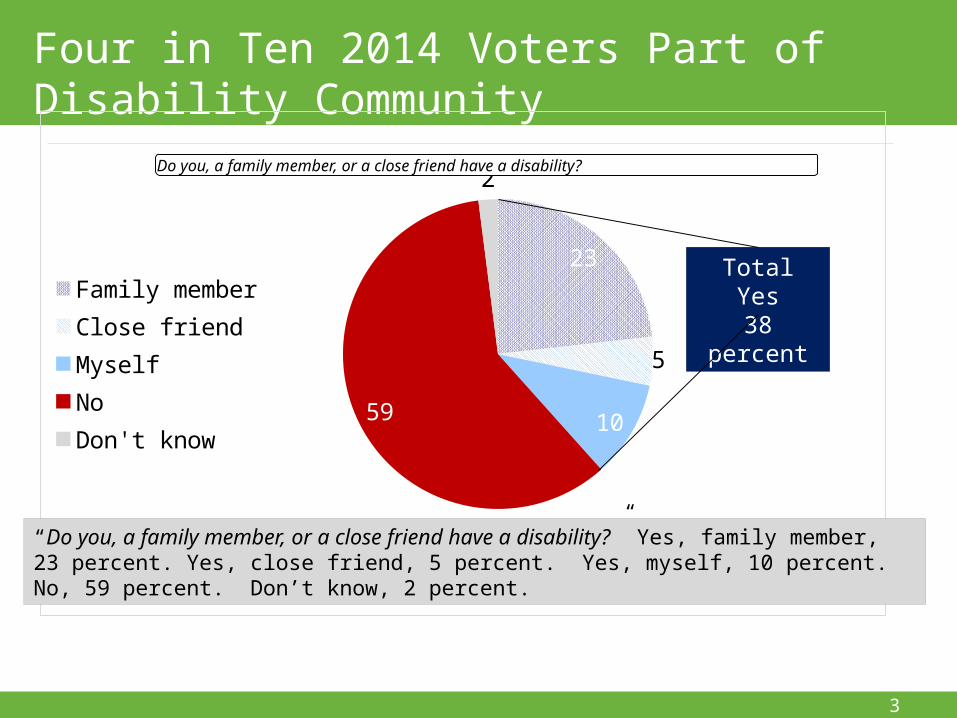
“Do you, a family member, or a close friend have a disability?” Yes, family member, 23 percent. Yes, close friend, 5 percent. Yes, myself, 10 percent. No, 59 percent. Don’t know, 2 percent.
Total Yes38 percent
November 15, 2011
4
Disability Community More Energized than Average
2014 voters Personally disabled Disability community Not disability community
5666 60
52
Please rate your level of interest in voting in today’s/yesterday’s election for U.S. Congress and other offices on a scale from zero to ten, where zero means you are not at all enthusiastic about voting this year and ten means you are extremely enthusiastic about voting this year.
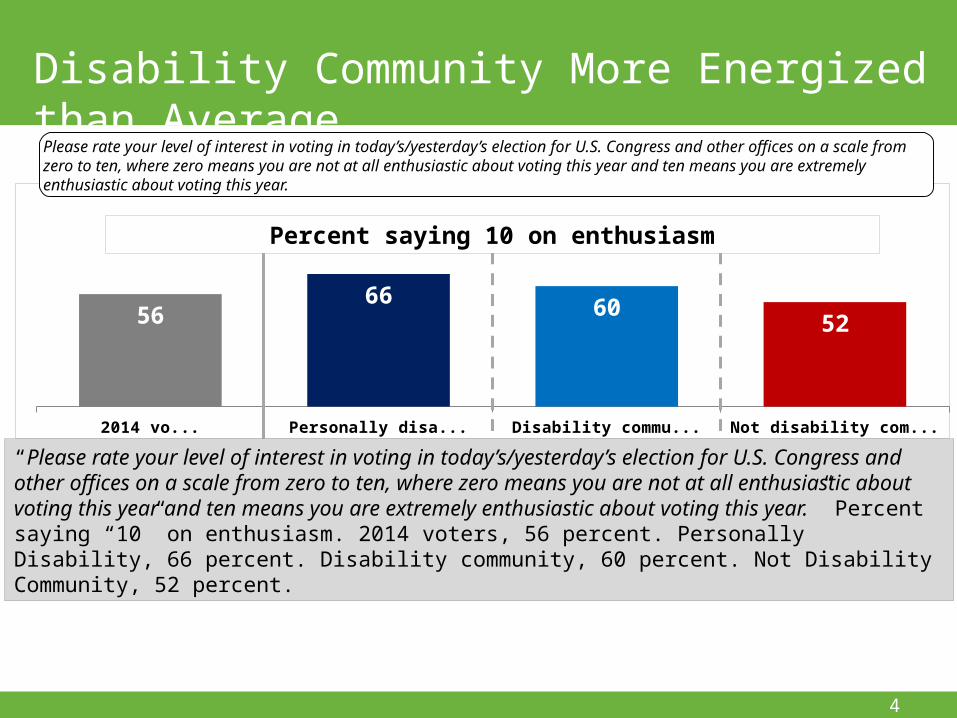
“Please rate your level of interest in voting in today’s/yesterday’s election for U.S. Congress and other offices on a scale from zero to ten, where zero means you are not at all enthusiastic about voting this year and ten means you are extremely enthusiastic about voting this year.” Percent saying “10” on enthusiasm. 2014 voters, 56 percent. Personally Disability, 66 percent. Disability community, 60 percent. Not Disability Community, 52 percent.
Percent saying 10 on enthusiasm
November 15, 2011
5
Share Pessimism of the Rest of the Country
Right direction Wrong track Right direction Wrong track Right direction Wrong track
22 18 21
7280 73
Generally speaking, do you think that things in this country are going in the right direction, or do you feel things have gotten pretty seriously off on the wrong track?
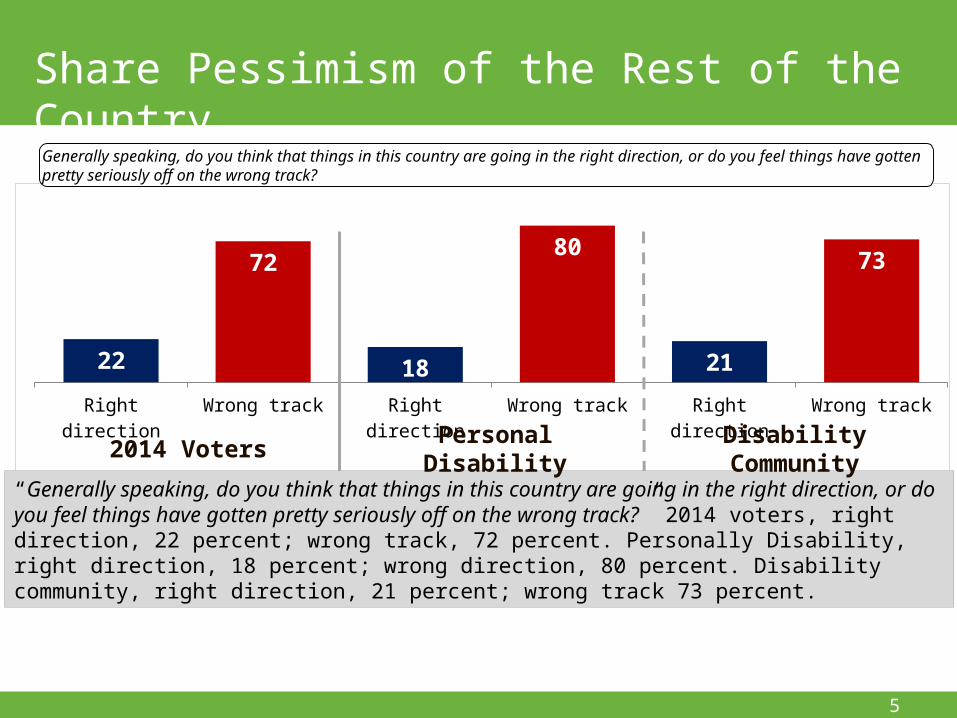
“Generally speaking, do you think that things in this country are going in the right direction, or do you feel things have gotten pretty seriously off on the wrong track?” 2014 voters, right direction, 22 percent; wrong track, 72 percent. Personally Disability, right direction, 18 percent; wrong direction, 80 percent. Disability community, right direction, 21 percent; wrong track 73 percent.
2014 Voters Personal Disability Disability Community
November 15, 2011
6
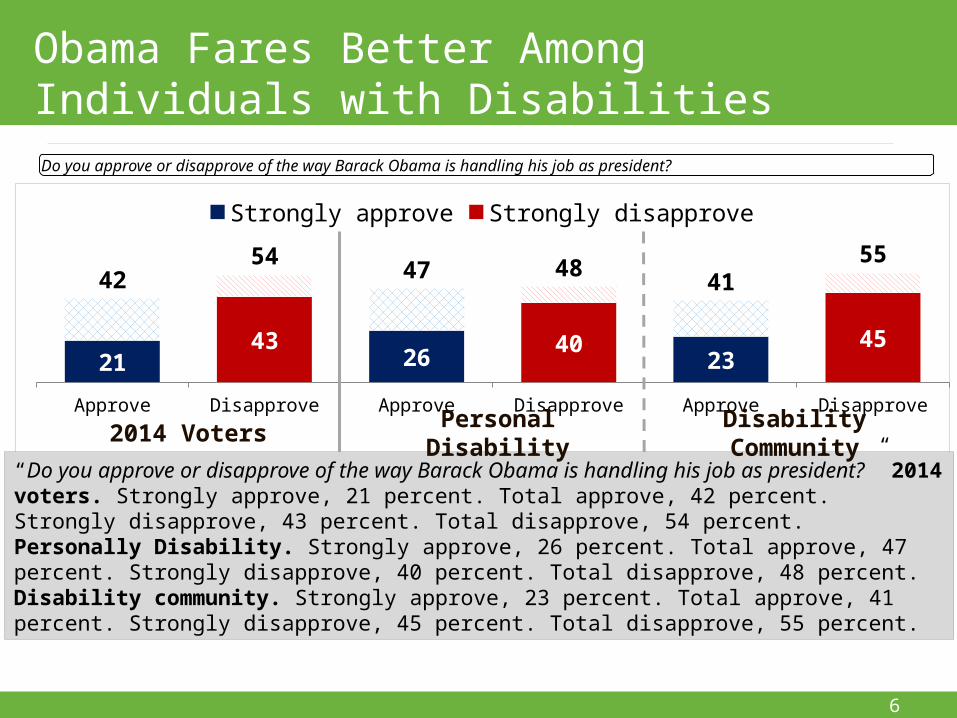
Obama Fares Better Among Individuals with Disabilities
Approve Disapprove Approve Disapprove Approve Disapprove
21 26 23
42 47 41
43 40 45
54 48 55
Strongly approve Strongly disapprove
Do you approve or disapprove of the way Barack Obama is handling his job as president?
“Do you approve or disapprove of the way Barack Obama is handling his job as president?” 2014 voters. Strongly approve, 21 percent. Total approve, 42 percent. Strongly disapprove, 43 percent. Total disapprove, 54 percent. Personally Disability. Strongly approve, 26 percent. Total approve, 47 percent. Strongly disapprove, 40 percent. Total disapprove, 48 percent. Disability community. Strongly approve, 23 percent. Total approve, 41 percent. Strongly disapprove, 45 percent. Total disapprove, 55 percent.
2014 Voters Personal Disability Disability Community
November 15, 2011
7
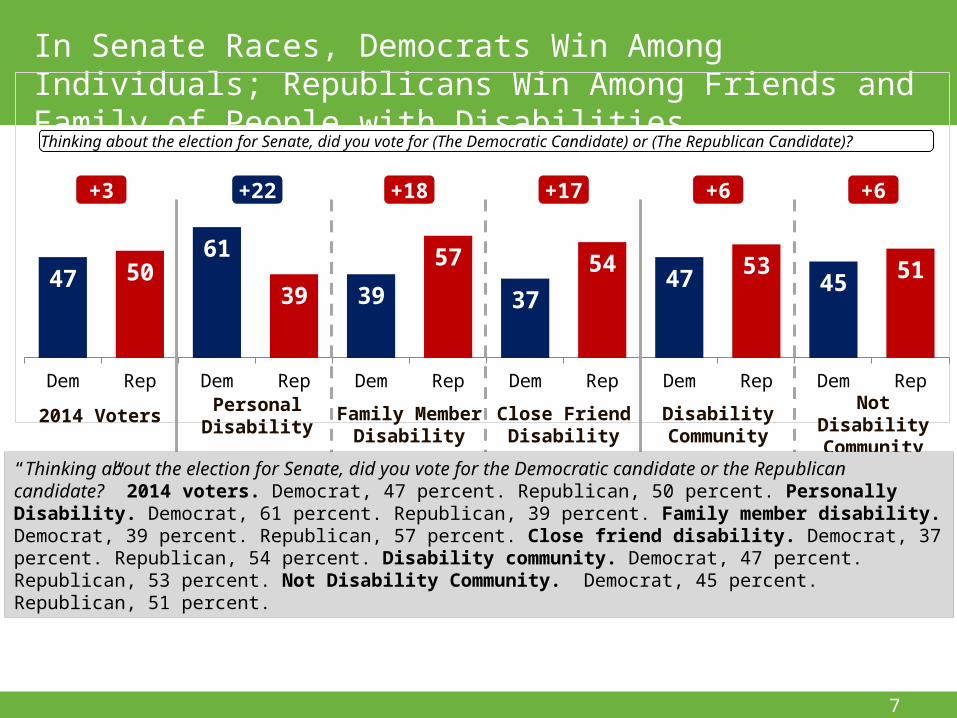
In Senate Races, Democrats Win Among Individuals; Republicans Win Among Friends and Family of People with Disabilities
Dem Rep Dem Rep Dem Rep Dem Rep Dem Rep Dem Rep
4761
39 3747 4550
39
57 54 53 51
Thinking about the election for Senate, did you vote for (The Democratic Candidate) or (The Republican Candidate)?
2014 Voters Personal Disability Disability Community
Not Disability Community
Family Member Disability
Close Friend Disability
“Thinking about the election for Senate, did you vote for the Democratic candidate or the Republican candidate?” 2014 voters. Democrat, 47 percent. Republican, 50 percent. Personally Disability. Democrat, 61 percent. Republican, 39 percent. Family member disability. Democrat, 39 percent. Republican, 57 percent. Close friend disability. Democrat, 37 percent. Republican, 54 percent. Disability community. Democrat, 47 percent. Republican, 53 percent. Not Disability Community. Democrat, 45 percent. Republican, 51 percent.
+3 +22 +18 +17 +6 +6
November 15, 2011
8
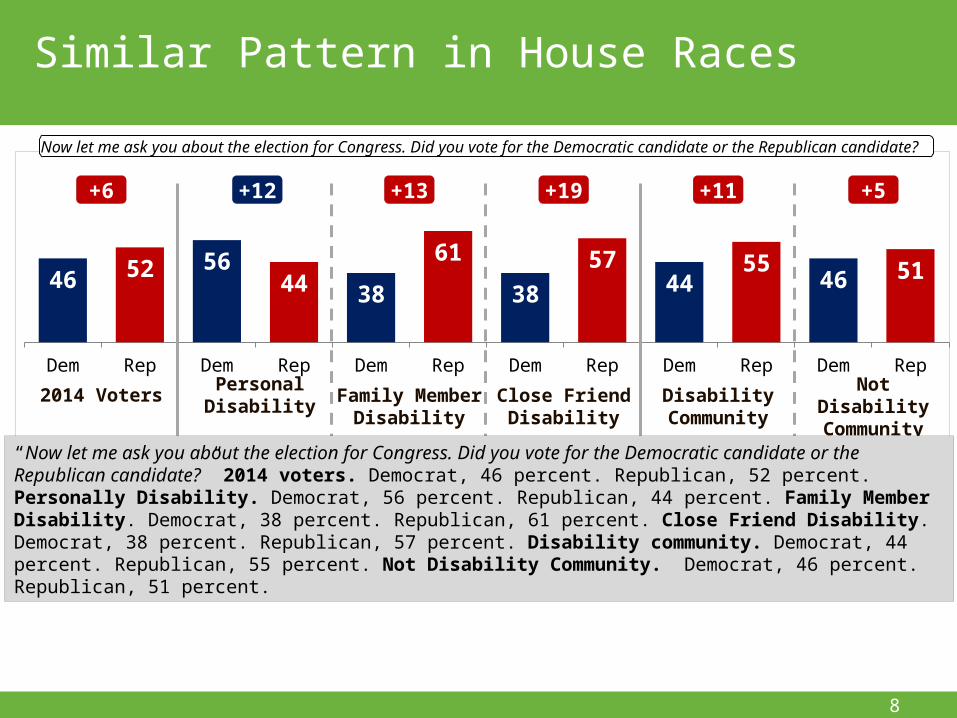
Similar Pattern in House Races
Dem Rep Dem Rep Dem Rep Dem Rep Dem Rep Dem Rep
4656
38 38 44 465244
61 57 55 51
Now let me ask you about the election for Congress. Did you vote for the Democratic candidate or the Republican candidate?
2014 Voters Personal Disability Disability Community
Not Disability Community
Family Member Disability
Close Friend Disability
“Now let me ask you about the election for Congress. Did you vote for the Democratic candidate or the Republican candidate?” 2014 voters. Democrat, 46 percent. Republican, 52 percent. Personally Disability. Democrat, 56 percent. Republican, 44 percent. Family Member Disability. Democrat, 38 percent. Republican, 61 percent. Close Friend Disability. Democrat, 38 percent. Republican, 57 percent. Disability community. Democrat, 44 percent. Republican, 55 percent. Not Disability Community. Democrat, 46 percent. Republican, 51 percent.
+6 +12 +13 +19 +11 +5
November 15, 2011
9
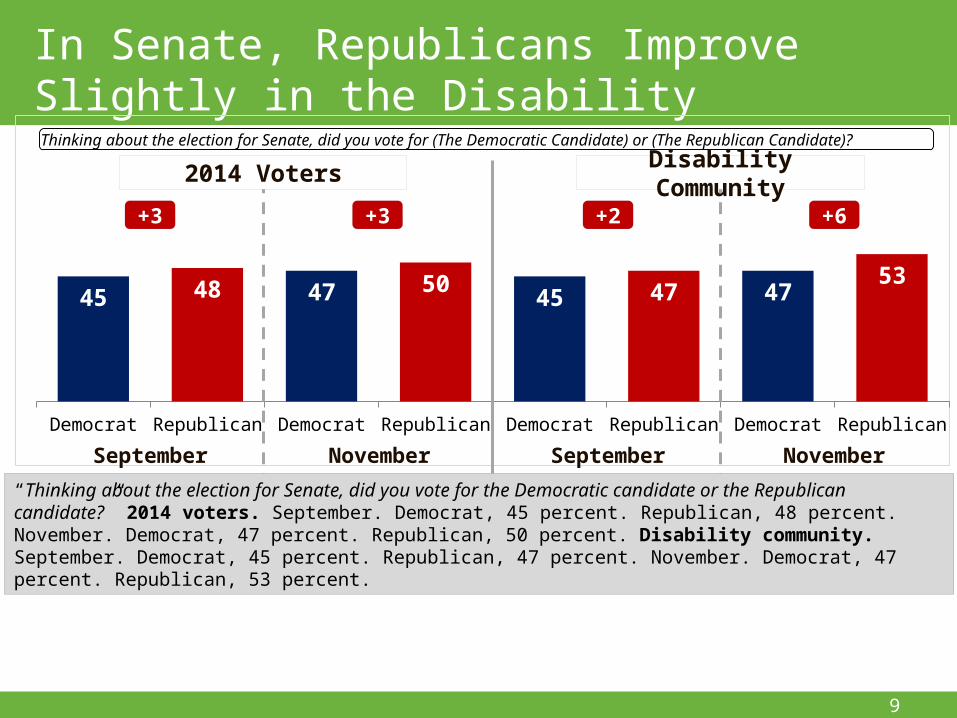
In Senate, Republicans Improve Slightly in the Disability Community Over last Two Months
Democrat Republican Democrat Republican Democrat Republican Democrat Republican
45 47 45 4748 50 4753
Thinking about the election for Senate, did you vote for (The Democratic Candidate) or (The Republican Candidate)?
“Thinking about the election for Senate, did you vote for the Democratic candidate or the Republican candidate?” 2014 voters. September. Democrat, 45 percent. Republican, 48 percent. November. Democrat, 47 percent. Republican, 50 percent. Disability community. September. Democrat, 45 percent. Republican, 47 percent. November. Democrat, 47 percent. Republican, 53 percent.
2014 Voters Disability Community
September SeptemberNovember November
+3 +3 +2 +6
10
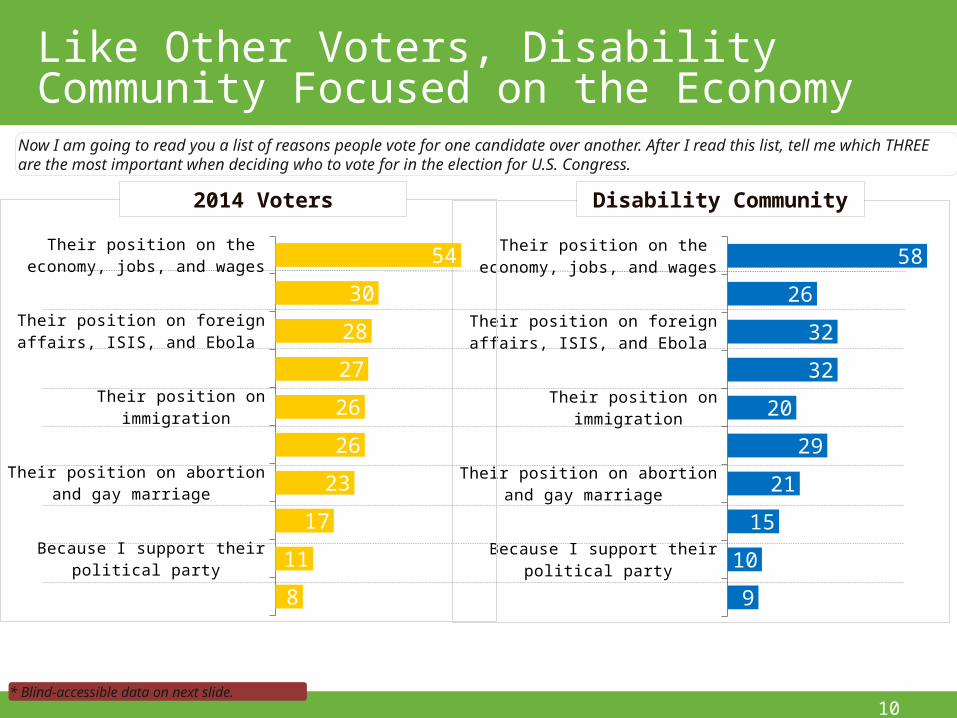
Now I am going to read you a list of reasons people vote for one candidate over another. After I read this list, tell me which THREE are the most important when deciding who to vote for in the election for U.S. Congress.
Their position on the economy, jobs, and wages
Their position on the new health care law
Their position on foreign affairs, ISIS, and Ebola
Their position on spending and deficits
Their position on immigration
Their position on Medicare and Social Security
Their position on abortion and gay marriage
Their position on women's issues
Because I support their political party
Because of Barack Obama
58
26
32
32
20
29
21
15
10
9
Like Other Voters, Disability Community Focused on the Economy
Their position on the economy, jobs, and wages
Their position on the new health care law
Their position on foreign affairs, ISIS, and Ebola
Their position on spending and deficits
Their position on immigration
Their position on Medicare and Social Security
Their position on abortion and gay marriage
Their position on women's issues
Because I support their political party
Because of Barack Obama
54
30
28
27
26
26
23
17
11
8
2014 Voters Disability Community
* Blind-accessible data on next slide.
11
Now I am going to read you a list of reasons people vote for one candidate over another. After I read this list, tell me which THREE are the most important when deciding who to vote for in the election for U.S. Congress.
Like Other Voters, Disability Community Focused on the Economy
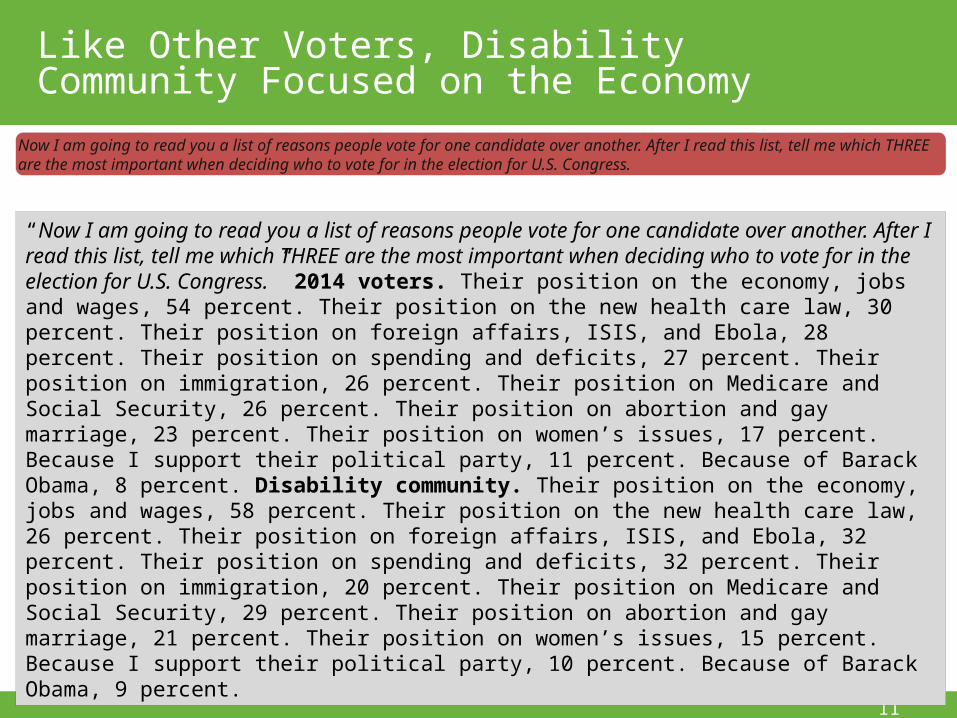
“Now I am going to read you a list of reasons people vote for one candidate over another. After I read this list, tell me which THREE are the most important when deciding who to vote for in the election for U.S. Congress.” 2014 voters. Their position on the economy, jobs and wages, 54 percent. Their position on the new health care law, 30 percent. Their position on foreign affairs, ISIS, and Ebola, 28 percent. Their position on spending and deficits, 27 percent. Their position on immigration, 26 percent. Their position on Medicare and Social Security, 26 percent. Their position on abortion and gay marriage, 23 percent. Their position on women’s issues, 17 percent. Because I support their political party, 11 percent. Because of Barack Obama, 8 percent. Disability community. Their position on the economy, jobs and wages, 58 percent. Their position on the new health care law, 26 percent. Their position on foreign affairs, ISIS, and Ebola, 32 percent. Their position on spending and deficits, 32 percent. Their position on immigration, 20 percent. Their position on Medicare and Social Security, 29 percent. Their position on abortion and gay marriage, 21 percent. Their position on women’s issues, 15 percent. Because I support their political party, 10 percent. Because of Barack Obama, 9 percent.
12
Many Agree Not Raising Issues Important to Them
Raising important issues Not raising important issues Raising important issues Not raising important issues20 23
33 3346 46
59 58
Now I'm going to read you a pair of statements. Please tell me whether the FIRST statement or the SECOND statement comes closer to your own view, even if neither is exactly right.
2014 Voters Disability Community
The President and the political debate in the country are raising issues important to people.
The national political debate in the country just isn't dealing with issues that matter to people.
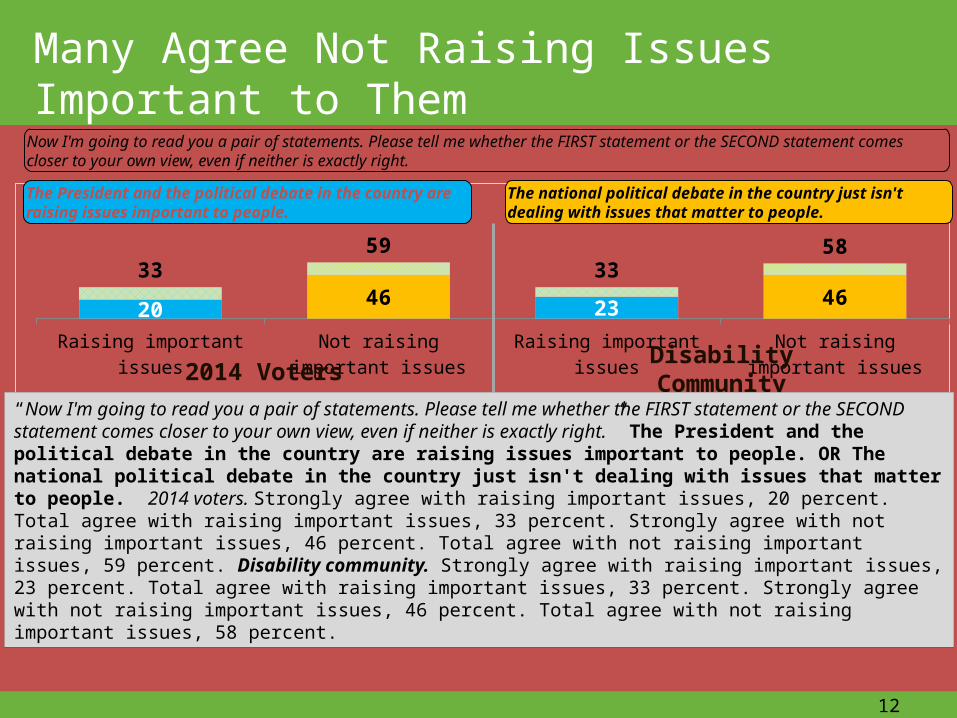
“Now I'm going to read you a pair of statements. Please tell me whether the FIRST statement or the SECOND statement comes closer to your own view, even if neither is exactly right.” The President and the political debate in the country are raising issues important to people. OR The national political debate in the country just isn't dealing with issues that matter to people. 2014 voters. Strongly agree with raising important issues, 20 percent. Total agree with raising important issues, 33 percent. Strongly agree with not raising important issues, 46 percent. Total agree with not raising important issues, 59 percent. Disability community. Strongly agree with raising important issues, 23 percent. Total agree with raising important issues, 33 percent. Strongly agree with not raising important issues, 46 percent. Total agree with not raising important issues, 58 percent.
November 15, 2011
13
Few Heard Candidates Speaking to Their Issues, But Disability Community More Likely to Hear Message
Yes, policies
No, no policies
Yes, policies
No, no policies
Yes, policies
No, no policies
Yes, policies
No, no policies
Yes, policies
No, no policies
Yes, policies
No, no policies
2238
23 18 26 19
58 4965 61 60 58
2014 Voters Personal Disability Disability Community
Not Disability Community
Family Member Disability
Close Friend Disability
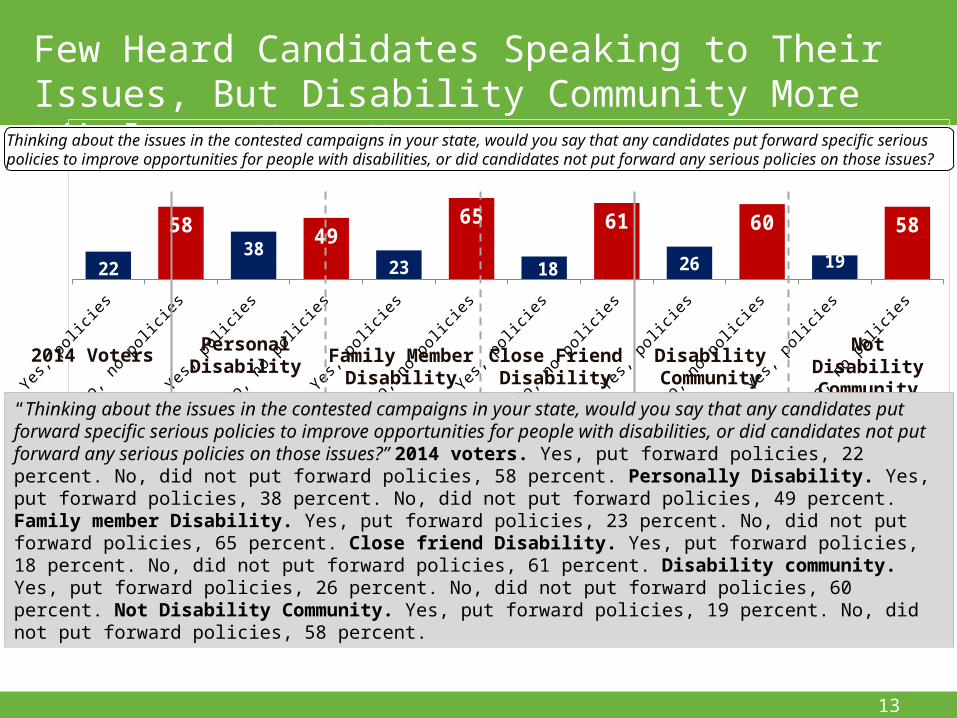
“Thinking about the issues in the contested campaigns in your state, would you say that any candidates put forward specific serious policies to improve opportunities for people with disabilities, or did candidates not put forward any serious policies on those issues?” 2014 voters. Yes, put forward policies, 22 percent. No, did not put forward policies, 58 percent. Personally Disability. Yes, put forward policies, 38 percent. No, did not put forward policies, 49 percent. Family member Disability. Yes, put forward policies, 23 percent. No, did not put forward policies, 65 percent. Close friend Disability. Yes, put forward policies, 18 percent. No, did not put forward policies, 61 percent. Disability community. Yes, put forward policies, 26 percent. No, did not put forward policies, 60 percent. Not Disability Community. Yes, put forward policies, 19 percent. No, did not put forward policies, 58 percent.
Thinking about the issues in the contested campaigns in your state, would you say that any candidates put forward specific serious policies to improve opportunities for people with disabilities, or did candidates not put forward any serious policies on those issues?
November 15, 2011
Impact No impact Impact No impact Impact No impact
3676
43
78 84 82
22 16 18
Major impact Minor impact
14
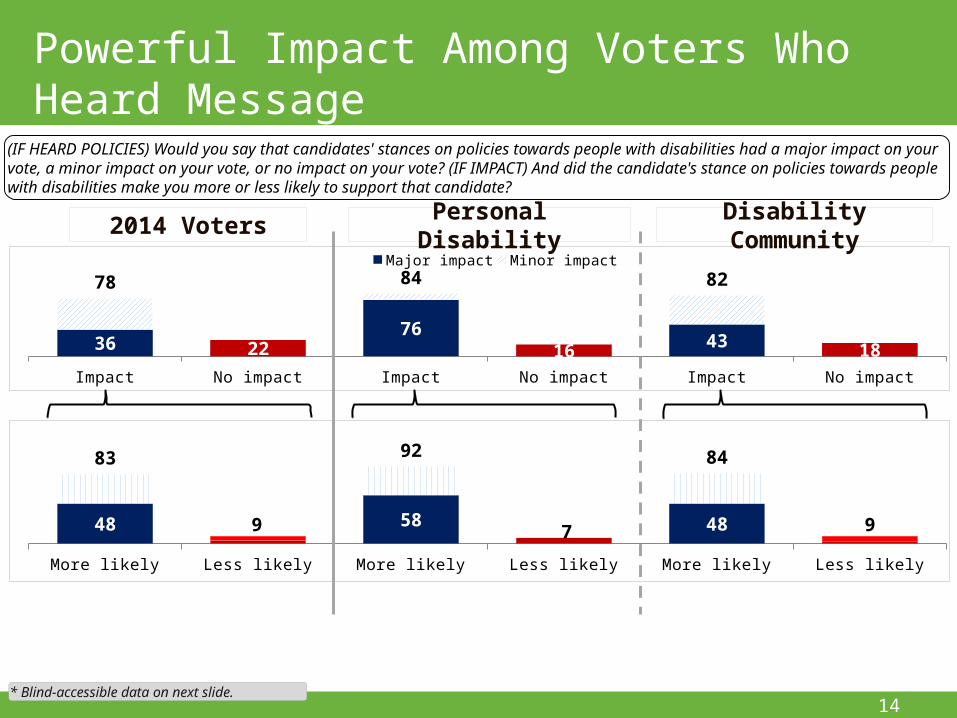
Powerful Impact Among Voters Who Heard Message
More likely Less likely More likely Less likely More likely Less likely
48 58 48
83 92 84
9 97
Much more likely Much less likely
(IF HEARD POLICIES) Would you say that candidates' stances on policies towards people with disabilities had a major impact on your vote, a minor impact on your vote, or no impact on your vote? (IF IMPACT) And did the candidate's stance on policies towards people with disabilities make you more or less likely to support that candidate?
2014 Voters Personal Disability Disability Community
* Blind-accessible data on next slide.
November 15, 2011
15
Powerful Impact Among Voters Who Heard Message
“(IF HEARD POLICIES) Would you say that candidates' stances on policies towards people with disabilities had a major impact on your vote, a minor impact on your vote, or no impact on your vote? (IF IMPACT) And did the candidate's stance on policies towards people with disabilities make you more or less likely to support that candidate?” 2014 voters. Major impact, 36 percent. Total impact, 78 percent. No impact, 22 percent. Much more likely to support that candidate, 48 percent. Total more likely, 83 percent. Total less likely, 9 percent. Personally Disability. Major impact, 76 percent. Total impact, 84 percent. No impact, 16 percent. Much more likely to support that candidate, 58 percent. Total more likely, 92 percent. Total less likely, 7 percent. Disability community. Major impact, 43 percent. Total impact, 82 percent. No impact, 18 percent. Much more likely to support that candidate, 48 percent. Total more likely, 84 percent. Total less likely, 9 percent.
November 15, 2011
16
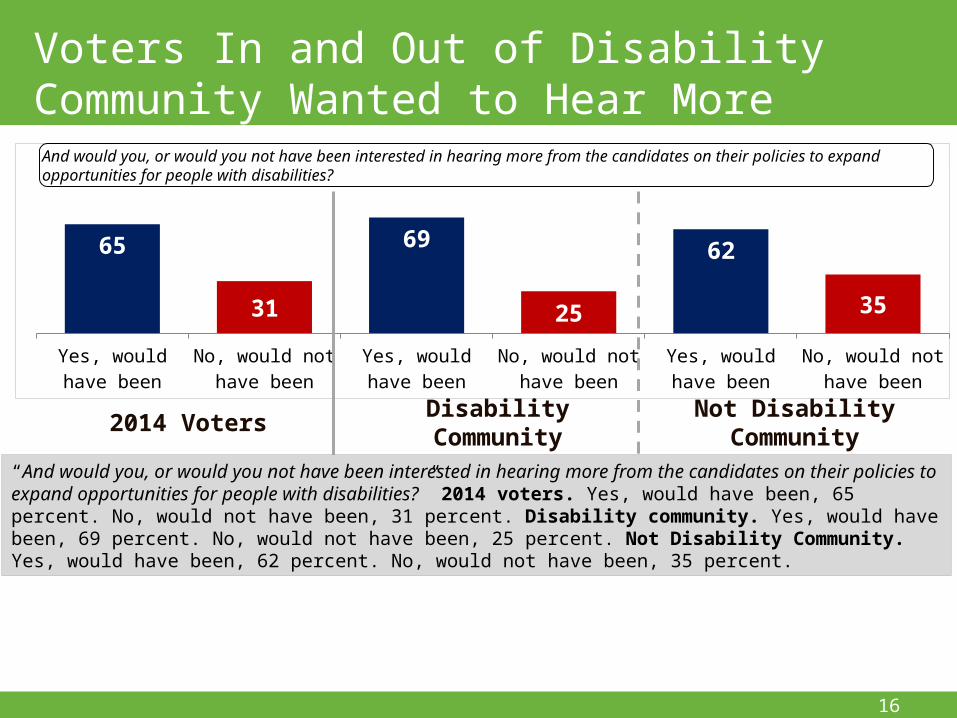
Voters In and Out of Disability Community Wanted to Hear More
Yes, would have been
No, would not have been
Yes, would have been
No, would not have been
Yes, would have been
No, would not have been
65 69 62
31 25 35
And would you, or would you not have been interested in hearing more from the candidates on their policies to expand opportunities for people with disabilities?
“And would you, or would you not have been interested in hearing more from the candidates on their policies to expand opportunities for people with disabilities?” 2014 voters. Yes, would have been, 65 percent. No, would not have been, 31 percent. Disability community. Yes, would have been, 69 percent. No, would not have been, 25 percent. Not Disability Community. Yes, would have been, 62 percent. No, would not have been, 35 percent.
2014 Voters Disability Community Not Disability Community
November 15, 2011
17
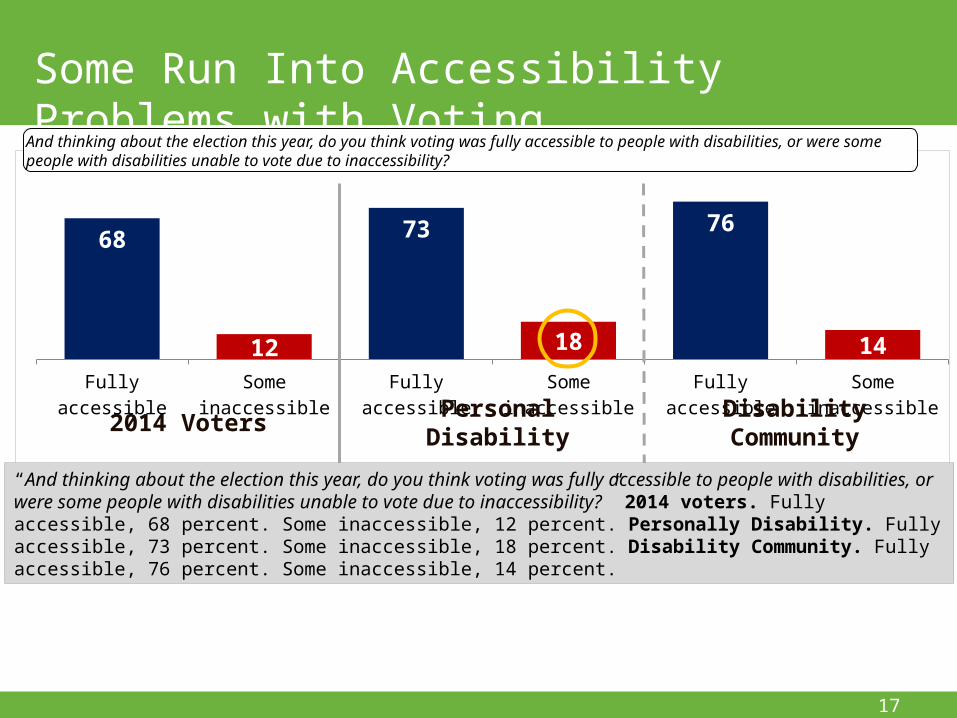
Some Run Into Accessibility Problems with Voting
Fully accessible Some inaccessible Fully accessible Some inaccessible Fully accessible Some inaccessible
68 73 76
12 18 14
And thinking about the election this year, do you think voting was fully accessible to people with disabilities, or were some people with disabilities unable to vote due to inaccessibility?
“And thinking about the election this year, do you think voting was fully accessible to people with disabilities, or were some people with disabilities unable to vote due to inaccessibility?” 2014 voters. Fully accessible, 68 percent. Some inaccessible, 12 percent. Personally Disability. Fully accessible, 73 percent. Some inaccessible, 18 percent. Disability Community. Fully accessible, 76 percent. Some inaccessible, 14 percent.
2014 Voters Personal Disability Disability Community
www.gqrr.com
10 G Street, NESuite 500Washington, D.C. 20002
Phone: +1 202 478 8300Fax: +1 202 478 8301
22 Bloomsbury Sq. London, UK WC1A 2NS
Phone: +44 (0)20 3740 9029
Cabrera 6060, 7DC1414 BHN, Ciudad de Buenos Aires, Argentina
Phone: +54 11 4772 0813
54 W 40th St, New York, NY 10018
Phone: 212 231 0050
CORPORATE HEADQUARTERS
WORLD HEADQUARTERS
EUROPEAN HEADQUARTERS
LATIN AMERICAN HEADQUARTERS
350-1 First Canadian Pl.Toronto Board of Trade TowerToronto, ON M5K 1C1
Phone: +1 647-526-6754
CANADIANHEADQUARTERS