Embed Size (px)
Citation preview
Structural Engineers World Congress 2007, November 2-7, 2007. Bangalore, India.
Vortex-induced vibrations of structures
Svend Ole Hansen
ABSTRACT Vortex-induced vibrations may occur on slender structures such as chimneys, towers and bridge decks. A full analytical description of the phenomenon is still not available, and the procedures used to predict vortex-induced vibrations of structures are still rather crude. The different opinions on how to represent the phenomenon mathematically are reflected in the variety of procedures used in practical designs. For instance, the present Eurocode on wind actions includes both the spectral model and the vortex-resonance model for predicting vortex-induced vibrations of structures.
The present paper describes the most important flow and structural characteristics governing vortex-induced vibrations of structures. The different mathematical approaches presently used to model the phenomenon are described and their modelings of the different physical aspects are discussed. The influence of air turbulence and Reynolds number are some of the physical aspects focused on.
The results obtained in a series of wind tunnel tests recently carried out with different cross sections, such as circular cylinders, sharp-edged sections, octagons and bridge decks, are used as a basis for selecting the most accurate mathematical models to predict vortex-induced vibrations of structures. The comparison of the wind tunnel test results with the predictions obtained from the different mathematical models shows a clear picture of their accuracy and shortcomings. Thus, the results presented in this paper will be a useful basis for the future selection of an accurate mathematical model for predicting vortex-induced vibrations in structural codes. KEYWORDS Vortex shedding, vortex-induced vibrations, motion-induced wind loads, turbulence, spectral model, vortex-resonance model, wind codes. INTRODUCTION Although a great deal of effort has been made during recent decades to improve the analytical models used for predicting vibrations due to vortex shedding, the analytical models available are still rather crude. The cross-wind forcing mechanisms have proved to be so complex that there is no general analytical method available to calculate cross-wind structural response. The main physical parameters involved in the forcing mechanisms have been clarified, but the basic data used in full-scale predictions have not reached a general agreement among researchers. Especially, the methods they use to take aeroelastic effects, i.e. motion-induced wind loads, into account differ considerably.
Two primary design aspects should be focused on in a design procedure:
1. Rare, extreme events occurring say once in 10-50 years. These events are important in connection with serviceability and their contribution to fatigue should be analysed.
2. Frequent events occurring many times during the expected lifetime. These events will often give the major contributions to the fatigue damage calculated.
It is essential that both aspects mentioned above are included in design models for vortex shedding. Eurocode 1 EN 1991-1-4:2005 (1) proposes two approaches for predicting vortex-induced vibrations of structures. Approach 1 based on the vortex-resonance model provides response estimates, which are larger than the frequent events and lower than the rare events. This was pointed out by Dyrbye and Hansen (2) in their discussion of the influence of different meteorological conditions for the motion-induced wind loads developed in vortex-induced vibrations. Approach 2 based on the spectral model takes rare as well as frequent events into account by including the influence of turbulence in the vibration amplitudes predicted. This enables that the spectral model does not underestimate the rare event response nor overestimates the frequent event response.
The spectral model is also used as basis for the specifications of vortex-induced vibrations in the Canadian and the Danish wind code, and in the CICIND model code for chimneys.
The design procedure focused on in this paper is based on the spectral model originally suggested by Vickery and Clark (3) and further refined by Vickery and Basu (4). Their data mainly includes circular cross sections. The design procedure presented in this paper extends the scope to sharp-edged cross sections as well. Furthermore, this paper focuses on the influence of turbulence in the vibration amplitude predictions, and this changes the predictions considerably towards the behaviour observed for many full-scale structures.
It is hoped that this paper could be used in the efforts to direct the different research groups toward a common understanding of vortex-induced vibrations of line-like structures.
None of the structures considered in the paper are part of a group. Group effects are, therefore, not considered. BASIC PHYSICS OF VORTEX-INDUCED VIBRATIONS The basic physics of vortex-induced vibrations are described below. Resonance wind velocity Vortex-induced vibrations may occur when vortices are shed alternately from opposite sides of a structure. This gives rise to a fluctuating load perpendicular to the wind direction. As the vortices are shed alternately first from one side then the other, a harmonically varying lateral load with the same frequency as the frequency of the vortex shedding is formed. The frequency )(zns of the lateral load caused by vortex shedding at location z is:
)()()(
zbzvStzn m
s = (1)
in which St is the Strouhal number, mv is the mean velocity of the approaching wind, and b is the cross-wind dimension of the structure considered. Significant vibrations may
occur if the dominating frequency of vortex shedding, sn , is the same as the natural frequency, en , for the structure vibrating in a mode in the cross-wind direction. Therefore, the resonance wind velocity rv defined by es nn = is equal to:
Stbn
vv referm == (2)
in which en is the natural frequency, refb is the reference cross-wind width and St is Strouhal number. Of course, the vortex-induced vibrations calculated do not depend on the choice of reference quantities, e.g. the reference width. The reference quantities chosen often refer to the point, at which the structural vibrations are largest. Scruton number The Scruton number Sc becomes one of the crucial parameters for the vortex-induced vibrations of structures, see e.g. Scruton (5). It is proportional to the structural damping and to the ratio between the vibrating mass and the mass of the air displaced by the structure, and it is defined as:
2
2
ref
es
bmSc
ρδ
= (3)
in which ρ is the air density, sδ quantifies the structural damping by the logarithmic decrement approximately equal to ss πζδ 2= , where sζ is the structural damping ratio, and the effective mass me per unit length is given by:
∫= h
ge
dzz
Mm
0
2 )(ξ (4)
in which ξ (z) is the mode shape, the integral in the denominator is taken over the structural part with length h exposed to vortex shedding forces, and gM is the modal mass, which for a line-like structure of length L may be expressed as:
∫=L
g dzzzmM0
2 )()( ξ (5)
where )(zm is the vibrating mass per unit length. Motion-induced wind loads Structural motion induces a feedback to the air flow generating the cross-wind load on the structure. For flexible structures these motion-induced wind loads are significant. The concept of aeroelasticity covering these load contributions is discussed below.
Structural motion interacts with the wind field in such a way that the dominating vortex shedding frequency synchronises with the structure’s natural frequency. This phenomenon is called lock-in.
Many experiments have been made in order to determine the influence of structural motions on the correlations of the cross-wind loading. The results of these experiments show that increasing vibration amplitudes cause an increase of correlation length.
The above-mentioned properties of lock-in and motion-dependent correlations are related to the aerodynamic cross-wind loading caused by the structural vibrations. In its most simple form, the motion-induced wind load mF consists of an inertia load proportional to the accelerations of the structure and an aerodynamic damping proportional to the velocity of the structure: defadefam chF ξξ &&& −−= (6)
defξ , defξ& and defξ&& are the cross-flow deflections, velocities and accelerations, respectively, of the structure. For most civil engineering structures in air, the added mass of air ah is small relative to the structural mass, and may thus be disregarded. However, the aerodynamic damping force defac ξ& will reduce the effective damping of the vibrations when ac is negative. As this occurs for wind velocities close to the critical wind velocity it is a very essential parameter when calculating the response.
The linear dependence between loading and velocity indicated in equation (6) is sufficiently accurate for small vibrations of up to approx. 5-10% of the structural width. For larger vibration amplitudes non-linear damping terms become important.
The aerodynamic damping parameter aK illustrated in figure 1 determines the linear term of the motion-induced wind loads on the structure. The figure shows that the aerodynamic damping may become negative for reduced wind velocities larger than or of the order of the Strouhal number reciprocal. Influence of turbulence The effect of turbulence on vortex-induced vibrations has been considered experimentally by Vickery (6), and Krenk and Nielsen (7) include turbulence in their theoretical lift-oscillator model. The description below extracts the basic influence of air turbulence.
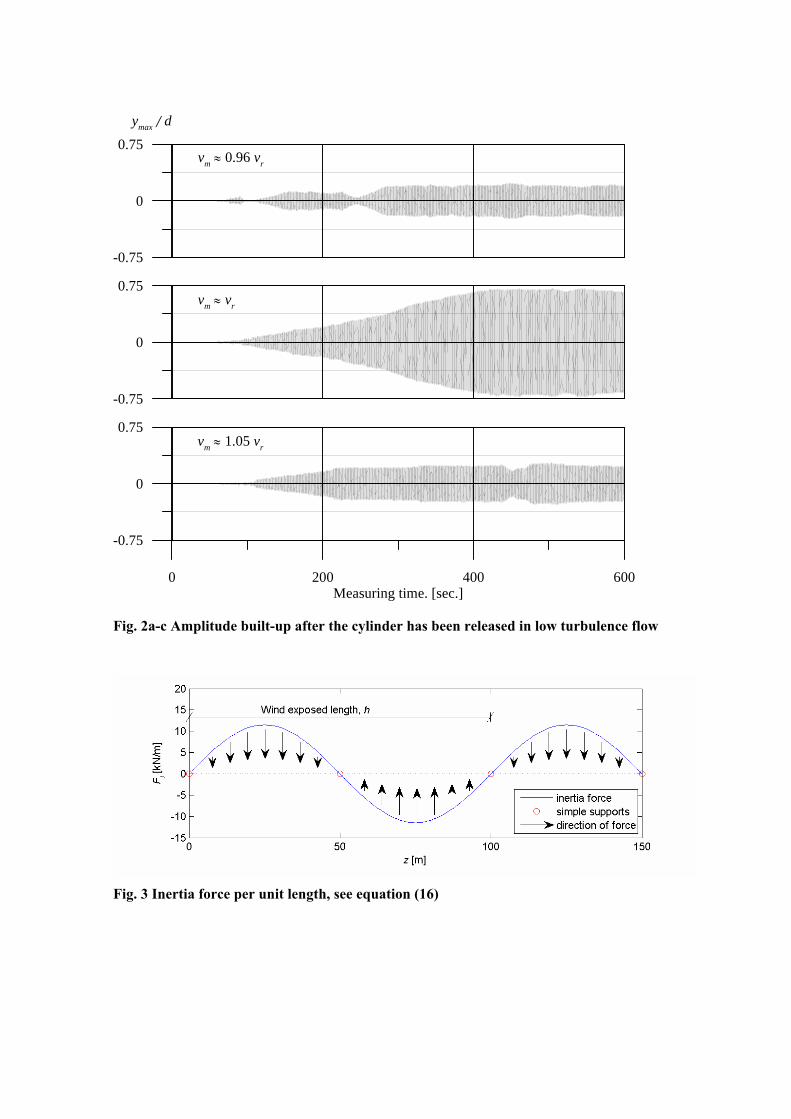
Figure 2a-c shows the increase in amplitude for a fixed cylinder suddenly released in a wind tunnel with low turbulence flow. The natural frequency of the cylinder vibrations is 1.81 Hz. The upper figure refers to a wind velocity mv approx. 4% lower than the resonance wind velocity rv , i.e. rm vv 96.0≈ , the middle figure to rm vv ≈ and the lower figure to rm vv 05.1≈ . The figure shows a slowly increase in amplitude where maximum amplitudes are reached after approx. 1000 natural vibration periods. Furthermore, the maximum amplitude reached depends strongly on the ratio between the actual wind velocity and the resonance wind velocity.
Large-scale turbulence in the atmosphere may be interpreted as a slowly varying mean wind velocity. Looking at the results shown in Figure 2a-c, it is not surprising that large
scale turbulence will have a pronounced effect on vortex-induced vibrations. When the mean wind velocity for a short period of time is equal to the resonance wind velocity, the amplitudes will grow slowly, but as soon as the mean wind velocity has changed away from the resonance wind velocity, large amplitudes will not grow up. The actual amplitudes will be of stochastic nature, i.e. increase when the wind velocity is close to the resonance wind velocity and reduce when this is not the case.
The observations described above refer to structures not having extremely low Scruton numbers. At low Scruton numbers large vibrations may develop even in turbulent flow.
The influence of large scale turbulence may be estimated approximately by integrating the aerodynamic damping parameter measured for different mean wind velocities and weighed with a Gaussian distribution describing the variation of the longitudinal turbulent component. A more accurate approach will be to analyse the differential equation describing the variations of the lift coefficient in time. Measurements of aerodynamic damping terms in turbulent flow may also be used.
The aerodynamic damping depends on turbulence intensity and not on the absolute variations of the wind velocity. The critical Scruton number, at which the jump from small to large vibrations occurs, depends strongly on the low frequency turbulence with large scales, but not on the high frequency turbulence with small scales. VORTEX-INDUCED VIBRATIONS BASED ON THE SPECTRAL MODEL Originally, Vickery and Clark (3) proposed the spectral model used to predict vortex-induced vibrations of line-like structures. During the last approx. 30 years the formulation and aerodynamic parameters used in the model have been analysed in several papers and text books, see e.g. Vickery and Basu (4), Vickery (6) and Dyrbye and Hansen (2).
The motion-induced wind loads in the spectral model are taken into account by aerodynamic damping of the form ay by& &− 3 , where the first, linear term introduces negative aerodynamic damping and the last, non-linear term gives positive damping ensuring that the response is self-limiting. For small amplitudes of up to approx. 5-10% of the structural width, the aerodynamic damping is described sufficiently accurate by the first, linear term.
The aerodynamic damping ratio ζ a is given by, see Vickery and Basu (4):
⎟⎟
⎠
⎞
⎜⎜
⎝
⎛
⎟⎟⎠
⎞⎜⎜⎝
⎛−=
2
,
,,
2
refrefLaL
refyKrefa
e
refa ba
Kmb
γσ
γρ
ζ (7)
in which the constants Kγ and aLγ are defined in equation (11) and (12) below.
Assuming that the reference velocity pressure 22221 / Stnbq erefref ρ= , in which ρ is the air
density, the standard deviation σ y of the structural deflection is given by, see Dyrbye and Hansen (2), equation (7.4.8)
ref
ref
e
ref
refrefLaL
refyKrefa
refcC
ref
y zh
bmb
baKSc
CStb
zξξρ
γσ
γπ
γσ )(
4
1)( 2
2
,
,,
,2
⎟⎟
⎠
⎞
⎜⎜
⎝
⎛
⎟⎟⎠
⎞⎜⎜⎝
⎛−−
= (8)
The standard deviation of the structural deflection follows the mode shape. The aerodynamic constant refcC , depends on the cross-sectional shape, and for a circular cylinder also of the Reynolds number. It is given by:
ref
refLrefc B
CC
λππ ,
2
4
,
~
28= (9)
in which ~CL is the lift coefficient, λ is the load correlation length, and B is the spectral bandwidth, all non-dimensional parameters describing the vortex-induced load on non-vibrating structures. ~CL and B , and thereby the constant refcC , , are functions of turbulence intensity, and for circular cross-sections also of Reynolds number, see e.g. Vickery (6).
The correction factors Cγ , Kγ and aLγ depend on the vortex-shedding forces on the structure in combination with the mode shape along the exposed length h . They are expressed by:
∫
∫= h
ref
h
e
C
dzzh
dznzgh
02
20
2
)(1
),(1
ξξ
γ (10)
∫
∫= h
h
refrefa
a
K
dzz
dzzb
zbK
zK
0
2
0
22
2
,
)(
)()()(
ξ
ξγ (11)
∫
∫= h
refrefa
a
h
refaL
dzzK
zK
dzz
04
4
,
02
2
)()(
)(
ξξ
ξξ
γ (12)
and the function g introduced in equation (10) is equal to, see Dyrbye and Hansen (2), equation (7.4.4)

( ) ⎥⎥⎦
⎤
⎢⎢⎣
⎡⎟⎟⎠
⎞⎜⎜⎝
⎛ −−=
2
)()(/1
21exp
)()(~)()(~)()(),(
zBznn
znn
zBB
CqbzzCzbzqnzg s
s
ref
refL
L
ξξ (13)
where the vortex-shedding frequency )(/)()( zbzvStzn ms ⋅= .
The correction factor Cγ in equation (10) depends primarily on the mode shape and to some extent also on the velocity profile and diameter variation with height. Assuming a uniform mode shape and velocity profile, height independent width b , lift coefficient ~CL and spectral bandwidth B , the function g z ne( , ) becomes equal to 1 when the vortex-shedding frequency n zs ( ) is equal to the natural frequency ne for all heights z .
It is often a good approximation to assume that K za ( ) is independent of height z . For structures with constant width b , the correction factor Kγ becomes equal to 1 and the correction factor aLγ only depends on the mode shape. The correction factor aLγ becomes
equal to 1 and 5/9 =1.34 for uniform and parabolic mode shapes, respectively. Parabolic mode shapes may, therefore, have larger limiting amplitudes than uniform mode shapes. This is not surprising since the stabilising non-linear damping force acts along a shorter structural length, when the mode shape becomes more complex.
The general expressions above may be simplified assuming that the cross-wind dimension and all aerodynamic parameters are constant along the structure. The aerodynamic parameters include the mean wind velocity mv and velocity pressure q , the lift coefficient
LC~ , the spectral bandwidth B , and the aerodynamic damping parameter aK .
The assumption may seem to be very limiting. However, this is not the situation since the vortex shedding forces are most important along a relatively short distance on the structure, where the structural vibrations are largest. Thus, using reference parameters representative for the locations where the mode shape has its maximum deflection will normally give accurate estimates of vortex-induced vibrations.
The correction factor Cγ for the aerodynamic parameter cC becomes equal to:
∫=
h
ref
C
dzzh 0
2
2 )(1
1
ξξ
γ (14)
The correction factor for the aerodynamic damping parameter aK becomes Kγ =1, and the correction factor for the limiting amplitude parameter follows directly from equation (12)
∫
∫= h
ref
h
refaL
dzz
dzz
04
40
2
2
)(
)(
ξξξξ
γ (15)
These correction factors are assumed in the code design procedure described below.
CODE DESIGN PROCEDURE The influence of turbulence has been included in the present design procedure in order to take observations on full-scale structures duly into account.
The code design procedure presented covers general mode shapes and is not restricted to mode shapes with non-changing signs. Vortex-induced response The effect of vortex-induced vibrations may be calculated from the effect of the inertia force )(zFI per unit length acting perpendicular to the wind direction and given by:
( )max
max,2 )(2)()(
ξξσπ zknzmzF ypeI ⋅⋅= (16)
in which )(zm is the vibrating mass per unit length, en is the natural frequency, pk is the peak-factor, and max,yσ is the standard deviation of the structural deflection at the point where the mode shape )(zξ has its largest deflection maxξ . max,yσ is given by:
hb
mb
baKSc
CStb e
L
ya
cy2
2max,
2max,
14
1 ρ
σπ
σ
⎟⎟
⎠
⎞
⎜⎜
⎝
⎛⎟⎟⎠
⎞⎜⎜⎝
⎛−−
= (17)
in which the aerodynamic constant refcCc CC ,γ= , the aerodynamic damping parameter aK is assumed to be equal to refaK , , and the normalised limiting amplitude refLLL aa ,γ= , see equation (8) above. The correction factors should be calculated using maxξξ =ref .
The standard deviation of the structural deflection may be determined by solving equation (17). The solution is given by:
2211
2max, ccc
by ++=⎟⎟
⎠
⎞⎜⎜⎝
⎛σ (18)
where the constants 1c and 2c are equal to:
⎟⎟⎠
⎞⎜⎜⎝
⎛−=
a
L
KScacπ4
12
2
1 hb
StC
mb
Kac c
ea
L4
222
2
ρ= (19)
The correction factors Cγ and Lγ are given in table 1 for five different simple mode shapes, four with non-changing sign and one with changing sign.
In the present simplified and approximate approach, the aerodynamic damping parameter aK is estimated for smooth flow cases and a function of longitudinal turbulence intensity,
vI , gives the reduction in turbulent flow, i.e.: )()Re(),Re( max, vvava IKKIK ⋅= (20) The function vK may approximately be determined by vv IK 31−= for 25.00 ≤≤ vI and
25.0)( =vv IK for 25.0>vI . This simplified model takes turbulence into account in a rather crude way and it gives only rough indications not underestimating the response. Further studies are needed to clarify the influence of turbulence more accurately.
The maximum amplitude maxy is calculated by multiplying the standard deviation max,yσ given by equation (17) with a peak-factor pk , i.e. ypky σ=max . For small amplitudes below approx. 1-2% of the cross-wind dimension, the peak-factor is approx. 3.5-4 depending on the natural frequency of the structure. For large amplitudes, the peak-factor is equal to 2 and for intermediate amplitudes, the peak-factor increases gradually with decreasing amplitude. The following simplified expression may be used: ( ))))4/((75.0arctan(2.112 4
ap KSck π+= (21) The expression in equation (21) was originally proposed by Ruscheweyh and Sedlacek (8). Fatigue calculation Fatigue calculations could be based on the design procedure proposed using the probability of different turbulence intensities at wind velocities close to the critical wind velocity. The occurrence of different atmospheric stability conditions may become important.
The constants cC and aK depend on the wind velocity ratio rm vv / , where mv is the mean wind velocity and rv is the resonance wind velocity. They are approximately given by:
⎥⎥⎦
⎤
⎢⎢⎣
⎡⎟⎠⎞
⎜⎝⎛ −
−⎟⎟⎠
⎞⎜⎜⎝
⎛=
22/3
max,/1
21exp
Bvv
vvCC mr
r
mcc (22)
)/()()Re(max, rmvvaa vvfIKKK ⋅= (23) The function f has its maximum value of 1 for rm vv = , and it may, as a rough approximation, be assumed to decrease linearly to the value of 0 for rm vv 2= . The function f is roughly equal to 0 for rm vv < and for rm vv 2> .
The occurrence of mean wind velocities up to approx. 15-20 m/s could be based on information included in the European Wind Atlas. Originally, these information was intended to be used in connection with predictions of wind energy production from wind turbines, but the European Wind Atlas will in most cases also provide accurate wind data input used for calculating fatigue damage due to vortex shedding.
The occurrence of different turbulence intensities as function of mean wind velocity has not been investigated thoroughly in the past. In connection with the Danish wind code, the results from two wind measuring stations were used to establish distributions of turbulence intensities. Both stations are characterised by wind over land with roughness lengths 0z of between 0.01m and 0.05m. For the two stations analysed, the occurrence of different turbulence intensities )(zIv at height z may approximately be given by a Gaussian distribution with a:
• mean value corresponding to neutral atmospheric conditions, i.e. )/ln(/1)( 0zzzI v =
• standard deviation gradually decreasing from approx. 0.06 at mean wind velocities below approx. 5 m/s to approx. 0.03 for mean wind velocities of approx. 10 m/s.
The probability connected with negative arguments may be assumed to correspond to zero turbulence intensity. The probabilities of turbulence intensities based on the Danish measurements will probably overestimate low turbulence situations in most parts of Europe thereby leading to overestimated fatigue damage of the structure. Example – three span bridge with sinusoidal mode shape – see figure 3 The vortex-induced response is determined for the first mode of a full-scale bridge with a box-girder cross section as shown in figure 12. The bridge is a three span bridge with simple supports. The mass per unit length of the bridge is m =4000 kg/m and the length of each span is 50 m. The vertical cross wind dimension is b = 3.75 m. The natural frequency is equal to en =0.73 Hz, and the structural damping is assumed to be 04.0=sδ .
Two spans are assumed to be wind exposed and one span not wind exposed, see figure 3. This indicates that the wind-exposed length is h =100 m, and the total length is L =150 m.
The resonance wind velocity given in equation (2) is calculated to be rv =22.8 m/s using the Strouhal number of 12.0=St determined in the tests carried out. For this resonance wind velocity, low turbulence situations do not occur indicating that the reduction of the aerodynamic damping parameter due to turbulence may be taken into account.
The aerodynamic parameter values are: 009.0, =refcC , 9.1, =refaK and 085.0, =refLa as determined in the wind tunnel test, see figure 14. The aerodynamic parameters cC and La are determined to refcCc CC ,γ= =1.41·0.009=0.0127 and refLLL aa ,γ= =1.16·0.085=0.099 using the correction factors of Cγ =1.41 and aLγ =1.16 determined in accordance with equation (14) and (15), see also table 1. The aerodynamic damping parameter becomes
( ) ( ) 16.113.0319.1, =⋅−⋅=⋅= vvrefaa IKKK assuming a turbulence intensity of 13%.
The effective mass per unit length becomes, see equation (4):
( ) ( )( )
( )( )6000
23
0
2
0
2
===
∫
∫m
dzz
dzzzmm h
L
e
ξ
ξ kg/m
The Scruton number may now be found as, see equation (3):
3.2775.325.1600004.022
22 =⋅⋅⋅
==bmSc es
ρδ
The constants 1c and 2c in equation (19) are equal to:
0043.016.14
3.2712
099.04
12
22
1 −=⎟⎠⎞
⎜⎝⎛
⋅−=⎟⎟
⎠
⎞⎜⎜⎝
⎛−=
ππ a
L
KScac
74
222
4
222
2 102.7100
75.312.0
0127.06000
75.325.116.1
099.0 −⋅=⋅
==hb
StC
mb
Kac c
ea
Lρ
and equation (18) gives the maximum standard deviation of the deflection:
( ) 0091.0102.70043.00043.0 722
211
max, =⋅+−+−=++= −cccb
yσ
The peak-factor in equation (21) becomes 90.3=pk . The inertia force wF (z) in equation (16) is illustrated in figure 3. CIRCULAR CYLINDERS Full-scale observations and codified aerodynamic parameters are described below. Full-scale observations Full-scale observations of steel chimneys have been reported extensively, see e.g. Pritchard (9) and Daly (10). Some of the characteristic features are focused on below in connection with the chimneys considered by Dyrbye and Hansen (2).
During the winter in 1995/96 four Danish chimneys have all experienced unacceptable large vibrations. All four chimneys were constructed during the period from 1972 to 1980, and no serious vibrations have been reported until the large vibrations occurred during the winter in 1995/96, i.e. approx. 20 years after construction.
The large vibrations of all 4 chimneys were observed during periods of cold weather with temperatures of approx. -10ºC to -5ºC. These vibrations occurred primarily in the morning and / or in the evening, indicating that the air flow may be characterised by extremely low turbulence levels due to stable stratification of the atmosphere.
The observations made during the winter 1995/96 were not unique. Similar observations have been made in many countries.
It should be emphasised that the large vibrations described above are not caused by group effects or corrosion problems. Furthermore, the large vibrations are not judged to originate from structural or foundation changes due to the cold weather. Rare events with large vibrations have also occurred during weather conditions with temperatures well above 0ºC.
However, the probability of low turbulence situations in cold weather is larger than in normal weather situations.
According to the results shown, under special conditions, e.g. certain meteorological situations with cold and smooth air flow over a relatively long period of time, say of approximately 1 hour, some slender steel structures may experience larger vibrations than predicted by the vortex-resonance model of Eurocode 1 EN 1991-1-4:2005.
In conclusion, the vortex-resonance model of Eurocode 1 sometimes overestimates and sometimes underestimates the response caused by vortex shedding. This drawback is not present in the spectral model of Eurocode 1, in which the air turbulence introduces the variability of structural response observed for full-scale structures. Codified aerodynamic parameters – spectral model of Eurocode 1 The aerodynamic parameters specified in the spectral model of Eurocode 1 are given in table 2, and the aerodynamic damping parameter is illustrated in figure 4. The values specified are based on the loads and vibrations measured on a large number of structures, see Hansen (11). The influence of the mode shapes in form of correction factors have not been extracted from the measurements. This refinement may be carried out at a later stage when the Eurocode is revised.
Inserting max,aK in equation (17) gives the vibration amplitudes illustrated in Figure 5a for smooth flow at different Reynolds numbers. Figure 5b-d show the vortex-induced vibrations as function of turbulence intensity for the Reynolds numbers considered in figure 5a. The influence of turbulence is seen to be pronounced for Scruton numbers of many typical structures.
The value of max,aK is crucial in order to estimate reliable results in the rare events of meteorological conditions with smooth air flow and at a mean wind velocity equal to the resonance wind velocity. The calibrations carried out show that the code procedure proposed is able to predict all large vibrations observed on the structures considered, see Hansen (11) for further details. SHARP-EDGED CROSS SECTIONS The aerodynamic parameters for uniform mode shapes are described below for different sharp-edged cross sections, see also table 3. They have been determined in a series of section model tests carried out in our boundary layer wind tunnel.
Smooth flow is the basic set-up in the tunnel. The turbulence intensity is approx. 2% and the turbulence has small scales. 3 spires located at the inlet generate additional turbulence. Changing the rotation speed of the ventilator generates low frequency turbulence.
The section models were mounted horizontally in the tunnel. By using end plates the flow around the section models is approximately 2-dimensional. Octagon cross section The octagon cross section is illustrated in figure 6. The Scruton number of the model is approx. 10, and the turbulence intensity of the air flow is approx. 7%.
The vortex-induced response is shown in figure 7 and 8, respectively, for the cross section without and with the guide vanes illustrated in figure 6. Guide vanes are seen to suppress the vortex-induced vibrations very effectively.
The aerodynamic damping parameter aK determined in the wind tunnel tests is approx. 0.5 and 1.64 for the cross section with and without the guiding vanes. The aerodynamic parameter cC has been estimated to be approx. 0.3% of aK . The measured value for aK of approx. 1.6 agrees well with the measurements shown in figure 1 for the octagon cross section, both measurements carried out in turbulent flow. L-shaped cross section The L-shaped cross section is illustrated in figure 9. Figures 10 and 11 show the results obtained in the wind tunnel tests carried out together with predictions based on the vortex-resonance model and the spectral model, respectively. The test conditions cover smooth flow and flow with turbulence intensity of approx. 10%.
The predictions calculated using the spectral model agree well with the measurements carried out. Such an agreement is not possible using the vortex-resonance model. Bridge cross section The bridge cross section considered is illustrated in figure 12. Figures 13 and 14 show the results obtained in the wind tunnel tests carried out together with predictions based on the vortex-resonance model and the spectral model, respectively. The test conditions cover smooth flow and flow with turbulence intensity of approx. 13%.
The predictions calculated using the spectral model agree well with the measurements carried out. Such an agreement is not possible using the vortex-resonance model. CONCLUSION Full-scale observations on many steel chimneys suggest that large and violent vortex-induced vibrations sometimes occur as rare, extreme events and that the frequent vortex-induced vibrations occur with much smaller amplitudes. It is essential that both aspects are included in design models for vortex shedding.
Eurocode 1 EN 1991-1-4:2005 proposes two approaches for predicting vortex-induced vibrations of structures. Approach 1 based on the vortex-resonance model provides response estimates, which are larger than the frequent events and lower than the rare events. Approach 2 based on the spectral model takes rare as well as frequent events into account by including the influence of turbulence in the vibration amplitudes predicted. This enables that approach 2 does not underestimate the rare event response nor overestimates the frequent event response.
Approach 2 of Eurocode 1 covers circular cylinders. This paper extends approach 2 also to cover different sharp-edged cross sections, and the presented design procedure may be used for general mode shapes having changing sign as well as constant sign. The influence of turbulence on the response is a basic part of the design procedure focused on.
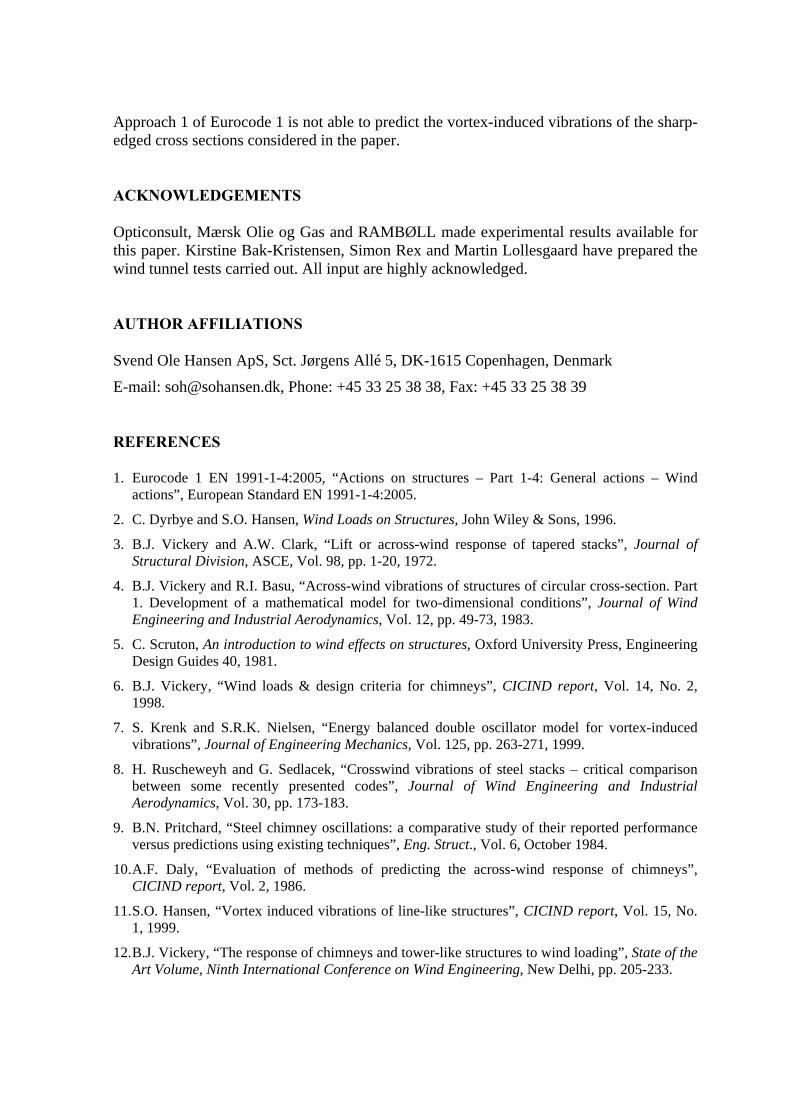
Approach 1 of Eurocode 1 is not able to predict the vortex-induced vibrations of the sharp-edged cross sections considered in the paper. ACKNOWLEDGEMENTS Opticonsult, Mærsk Olie og Gas and RAMBØLL made experimental results available for this paper. Kirstine Bak-Kristensen, Simon Rex and Martin Lollesgaard have prepared the wind tunnel tests carried out. All input are highly acknowledged. AUTHOR AFFILIATIONS Svend Ole Hansen ApS, Sct. Jørgens Allé 5, DK-1615 Copenhagen, Denmark
E-mail: [email protected], Phone: +45 33 25 38 38, Fax: +45 33 25 38 39 REFERENCES 1. Eurocode 1 EN 1991-1-4:2005, “Actions on structures – Part 1-4: General actions – Wind
actions”, European Standard EN 1991-1-4:2005.
2. C. Dyrbye and S.O. Hansen, Wind Loads on Structures, John Wiley & Sons, 1996.
3. B.J. Vickery and A.W. Clark, “Lift or across-wind response of tapered stacks”, Journal of Structural Division, ASCE, Vol. 98, pp. 1-20, 1972.
4. B.J. Vickery and R.I. Basu, “Across-wind vibrations of structures of circular cross-section. Part 1. Development of a mathematical model for two-dimensional conditions”, Journal of Wind Engineering and Industrial Aerodynamics, Vol. 12, pp. 49-73, 1983.
5. C. Scruton, An introduction to wind effects on structures, Oxford University Press, Engineering Design Guides 40, 1981.
6. B.J. Vickery, “Wind loads & design criteria for chimneys”, CICIND report, Vol. 14, No. 2, 1998.
7. S. Krenk and S.R.K. Nielsen, “Energy balanced double oscillator model for vortex-induced vibrations”, Journal of Engineering Mechanics, Vol. 125, pp. 263-271, 1999.
8. H. Ruscheweyh and G. Sedlacek, “Crosswind vibrations of steel stacks – critical comparison between some recently presented codes”, Journal of Wind Engineering and Industrial Aerodynamics, Vol. 30, pp. 173-183.
9. B.N. Pritchard, “Steel chimney oscillations: a comparative study of their reported performance versus predictions using existing techniques”, Eng. Struct., Vol. 6, October 1984.
10. A.F. Daly, “Evaluation of methods of predicting the across-wind response of chimneys”, CICIND report, Vol. 2, 1986.
11. S.O. Hansen, “Vortex induced vibrations of line-like structures”, CICIND report, Vol. 15, No. 1, 1999.
12. B.J. Vickery, “The response of chimneys and tower-like structures to wind loading”, State of the Art Volume, Ninth International Conference on Wind Engineering, New Delhi, pp. 205-233.
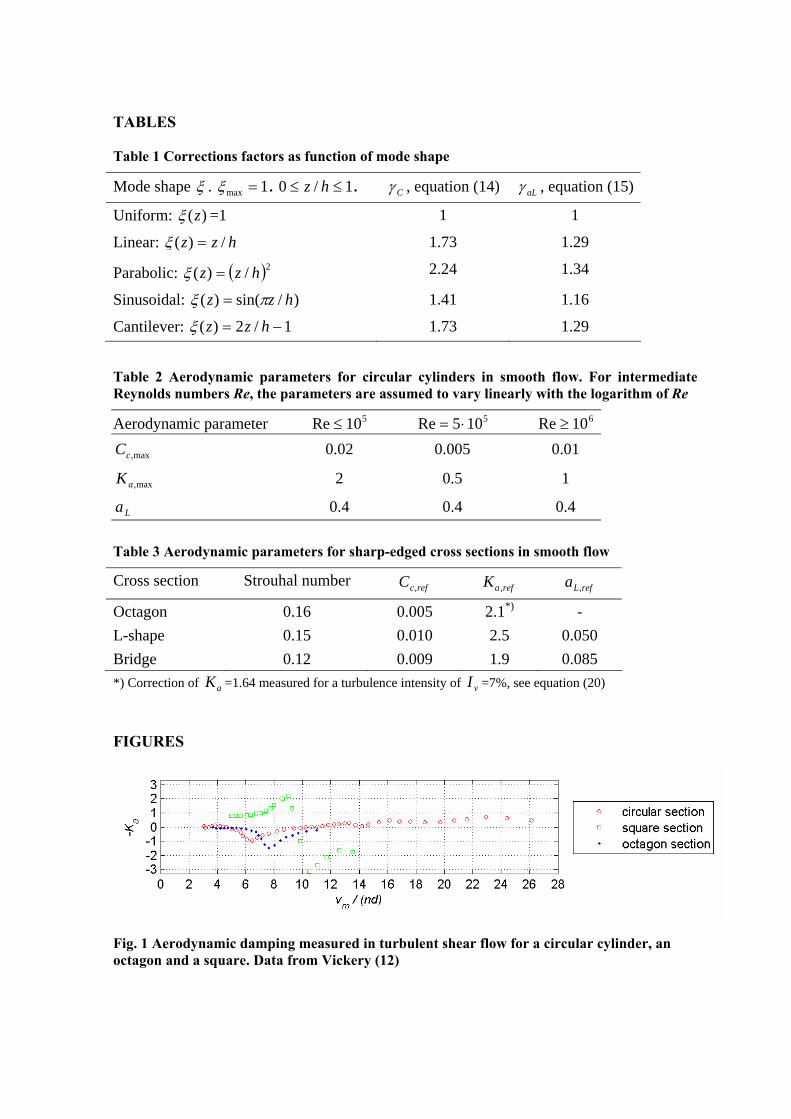
TABLES Table 1 Corrections factors as function of mode shape
Mode shape ξ . 1max =ξ . 1/0 ≤≤ hz . Cγ , equation (14) aLγ , equation (15)
Uniform: )(zξ =1 1 1
Linear: hzz /)( =ξ 1.73 1.29
Parabolic: ( )2/)( hzz =ξ 2.24 1.34
Sinusoidal: )/sin()( hzz πξ = 1.41 1.16
Cantilever: 1/2)( −= hzzξ 1.73 1.29 Table 2 Aerodynamic parameters for circular cylinders in smooth flow. For intermediate Reynolds numbers Re, the parameters are assumed to vary linearly with the logarithm of Re
Aerodynamic parameter Re ≤ 105 Re = ⋅5 105 Re ≥ 106
max,cC 0.02 0.005 0.01
max,aK 2 0.5 1
a L 0.4 0.4 0.4
Table 3 Aerodynamic parameters for sharp-edged cross sections in smooth flow
Cross section Strouhal number refcC , refaK , refLa ,
Octagon 0.16 0.005 2.1*) - L-shape 0.15 0.010 2.5 0.050 Bridge 0.12 0.009 1.9 0.085 *) Correction of aK =1.64 measured for a turbulence intensity of vI =7%, see equation (20)
FIGURES
Fig. 1 Aerodynamic damping measured in turbulent shear flow for a circular cylinder, an octagon and a square. Data from Vickery (12)
0 200 400 600Measuring time. [sec.]
ymax / d
-0.75
0
0.75
-0.75
0
0.75
-0.75
0
0.75vm ≈ 0.96 vr
vm ≈ vr
vm ≈ 1.05 vr
Fig. 2a-c Amplitude built-up after the cylinder has been released in low turbulence flow
Fig. 3 Inertia force per unit length, see equation (16)
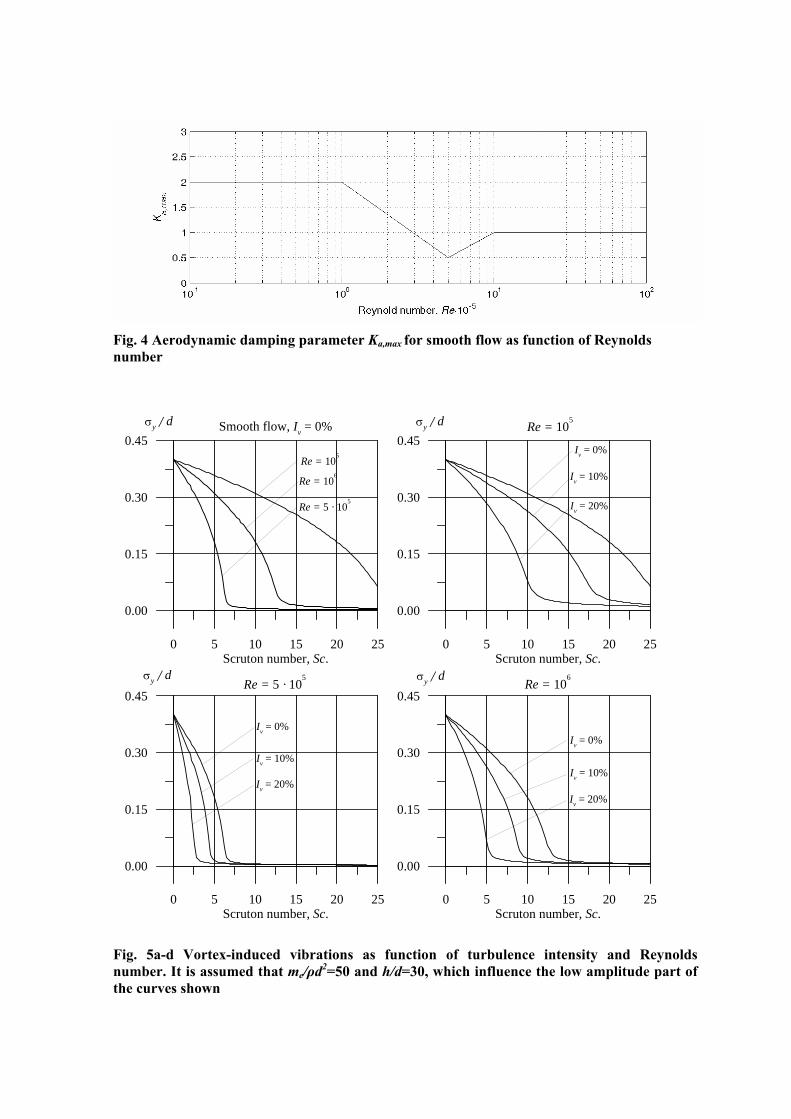
Fig. 4 Aerodynamic damping parameter Ka,max for smooth flow as function of Reynolds number
0 5 10 15 20 25Scruton number, Sc.
0.00
0.15
0.30
0.45σy / d
Re = 105
Re = 106
Re = 5 · 105
0 5 10 15 20 25Scruton number, Sc.
0.00
0.15
0.30
0.45σy / dSmooth flow, Iv = 0%
Iv = 0%
Re = 105
Iv = 10%
Iv = 20%
0 5 10 15 20 25Scruton number, Sc.
0.00
0.15
0.30
0.45Re = 10
6
0 5 10 15 20 25Scruton number, Sc.
0.00
0.15
0.30
0.45σy / d σy / dRe = 5 · 10
5
Iv = 0%
Iv = 10%
Iv = 20%
Iv = 0%
Iv = 10%
Iv = 20%
Fig. 5a-d Vortex-induced vibrations as function of turbulence intensity and Reynolds number. It is assumed that me/ρd2=50 and h/d=30, which influence the low amplitude part of the curves shown
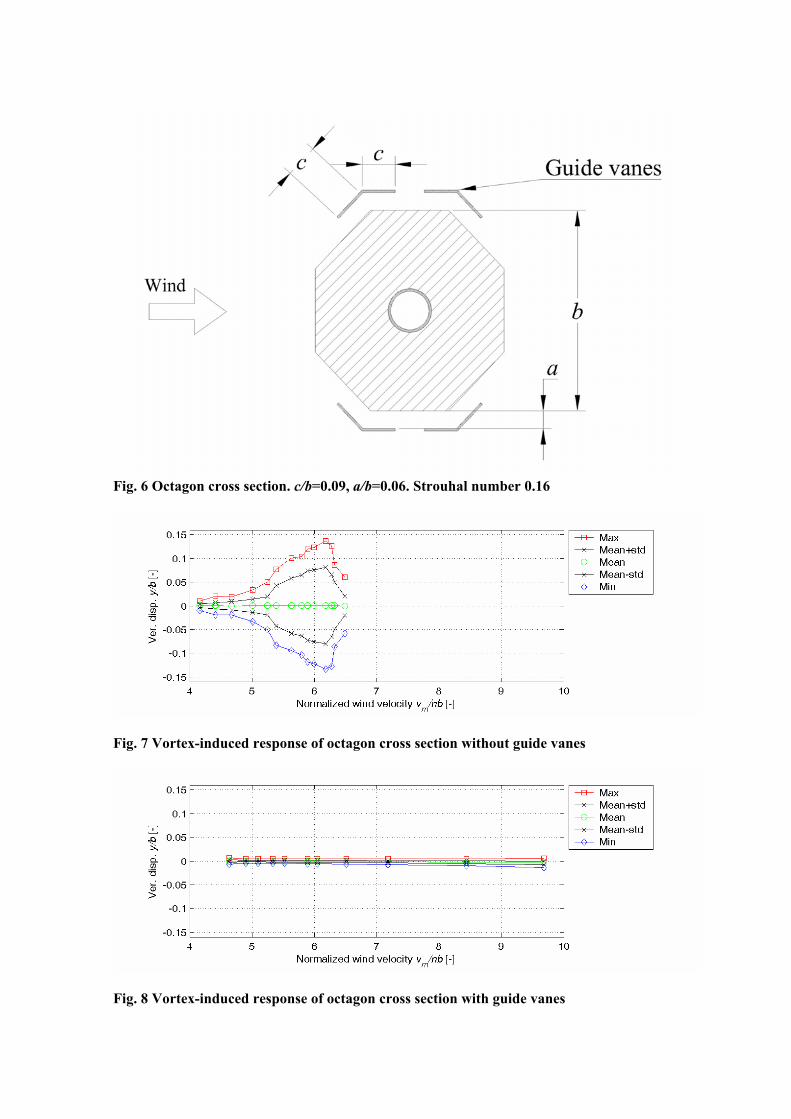
Fig. 6 Octagon cross section. c/b=0.09, a/b=0.06. Strouhal number 0.16
Fig. 7 Vortex-induced response of octagon cross section without guide vanes
Fig. 8 Vortex-induced response of octagon cross section with guide vanes
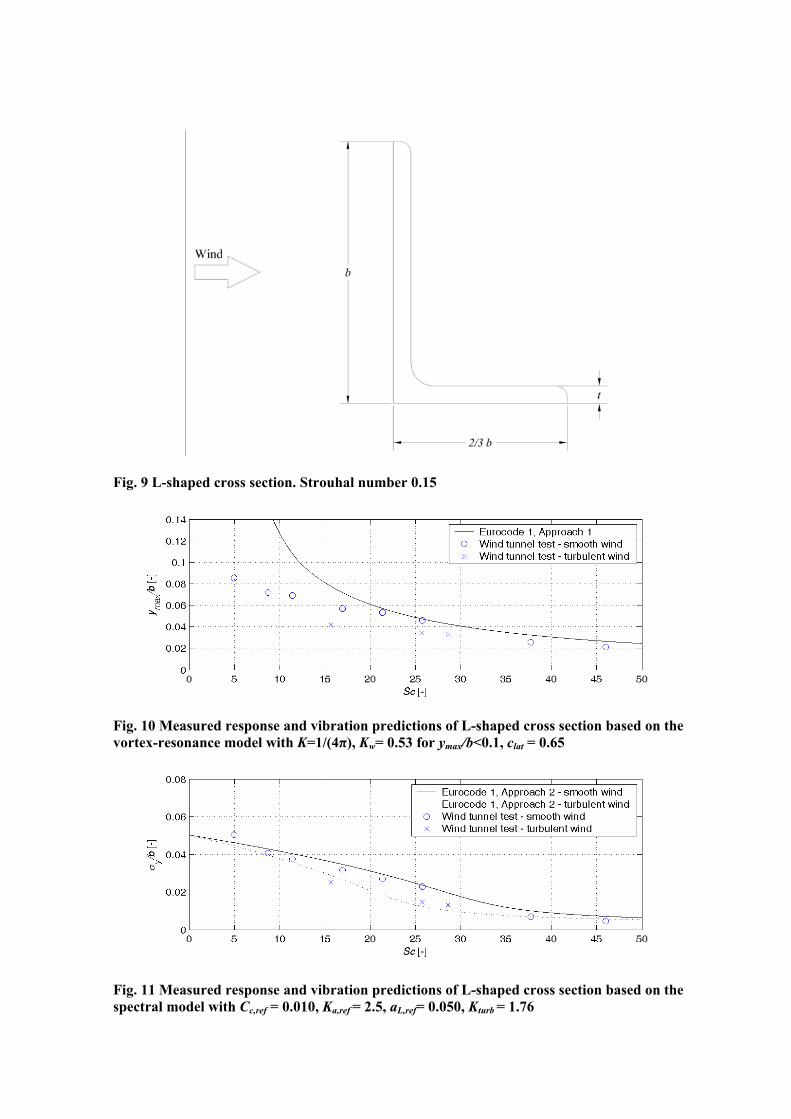
Fig. 9 L-shaped cross section. Strouhal number 0.15
Fig. 10 Measured response and vibration predictions of L-shaped cross section based on the vortex-resonance model with K=1/(4π), Kw= 0.53 for ymax/b<0.1, clat = 0.65
Fig. 11 Measured response and vibration predictions of L-shaped cross section based on the spectral model with Cc,ref = 0.010, Ka,ref = 2.5, aL,ref= 0.050, Kturb = 1.76
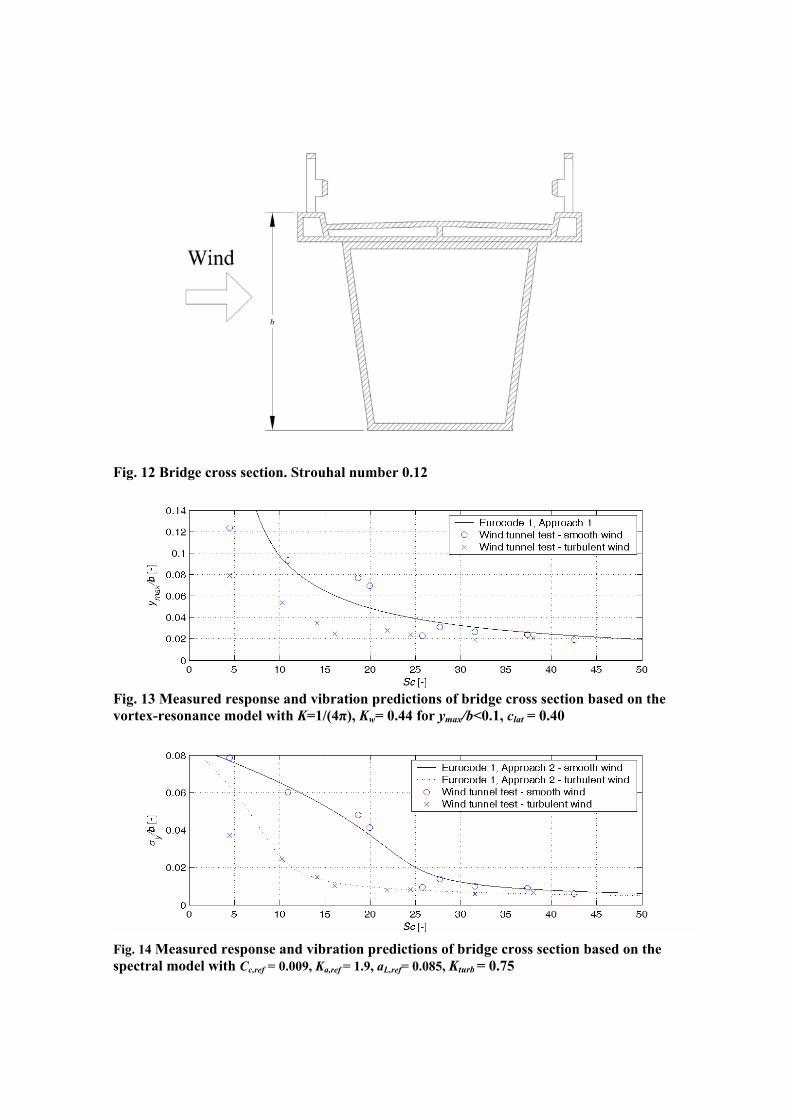
Fig. 12 Bridge cross section. Strouhal number 0.12
Fig. 13 Measured response and vibration predictions of bridge cross section based on the vortex-resonance model with K=1/(4π), Kw= 0.44 for ymax/b<0.1, clat = 0.40
Fig. 14 Measured response and vibration predictions of bridge cross section based on the spectral model with Cc,ref = 0.009, Ka,ref = 1.9, aL,ref= 0.085, Kturb = 0.75