Embed Size (px)
Citation preview
VOLVO CAR GROUP
INTERIM REPORT SECOND QUARTER 2016
i OF 24
Volvo Car GROUP interim report Second Quarter 2016
VOLVO CAR GROUP
INTERIM REPORT SECOND QUARTER 2016
2 OF 24
VOLVO CAR AB (PUBL.) (556810–8988)
INTERIM REPORT SECOND QUARTER 2016, GOTHENBURG JULY 19TH 2016
Volvo Car GROUP interim report second quarter 2016
SECOND QUARTER
• Volvo Cars retail sales at 135,972 (124,563) units
• Net revenue at MSEK 41,890 (41,564)
• Operating income (EBIT) of MSEK 2,447 (1,671)
• Net income of MSEK 1,715 (1,118)
• Cash flow from operating and investing activities of MSEK –2,852 (–56)
• MEUR 500 bond issued
• Start of production for S90 and V90
FIRST SIX MONTHS
• Volvo Cars retail sales at 256,563 (232,284) units
• Net revenue at MSEK 83,647 (75,215)
• Operating income (EBIT) of MSEK 5,592 (1,660)
• Net income of MSEK 3,784 (877)
• Cash flow from operating and investing activities of MSEK –3,175 (–1,044)
VOLVO CAR GROUP
INTERIM REPORT SECOND QUARTER 2016
3 OF 24
Key figuresQ2
2016Q2
2015
First six months
2016
First six months
2015Full year
2015
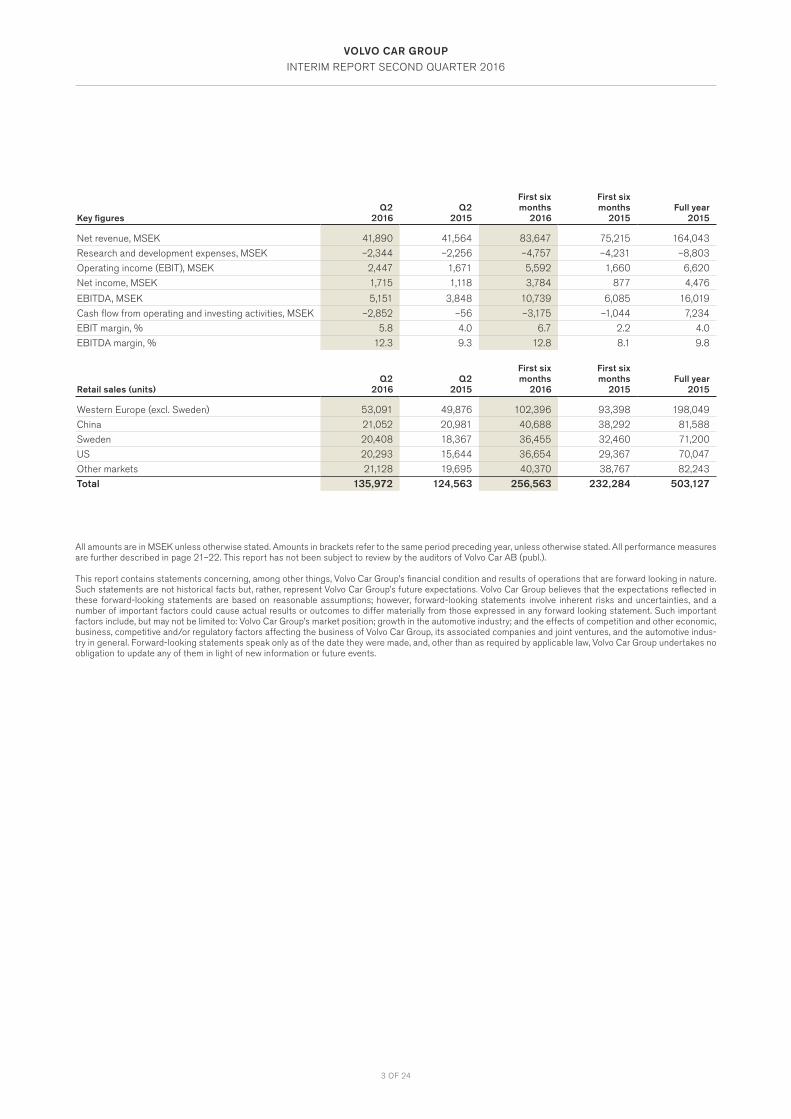
Net revenue, MSEK 41,890 41,564 83,647 75,215 164,043
Research and development expenses, MSEK –2,344 –2,256 –4,757 –4,231 –8,803
Operating income (EBIT), MSEK 2,447 1,671 5,592 1,660 6,620
Net income, MSEK 1,715 1,118 3,784 877 4,476
EBITDA, MSEK 5,151 3,848 10,739 6,085 16,019
Cash flow from operating and investing activities, MSEK –2,852 –56 –3,175 –1,044 7,234
EBIT margin, % 5.8 4.0 6.7 2.2 4.0
EBITDA margin, % 12.3 9.3 12.8 8.1 9.8
Retail sales (units)Q2
2016Q2
2015
First six months
2016
First six months
2015Full year
2015
Western Europe (excl. Sweden) 53,091 49,876 102,396 93,398 198,049
China 21,052 20,981 40,688 38,292 81,588
Sweden 20,408 18,367 36,455 32,460 71,200
US 20,293 15,644 36,654 29,367 70,047
Other markets 21,128 19,695 40,370 38,767 82,243
Total 135,972 124,563 256,563 232,284 503,127
All amounts are in MSEK unless otherwise stated. Amounts in brackets refer to the same period preceding year, unless otherwise stated. All performance measures are further described in page 21–22. This report has not been subject to review by the auditors of Volvo Car AB (publ.).
This report contains statements concerning, among other things, Volvo Car Group’s financial condition and results of operations that are forward looking in nature. Such statements are not historical facts but, rather, represent Volvo Car Group’s future expectations. Volvo Car Group believes that the expectations reflected in these forward-looking statements are based on reasonable assumptions; however, forward-looking statements involve inherent risks and uncertainties, and a number of important factors could cause actual results or outcomes to differ materially from those expressed in any forward looking statement. Such important factors include, but may not be limited to: Volvo Car Group’s market position; growth in the automotive industry; and the effects of competition and other economic, business, competitive and/or regulatory factors affecting the business of Volvo Car Group, its associated companies and joint ventures, and the automotive indus-try in general. Forward-looking statements speak only as of the date they were made, and, other than as required by applicable law, Volvo Car Group undertakes no obligation to update any of them in light of new information or future events.
4 OF 24
VOLVO CAR GROUP
INTERIM REPORT SECOND QUARTER 2016
VOLVO CAR GROUP
INTERIM REPORT SECOND QUARTER 2016
5 OF 24
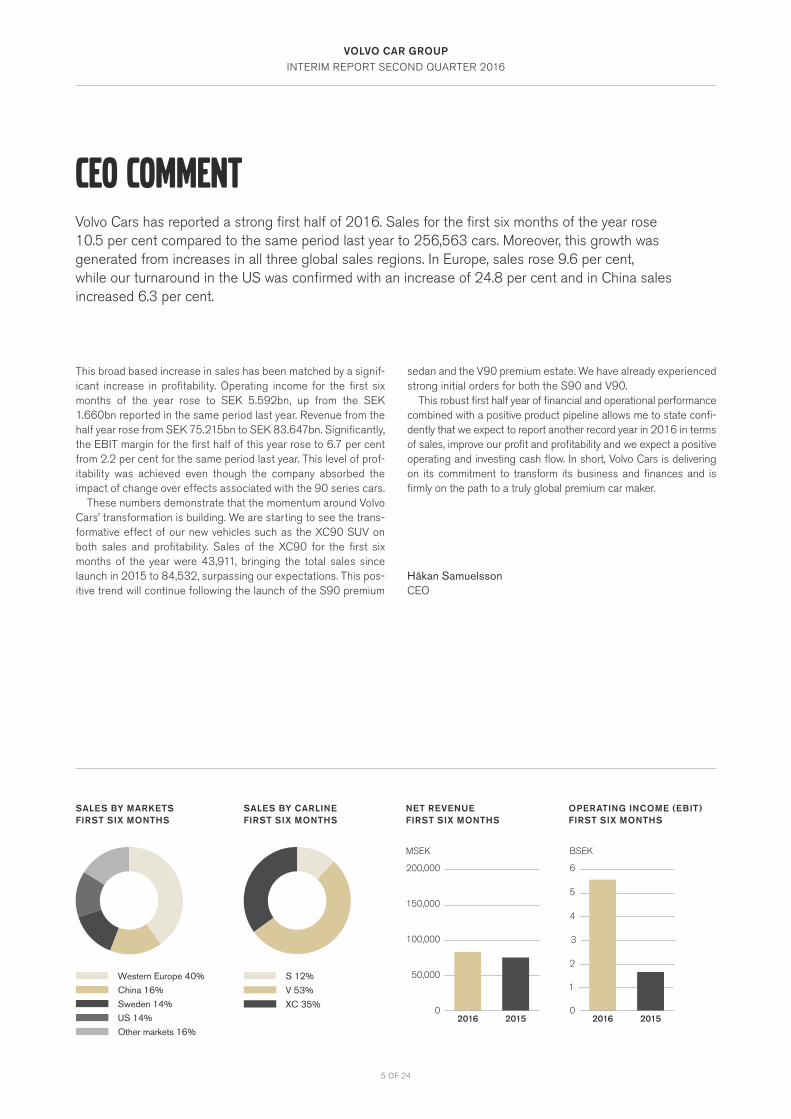
Volvo Cars has reported a strong first half of 2016. Sales for the first six months of the year rose 10.5 per cent compared to the same period last year to 256,563 cars. Moreover, this growth was generated from increases in all three global sales regions. In Europe, sales rose 9.6 per cent, while our turnaround in the US was confirmed with an increase of 24.8 per cent and in China sales increased 6.3 per cent.
This broad based increase in sales has been matched by a signif-icant increase in profitability. Operating income for the first six months of the year rose to SEK 5.592bn, up from the SEK 1.660bn reported in the same period last year. Revenue from the half year rose from SEK 75.215bn to SEK 83.647bn. Significantly, the EBIT margin for the first half of this year rose to 6.7 per cent from 2.2 per cent for the same period last year. This level of prof-itability was achieved even though the company absorbed the impact of change over effects associated with the 90 series cars.
These numbers demonstrate that the momentum around Volvo Cars’ transformation is building. We are starting to see the trans-formative effect of our new vehicles such as the XC90 SUV on both sales and profitability. Sales of the XC90 for the first six months of the year were 43,911, bringing the total sales since launch in 2015 to 84,532, surpassing our expectations. This pos-itive trend will continue following the launch of the S90 premium
sedan and the V90 premium estate. We have already experienced strong initial orders for both the S90 and V90.
This robust first half year of financial and operational performance combined with a positive product pipeline allows me to state confi-dently that we expect to report another record year in 2016 in terms of sales, improve our profit and profitability and we expect a positive operating and investing cash flow. In short, Volvo Cars is delivering on its commitment to transform its business and finances and is firmly on the path to a truly global premium car maker.
Håkan SamuelssonCEO
ceo COMMENT
SALES BY MARKETS FIRST SIX MONTHS
SALES BY CARLINE FIRST SIX MONTHS
Sweden 14%China 16%
Other markets 16%US 14%
Western Europe 40%
XC 35%
V 53%
S 12%
NET REVENUE FIRST SIX MONTHS
OPERATING INCOME (EBIT) FIRST SIX MONTHS
MSEK
200,000
150,000
100,000
50,000
02016 2015
Dolores XX% Lorem XX%
BSEK
6
5
4
2
0
3
1
2016 2015
Dolores XX% Lorem XX%
6 OF 24
VOLVO CAR GROUP
INTERIM REPORT SECOND QUARTER 2016
Volvo Car AB (publ.), with its registered office in Gothenburg, is 100 per cent owned by Geely Sweden Holdings AB, owned by Shanghai Geely Zhaoyuan International Investment Co., Ltd., reg-istered in Shanghai, China, with 100 per cent ownership held by Zhejiang Geely Holding Group Ltd., registered in Hangzhou, China.
PASSENGER CAR MARKE T DE VELOPMENT
Western EuropeCar sales in the first half of 2016 were supported by a general economic improvement in most European countries as well as a general need for fleet replacement. Western European passen-ger car sales continued to grow at a robust pace of 8 per cent. All major Western European markets generated growth, albeit cer-tain geographies enjoyed more moderate uplift e.g. the UK ahead of its EU referendum. In line with the overall industry trends, there remained an ongoing shift from traditional segments to SUV sales.
ChinaAfter turbulent market conditions in 2015, the passenger and commercial vehicle sales in China stabilised during the first six months and delivered a solid growth of 9 per cent, on the back of tax reductions on vehicles with engines smaller than 1.6L as well as better macroeconomic conditions than the previous year. The consumer shift to SUVs continued to be a theme in the market, with significant year-over-year sales increases.
Volvo Car AB (publ.) holds shares in its subsidiary Volvo Car Corporation and provides the Group with certain financing solu-tions. Volvo Car AB (publ.) indirectly, through Volvo Car Corpora-tion and its subsidiaries operates in the automotive industry with business relating to the design, development, manufacturing, marketing and sales of cars and thereto related services. Volvo Car Group and its global operations are referred to as “Volvo Cars”.
USAgainst an industry backdrop of six straight years of growth and record units sold in 2015, the first six months of 2016, US vehicle sales growth began to moderate with a growth of 4 per cent. Though sales growth may be slowing, the market still set record sales in the first six months of this year driven by macro trends of cheap petrol prices, low unemployment and low interest rates. There was also positivity in certain segments in the market, as demands for the crossover SUVs and light trucks remained robust.
Other MarketsMacroeconomic conditions in Russia continued to impact the light-vehicle market negatively during the first six months, while the Russian passenger vehicle market continued the downward trend by falling 14 per cent. The passenger car market in Japan also remained challenging with a decrease of 7 per cent. In the meanwhile, positive market conditions were present in several Eastern European markets, such as Poland and Czech Republic, where vehicle sales grew by 20 per cent and 18 per cent respec-tively.
The Volvo Car Group
Sales development
7 OF 24
VOLVO CAR GROUP
INTERIM REPORT SECOND QUARTER 2016
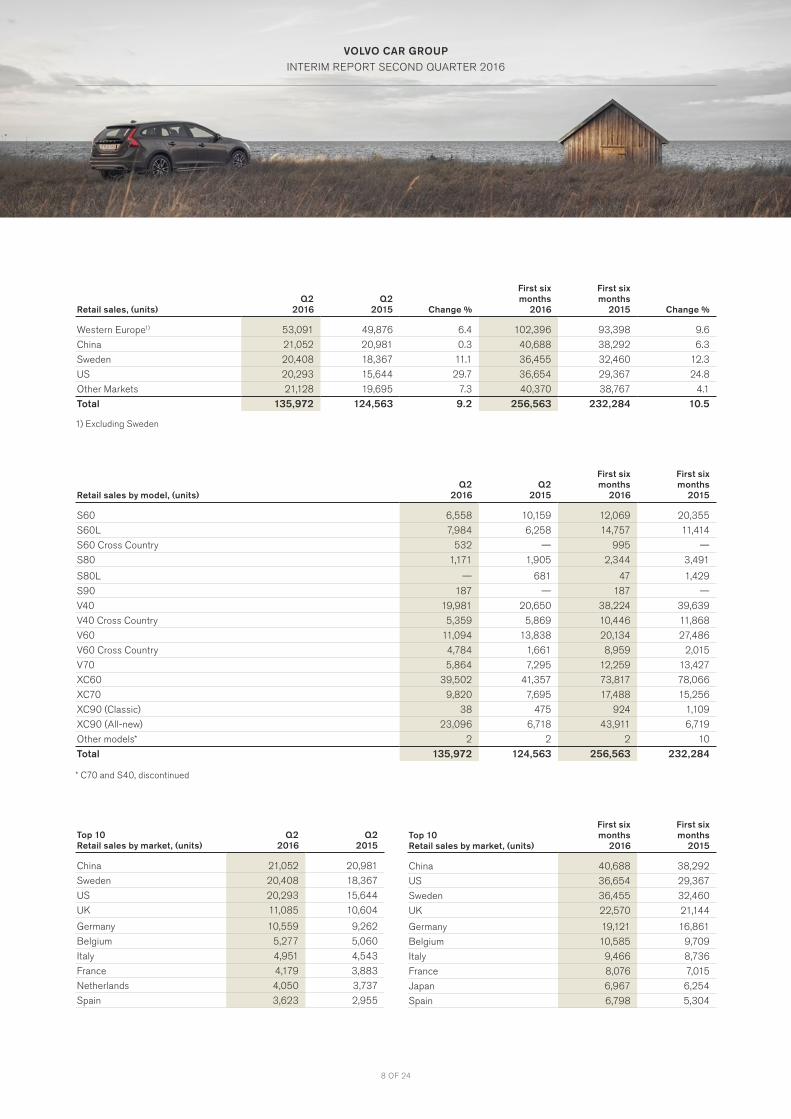
For the second quarter, Volvo Cars retail sales increased by 9.2 per cent to 135,972 (124,563) units, reflecting a positive trend for Volvo Cars across all regions. In particular, the US and Sweden both contributed to the overall positive sales performance with double-digit growth. The all-new XC90 drove the overall increase and reached sales of 23,096 (6,718) units.
Volvo Cars’ best-selling car in the second quarter was the XC60, with 39,502 (41,357) sold units. The second best-selling car line was the V40/V40 Cross Country where sales decreased slightly to 25,340 (26,519) units.
In the first six months, Volvo Cars reported retail sales of 256,563 (232,284) units, an increase of 10.5 per cent. All regions delivered positive sales growth and contributed to positive sales momentum. The sales increase was mainly driven by the all-new XC90 with 43,911 (6,719) units of the popular model sold world-wide.
During the first six months of 2016, the XC60 remained the most popular model with 73,817 (78,066) units sold. The second best-selling car line was the V40/V40 Cross Country with sales of 48,670 (51,507) units, followed by the all-new XC90.
Western EuropeFrom April to June, Volvo Cars continued its positive sales trend in Western Europe and reported retail sales of 53,091 (49,876) units, an increase of 6.4 per cent. Germany, Spain and France were the main drivers behind the positive development. With sales of 15,290 (17,067) units, the V40/V40 Cross Country remained the best-selling model, while volume growth was driven by 8,017 (3,168) sold units of the all-new XC90.
For the first half year, Western Europe delivered a 9.6 per cent increase in sales and reported retail sales of 102,396 (93,398) units. Key markets, including Germany, UK, Belgium and France all delivered solid growth. Spain also continued its strong growth at 28.2 per cent. The V40/V40 Cross Country remained the best-selling model in Western Europe with retail sales of 29,090 (33,064), while the all-new XC90 contributed to the overall solid performance with 15,542 (3,168) units.
ChinaVolvo Cars’ retail sales in China in the second quarter were up by 0.3 per cent and reached 21,052 (20,981) units. The locally-pro-duced S60L was the best-selling model, with 6,958 (6,258) units sold.
For the first half of 2016, China delivered solid growth of 6.3 per cent, selling 40,688 (38,292) units. The XC60 was the best-selling model with retail sales of 18,170 (18,292) units, fol-lowed by the S60L with 12,724 (11,414) sold units.
SwedenIn the second quarter, Volvo Cars’ retail sales in Sweden contin-ued to be strong with an increase of 11.1 per cent and a total sales of 20,408 (18,367) units. The most sold model was the XC70 with 5,207 (3,476) units, followed by the XC60 selling 4,091 (4,236) units.
During the first six months, sales in Sweden delivered a strong increase of 12.3 per cent and reached 36,455 (32,460) units. Volvo Cars therefore retained its market-leading position with a market share of 20 per cent. This strong sales performance con-tinues to be supported by the XC carlines in Volvo Cars’ home market. The XC carlines accounted for 47.6 per cent of the total sales and recorded an increase of 18.8 per cent to 17,359 (14,607) units.
USWith a sales increase of 29.7 per cent in the second quarter, Volvo Cars further strengthened its position in the competitive US market where a total number of 20,293 (15,644) units were sold. The all-new XC90 contributed with 8,170 (1,453) sold units, and was both the geography’s best-selling model and the main growth driver.
Over the course of the first half year, Volvo Cars continued its strong recovery in the US, with a substantial sales increase of 24.8 per cent to 36,654 (29,367) units. This positive trend was largely on the back of the all-new XC90, which contributed to the strong performance with 16,017 (1,453) sold units.
Other MarketsDuring the second quarter, other markets have continued to sta-bilise and early signs of recovery are bourne out as sales grew by 7.3 per cent, reaching 21,128 (19,695) units, driven by strong sales in Poland, Japan and Canada. The sales downward trend in Russia also started to stabilise.
For the first six months, a total number of 40,370 (38,767) units were delivered in Other Markets, which translated into growth of 4.1 per cent. The XC60 and the V40/V40 Cross Coun-try were the most popular models, while the all-new XC90 was the main growth driver selling 7,746 (1,072) units.
VOLVO CARS SALES DEVELOPMENT
8 OF 24
VOLVO CAR GROUP
INTERIM REPORT SECOND QUARTER 2016
Retail sales, (units)Q2
2016Q2
2015 Change %
First six months
2016
First six months
2015 Change %
Western Europe1) 53,091 49,876 6.4 102,396 93,398 9.6
China 21,052 20,981 0.3 40,688 38,292 6.3
Sweden 20,408 18,367 11.1 36,455 32,460 12.3
US 20,293 15,644 29.7 36,654 29,367 24.8
Other Markets 21,128 19,695 7.3 40,370 38,767 4.1
Total 135,972 124,563 9.2 256,563 232,284 10.5
1) Excluding Sweden
Retail sales by model, (units)Q2
2016Q2
2015
First six months
2016
First six months
2015
S60 6,558 10,159 12,069 20,355
S60L 7,984 6,258 14,757 11,414
S60 Cross Country 532 — 995 —
S80 1,171 1,905 2,344 3,491
S80L — 681 47 1,429
S90 187 — 187 —
V40 19,981 20,650 38,224 39,639
V40 Cross Country 5,359 5,869 10,446 11,868
V60 11,094 13,838 20,134 27,486
V60 Cross Country 4,784 1,661 8,959 2,015
V70 5,864 7,295 12,259 13,427
XC60 39,502 41,357 73,817 78,066
XC70 9,820 7,695 17,488 15,256
XC90 (Classic) 38 475 924 1,109
XC90 (All-new) 23,096 6,718 43,911 6,719
Other models* 2 2 2 10
Total 135,972 124,563 256,563 232,284
* C70 and S40, discontinued
Top 10Retail sales by market, (units)
Q2 2016
Q2 2015
China 21,052 20,981
Sweden 20,408 18,367
US 20,293 15,644
UK 11,085 10,604
Germany 10,559 9,262
Belgium 5,277 5,060
Italy 4,951 4,543
France 4,179 3,883
Netherlands 4,050 3,737
Spain 3,623 2,955
Top 10Retail sales by market, (units)
First six months
2016
First six months
2015
China 40,688 38,292
US 36,654 29,367
Sweden 36,455 32,460
UK 22,570 21,144
Germany 19,121 16,861
Belgium 10,585 9,709
Italy 9,466 8,736
France 8,076 7,015
Japan 6,967 6,254
Spain 6,798 5,304
9 OF 24
VOLVO CAR GROUP
INTERIM REPORT SECOND QUARTER 2016
Production start of S90 and V90During the second quarter, production of the new S90 premium sedan and the new V90 premium estate started in the Torslanda plant, Sweden. This means that all new models in the top-of-the-line 90 series, based on Volvo’s in-house developed modular vehi-cle architecture SPA, are now being produced.
Bond issuanceAs of May 18, 2016 Volvo Volvo Car AB (publ.) closed the issuance of a MEUR 500 bond, which is the Group’s debut bond issuance. The senior unsecured notes issued mature as of May 2021 and carry a fixed coupon rate of 3.25 per cent. The bond issue was conducted for general corporate purposes and is aimed at increas-ing the company’s financial flexibility and diversifying its funding sources. The bond has been listed on the Euro MTF list on the Luxembourg stock exchange (Société de la bourse de Luxem-bourg).
Credit ratingIn connection to the bond issue, Volvo Cars now also have a public credit rating from Moody’s Investors Service, Inc. and Standard & Poor’s Financial Services LLC.
Summary of first quarter:• Betsy Atkins was appointed new member of the Board of
Directors• Launch of S90 and V90
SIGNIF ICANT E VENTS AF TER THE REPORTING PERIODNo significant events have occurred after the reporting period.
SIGNIF ICANT E VENTS PARENT COMPANYThe parent company conducts no operations and has no employ-ees. In connection with the bond issuance the parent company changed its legal form to a public entity (refer to Significant events – Bond issuance). The income statements and balance sheets for the Parent Company are presented on page 18. EMPLOYEE SDuring the second quarter 2016, Volvo Car Group employed on average 29,180 (27,891) full-time employees. Furthermore, the Group employed on average 3,833 (3,622) consultants during the second quarter. The increased number of consultants and employees are mainly related to higher production volumes and the continuous development of future car models.
RISKS AND UNCERTAINT Y FACTORSRisks are a natural element in all business activities. In order to achieve Volvo Cars’ short- and long-term objectives, enterprise risk management is part of the daily activities at Volvo Cars. For a more in-depth analysis of risks, see the Volvo Car Group Annual Report 2015 page 53.
On June 23, 2016 a referendum in the United Kingdom returned a result in favor of leaving the European Union (com-monly referred to as ‘Brexit’). Volvo Cars has evaluated the risks and uncertainty factors and sees limited volume and revenue implications. However, currency volatility could increase and there is also additional uncertainty around European economic growth.
Other than that, no significant changes have been assessed.
10 OF 24
Income Statement (MSEK)Q2
2016Q2
2015
Net revenue 41,890 41,564
Gross income 8,889 9,470
Operating income (EBIT) 2,447 1,671
Income before tax 2,148 1,285
Net income 1,715 1,118
VOLVO CAR GROUP
INTERIM REPORT SECOND QUARTER 2016
During the second quarter, Volvo Car Group generated net reve-nue of MSEK 41,890 (41,564) which is flat compared to the same period in 2015. The increase from the positive sales mix, mainly due to the all-new XC90, was partly offset by negative exchange rate development.
Cost of sales increased by MSEK 907 to MSEK –33,001 (–32,094) an increase of 2.8 per cent compared to the same period in 2015. This increase is attributable to the sales mix, resulting in increased material costs, and change over effects such as launch costs related to start of production of the new S90 and V90. Gross income decreased to MSEK 8,889 (9,470).
Research and development expenses recognised in the income statement increased to MSEK 2,344 (2,256), including amortisa-tion of capitalised development expenses of MSEK –777 (–606). The increase is related to higher amortisation of capitalised development expenses and increased costs for upcoming car models. See table below.
Selling expenses increased by MSEK –364 to MSEK –3,032 (–2,668) primarily due to increased marketing and event expenses related to the launch of new car models and advertising cam-paigns.
Administrative expenses decreased by MSEK 240 to MSEK –1,572 (–1,812).
Other operating income and expense, net, increased to MSEK 422 (–1,097). The increase is mainly related to a positive result from realised cash flow hedges.
Operating income (EBIT) increased to MSEK 2,447 (1,671), resulting in an operating margin of 5.8 (4.0) per cent.
Net financial items amounted to MSEK –299 (–386). This increase was primarily due to a positive net foreign exchange result on financing activities.
Tax expense increased based on the increase in income before tax. Net income amounted to MSEK 1,715 (1,118).
Financial summarySECOND QUARTER – INCOME AND RE SULT The comparative figures refer to the consolidated income statement of second quarter 2015 if not otherwise stated.
R&D spending (MSEK)Q2
2016Q2
2015
Capitalised development expenses 1,678 1,158
Research and development expenses –2,344 –2,256
whereof amortised development expenses –777 –606
11 OF 24
VOLVO CAR GROUP
INTERIM REPORT SECOND QUARTER 2016
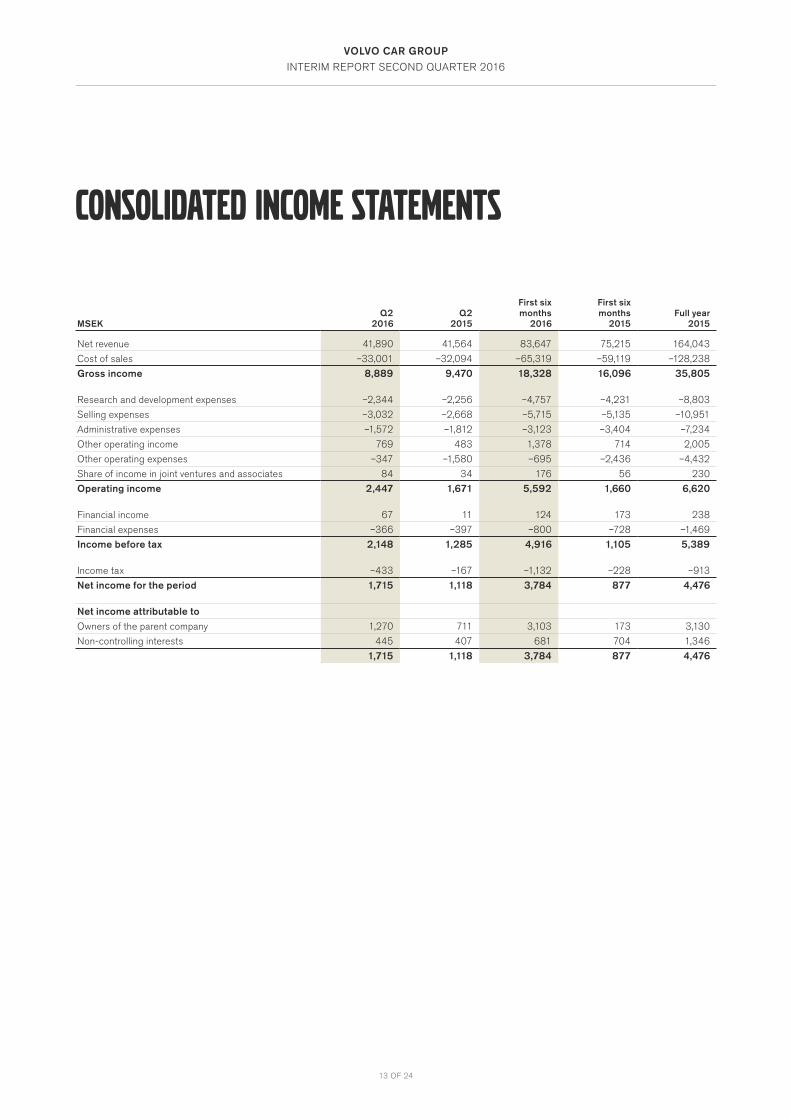
During January to June 2016, Volvo Car Group generated net revenue of MSEK 83,647 (75,215), an increase of 11.2 per cent compared to the same period in 2015. The increase was primarily driven by volume and a positive sales mix, mainly due to the all-new XC90 partly offset by negative exchange rate development.
Cost of sales increased by MSEK 6,200 to MSEK –65,319 (–59,119) an increase of 10.5 per cent compared to the same period in 2015. This increase is primarily attributable to the sales mix, resulting in increased material costs. Gross income increased to MSEK 18,328 (16,096), resulting in a gross margin of 21.9 (21.4) per cent.
Research and development expenses recognised in the income statement increased to MSEK –4,757 (–4,231), including amorti-sation of capitalised development expenses of MSEK –1,420 (–1,073). The increase is related to higher amortisation of capital-ised development expenses and increased costs for upcoming car models. See table below.
Selling expenses increased by MSEK 580 to MSEK –5,715 (–5,135) primarily due to increased marketing and event expenses related to the launch of new car models and advertising cam-paigns.
Administrative expenses decreased by MSEK 281 to MSEK –3,123 (–3,404).
Other operating income and expense, net, increased to MSEK 683 (–1,722). The increase is mainly related to a positive result from realised cash flow hedges and income from collaborations with related parties regarding common development activities.
Operating income (EBIT) increased to MSEK 5,592 (1,660), resulting in an operating margin of 6.7 (2.2) per cent.
Net financial items amounted to MSEK –676 (–555). This decrease was due to a negative net foreign exchange result on financing activities.
Tax expense increased based on the increase in income before tax. Net income amounted to MSEK 3,784 (877).
FIRST SIX MONTHS – INCOME AND RE SULT The comparative figures refer to the consolidated income statement of the first six months 2015 if not otherwise stated.
R&D spending (MSEK)
First six months
2016
First six months
2015
Capitalised development expenses 2,836 2,218
Research and development expenses –4,757 –4,231
whereof amortised development expenses –1,420 –1,073
Income Statement (MSEK)
First six months
2016
First six months
2015
Net revenue 83,647 75,215
Gross income 18,328 16,096
Operating income (EBIT) 5,592 1,660
Income before tax 4,916 1,105
Net income 3,784 877
12 OF 24
VOLVO CAR GROUP
INTERIM REPORT SECOND QUARTER 2016
FIRST SIX MONTHS – NE T F INANCIAL POSITION AND L IQUIDIT Y The comparative figures for the cash flow items refer to the consolidated cash flow statement of first half year 2015 if not otherwise stated. The comparative figures for the balance sheet items refer to the consolidated balance sheets of December 31, 2015 if not other-wise stated.
For the first half year, cash flow from operating and investing activities amounted to MSEK –3,175 (–1,044).
Cash flow from operating activities amounted to MSEK 4,613 (7,745). The improved operating income is offset by a negative development in working capital, which is mainly related to increased accounts receivables and inventories, due to produc-tion related seasonality and sales mix. Accounts payables is slightly positive, however negatively influenced by change over effects. Furthermore, there is a negative impact from decreased VAT liabilities.
Cash flow from investing activities amounted to MSEK –7,788 (–8,789). Investments in tangible assets amounted to MSEK –5,030 (–4,487) and is primarily due to assets under construction related to the ongoing construction of the US plant, as well as preparation for production of the new S90 in China. Investments in tangible assets also includes special tool investments related to new car models based on the SPA platform, such as the new
S90 and V90. Investments in intangible assets amounted to MSEK –2,938 (–2,351) and includes investments in upcoming new car models.
Cash flow from financing activities amounted to MSEK 222 (4,878) and is mainly attributable to proceeds from the new bond loan of MSEK 4,619, offset by repayment of liabilities to credit institutions which amounted to MSEK 3,985.
Cash and cash equivalents including marketable securities decreased to MSEK 27,230 (29,135). The revolving credit facility of MEUR 660 remains undrawn. Net debt/net cash decreased to MSEK –4,622 (–7,721).
Total equity increased by MSEK 2,671 to MSEK 37,306 (34,635), resulting in an equity ratio of 26.4 (26.2) per cent. The change in equity was mainly related to the positive net income for the period of MSEK 3,784 mainly offset by negative effects related to remeasurement of post-employment benefits of MSEK –829, due to a decrease in discount rates.
Cash flow Statement (MSEK)
First six months
2016
First six months
2015
Cash flow from operating activities 4,613 7,745
Cash flow from investing activities –7,788 –8,789
Cash flow from operating and investing activities –3,175 –1,044
Cash flow from financing activities 222 4,878
Cash flow for the period –2,953 3,834
Performance measures June 30,
2016Dec 31,
2015
Net debt (Net cash if negative) (MSEK) –4,622 –7,721
Equity ratio (%) 26.4 26.2
VOLVO CAR GROUP
INTERIM REPORT SECOND QUARTER 2016
13 OF 24
CONSOLIDATED INCOME STATEMENTS
MSEKQ2
2016Q2
2015
First six months
2016
First six months
2015Full year
2015
Net revenue 41,890 41,564 83,647 75,215 164,043
Cost of sales –33,001 –32,094 –65,319 –59,119 –128,238
Gross income 8,889 9,470 18,328 16,096 35,805
Research and development expenses –2,344 –2,256 –4,757 –4,231 –8,803
Selling expenses –3,032 –2,668 –5,715 –5,135 –10,951
Administrative expenses –1,572 –1,812 –3,123 –3,404 –7,234
Other operating income 769 483 1,378 714 2,005
Other operating expenses –347 –1,580 –695 –2,436 –4,432
Share of income in joint ventures and associates 84 34 176 56 230
Operating income 2,447 1,671 5,592 1,660 6,620
Financial income 67 11 124 173 238
Financial expenses –366 –397 –800 –728 –1,469
Income before tax 2,148 1,285 4,916 1,105 5,389
Income tax –433 –167 –1,132 –228 –913
Net income for the period 1,715 1,118 3,784 877 4,476
Net income attributable toOwners of the parent company 1,270 711 3,103 173 3,130
Non-controlling interests 445 407 681 704 1,346
1,715 1,118 3,784 877 4,476
VOLVO CAR GROUP
INTERIM REPORT SECOND QUARTER 2016
14 OF 24
CONSOLIDATED COMPREHENSIVE INCOME
MSEKQ2
2016Q2
2015
First six months
2016
First six months
2015Full year
2015
Net income for the period 1,715 1,118 3,784 877 4,476
Other comprehensive income, net of income taxItems that will not be reclassified subsequently to income statement:Remeasurements of provisions for post-employment benefits –369 2,061 –829 1,051 1,321
Items that may be reclassified subsequently to income statement:Translation difference on foreign operations 346 –402 260 150 –175
Translation difference of hedge instruments of net investments in foreign operations –66 22 –83 87 100
Change in cash flow hedge –1,486 1,259 –461 326 1,617
Other comprehensive income, net of income tax –1,575 2,940 –1,113 1,614 2,863Total comprehensive income for the period 140 4,058 2,671 2,491 7,339
Total comprehensive income attributable toOwners of the parent company –340 3,751 2,025 1,708 6,005
Non-controlling interests 480 307 646 783 1,334
140 4,058 2,671 2,491 7,339
VOLVO CAR GROUP
INTERIM REPORT SECOND QUARTER 2016
15 OF 24
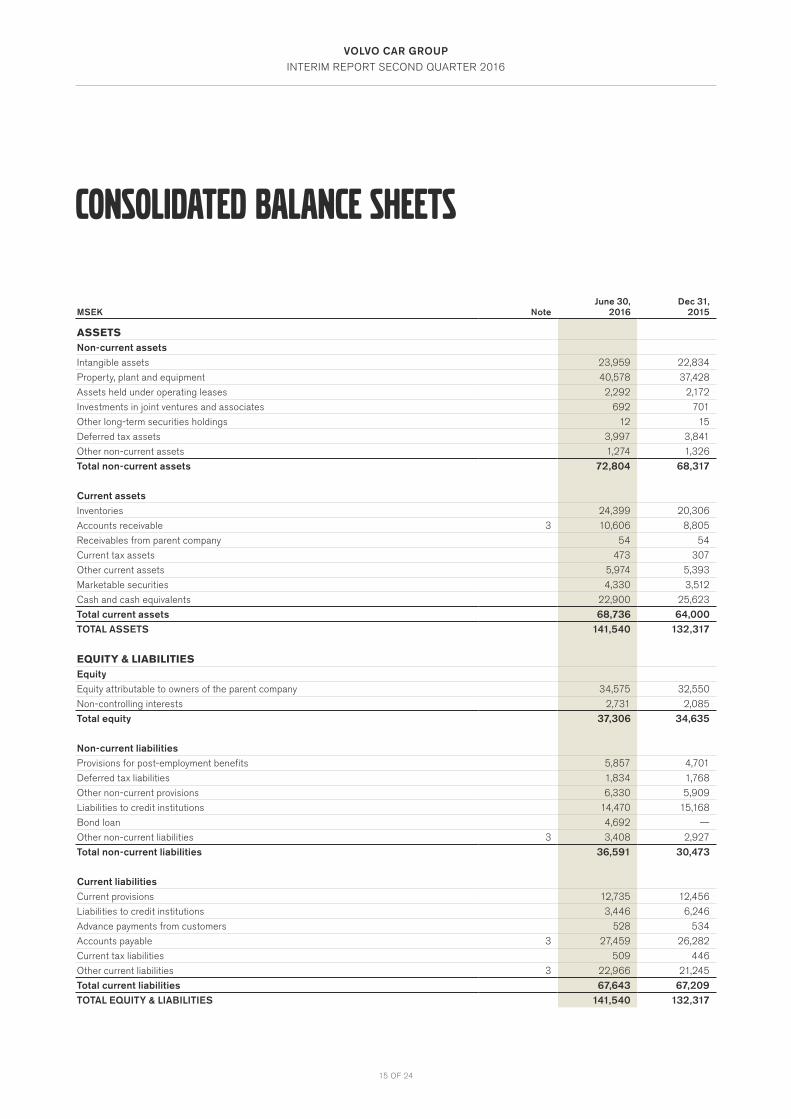
CONSOLIDATED BALANCE SHEETS
MSEK NoteJune 30,
2016Dec 31,
2015
ASSETSNon-current assetsIntangible assets 23,959 22,834
Property, plant and equipment 40,578 37,428
Assets held under operating leases 2,292 2,172
Investments in joint ventures and associates 692 701
Other long-term securities holdings 12 15
Deferred tax assets 3,997 3,841
Other non-current assets 1,274 1,326
Total non-current assets 72,804 68,317
Current assetsInventories 24,399 20,306
Accounts receivable 3 10,606 8,805
Receivables from parent company 54 54
Current tax assets 473 307
Other current assets 5,974 5,393
Marketable securities 4,330 3,512
Cash and cash equivalents 22,900 25,623
Total current assets 68,736 64,000TOTAL ASSETS 141,540 132,317
EQUITY & LIABILITIESEquityEquity attributable to owners of the parent company 34,575 32,550
Non-controlling interests 2,731 2,085
Total equity 37,306 34,635
Non-current liabilitiesProvisions for post-employment benefits 5,857 4,701
Deferred tax liabilities 1,834 1,768
Other non-current provisions 6,330 5,909
Liabilities to credit institutions 14,470 15,168
Bond loan 4,692 —
Other non-current liabilities 3 3,408 2,927
Total non-current liabilities 36,591 30,473
Current liabilitiesCurrent provisions 12,735 12,456
Liabilities to credit institutions 3,446 6,246
Advance payments from customers 528 534
Accounts payable 3 27,459 26,282
Current tax liabilities 509 446
Other current liabilities 3 22,966 21,245
Total current liabilities 67,643 67,209TOTAL EQUITY & LIABILITIES 141,540 132,317
VOLVO CAR GROUP
INTERIM REPORT SECOND QUARTER 2016
16 OF 24
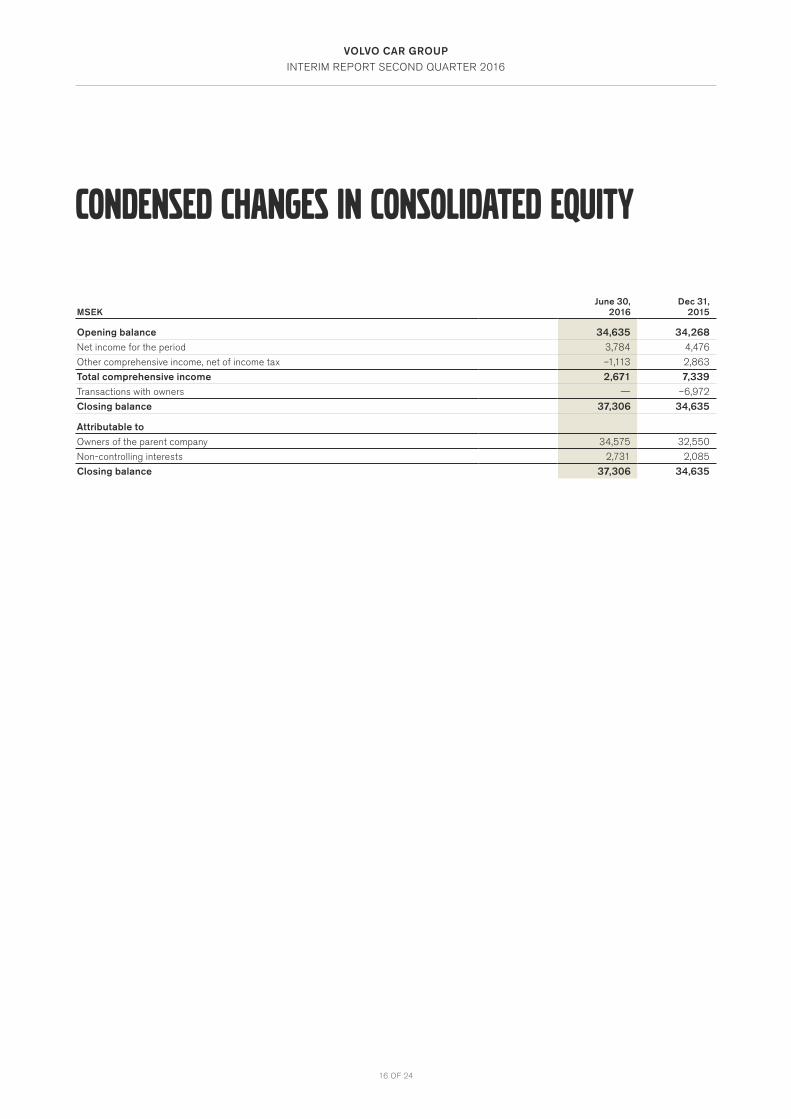
CONDENSED CHANGES IN CONSOLIDATED EQUITY
MSEKJune 30,
2016Dec 31,
2015
Opening balance 34,635 34,268Net income for the period 3,784 4,476
Other comprehensive income, net of income tax –1,113 2,863
Total comprehensive income 2,671 7,339Transactions with owners — –6,972
Closing balance 37,306 34,635
Attributable to Owners of the parent company 34,575 32,550
Non-controlling interests 2,731 2,085
Closing balance 37,306 34,635
VOLVO CAR GROUP
INTERIM REPORT SECOND QUARTER 2016
17 OF 24
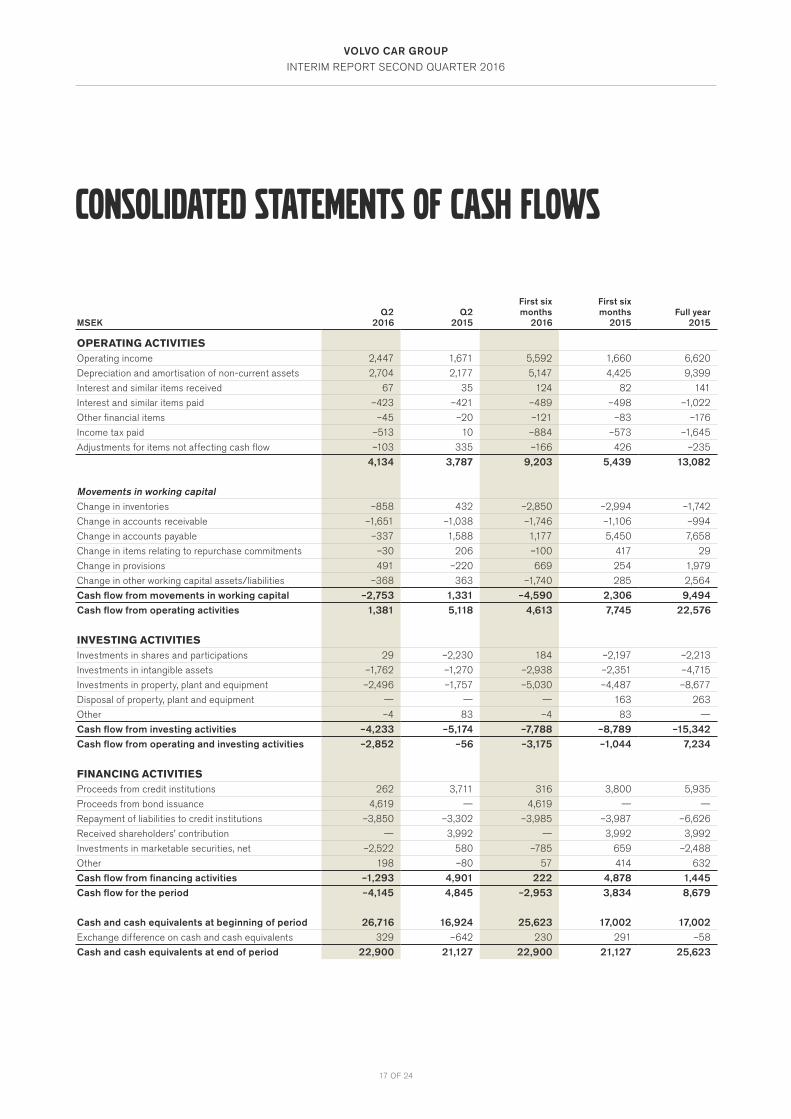
CONSOLIDATED STATEMENTS OF CASH FLOWS
MSEKQ2
2016Q2
2015
First six months
2016
First six months
2015Full year
2015
OPERATING ACTIVITIESOperating income 2,447 1,671 5,592 1,660 6,620
Depreciation and amortisation of non-current assets 2,704 2,177 5,147 4,425 9,399
Interest and similar items received 67 35 124 82 141
Interest and similar items paid –423 –421 –489 –498 –1,022
Other financial items –45 –20 –121 –83 –176
Income tax paid –513 10 –884 –573 –1,645
Adjustments for items not affecting cash flow –103 335 –166 426 –235
4,134 3,787 9,203 5,439 13,082
Movements in working capitalChange in inventories –858 432 –2,850 –2,994 –1,742
Change in accounts receivable –1,651 –1,038 –1,746 –1,106 –994
Change in accounts payable –337 1,588 1,177 5,450 7,658
Change in items relating to repurchase commitments –30 206 –100 417 29
Change in provisions 491 –220 669 254 1,979
Change in other working capital assets/liabilities –368 363 –1,740 285 2,564
Cash flow from movements in working capital –2,753 1,331 –4,590 2,306 9,494Cash flow from operating activities 1,381 5,118 4,613 7,745 22,576
INVESTING ACTIVITIESInvestments in shares and participations 29 –2,230 184 –2,197 –2,213
Investments in intangible assets –1,762 –1,270 –2,938 –2,351 –4,715
Investments in property, plant and equipment –2,496 –1,757 –5,030 –4,487 –8,677
Disposal of property, plant and equipment — — — 163 263
Other –4 83 –4 83 —
Cash flow from investing activities –4,233 –5,174 –7,788 –8,789 –15,342Cash flow from operating and investing activities –2,852 –56 –3,175 –1,044 7,234
FINANCING ACTIVITIESProceeds from credit institutions 262 3,711 316 3,800 5,935
Proceeds from bond issuance 4,619 — 4,619 — —
Repayment of liabilities to credit institutions –3,850 –3,302 –3,985 –3,987 –6,626
Received shareholders’ contribution — 3,992 — 3,992 3,992
Investments in marketable securities, net –2,522 580 –785 659 –2,488
Other 198 –80 57 414 632
Cash flow from financing activities –1,293 4,901 222 4,878 1,445Cash flow for the period –4,145 4,845 –2,953 3,834 8,679
Cash and cash equivalents at beginning of period 26,716 16,924 25,623 17,002 17,002Exchange difference on cash and cash equivalents 329 –642 230 291 –58
Cash and cash equivalents at end of period 22,900 21,127 22,900 21,127 25,623
VOLVO CAR GROUP
INTERIM REPORT SECOND QUARTER 2016
18 OF 24
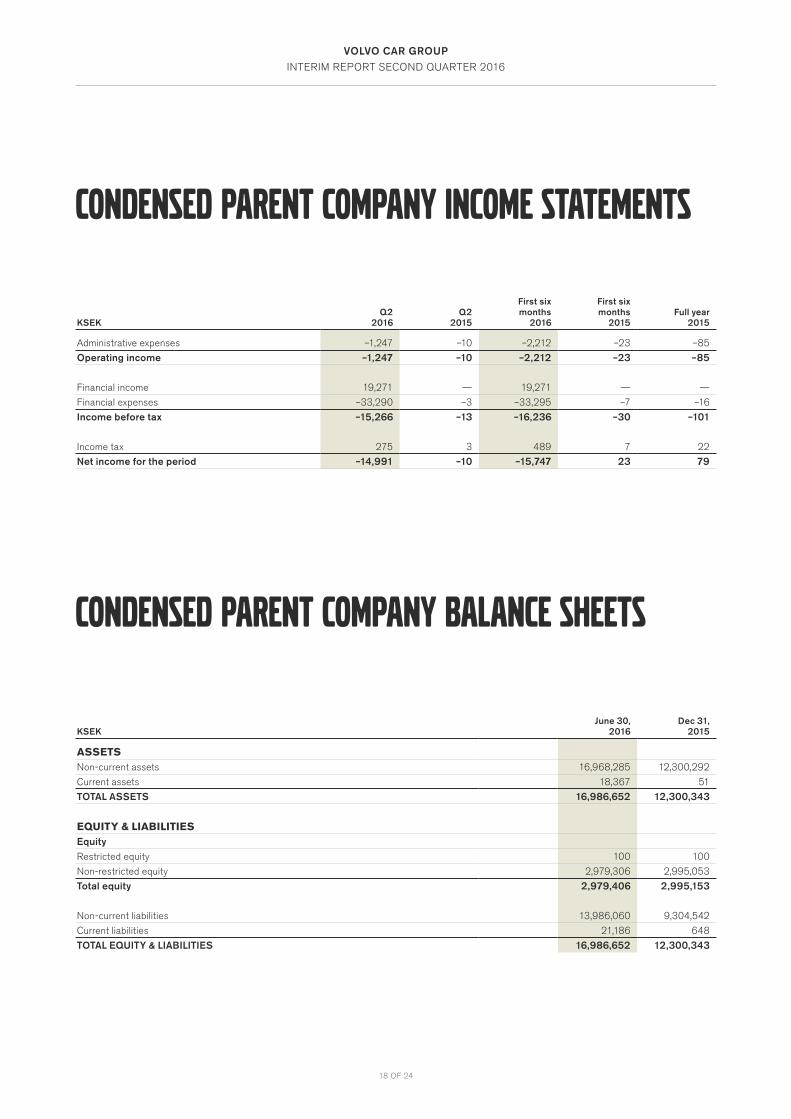
CONDENSED PARENT COMPANY INCOME STATEMENTS
CONDENSED PARENT COMPANY BALANCE SHEETS
KSEKQ2
2016Q2
2015
First six months
2016
First six months
2015Full year
2015
Administrative expenses –1,247 –10 –2,212 –23 –85
Operating income –1,247 –10 –2,212 –23 –85
Financial income 19,271 — 19,271 — —
Financial expenses –33,290 –3 –33,295 –7 –16
Income before tax –15,266 –13 –16,236 –30 –101
Income tax 275 3 489 7 22
Net income for the period –14,991 –10 –15,747 23 79
KSEK June 30,
2016Dec 31,
2015
ASSETSNon-current assets 16,968,285 12,300,292
Current assets 18,367 51
TOTAL ASSETS 16,986,652 12,300,343
EQUITY & LIABILITIESEquityRestricted equity 100 100
Non-restricted equity 2,979,306 2,995,053
Total equity 2,979,406 2,995,153
Non-current liabilities 13,986,060 9,304,542
Current liabilities 21,186 648
TOTAL EQUITY & LIABILITIES 16,986,652 12,300,343
19 OF 24
VOLVO CAR GROUP
INTERIM REPORT SECOND QUARTER 2016
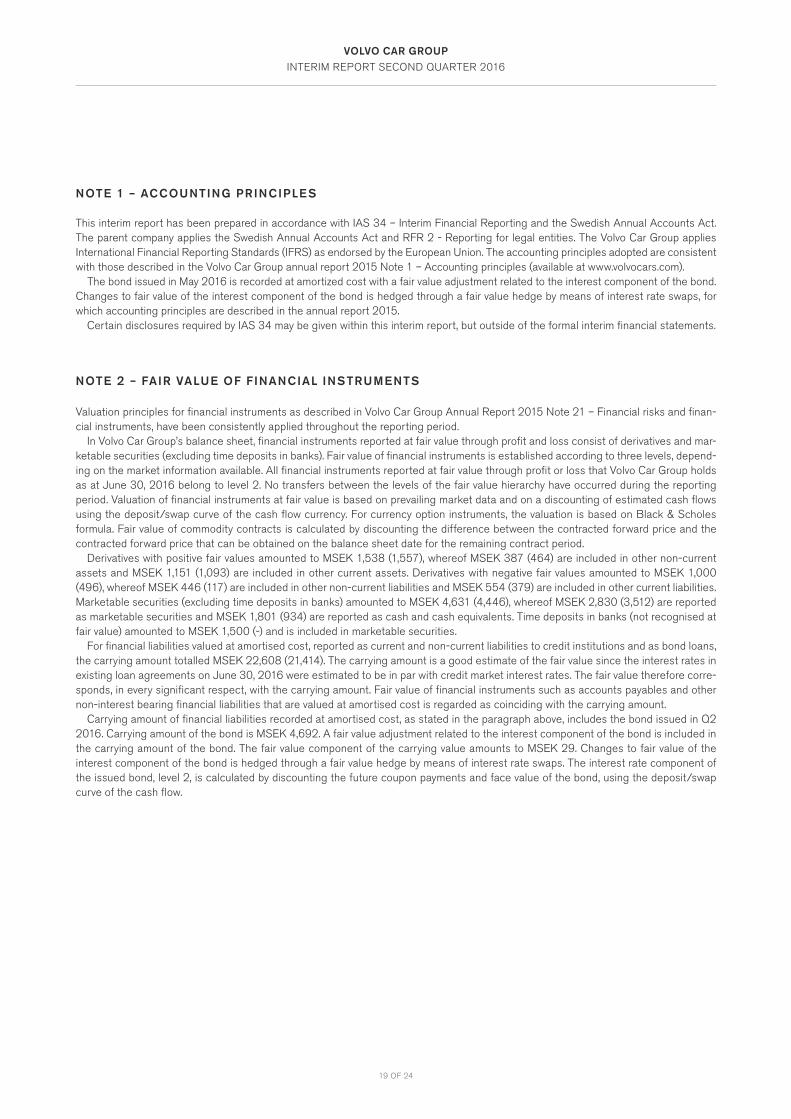
NOTE 1 – ACCOUNTING PRINCIPLE S
This interim report has been prepared in accordance with IAS 34 – Interim Financial Reporting and the Swedish Annual Accounts Act. The parent company applies the Swedish Annual Accounts Act and RFR 2 - Reporting for legal entities. The Volvo Car Group applies International Financial Reporting Standards (IFRS) as endorsed by the European Union. The accounting principles adopted are consistent with those described in the Volvo Car Group annual report 2015 Note 1 – Accounting principles (available at www.volvocars.com). The bond issued in May 2016 is recorded at amortized cost with a fair value adjustment related to the interest component of the bond. Changes to fair value of the interest component of the bond is hedged through a fair value hedge by means of interest rate swaps, for which accounting principles are described in the annual report 2015.
Certain disclosures required by IAS 34 may be given within this interim report, but outside of the formal interim financial statements.
NOTE 2 – FAIR VALUE OF F INANCIAL INSTRUMENTS
Valuation principles for financial instruments as described in Volvo Car Group Annual Report 2015 Note 21 – Financial risks and finan-cial instruments, have been consistently applied throughout the reporting period.
In Volvo Car Group’s balance sheet, financial instruments reported at fair value through profit and loss consist of derivatives and mar-ketable securities (excluding time deposits in banks). Fair value of financial instruments is established according to three levels, depend-ing on the market information available. All financial instruments reported at fair value through profit or loss that Volvo Car Group holds as at June 30, 2016 belong to level 2. No transfers between the levels of the fair value hierarchy have occurred during the reporting period. Valuation of financial instruments at fair value is based on prevailing market data and on a discounting of estimated cash flows using the deposit/swap curve of the cash flow currency. For currency option instruments, the valuation is based on Black & Scholes formula. Fair value of commodity contracts is calculated by discounting the difference between the contracted forward price and the contracted forward price that can be obtained on the balance sheet date for the remaining contract period.
Derivatives with positive fair values amounted to MSEK 1,538 (1,557), whereof MSEK 387 (464) are included in other non-current assets and MSEK 1,151 (1,093) are included in other current assets. Derivatives with negative fair values amounted to MSEK 1,000 (496), whereof MSEK 446 (117) are included in other non-current liabilities and MSEK 554 (379) are included in other current liabilities. Marketable securities (excluding time deposits in banks) amounted to MSEK 4,631 (4,446), whereof MSEK 2,830 (3,512) are reported as marketable securities and MSEK 1,801 (934) are reported as cash and cash equivalents. Time deposits in banks (not recognised at fair value) amounted to MSEK 1,500 (-) and is included in marketable securities.
For financial liabilities valued at amortised cost, reported as current and non-current liabilities to credit institutions and as bond loans, the carrying amount totalled MSEK 22,608 (21,414). The carrying amount is a good estimate of the fair value since the interest rates in existing loan agreements on June 30, 2016 were estimated to be in par with credit market interest rates. The fair value therefore corre-sponds, in every significant respect, with the carrying amount. Fair value of financial instruments such as accounts payables and other non-interest bearing financial liabilities that are valued at amortised cost is regarded as coinciding with the carrying amount.
Carrying amount of financial liabilities recorded at amortised cost, as stated in the paragraph above, includes the bond issued in Q2 2016. Carrying amount of the bond is MSEK 4,692. A fair value adjustment related to the interest component of the bond is included in the carrying amount of the bond. The fair value component of the carrying value amounts to MSEK 29. Changes to fair value of the interest component of the bond is hedged through a fair value hedge by means of interest rate swaps. The interest rate component of the issued bond, level 2, is calculated by discounting the future coupon payments and face value of the bond, using the deposit/swap curve of the cash flow.
VOLVO CAR GROUP
INTERIM REPORT SECOND QUARTER 2016
20 OF 24
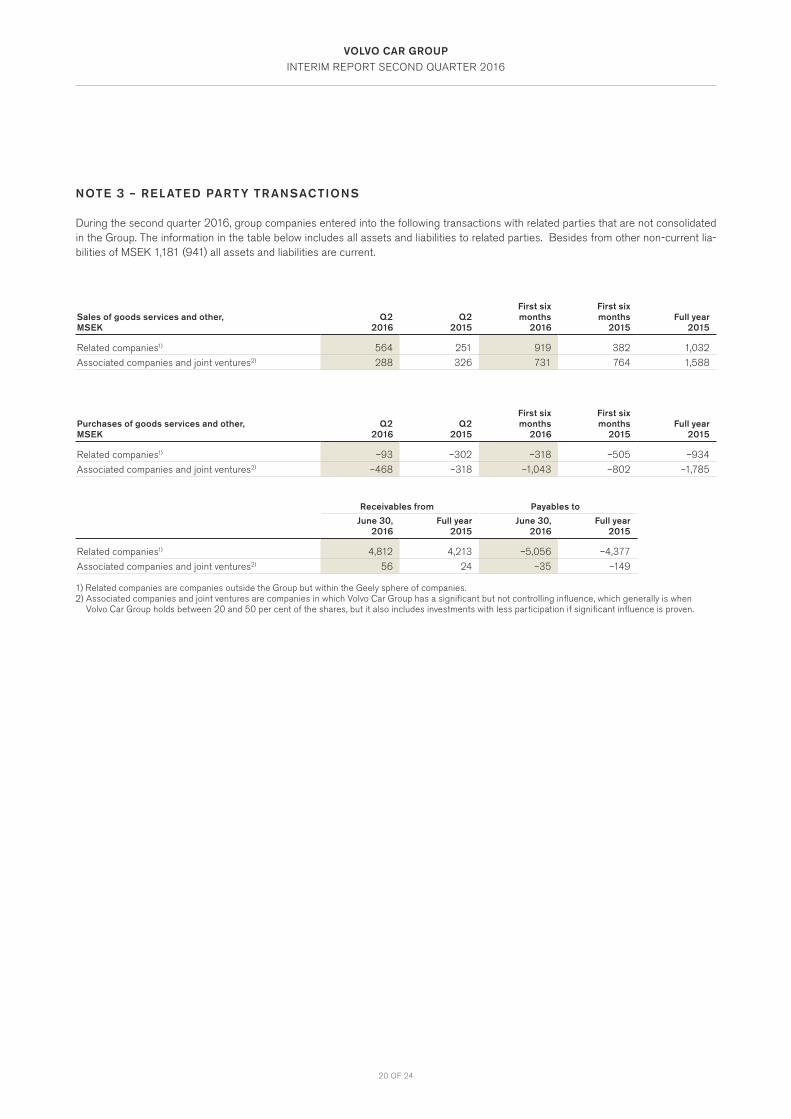
NOTE 3 – REL ATED PART Y TR ANSACTIONS
During the second quarter 2016, group companies entered into the following transactions with related parties that are not consolidated in the Group. The information in the table below includes all assets and liabilities to related parties. Besides from other non-current lia-bilities of MSEK 1,181 (941) all assets and liabilities are current.
Sales of goods services and other,MSEK
Q2 2016
Q2 2015
First six months
2016
First six months
2015Full year
2015
Related companies1) 564 251 919 382 1,032
Associated companies and joint ventures2) 288 326 731 764 1,588
Purchases of goods services and other,MSEK
Q2 2016
Q2 2015
First six months
2016
First six months
2015Full year
2015
Related companies1) –93 –302 –318 –505 –934
Associated companies and joint ventures2) –468 –318 –1,043 –802 –1,785
Receivables from Payables to
June 30, 2016
Full year 2015
June 30, 2016
Full year 2015
Related companies1) 4,812 4,213 –5,056 –4,377
Associated companies and joint ventures2) 56 24 –35 –149
1) Related companies are companies outside the Group but within the Geely sphere of companies. 2) Associated companies and joint ventures are companies in which Volvo Car Group has a significant but not controlling influence, which generally is when
Volvo Car Group holds between 20 and 50 per cent of the shares, but it also includes investments with less participation if significant influence is proven.
VOLVO CAR GROUP
INTERIM REPORT SECOND QUARTER 2016
21 OF 24
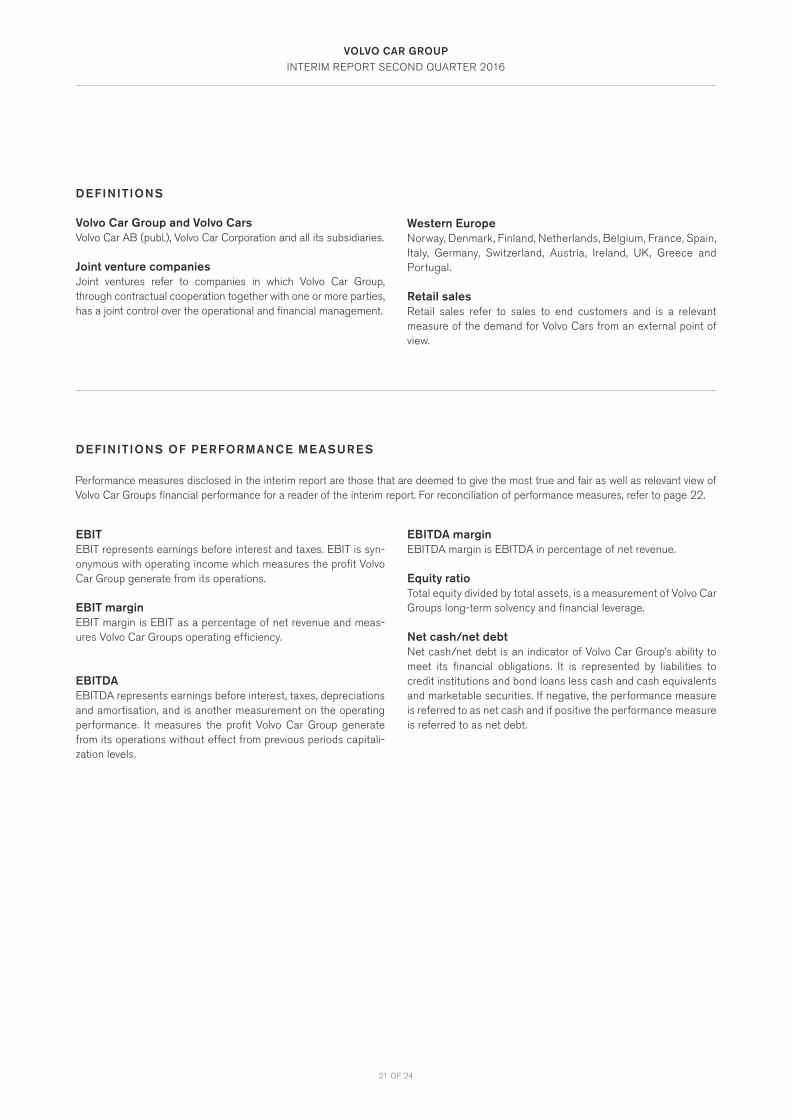
DEFINIT IONS
Volvo Car Group and Volvo CarsVolvo Car AB (publ.), Volvo Car Corporation and all its subsidiaries.
Joint venture companiesJoint ventures refer to companies in which Volvo Car Group, through contractual cooperation together with one or more parties, has a joint control over the operational and financial management.
EBITEBIT represents earnings before interest and taxes. EBIT is syn-onymous with operating income which measures the profit Volvo Car Group generate from its operations.
EBIT marginEBIT margin is EBIT as a percentage of net revenue and meas-ures Volvo Car Groups operating efficiency.
EBITDAEBITDA represents earnings before interest, taxes, depreciations and amortisation, and is another measurement on the operating performance. It measures the profit Volvo Car Group generate from its operations without effect from previous periods capitali-zation levels.
EBITDA marginEBITDA margin is EBITDA in percentage of net revenue.
Equity ratioTotal equity divided by total assets, is a measurement of Volvo Car Groups long-term solvency and financial leverage.
Net cash/net debtNet cash/net debt is an indicator of Volvo Car Group’s ability to meet its financial obligations. It is represented by liabilities to credit institutions and bond loans less cash and cash equivalents and marketable securities. If negative, the performance measure is referred to as net cash and if positive the performance measure is referred to as net debt.
Western EuropeNorway, Denmark, Finland, Netherlands, Belgium, France, Spain, Italy, Germany, Switzerland, Austria, Ireland, UK, Greece and Portugal.
Retail salesRetail sales refer to sales to end customers and is a relevant measure of the demand for Volvo Cars from an external point of view.
Performance measures disclosed in the interim report are those that are deemed to give the most true and fair as well as relevant view of Volvo Car Groups financial performance for a reader of the interim report. For reconciliation of performance measures, refer to page 22.
DEFINIT IONS OF PERFORMANCE ME ASURE S
VOLVO CAR GROUP
INTERIM REPORT SECOND QUARTER 2016
22 OF 24
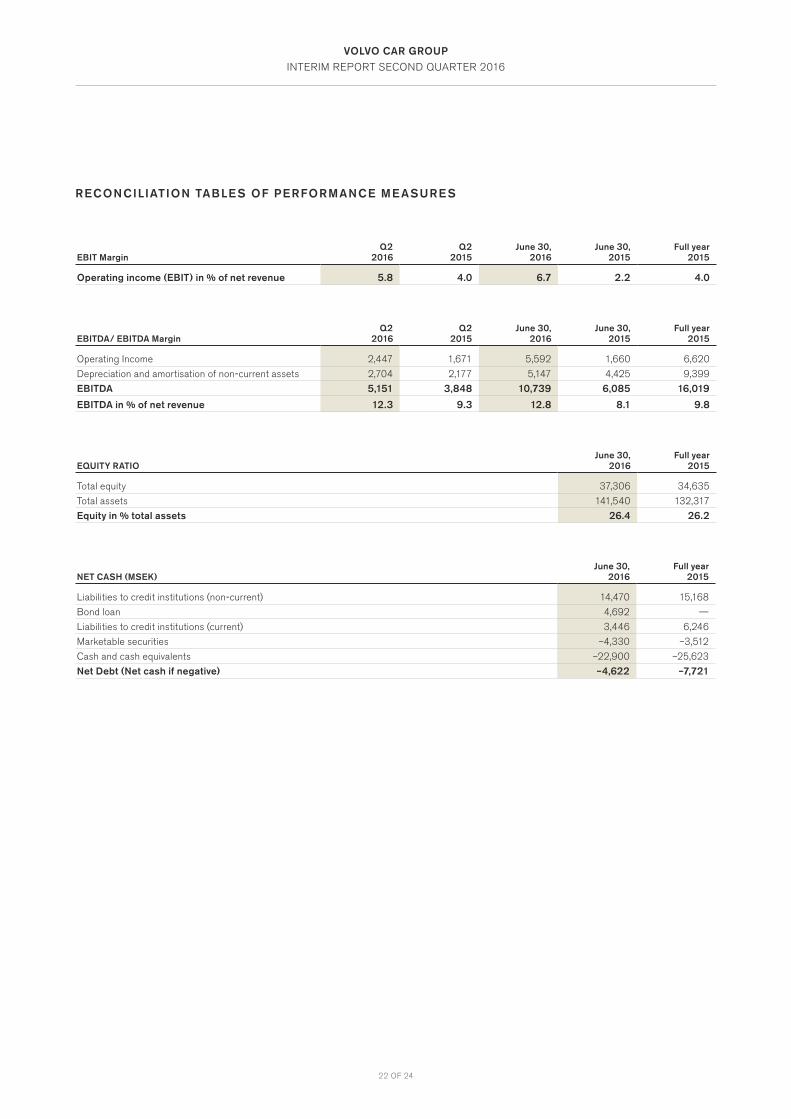
RECONCIL IATION TABLE S OF PERFORMANCE ME ASURE S
EBIT MarginQ2
2016Q2
2015June 30,
2016June 30,
2015Full year
2015
Operating income (EBIT) in % of net revenue 5.8 4.0 6.7 2.2 4.0
EBITDA/ EBITDA MarginQ2
2016Q2
2015June 30,
2016June 30,
2015Full year
2015
Operating Income 2,447 1,671 5,592 1,660 6,620
Depreciation and amortisation of non-current assets 2,704 2,177 5,147 4,425 9,399
EBITDA 5,151 3,848 10,739 6,085 16,019
EBITDA in % of net revenue 12.3 9.3 12.8 8.1 9.8
EQUITY RATIOJune 30,
2016Full year
2015
Total equity 37,306 34,635
Total assets 141,540 132,317
Equity in % total assets 26.4 26.2
NET CASH (MSEK)June 30,
2016Full year
2015
Liabilities to credit institutions (non-current) 14,470 15,168
Bond loan 4,692 —
Liabilities to credit institutions (current) 3,446 6,246
Marketable securities –4,330 –3,512
Cash and cash equivalents –22,900 –25,623
Net Debt (Net cash if negative) –4,622 –7,721
VOLVO CAR GROUP
INTERIM REPORT SECOND QUARTER 2016
23 OF 24
CONTACT
Nils MöskoVice President, Head of Investor Relations+46-(0)31–59 21 [email protected]
Volvo Car Group Headquarters405 31 Gothenburgwww.volvocars.com
The President and Chief Executive Officer certify that the interim report gives a fair view of the performance of the business, position and income statements of the parent company and the Group, and describes the principal risks and uncertainties to which the Group are exposed.
Gothenburg, July 19, 2016
Håkan SamuelssonPresident and Chief Executive Officer
This report has not been subject to review by the auditors of Volvo Car AB (publ.).
The Volvo Car Group interim report on the third quarter 2016 will be published on October 27, 2016 at 06.00 AM CEST.

VOLVO CAR GROUP
INTERIM REPORT SECOND QUARTER 2016
24 OF 24