Embed Size (px)
Citation preview
Volvo Car GROUPInterim report FIRST quarter 2018

2 OF 26
VOLVO CAR GROUP
INTERIM REPORT FIRST QUARTER 2018VOLVO CAR AB (PUBL.) (556810–8988) INTERIM REPORT FIRST QUARTER 2018, GOTHENBURG APRIL 26TH 2018
FIRST QUARTER
• Retail sales increased by 14.1 per cent to 147,407 (129,148) units
• Net revenue increased by 18.9 per cent to MSEK 56,813 (47,802)
• Operating income (EBIT) increased by 3.6 per cent to MSEK 3,616 (3,491)
• Net income decreased by 1.8 per cent to MSEK 2,558 (2,606)
• Cash flow from operating and investing activities at MSEK -2,785 (-2,304)
• Launch of the new V60
• First manufacturing plant became climate neutral
• Volvo Cars recognised on the 2018 list of the World’s Most Ethical Companies® by the Ethisphere Institute

3 OF 26
VOLVO CAR GROUP
INTERIM REPORT FIRST QUARTER 2018
Key figures Q1 2018 Q1 2017
Net revenue, MSEK 56,813 47,802
Research and development expenses, MSEK -2,070 -2,672
Operating income (EBIT), MSEK 3,616 3,491
Net income, MSEK 2,558 2,606
EBITDA, MSEK 6,863 6,361
Cash flow from operating and investing activities, MSEK -2,785 -2,304
Gross margin, % 20.1 22.7
EBIT margin, % 6.4 7.3
EBITDA margin, % 12.1 13.3
Net Cash (Net debt if positive) -10,386 -16,608
Retail sales (units) Q1 2018 Q1 2017
Europe 79,512 75,245
China 28,768 23,335
US 20,083 13,476
Other 19,044 17,092
Retail sales total 147,407 129,148
Wholesales1) 155,272 139,052Production 175,669 152,633
1) Wholesales refers to new car sales to dealers and other customers including own units and rentals.
All amounts are in MSEK unless otherwise stated. Amounts in brackets refer to the same period for the preceding year, unless otherwise stated. All performance measures are further described on page 23.
This report contains statements concerning, among other things, Volvo Car Group’s financial condition and results of operations that are forward-looking in nature. Such statements are not historical facts but, rather, represent Volvo Car Group’s future expectations. Volvo Car Group believes that the expectations reflected in these forward-looking statements are based on reasonable assumptions, however, forward-looking statements involve inherent risks and uncertainties, and a number of important factors could cause actual results or outcomes to differ materially from those expressed in any forward-looking statement. Such important factors include, but may not be limited to: Volvo Car Group’s market position, growth in the automotive industry, and the effects of competition and other economic, business, competitive and/or regulatory factors affecting the business of Volvo Car Group, its associated companies and joint ventures, and the automotive indus-try in general. Forward-looking statements speak only as of the date they were made and, other than as required by applicable law, Volvo Car Group undertakes no obligation to update any of them in light of new information or future events.

4 OF 26
VOLVO CAR GROUP
INTERIM REPORT FIRST QUARTER 2018
Demand in the US is strong and we have seen a continued good pick up in sales since last year. We will soon open our first US plant in Charleston, making us a truly global company. China remains our biggest single market and our growth there continues. With our strong local presence and ongoing focus on brand awareness we are gaining market share. We also see solid growth in Europe, mainly driven by the XC60 and sales of the XC40 which started in February. Demand for the XC40 is ahead of expectations, with 6,500 cars already sold and over 24,000 orders in pipeline. We are among the leaders in the SUV segment. SUVs account for approximately 50 per cent of both sales and revenue, and with the XC40 now reaching our customers we have a strong SUV line-up in a range of segments which cover more than 75 per cent of total SUV sales globally. I am particularly proud to mention that the XC40 was recently named European Car of the Year in Geneva and that the XC60 was recognised as both the World Car of the Year 2018 and the Euro NCAP’s best overall performer in 2017. But Volvo Cars is about more than just SUVs. In February we launched the new V60 in its natural habitat, on the driveway of a family home in Stockholm. The family estate driver has been an important customer for our business for generations and, with the new V60, we honour that tradition and take it even further. This year we will also launch the S60; the final car built on our SPA platform. It will be produced in Charleston both for local sales and export. This is a big moment for Volvo Cars and our first US factory will benefit from the global standards which ensure the same quality wherever we produce. Care by Volvo, the hassle-free subscription service, will be the perfect alternative for the modern car owner. It will bring us closer to our consumers, and in the long run it will generate recurring revenue which will make our business more resilient against cycli-cality. Volvo Car Group is no longer a traditional OEM. We have trans-formed our business and created a group structure that enables us to further capitalise on the consumer and technology trends that are reinventing the car industry. We also continue to make progresses with Polestar, Lynk & Co and Zenuity. Each will play a key role in our future; Polestar will spearhead electrification within the group, Lynk & Co will be the first Chinese automotive brand going global, and Zenuity will pro-vide cutting-edge AD/ADAS systems to the market.
With this positive start to the year I am pleased to report that the Volvo Car Group you see today has already become so much more than just Volvo Cars. This gives me great confidence in our outlook for 2018, where we expect sales and revenue to continue to grow, and operational profits to remain strong.
Håkan SamuelssonCEO
ceo COMMENTWe have continued our strong performance at the start of 2018 delivering increased sales across all regions. In March, we delivered our highest sales month ever. That sales growth has driven a revenue increase and the Group’s operating profit is in line with our expectations.

5 OF 26
VOLVO CAR GROUP
INTERIM REPORT FIRST QUARTER 2018
VOLVO CAR GROUP INTERIM REPORT FIRST QUARTER 2018
Volvo Car AB (publ.), with its registered office in Gothenburg, is majority owned (99 per cent) by Geely Sweden Holdings AB, owned by Shanghai Geely Zhaoyuan International Investment Co., Ltd., registered in Shanghai, China, ultimately owned by Zhejiang Geely Holding Group Ltd., registered in Hangzhou, China.
Volvo Car AB (publ.) holds shares in its subsidiary Volvo Car Corporation and provides the Group with certain financing solu-
tions. Volvo Car AB (publ.) indirectly, through Volvo Car Corpora-tion and its subsidiaries, operates in the automotive industry with business relating to the design, development, manufacturing, mar-keting and sales of cars and thereto related services. Volvo Car Group and its global operations are referred to as “Volvo Cars”.
Volvo Cars’ global retail sales increased by 14.1 per cent to 147,407 (129,148) units and wholesales increased by 11.7 per cent to 155,272 (139,052) units in the first quarter. Sales of the S90 more than doubled to a total of 15,718 cars. Deliveries of the XC40 started in February and Volvo Cars sold 6,236 units during the quarter. The best-selling models for the quarter were the XC60 and XC90.
All main markets increased quarter-on-quarter with the US being the main driver for Volvo Cars’ global growth. China contin-ued to be Volvo Cars’ biggest market, closely followed by Sweden and the US. Demand for the 90 series remained strong, while the XC60 continued to be Volvo Cars’ bestseller accounting for 27.0 per cent of total sales.
EuropeThe passenger car market in Europe remained slightly positive with a 0.6 per cent growth in the first quarter of 2018. Western Europe remained on a steady growth path driven by monetary stimulus, better access to credit and rising consumer confidence. The exception is the UK due to ongoing uncertainties related to Brexit. Volvo Cars’ retail sales in the region increased by 5.7 per cent in the first quarter of the year, strongly outperforming the regional growth. The Swedish market continued to account for a signifi-cant proportion of Volvo Cars’ European sales, with sales of 20,094 units, reflecting growth of 13.4 per cent. Sales in the Netherlands almost doubled to 4,915 (2,669) units in the first quarter. Consumer appetite for the XC60 and V40 helped improve sales. Sales in Belgium and France both grew by 17.8 per cent and 11.3 per cent respectively. The decline in sales in Italy reflected the market performance mainly due to fewer working days.
The Volvo Car Group
Sales development
Retail sales (units) Q1 2018 Q1 2017 Change %
Europe 79,512 75,245 5.7
China 28,768 23,335 23.3
US 20,083 13,476 49.0
Other 19,044 17,092 11.4
Retail sales total 147,407 129,148 14.1
Wholesales 155,272 139,052 11.7Production 175,669 152,633 15.1

6 OF 26
VOLVO CAR GROUP
INTERIM REPORT FIRST QUARTER 2018
ChinaThe Chinese passenger car market grew by 4.4 per cent in the first quarter of 2018. Chinese appetite for vehicles in the sedan segment comprises the biggest driver for growth within the pre-mium segment.
Volvo Cars’ sales momentum in China continued with retail sales growing 23.3 per cent in the first quarter of the year to 28,768 (23,335) units. Growth was driven by higher demand of the S90 which sold 9,133 (2,262) units and became Volvo Cars’ most popular car in the market. This was closely followed by the XC60 of which Volvo Cars sold 8,586 units. Both the S90 and XC60 are locally produced.
USTotal market sales of passenger cars in the US increased by 2.2 per cent in the first quarter of the year. Consumer sentiment con-tinued to strengthen; in March 2018 the strongest consumer sentiment reading was recorded since January 2004. Demand in the US is mainly focused on - and driven by - the light trucks segment. The SUV market grew slightly by 1.2 per cent quar-ter-on-quarter, but growth in the small-size SUV sector has picked up and now stands at almost 30 per cent. Volvo Cars’ retail sales increased by 49.0 per cent to 20,083 units compared to a low (13,476) quarter last year. Demand in the US was mainly driven by the XC60 and XC90, which both grew at levels above 60 per cent, strongly outperforming the domestic market. Together, these models account for 66.8 per cent of Volvo Cars’ sales in the US.
OtherIn other markets, Volvo Cars’ retail sales increased by 11.4 per cent to 19,044 units. The increase was supported by strong demand for the XC60 which grew 28.3 per cent to 5,368 units; Japan, Canada, Korea and Taiwan being the main drivers in terms of volume growth.
RETAIL SALES BY MARKET FIRST QUARTER 2018
RETAIL SALES BY CARLINE FIRST QUARTER 2018
Other, 12%
US, 14%
China, 20%
Europe, 54%
XC, 47%
V, 35%
S, 18%
VOLVO CAR GROUP INTERIM REPORT FIRST QUARTER 2018
7 OF 26
VOLVO CAR GROUP
INTERIM REPORT FIRST QUARTER 2018
VOLVO CAR GROUP INTERIM REPORT FIRST QUARTER 2018
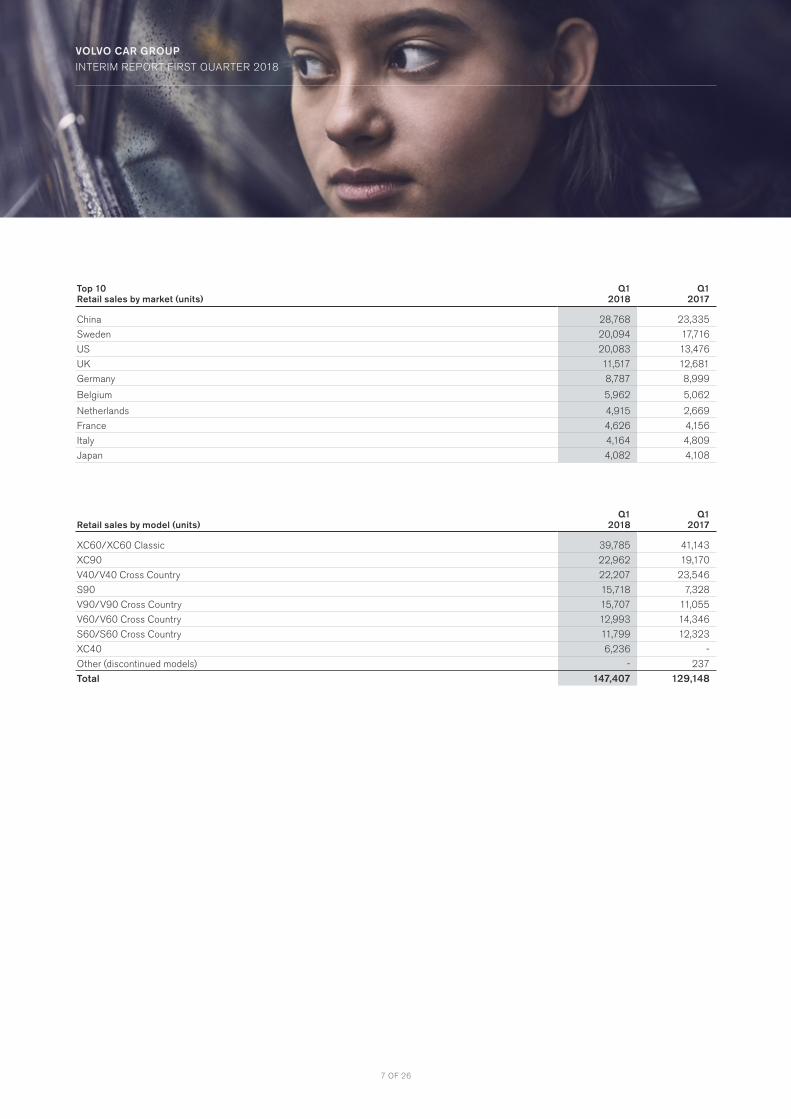
Top 10Retail sales by market (units)
Q1 2018
Q1 2017
China 28,768 23,335
Sweden 20,094 17,716
US 20,083 13,476
UK 11,517 12,681
Germany 8,787 8,999
Belgium 5,962 5,062
Netherlands 4,915 2,669
France 4,626 4,156
Italy 4,164 4,809
Japan 4,082 4,108
Retail sales by model (units)Q1
2018Q1
2017
XC60/XC60 Classic 39,785 41,143
XC90 22,962 19,170
V40/V40 Cross Country 22,207 23,546
S90 15,718 7,328
V90/V90 Cross Country 15,707 11,055
V60/V60 Cross Country 12,993 14,346
S60/S60 Cross Country 11,799 12,323
XC40 6,236 -
Other (discontinued models) - 237
Total 147,407 129,148

8 OF 26
VOLVO CAR GROUP
INTERIM REPORT FIRST QUARTER 2018
FIRST QUARTER 2018
Lynk & Co cars to be produced at Volvo Cars Ghent plantFollowing Volvo Cars’ acquisition of the 30 per cent stake in Lynk & Co last year, the joint production with Lynk & Co, planned late 2019, will have a positive effect on cost levels, employment and
production volumes, while generating the expected economies of scale related to the Compact Modular Architecture (CMA) used by both Volvo Cars and Lynk & Co.
Significant events
VOLVO CAR GROUP INTERIM REPORT FIRST QUARTER 2018
Other eventsLaunch of the new V60As part of our core business of launching and building cars, as well as delivering new mobility solutions, production of the new model starts at the Torslanda plant in Sweden in the beginning of the second quarter. Being the first in the segment, customers can also access the new V60 via Volvo Cars’ subscription service Care by Volvo.
XC60 World Car of the Year and XC40 European Car of the Year 2018The XC60 announcement was made at the New York Auto Show and was the first in this competition for Volvo Cars. Furthermore, it was also recognised as Euro NCAP’s best overall performer of the year 2017, and Japan’s 2017-18 Car of the Year. In addition, the XC40 small SUV was named European Car of the Year at the Geneva Motor Show. Volvo Cars considers these recogni-tions to clearly indicate the cars have the right combination of design, connectivity and safety, delivering on the company’s ambition to enhance consumer experiences all over the world.
Technology start-up investment fund launchedThe launch of the fund is supporting Volvo Cars’ ambition to invest in strategic technology and mobility such as artificial intelligence, electrification, autonomous driving and digital mobility services. It is part of a continued push for innovation, and accelerates the company’s digital transformation.
First manufacturing plant became climate neutralDelivering on Volvo Cars’ Sustainability Program Omtanke, the engine factory in Skövde, Sweden has become the Group’s first climate neutral manufacturing plant, having switched to renewa-ble heating as of January 1.
Volvo Cars named one of the World’s Most Ethical Companies®
The recognition was received for the second consecutive year by the Ethisphere Institute, a global leader in defining and advancing the standards of ethical business practices. The recognition con-firms progress towards one of Volvo Cars’ Omtanke commitments; to drive ethical leadership for responsible business
Changes to the Volvo Cars Board of DirectorsIn March, Volvo Cars announced the appointment of Lone Fønss Schrøder as Vice Chairman of the Board, still remaining as Chair-man of the Audit Committee. Mrs Schrøder replaces Mikael Ols-son who assumes a position in the Nomination Committee. After eight years of service, Peter Zhang has decided to leave the Board.

9 OF 26
VOLVO CAR GROUP
INTERIM REPORT FIRST QUARTER 2018
Income Statement (MSEK)Q1
2018Q1
2017
Net revenue 56,813 47,802
Gross income 11,426 10,849
Operating income 3,616 3,491
Income before tax 3,438 3,244
Net income 2,558 2,606
Research and development (MSEK)Q1
2018Q1
2017
Research and development spending -2,841 -3,476
Capitalised development costs 1,847 1,834
Amortisation and depreciation of Research and development 1) -1,076 -1,030
Research and development expenses -2,070 -2,672
1) Includes amortisation of capitalised development cost and a portion of depreciation of other intangible assets.
During the first quarter, Volvo Cars generated net revenue of MSEK 56,813 (47,802), an increase of 18.9 per cent, reflecting a continuous strong growth of Volvo Cars core business. Net reve-nue increased in all main geographical regions as a result of the positive sales development, where wholesales increased by 11.7 per cent to 155,272 (139,052) units.
Cost of sales increased to MSEK –45,387 (–36,953), due to higher sales volume and product mix. Material costs, freight and distribution as well as depreciations and amortisations are increasing mainly as a result of the increased production. Gross income increased to MSEK 11,426 (10,849). Gross margin decreased to 20.1 (22.7) per cent, reflecting the ramp up of pro-duction and negative exchange rate effects.
Research and development, selling and administrative expenses are in line with prior year, amounting to MSEK -7,799 (-7,601). Research and development expenses have been offset by received government grants. For details, see table below.
Other operating income and expense, net, decreased to MSEK -43 (178), mainly related to increased royalty expenses and a decrease of sold services.
Operating income (EBIT) amounted to MSEK 3,616 (3,491). The gross income development had a positive effect on operating income. This effect was partly offset by increased advertising, sales and promotion expenses due to launch of new car models and selling expenses related to business growth, including nega-tive foreign exchange effect of MSEK 635. EBIT margin decreased to 6.4 (7.3) per cent.
Net financial items amounted to MSEK –178 (-247), mainly related to decreased interest expenses and positive exchange rate effects.
The income tax increase is mainly related to increased profit and timing in withholding tax.
Net income amounted to MSEK 2,558 (2,606).
Financial summaryFIRST QUARTER 2018 – INCOME AND RESULTThe comparative figures refer to the consolidated income statement of the first quarter 2017 if not otherwise stated.
VOLVO CAR GROUP INTERIM REPORT FIRST QUARTER 2018

10 OF 26
VOLVO CAR GROUP
INTERIM REPORT FIRST QUARTER 2018
CASH FLOWCash flow from operating and investing activities amounted to MSEK -2,785 (-2,304).
Cash flow from operating activities amounted to MSEK 2,444 (3,019). The change is due to the positive operating income of MSEK 3,616 (3,491), adjusting for depreciation and amortisation of MSEK 3,247 (2,870) together with a negative working capital of MSEK -3,575 (-2,870) and increased income tax paid of MSEK -1,001 (-523).
Cash flow from working capital is mainly related to negative effects in inventory, due to production related seasonality, prod-uct mix and ramp-up of production. Furthermore, the working capital development is explained by increased accounts receiva-ble, offset by positive effects from accounts payables.
Cash flow from investing activities amounted to MSEK –5,229 (–5,323). Investments in tangible assets amounted to MSEK –3,192 (–3,573), mainly driven by the ongoing construction of the US plant and investments related to new car models, such as the 60 series and XC40. Investments in intangible assets amounted to MSEK –2,154 (–1,826) as a result of continuous investments in new and upcoming car models and new technology.
Cash flow from financing activities amounted to MSEK -4,431 (2,871). The change is mainly attributable to repayment of liabili-ties to credit institutions of MSEK -5,934 (-701), whereof MSEK 5,790 was an early repayment of a bank loan made in January. Volvo Cars continuously assesses how to optimise its finance structure and this repayment represents another step in that pro-cess. The change in cash flow from financing activities was partly offset by matured marketable securities of net MSEK 1,257 (3,090).
NET FINANCIAL POSITION AND LIQUIDITYThe presented figures refer to the consolidated figures for the first quarter 2018 if not otherwise stated. The comparative figures for the cash flow items refer to the consolidated cash flow statement for the first quarter 2017 if not otherwise stated. The comparative figures for the balance sheet items refer to the consolidated balance sheets of December 31, 2017 if not otherwise stated.
VOLVO CAR GROUP INTERIM REPORT FIRST QUARTER 2018
Cash flow Statement (MSEK) Q1 2018 Q1 2017
Cash flow from operating activities 2,444 3,019
Cash flow from investing activities -5,229 -5,323
Cash flow from operating and investing activities -2,785 -2,304
Cash flow from financing activities -4,431 2,871
Cash flow for the period -7,216 567
Cash and cash equivalents including marketable securities decreased to MSEK 31,967 (39,394). Net cash decreased to MSEK -10,386 (-12,513). Including undrawn credit facilities of MSEK 15,876 (15,203), liquidity is at MSEK 47,843 (54,597).
EQUITYTotal equity increased by MSEK 3,618 to MSEK 58,278 (54,660), resulting in an equity ratio of 29.7 (28.7) per cent. The change is attributable to the positive net income of MSEK 2,558 and posi-tive effects in other comprehensive income, mainly related to remeasurements of provisions for post-employment benefits of MSEK 493. The equity also increased by MSEK 474 due to a capital contribution from non-controlling interests within Polestar New Energy Vehicle Co., Ltd., partly offset by a dividend of MSEK 63 to the holders of preference shares.

11 OF 26
VOLVO CAR GROUP
INTERIM REPORT FIRST QUARTER 2018
SIGNIFICANT EVENTS AFTER THE REPORTING PERIODThere are no significant events after the reporting period.
RISKS AND UNCERTAINTY FACTORSRisks are a natural element in all business activities. In order to achieve Volvo Cars’ short and long-term objectives, enterprise risk management is part of the daily activities at Volvo Cars. For a more in-depth analysis of risks, see the Volvo Car Group Annual Report 2017 page 104.
Volvo Cars is present on the bond market and is continuously considering various capital market options that may or may not include possible listings.
PRODUCTIONVolvo Cars produced 175,669 (152,633) units in the first quarter of 2018, an increase of 15.1 per cent.
EMPLOYEESDuring the first quarter of 2018, Volvo Cars employed an average of 40,000 (33,000) full-time employees and 4,300 (4,200) con-sultants. The total increase relates mainly to higher production volumes, the ramp up in China, the construction of the Charleston manufacturing plant in the US, continuous development of future technologies such as electrification and autonomous driving, as well as continuous development of current and future car models.
PARENT COMPANYThe parent company conducts no operations and has no employ-ees. The income statements and balance sheets for the parent company are presented on page 18.
VOLVO CAR GROUP INTERIM REPORT FIRST QUARTER 2018
OUTLOOK 2018
Revenue growthWe expect the worldwide passenger car market to grow and the premium segment to continue to develop positively. Volvo Cars expects continued growth in rev-enue and retail sales supported by our renewed prod-uct portfolio, as well as incremental sales of the XC40.
Operating incomeWe expect profits to remain strong based on an improved model mix following the completion of the roll out of SPA cars and the introduction of the XC40. Profit is expected to be partly impacted by increased expenses related to continued focus on marketing, R&D and digitalisation.
InvestmentsWe will finalise the construction of our plant in the US, and continue to make investments in the renewal of our product portfolio as well as new technologies. Capital expenditure is therefore predicted to maintain at the same level as in 2017.

12 OF 26
VOLVO CAR GROUP
INTERIM REPORT FIRST QUARTER 2018

13 OF 26
VOLVO CAR GROUP
INTERIM REPORT FIRST QUARTER 2018
CONSOLIDATED INCOME STATEMENTS
MSEK Note Q1
2018Q1
2017Full year
2017
Net revenue 2 56,813 47,802 210,912
Cost of sales -45,387 -36,953 -164,254
Gross income 11,426 10,849 46,658
Research and development expenses -2,070 -2,672 -10,187
Selling expenses -4,004 -3,177 -15,266
Administrative expenses -1,725 -1,752 -8,182
Other operating income 555 652 3,054
Other operating expenses -598 -474 -2,216
Share of income in joint ventures and associates 32 65 200
Operating income 3,616 3,491 14,061
Financial income 113 75 355
Financial expenses -291 -322 -1,269
Income before tax 3,438 3,244 13,147
Income tax -880 -638 -2,922
Net income 2,558 2,606 10,225
Net income attributable toOwners of the parent company 2,081 2,253 7,960
Non-controlling interests 477 353 2,265
2,558 2,606 10,225

14 OF 26
VOLVO CAR GROUP
INTERIM REPORT FIRST QUARTER 2018
CONSOLIDATED COMPREHENSIVE INCOME
MSEKQ1
2018Q1
2017Full year
2017
Net income for the period 2,558 2,606 10,225Other comprehensive incomeItems that will not be reclassified subsequently to income statement:Remeasurements of provisions for post-employment benefits 493 174 -422
Tax on items that will not be reclassified to income statement -119 -30 62
Items that may be reclassified subsequently to income statement:Translation difference on foreign operations 1,280 43 -318
Translation difference of hedge instruments of net investments in foreign operations -183 4 -121
Change in cash flow hedge -1,104 517 4,453
Tax on items that may be reclassified to income statement 282 -114 -953
Other comprehensive income, net of income tax 649 594 2,701Total comprehensive income for the period 3,207 3,200 12,926
Total comprehensive income attributable toOwners of the parent company 2,385 2,872 10,777
Non-controlling interests 822 328 2,149
3,207 3,200 12,926

15 OF 26
VOLVO CAR GROUP
INTERIM REPORT FIRST QUARTER 2018
CONSOLIDATED BALANCE SHEETS
MSEK NoteMar 31,
2018Dec 31,
2017
ASSETSNon-current assetsIntangible assets 30,185 29,157
Property, plant and equipment 58,273 55,245
Assets held under operating leases 2,302 2,577
Receivables on parent company 55 54
Investments in joint ventures and associates 6,135 5,480
Other long-term securities holdings 169 80
Deferred tax assets 5,364 4,558
Other non-current assets 3 3,336 3,704
Total non-current assets 105,819 100,855
Current assetsInventories 37,273 30,665
Accounts receivable 4 12,005 10,832
Current tax assets 586 463
Other current assets 3 8,635 7,955
Marketable securities 3 2,859 3,992
Cash and cash equivalents 3 29,108 35,402
Total current assets 90,466 89,309TOTAL ASSETS 196,285 190,164
EQUITY & LIABILITIESEquityEquity attributable to owners of the parent company 51,288 48,729
Non-controlling interests 6,990 5,931
Total equity 58,278 54,660
Non-current liabilitiesProvisions for post-employment benefits 5,633 6,525
Deferred tax liabilities 2,160 1,977
Other non-current provisions 5,013 4,885
Liabilities to credit institutions 3 6,606 6,622
Bonds 3 13,181 12,735
Contract liability - revenue related 1 3,872 3,739
Other non-current liabilities 3, 4 3,215 2,636
Total non-current liabilities 39,680 39,119
Current liabilitiesCurrent provisions 6,637 5,921
Liabilities to credit institutions 3 1,702 7,426
Contract liability - revenue related 1 15,767 15,099
Accounts payable 4 41,039 38,536
Current tax liabilities 1,706 1,380
Other current liabilities 3, 4 31,476 28,023
Total current liabilities 98,327 96,385TOTAL EQUITY & LIABILITIES 196,285 190,164

16 OF 26
VOLVO CAR GROUP
INTERIM REPORT FIRST QUARTER 2018
CONDENSED CHANGES IN CONSOLIDATED EQUITY
MSEKMar 31,
2018Dec 31,
2017
Opening balance 54,660 43,310Net income for the period 2,558 10,225
Other comprehensive income, net of income tax 649 2,701
Total comprehensive income 3,207 12,926Capital contribution from Non-controlling interests 474 631
Issue of preference shares − -19
Dividend to shareholders -63 -2,188
Transactions with owners 411 -1,576Closing balance 58,278 54,660
Attributable to Owners of the parent company 51,288 48,729
Non-controlling interests 6,990 5,931
Closing balance 58,278 54,660

17 OF 26
VOLVO CAR GROUP
INTERIM REPORT FIRST QUARTER 2018
CONSOLIDATED STATEMENTS OF CASH FLOWS
MSEKQ1
2018Q1
2017Full year
2017
OPERATING ACTIVITIESOperating income 3,616 3,491 14,061
Depreciation and amortisation of non-current assets 3,247 2,870 12,098
Interest and similar items received 77 75 303
Interest and similar items paid -46 -43 -1,016
Other financial items 24 -16 -383
Income tax paid -1,001 -523 -3,471
Adjustments for other items not affecting cash flow 102 35 122
6,019 5,889 21,714
Movements in working capital
Change in inventories -4,567 -4,647 -9,524
Change in accounts receivable -778 -76 -1,474
Change in accounts payable 1,650 2,184 8,220
Change in balances related to repurchase contracts -206 207 235
Change in provisions -544 -692 -141
Change in contract liability - revenue related 753 703 3,998
Change in other working capital assets/liabilities 117 -549 1,502
Cash flow from movements in working capital -3,575 -2,870 2,816Cash flow from operating activities 2,444 3,019 24,530
INVESTING ACTIVITIESInvestments in shares and participations, net 31 78 -2,081
Dividend received from joint ventures and associates – – 37
Investments in intangible assets -2,154 -1,826 -9,651
Investments in property, plant and equipment -3,192 -3,573 -16,634
Disposal of property, plant and equipment 86 – –
Other – -2 -1
Cash flow from investing activities -5,229 -5,323 -28,330Cash flow from operating and investing activities -2,785 -2,304 -3,800
FINANCING ACTIVITIESProceeds from credit institutions 52 534 1,291
Proceeds from bond issuance – – 4,914
Proceeds from issuance of preference shares, net – -32 -82
Repayment of liabilities to credit institutions -5,934 -701 -3,658
Dividend paid to shareholders – – -2,188
Investments in marketable securities, net 1,257 3,090 785
Other 194 -20 271
Cash flow from financing activities -4,431 2,871 1,333Cash flow for the period -7,216 567 -2,467
Cash and cash equivalents at beginning of period 35,402 38,635 38,635Exchange difference on cash and cash equivalents 922 -28 -766
Cash and cash equivalents at end of period 29,108 39,174 35,402

18 OF 26
VOLVO CAR GROUP
INTERIM REPORT FIRST QUARTER 2018
CONDENSED PARENT COMPANY INCOME STATEMENTS
CONDENSED PARENT COMPANY BALANCE SHEETS
MSEKQ1
2018Q1
2017Full year
2017
Administrative expenses -14 -7 -20
Operating income -14 -7 -20
Income from participation in subsidiary1) − − 1,565
Financial income 83 55 243
Financial expenses -120 -93 -481
Income before tax -51 -45 1,307
Income tax 11 10 43
Net income -40 -35 1,350
1) Received dividend from subisidary of MSEK 1,565, passed through to the shareholders.
Other comprehensive income and net income are consistent since there are no items in other comprehensive income.
MSEK Mar 31,
2018Dec 31,
2017
ASSETSNon-current assets 25,646 25,196
Current assets 4,937 4,895
TOTAL ASSETS 30,583 30,091
EQUITY & LIABILITIESEquityRestricted equity 51 51
Non-restricted equity 7,277 7,380
Total equity 7,328 7,431
Non-current liabilities 23,062 22,602
Current liabilities 193 58
TOTAL EQUITY & LIABILITIES 30,583 30,091

19 OF 26
VOLVO CAR GROUP
INTERIM REPORT FIRST QUARTER 2018
NOTE 1 – ACCOUNTING PRINCIPLES
This interim report has been prepared in accordance with IAS 34 – Interim Financial Reporting and the Swedish Annual Accounts Act. The Volvo Car Group applies International Financial Reporting Standards (IFRS) as endorsed by the European Union. The parent com-pany applies RFR 2 - Reporting for legal entities and the Swedish Annual Accounts Act. The accounting principles adopted are, in all material aspects, consistent with those described in the Volvo Car Group Annual Report 2017 Note 1 – Accounting Principles for Volvo Car Group and the parent company respectively (available at www.volvocars.com), together with the additions in below paragraphs.
On January 1, 2018, IFRS 15 – Revenue from contracts with customers and IFRS 9 – Financial instruments were being applied. Accounting principles adopted are, in all material aspects, consistent with those described in the Volvo Car Group Annual Report 2017 Note 33 – New Accounting Standards Implemented on January 1, 2018. As described in Note 33, in terms of IFRS 15 there is no tran-sition effect impacting the Consolidated Income Statements, and consequently no restatement of prior year figures in the Consolidated Income Statements. As also described in Note 33, Volvo Car Group has decided to disclose contract liabilities on a separate financial statement line in the Q1 2018 Consolidated Balance Sheets, Contract liabilities – revenue related, as non-current and current liabilities respectively. For comparison purposes, prior year figures have been reclassified in the Consolidated Balance Sheets, as follows:
Non-current contract liability – revenue related
MSEK
Q1 2018
Full year,
2017Classification in the annual report 2017
Sales generated obligations 470 526 Other non-current provisions
Deferred revenue – extended service business 2,337 2,189 Other non-current provisions
Deferred revenue – sales with repurchase contracts* 417 429 Non-current liabilities
Advance payments from customers 648 595 Non-current liabilities
Total 3,872 3,739
Current contract liability – revenue related
MSEK
Q1 2018
Full year,
2017Classification in the annual report 2017
Sales generated obligations 11,787 11,313 Current provisions
Deferred revenue – extended service business 1,893 1,849 Current provisions
Deferred revenue – sales with repurchase contracts* 1,221 1,280 Other current liabilities
Advance payments from customers 866 657 Advance payments from customers
Total 15,767 15,099
* Recorded as an operating lease contract.
As described in Note 33, in terms of IFRS 9 there is no transition effect, and consequently no restatement of prior year figures. As required by IFRS 9, a provision for expected credit losses has been recorded in Q1 2018, with an amount of MSEK 16, in addition to the provision for incurred losses. As also required by IFRS 9, time value of options is recorded in other comprehensive income rather than in the income statement in Q1 2018, with an amount of MSEK 1.
IFRS 16 was published in January 2016 and is effective for accounting periods beginning on or after January 1, 2019. The standard was endorsed by the EU in November 2017. It replaces current leasing accounting standard, IAS 17 Leases. The new standard provides guidance for lessee accounting on how to bring lease commitments, previously treated off balance, onto the balance sheet. Volvo Car Group is currently analysing the effects of implementing IFRS 16, and is yet to assess the impact.
Certain disclosures, required by IAS 34 – Interim financial reporting, may be given within this interim report, but outside of the formal interim financial statements.

20 OF 26
VOLVO CAR GROUP
INTERIM REPORT FIRST QUARTER 2018
NOTE 2 – net revenueNet revenue allocated to geographical regions:
MSEKQ1
2018Q1
2017Full year
2017
China 11,890 8,870 45,254
US 8,496 7,290 33,457
Europe 29,048 24,969 102,869
of which Sweden 7,149 6,344 27,724 of which Germany 3,781 2,719 13,519 of which United Kingdom 3,171 3,471 12,581Other markets 7,379 6,673 29,332
of which Japan 1,335 1,438 5,759 of which Russia 478 465 2,948Total 56,813 47,802 210,912
Net revenue allocated to category:
MSEKQ1
2018Q1
2017Full year
2017
Sale of products and related goods and services 1) 54,137 45,215 197,225
Sale of licenses and royalties 27 210 4,023
Revenue from subscription, leasing and rental business 1,122 1,466 6,056
Other Net revenue 1,527 911 3,608
Total 56,813 47,802 210,912
1) Includes realised effect of cash flow hedge contracts amounting to MSEK 6 (-404).
NOTE 3 – FAIR VALUE OF FINANCIAL INSTRUMENTS
Valuation principles for financial instruments as described in Volvo Car Group Annual Report 2017 Note 21 – Financial risks and financial instruments, have been consistently applied throughout the reporting period. The comparative figures in this note refer to December 31, 2017.
In Volvo Car Group’s balance sheet, financial instruments reported at fair value through the income statement consist of derivatives, equity investments as well as marketable securities (excluding time deposits in banks), see table ‘Financial instruments recorded at fair value through the income statement’ in this note. Fair value of financial instruments is established according to three levels, depending on market information available. All derivative financial instruments and marketable securities that Volvo Car Group holds as of March 31, 2018 belong to level 2. In level 3, the amount invested in other long-term securities holdings of MSEK 169 (80) is valued at cost, being the best approximate of fair value. No transfers between the levels of the fair value hierarchy have occurred. Valuation of financial instruments at fair value belonging to level 2 is based on prevailing market data and on a discounting of estimated cash flows using the deposit/swap curve of the cash flow currency and include risk assumptions. For currency option instruments, the valuation is based on Black & Scholes formula. Fair value of commodity contracts is calculated by discounting the difference between the contracted forward price and the contracted forward price that can be obtained on the balance sheet date for the remaining contract period.
The total fair value of the derivative portfolio as of March 31, 2018, amounted to MSEK 910 (1,612). The major part is related to cash flow hedging of currency risk. The table below shows the percentage of the forecasted cash flows that were hedged expressed in nominal terms and in Cash Flow at Risk (CFaR), which is the maximum loss at a 95 per cent confidence level in one year. The CFaR is based on the cash flow forecast, market volatility and correlations.
0-24 months 25-48 months
Mar 31, 2018
Dec 31,2017
Mar 31, 2018
Dec 31,2017
Nominal hedge % 31 29 6 5
CFaR incl. hedges % 40 38 13 11

21 OF 26
VOLVO CAR GROUP
INTERIM REPORT FIRST QUARTER 2018
NOTE 3 – FAIR VALUE OF FINANCIAL INSTRUMENTS - continued
Financial instruments recorded at fair value through the income statement
MSEKMar 31,
2018Dec 31,
2017
Other non-current assetsDerivative assets 875 1,234
Other long-term securities holdings 169 80
Other current assetsDerivative assets 1,809 1,172
Marketable securitiesMarketable securities1) 804 991
Cash and cash equivalentsMarketable securities 1,294 1,780
Total assets 4,951 5,257
Other non-current liabilitiesDerivative liabilities 630 223
Other current liabilitiesDerivative liabilities 1,144 571
Total liabilities 1,774 794
1) Excluding time deposits in banks (not recorded at fair value) MSEK 2,055 (3,001).
For financial liabilities valued at amortised cost, reported as current and non-current liabilities to credit institutions and as bonds, the carrying amount totalled MSEK 21,489 (26,783), see table below.
Financial liabilities valued at amortised cost Carrying amount Fair value
Carrying amount Fair value
MSEK Mar 31, 2018 Dec 31, 2017
Bonds and liabilities to credit institutions 21,489 22,024 26,783 27,465
Total 21,489 22,024 26,783 27,465
Carrying amount of financial liabilities recorded at amortised cost, as stated in the table above, includes the MEUR 500 bond issued in May 2016. Carrying amount of the bond is MSEK 5,082 (4,854). A fair value adjustment related to the interest component of the bond is included in the carrying amount of the bond. The fair value component of the carrying value amounts to MSEK -8 (-14). Changes to fair value of the interest component of the bond is hedged through a fair value hedge by means of interest rate swaps. The interest rate component of the issued bond, level 2, is calculated by discounting the future coupon payments and face value of the bond, using the deposit/swap curve of the cash flow. The remaining bonds are recorded at amortised cost and are not subject to hedge accounting.

22 OF 26
VOLVO CAR GROUP
INTERIM REPORT FIRST QUARTER 2018
NOTE 4 – RELATED PARTY TRANSACTIONS
During the first quarter 2018, Group companies entered into the following transactions with related parties which are not consolidated in the Group. The information in the table below includes all assets and liabilities to related parties. Besides from other non-current liabilities of MSEK 234 (300) all assets and liabilities are current.
Sales of goods, services and other
MSEKQ1
2018Q1
2017Full year
2017
Related companies 1) 3) 444 592 4,756
Associated companies and joint ventures 2) 52 44 249
Purchases of goods, services and other
MSEKQ1
2018Q1
2017Full year
2017
Related companies 1) -32 -222 -1,613
Associated companies and joint ventures 2) -464 -202 -1,043
Receivables Payables
Mar 31, 2018
Dec 31,2017
Mar 31, 2018
Dec 31,2017
Related companies 1) 3,176 3,136 2,536 2,935
Associated companies and joint ventures 2) 1,133 911 239 297
1) Related companies are companies outside the Volvo Car Group but within the Geely sphere of companies. 2) Associated companies and joint ventures are companies in which Volvo Car Group has a significant but not controlling influence, which generally is when Volvo
Car Group holds between 20 and 50 per cent of the shares. 3) Licence revenue represent a value of MSEK 6 (202) in the first quarter.

23 OF 26
VOLVO CAR GROUP
INTERIM REPORT FIRST QUARTER 2018
GENERAL DEFINITIONS
Volvo Car Group and Volvo CarsVolvo Car AB (publ.), Volvo Car Corporation and all its subsidiaries.
Joint venture companiesJoint ventures refer to companies in which Volvo Car Group, through contractual cooperation together with one or more parties, has a joint control over the operational and financial management.
Gross marginGross margin is Gross income as a percentage of net revenue and represents the percent of total net revenue that Volvo Cars retains after incurring the direct costs associated with producing the goods and services sold.
EBITEBIT represents earnings before interest and taxes. EBIT is syn-onymous with operating income which measures the profit Volvo Car Group generates from its operations.
EBIT marginEBIT margin is EBIT as a percentage of net revenue and meas-ures Volvo Car Group’s operating efficiency.
EBITDAEBITDA represents earnings before interest, taxes, depreciations and amortisation, and is another measurement of the operating performance. It measures the profit Volvo Car Group generate from its operations without effect from previous periods capitali-sation levels.
EBITDA marginEBITDA margin is EBITDA in percentage of net revenue.
Equity ratioTotal equity divided by total assets, is a measurement of Volvo Car Group’s long-term solvency and financial leverage.
Net cash/net debtNet cash/net debt is an indicator of Volvo Car Group’s ability to meet its financial obligations. It is represented by liabilities to credit institutions, bonds and other interest-bearing non- current liabilities, less cash and cash equivalents and marketable securi-ties. If negative, the performance measure is referred to as net cash and if positive the performance measure is referred to as net debt.
LiquidityLiquidity consist of cash and cash equivalents, undrawn credit facilities and marketable securities.
EuropeEurope is defined as EU28+EFTA.
Passenger carsPassenger cars are vehicles with at least four wheels, used for the transport of passengers, and comprising no more than eight seats in addition to the driver’s seat.
Performance measures disclosed in the interim report are those that are deemed to give a relevant view of Volvo Car Group’s financial performance for a reader of the interim report. For a reconciliation of performance measures, refer to page 24.
DEFINITIONS OF PERFORMANCE MEASURES

24 OF 26
VOLVO CAR GROUP
INTERIM REPORT FIRST QUARTER 2018
RECONCILIATION TABLES OF PERFORMANCE MEASURES
Gross MarginQ1
2018Q1
2017Full year
2017
Gross income in % of Net revenue 20.1 22.7 22.1
EBIT MarginQ1
2018Q1
2017Full year
2017
Operating income (EBIT) in % of Net revenue 6.4 7.3 6.7
EBITDA/EBITDA MarginQ1
2018Q1
2017Full year
2017
Operating income 3,616 3,491 14,061
Depreciation and amortisation of non-current assets 3,247 2,870 12,098
EBITDA 6,863 6,361 26,159EBITDA in % of Net revenue 12.1 13.3 12.4
EQUITY RATIOMar 31,
2018Dec 31,
2017
Total equity 58,278 54,660
Total assets 196,285 190,164
Equity in % total assets 29.7 28.7
NET DEBT/NET CASH Mar 31,
2018Dec 31,
2017
Liabilities to credit institutions (non-current) 6,606 6,622
Bonds 1) 13,189 12,749
Other interest-bearing non-current liabilities 2) 84 84
Liabilities to credit institutions (current) 1,702 7,426
Marketable securities -2,859 -3,992
Cash and cash equivalents -29,108 -35,402
Net cash (Net debt if positive) -10,386 -12,513
1) The bond loans are presented above at amortised cost. The MEUR 500 bond is recognised in the balance sheet with a fair value adjustment and the fair value component amounted to MSEK -8 (-14).
2) Included in Other non-current liabilities in the Balance sheet.
LIQUIDITYMar 31,
2018Dec 31,
2017
Cash and cash equivalents 29,108 35,402
Marketable securities 2,859 3,992
Undrawn credit facilities 15,876 15,203
Liquidity 47,843 54,597
25 OF 26
VOLVO CAR GROUP
INTERIM REPORT FIRST QUARTER 2018
CONTACT
Nils MöskoVice President, Head of Investor Relations+46-(0)31–59 21 [email protected]
Volvo Car Group Headquarters405 31 Gothenburgwww.volvocars.com
The President and Chief Executive Officer certifies that the interim report gives a fair view of the performance of the business, position and income statements of Volvo Car AB (publ.) and Volvo Car Group, and describes the principal risks and uncertainties to which the Volvo Car Group is exposed.
Gothenburg, April 26th, 2018
Håkan SamuelssonPresident and Chief Executive Officer
This report has not been subject to review by Volvo Car AB’s (publ.) auditors.
The Volvo Car Group interim report on the second quarter 2018 will be published on July 19th, 2018.