Embed Size (px)
Citation preview

VOLVO CAR GROUP
FY 2017 resultS
Patrik Tolf, Deputy CFO & head of Group Finance Hans Oscarsson, Senior vice president finance & CFO
Nils Mösko, vice president & Head of investor relations

By accepting this document, the person to whom it is provided (the “Recipient”) agrees to be bound by the following obligations and limitations.
This document has been prepared and issued by Volvo Car AB (together with its subsidiaries, “Volvo Cars”).
The information contained in this document is derived from sources that have not been independently verified. Except in the case of fraudulent misrepresentation, no responsibility or liability is accepted by Volvo Cars or by any of its respective officers, employees, affiliates or agents in relation to the accuracy, completeness or sufficiency of any information contained herein or any other written or oral information made available by Volvo Cars in connection therewith or any data which any such information generates, or for any loss whatsoever arising from or in connection with the use of or reliance on this document and any such liability is expressly disclaimed. Analyses and opinions contained herein may be based on assumptions that, if altered, can change the analyses or opinions expressed. This document speaks as of the date hereof and in providing this document, Volvo Cars gives no undertaking and is under no obligation to provide the Recipient with access to any additional information or to update this document or to correct any inaccuracies in it which may become apparent. Volvo Cars’ past performance is not necessarily indicative of future results and nothing contained herein shall constitute any representation or warranty as to future performance of Volvo Cars or any security, credit, currency, rate or other market or economic measure. Nor does this document constitute a recommendation with respect to any securities.
VOLVO CAR GROUP RESULTS PRESENTATION JANUARY-DECEMBER 2017
DISCLAIMER
2
VOLVO CAR GROUP RESULTS PRESENTATION JANUARY-DECEMBER 2017
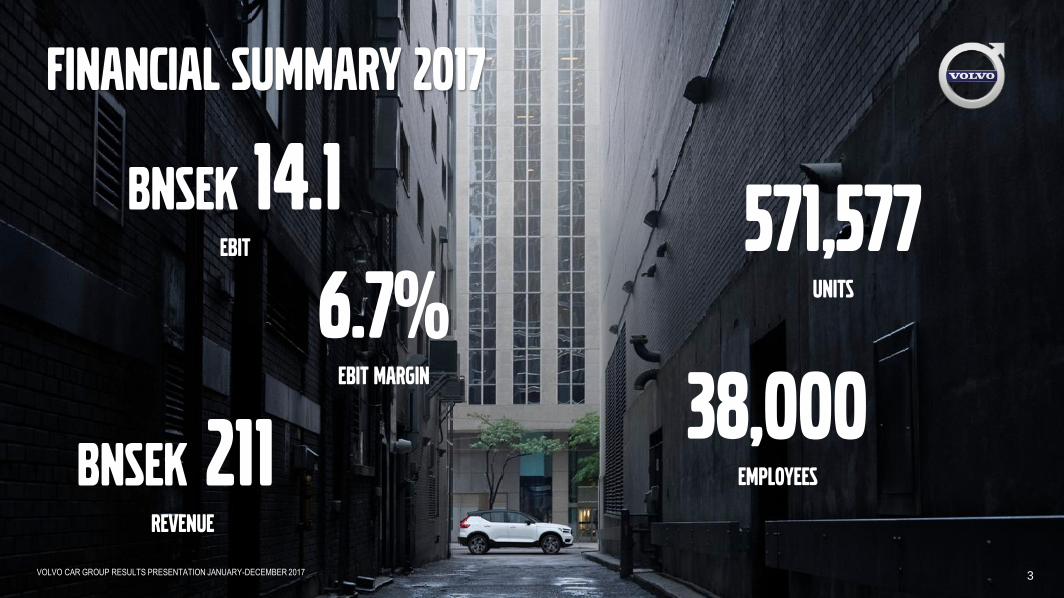
Financial Summary 2017
BNSEK 211 Revenue
BNSEK 14.1 ebit 571,577
units
6.7%Ebit margin
3
38,000EMPLOYEES

VOLVO CAR GROUP RESULTS PRESENTATION JANUARY-DECEMBER 2017
Comparable period: Jan – Dec 2016
Europe is defined as EU + EFTA
US –1.5% China +25.8%
EUROPE +2.8%
Global growth +7.0%
Volvo Car Group Sales
4

2017 highlights
Torslanda plant - at full speed
S90 - worldwide export from China
Sales in China – first time over 100,000
XC40 - start of production in Gent
Clear electrification strategy – T8 sales up 30 %
Subscription model – Care by Volvo
Complete SUV line up
VOLVO CAR GROUP RESULTS PRESENTATION JANUARY-DECEMBER 2017 5

Complete SUV Lineup
VOLVO CAR GROUP RESULTS PRESENTATION JANUARY-DECEMBER 2017 6
Fastest growing industry segment
More than 50% of Volvo Cars’ revenue

VOLVO CAR GROUP RESULTS PRESENTATION JANUARY-DECEMBER 2017
Financials
7
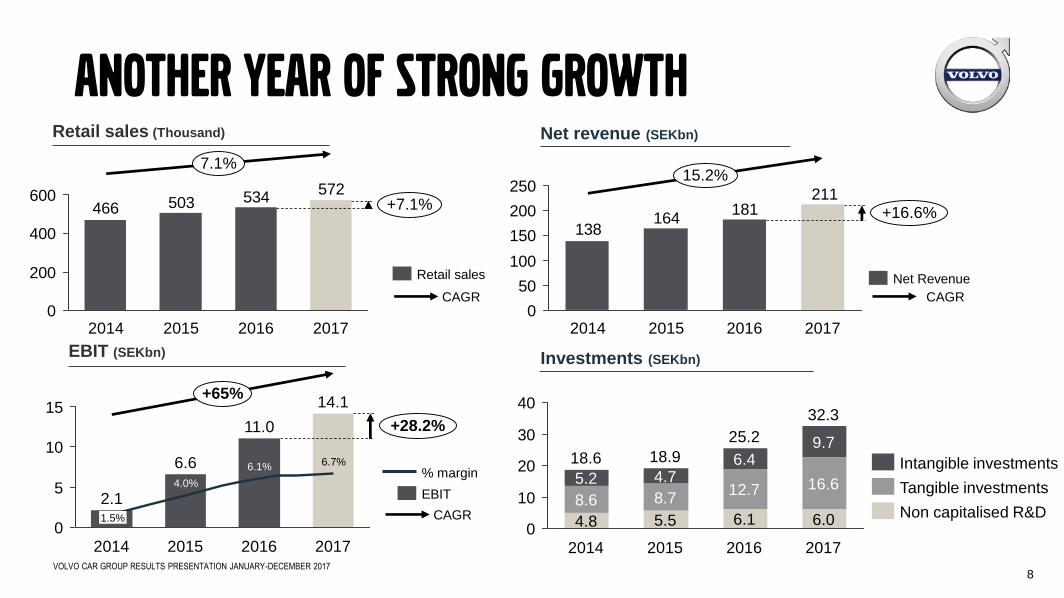
Another year of strong growthNet revenue (SEKbn)
VOLVO CAR GROUP RESULTS PRESENTATION JANUARY-DECEMBER 2017
211181
164138
0
50
100
150
200
250
+16.6%
15.2%
2017201620152014
8
Net Revenue
CAGR
EBIT (SEKbn)
0
5
10
15+28.2%
+65%
2017
14.1
6.7%
2016
11.0
6.1%
2015
6.6
4.0%
2014
2.11.5%
EBIT
% margin
CAGR0
10
20
30
40
2017
32.3
6.0
16.6
9.7
2016
25.2
6.1
12.7
6.4
2015
18.9
5.5
8.7
4.7
2014
18.6
4.8
8.6
5.2
Non capitalised R&D
Tangible investments
Intangible investments
Investments (SEKbn)
Retail sales (Thousand)
CAGR
572534503466
0
200
400
600+7.1%
7.1%
2017201620152014
Retail sales

Net revenue 2017 – 17% Organic growth
9
MSEK
FY 2017
+17%211,000
Other
8,000
Sales Mix and Pricing
7,500
Volume
14,500
FY 2016
181,000
VOLVO CAR GROUP RESULTS PRESENTATION JANUARY-DECEMBER 2017
VOLVO CAR GROUP RESULTS PRESENTATION JANUARY-DECEMBER 2017
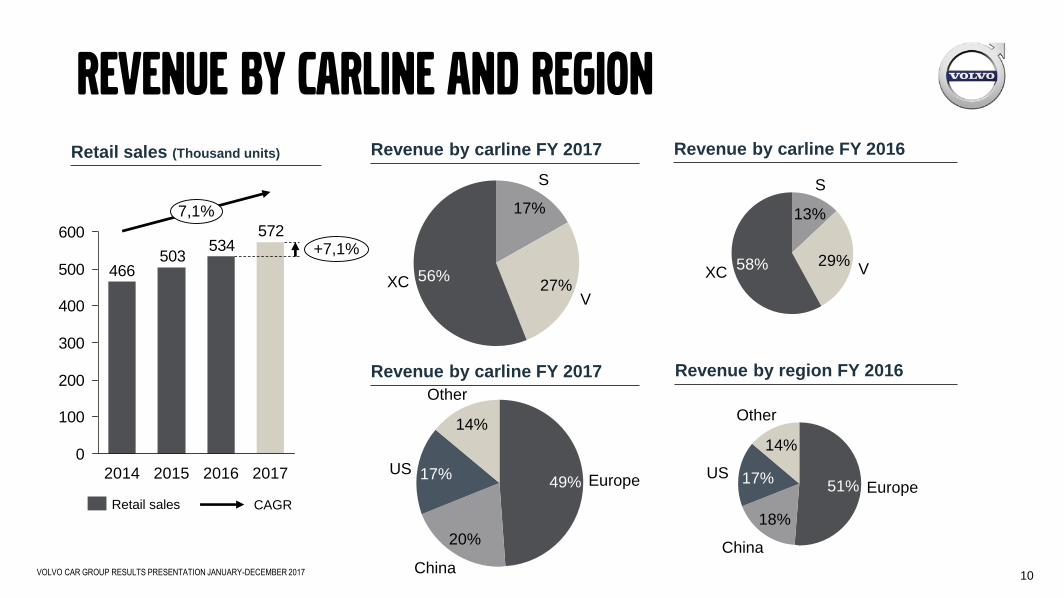
XC 56%
V27%
S
17%
49% Europe
20%
China
17%US
14%
Other
Revenue by carline FY 2017 Revenue by carline FY 2016
Revenue by carline and region
Revenue by carline FY 2017 Revenue by region FY 2016
17%
China
18%
Europe51%
14%
Other
US
XC58% V
29%
S
13%
10
Retail sales (Thousand units)
572534
503466
0
100
200
300
400
500
600+7,1%
7,1%
2017201620152014
Retail sales CAGR

ebit 2017 – 28% improvement in transition year
11
MSEK
-500
+28%
2017
14,100
Fixed cost, FX and OtherSales Mix and Pricing
-300
Volume
3,900
2016
11,000
6.1% EBIT
margin
6.7%EBIT
margin
VOLVO CAR GROUP RESULTS PRESENTATION JANUARY-JUNE 2017

Cash Flow – Investments financed
VOLVO CAR GROUP RESULTS PRESENTATION JANUARY-DECEMBER 2017
* Change in inventories, accounts receivables and accounts payables, **Adjusted for interests and other items, *** Adjusted for exchange on cash
500
2017 FY Liquidity
54,600
35,400
4,000
15,200
Financing***Strategic
investments
-2,800
Operating
investments**
-24,300
Working capital*
-2,800
EBITDA
26,200
2016 FY Liquidity
49,600
38,600
4,700
6,300
CashMarketable securitiesUndrawn credit facilities
12
MSEK
Free cash flow from recurring
business MSEK -900

R&D Expenses (SEKbn)
0
2
4
6
8
10
12
8.8
5.4%
2014
7.2
2017
10.2
4.8%
2016
10.2
5.6%
2015
5.2%
R&D expenses% of Revenue
Investments (SEKbn)
13.6%
2014
18.6
4.8
8.6
5.2
25.2
6.1
12.7
6.4
13.9%
2015 2016
15.3%
9.7
18.9
5.5
8.7
4.7
11.5%
2017
6.0
32.3
16.6
Tangible investments
Non capitalised R&DIntangible investments
% of Revenue
VOLVO CAR GROUP RESULTS PRESENTATION JANUARY-DECEMBER 2017 13
Investments and R&D
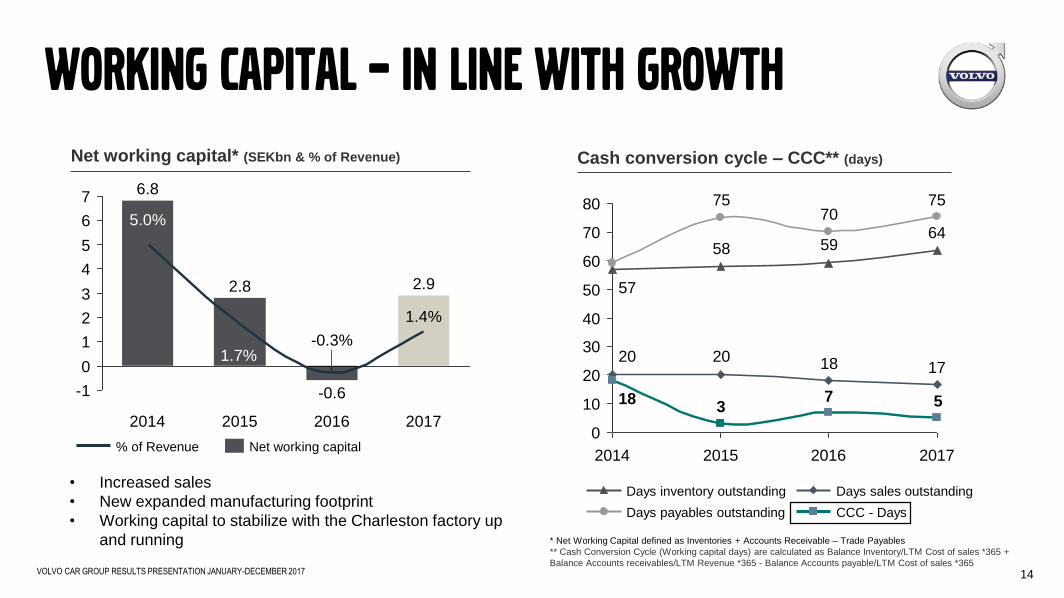
Net working capital* (SEKbn & % of Revenue)
* Net Working Capital defined as Inventories + Accounts Receivable – Trade Payables
** Cash Conversion Cycle (Working capital days) are calculated as Balance Inventory/LTM Cost of sales *365 +
Balance Accounts receivables/LTM Revenue *365 - Balance Accounts payable/LTM Cost of sales *365
Cash conversion cycle – CCC** (days)
-1
0
1
2
3
4
5
6
7
2017
2.9
1.4%
-0.6
-0.3%
2.8
1.7%
2016
6.8
5.0%
20152014
Net working capital% of Revenue
645958
57
7570
75
17182020
573
18
0
10
20
30
40
50
60
70
80
2014 2015 2016 2017
CCC - Days
Days sales outstanding
Days payables outstanding
Days inventory outstanding
VOLVO CAR GROUP RESULTS PRESENTATION JANUARY-DECEMBER 2017 14
Working capital – in line with growth
• Increased sales
• New expanded manufacturing footprint
• Working capital to stabilize with the Charleston factory up
and running

Liquidity & debt – comfortable net cash position
VOLVO CAR GROUP RESULTS PRESENTATION JANUARY-DECEMBER 2017
27,700
Debt
26,900
6,700
7,400
12,800
Liquidity
54,600
35,400
4,000
15,200
12,500
Short-term Debt
Bonds
Long-term Debt
Cash & Cash Equivalents
Marketable Securities
Undrawn Credit Facilities
MSEK
Net cash position of SEK 12,5bn
(2016 SEK18.9bn)
15

Balanced Amortisation schedule
VOLVO CAR GROUP RESULTS PRESENTATION JANUARY-DECEMBER 2017
5,800
1,200
2017
Dec 31
54,600
4,900
1,800
2020
3,000
2019
7,000
1,450
6,700
2018
4,900
3,000
202520222021
Repayment of CDB EUR loanLoansLiquidity Bonds
MSEK
16
51% 49% BondsLoans
Funding by type

VOLVO CAR GROUP RESULTS PRESENTATION JANUARY-DECEMBER 2017 17
Looking ahead

VOLVO CAR GROUP RESULTS PRESENTATION JANUARY-DECEMBER 2017 18
Volvo Car Group
Volvo Cars Polestar Zenuity Lynk & CoSubscription
Business

Outlook 2018
VOLVO CAR GROUP RESULTS PRESENTATION JANUARY-DECEMBER 2017 19
Further sales progress - complete SUV line up
New disruption business opportunities
Complete product portfolio renewal
Truly global manufacturing footprint
Continued strong growth and improved profits

VOLVO CAR GROUP RESULTS PRESENTATION JANUARY-DECEMBER 2017
Questions
20
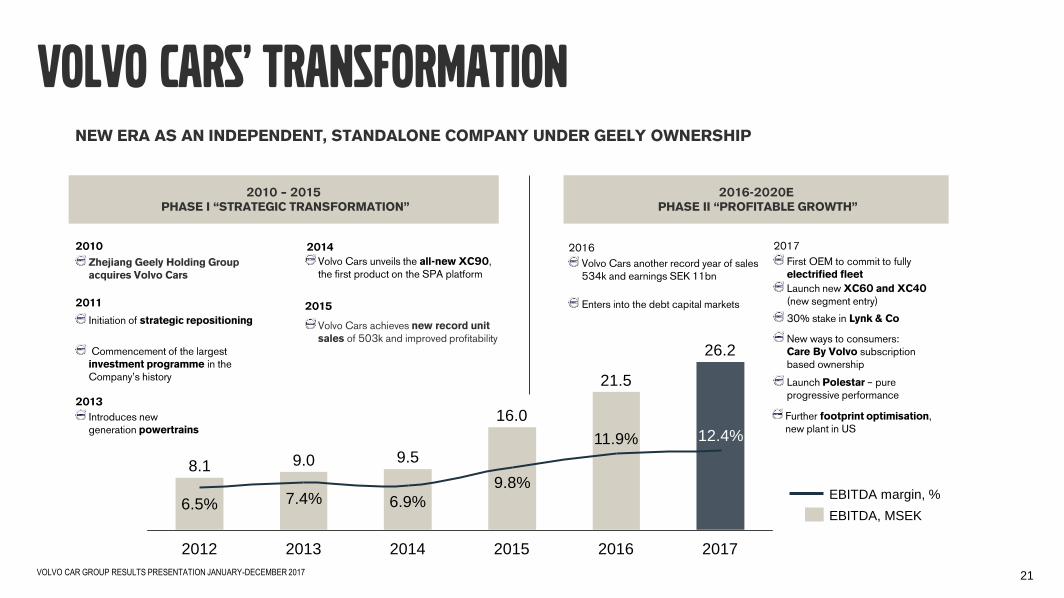
NEW ERA AS AN INDEPENDENT, STANDALONE COMPANY UNDER GEELY OWNERSHIP
Zhejiang Geely Holding Group acquires Volvo Cars
2010
2013
Volvo Cars unveils the all-new XC90, the first product on the SPA platform
2014
Volvo Cars achieves new record unit sales of 503k and improved profitability
2015
Further footprint optimisation, new plant in US
Initiation of strategic repositioning
Commencement of the largest investment programme in the Company’s history
2011
2010 – 2015PHASE I “STRATEGIC TRANSFORMATION”
2016-2020EPHASE II “PROFITABLE GROWTH”
Introduces new generation powertrains
2016
Volvo Cars another record year of sales 534k and earnings SEK 11bn
Enters into the debt capital markets
Launch Polestar – pure progressive performance
Launch new XC60 and XC40 (new segment entry)
2017
First OEM to commit to fully electrified fleet
New ways to consumers:Care By Volvo subscription based ownership
30% stake in Lynk & Co
Volvo Cars’ Transformation
2017
26.2
12.4%
2016
21.5
11.9%
2015
16.0
9.8%
2014
9.5
6.9%
2013
9.0
7.4%
2012
8.1
6.5%EBITDA margin, %
EBITDA, MSEK
VOLVO CAR GROUP RESULTS PRESENTATION JANUARY-DECEMBER 2017 21

VOLVO CAR GROUP RESULTS PRESENTATION JANUARY-DECEMBER 2017
Jan-Dec
2017 total
Working
Capital
-2,800
Payables
8,200
Receivables
-1,500
Inventory
-9,500
2017
Dec 31
5.0
Payables
-5.4
Receivables
-1.2
Inventory
4.6
2016
Dec 31
7.0
Change in Working capital (MSEK) 12 months rolling CCC* days
Appendix 1:
Working Capital and CCC days
22
* Cash Conversion Cycle (Working capital days) are calculated as Balance Inventory/LTM Cost of sales *365 +
Balance Accounts receivables/LTM Revenue *365 - Balance Accounts payable/LTM Cost of sales *365

VOLVO CAR GROUP RESULTS PRESENTATION JANUARY-DECEMBER 2017
Appendix 2:
Number of employees
23
* Cash Conversion Cycle (Working capital days) are calculated as Balance Inventory/LTM Cost of sales *365 +
Balance Accounts receivables/LTM Revenue *365 - Balance Accounts payable/LTM Cost of sales *365
Number of employees* (Thousand)
30.000
10.000
20.000
0
5.000
25.000
15.000
40.000
35.000
13,5%
2017
+25,0%
38.000
26.00028.100
2014 2015
30.400
2016
Sweden
Other
China
Americas
Europe, other
CAGR

Appendix 3:
Retail sales
VOLVO CAR GROUP RESULTS PRESENTATION JANUARY-DECEMBER 2017 24

Appendix 4:
Key figures
VOLVO CAR GROUP RESULTS PRESENTATION JANUARY-DECEMBER 2017 25

Appendix 5:
Definitions of performance measures
VOLVO CAR GROUP RESULTS PRESENTATION JANUARY-DECEMBER 2017 26

Appendix 6:
Reconciliation tables of performance measures
VOLVO CAR GROUP RESULTS PRESENTATION JANUARY-DECEMBER 2017 27

Appendix 7:
Reconciliation tables of performance measures contd.
VOLVO CAR GROUP RESULTS PRESENTATION JANUARY-DECEMBER 2017 28
VOLVO CAR GROUP RESULTS PRESENTATION JANUARY-DECEMBER 2017 29