Embed Size (px)
Citation preview
VOLUNTEERTOTAL PHOSPHORUS
MONITORING PROGRAMWATER ACTIONVOLUNTEERS (WAV) STREAM MONITORING
LINDSEY ALBRIGHT AND KRIS STEPENUCKILANA HAIMES AND TIM ASPLUND
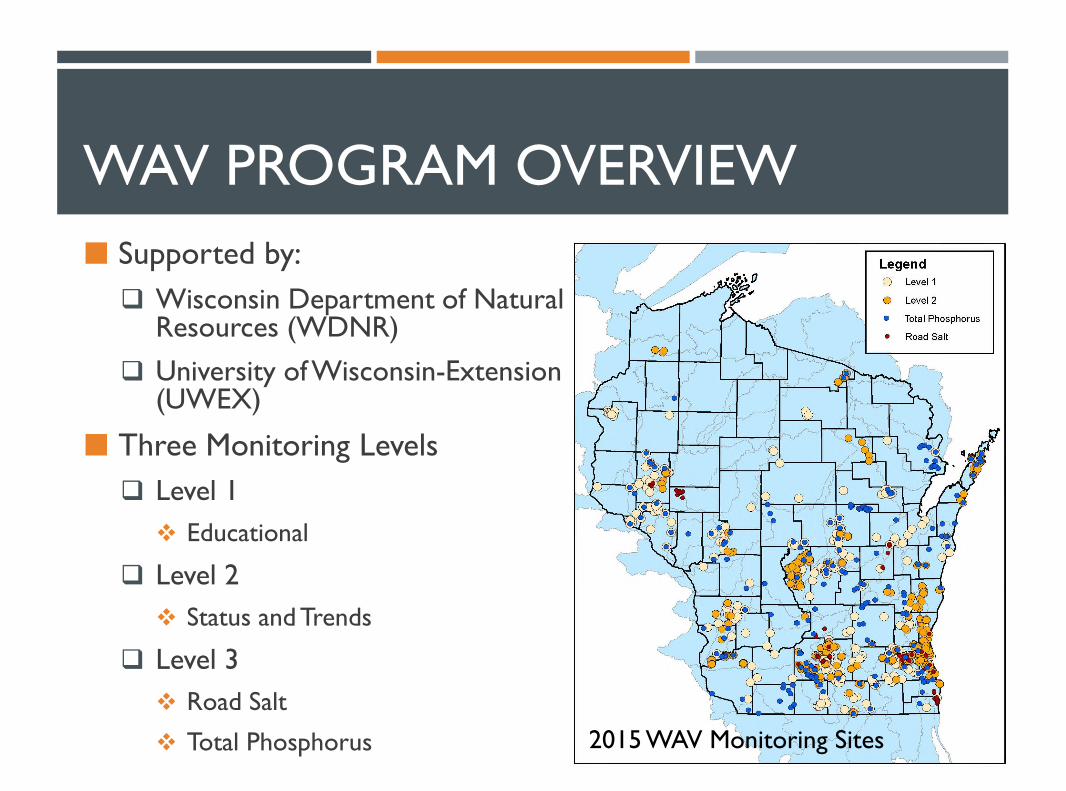
WAV PROGRAM OVERVIEW
Supported by:
Wisconsin Department of NaturalResources (WDNR)
University of Wisconsin-Extension(UWEX)
Three Monitoring Levels
Level 1
Educational
Level 2
Status and Trends
Level 3
Road Salt
Total Phosphorus 2015 WAV Monitoring Sites
PROGRAM GOALS
Support WDNR efforts to assess in-streamphosphorus levels across the state
Characterize the total phosphorus concentrationsmost commonly occurring in the streams
Primary algae and aquatic plant "growing season”
Engage WAV Stream Monitors in the sampling processto help alleviate biologist workload
More data is needed to assess water quality on awidescale basis

PROGRAM TIMELINE
Developed the Wisconsin’sConsolidated Assessment and ListingMethodology (WisCALM) document
Established numeric criteria for in-streamphosphorus levels
Began monitoring streams across thestate to collect the necessary data todevelop impaired waters lists
2010
2010
2010
2010
2010
2011
2012
2013
2014
2015
2016
2010

PROGRAM TIMELINE
WAV staff worked with the WDNRStreams Technical Team to develop:
Methods for WAV volunteers to followwhen collecting water samples
Volunteer training plan
Quality Assurance Project Plan
2010
2010
2010
2010
2011
2012
2013
2014
2015
2016
2010

SAMPLING METHODOLOGY
Water samples arecollected:
May through October
Approx. 30 days apart
Provided with samplingpole for safety
Acid preservativeadded to sample
Shipped on ice toWSLH
QA/QC at 10% of sites

PROGRAM TIMELINE
WAV staff worked with the WDNRStreams Technical Team to develop:
Methods for WAV volunteers to followwhen collecting water samples
Volunteer training plan
Quality Assurance Project Plan
12 sites were monitored with 100%success
2010
2010
2010
2010
2011
2012
2013
2014
2015
2016
2010
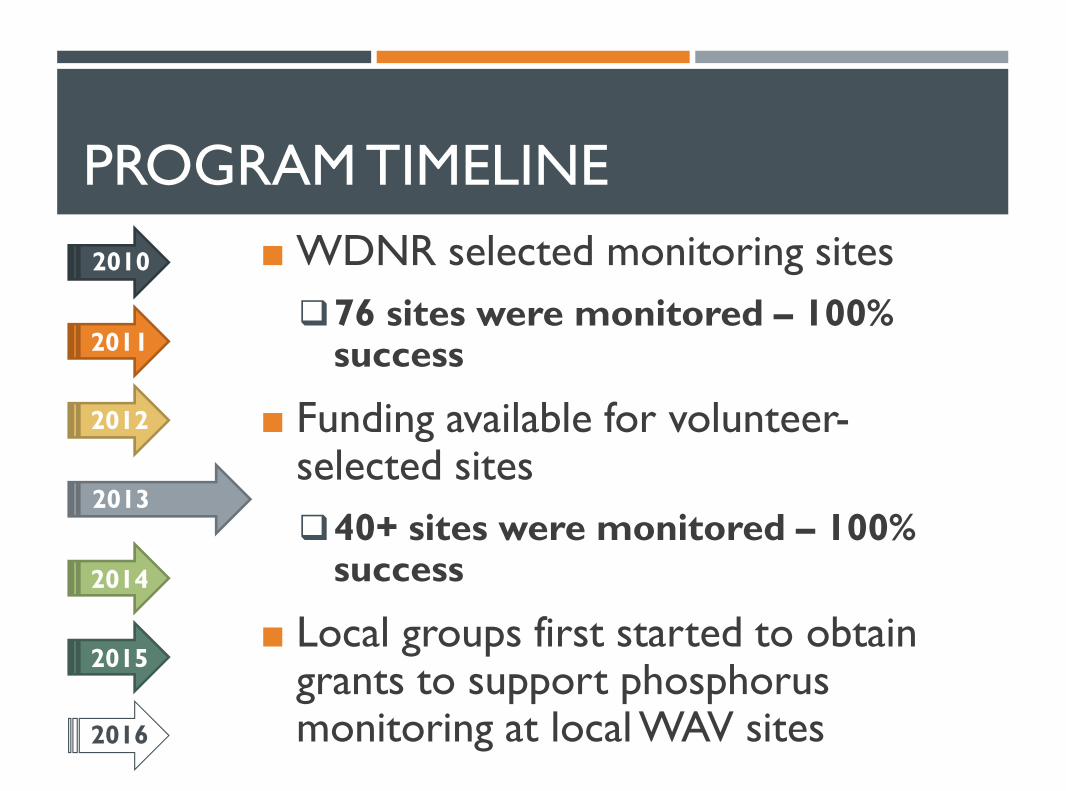
PROGRAM TIMELINE
WDNR selected monitoring sites
76 sites were monitored – 100%success
Funding available for volunteer-selected sites
40+ sites were monitored – 100%success
Local groups first started to obtaingrants to support phosphorusmonitoring at local WAV sites
2010
2010
2010
2010
2010
2011
2012
2013
2014
2015
2016
2010

PROGRAM TIMELINE
WDNR selected monitoring sites
98 sites were monitored – 99.5%success
WAV volunteer support saved WDNR$22,600
No WAV selected sites monitored
Local groups obtain grants to supportmonitoring
Over $47,000 in monitoring and shippingcosts
2010
2010
2010
2010
2010
2011
2012
2013
2014
2015
2016
2010
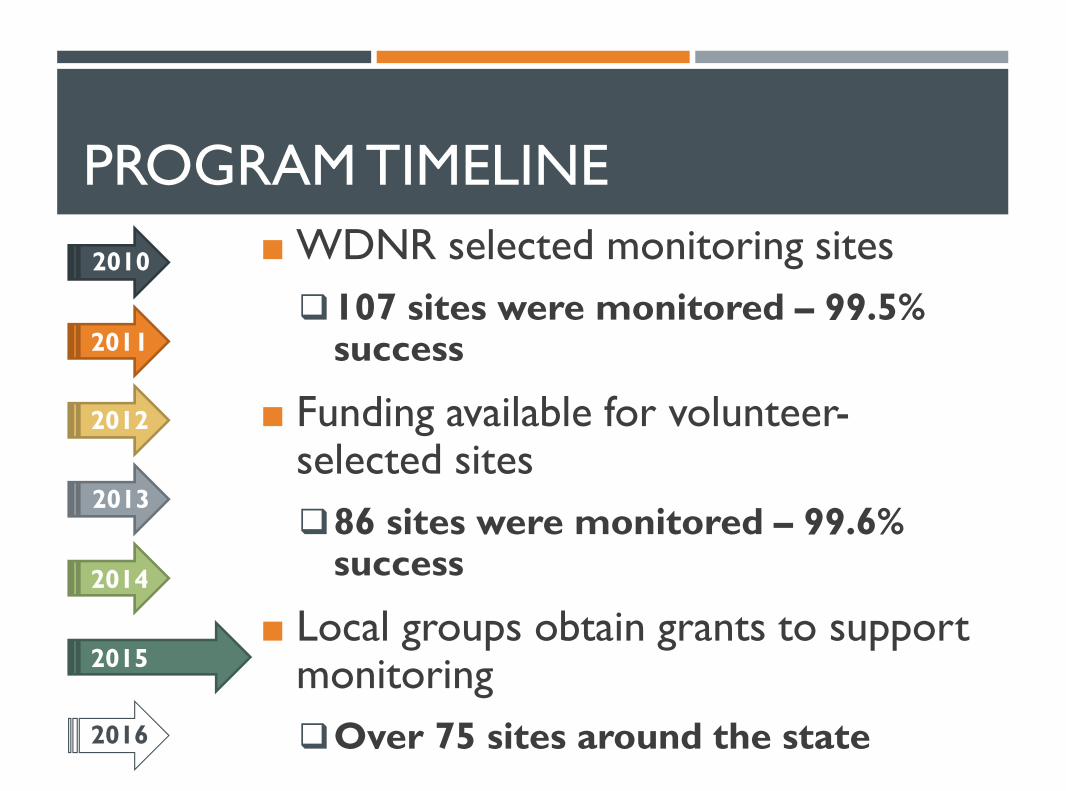
PROGRAM TIMELINE
WDNR selected monitoring sites
107 sites were monitored – 99.5%success
Funding available for volunteer-selected sites
86 sites were monitored – 99.6%success
Local groups obtain grants to supportmonitoring
Over 75 sites around the state
2010
2010
2010
2010
2010
2011
2012
2013
2014
2015
2016
2010

PROGRAM TIMELINE
WDNR selected monitoring sites
92 sites are being monitored
Funding available for volunteer-selected sites
50 sites are being monitored
Local groups obtain grants to supportmonitoring
Over 80 sites around the state
2010
2010
2010
2010
2010
2011
2012
2013
2014
2015
2016
2010
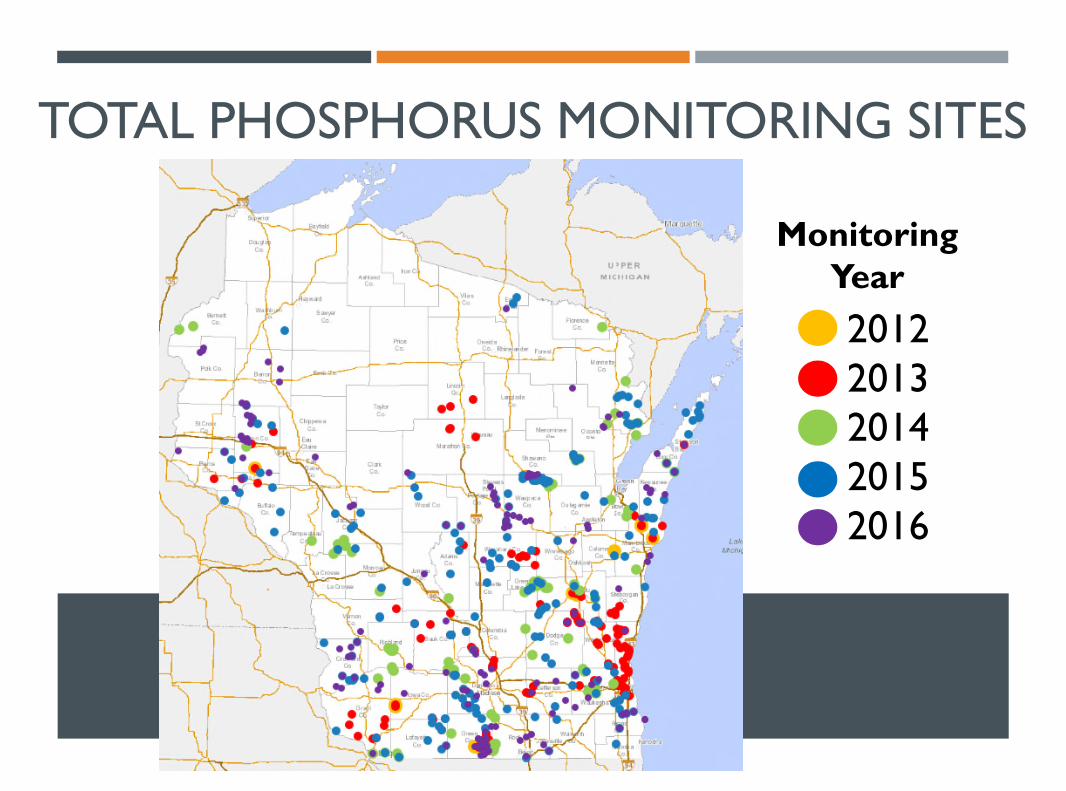
TOTAL PHOSPHORUS MONITORING SITES
20122013201420152016
MonitoringYear
KEY CONSIDERATIONS FOR PROGRAM
Concise methodology and clear expectations
Communication, communication, communication!
Follow up with volunteers
Communication about lab results
End of season survey
Monitoring reports

MONITORING REPORTS

KEY CONSIDERATIONS FOR PROGRAM
Concise methodology and clear expectations
Communication, communication, communication!
Follow up with volunteers
Communication about lab results
End of season survey
Monitoring reports
Training resources for the volunteers
Online TP monitoring quiz for returning volunteers
WAV monitoring videos
BENEFITS TOVOLUNTEER ENGAGEMENT
For WDNR
Money and time savingsfor staff
Lots of data for little $
More eyes on theground throughout thestate
Increasedvolunteer/DNR staffinteraction
For WAV monitors
Expanded WAVmonitoring program
Collecting useful data
Increased engagementin the WAV program asa whole
Increased knowledgeabout their WAV site(s)

ACKNOWLEDGMENTS

QUESTIONS?Lindsey Albright – Dakota County Soil and Water – [email protected]
Kris Stepenuck – University ofVermont – [email protected] Haimes – Wisconsin DNR – [email protected] Asplund – Wisconsin DNR – [email protected]


![Simultaneous Measurement of Total Nitrogen and Phosphorus ... · digestion procedures found in U.S. EPA 351.2 (Total Kjeldahl Nitrogen [TKN]) and 365.4 (Total Kjeldahl Phosphorus](https://img.pdfslide.us/doc/110x75/60608f94db713f558836050e/simultaneous-measurement-of-total-nitrogen-and-phosphorus-digestion-procedures.jpg)