Embed Size (px)
Citation preview
Estimation of Total Nitrogen and Total Phosphorus in Streams of the Middle Columbia River Basin (Oregon, Washington, and Idaho) Using SPARROW Models, with Emphasis on the Yakima River Basin, Washington
Scientific Investigations Report 2013–5199
Prepared in cooperation with Washington State Department of Ecology and U.S. Environmental Protection Agency
U.S. Department of the InteriorU.S. Geological Survey

Estimation of Total Nitrogen and Total Phosphorus in Streams of the Middle Columbia River Basin (Oregon, Washington, and Idaho) Using SPARROW models, with Emphasis on the Yakima River Basin, Washington
By Henry M. Johnson, Robert W. Black, and Daniel R. Wise
Prepared in cooperation with Washington State Department of Ecology and U.S. Environmental Protection Agency
Scientific Investigations Report 2013–5199
U.S. Department of the InteriorU.S. Geological Survey

U.S. Department of the InteriorSALLY JEWELL, Secretary
U.S. Geological SurveySuzette M. Kimball, Acting Director
U.S. Geological Survey, Reston, Virginia: 2013
For more information on the USGS—the Federal source for science about the Earth, its natural and living resources, natural hazards, and the environment, visit http://www.usgs.gov or call 1–888–ASK–USGS.
For an overview of USGS information products, including maps, imagery, and publications, visit http://www.usgs.gov/pubprod
To order this and other USGS information products, visit http://store.usgs.gov
Any use of trade, firm, or product names is for descriptive purposes only and does not imply endorsement by the U.S. Government.
Although this information product, for the most part, is in the public domain, it also may contain copyrighted materials as noted in the text. Permission to reproduce copyrighted items must be secured from the copyright owner.
Suggested citation:Johnson, H.M., Black, R.W., and Wise, D.R., 2013, Estimation of total nitrogen and total phosphorus in streams of the Middle Columbia River Basin (Oregon, Washington, and Idaho) using SPARROW models, with emphasis on the Yakima River Basin, Washington: U. S. Geological Survey Scientific Investigations Report 2013–5199, 28 p., http://dx.doi.org/10.3133/sir20135199.
ISSN 2328-0328 (online)
iii
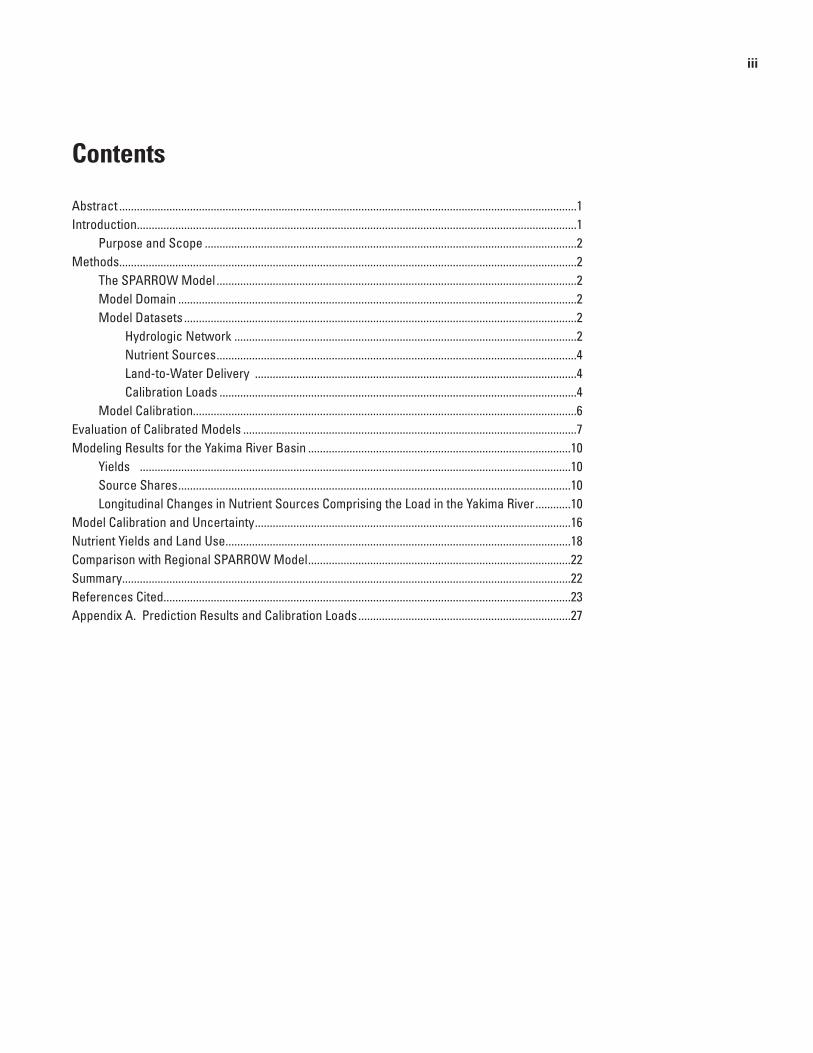
Contents
Abstract ...........................................................................................................................................................1Introduction.....................................................................................................................................................1
Purpose and Scope ..............................................................................................................................2Methods...........................................................................................................................................................2
The SPARROW Model ..........................................................................................................................2Model Domain .......................................................................................................................................2Model Datasets .....................................................................................................................................2
Hydrologic Network ....................................................................................................................2Nutrient Sources ..........................................................................................................................4Land-to-Water Delivery .............................................................................................................4Calibration Loads .........................................................................................................................4
Model Calibration..................................................................................................................................6Evaluation of Calibrated Models .................................................................................................................7Modeling Results for the Yakima River Basin .........................................................................................10
Yields ..................................................................................................................................................10Source Shares .....................................................................................................................................10Longitudinal Changes in Nutrient Sources Comprising the Load in the Yakima River ............10
Model Calibration and Uncertainty ...........................................................................................................16Nutrient Yields and Land Use .....................................................................................................................18Comparison with Regional SPARROW Model .........................................................................................22Summary........................................................................................................................................................22References Cited..........................................................................................................................................23Appendix A. Prediction Results and Calibration Loads ........................................................................27
iv
Figures 1. Map showing land cover and major rivers of the Middle Columbia River Basin,
Oregon, Washington, and Idaho.................................................................................................3 2. Map showing model residuals of stream load for the total nitrogen SPARROW
model of the Middle Columbia River Basin, Oregon, Washington, and Idaho ...................8 3. Map showing model residuals of stream load for the total phosphorus SPARROW
model of the Middle Columbia River Basin, Oregon, Washington, and Idaho ...................9 4. Map showing incremental yield of total nitrogen for the Yakima River Basin,
Washington ..................................................................................................................................11 5. Map showing incremental yield of total phosphorus for the Yakima River Basin,
Washington ..................................................................................................................................12 6. Map showing largest source of total nitrogen in each incremental catchment in
the Yakima River Basin, Washington .......................................................................................13 7. Map showing largest source of total phosphorus in each incremental catchment
in the Yakima River Basin, Washington...................................................................................14 8. Graph showing sources of total nitrogen contributing to the total nitrogen load in
the Yakima River, Washington ..................................................................................................15 9. Graph showing sources of total phosphorus contributing to the total phosphorus
load in the Yakima River, Washington .....................................................................................15 10. Boxplot showing distribution of total nitrogen yield in catchments with a single
dominant land use in the Yakima River Basin, Washington ................................................19 11. Boxplot showing distribution of total phosphorus yield in catchments with a single
dominant land use in the Yakima River Basin, Washington ................................................19
Tables 1. Nutrient sources and model statistics for the total nitrogen SPARROW model of
the Middle Columbia River Basin, Oregon, Washington, and Idaho ....................................5 2. Nutrient sources and model statistics for the total phosphorus SPARROW model
of the Middle Columbia River Basin, Oregon, Washington, and Idaho ...............................6 3. Values of total nitrogen and total phosphorus yield from published reports and
values of total nitrogen and total phosphorus yield calculated from data in published reports ........................................................................................................................20
4. Comparison of model diagnostic statistics and directly comparable source-term model coefficients for the SPARROW models developed for the United States Pacific Northwest and the Middle Columbia River Basin, Oregon, Washington, and Idaho ....................................................................................................................................21
v
Conversion Factors, Datum, and Abbreviations and Acronyms
Conversion Factors
SI to Inch/Pound
Multiply By To obtain
Flow rate
cubic meter per second (m3/s) 35.3107 cubic foot per second (ft3/s)Length
kilometer (km) 0.6214 mile (mi)
Area
square kilometer (km2) 247.1 acre
Masskilogram per year (kg/yr) 2.205 pound avoirdupois per year (lb/yr)
Application ratekilogram per hectare (kg/ha) 0.8921 pound per acre (lb/acre)kilogram per hectare per year
[(kg/ha)/yr]0.8921 pound per acre per year
[(lb/acre)/yr]kilogram per square kilometer per
year [(kg/km2)/yr]0.008921 pound per acre per year
[(lb/acre)/yr]
Concentrations of chemical constituents in water are given either in milligrams per liter (mg/L) or micrograms per liter (µg/L).
Datum
Horizontal coordinate information is referenced to the North American Datum of 1927 (NAD 27).
Abbreviations and Acronyms
Abbreviation or acronym
Definition
IQR interquartile rangeNAWQA National Water-Quality Assessment ProgramNHD National Hydrography DatasetNLLS nonlinear least squares regressionPNW Pacific NorthwestRK river kilometerRMSE root mean squared errorSPARROW model Spatially Referenced Regression on Watershed attributes modelTN total nitrogenTP total phosphorusEPA U.S. Environmental Protection AgencyUSGS U.S. Geological SurveyWDOE Washington State Department of EcologyWWTP wastewater treatment plant

vi
Estimation of Total Nitrogen and Total Phosphorus in Streams of the Middle Columbia River Basin (Oregon, Washington, and Idaho) Using SPARROW Models, with Emphasis on the Yakima River Basin, Washington
By Henry M. Johnson, Robert W. Black, and Daniel R. Wise
AbstractThe watershed model SPARROW (Spatially Related
Regressions on Watershed attributes) was used to predict total nitrogen (TN) and total phosphorus (TP) loads and yields for the Middle Columbia River Basin in Idaho, Oregon, and Washington. The new models build on recently published models for the entire Pacific Northwest, and provide revised load predictions for the arid interior of the region by restricting the modeling domain and recalibrating the models. Results from the new TN and TP models are provided for the entire region, and discussed with special emphasis on the Yakima River Basin, Washington.
In most catchments of the Yakima River Basin, the TN and TP in streams is from natural sources, specifically nitrogen fixation in forests (TN) and weathering and erosion of geologic materials (TP). The natural nutrient sources are overshadowed by anthropogenic sources of TN and TP in highly agricultural and urbanized catchments; downstream of the city of Yakima, most of the load in the Yakima River is derived from anthropogenic sources. Yields of TN and TP from catchments with nearly uniform land use were compared with other yield values and export coefficients published in the scientific literature, and generally were in agreement. The median yield of TN was greatest in catchments dominated by agricultural land and smallest in catchments dominated by grass and scrub land. The median yield of TP was greatest in catchments dominated by forest land, but the largest yields (90th percentile) of TP were from agricultural catchments. As with TN, the smallest TP yields were from catchments dominated by grass and scrub land.
IntroductionNumerous streams and rivers throughout the Middle
Columbia River Basin do not meet State water-quality standards directly or indirectly because of nutrient enrichment (Oregon Department of Environmental Quality, 2013; Idaho
Department of Environmental Quality, 2013; Washington Department of Ecology, 2013a). High concentrations of nitrogen and phosphorus nourish communities of algae and photosynthetic cyanobacteria, which can cause large diurnal swings in dissolved oxygen and pH that can be toxic to sensitive fish species, including threatened and endangered salmonids. Decomposition of those communities in the late summer and autumn consumes dissolved oxygen that can stress or kill aquatic organisms (Carter, 2005; Wise and others, 2009). Nutrient enrichment also affects the cost of treatment and the quality of drinking water. Algae cause taste and odor issues in public-water supplies and the organic carbon content of the organisms contributes to the production of harmful disinfection byproducts in treated drinking water. Blooms of toxic photosynthetic cyanobacteria have been documented throughout the Pacific Northwest (PNW) (Oregon Health Authority, 2013; Washington Department of Ecology, 2013b). These blooms increase the expense of treating drinking water and are a public health hazard (Stone and Hitchko, 2009).
Water-quality models can help regulatory and management agencies address nutrient issues by providing insight into sources, transport paths, and transformation mechanisms. Since 2006, the U.S. Geological Survey (USGS) has been developing SPARROW (Spatially Related Regressions on Watershed attributes) models for the PNW as part of the National Water-Quality Assessment (NAWQA) Program. New SPARROW models for total nitrogen (TN) and total phosphorus (TP) for the PNW were recently published by Wise and Johnson (2013). These models updated the original models (Wise and Johnson, 2011) with a refined hydrologic network, updated nutrient source data, and revised calibration load estimates. In 2011, the U.S. Environmental Protection Agency (EPA) and the Washington State Department of Ecology (WDOE) requested assistance from the USGS in understanding the sources and transport of nutrients in the Yakima River Basin, Washington. Although the Wise and Johnson (2013) SPARROW models can provide such information, it was expected that the models could be improved by recalibrating them for a region that excluded the wet, western areas of Oregon and Washington.
2 Total Nitrogen and Total Phosphorus, Middle Columbia River Basin, Using SPARROW Models, Emphasis on Yakima River Basin, Washington
Purpose and Scope
This report describes the methods used to develop and the results of two SPARROW surface-water nutrient models of the Middle Columbia Basin, Oregon, Washington, and Idaho. The objectives of this study were (1) to recalibrate the Wise and Johnson (2013) PNW SPARROW models for TN and TP for a modeling domain limited to the Middle Columbia River Basin, (2) to predict the nutrient load in monitored and unmonitored streams in the Yakima River Basin, and (3) to evaluate the relative importance of the modeled TN and TP sources to the nutrient load of streams in the Yakima River Basin.
Methods
The SPARROW Model
The SPARROW model is a hybrid statistical and mechanistic model for estimating the movement of mass through the landscape under long-term, steady-state conditions (Schwarz and others, 2006). A calibrated model provides predictions of the annual load and annual yield (load per unit area) for the constituent of interest (TN and TP for this report) for every reach in the modeled surface-water network.
The SPARROW model uses data describing catchment attributes (nutrient sources, landscape characteristics, and stream and water body properties) to explain the spatial variation in estimated, mean annual stream load (expressed as kilograms per year). Estimated, mean annual stream loads are the dependent variable (calibration dataset) for the model, and the catchment attributes are the explanatory variables. The model uses a weighted nonlinear least-squares (NLLS) regression to estimate coefficients for the terms representing catchment attributes. Confidence intervals for the estimated coefficients are obtained by resampling using non-parametric bootstrap analysis as described by Schwarz and others (2006).
Model Domain
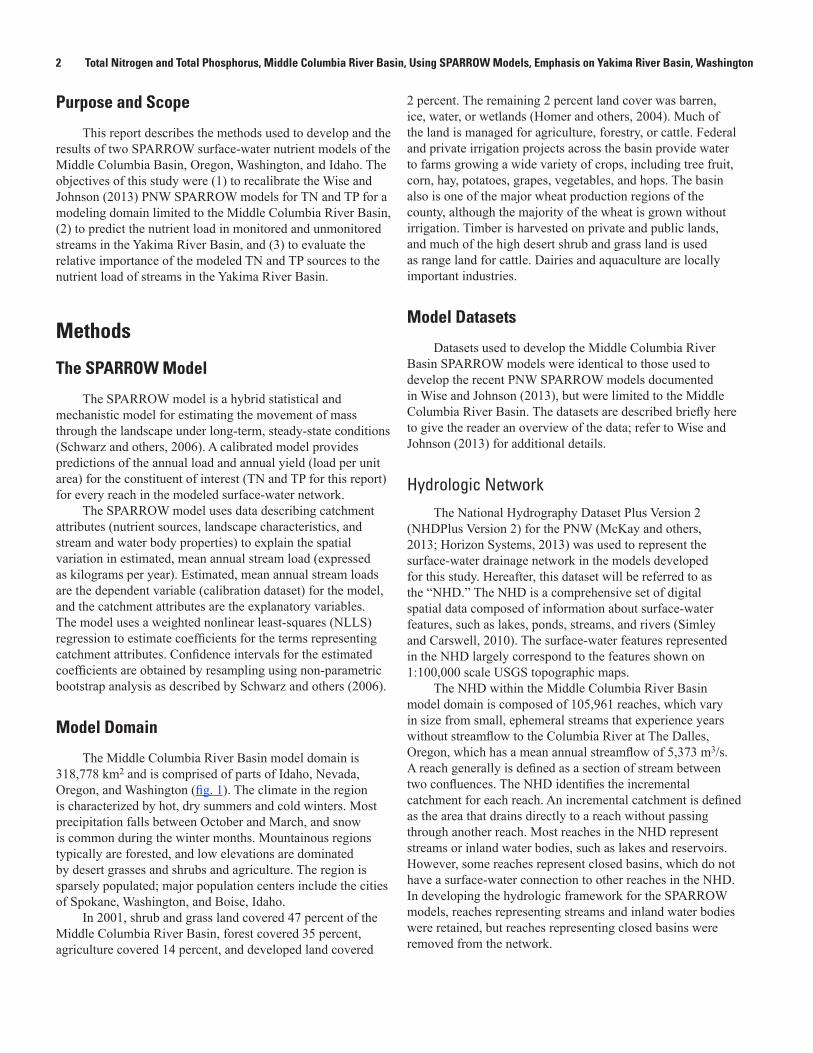
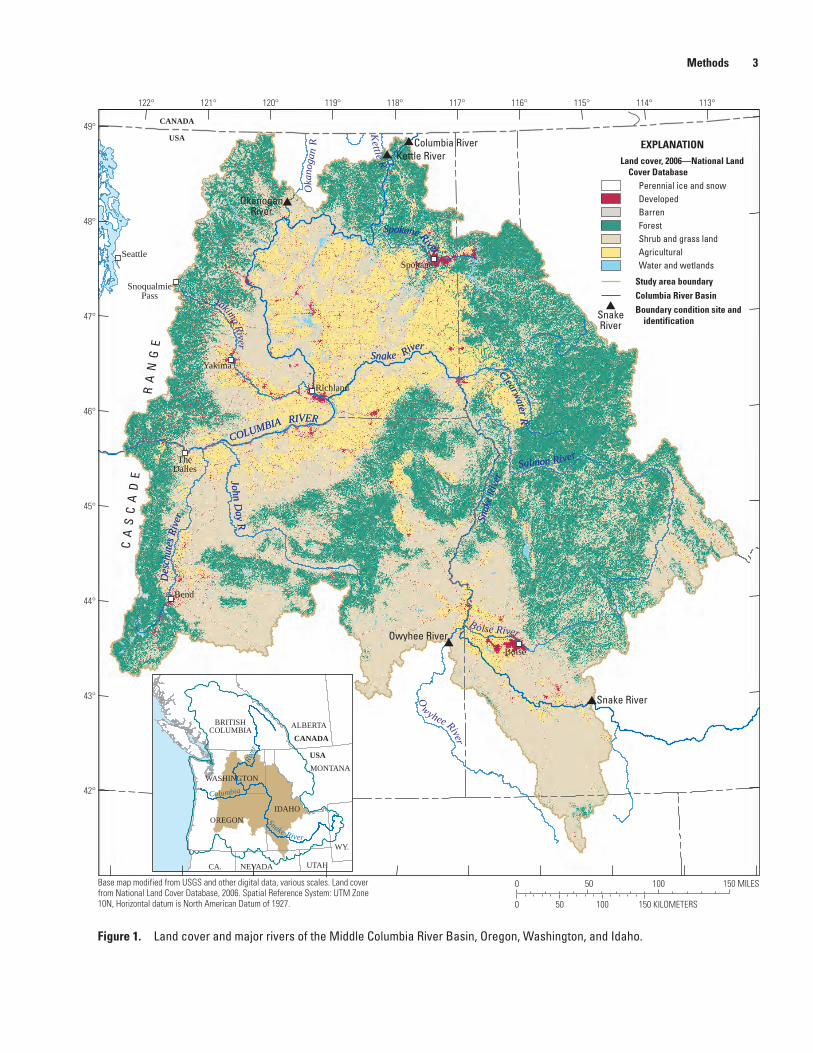
The Middle Columbia River Basin model domain is 318,778 km2 and is comprised of parts of Idaho, Nevada, Oregon, and Washington (fig. 1). The climate in the region is characterized by hot, dry summers and cold winters. Most precipitation falls between October and March, and snow is common during the winter months. Mountainous regions typically are forested, and low elevations are dominated by desert grasses and shrubs and agriculture. The region is sparsely populated; major population centers include the cities of Spokane, Washington, and Boise, Idaho.
In 2001, shrub and grass land covered 47 percent of the Middle Columbia River Basin, forest covered 35 percent, agriculture covered 14 percent, and developed land covered
2 percent. The remaining 2 percent land cover was barren, ice, water, or wetlands (Homer and others, 2004). Much of the land is managed for agriculture, forestry, or cattle. Federal and private irrigation projects across the basin provide water to farms growing a wide variety of crops, including tree fruit, corn, hay, potatoes, grapes, vegetables, and hops. The basin also is one of the major wheat production regions of the county, although the majority of the wheat is grown without irrigation. Timber is harvested on private and public lands, and much of the high desert shrub and grass land is used as range land for cattle. Dairies and aquaculture are locally important industries.
Model Datasets
Datasets used to develop the Middle Columbia River Basin SPARROW models were identical to those used to develop the recent PNW SPARROW models documented in Wise and Johnson (2013), but were limited to the Middle Columbia River Basin. The datasets are described briefly here to give the reader an overview of the data; refer to Wise and Johnson (2013) for additional details.
Hydrologic NetworkThe National Hydrography Dataset Plus Version 2
(NHDPlus Version 2) for the PNW (McKay and others, 2013; Horizon Systems, 2013) was used to represent the surface-water drainage network in the models developed for this study. Hereafter, this dataset will be referred to as the “NHD.” The NHD is a comprehensive set of digital spatial data composed of information about surface-water features, such as lakes, ponds, streams, and rivers (Simley and Carswell, 2010). The surface-water features represented in the NHD largely correspond to the features shown on 1:100,000 scale USGS topographic maps.
The NHD within the Middle Columbia River Basin model domain is composed of 105,961 reaches, which vary in size from small, ephemeral streams that experience years without streamflow to the Columbia River at The Dalles, Oregon, which has a mean annual streamflow of 5,373 m3/s. A reach generally is defined as a section of stream between two confluences. The NHD identifies the incremental catchment for each reach. An incremental catchment is defined as the area that drains directly to a reach without passing through another reach. Most reaches in the NHD represent streams or inland water bodies, such as lakes and reservoirs. However, some reaches represent closed basins, which do not have a surface-water connection to other reaches in the NHD. In developing the hydrologic framework for the SPARROW models, reaches representing streams and inland water bodies were retained, but reaches representing closed basins were removed from the network.
Methods 3
tac13-0870_fig 01
Spokane
Bend
Boise
Seattle
TheDalles
Yakima
SnoqualmiePass
Richland
Des
chut
es R
iver
Des
chut
es R
iver
Yakima River
Ow yhee River
Boise River
Clearwater R
Clearwater R
Oka
noga
n R
Kettle R
Salmon RiverSalmon River
Spokane River
Spokane River
COLUMBIA RIVER
COLUMBIA RIVER
John Day R
John Day R
Snake RiverSnake River
Snak
e Riv
erSn
ake R
iver
Columbia RiverKettle River
OkanoganRiver
Owyhee River
Snake River
BRITISHCOLUMBIA ALBERTA
USA
CANADA
USA
CANADA
WASHINGTON
IDAHO
MONTANA
WY.
CA. NEVADA UTAH
OREGON
Columbia
Rive
r
Snake River
EXPLANATION
Perennial ice and snowDevelopedBarrenForestShrub and grass landAgriculturalWater and wetlands
Study area boundaryColumbia River Basin
Land cover, 2006—National LandCover Database
Boundary condition site andidentificationSnake
River
113°114°115°116°117°118°119°120°121°122°
49°
48°
47°
46°
45°
44°
43°
42°
0 50 100 150 MILES
0 100 150 KILOMETERS50
Base map modified from USGS and other digital data, various scales. Land cover from National Land Cover Database, 2006. Spatial Reference System: UTM Zone 10N, Horizontal datum is North American Datum of 1927.
CA
SC
AD
E
RA
NG
E
Figure 1. Land cover and major rivers of the Middle Columbia River Basin, Oregon, Washington, and Idaho.
4 Total Nitrogen and Total Phosphorus, Middle Columbia River Basin, Using SPARROW Models, Emphasis on Yakima River Basin, Washington
Within SPARROW, the NHD reach network is modified to account for water (and therefore TN or TP load) diverted from streams and reservoirs for irrigation and power generation. Load that is removed for power generation is returned to the model at the appropriate downstream reach. Load that is removed for irrigation is permanently removed from the model. This treatment is justified because (1) the load of nutrients in irrigation water is small relative to the load of nutrients in fertilizer and manure applied to a field, and (2) the high degree of spatial correlation between applied irrigation water and fertilizer would make it difficult or impossible to include both sources in the model.
Nutrient SourcesThe nutrient sources used in the TN and TP SPARROW
models either were estimates of the annual TN or TP load applied to the land, or were surrogates where direct load estimates were unavailable or unreliable (Wise and Johnson, 2013). Natural nutrient sources represented in the models included fixation of nitrogen from the atmosphere in forested areas and the weathering of geologic phosphorus. Nitrogen fixation in forested areas was represented as area of forest land. Nitrogen fixation in other land-cover types was assumed to be negligible (for example, scrub land) or inseparable from a second, more dominant nitrogen source (for example, agricultural land). Weathering of geologic phosphorus was represented as area of forest land and area of grass and scrub land. As with nitrogen fixation, geologic phosphorus was assumed to be inseparable from agricultural and grazing phosphorus. The representation of natural TN and TP in this manner resulted in some catchments with no sources of TN or TP and, therefore, no modeled load or yield.
Anthropogenic nutrient sources in the models included the discharge of TN and TP from permitted wastewater facilities (treatment plants, fish farms, and fish hatcheries), the application of fertilizer on farmland, and the application or deposition of livestock manure. In the TN model, the fertilizer and livestock manure sources were combined into a single term where both were applied in the same catchment, resulting in a source term for catchments that only receive fertilizer and a second source term for catchments that receive both fertilizer and livestock manure. The nutrient sources used in the TN and TP models are shown in tables 1 and 2. The methods used to estimate these nutrient sources are described in Wise and Johnson (2013).
The TN and TP SPARROW models also accounted for nutrient loads from the largest spring complexes (collections of natural springs that discharge into or near a stream and contribute substantially to the flow in that stream) and the nutrient load associated with the return of water from off-stream power generation facilities. Spring complexes and power returns are not sources of nutrients, but are pathways for the return of nutrients to a stream. They are represented in the models as point sources because there is no mechanism
within the NHD hydrologic network or in the SPARROW model to accommodate these unique pathways for nutrient movement from the landscape to the stream. The methods used to estimate these loads are documented in Wise and Johnson (2013).
Land-to-Water Delivery The delivery of nutrients from land to water was
simulated by considering land cover, climate, soil properties, geology, and hydrology. For the Middle Columbia River Basin SPARROW models, the following were used as land-to-water delivery terms: (1) total precipitation, (2) percentage of agricultural land receiving irrigation in a catchment, and (3) percentage of the catchment classified as having very high phosphorus retention potential (tables 1 and 2). Total precipitation was compiled by the NAWQA Program as part of a national effort and was summarized for each incremental NHD catchment (Michael Wieczorek, U.S. Geological Survey, written commun., June 11, 2011). Percentage of agricultural land receiving irrigation was developed for the PNW SPARROW models of Wise and Johnson (2013) and is described therein. Percentage of catchment classified as having very high phosphorus retention potential was developed (but not used) for the PNW SPARROW models of Wise and Johnson (2013). The dataset was derived from a worldwide dataset of phosphorus retention potential in soil developed by the International Soil Reference and Information Center (2013). These data were processed for use in the SPARROW models and are available from U.S. Geological Survey (2013). Hereinafter, this land-to-water delivery term will be referred to as phosphorus retention.
Calibration LoadsThe calibration dataset for the models consisted of mean
annual TN and TP stream loads that were estimated from water-quality data obtained from Federal and state regulatory agencies and streamflow data collected primarily by the U.S. Geological Survey (USGS). Sites and load estimates are a subset of those used by Wise and Johnson (2013).
Water-quality monitoring stations were selected as TN and (or) TP calibration stations if they were near a streamflow-gaging station (ratio of two catchment areas was between 0.75 and 1.33) and met the minimum criteria for the number of TN and TP samples (20), seasonal coverage (3 samples per season), and period of record (last sample collected no later than 1995 if there were at least 5 years of data or last sample collected no later than 1999 if there were less than 5 years of data). The mean annual TN and TP stream loads were estimated using the USGS Fluxmaster model (Schwarz and others, 2006), which relates the loads measured at water-quality monitoring stations (calibration stations) to measured streamflow, season, and time. TN loads
Methods 5
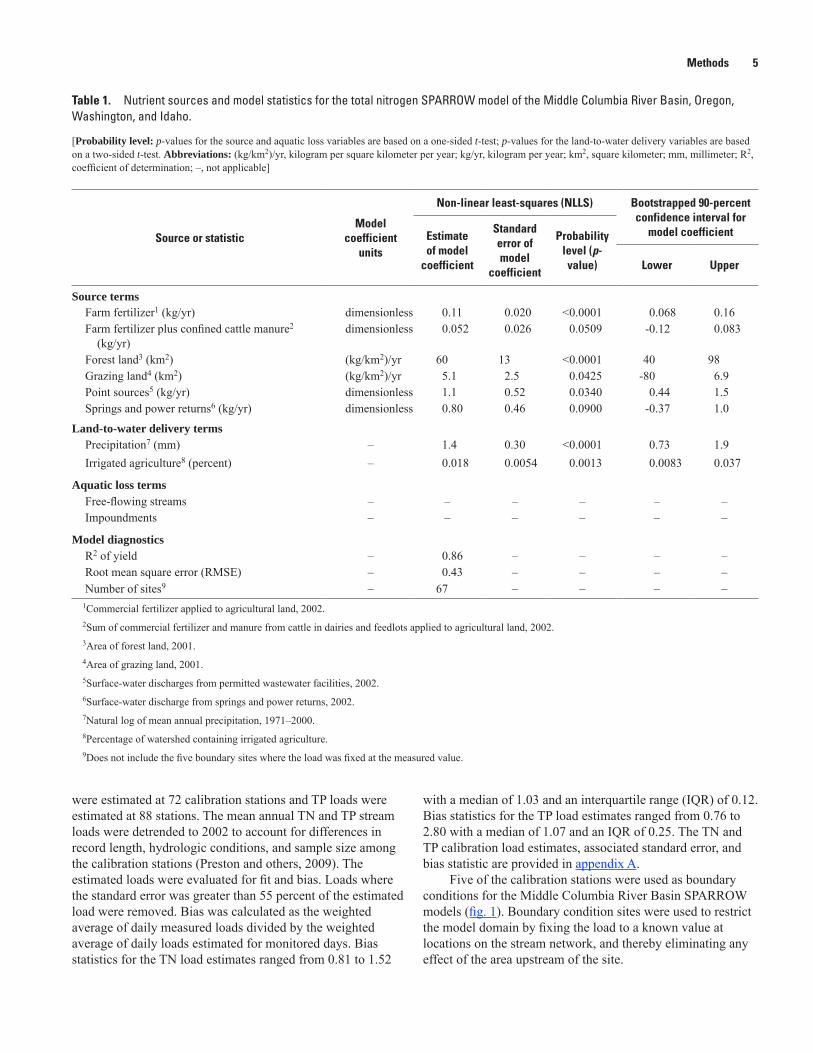
Table 1. Nutrient sources and model statistics for the total nitrogen SPARROW model of the Middle Columbia River Basin, Oregon, Washington, and Idaho.
[Probability level: p-values for the source and aquatic loss variables are based on a one-sided t-test; p-values for the land-to-water delivery variables are based on a two-sided t-test. Abbreviations: (kg/km2)/yr, kilogram per square kilometer per year; kg/yr, kilogram per year; km2, square kilometer; mm, millimeter; R2, coefficient of determination; –, not applicable]
Source or statisticModel
coefficient units
Non-linear least-squares (NLLS) Bootstrapped 90-percent confidence interval for
model coefficientEstimate of model
coefficient
Standard error of model
coefficient
Probability level (p-value) Lower Upper
Source termsFarm fertilizer1 (kg/yr) dimensionless 0.11 0.020 <0.0001 0.068 0.16Farm fertilizer plus confined cattle manure2
(kg/yr)dimensionless 0.052 0.026 0.0509 -0.12 0.083
Forest land3 (km2) (kg/km2)/yr 60 13 <0.0001 40 98Grazing land4 (km2) (kg/km2)/yr 5.1 2.5 0.0425 -80 6.9Point sources5 (kg/yr) dimensionless 1.1 0.52 0.0340 0.44 1.5Springs and power returns6 (kg/yr) dimensionless 0.80 0.46 0.0900 -0.37 1.0
Land-to-water delivery termsPrecipitation7 (mm) – 1.4 0.30 <0.0001 0.73 1.9Irrigated agriculture8 (percent) – 0.018 0.0054 0.0013 0.0083 0.037
Aquatic loss termsFree-flowing streams – – – – – –Impoundments – – – – – –
Model diagnosticsR2 of yield – 0.86 – – – –Root mean square error (RMSE) – 0.43 – – – –Number of sites9 – 67 – – – –
1Commercial fertilizer applied to agricultural land, 2002.2Sum of commercial fertilizer and manure from cattle in dairies and feedlots applied to agricultural land, 2002.3Area of forest land, 2001.4Area of grazing land, 2001.5Surface-water discharges from permitted wastewater facilities, 2002.6Surface-water discharge from springs and power returns, 2002.7Natural log of mean annual precipitation, 1971–2000.8Percentage of watershed containing irrigated agriculture.9Does not include the five boundary sites where the load was fixed at the measured value.
were estimated at 72 calibration stations and TP loads were estimated at 88 stations. The mean annual TN and TP stream loads were detrended to 2002 to account for differences in record length, hydrologic conditions, and sample size among the calibration stations (Preston and others, 2009). The estimated loads were evaluated for fit and bias. Loads where the standard error was greater than 55 percent of the estimated load were removed. Bias was calculated as the weighted average of daily measured loads divided by the weighted average of daily loads estimated for monitored days. Bias statistics for the TN load estimates ranged from 0.81 to 1.52
with a median of 1.03 and an interquartile range (IQR) of 0.12. Bias statistics for the TP load estimates ranged from 0.76 to 2.80 with a median of 1.07 and an IQR of 0.25. The TN and TP calibration load estimates, associated standard error, and bias statistic are provided in appendix A.
Five of the calibration stations were used as boundary conditions for the Middle Columbia River Basin SPARROW models (fig. 1). Boundary condition sites were used to restrict the model domain by fixing the load to a known value at locations on the stream network, and thereby eliminating any effect of the area upstream of the site.
6 Total Nitrogen and Total Phosphorus, Middle Columbia River Basin, Using SPARROW Models, Emphasis on Yakima River Basin, Washington
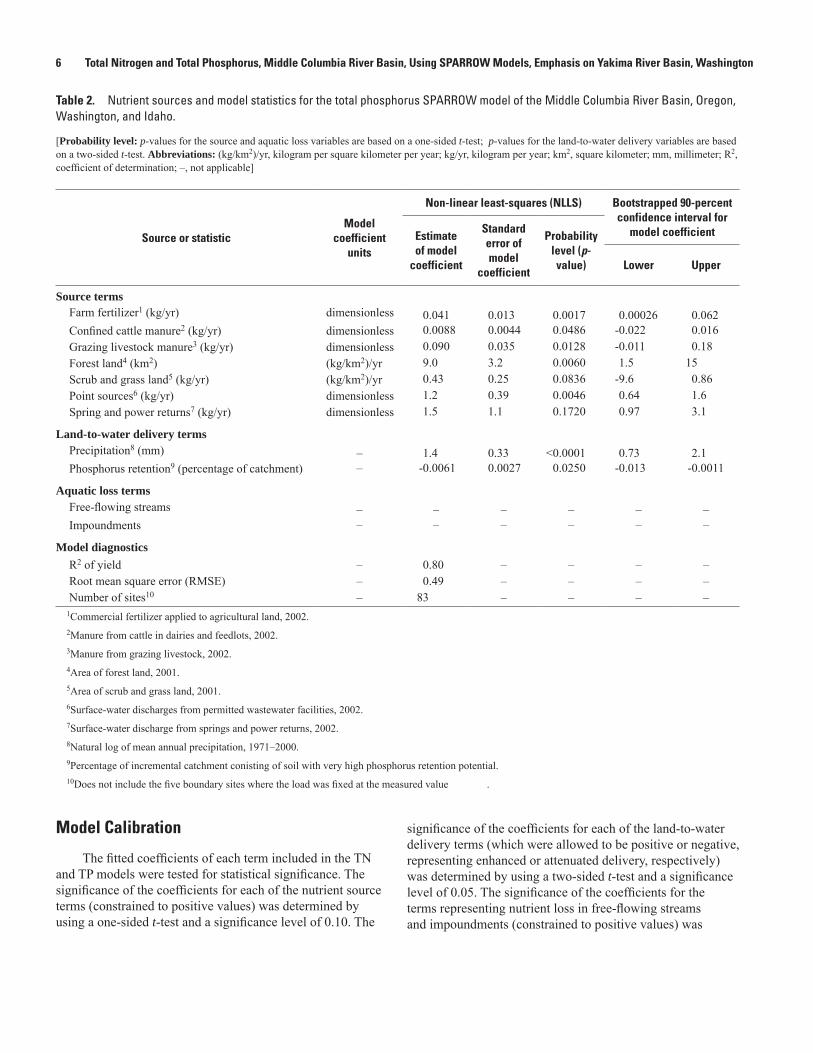
Table 2. Nutrient sources and model statistics for the total phosphorus SPARROW model of the Middle Columbia River Basin, Oregon, Washington, and Idaho.
[Probability level: p-values for the source and aquatic loss variables are based on a one-sided t-test; p-values for the land-to-water delivery variables are based on a two-sided t-test. Abbreviations: (kg/km2)/yr, kilogram per square kilometer per year; kg/yr, kilogram per year; km2, square kilometer; mm, millimeter; R2, coefficient of determination; –, not applicable]
Source or statisticModel
coefficient units
Non-linear least-squares (NLLS) Bootstrapped 90-percent confidence interval for
model coefficientEstimate of model
coefficient
Standard error of model
coefficient
Probability level (p-value) Lower Upper
Source termsFarm fertilizer1 (kg/yr) dimensionless 0.041 0.013 0.0017 0.00026 0.062Confined cattle manure2 (kg/yr) dimensionless 0.0088 0.0044 0.0486 -0.022 0.016Grazing livestock manure3 (kg/yr) dimensionless 0.090 0.035 0.0128 -0.011 0.18Forest land4 (km2) (kg/km2)/yr 9.0 3.2 0.0060 1.5 15Scrub and grass land5 (kg/yr) (kg/km2)/yr 0.43 0.25 0.0836 -9.6 0.86Point sources6 (kg/yr) dimensionless 1.2 0.39 0.0046 0.64 1.6Spring and power returns7 (kg/yr) dimensionless 1.5 1.1 0.1720 0.97 3.1
Land-to-water delivery termsPrecipitation8 (mm) – 1.4 0.33 <0.0001 0.73 2.1Phosphorus retention9 (percentage of catchment) – -0.0061 0.0027 0.0250 -0.013 -0.0011
Aquatic loss termsFree-flowing streams – – – – – –Impoundments – – – – – –
Model diagnosticsR2 of yield – 0.80 – – – –Root mean square error (RMSE) – 0.49 – – – –Number of sites10 – 83 – – – –
1Commercial fertilizer applied to agricultural land, 2002. 2Manure from cattle in dairies and feedlots, 2002. 3Manure from grazing livestock, 2002. 4Area of forest land, 2001. 5Area of scrub and grass land, 2001. 6Surface-water discharges from permitted wastewater facilities, 2002. 7Surface-water discharge from springs and power returns, 2002. 8Natural log of mean annual precipitation, 1971–2000. 9Percentage of incremental catchment conisting of soil with very high phosphorus retention potential. 10Does not include the five boundary sites where the load was fixed at the measured value .
Model Calibration
The fitted coefficients of each term included in the TN and TP models were tested for statistical significance. The significance of the coefficients for each of the nutrient source terms (constrained to positive values) was determined by using a one-sided t-test and a significance level of 0.10. The
significance of the coefficients for each of the land-to-water delivery terms (which were allowed to be positive or negative, representing enhanced or attenuated delivery, respectively) was determined by using a two-sided t-test and a significance level of 0.05. The significance of the coefficients for the terms representing nutrient loss in free-flowing streams and impoundments (constrained to positive values) was
Evaluation of Calibrated Models 7
determined by using a one-sided t-test and a significance level of 0.10. Final model selection was based on the overall model fit by evaluating the R-squared (R2) of yield and the root mean squared error (RMSE), and by evaluating the residuals for spatial patterns. The R2 of yield is the R2 value for the natural logarithm of yield and is considered a better measure of goodness-of-fit than R2 because it accounts for the effect of contributing area, which can explain much of the variation in stream load. The spatial patterns in model fit were evaluated by calculating and mapping the residual for each calibration station.
Evaluation of Calibrated ModelsThe SPARROW model for TN was calibrated using six
source terms (farm fertilizer, farm fertilizer plus confined cattle manure, forest land, grazing land, point sources, and springs and power returns) and two land-to-water delivery terms (precipitation and irrigated agriculture) (table 1). Neither aquatic loss functions were significant in the TN model, which is consistent with the latest TN model completed for the PNW (Wise and Johnson, 2013). The TN model explained 86 percent of the variance in the monitored yields.
All estimated coefficients in the TN model were significant (one-sided p-value less than 0.1 for source terms, two-sided p-value less than 0.05 for land-to-water delivery terms) (table 1). The three terms in the TN model with the largest p-values (farm fertilizer plus confined cattle manure, grazing land, and springs and power returns) also had asymmetric confidence intervals determined from bootstrap resampling. This suggests there is greater uncertainty in the SPARROW predictions resulting from these terms than from other terms used in the model. The greater uncertainty in these terms may imply an underlying issue with the terms themselves; for example, combining farm fertilizer and confined cattle manure into a single term was a compromise solution to not including confined cattle manure in the model at all. As a stand-alone term, confined cattle manure was highly insignificant (p-value between 0.40 and 0.55), owing to a high degree of spatial correlation with fertilizer, but excluding it from the model was not an option because of its locally large importance. Similarly, the springs and power returns term in the model was locally important, but the source was present only in a few catchments. Excluding the term from the model resulted in poorer fit statistics, so it was retained in the model. The asymmetry in the grazing source term probably is due to the removal or duplication of one or more key calibration sites during the bootstrap resampling procedure. Grazing lands (primarily scrub and grass land) constitute much of the land area in the model domain, but are not well represented by calibration sites.
The SPARROW model for TP was calibrated using seven source terms (farm fertilizer, manure generated at confined cattle operations, manure generated by grazing livestock, area of forest land, area of scrub and grass land, point sources, and springs and power returns) and two land-to-water delivery terms (precipitation and phosphorus retention) (table 2). The aquatic loss functions were not significant in the TP model, consistent with the latest TP model completed in the PNW (Wise and Johnson, 2013). The TP model explained about 80 percent of the variance in the monitored yields.
All estimated coefficients in the TP model were significant (one-sided p-value less than 0.1 for source terms, two-sided p-value less than 0.05 for land-to-water delivery terms), except the coefficient for springs and power returns (p-value = 0.1720) (table 2). The term was retained in the model because it is a locally important source of nutrients. The lack of statistical significance of the springs and power returns term may be due to the small number of catchments influenced by the source. Removal of the springs and power returns term from the model resulted in a poorer model fit and unreasonable values for other model coefficients. After springs and power returns, the two terms in the TP model with the next-largest p-values (confined cattle manure; scrub and grass land) had asymmetric confidence intervals determined from bootstrap resampling. These two terms correspond with two of the highly asymmetric terms in the TN model. This is no coincidence, and is indicative of the same underlying issues with the terms in the TP model as were discussed for the TN model.
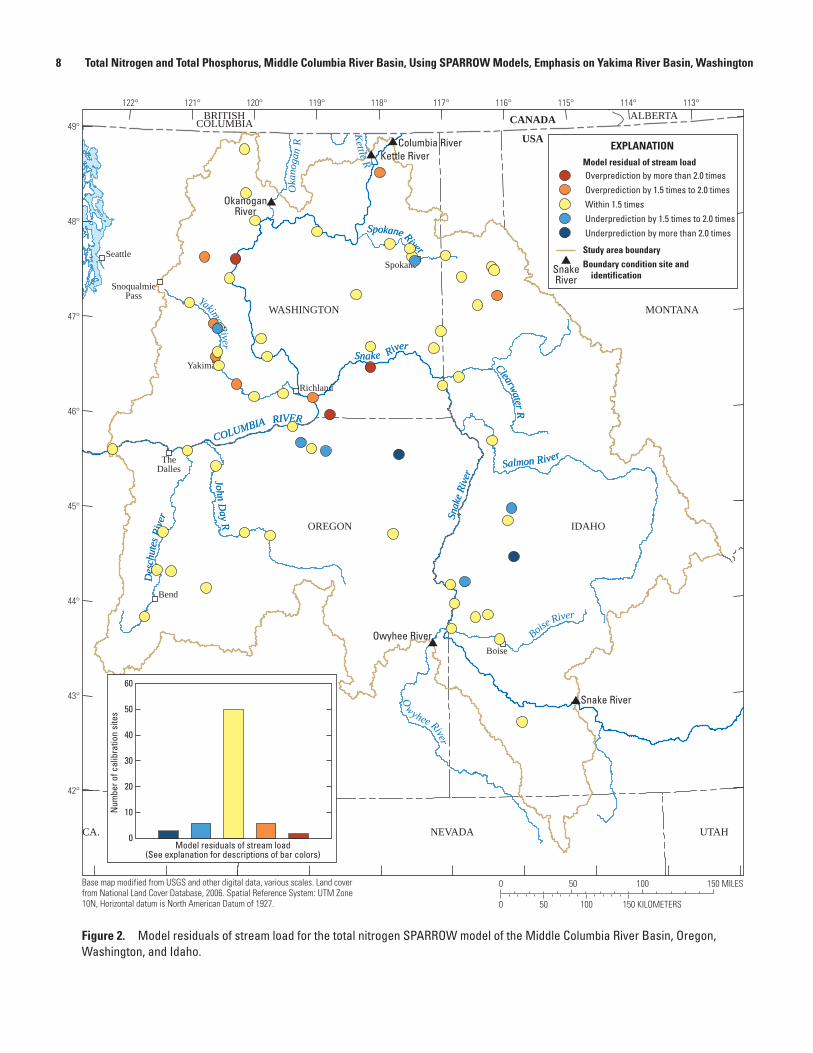
Model residuals (log-transformed calibration load minus log-transformed predicted load) were plotted on a map and visually inspected for outliers and spatial correlation (figs. 2 and 3). For the TN model, the predicted load was within 2 times the calibration load at 62 of 67 sites (93 percent) and within 1.5 times the calibration load at 49 of 67 sites (73 percent). The smallest TN residual was -1.13, which corresponds to an overprediction where the predicted load is 3.1 times the calibration load; the largest TN residual was 1.11, which corresponds to an underprediction where the calibration load is 3.0 times the predicted load.
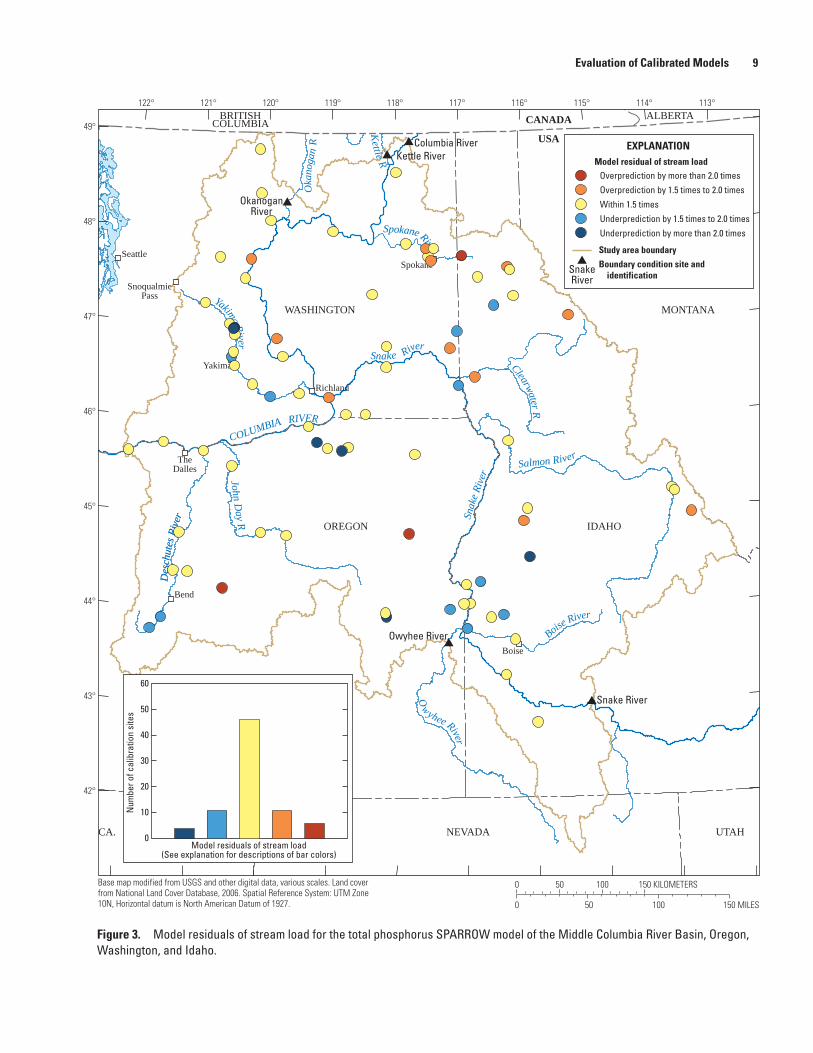
For the TP model, the predicted load was within 2 times the calibration load at 73 of 83 sites (88 percent) and within 1.5 times the calibration load at 51 of 83 sites (61 percent). The smallest TP residual was -1.46, which corresponds to an overprediction where the predicted load is 4.3 times the calibration load; the largest TP residual was 1.09, which corresponds to an underprediction where the calibration load is 2.0 times the predicted load.
8 Total Nitrogen and Total Phosphorus, Middle Columbia River Basin, Using SPARROW Models, Emphasis on Yakima River Basin, Washington
tac13-0870_fig 02
Spokane
Bend
Seattle
TheDalles
Yakima
SnoqualmiePass
Richland
Boise
Des
chut
es R
iver
Des
chut
es R
iver
Yakima River
Ow yhee River
Clearwater R
Clearwater RO
kano
gan
R
Kettle R
Salmon RiverSalmon River
Spokane River
Spokane River
COLUMBIA RIVER
COLUMBIA RIVER
John Day R
John Day R
Snake RiverSnake River
Snak
e Riv
erSn
ake R
iver
Boise River
Columbia RiverKettle River
OkanoganRiver
Owyhee River
Snake River
113°114°115°116°117°118°119°120°121°122°
49°
48°
47°
46°
45°
44°
43°
42°
Base map modified from USGS and other digital data, various scales. Land cover from National Land Cover Database, 2006. Spatial Reference System: UTM Zone 10N, Horizontal datum is North American Datum of 1927.
0 50 100 150 MILES
0 100 150 KILOMETERS50
Model residual of stream load
EXPLANATION
Overprediction by more than 2.0 timesOverprediction by 1.5 times to 2.0 timesWithin 1.5 timesUnderprediction by 1.5 times to 2.0 timesUnderprediction by more than 2.0 times
Study area boundary
Boundary condition site andidentificationSnake
River
Model residual of stream load
Model residuals of stream load(See explanation for descriptions of bar colors)
Num
ber o
f cal
ibra
tion
site
s
0
10
20
30
40
50
60
BRITISHCOLUMBIA
ALBERTA
USA
CANADA
WASHINGTON
IDAHO
MONTANA
CA. NEVADA UTAH
OREGON
Figure 2. Model residuals of stream load for the total nitrogen SPARROW model of the Middle Columbia River Basin, Oregon, Washington, and Idaho.
Evaluation of Calibrated Models 9
tac13-0870_fig 03
Spokane
Bend
Seattle
TheDalles
Yakima
SnoqualmiePass
Richland
Boise
Des
chut
es R
iver
Des
chut
es R
iver
Yakima River
Ow yhee River
Clearwater R
Clearwater R
Oka
noga
n R
Kettle R
Salmon RiverSalmon River
Spokane River
Spokane River
COLUMBIA RIVER
COLUMBIA RIVER
John Day R
John Day R
Snake RiverSnake River
Snak
e Riv
erSn
ake R
iver
Boise River
Columbia RiverKettle River
OkanoganRiver
Owyhee River
Snake River
113°114°115°116°117°118°119°120°121°122°
49°
48°
47°
46°
45°
44°
43°
42°
Base map modified from USGS and other digital data, various scales. Land cover from National Land Cover Database, 2006. Spatial Reference System: UTM Zone 10N, Horizontal datum is North American Datum of 1927. 0 50 100 150 MILES
0 100 150 KILOMETERS50
EXPLANATION
Overprediction by more than 2.0 timesOverprediction by 1.5 times to 2.0 timesWithin 1.5 timesUnderprediction by 1.5 times to 2.0 timesUnderprediction by more than 2.0 times
Study area boundary
Boundary condition site andidentificationSnake
River
Model residual of stream load
Model residuals of stream load(See explanation for descriptions of bar colors)
Num
ber o
f cal
ibra
tion
site
s
0
10
20
30
40
50
60
BRITISHCOLUMBIA
ALBERTA
USA
CANADA
WASHINGTON
IDAHO
MONTANA
CA. NEVADA UTAH
OREGON
Figure 3. Model residuals of stream load for the total phosphorus SPARROW model of the Middle Columbia River Basin, Oregon, Washington, and Idaho.
10 Total Nitrogen and Total Phosphorus, Middle Columbia River Basin, Using SPARROW Models, Emphasis on Yakima River Basin, Washington
Modeling Results for the Yakima River Basin
Modeling results shown in this report are limited to the Yakima River Basin to provide detailed information on the areas of interest to WDOE and EPA. Results for the entire model domain are provided in appendix A.
Yields
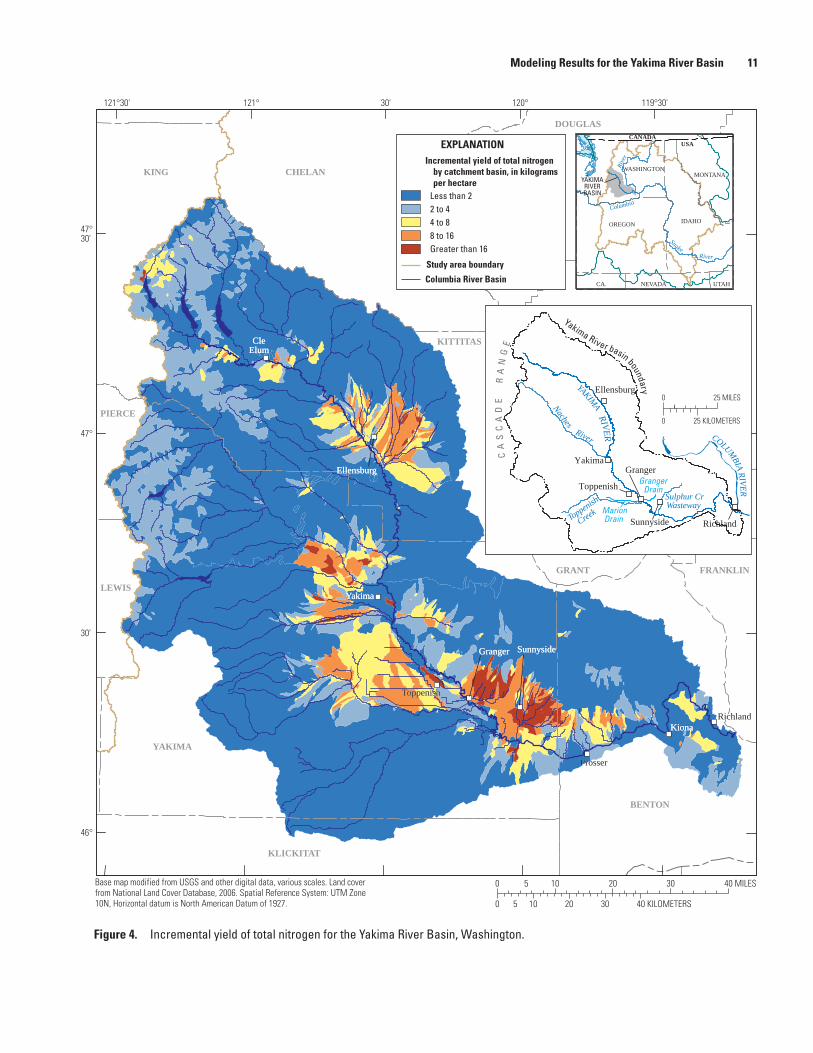
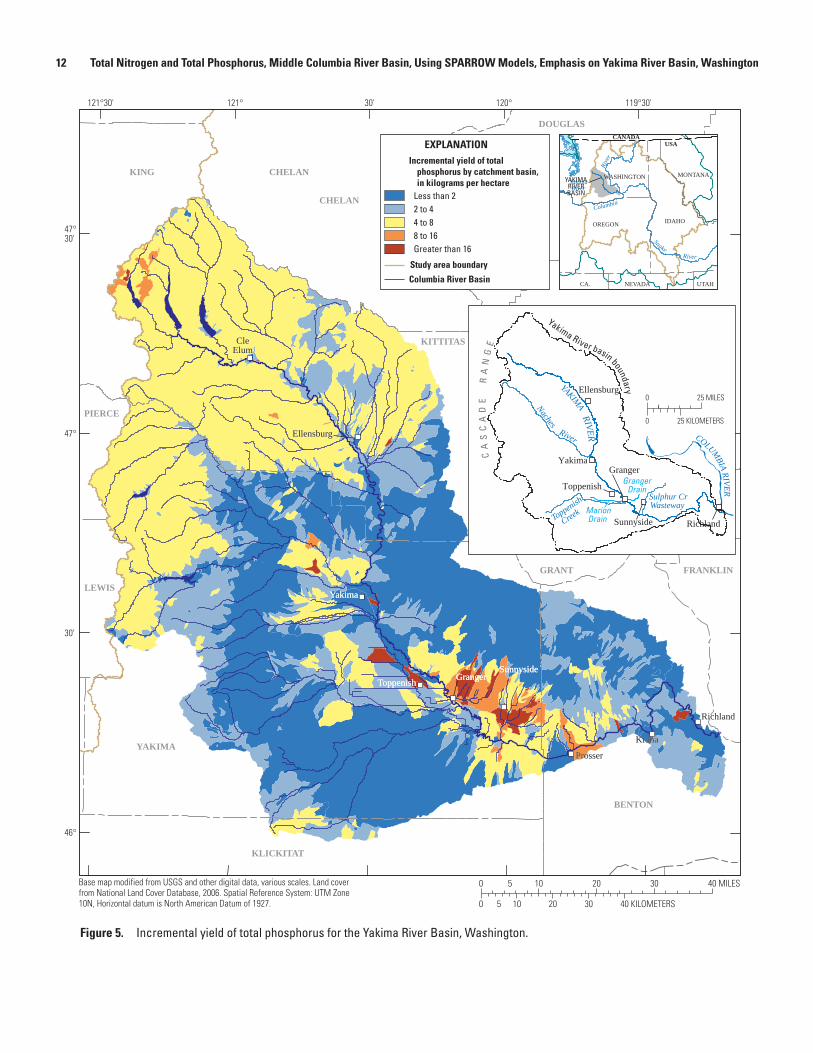
The incremental yield of TN and TP was calculated to facilitate comparisons among incremental catchments and to better understand the spatial patterns of nutrient sources. An incremental catchment is defined as the area that drains directly to a reach without passing through another reach. The yield value is expressed as mass per unit area so the relative importance of different areas of the Yakima River Basin as sources of TN and TP can be compared. Catchments with the largest incremental yield of TN and TP are located in the major agricultural regions of the Yakima River Basin (figs. 4 and 5), with the largest yields in catchments near the cities of Granger and Sunnyside, Washington. Large yields of TN and TP also were predicted in the uppermost-forested catchments of the Cascade Range and in catchments where municipal wastewater-treatment plants discharge their effluent.
Source Shares
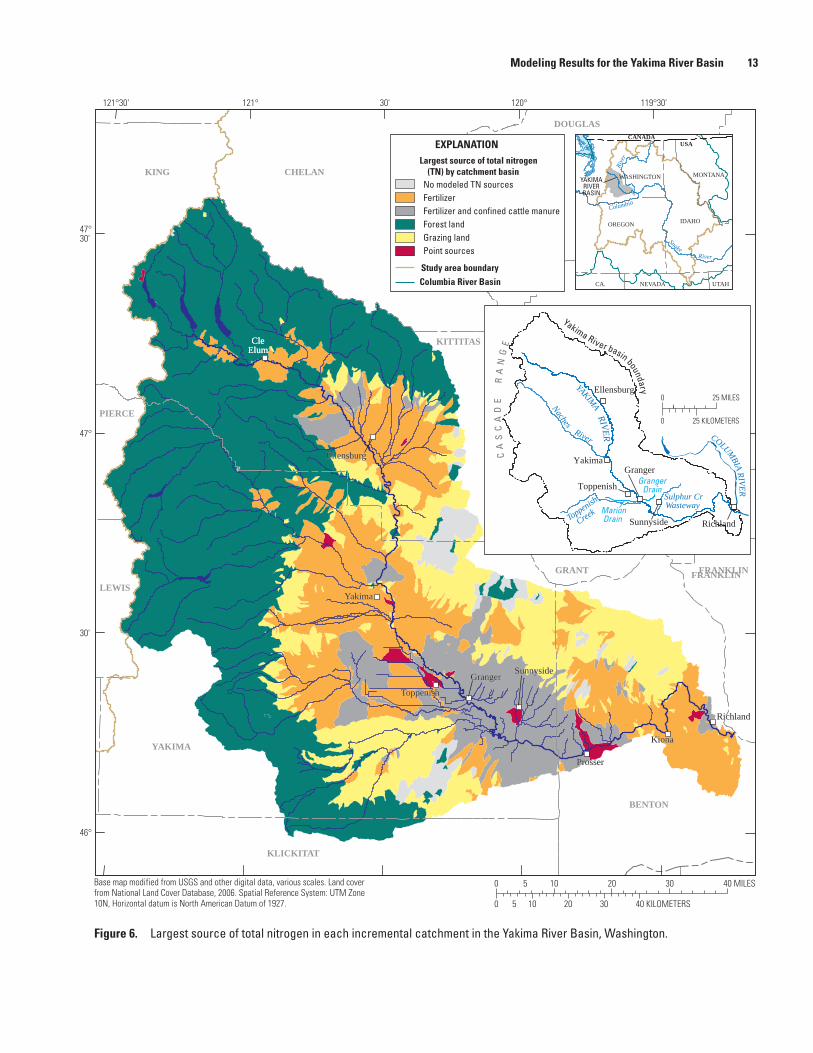
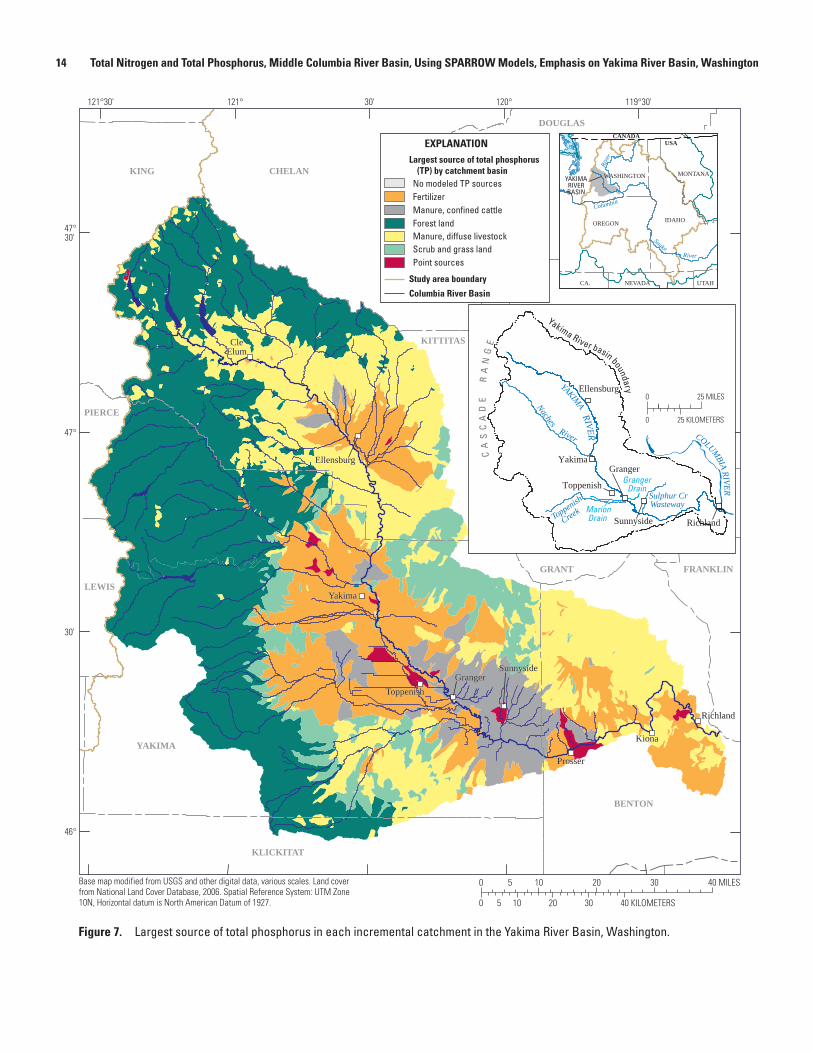
The largest source of TN and TP contributing to the load exported from each incremental catchment is shown in figures 6 and 7, respectively. These maps generally reflect the surrounding land use, with natural sources (forest, scrub, and grass land) dominating catchments minimally influenced by agriculture and ranching; agricultural and manure sources are dominant in agricultural and grazed landscapes. The notable exception to this pattern is in catchments where effluent from a municipal wastewater-treatment plant (WWTP) is discharged. Catchments without any modeled nutrient sources are more prevalent on the TN map (fig. 6) because the only statistically significant natural source of nitrogen in the TN model was forest land. In the TP model, forest, scrub, and grass land were included and were statistically significant sources of natural sources of TP.
Longitudinal Changes in Nutrient Sources Comprising the Load in the Yakima River
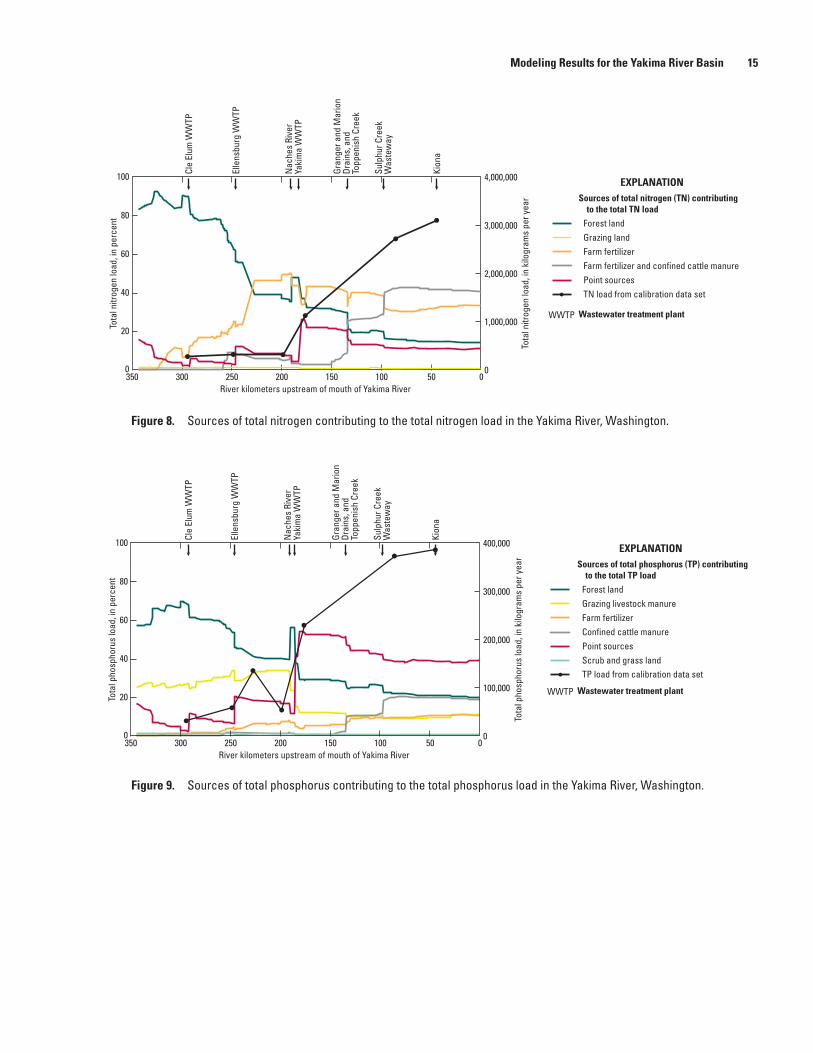
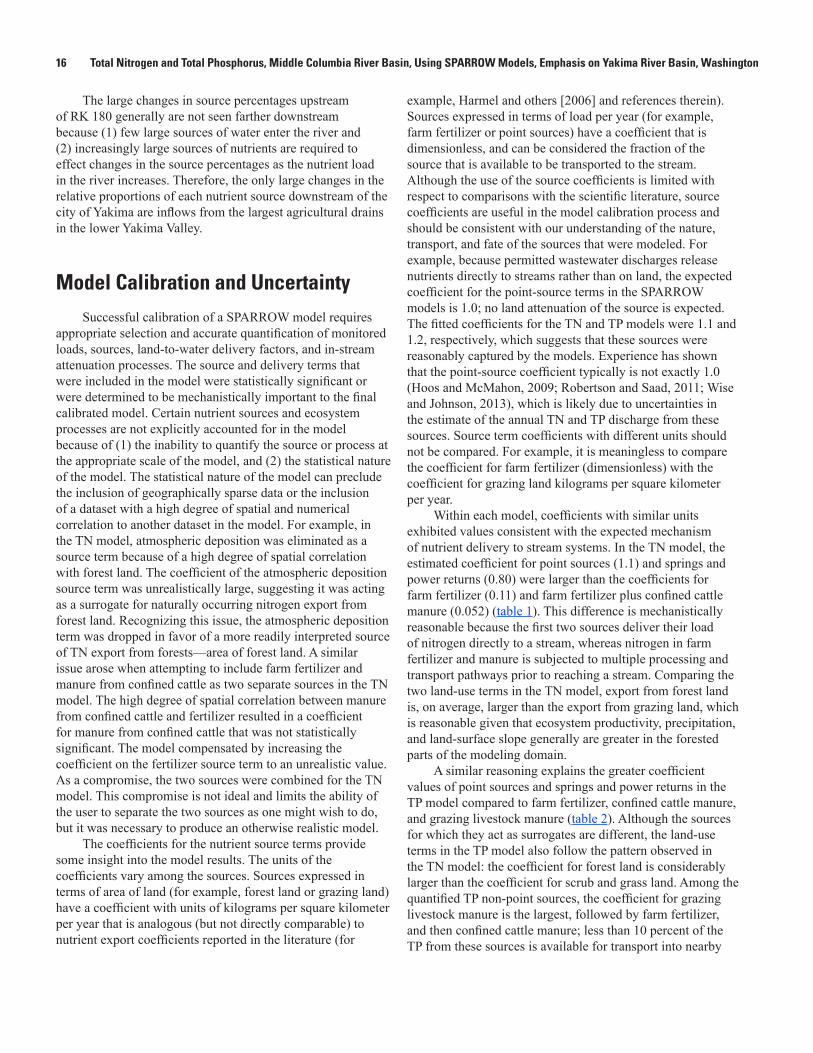
The percentage of each modeled source that contributes to the TN and TP load in the main stem of the Yakima River as it flows from its headwaters to its confluence with the Columbia River is shown in figures 8 and 9. These figures
illustrate the effect of anthropogenic nutrient sources on the river as it passes through the agricultural and urban centers along its route.
In the uppermost reaches of the Yakima River, near river kilometer (RK) 350, about 85 percent of the TN load and about 55 percent of the TP load is derived from forest land, about 25 percent of the TP load is derived from grazing livestock manure, and about 15 of the TN and TP load is from the Snoqualmie Pass WWTP. The percentage of TP load from grazing livestock manure is large compared to the TN load from grazing lands (about 2 percent) and suggests the grazing livestock manure source may be serving as a surrogate for natural sources in this portion of the model. The relatively coarse method for estimating grazing manure likely overestimated the actual amounts deposited in the sparsely populated, forested headwaters of the Yakima River Basin. The large percentage of TN and TP attributed to the Snoqualmie Pass WWTP may appear large until the dilute waters into which the treatment plant discharges are considered; the total nutrient load in the Yakima River at its headwaters is about 8 percent of the load at Kiona, Washington (RK 44). Effluent from WWTPs at Cle Elum (RK 292), Ellensburg (RK 246), and Yakima (RK 180) also cause marked increases in the percentage of TN and TP load attributed to point sources, and a concomitant decrease in the percentage attributed to other sources. WWTPs downstream of Yakima do not visibly affect the point-source percentage because the load in the river at those effluent points is much larger than the load in the effluent itself.
Agricultural sources of TN and TP begin to increase near RK 320 and RK 260, respectively, and level off around RK 200. The Naches River joins the Yakima River near RK 190 and provides the last significant influx of naturally sourced TN and TP to the main stem. Downstream of Yakima, TN and TP percentages from forest, grazing, and grass and scrub land continue to decrease with increasing inputs from agricultural lands. Large inputs from agricultural tributaries were predicted near RK 130, where Granger Drain, Marion Drain, and Toppenish Creek join the Yakima River, and again near RK 97, where Sulphur Creek Wasteway enters the river. Manure from confined cattle operations is an important component of the agricultural nutrients downstream of the city of Yakima. Most TN and TP attributed to manure enters the river between RK 150 and RK 100. The proportion of the various nutrient sources is relatively stable downstream of RK 100. Near Kiona (RK 44), the monitoring site farthest downstream on the Yakima River, the TN load in the river is about 74 percent fertilizer and manure from confined cattle operations, 15 percent from forest land, 11 percent from point sources, and less than 1 percent from grazing lands. The TP load in the Yakima River at Kiona is about 39 percent from point sources, 21 percent from forest land, 20 percent from confined cattle manure, 11 percent from farm fertilizer, 9 percent from grazing livestock manure, and less than 1 percent from scrub and grass land.
Modeling Results for the Yakima River Basin 11
tac13-0870_fig 04
CleElumCle
Elum
EllensburgEllensburg
YakimaYakima
SunnysideSunnysideGrangerGranger
ProsserProsser
KionaKionaRichlandRichland
ToppenishToppenish
CHELAN
DOUGLAS
GRANT
KING
KITTITAS
PIERCE
ADAMS
YAKIMA
LEWIS
FRANKLIN
BENTON
KLICKITAT
EXPLANATION
Less than 22 to 44 to 88 to 16Greater than 16
Columbia River Basin
Incremental yield of total nitrogen by catchment basin, in kilograms per hectare
Study area boundary
119°30'120°30'121°121°30'
47°30'
47°
30'
46°
USACANADA
WASHINGTON
IDAHOOREGON
Columbia
Rive
r
Snake River
MONTANA
CA. NEVADA UTAH
Base map modified from USGS and other digital data, various scales. Land cover from National Land Cover Database, 2006. Spatial Reference System: UTM Zone 10N, Horizontal datum is North American Datum of 1927.
0 10 20 30 40 MILES5
0 10 20 30 40 KILOMETERS5
GrangerDrain
MarionDrain
Yakima River basin boundary
Toppenish
Creek
River
Naches
YAKIMA RIVER COLUMBIA RIVER
Sulphur CrWasteway
Ellensburg
Toppenish
Yakima
Sunnyside Richland
Granger
CA
SC
AD
E
RA
NG
E
0 25 MILES
0 25 KILOMETERS
YAKIMARIVERBASIN
Figure 4. Incremental yield of total nitrogen for the Yakima River Basin, Washington.
12 Total Nitrogen and Total Phosphorus, Middle Columbia River Basin, Using SPARROW Models, Emphasis on Yakima River Basin, Washington
tac13-0870_fig 05
CleElumCle
Elum
EllensburgEllensburg
YakimaYakima
SunnysideSunnysideGrangerGranger
ProsserProsser
KionaKiona
RichlandRichland
ToppenishToppenish
CHELAN
DOUGLAS
GRANT
KING
KITTITAS
ADAMS
YAKIMA
LEWIS
BENTON
KLICKITAT
CHELAN
DOUGLAS
GRANT
PIERCE
ADAMS
FRANKLIN
EXPLANATION
Less than 22 to 44 to 88 to 16Greater than 16
Columbia River Basin
Incremental yield of total phosphorus by catchment basin, in kilograms per hectare
Study area boundary
119°30'120°30'121°121°30'
47°30'
47°
30'
46°
USACANADA
WASHINGTON
IDAHOOREGON
Columbia
Rive
r
Snake River
YakimaRiver
MONTANA
CA. NEVADA UTAH
Base map modified from USGS and other digital data, various scales. Land cover from National Land Cover Database, 2006. Spatial Reference System: UTM Zone 10N, Horizontal datum is North American Datum of 1927.
0 10 20 30 40 MILES5
0 10 20 30 40 KILOMETERS5
CA
SC
AD
E
RA
NG
E
GrangerDrain
MarionDrain
Yakima River basin boundary
Toppenish
Creek
River
Naches
YAKIMA RIVER COLUMBIA RIVER
Sulphur CrWasteway
Ellensburg
Toppenish
Yakima
Sunnyside Richland
Granger
CA
SC
AD
E
RA
NG
E
0 25 MILES
0 25 KILOMETERS
YAKIMARIVERBASIN
Figure 5. Incremental yield of total phosphorus for the Yakima River Basin, Washington.
Modeling Results for the Yakima River Basin 13
tac13-0870_fig 06
CleElumCle
Elum
EllensburgEllensburg
YakimaYakima
SunnysideSunnysideGrangerGranger
ProsserProsser
KionaKiona
RichlandRichland
ToppenishToppenish
KING
ADAMS
YAKIMA
LEWISFRANKLIN
BENTON
KLICKITAT
CHELAN
DOUGLAS
GRANT
KITTITAS
PIERCE
FRANKLIN
EXPLANATION
Columbia River Basin
Largest source of total nitrogen (TN) by catchment basin
No modeled TN sourcesFertilizerFertilizer and confined cattle manureForest landGrazing landPoint sources
Study area boundary
119°30'120°30'121°121°30'
47°30'
47°
30'
46°
USACANADA
WASHINGTON
IDAHOOREGON
Columbia
Rive
r
Snake River
MONTANA
CA. NEVADA UTAH
Base map modified from USGS and other digital data, various scales. Land cover from National Land Cover Database, 2006. Spatial Reference System: UTM Zone 10N, Horizontal datum is North American Datum of 1927.
0 10 20 30 40 MILES5
0 10 20 30 40 KILOMETERS5
GrangerDrain
MarionDrain
Yakima River basin boundary
Toppenish
Creek
River
Naches
YAKIMA RIVER COLUMBIA RIVER
Sulphur CrWasteway
Ellensburg
Toppenish
Yakima
Sunnyside Richland
Granger
CA
SC
AD
E
RA
NG
E
0 25 MILES
0 25 KILOMETERS
YAKIMARIVERBASIN
Figure 6. Largest source of total nitrogen in each incremental catchment in the Yakima River Basin, Washington.
14 Total Nitrogen and Total Phosphorus, Middle Columbia River Basin, Using SPARROW Models, Emphasis on Yakima River Basin, Washington
tac13-0870_fig 07
CleElumCle
Elum
EllensburgEllensburg
YakimaYakima
SunnysideSunnysideGrangerGranger
ProsserProsser
KionaKiona
RichlandRichland
ToppenishToppenish
KING
ADAMS
YAKIMA
LEWIS
BENTON
KLICKITAT
CHELAN
DOUGLAS
GRANT
KITTITAS
PIERCE
FRANKLIN
EXPLANATION
Columbia River Basin
Largest source of total phosphorus (TP) by catchment basin
No modeled TP sourcesFertilizerManure, confined cattleForest landManure, diffuse livestockScrub and grass landPoint sources
Study area boundary
119°30'120°30'121°121°30'
47°30'
47°
30'
46°
USACANADA
WASHINGTON
IDAHOOREGON
Columbia
Rive
r
Snake River
MONTANA
CA. NEVADA UTAH
Base map modified from USGS and other digital data, various scales. Land cover from National Land Cover Database, 2006. Spatial Reference System: UTM Zone 10N, Horizontal datum is North American Datum of 1927.
0 10 20 30 40 MILES5
0 10 20 30 40 KILOMETERS5
GrangerDrain
MarionDrain
Yakima River basin boundary
Toppenish
Creek
River
Naches
YAKIMA RIVER COLUMBIA RIVER
Sulphur CrWasteway
Ellensburg
Toppenish
Yakima
Sunnyside Richland
Granger
CA
SC
AD
E
RA
NG
E
0 25 MILES
0 25 KILOMETERS
YAKIMARIVERBASIN
Figure 7. Largest source of total phosphorus in each incremental catchment in the Yakima River Basin, Washington.
Modeling Results for the Yakima River Basin 15
tac13-0870_fig 08
Cle
Elum
WW
TP
Elle
nsbu
rg W
WTP
Yaki
ma
WW
TPN
ache
s Ri
ver
Kion
a
Sulp
hur C
reek
Was
tew
ay
Gran
ger a
nd M
ario
n Dr
ains
, and
To
ppen
ish
Cree
k
50100150200250300350River kilometers upstream of mouth of Yakima River
0
20
40
60
80
100
Tota
l nitr
ogen
load
, in
perc
ent
00
Tota
l nitr
ogen
load
, in
kilo
gram
s pe
r yea
r
Forest landGrazing landFarm fertilizerFarm fertilizer and confined cattle manurePoint sourcesTN load from calibration data set
EXPLANATIONSources of total nitrogen (TN) contributing
to the total TN load
1,000,000
2,000,000
3,000,000
4,000,000
Wastewater treatment plantWWTP
Figure 8. Sources of total nitrogen contributing to the total nitrogen load in the Yakima River, Washington.
tac13-0870_fig 09
Cle
Elum
WW
TP
Elle
nsbu
rg W
WTP
Yaki
ma
WW
TPN
ache
s Ri
ver
Kion
a
Sulp
hur C
reek
Was
tew
ay
Gran
ger a
nd M
ario
n Dr
ains
, and
To
ppen
ish
Cree
k
Sources of total phosphorus (TP) contributingto the total TP load
Wastewater treatment plantWWTP
Forest landGrazing livestock manureFarm fertilizerConfined cattle manurePoint sourcesScrub and grass landTP load from calibration data set
EXPLANATION
50100150200250300350River kilometers upstream of mouth of Yakima River
Tota
l pho
spho
rus
load
, in
perc
ent
0
20
40
60
80
100
00
100,000
200,000
300,000
400,000
Tota
l pho
spho
rus
load
, in
kilo
gram
s pe
r yea
r
Figure 9. Sources of total phosphorus contributing to the total phosphorus load in the Yakima River, Washington.
16 Total Nitrogen and Total Phosphorus, Middle Columbia River Basin, Using SPARROW Models, Emphasis on Yakima River Basin, Washington
The large changes in source percentages upstream of RK 180 generally are not seen farther downstream because (1) few large sources of water enter the river and (2) increasingly large sources of nutrients are required to effect changes in the source percentages as the nutrient load in the river increases. Therefore, the only large changes in the relative proportions of each nutrient source downstream of the city of Yakima are inflows from the largest agricultural drains in the lower Yakima Valley.
Model Calibration and UncertaintySuccessful calibration of a SPARROW model requires
appropriate selection and accurate quantification of monitored loads, sources, land-to-water delivery factors, and in-stream attenuation processes. The source and delivery terms that were included in the model were statistically significant or were determined to be mechanistically important to the final calibrated model. Certain nutrient sources and ecosystem processes are not explicitly accounted for in the model because of (1) the inability to quantify the source or process at the appropriate scale of the model, and (2) the statistical nature of the model. The statistical nature of the model can preclude the inclusion of geographically sparse data or the inclusion of a dataset with a high degree of spatial and numerical correlation to another dataset in the model. For example, in the TN model, atmospheric deposition was eliminated as a source term because of a high degree of spatial correlation with forest land. The coefficient of the atmospheric deposition source term was unrealistically large, suggesting it was acting as a surrogate for naturally occurring nitrogen export from forest land. Recognizing this issue, the atmospheric deposition term was dropped in favor of a more readily interpreted source of TN export from forests—area of forest land. A similar issue arose when attempting to include farm fertilizer and manure from confined cattle as two separate sources in the TN model. The high degree of spatial correlation between manure from confined cattle and fertilizer resulted in a coefficient for manure from confined cattle that was not statistically significant. The model compensated by increasing the coefficient on the fertilizer source term to an unrealistic value. As a compromise, the two sources were combined for the TN model. This compromise is not ideal and limits the ability of the user to separate the two sources as one might wish to do, but it was necessary to produce an otherwise realistic model.
The coefficients for the nutrient source terms provide some insight into the model results. The units of the coefficients vary among the sources. Sources expressed in terms of area of land (for example, forest land or grazing land) have a coefficient with units of kilograms per square kilometer per year that is analogous (but not directly comparable) to nutrient export coefficients reported in the literature (for
example, Harmel and others [2006] and references therein). Sources expressed in terms of load per year (for example, farm fertilizer or point sources) have a coefficient that is dimensionless, and can be considered the fraction of the source that is available to be transported to the stream. Although the use of the source coefficients is limited with respect to comparisons with the scientific literature, source coefficients are useful in the model calibration process and should be consistent with our understanding of the nature, transport, and fate of the sources that were modeled. For example, because permitted wastewater discharges release nutrients directly to streams rather than on land, the expected coefficient for the point-source terms in the SPARROW models is 1.0; no land attenuation of the source is expected. The fitted coefficients for the TN and TP models were 1.1 and 1.2, respectively, which suggests that these sources were reasonably captured by the models. Experience has shown that the point-source coefficient typically is not exactly 1.0 (Hoos and McMahon, 2009; Robertson and Saad, 2011; Wise and Johnson, 2013), which is likely due to uncertainties in the estimate of the annual TN and TP discharge from these sources. Source term coefficients with different units should not be compared. For example, it is meaningless to compare the coefficient for farm fertilizer (dimensionless) with the coefficient for grazing land kilograms per square kilometer per year.
Within each model, coefficients with similar units exhibited values consistent with the expected mechanism of nutrient delivery to stream systems. In the TN model, the estimated coefficient for point sources (1.1) and springs and power returns (0.80) were larger than the coefficients for farm fertilizer (0.11) and farm fertilizer plus confined cattle manure (0.052) (table 1). This difference is mechanistically reasonable because the first two sources deliver their load of nitrogen directly to a stream, whereas nitrogen in farm fertilizer and manure is subjected to multiple processing and transport pathways prior to reaching a stream. Comparing the two land-use terms in the TN model, export from forest land is, on average, larger than the export from grazing land, which is reasonable given that ecosystem productivity, precipitation, and land-surface slope generally are greater in the forested parts of the modeling domain.
A similar reasoning explains the greater coefficient values of point sources and springs and power returns in the TP model compared to farm fertilizer, confined cattle manure, and grazing livestock manure (table 2). Although the sources for which they act as surrogates are different, the land-use terms in the TP model also follow the pattern observed in the TN model: the coefficient for forest land is considerably larger than the coefficient for scrub and grass land. Among the quantified TP non-point sources, the coefficient for grazing livestock manure is the largest, followed by farm fertilizer, and then confined cattle manure; less than 10 percent of the TP from these sources is available for transport into nearby
Model Calibration and Uncertainty 17
streams. The grazing livestock manure coefficient seems large; however, the NLLS standard error and the bootstrap analysis indicate considerable uncertainty in this coefficient. Despite the relatively large amount of uncertainty and the small fraction of the total TP load that originates from grazing livestock manure (figs. 7 and 9), it is still statistically significant because of its importance in certain catchments in the model.
The relative magnitudes of the coefficients are not directly related to their contribution to the nutrient load issuing from a catchment. The load issuing from a catchment is a function of not only the source coefficient, but also of the size of each source, the delivery terms, and the magnitude of the load entering a catchment from upstream sources.
Because only the sign of the coefficients provides useful insight into the model-calibration process, little information can be acquired by analysis of the coefficients of delivery terms. A positive coefficient indicates the term increases export to streams; a negative coefficient indicates the term decreases export to streams. A positive coefficient was expected for mean precipitation for the TN and TP models, and is due to a positive correlation between precipitation and nutrient runoff in most catchments. A non-significant or negative coefficient for this term would have been highly suspect. In the TN model, the coefficient on the irrigated agriculture delivery term was positive, indicating that TN export is greater from irrigated crops than from non-irrigated crops. This observation may be because of differences in the types of crops grown and their associated applications of nitrogenous fertilizer. Alternately, it may point to differences in nitrogen transport pathways—primarily groundwater or primarily overland runoff—and the associated opportunities for nitrogen uptake and denitrification. In the TP model, the phosphorus retention coefficient was negative, indicating that less TP is transported to streams in catchments with a high percentage of phosphorus-retaining soils. The phosphorus retention land-to-water delivery term is a measure of the capacity of the soil in a catchment to inhibit the movement of soluble forms of phosphorus through one or more sorption or precipitation processes (Cole and others, 1953; Hemwall, 1957; James and others, 1996; Berg and Joern, 2006; Devau and others, 2011). Phosphorus immobilized in this manner is still part of the pool of TP in a catchment, but erosion by wind or water is necessary to move that particle (and its associated TP) into the stream.
In-stream attenuation of nutrients represents a permanent loss or removal of nutrients, and is thought to reflect denitrification (TN) and the settling of particulates (TN and TP). Because SPARROW simulates long-term annual nutrient loads, intra-annual variation of nutrients (such as algal growth and decay) is not reflected in the SPARROW stream attenuation term. In-stream attenuation often is identified as a statistically significant process in SPARROW nutrient models (Smith and others, 1997; Preston and Brakebill, 1999; Moore
and others, 2004; Hoos and McMahon, 2009). This was not the case for either model calibrated for this study, and is consistent with other SPARROW models constructed for the PNW (Wise and Johnson, 2011, 2013). Although a thorough explanation for this finding has not yet been identified, a number of possibilities exist. Recent work in the Yakima River Basin showed little metabolism of nitrate in agricultural streams (Duff and others, 2008), yet this observation can be only a partial explanation because agricultural streams represent a relatively small fraction of all stream reaches in these models. Another possibility is that the lack of a statistically significant in-stream attenuation term for TN could be a modeling artifact resulting from the interaction between the in-stream attenuation term and the representation of natural TN sources using forest land. Stream attenuation of TN is greater in small streams compared to large streams (Alexander and others, 2000; Peterson and others, 2001), and most of the smallest stream reaches in the PNW (first- and second-order streams) are located in catchments that generally included a high percentage of forest land (greater than 50 percent). In-stream attenuation in low-order reaches may be accounted for in the coefficients for the forest land term, thus eliminating the need to account for this process through a separate attenuation term. The lack of a significant in-stream attenuation term for TP suggests dams and reservoirs have little or no effect on TP removal on annual time scales despite the large number of these structures in the PNW. In the Middle Columbia River Basin (and the larger PNW region), most large dams are located in steep, forested areas and provide flood control and water storage for irrigation and drinking water. Most dams are located upstream of the largest sources of TP (agricultural fertilizer and manure) and, therefore, play a small role in the overall removal of TP in the system. The only major dams downstream of the primary agricultural areas in the Middle Columbia River Basin are on the Columbia River, and are “run-of-the-river” dams with little storage capacity. Other aspects of dam construction and operation in the PNW also may contribute to minimal annual TP storage, including seasonal drawdown and bottom-release of stored water.
The source and land-to-water delivery terms used in the TN and TP models are statistically significant or were determined to be mechanistically important to the final calibrated model, but do not represent the only or best source or delivery terms that could be used in SPARROW models. A number of additional source and delivery terms were considered, but were eliminated from consideration. In some cases, there was not enough information to parameterize what might be considered an important source or process because of insufficient data. In other cases, it was possible to include and parameterize a source or delivery term in the model, but the term was not statistically significant or it was strongly correlated with another significant term. In some cases, it was necessary to combine correlated source terms into a new source term to examine the role of potentially significant
18 Total Nitrogen and Total Phosphorus, Middle Columbia River Basin, Using SPARROW Models, Emphasis on Yakima River Basin, Washington
sources (for example, farm fertilizer and confined cattle manure in the TN model). During calibration, unspecified sources and processes likely were indirectly accounted for in the estimated values of more broadly defined coefficients (for example, point sources, springs, and power returns). Uncertainty in the estimated model coefficients also might have been due to the finite sample sizes of the models and measurement errors associated with model input data. Such uncertainty might be reduced through the collection of additional water-quality data (especially in unmonitored areas) and refinements in the estimates of landscape attributes (especially nutrient source loadings). Refer to Wise and Johnson (2011) for a more thorough discussion of uncertainty in the source and delivery term datasets. Although more abundant and detailed sources and delivery data would improve these models, the percentage of variation explained by the TN (86 percent) and TP (80 percent) is consistent with other SPARROW model results for the PNW (Wise and Johnson, 2011, 2013).
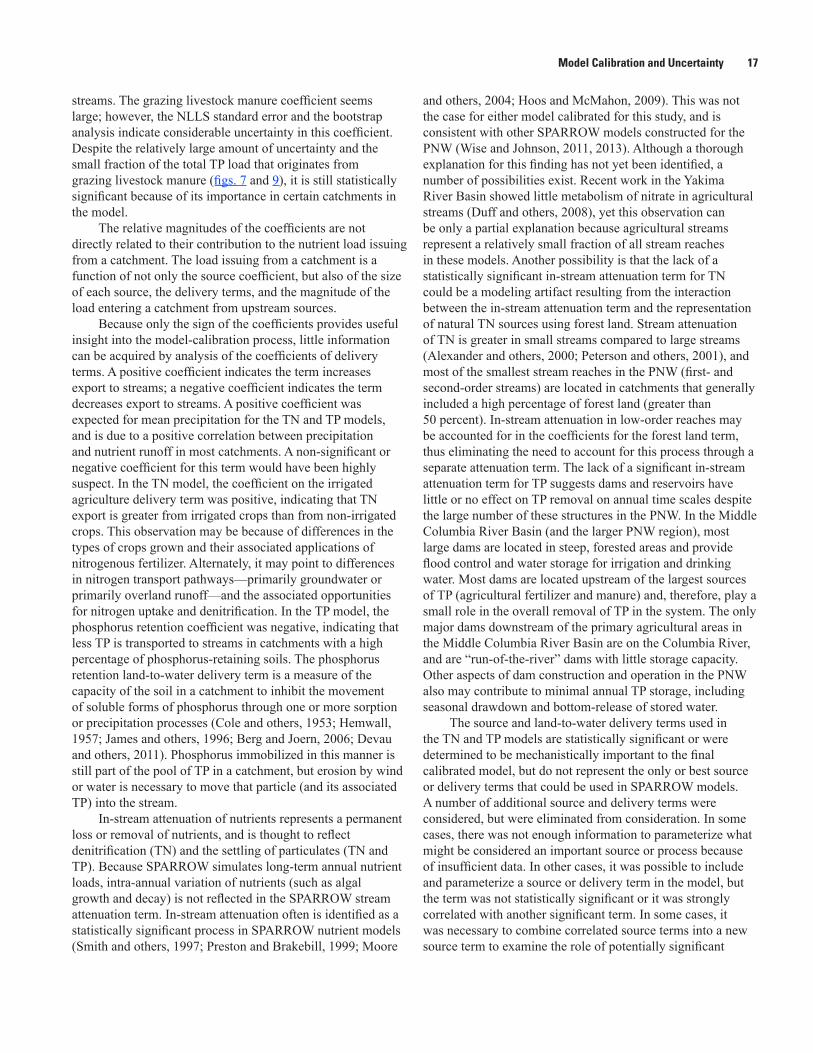
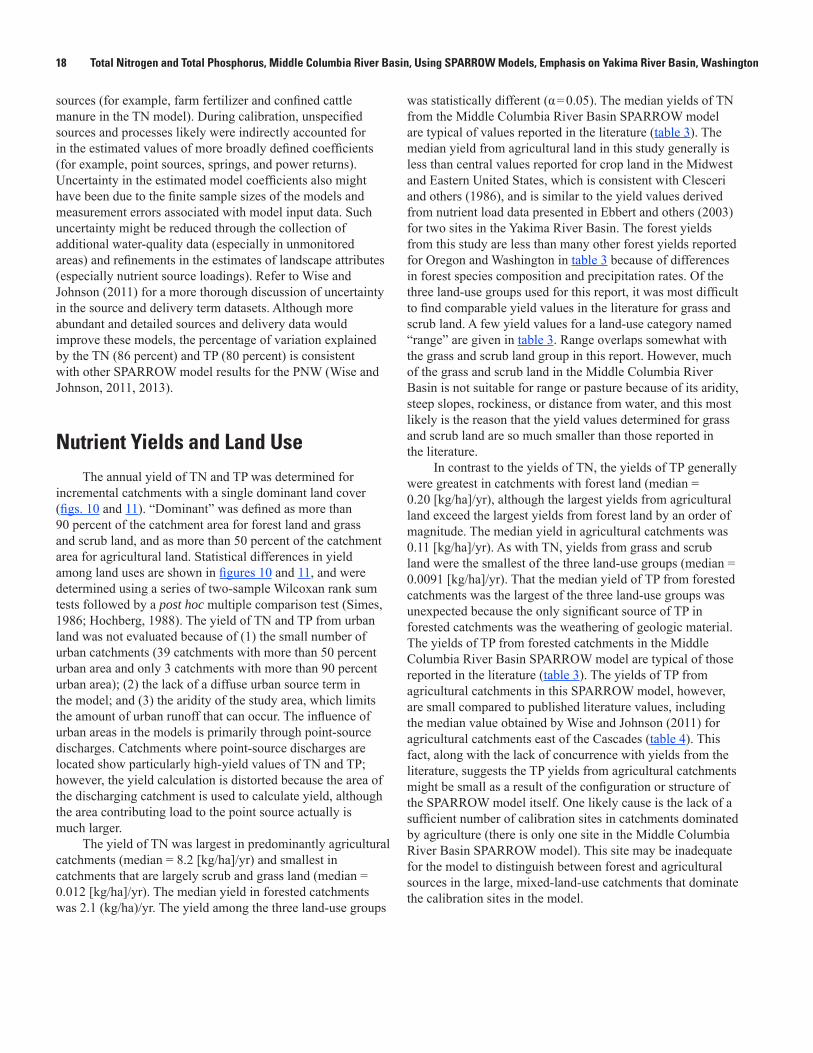
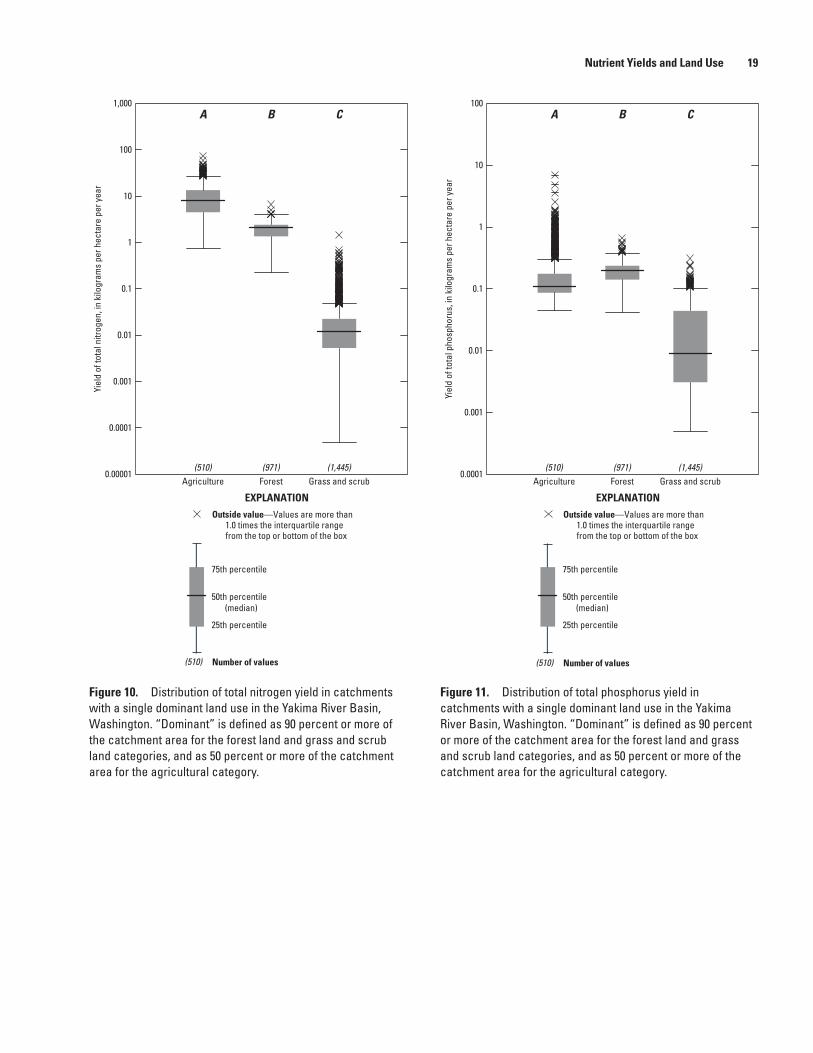
Nutrient Yields and Land UseThe annual yield of TN and TP was determined for
incremental catchments with a single dominant land cover (figs. 10 and 11). “Dominant” was defined as more than 90 percent of the catchment area for forest land and grass and scrub land, and as more than 50 percent of the catchment area for agricultural land. Statistical differences in yield among land uses are shown in figures 10 and 11, and were determined using a series of two-sample Wilcoxan rank sum tests followed by a post hoc multiple comparison test (Simes, 1986; Hochberg, 1988). The yield of TN and TP from urban land was not evaluated because of (1) the small number of urban catchments (39 catchments with more than 50 percent urban area and only 3 catchments with more than 90 percent urban area); (2) the lack of a diffuse urban source term in the model; and (3) the aridity of the study area, which limits the amount of urban runoff that can occur. The influence of urban areas in the models is primarily through point-source discharges. Catchments where point-source discharges are located show particularly high-yield values of TN and TP; however, the yield calculation is distorted because the area of the discharging catchment is used to calculate yield, although the area contributing load to the point source actually is much larger.
The yield of TN was largest in predominantly agricultural catchments (median = 8.2 [kg/ha]/yr) and smallest in catchments that are largely scrub and grass land (median = 0.012 [kg/ha]/yr). The median yield in forested catchments was 2.1 (kg/ha)/yr. The yield among the three land-use groups
was statistically different (α = 0.05). The median yields of TN from the Middle Columbia River Basin SPARROW model are typical of values reported in the literature (table 3). The median yield from agricultural land in this study generally is less than central values reported for crop land in the Midwest and Eastern United States, which is consistent with Clesceri and others (1986), and is similar to the yield values derived from nutrient load data presented in Ebbert and others (2003) for two sites in the Yakima River Basin. The forest yields from this study are less than many other forest yields reported for Oregon and Washington in table 3 because of differences in forest species composition and precipitation rates. Of the three land-use groups used for this report, it was most difficult to find comparable yield values in the literature for grass and scrub land. A few yield values for a land-use category named “range” are given in table 3. Range overlaps somewhat with the grass and scrub land group in this report. However, much of the grass and scrub land in the Middle Columbia River Basin is not suitable for range or pasture because of its aridity, steep slopes, rockiness, or distance from water, and this most likely is the reason that the yield values determined for grass and scrub land are so much smaller than those reported in the literature.
In contrast to the yields of TN, the yields of TP generally were greatest in catchments with forest land (median = 0.20 [kg/ha]/yr), although the largest yields from agricultural land exceed the largest yields from forest land by an order of magnitude. The median yield in agricultural catchments was 0.11 [kg/ha]/yr). As with TN, yields from grass and scrub land were the smallest of the three land-use groups (median = 0.0091 [kg/ha]/yr). That the median yield of TP from forested catchments was the largest of the three land-use groups was unexpected because the only significant source of TP in forested catchments was the weathering of geologic material. The yields of TP from forested catchments in the Middle Columbia River Basin SPARROW model are typical of those reported in the literature (table 3). The yields of TP from agricultural catchments in this SPARROW model, however, are small compared to published literature values, including the median value obtained by Wise and Johnson (2011) for agricultural catchments east of the Cascades (table 4). This fact, along with the lack of concurrence with yields from the literature, suggests the TP yields from agricultural catchments might be small as a result of the configuration or structure of the SPARROW model itself. One likely cause is the lack of a sufficient number of calibration sites in catchments dominated by agriculture (there is only one site in the Middle Columbia River Basin SPARROW model). This site may be inadequate for the model to distinguish between forest and agricultural sources in the large, mixed-land-use catchments that dominate the calibration sites in the model.
Nutrient Yields and Land Use 19
tac13-0870_fig 10
0.00001
0.0001
0.001
0.01
0.1
1
10
100
1,000
Agriculture Forest Grass and scrub(510) (971) (1,445)
Yiel
d of
tota
l nitr
ogen
, in
kilo
gram
s pe
r hec
tare
per
yea
r
A B C
(510)
EXPLANATION
Number of values
Outside value—Values are more than1.0 times the interquartile range from the top or bottom of the box
75th percentile
25th percentile
50th percentile(median)
Figure 10. Distribution of total nitrogen yield in catchments with a single dominant land use in the Yakima River Basin, Washington. “Dominant” is defined as 90 percent or more of the catchment area for the forest land and grass and scrub land categories, and as 50 percent or more of the catchment area for the agricultural category.
tac13-0870_fig 11
Agriculture Forest Grass and scrub(510) (971) (1,445)
Yiel
d of
tota
l pho
spho
rus,
in k
ilogr
ams
per h
ecta
re p
er y
ear
A B C
0.0001
0.001
0.01
0.1
1
10
100
(510)
EXPLANATION
Number of values
Outside value—Values are more than1.0 times the interquartile range from the top or bottom of the box
75th percentile
25th percentile
50th percentile(median)
Figure 11. Distribution of total phosphorus yield in catchments with a single dominant land use in the Yakima River Basin, Washington. “Dominant” is defined as 90 percent or more of the catchment area for the forest land and grass and scrub land categories, and as 50 percent or more of the catchment area for the agricultural category.
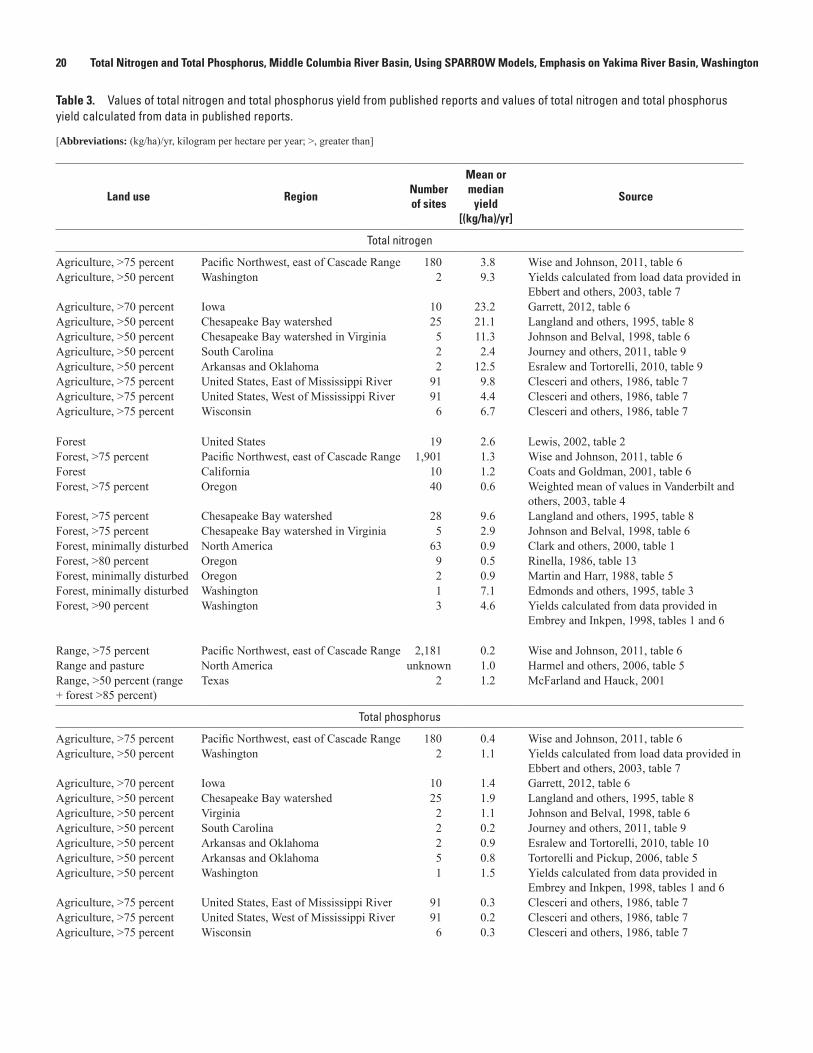
20 Total Nitrogen and Total Phosphorus, Middle Columbia River Basin, Using SPARROW Models, Emphasis on Yakima River Basin, Washington
Table 3. Values of total nitrogen and total phosphorus yield from published reports and values of total nitrogen and total phosphorus yield calculated from data in published reports.
[Abbreviations: (kg/ha)/yr, kilogram per hectare per year; >, greater than]
Land use RegionNumber of sites
Mean or median
yield [(kg/ha)/yr]
Source
Total nitrogen
Agriculture, >75 percent Pacific Northwest, east of Cascade Range 180 3.8 Wise and Johnson, 2011, table 6Agriculture, >50 percent Washington 2 9.3 Yields calculated from load data provided in
Ebbert and others, 2003, table 7Agriculture, >70 percent Iowa 10 23.2 Garrett, 2012, table 6Agriculture, >50 percent Chesapeake Bay watershed 25 21.1 Langland and others, 1995, table 8Agriculture, >50 percent Chesapeake Bay watershed in Virginia 5 11.3 Johnson and Belval, 1998, table 6Agriculture, >50 percent South Carolina 2 2.4 Journey and others, 2011, table 9 Agriculture, >50 percent Arkansas and Oklahoma 2 12.5 Esralew and Tortorelli, 2010, table 9Agriculture, >75 percent United States, East of Mississippi River 91 9.8 Clesceri and others, 1986, table 7Agriculture, >75 percent United States, West of Mississippi River 91 4.4 Clesceri and others, 1986, table 7Agriculture, >75 percent Wisconsin 6 6.7 Clesceri and others, 1986, table 7
Forest United States 19 2.6 Lewis, 2002, table 2Forest, >75 percent Pacific Northwest, east of Cascade Range 1,901 1.3 Wise and Johnson, 2011, table 6Forest California 10 1.2 Coats and Goldman, 2001, table 6Forest, >75 percent Oregon 40 0.6 Weighted mean of values in Vanderbilt and
others, 2003, table 4Forest, >75 percent Chesapeake Bay watershed 28 9.6 Langland and others, 1995, table 8Forest, >75 percent Chesapeake Bay watershed in Virginia 5 2.9 Johnson and Belval, 1998, table 6Forest, minimally disturbed North America 63 0.9 Clark and others, 2000, table 1Forest, >80 percent Oregon 9 0.5 Rinella, 1986, table 13Forest, minimally disturbed Oregon 2 0.9 Martin and Harr, 1988, table 5Forest, minimally disturbed Washington 1 7.1 Edmonds and others, 1995, table 3Forest, >90 percent Washington 3 4.6 Yields calculated from data provided in
Embrey and Inkpen, 1998, tables 1 and 6
Range, >75 percent Pacific Northwest, east of Cascade Range 2,181 0.2 Wise and Johnson, 2011, table 6Range and pasture North America unknown 1.0 Harmel and others, 2006, table 5Range, >50 percent (range+ forest >85 percent)
Texas 2 1.2 McFarland and Hauck, 2001
Total phosphorus
Agriculture, >75 percent Pacific Northwest, east of Cascade Range 180 0.4 Wise and Johnson, 2011, table 6Agriculture, >50 percent Washington 2 1.1 Yields calculated from load data provided in
Ebbert and others, 2003, table 7Agriculture, >70 percent Iowa 10 1.4 Garrett, 2012, table 6Agriculture, >50 percent Chesapeake Bay watershed 25 1.9 Langland and others, 1995, table 8Agriculture, >50 percent Virginia 2 1.1 Johnson and Belval, 1998, table 6Agriculture, >50 percent South Carolina 2 0.2 Journey and others, 2011, table 9Agriculture, >50 percent Arkansas and Oklahoma 2 0.9 Esralew and Tortorelli, 2010, table 10Agriculture, >50 percent Arkansas and Oklahoma 5 0.8 Tortorelli and Pickup, 2006, table 5Agriculture, >50 percent Washington 1 1.5 Yields calculated from data provided in
Embrey and Inkpen, 1998, tables 1 and 6Agriculture, >75 percent United States, East of Mississippi River 91 0.3 Clesceri and others, 1986, table 7Agriculture, >75 percent United States, West of Mississippi River 91 0.2 Clesceri and others, 1986, table 7Agriculture, >75 percent Wisconsin 6 0.3 Clesceri and others, 1986, table 7
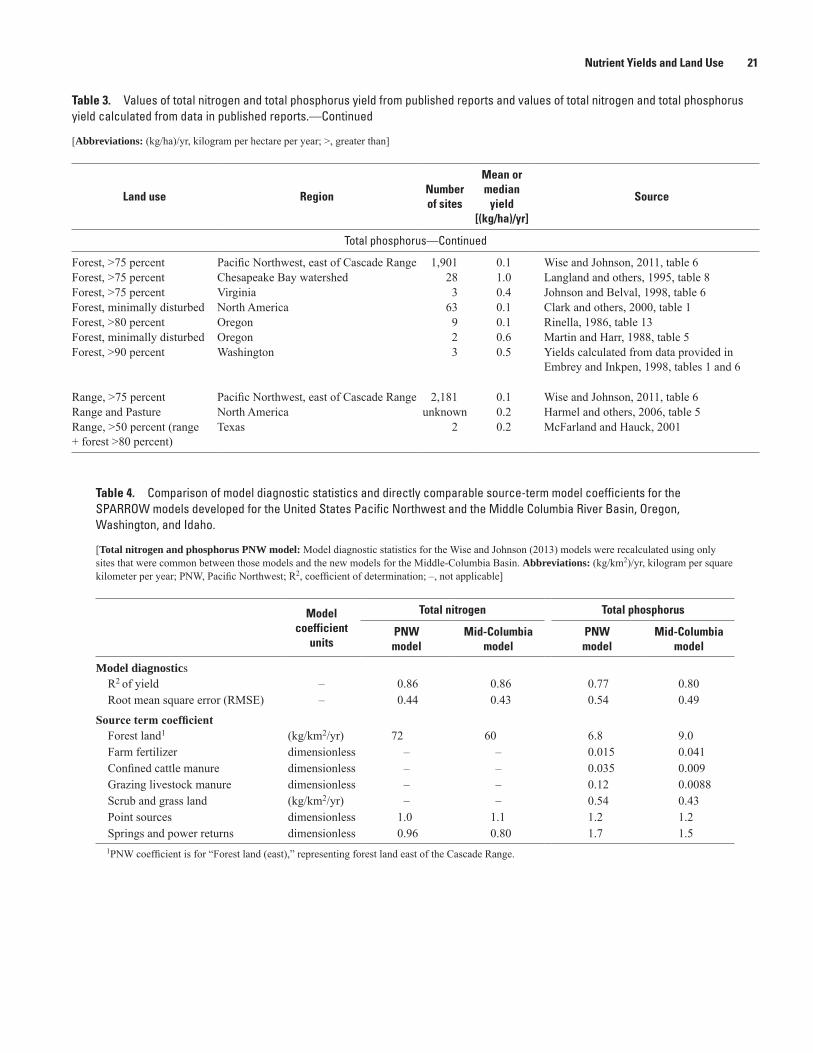
Nutrient Yields and Land Use 21
Table 3. Values of total nitrogen and total phosphorus yield from published reports and values of total nitrogen and total phosphorus yield calculated from data in published reports.—Continued
[Abbreviations: (kg/ha)/yr, kilogram per hectare per year; >, greater than]
Land use RegionNumber of sites
Mean or median
yield [(kg/ha)/yr]
Source
Total phosphorus—Continued
Forest, >75 percent Pacific Northwest, east of Cascade Range 1,901 0.1 Wise and Johnson, 2011, table 6Forest, >75 percent Chesapeake Bay watershed 28 1.0 Langland and others, 1995, table 8 Forest, >75 percent Virginia 3 0.4 Johnson and Belval, 1998, table 6Forest, minimally disturbed North America 63 0.1 Clark and others, 2000, table 1Forest, >80 percent Oregon 9 0.1 Rinella, 1986, table 13Forest, minimally disturbed Oregon 2 0.6 Martin and Harr, 1988, table 5Forest, >90 percent Washington 3 0.5 Yields calculated from data provided in
Embrey and Inkpen, 1998, tables 1 and 6
Range, >75 percent Pacific Northwest, east of Cascade Range 2,181 0.1 Wise and Johnson, 2011, table 6Range and Pasture North America unknown 0.2 Harmel and others, 2006, table 5Range, >50 percent (range+ forest >80 percent)
Texas 2 0.2 McFarland and Hauck, 2001
Table 4. Comparison of model diagnostic statistics and directly comparable source-term model coefficients for the SPARROW models developed for the United States Pacific Northwest and the Middle Columbia River Basin, Oregon, Washington, and Idaho.
[Total nitrogen and phosphorus PNW model: Model diagnostic statistics for the Wise and Johnson (2013) models were recalculated using only sites that were common between those models and the new models for the Middle-Columbia Basin. Abbreviations: (kg/km2)/yr, kilogram per square kilometer per year; PNW, Pacific Northwest; R2, coefficient of determination; –, not applicable]
Model coefficient
units
Total nitrogen Total phosphorus
PNW model
Mid-Columbia model
PNW model
Mid-Columbia model
Model diagnostics R2 of yield – 0.86 0.86 0.77 0.80 Root mean square error (RMSE) – 0.44 0.43 0.54 0.49
Source term coefficient Forest land1 (kg/km2/yr) 72 60 6.8 9.0 Farm fertilizer dimensionless – – 0.015 0.041 Confined cattle manure dimensionless – – 0.035 0.009 Grazing livestock manure dimensionless – – 0.12 0.0088 Scrub and grass land (kg/km2/yr) – – 0.54 0.43 Point sources dimensionless 1.0 1.1 1.2 1.2 Springs and power returns dimensionless 0.96 0.80 1.7 1.5
1PNW coefficient is for “Forest land (east),” representing forest land east of the Cascade Range.
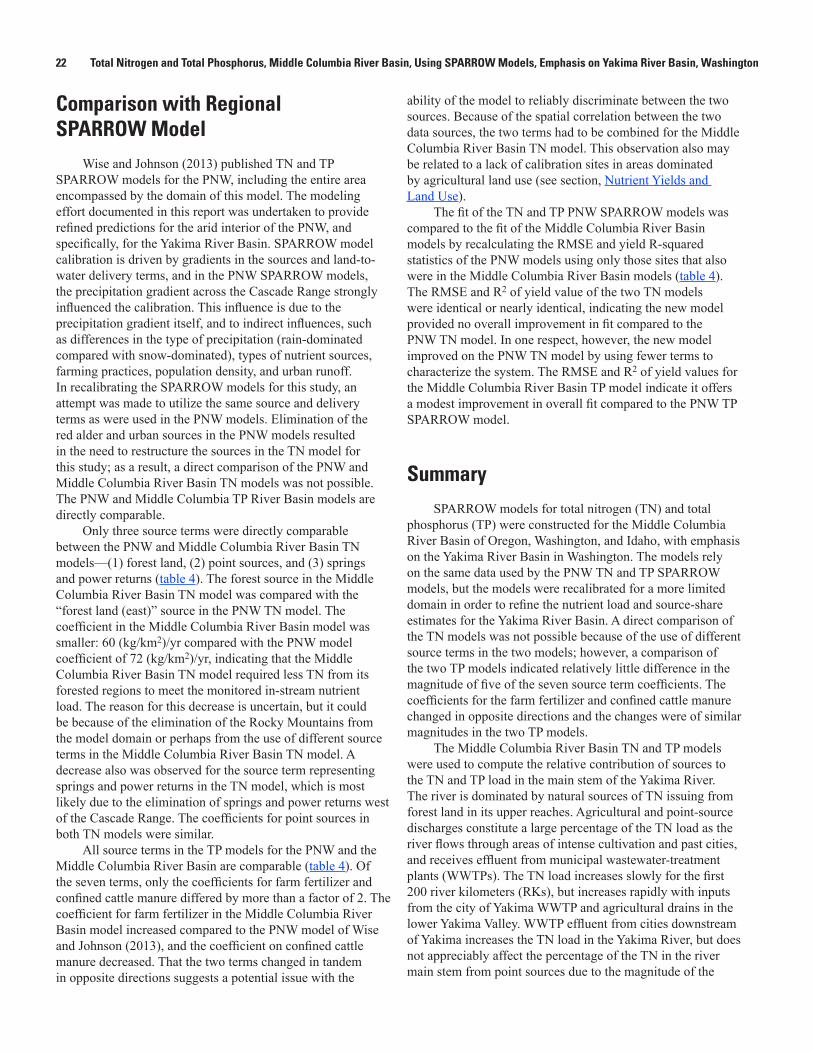
22 Total Nitrogen and Total Phosphorus, Middle Columbia River Basin, Using SPARROW Models, Emphasis on Yakima River Basin, Washington
Comparison with Regional SPARROW Model
Wise and Johnson (2013) published TN and TP SPARROW models for the PNW, including the entire area encompassed by the domain of this model. The modeling effort documented in this report was undertaken to provide refined predictions for the arid interior of the PNW, and specifically, for the Yakima River Basin. SPARROW model calibration is driven by gradients in the sources and land-to-water delivery terms, and in the PNW SPARROW models, the precipitation gradient across the Cascade Range strongly influenced the calibration. This influence is due to the precipitation gradient itself, and to indirect influences, such as differences in the type of precipitation (rain-dominated compared with snow-dominated), types of nutrient sources, farming practices, population density, and urban runoff. In recalibrating the SPARROW models for this study, an attempt was made to utilize the same source and delivery terms as were used in the PNW models. Elimination of the red alder and urban sources in the PNW models resulted in the need to restructure the sources in the TN model for this study; as a result, a direct comparison of the PNW and Middle Columbia River Basin TN models was not possible. The PNW and Middle Columbia TP River Basin models are directly comparable.
Only three source terms were directly comparable between the PNW and Middle Columbia River Basin TN models—(1) forest land, (2) point sources, and (3) springs and power returns (table 4). The forest source in the Middle Columbia River Basin TN model was compared with the “forest land (east)” source in the PNW TN model. The coefficient in the Middle Columbia River Basin model was smaller: 60 (kg/km2)/yr compared with the PNW model coefficient of 72 (kg/km2)/yr, indicating that the Middle Columbia River Basin TN model required less TN from its forested regions to meet the monitored in-stream nutrient load. The reason for this decrease is uncertain, but it could be because of the elimination of the Rocky Mountains from the model domain or perhaps from the use of different source terms in the Middle Columbia River Basin TN model. A decrease also was observed for the source term representing springs and power returns in the TN model, which is most likely due to the elimination of springs and power returns west of the Cascade Range. The coefficients for point sources in both TN models were similar.
All source terms in the TP models for the PNW and the Middle Columbia River Basin are comparable (table 4). Of the seven terms, only the coefficients for farm fertilizer and confined cattle manure differed by more than a factor of 2. The coefficient for farm fertilizer in the Middle Columbia River Basin model increased compared to the PNW model of Wise and Johnson (2013), and the coefficient on confined cattle manure decreased. That the two terms changed in tandem in opposite directions suggests a potential issue with the
ability of the model to reliably discriminate between the two sources. Because of the spatial correlation between the two data sources, the two terms had to be combined for the Middle Columbia River Basin TN model. This observation also may be related to a lack of calibration sites in areas dominated by agricultural land use (see section, Nutrient Yields and Land Use).
The fit of the TN and TP PNW SPARROW models was compared to the fit of the Middle Columbia River Basin models by recalculating the RMSE and yield R-squared statistics of the PNW models using only those sites that also were in the Middle Columbia River Basin models (table 4). The RMSE and R2 of yield value of the two TN models were identical or nearly identical, indicating the new model provided no overall improvement in fit compared to the PNW TN model. In one respect, however, the new model improved on the PNW TN model by using fewer terms to characterize the system. The RMSE and R2 of yield values for the Middle Columbia River Basin TP model indicate it offers a modest improvement in overall fit compared to the PNW TP SPARROW model.
SummarySPARROW models for total nitrogen (TN) and total
phosphorus (TP) were constructed for the Middle Columbia River Basin of Oregon, Washington, and Idaho, with emphasis on the Yakima River Basin in Washington. The models rely on the same data used by the PNW TN and TP SPARROW models, but the models were recalibrated for a more limited domain in order to refine the nutrient load and source-share estimates for the Yakima River Basin. A direct comparison of the TN models was not possible because of the use of different source terms in the two models; however, a comparison of the two TP models indicated relatively little difference in the magnitude of five of the seven source term coefficients. The coefficients for the farm fertilizer and confined cattle manure changed in opposite directions and the changes were of similar magnitudes in the two TP models.
The Middle Columbia River Basin TN and TP models were used to compute the relative contribution of sources to the TN and TP load in the main stem of the Yakima River. The river is dominated by natural sources of TN issuing from forest land in its upper reaches. Agricultural and point-source discharges constitute a large percentage of the TN load as the river flows through areas of intense cultivation and past cities, and receives effluent from municipal wastewater-treatment plants (WWTPs). The TN load increases slowly for the first 200 river kilometers (RKs), but increases rapidly with inputs from the city of Yakima WWTP and agricultural drains in the lower Yakima Valley. WWTP effluent from cities downstream of Yakima increases the TN load in the Yakima River, but does not appreciably affect the percentage of the TN in the river main stem from point sources due to the magnitude of the
References Cited 23
TN output from the large drains in the lower Yakima Valley such as Granger Drain, Marion Drain, Toppenish Creek, and Sulphur Creek Wasteway.
As with TN, the Yakima River is dominated by natural sources of TP issuing from forest land in its upper reaches. TP originating from forest land is presumed to be largely from natural weathering of geologic materials. Contributions of TP from grazing land and point sources (municipal WWTPs) constitute most of the TP in the river downstream to about RK 210, where the city of Yakima WWTP outfall enters the river. Downstream of this point, the dominant sources of TP load in the river shift from predominantly natural to predominantly anthropogenic. TP from farm fertilizer and confined cattle manure become a major part of the TP load in the river downstream of the large lower valley agricultural drains, many of which enter the river between RK 150 and RK 100.
References Cited
Alexander, R.B., Smith, R.A., and Schwarz, G.E., 2000, Effect of stream channel size on the delivery of nitrogen to the Gulf of Mexico: Nature, v. 403, no. 6771, p. 758–761.
Berg, A.S., and Joern, B.C., 2006, Sorption dynamics of organic and inorganic phosphorus compounds in soil: Journal of Environmental Quality, v. 35, no. 5, p. 1855–1862.
Carter, K., 2005, The effects of dissolved oxygen on steelhead trout, coho salmon, and Chinook salmon biology and function by life stage: California Regional Water Quality Control Board, North Coast Region, 10 p.
Clark, G.M., Mueller, D.K., and Mast, M.A., 2000, Nutrient concentrations and yields in undeveloped stream basins of the United States: Journal of the American Water Resources Association, v. 36, no. 4, p. 849–860.
Clesceri, N.L., Curran, S.J., and Sedlak, R.I., 1986, Nutrient loads to Wisconsin lakes—Part I—Nitrogen and phosphorus export coefficients: Water Resources Bulletin, v. 22, no. 6, p. 983–990.
Coats, R.N., and Goldman, C.R., 2001, Patterns of nitrogen transport in streams of the Lake Tahoe Basin, California–Nevada: Water Resources Research, v. 37, no. 2, p. 405–415.
Cole, C.V., Olsen, S.R., and Scott, C.O., 1953, The nature of phosphate sorption by calcium carbonate: Soil Science Society of America Journal, v. 17, no. 4, p. 352–356.
Devau, N., Hinsinger, P., Le Cadre, E., Colomb, B., and Gérard, F., 2011, Fertilization and pH effects on processes and mechanisms controlling dissolved inorganic phosphorus in soils: Geochimica et Cosmochimica Acta, v. 75, no. 10, p. 2980–2996.
Duff, J.H., Tesoriero, A.J., Richardson, W.B., Strauss, E.A., and Munn, M.D., 2008, Whole-stream response to nitrate loading in three streams draining agricultural landscapes: Journal of Environmental Quality, v. 37, no. 3, p. 1133–1144.
Ebbert, J.C., Embrey, S.S., and Kelley, J.A., 2003, Concentrations and loads of suspended sediment and nutrients in surface water of the Yakima River Basin, Washington, 1999–2000—With an analysis of trends in concentrations: U.S. Geological Survey Water-Resources Investigations Report 03-4026, 97 p., http://pubs.usgs.gov/wri/wri034026/.
Edmonds, R.L., Thomas, T.B., and Blew, R.D., 1995, Biogeochemistry of an old-growth forested watershed, Olympic National Park, Washington: Water Resources Bulletin, v. 31, no. 3, p. 409–419.
Embrey, S.S., and Inkpen, E.L., 1998, Water-quality assessment of the Puget Sound Basin, Washington, nutrient transport in rivers, 1980–93: U.S. Geological Survey Water-Resources Investigations Report 97-4270, 30 p., http://pubs.er.usgs.gov/publication/wri974270.
Esralew, R.A., and Tortorelli, R.L., 2010, Nutrient concentrations, loads, and yields in the Eucha-Spavinaw Basin, Arkansas and Oklahoma, 2002–09: U.S. Geological Survey Scientific Investigations Report 2010-5119, 61 p., http://pubs.usgs.gov/sir/2010/5119/.
Garrett, J.D., 2012, Concentrations, loads, and yields of select constituents from major tributaries of the Mississippi and Missouri Rivers in Iowa, water years 2004–2008: U.S. Geological Survey Scientific Investigations Report 2012-5240, 61 p., http://pubs.usgs.gov/sir/2012/5240/.
Harmel, D., Potter, S., Casebolt, P., Reckhow, K., Green, C., and Haney, R., 2006, Compilation of measured nutrient load data for agricultural land uses in the United States: Journal of the American Water Resources Association, v. 42, no. 5, p. 1163–1178.
Hemwall, J.B., 1957, The fixation of phosphorus by soils, in Norman, A.G., ed., Advances in Agronomy: New York, Academic Press Inc., p. 96–112.
Hochberg, Y., 1988, A sharper Bonferroni procedure for multiple tests of significance: Biometrika, v. 75, no. 4, p. 800–802.
24 Total Nitrogen and Total Phosphorus, Middle Columbia River Basin, Using SPARROW Models, Emphasis on Yakima River Basin, Washington
Homer, C., Huang, C., Yang, L., Wylie, B., and Coan, M., 2004, Development of a 2001 National land-cover database for the United States: Photogrammetric Engineering & Remote Sensing, v. 70, no. 7, p. 829–840.
Hoos, A.B., and McMahon, G., 2009, Spatial analysis of instream nitrogen loads and factors controlling nitrogen delivery to streams in the southeastern United States using spatially referenced regression on watershed attributes (SPARROW) and regional classification frameworks: Hydrological Processes, v. 23, no. 16, p. 2275–2294.
Horizon Systems, 2013, NHDPlusV2 Data: Horizon Systems database, accessed April 19, 2013, at http://www.horizon-systems.com/NHDPlus/NHDPlusV2_data.php.
Idaho Department of Environmental Quality, 2013, Integrated report: Idaho Department of Environmental Quality Web site, accessed April 24, 2013, at http://www.deq.idaho.gov/water-quality/surface-water/monitoring-assessment/integrated-report.aspx.
International Soil Reference and Information Center, 2013, Global assessment of soil phosphorus retention potential: International Soil Reference and Information Center Web site, accessed July 16, 2013, at http://www.isric.org/data/global-assessment-soil-phosphorus-retention-potential.
James, D.W., Kotuby-Amacher, J., Anderson, G.L., and Huber, D.A., 1996, Phosphorus mobility in calcareous soils under heavy manuring: Journal of Environmental Quality, v. 25, no. 4, p. 770–775.
Johnson, H.M., and Belval, D.L., 1998, Nutrient and suspended solids loads, yields, and trends in the non-tidal part of five major river basins in Virginia, 1985–96: U.S. Geological Survey Water-Resources Investigations Report 98-4025, 36 p., http://pubs.er.usgs.gov/publication/wri984025.
Journey, C.A., Caldwell, A.W., Feaster, T.D., Petkewich, M.D., and Bradley, P.M., 2011, Concentrations, loads, and yields of nutrients and suspended sediment in the South Pacolet, North Pacolet, and Pacolet Rivers, northern South Carolina and southwestern North Carolina, October 2005 to September 2009: U.S. Geological Survey Scientific Investigations Report 2010-5252, 79 p., http://pubs.usgs.gov/sir/2010/5252/.
Langland, M.J., Lietman, P.L., and Hoffman, S., 1995, Synthesis of nutrient and sediment data for watersheds within the Chesapeake Bay drainage basin: U.S. Geological Survey Water-Resources Investigations Report 95-4233, 121 p., http://pubs.er.usgs.gov/publication/wri954233.
Lewis, W.M., Jr., 2002, Yield of nitrogen from minimally disturbed watersheds of the United States: Biogeochemistry, v. 57–58, no. 1, p. 375–385.
Martin, C.W., and Harr, R.D., 1988, Precipitation and streamwater chemistry from undisturbed watersheds in the Cascade Mountains of Oregon: Water, Air, and Soil Pollution, v. 42, nos. 1–2, p. 203–219.
McFarland, A.M.S., and Hauck, L.M., 2001, Determining nutrient export coefficients and source loading uncertainty using in-stream monitoring data: Journal of the American Water Resources Association, v. 37, no. 1, p. 223–236.
McKay, L., Bondelid, T., Dewald, T., Rea, A., Johnston, C., and Moore, R., 2013, NHDPlus Version 2—User guide (data model 2.1): Prepared for U.S Environmental Protection Agency, Office of Water, 168 p.
Moore, R.B., Johnston, C.M., Robertson, K.W., and Deacon, J.R., 2004, Estimation of total nitrogen and phosphorus In New England streams using spatially referenced regression models: U.S. Geological Survey Scientific Investigations Report 2004-5012, 42 p., http://pubs.usgs.gov/sir/2004/5012/.
Oregon Department of Environmental Quality, 2013, Oregon’s 2010 Integrated Report: Portland, Oregon Department of Environmental Quality Web site, accessed April 24, 2013, at http://www.deq.state.or.us/wq/assessment/2010Report.htm.
Oregon Health Authority, 2013, Algae bloom advisories: Portland, Oregon Health Authority Web site, accessed April 24, 2013, at http://public.health.oregon.gov/HealthyEnvironments/Recreation/HarmfulAlgaeBlooms/Pages/Blue-GreenAlgaeAdvisories.aspx.
Peterson, B.J., Wollheim, W.M., Mulholland, P.J., Webster, J.R., Meyer, J.L., Tank, J.L., Martí, E., Bowden, W.B., Valett, H.M., Hershey, A.E., McDowell, W.H., Dodds, W.K., Hamilton, S.K., Gregory, S., and Morrall, D.D., 2001, Control of nitrogen export from watersheds by headwater streams: Science, v. 292, no. 5514, p. 86–90.
Preston, S.D., Alexander, R.B., Woodside, M.D., and Hamilton, P.A., 2009, SPARROW modeling—Enhancing understanding of the Nation’s water quality: U.S. Geological Survey Fact Sheet 2009-3019, 6 p., http://pubs.usgs.gov/fs/2009/3019/.
Preston, S.D., and Brakebill, J.W., 1999, Application of spatially referenced regression modeling for the evaluation of total nitrogen loading in the Chesapeake Bay watershed: U.S. Geological Survey Water-Resources Investigations Report 99-4054, 12 p., http://md.water.usgs.gov/publications/wrir-99-4054/.
Rinella, J.F., 1986, Analysis of fixed-station water-quality data in the Umpqua River Basin, Oregon: U.S. Geological Survey Water-Resources Investigations Report 85-4253, 96 p., http://pubs.er.usgs.gov/publication/wri854253.
References Cited 25
Robertson, D.M., and Saad, D.A., 2011, Nutrient inputs to the Laurentian Great Lakes by source and watershed estimated using SPARROW watershed models: Journal of the American Water Resources Association, v. 47, no. 5, p. 1011–1033.
Schwarz, G.E., Hoos, A.B., Alexander, R.B., and Smith, R.A., 2006, The SPARROW surface water-quality model—Theory, application and user documentation: U.S. Geological Survey Techniques and Methods, book 6, chap. B3, 256 p., http://pubs.usgs.gov/tm/2006/tm6b3/.
Simes, R.J., 1986, An improved Bonferroni procedure for multiple tests of significance: Biometrika, v. 73, no. 3, p. 751–754.
Simley, J.D., and Carswell, W.J., Jr., 2010, The National Map—Hydrography: U.S. Geological Survey Fact Sheet 2009-3054, 4 p., http://pubs.usgs.gov/fs/2009/3054/.
Smith, R.A., Schwarz, G.E., and Alexander, R.B., 1997, Regional interpretation of water-quality monitoring data: Water Resources Research, v. 33, no. 12, p. 2781–2798.
Stone, D., and Hitchko, K., 2009, Toxic blooms in Oregon waters: Corvallis, Oregon State University, Report Number EC 1631-E, 4 p.
Tortorelli, R.L., and Pickup, B.E., 2006, Phosphorus concentrations, loads, and yields in the Illinois River Basin, Arkansas and Oklahoma, 2000–2004: U.S. Geological Survey Scientific Investigations Report 2006–5175, 38 p., http://pubs.usgs.gov/sir/2006/5175/.
U.S. Geological Survey, 2013, Extent of soil with very high phosphorus retention potential in the United States Pacific Northwest: U.S. Geological Survey Water Resources NSDI Node Web site, accessed July 16, 2013, at http://water.usgs.gov/lookup/getspatial?sir2013-5103_PNW_SPARROW_Soil_P_RetentionPotential_p_ret_vhigh.
Vanderbilt, K.L., Lajtha, K., and Swanson, F.J., 2003, Biogeochemistry of unpolluted forested watersheds in the Oregon Cascades—Temporal patterns of precipitation and stream nitrogen fluxes: Biogeochemistry, v. 62, no. 1, p. 87–117.
Washington Department of Ecology, 2013a, Washington State’s water quality assessment and 303(d) list: Olympia, Washington Department of Ecology Web site, accessed April 24, 2013, at http://www.ecy.wa.gov/programs/wq/303d/index.html.
Washington Department of Ecology, 2013b, Algae bloom monitoring: Olympia, Washington Department of Ecology Web site, accessed April 24, 2013, at http://www.ecy.wa.gov/programs/wq/plants/algae/monitoring/index.html.
Wise, D.R., and Johnson, H.M., 2011, Surface-water nutrient conditions and sources in the United States Pacific Northwest: Journal of the American Water Resources Association, v. 47, no. 5, p. 1110–1135.
Wise, D.R., and Johnson, H.M., 2013, Application of the SPARROW model to assess surface-water nutrient conditions and sources in the United States Pacific Northwest: U.S. Geological Survey Scientific Investigations Report 2013-5103, 32 p., http://pubs.usgs.gov/sir/2013/5103/.
Wise, D.R., Zuroske, M.L., Carpenter, K.D., and Kiesling, R.L., 2009, Assessment of eutrophication in the Lower Yakima River Basin, Washington, 2004–2007: U.S. Geological Survey Scientific Investigations Report 2009-5078, 109 p., http://pubs.usgs.gov/sir/2009/5078/.

Appendix A 27
Appendix A. Prediction Results and Calibration LoadsThe mean annual total nitrogen and phosphorus loads and yields predicted by the Middle Columbia River Basin
SPARROW models are available online in a tab-delimited ASCII file at http://pubs.usgs.gov/sir/2013/5199/. The file includes predictions for individual stream reaches in the National Hydrography Dataset Plus Version 2 (Pacific Northwest) geospatial dataset (Horizon Systems, 2013). Columns in the ASCII file are described in the header (denoted by lines starting with “#”), and include COMID (common identifier of an NHD reach), AreaSqKM (area of the incremental NHD catchment, in square kilometers), TotDASqKM (total area draining to a reach, in square kilometers), predictions of the total mean annual load for each reach that is attributable to all upstream nutrient sources (in kilograms per year), and predictions of the total mean annual load for each reach that is attributable to individual upstream nutrient sources (in kilograms per year). The file also contains the estimated loads used to calibrate the SPARROW models.
Reference Cited
Horizon Systems, 2013, NHDPlusV2 Data: Horizon Systems database, accessed April 19, 2013, at http://www.horizon-systems.com/NHDPlus/NHDPlusV2_data.php.


Publishing support provided by the U.S. Geological Survey Publishing Network, Tacoma Publishing Service Center
For more information concerning the research in this report, contact theDirector, Oregon Water Science CenterU.S. Geological Survey2130 SW 5th AvenuePortland, Oregon 97201http://or.water.usgs.gov

ISSN 2328-0328 (online)http://dx.doi.org/10.3133/sir20135199
Johnson and others— Total N
itrogen and Total Phosphorus, Middle Colum
bia River Basin, U
sing SPARRO
W M
odels, Emphasis on Yakim
a River Basin, W
ashington—Scientific Investigations Report 2013–5199


![polk.wateratlas.usf.edu · Phosphorus by SW-846 9056 [REF) (S) List Phosphorus 130 mg/Kg Ortho Phosphate, SW-846 9056 [REF] (S) List Ortho Phosphate Total Nitrogen List Total Nitrogen](https://img.pdfslide.us/doc/110x75/5f16a72204c3330bc5713c64/polk-phosphorus-by-sw-846-9056-ref-s-list-phosphorus-130-mgkg-ortho-phosphate.jpg)


![Simultaneous Measurement of Total Nitrogen and Phosphorus ... · digestion procedures found in U.S. EPA 351.2 (Total Kjeldahl Nitrogen [TKN]) and 365.4 (Total Kjeldahl Phosphorus](https://img.pdfslide.us/doc/110x75/60608f94db713f558836050e/simultaneous-measurement-of-total-nitrogen-and-phosphorus-digestion-procedures.jpg)