Embed Size (px)
DESCRIPTION
A experiment, study & results of Voluntary Control of Motor Units in Human Antagonist Muscles.
Citation preview
JOURNAL OF NEUROPHYSIOLOGY Vol. 58, No.3, September 1987. Primed in U.S.A.
Voluntary Control of Motor Units in Human Antagonist Muscles: Coactivation and Reciprocal Activation
C. J. DE LUCA AND B. MAMBRITO
NeuroMuscular Research Center, Boston University, Boston, Massachusetts 02215
SUMMAR Y AND CONCLUSIONS
1. Myoelectric (ME) activity of several motor units was detected simultaneously from the human flexor pollicis longus and extensor pollicis longus muscles, the only two muscles that control the interphalangeal joint of the thumb. The ME signals were detected while the subjects produced isometric force outputs to track three different paradigms: triangular trajectories, random-force trajectories requiring both flexion and extension contractions, and net zero force resulting from stiffening the joint by voluntarily coactivating both muscles.
2. The ME signals were.decomposed into their constituent motor-unit action potential trains. The firing rate behavior of the concurrently active motor units was studied using cross-correlation techniques.
3. During isometric contractions the firing rates of motor units within a muscle were greatly cross-correlated with essentially zero time shift with respect to each other. This observation confirms our previous report of this behavior, which has been called common drive (9). Common drive was also found among the motor units of the agonist and antagonist muscles during voluntary coactivation to stiffen the interphalangeal joint. This observation suggests two interesting points: 1) that the common drive mechanism has a component of central origin, and 2) that the central nervous system may control the motoneuron pools of an agonist-antagonist muscle pair as if they were one pool when both are performing the same task.
4. During force reversals, the firing rates of motor units reverse in an orderly manner:
earlier recruited motor units decrease their firing rate before later recruited motor units. This orderly reversal of firing rates is consistent with the concept of orderly recruitment and derecruitment.
5. A control scheme is suggested to explain the behavior ofthe motor units in both muscles during force reversal. It consists of centrally mediated reciprocally organized flexion and extension commands along with a common coactivation command to both muscles. This control scheme allows for coactivation and reciprocal activation of an agonist-antagonist set.
6. The agonist-antagonist pair was observed to generate a net force in two control modalities: proportional activation and reciprocal activation. In proportional activation, the agonist-antagonist set is coactivated during either of two states: when uncertainty exists in the required task or when a compensatory force contraction is perceived to be required. Otherwise, proportional activation enables only the agonist. The modality of reciprocal activation is employed when both states coexist; that is, when uncertainty exists in the required task and when a compensatory-force contraction is perceived to be required.
INTRODUCTION
Every joint in the human body is mobilized by muscles that generate forces in opposing directions. Therefore, it is possible to control separately both the torque and the stiffness at the joint. The net torque at a joint is the difference between the torques of the
0022-3077/87 $1.50 Copyright © 1987 The American Physiological Society 525
526 C. J. DE LUCA AND B. MAMBRITO
agonist and antagonist muscle sets. The net stiffness is the sum of the individual stiffness of the agonist and antagonist muscle sets. Thus the value of these two variables may range from high torque and low stiffness, when either the agonist set or antagonist set is individually activated, to zero torque and high stiffness when both sets are coactivated.
The control of antagonist muscles has been a topic of great interest since Sherrington (30, 31) reported his influential work. Sherrington demonstrated the existence of a centrally mediated reciprocal activation by applying electrical stimuli to specific areas of the motor cortex of a cat and noted that some muscles contracted while their antagonist relaxed. He also observed that in decerebrate cats, a peripherally applied stimulus elicited opposite reactions in an agonist-antagonist muscle set. This led him to postulate the concept of (peripherally mediated) reciprocal inhibition.
Since Sherrington's sterling work, the relative involvement of the central and peripheral systems in controlling antagonist muscles has been under constant scrutiny. As eary as 1925, Tilney and Pike (36) suggested that the cerebellum plays an important role in switching from reciprocal activation to coactivation. This notion has been supported by the findings of Terzuolo et al. (33, 34) working with monkeys and Hallett et al. (16) working with humans. They demonstrated that lesions in the cerebellum disturb and may eliminate the agonist-antagonist reciprocity. Direct measurements from the central nervous system have provided indications that specific cells in the cerebellar cortex (32) and in the red nucleus (7) are selectively activated during coactivation and reciprocal activation (6) of agonist-antagonist muscles in the upper limb. Cheney et al. (6) also found cells in the motor cortex that were selectively activated preceding reciprocal activation of agonist-antagonist muscles.
By far, the majority of studies directed at understanding the behavior of antagonist muscles have been performed by observing the gross myoelectric (ME) signal. In the past three decades, numerous investigators (1, 3, 13, 18, 20, among others) have shown that during rapid movements, the activity of both agonist and antagonist muscles often displays a triphasic pattern: an initial burst of
agonist activity with the antagonist silent (limb acceleration); followed by a reduction of agonist activity with a burst of activity in the antagonist (limb deceleration); and a subsequent resumption of agonist and antagonist activity. In the past decade, an animated and productive discussion has been carried out concerning the relative involvement of centrally preprogrammed commands and peripheral feedback commands in the control of rapid movements as well as the reproducibility of the triphasic pattern (l , 13, 15, 21, among others). Relatively few works have reported on agonist-antagonist interaction during other contraction modalities.
All previously reported studies on agonistantagonist interaction in humans have been limited to interpretation of the gross ME signal. Such approaches are restricted to providing information concerning the timing and the relative level ofthe contraction of the involved muscles. Recent advances in ME signal analysis techniques have made it possible to decompose gross signals into the individual constituent motor-unit action potential trains (MUAPTs). This study employs these techniques to observe the behavior of concurrently active motor units for the purpose of describing the intricacies of motor control in a relatively simple agonist-antagonist muscle set during voluntary contractions. Specifically, we were interested in studying the relationship between the firing rates ofmotor units within and among an agonist-antagonist muscle pair while the muscles performed a variety of contractions designed to require varying degrees of coactivation and reciprocal activation.
METHODS The flexor pollicis longus (FPL) and the exten
sor pollicis longus (EPL) muscles were chosen as the agonist-antagonist pair to be studied for the following reasons: the distal phalanx of the thumb is controlled solely by these two muscles, and the thumb has a relatively large cortical representation, which suggests a relatively high degree of motor control.
Three male subjects (ages 30, 30, and 34) participated in the study. They had no known history of neuromuscular disease, disorders, or injuries.
Force recording The subjects were seated. The forearm was
constrained in a specially designed force measur
527 MOTOR-UNIT CONTROL IN ANTAGONIST MUSCLES
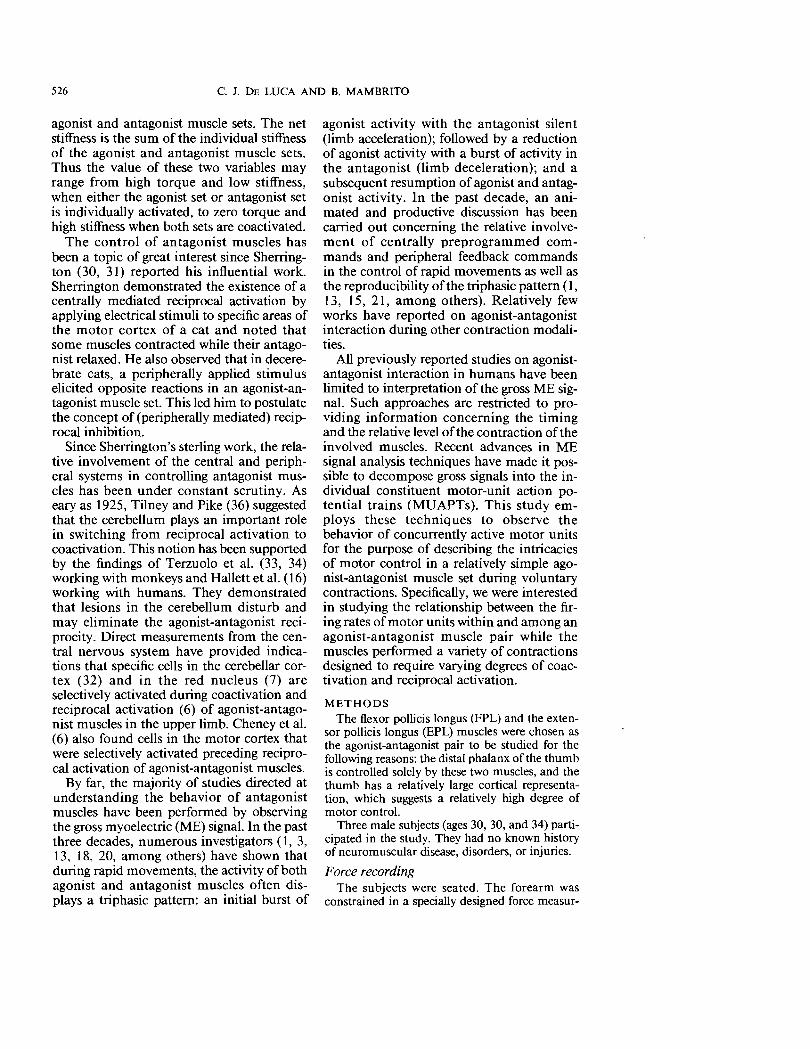
ing apparatus. This device rigidly restrained the thumb phalangeal joint so that only isometric force generation was possible. The apparatus consisted of a plastic cast, which immobilized the wrist, the carpal-metacarpal joints, and the metacarpal-phalangeal joint of the thumb. The interphalangeal joint of the thumb was immobilized by a polyester resin and styrene-monomer cast that was fitted individually to each subject. The cast was connected to a high-stiffness force transducer (3.0 N/JLm), which generated positive or negative voltages proportional to the force applied to it (see Fig. 1). The output of the force transducer controlled the vertical position of either a horizontal line or a point moving across the screen of an oscilloscope. A second line or point was simultaneously displayed on the oscilloscope. The vertical position of the latter line or point was controlled by a computer. Thus the subject could isometrically force track various type(s) of computer-generated waveforms. The force transducer output was recorded on an FM tape recorder.
The output of the force transducer was normalized using the output value obtained when the subject exerted the maximal voluntary contrac
tion (MVC) and was acquired at the beginning of the experiment session before electrode insertion. Two MVC values had to be considered: one for flexion, the other for extension. In each case, the value of the MVC was chosen as the largest of three consecutive attempts spaced 5 min apart.
Four types of contractions were utilized: 1) voluntary exerted cocontraction in which the subject was required voluntarily to stiffen the thumb interphalangeal joint; i.e., to cocontract the FPL and EPL without exerting any net torque output; 2) force-varying isometric contractions with a force rate of 15% MVC;s, reaching either 30% MVC (4 s in flexion and 4 s in extension) or 60% MVC (8 s in flexion and 8 s in extension). Two types of tracking modes were utilized with the triangular waveforms. In the first type, the subject saw two vertically moving horizontal lines on the oscilloscope: one line controlled by the force transducer output and the other controlled by the computer. During a contraction, the subject was required to match the two lines continuously. This mode will be referred to as instantaneous tracking. In the second type of tracking mode, a triangular waveform was predrawn on the storage
FIG. I. Arrangement of restraining and force measuring apparatus. Note the needle insertion trajectory into the flexor pollicis longus and extensor pollicis longus muscles.
528 C. J. DE LUCA AND B. MAMBRITO
oscilloscope. The subject was then asked to draw over the predrawn waveform using the output of the force transducer. In this second mode, the subject could continuously preview the complete waveform to be tracked; hence, this mode will be referred to as preview tracking; 3) isometric forcetracking of a waveform, whose amplitude was a random variable with zero mean and a range of 15% MVC in flexion and 15%MVC in extension. In this contraction mode, the tracking task had two levels of difficulty. One level was considered to be relatively easy. In this case, the random waveform had a mean frequency of 0.43 Hz and a median frequency of 0.37 Hz. The other level was considered to be of medium difficulty. In this case, the random waveform had a mean frequency of 0.86 Hz and a median frequency of 0.74 Hz. The degree of difficulty of these two tracking tasks was established by the subjective opinions of the three subjects. The validity of this designation is substantiated by the work of Doubler and Childress (10), who found that visual tracking of force-generated trajectories had an upper boundary of -I Hz.
ME signal acquisition and processing A quadrifilar needle electrode was used to de
tect three independent channels of ME signals
a:: ow Cfl-.J ZU WCfl f-::::> x::E w
-1 W -.J U Cfl ::::> ::E
a:: o x w -.J u,
I o 2 4 6
TIME IN
from each ofthe two muscles. The multiple channel detection increased the discrimination power among different motor-unit action potentials (MUAPs). The six detected ME signals (3 per muscle) were then band-pass filtered with lowand high-frequency 3-dB points set at I and 10 kHz. The procedure of setting the lower 3-dB
. point at I kHz, rather than at a lower frequency, consistently reduced the amplitude of the slower rise time MUAP waveforms produced by muscle fibers that are distant from the detection site. This procedure facilitates discrimination of action potentials froni different motor units.
During the electrode insertion, the path of the electrode to the target muscle was monitored using functional tests. For the flexor muscle, the following procedure was executed: 1) the electrode was inserted until ME signal activity was observed with weak wrist extension; 2) while the subject maintained wrist extension, insertion of the electrode continued until the ME signal activity decreased or disappeared; 3) after the muscular fascia was pierced between extensor carpi radialis brevis and pronator teres, we verified that ME signal activity was present only on mild forearm pronation; and 4) insertion was continued until ME signal activity was observed only in correspondence with mild flexion effort of the thumb distal phalanx. A similar procedure was used for
5
z 3
0
Cfl Z W f-x
U > ::E
w ~ 0
0-- z
w u a::z 00 u,
5 x W -.J u,
108 SECONDS
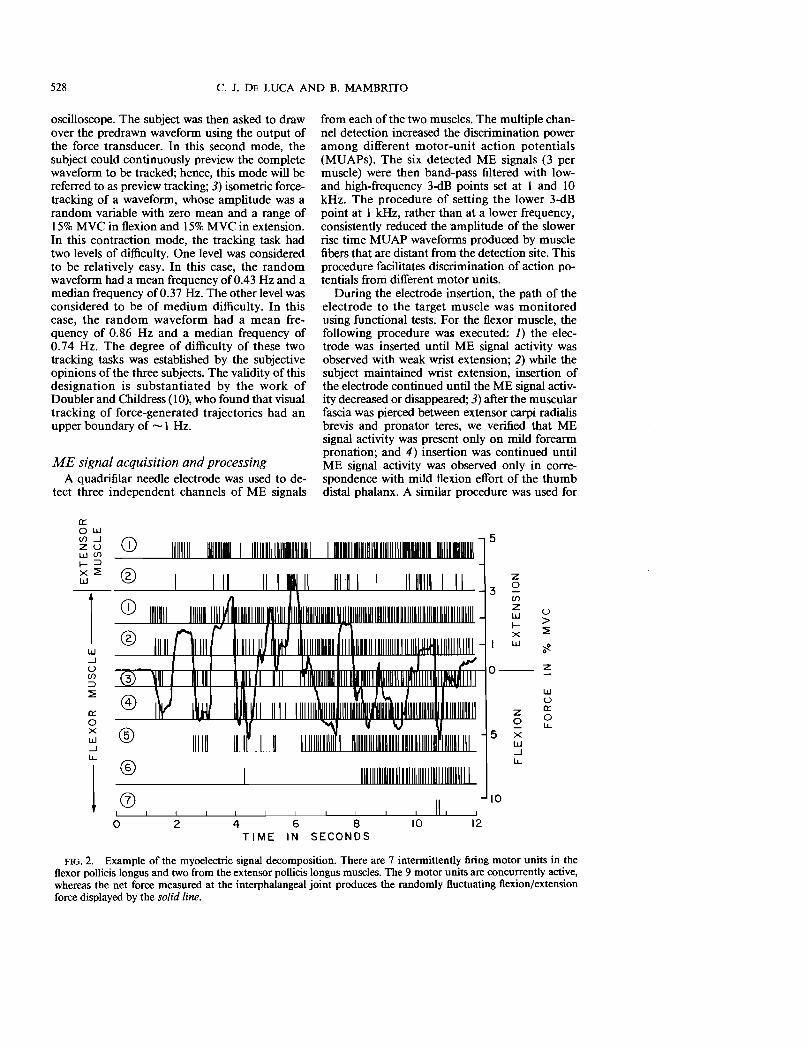
FIG. 2. Example of the myoelectric signal decomposition. There are 7 intermittently firing motor units in the flexor pollicis longus and two from the extensor pollicis longus muscles. The 9 motor units are concurrently active, whereas the net force measured at the interphalangeal joint produces the randomly fluctuating flexion/extension force displayed by the solid line.
10
529 MOTOR-UNIT CONTROL IN ANTAGONIST MUSCLES
the extensor muscle. As a precautionary measure, electrical stimulation through the recording electrode was used to verify the proper electrode location.
The ME signals from the triangular force-varying contractions were sampled, time compressed, and transferred to digital storage. The ME signal records were then separated into the constituent MUAPTs by a technique known as decomposition. Decomposition algorithms use motor-unit firing statistics (estimated on-line during the decomposition operation) and MUAP waveform shapes (in a three-dimensional representation obtained from the 3 channels of ME signals). The statistical parameters of the discharge times are recursively estimated, and the templates for each motor unit in each channel are updated at each MU AP detection. Special algorithms designed to resolve superpositions, such as those that may occur during synchronous discharges, are included. This latter set of algorithms attempts to identify a complex waveform (in 3 dimensions) by creating the waveform by superimposing the templates of all identified MUAPs in three dimensions. This technique has been tested for accuracy by decomposing the simultaneously recorded activities from two needle electrodes inserted into a muscle at different sites. Whenever a motor unit was present in the records from both needle electrodes, a I00% agreement between the firings was obtained. Only those MUAPTs that could be decomposed with absolute confidence (I 00% accuracy) have been presented in RESULTS. Refer to Mambrito and De Luca (28, 29) for details. A formal presentation of the algorithm used to decompose the ME signal can be found in LeFever and De Luca (24) and LeFever, Xenakis, and De Luca (25).
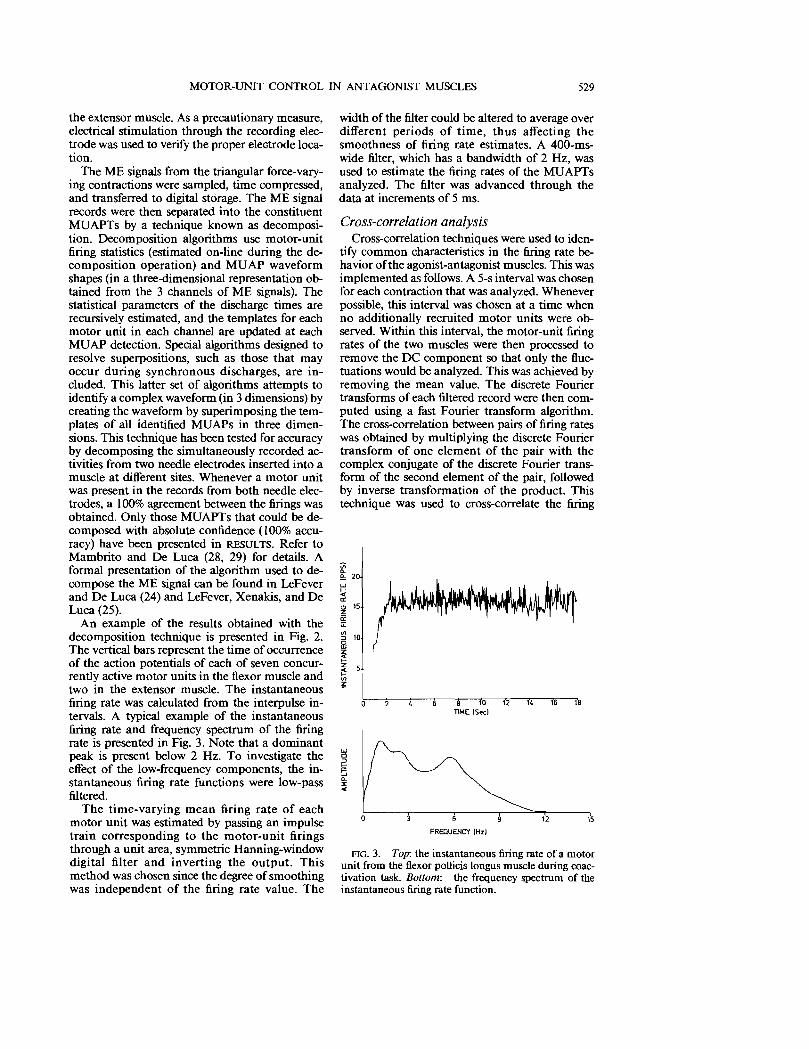
An example of the results obtained with the decomposition technique is presented in Fig. 2. The vertical bars represent the time of occurrence of the action potentials of each of seven concurrently active motor units in the flexor muscle and two in the extensor muscle. The instantaneous firing rate was calculated from the interpulse intervals. A typical example of the instantaneous firing rate and frequency spectrum of the firing rate is presented in Fig. 3. Note that a dominant peak is present below 2 Hz. To investigate the effect of the low-frequency components, the instantaneous firing rate functions were low-pass filtered.
The time-varying mean firing rate of each motor unit was estimated by passing an impulse train corresponding to the motor-unit firings through a unit area, symmetric Hanning-window digital filter and inverting the output. This method was chosen since the degree of smoothing was independent of the firing rate value. The
width ofthe filter could be altered to average over different periods of time, thus affecting the smoothness of firing rate estimates. A 400-mswide filter, which has a bandwidth of 2 Hz, was used to estimate the firing rates of the MUAPTs analyzed. The filter was advanced through the data at increments of 5 ms.
Cross-correlation analysis Cross-correlation techniques were used to iden
tify common characteristics in the firing rate behavior ofthe agonist-antagonist muscles. This was implemented as follows. A 5-s interval was chosen for each contraction that was analyzed. Whenever possible, this interval was chosen at a time when no additionally recruited motor units were observed. Within this interval, the motor-unit firing rates of the two muscles were then processed to remove the DC component so that only the fluctuations would be analyzed. This was achieved by removing the mean value. The discrete Fourier transforms of each filtered record were then computed using a fast Fourier transform algorithm. The cross-correlation between pairs of firing rates was obtained by multiplying the discrete Fourier transform of one element of the pair with the complex conjugate of the discrete Fourier transform of the second element of the pair, followed by inverse transformation of the product. This technique was used to cross-correlate the firing
Vi ~ 20 Ul I-c
'"o 15
"' z
u: VI ::J 10 a ?l I
~ 5 VI
~
10 12 14 16 18 TIMEISeci
FREQUENCY IHzl
FlG. 3. Top: the instantaneous firing rate of a motor unit from the flexor pollicis longus muscle during coactivation task. Bottom: the frequency spectrum of the instantaneous firing rate function.
530 C. J. DE LUCA AND B. MAMBRITO
rate of motor units within a muscle and among two muscles. It was also used to cross-correlate the firing rates of motor units with the net force output of the interphalangeal joint. The cross-correlation functions had a resolution of 5 ms, determined by the resolution of the firing rates.
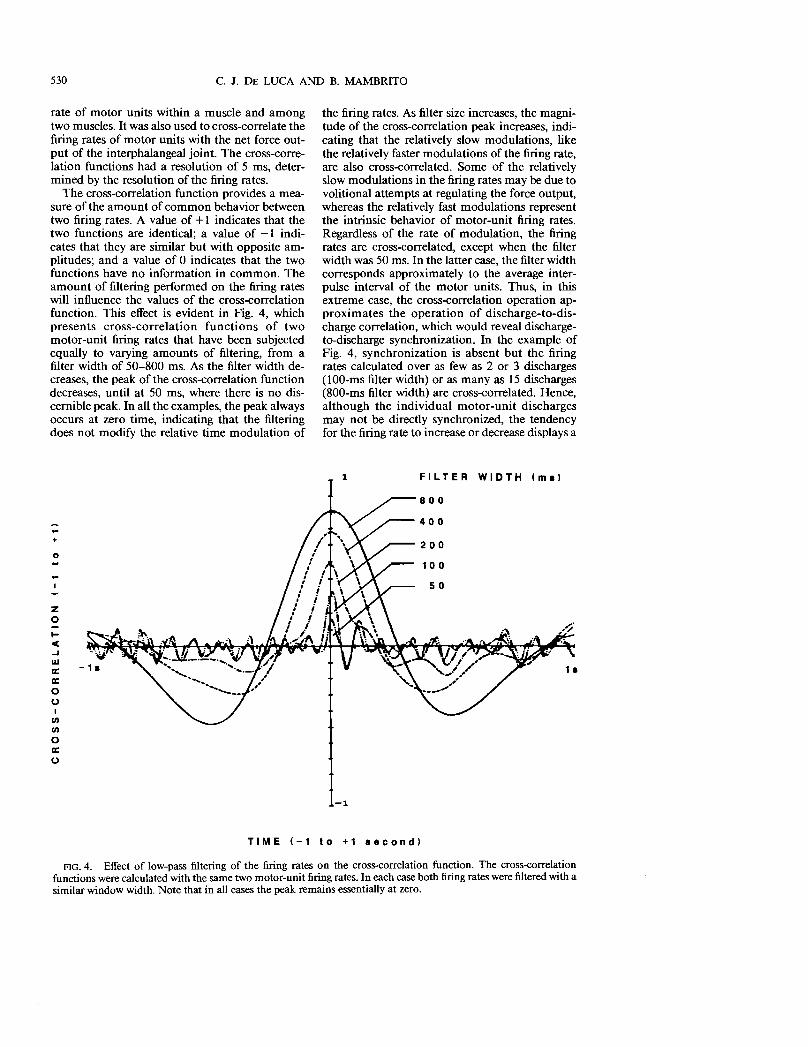
The cross-correlation function provides a measure of the amount of common behavior between two firing rates. A value of + I indicates that the two functions are identical; a value of - I indicates that they are similar but with opposite amplitudes; and a value of 0 indicates that the two functions have no information in common. The amount of filtering performed on the firing rates will influence the values of the cross-correlation function. This effect is evident in Fig. 4, which presents cross-correlation functions of two motor-unit firing rates that have been subjected equally to varying amounts of filtering, from a filter width of 50-800 ms. As the filter width decreases, the peak of the cross-correlation function decreases, until at 50 ms, where there is no discernible peak. In all the examples, the peak always occurs at zero time, indicating that the filtering does not modify the relative time modulation of
+
o
z o ~
C -I W IE: IE: o o I
III III
o IE: o
TIME (-1
FlG. 4. Effect of low-pass filtering of the firing rates
the firing rates. As filter size increases, the magnitude of the cross-correlation peak increases, indicating that the relatively slow modulations, like the relatively faster modulations of the firing rate, are also cross-correlated. Some of the relatively slow modulations in the firing rates may be due to volitional attempts at regulating the force output, whereas the relatively fast modulations represent the intrinsic behavior of motor-unit firing rates. Regardless of the rate of modulation, the firing rates are cross-correlated, except when the filter width was 50 ms. In the latter case, the filter width corresponds approximately to the average interpulse interval of the motor units. Thus, in this extreme case, the cross-correlation operation approximates the operation of discharge-to-discharge correlation, which would reveal dischargeto-discharge synchronization. In the example of Fig. 4, synchronization is absent but the firing rates calculated over as few as 2 or 3 discharges (IOO-ms filter width) or as many as 15 discharges (800-ms filter width) are cross-correlated. Hence, although the individual motor-unit discharges may not be directly synchronized, the tendency for the firing rate to increase or decrease displays a
1 FILTER WIDTH t m e )
-1
to +1 s e c e n d )
on the cross-correlation function. The cross-correlation functions were calculated with the same two motor-unit firing rates. In each case both firing rates were filtered with a similar window width. Note that in all cases the peak remains essentially at zero.
531
30
MOTOR-UNIT CONTROL IN ANTAGONIST MUSCLES
behavior that is similar in all currently active motor units.
RESULTS
Voluntary exerted cocontractions. An example of the firing rate and force
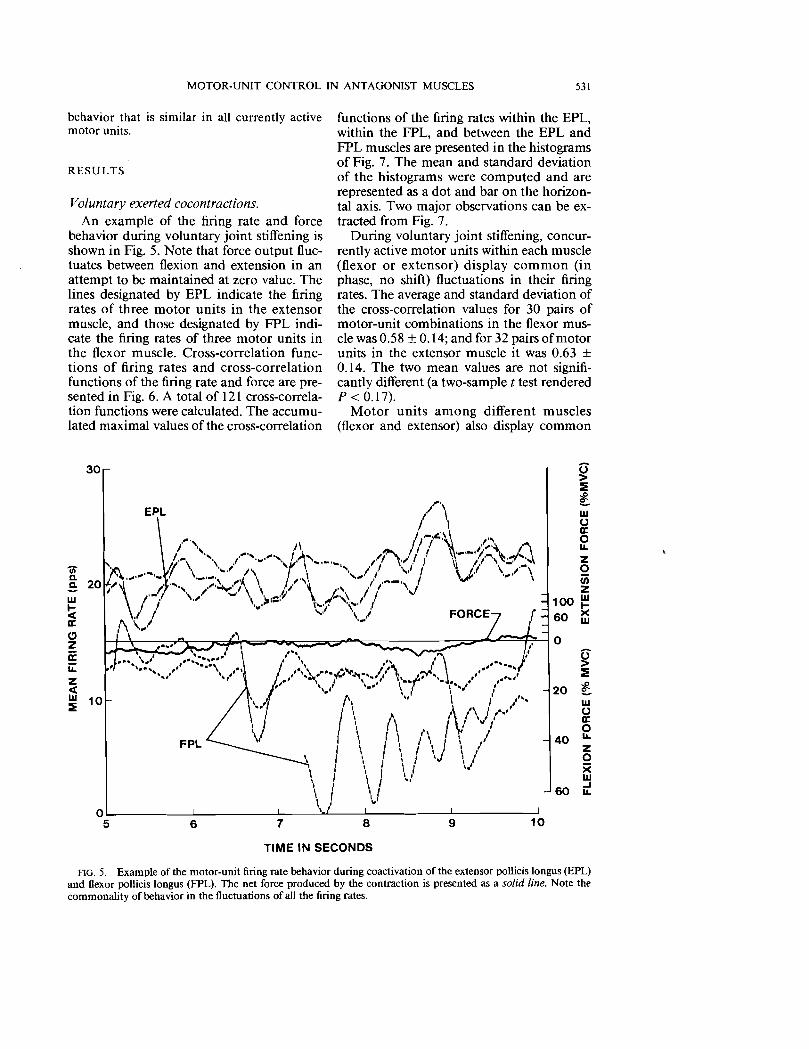
behavior during voluntary joint stiffening is shown in Fig. 5. Note that force output fluctuates between flexion and extension in an attempt to be maintained at zero value. The lines designated by EPL indicate the firing rates of three motor units in the extensor muscle, and those designated by FPL indicate the firing rates of three motor units in the flexor muscle. Cross-correlation functions of firing rates and cross-correlation functions of the firing rate and force are presented in Fig. 6. A total of 121 cross-correlation functions were calculated. The accumulated maximal values of the cross-correlation
EPL
.../ \'" ... II."
functions of the firing rates within the EPL, within the FPL, and between the EPL and FPL muscles are presented in the histograms of Fig. 7. The mean and standard deviation of the histograms were computed and are represented as a dot and bar on the horizontal axis. Two major observations can be extracted from Fig. 7.
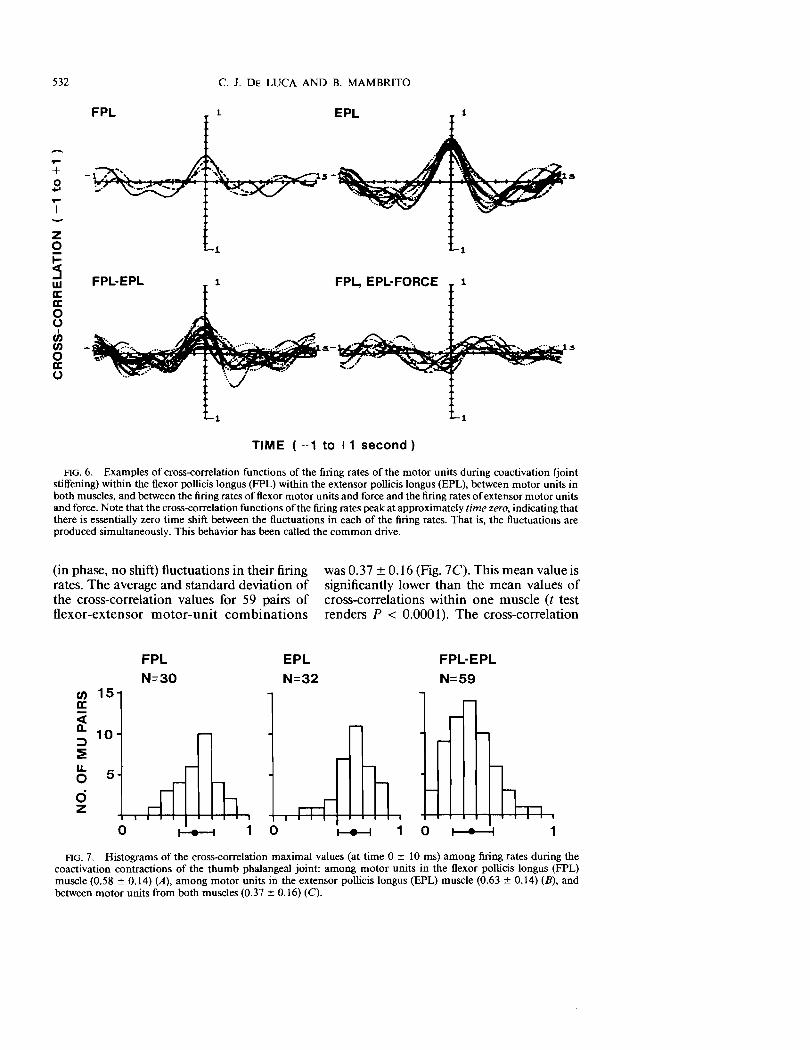
During voluntary joint stiffening, concurrently active motor units within each muscle (flexor or extensor) display common (in phase, no shift) fluctuations in their firing rates. The average and standard deviation of the cross-correlation values for 30 pairs of motor-unit combinations in the flexor muscle was 0.58 ± 0.14; and for 32 pairs ofmotor units in the extensor muscle it was 0.63 ± 0.14. The two mean values are not significantly different (a two-sample t test rendered P < 0.17).
Motor units among different muscles (flexor and extensor) also display common
It·..\ Cii ~ ._. 1 \ c. 40 .........e: 20 /\i ~t' ....,. w ,.-/ '.~I- I 1 oct .I I a: ,,\\/.. ~ Z a: u.. Z oct w 10::iE
0L.....- ...L- --.L...._----'aL-_---'- ----'- --:-'
FPL
, ~
"\ r ....·...·..·....·..rl.~\ <;_..... /1'1 I'~'.I l Ii I~'-\ ~.:::' <,\ .....' 1\ " -,, /', \./ I \ 1/ \, /-\
/ ...\
11'i"'\~ ,'"r-; /,, \\....._./.....~ .j..'\
\.~ \ I "." .. . I / ·wv<,. \ ,/ \' r>. .' /-'-'\,1
.... \ :>I=:~ ",""','. / ,I .... \..... . \,"' l ...../ \ .../
5 6 7 8
TIME IN SECONDS
v" ..
100 60 t<FORCE ( wI
0
~ ::iE
20 i w oa: o
40 u.. Z o X w
60 it
9 10
0> ::iE i w 0a: 0 u.. Z 0 en z w
FIG. 5. Example of the motor-unit firing rate behavior during coactivation of the extensor pollicis longus (EPL) and flexor pollicis longus (FPL). The net force produced by the contraction is presented as a solid line. Note the commonality of behavior in the fluctuations of all the firing rates.
532 C. J. DE LUCA AND B. MAMBRITO
-+ o +'-I z o 1 1
~ w a: a:
FPL·EPL 1 FPL., EPL·FORCE 1
o (J
I en en o a: (J
1 1
TIME (-1 to +1 second)
FIG. 6. Examples of cross-correlation functions of the firing rates of the motor units during coactivation (joint stiffening) within the flexor pollicis longus (FPL) within the extensor pollicis longus (EPL), between motor units in both muscles, and between the firing rates of flexor motor units and force and the firing rates of extensor motor units and force. Note that the cross-correlation functions of the firing rates peak at approximately time zero, indicating that there is essentially zero time shift between the fluctuations in each of the firing rates. That is, the fluctuations are produced simultaneously. This behavior has been called the common drive.
(in phase, no shift) fluctuations in their firing was 0.37 ± 0.16 (Fig. 7C). This mean value is rates. The average and standard deviation of significantly lower than the mean values of the cross-correlation values for 59 pairs of cross-correlations within one muscle (t test flexor-extensor motor-unit combinations renders P < 0.0001). The cross-correlation
FPL EPL FPL·EPL N=30 N=32 N=59
rJ) 15 D:
~ 10
~
~ u,
5o o z
o 1
-r-
---
- n-., 0 I • I 1
FIG. 7. Histograms of the cross-correlation maximal values (at time 0 ± 10 ms) among firing rates during the coactivation contractions of the thumb phalangeal joint: among motor units in the flexor pollicis longus (FPL) muscle (0.58 ± 0.14) (A), among motor units in the extensor pollicis longus (EPL) muscle (0.63 ± 0.14) (B), and between motor units from both muscles (0.37 ± 0.16) (C).
533
40
30
20
10
0
til
0
0- 30
III
l-
C
II:
C1 Z
10 II:
II.
0
30
20
MOTOR-UNIT CONTROL IN ANTAGONIST MUSCLES
10 J I I . /I \F1 \4'3 E2F1-j"
F2 O
A
.",)
I"~ I , • I
I I I
... /,",
..' '. I .... ,...... i.
;; i i \E
B
(oJ:.t.
!.
:V IiI' . . :
,I I I'
,I I'
I I , , ,
" , I I, II " f'\J1 r ,., ,I,"' :,E1 "F1~\J \',
I
F2 "\:
C
T f·
" II '
,•I " •• 1 1, n\'\
I i~2\
z 2 en z60
40 IIIl o )(20 > III
0 :I 'It z
Q20 )( III...
40 II.
60
Z 2 en z60 III
40 l
20 >U
III )(
0 :I # z
Q20 )( III...
40 II.
60
z 0 iii
60 III z
40 l )(
20 ~ III o :E ~ Z
0 20 )(
III... 40 II.
60
2 3 4 5 6 7 8 9 10 TIME IN SECONDS
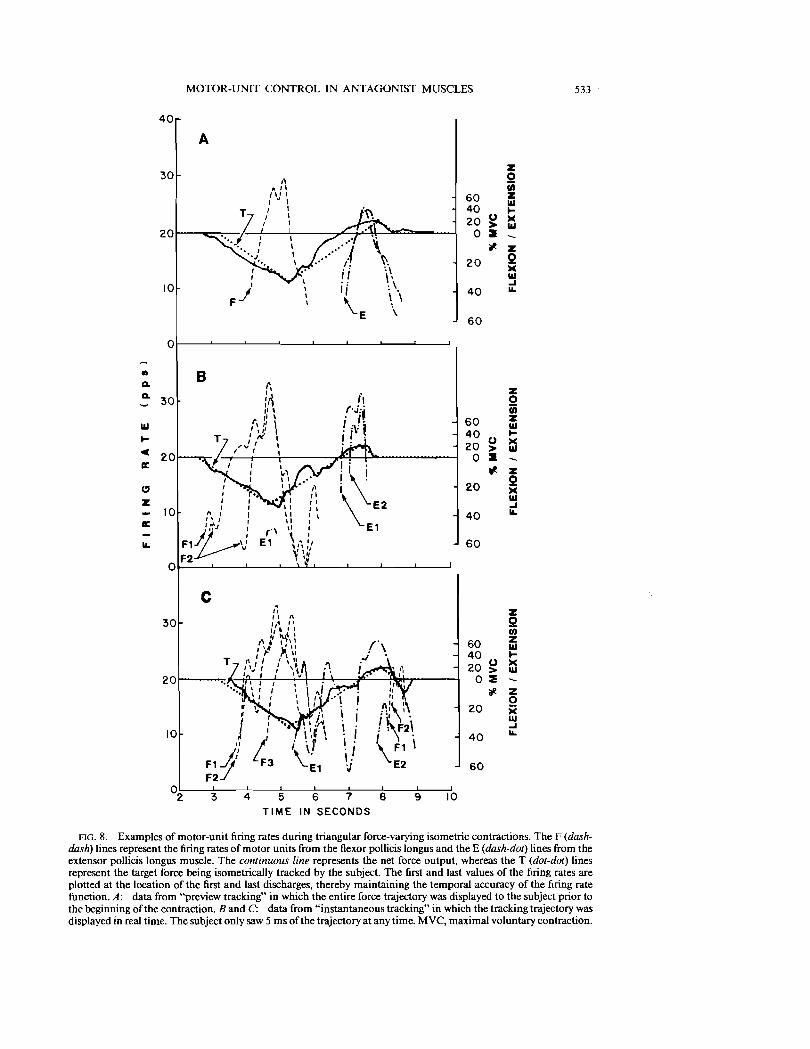
AG. 8. Examples of motor-unit firing rates during triangular force-varying isometric contractions. The F (dashdash) lines represent the firing rates of motor units from the flexor pollicis longus and the E (dash-dot) lines from the extensor pollicis longus muscle. The continuous line represents the net force output, whereas the T (dot-dot) lines represent the target force being isometrically tracked by the subject. The first and last values of the firing rates are plotted at the location of the first and last discharges, thereby maintaining the temporal accuracy of the firing rate function. A: data from "preview tracking" in which the entire force trajectory was displayed to the subject prior to the beginning of the contraction. Band C: data from "instantaneous tracking" in which the tracking trajectory was displayed in real time. The subject only saw 5 ms of the trajectory at any time. MVC, maximal voluntary contraction.
534
40
C. J. DE LUCA AND B. MAMBRITO
between the firing rates of either muscle and the net force is virtually nonexistent as shown in Fig. 6. This is due to the near zero value of the net force and the cancellation effect of the opposing forces on the force fluctuations emanating from each muscle.
Force-varying isometric contractions Thirteen contractions were analyzed: six
with preview tracking and seven with instantaneous tracking. A total of 27 MUAPTs were extracted from the decomposed ME signals. The firing rate behavior is presented in Fig. 8, A-C. The firing rates of the flexor motor units are shown as dash-dash (or F) lines and those of the extensor as dash-dot (or E) lines. The force transducer output is represented by a continuous line and the tracked waveform by a dot-dot (or T) line. Flexion force has a negative excursion, whereas extension force has a positive excursion. Although the three examples represent
t,EPL , \ l
"\
I l I \I ,I I ! \I ,i I30 I i i' \\i i \"iii' II i "Q.
Q. i I II
i, Iw I "
i I Il-I \« ilI: !
CJ 20 i z I i lI:
iii: ~ I z ~"'I i
iI j ii« J I,,:E
W I i I Ii I ' , I10
i\ I' , I i\.i/PL \ I , ,
I
~.I
1''- ,i-,I I I l '.' ( " I I \ I \
I I, " , I \ I .. , / 'I ..o ' , \
4 5 6
data from the same experimental session and were recorded at the same electrode position, there is no guarantee that the same motor units were detected in contractions A, B, and C. Nevertheless, these three examples illustrate the typical agonist-antagonist behavior that was observed during triangular forcevarying contractions.
Independent of antagonist muscle activity, the motor units in the agonist muscle displayed an ordered recruitment and derecruitment scheme in all the records that were analyzed. During force-increasing and decreasing contractions, motor units are derecruited in reverse order of their recruitment. The recruitment order was also maintained among extensor motor units recruited during flexion and vice versa. These data agree with the recruitment scheme observed in other human muscles such as the first dorsal interosseous muscle and deltoid muscle (8, 12) and the tibialis anterior muscle (4).
U 80 >
:E :£2.
"i\I I I I, I I I 'I , i I i I I
I I \
I .... \ ..
60
40
20
0
w U lI: 0 II..
z Q Ul z w I-x w
U >:E
10 :oR2.w oa: 0
20 II..
"....,,'\ I ,
z 0 X
I/'' " \
\, 30
W ..I II..
7 8
TIME IN SECONDS
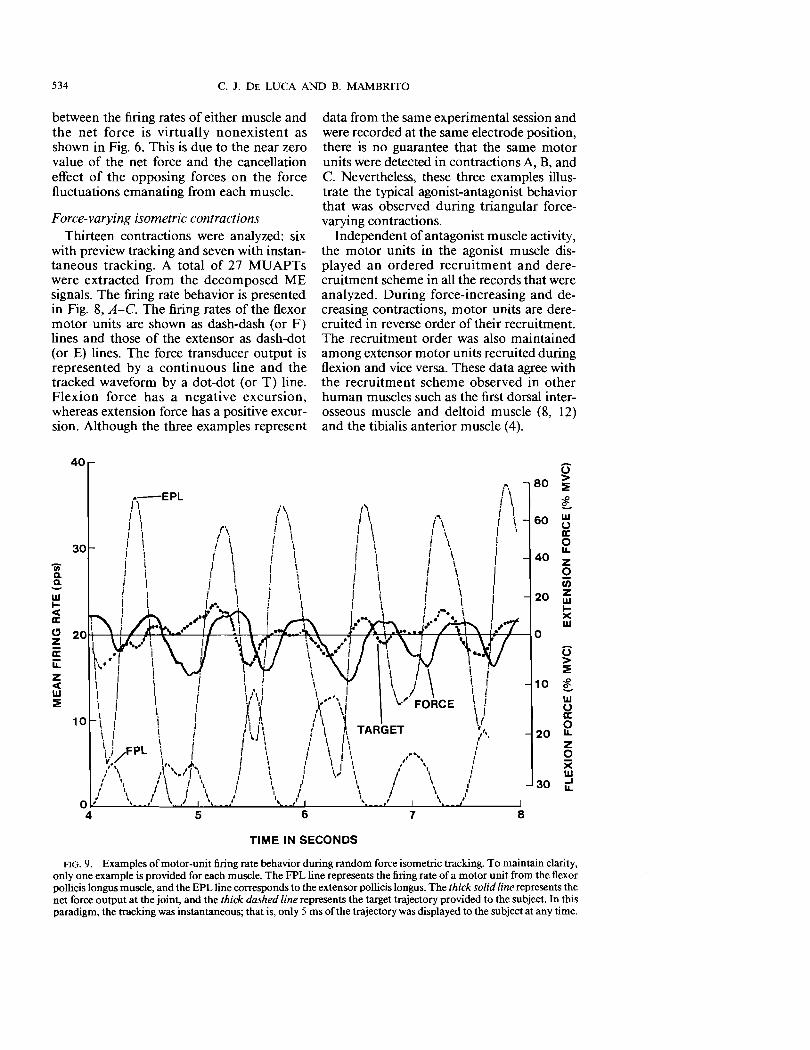
FlG.9. Examples of motor-unit firing rate behavior during random force isometric tracking. To maintain clarity, only one example is provided for each muscle. The FPL line represents the firing rate of a motor unit from the flexor pollicis longus muscle, and the EPL line corresponds to the extensor pollicis longus. The thick solid line represents the net force output at the joint, and the thick dashed line represents the target trajectory provided to the subject. In this paradigm, the tracking was instantaneous; that is, only 5 ms of the trajectory was displayed to the subject at any time.
535 MOTOR-UNIT CONTROL IN ANT AGONIST MUSCLES
Figure 8A presents the data from a preview tracking contraction. Note how the turning points at the apexes (in flexion and extension) are executed accurately with the subject producing the appropriate force, which is due presumably to prior knowledge concerning the target trajectory. The overall force record was smoother than that produced when the force target was not predrawn. Moreover, this observation was true for all the records. Figure 8, Band C, presents data from instantaneous tracking contractions. In this case, compensation for variation in the target and trajectory could not be made in advance. Instead, any mismatch between the target and force trajectories was compensated after the error occurred. Antagonist muscle intervention was observed often (7 out of 8 contractions) and coincided with error compensation.
Figure 8C also shows another aspect of firing rate behavior that is consistent with observations previously made in the deltoid and first dorsal interosseous muscles (8). Prior to force reversal, at - 5 s, the firing rates of motor units Fl, F2, and F3 display an ordered reversal, i.e., F1 reverses direction before F2, which in tum reverses direction before F3. In other words, motor units recruited first (small motor units that achieve higher firing rates) reverse their firing rates before motor units which are recruited later (larger motor units that achieve slower firing rates).
Random-force tracking A total of 10 contractions were analyzed:
six consisting of the relatively simpler tracking tasks (median frequency = 0.37 Hz) and four of the relatively more difficult tracking
FPL EPL 1 1
,.... + o... 1 z o
1 1~ w FPL-EPL FPL,EPL·FORCEa: a: 1 1 o u
~ oa: u
1 1
TIME (-1 to+1 second)
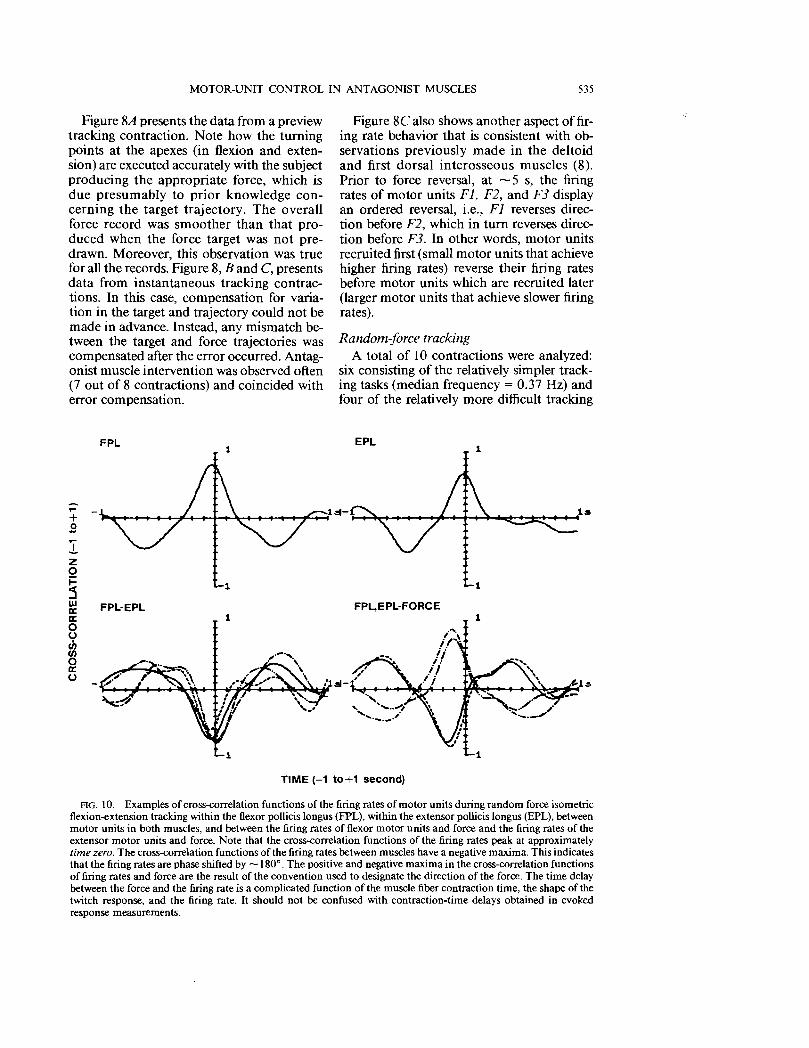
FIG. 10. Examples of cross-correlation functions of the firing rates of motor units during random force isometric flexion-extension tracking within the flexor pollicis longus (FPL), within the extensor pollicis longus (EPL), between motor units in both muscles, and between the firing rates of flexor motor units and force and the firing rates of the extensor motor units and force. Note that the cross-correlation functions of the firing rates peak at approximately time zero. The cross-correlation functions of the firing rates between muscles have a negative maxima. This indicates that the firing rates are phase shifted by -180°. The positive and negative maxima in the cross-correlation functions of firing rates and force are the result of the convention used to designate the direction of the force. The time delay between the force and the firing rate is a complicated function of the muscle fiber contraction time, the shape of the twitch response, and the firing rate. It should not be confused with contraction-time delays obtained in evoked response measurements.
536 C. J. DE LUCA AND B. MAMBRITO
tasks (median frequency = 0.74 Hz). Figure 9 shows an example of firing rate behavior. The dashed line represents the firing rate of a flexor motor unit and the dash-dot line the extensor motor unit. The heavy continuous line represents the net force output, and the heavy dashed line represents the trajectory. Note that for the sake ofvisual simplicity, the firing rate of only one motor unit from each muscle is shown.
Figure 10 provides an example of the computed cross-correlation functions obtained from the random-force tracking experiments. They represent cross-correlation between pairs of motor-unit firing rates in the flexor muscles, cross-correlation between pairs of motor-unit firing rates in the extensor muscle, cross-correlation among pairs of motor-unit firing rates of the flexor and the extensor muscle, and cross-correlation between force and the firing rates of flexor motor units and between force and firing rates of extensor motor units. In the crosscorrelation functions of the firing rates, the peak always occurred within ± 10 ms ofzero
time shift. When the maximal cross-correlation value was positive, the two firing rates were in phase with essentially zero time shift. When the value was negative, as in the case of the cross-correlation between the motor units of the two muscles, the two firing rates were 1800 out of phase. In the case of the cross-correlation between force and the firing rates of the flexor muscle, the value was negative because of the force recording arrangements. Force during extension increased in the positive direction.
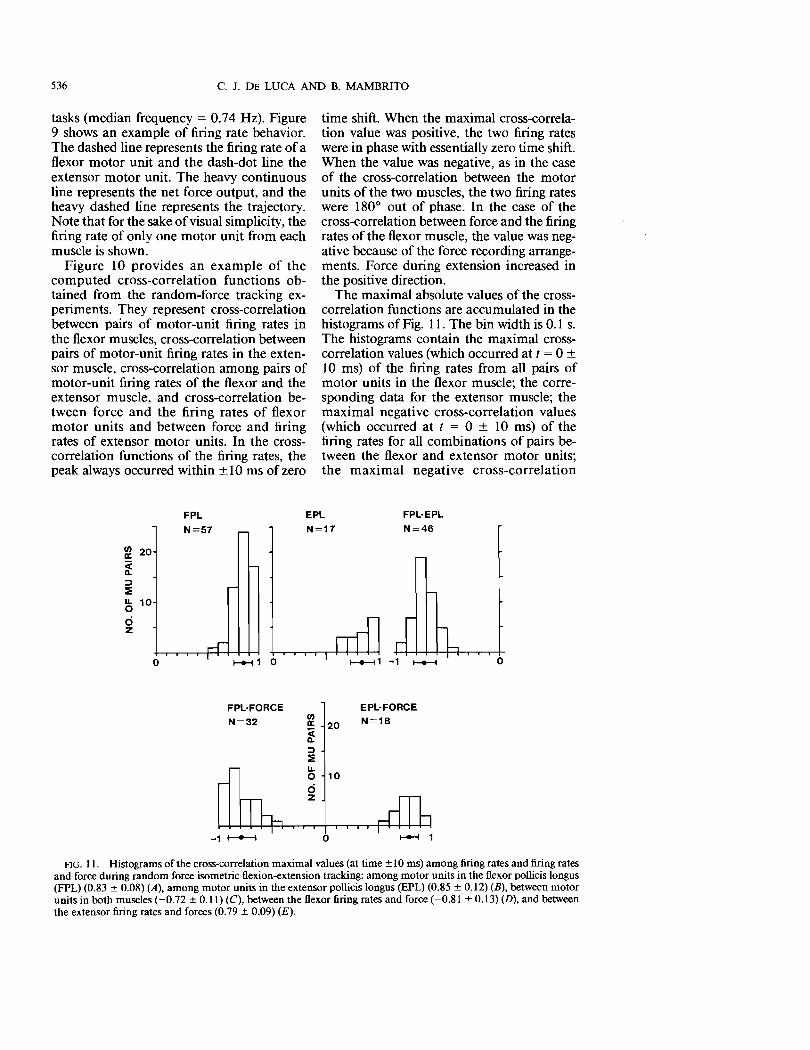
The maximal absolute values of the crosscorrelation functions are accumulated in the histograms of Fig. 11. The bin width is 0.1 s. The histograms contain the maximal crosscorrelation values (which occurred at t = 0 ± 10 ms) of the firing rates from all pairs of motor units in the flexor muscle; the corresponding data for the extensor muscle; the maximal negative cross-correlation values (which occurred at t = 0 ± 10 ms) of the firing rates for all combinations of pairs between the flexor and extensor motor units; the maximal negative cross-correlation
FPL EPL FPL-EPL
N=57
I
N=17 N=46
12 20
~ => ==l5 10
d z
o t-+-l 1
EPL-FORCEFPL·FORCE C1l N=18N=32 II: 20
~ => ==u. o 10 d z
o
FlG. II. Histograms of the cross-correlation maximal values (at time ± 10 ms) among firing rates and firing rates and force during random force isometric flexion-extension tracking: among motor units in the flexor pollicis longus (FPL) (0.83 ± 0.08) (A), among motor units in the extensor pollicis longus (EPL) (0.85 ± 0.12) (B), between motor units in both muscles (-0.72 ± 0.11) (C), between the flexor firing rates and force (-0.81 ± 0.13) (D), and between the extensor firing rates and forces (0.79 ± 0.09) (E).
o0
MOTOR-UNIT CONTROL IN ANTAGONIST MUSCLES 537
values (which occurred at 100-200 ms) of the flexor motor-unit firing rates and the force output; and the corresponding positive values for the extensor muscle. The mean and standard deviation of the histograms are also presented. The following observations may be extracted from the histograms of Fig. n.
During random-force tracking, concurrently active motor units in each muscle (flexor or extensor) display a considerable amount of common fluctuation in their firing rates. The average and standard deviation of the cross-correlation values for 57 pairs of motor units in the flexor muscle and 17 pairs of motor units in the extensor muscle was 0.83 ± 0.08 and 0.85 ± 0.12, respectively. The two mean values are not significantly different (P < 0.42).
Motor units of different muscles (flexor and extensor) display 180 0 out-of-phase cross-correlation, thus indicating that as the firing rates of the motor units of one muscle are increasing, those of the antagonist muscle are decreasing in a corresponding amount and vice versa. The average cross-correlation value for 46 pairs of simultaneously active motor units was -0.72 ± 0.11. This value is statistically significantly different (P < 0.0001) from the values of the cross-correlation of the motor-unit firing rates within each of the two muscles.
In both muscles, the fluctuations in the motor-unit firing rates are highly correlated to the fluctuation in the corresponding force output: 0.81 ± 0.13 for the flexor and -0.79 ± 0.09 for the extensor. The peak of the cross-correlation values occurred between 100 and 200 ms. This delay represents the time required to build up the force inside the muscle and to transmit it through the tendons and other tissues to the force transducer.
By comparing the data of the histograms in Figs. 7 and 11, it is apparent that the amount of cross-correlation among the firing rates of motor units in a muscle is greater during random-force trajectory tracking than during voluntary stiffening. This becomes evident when a two-tailed t test is performed on the data. In both the flexor and extensor muscles, the cross-correlation values during random-force trajectory tracking were greater than those obtained during voluntary cocontraction (P < 0.0001).
!>/DISCUSSION
The common drive During the voluntarily coactivated con
tractions of both agonist and antagonist muscles to produce joint stiffening, the mean firing rates of the motor units were substantially correlated with essentially zero time shift. (See Figs. 6 and 7.) This implies that the fluctuations of the mean firing rates evident in Fig. 5 are produced simultaneously. The unison behavior of the mean firing rates of motor units is also visible in the force-varying contractions presented in Fig. 8. This property of the firing rates has been called the common drive. De Luca et al. (9) have described its presence in other muscles. The existence of common drive indicates that the nervous system does not control the firing rates of motor units individually. Instead, it acts on the motoneuron pool in a uniform fashion.
Within one muscle, existence of the common drive could be partially explained by the widespread homogeneous influence of the stretch reflex mechanism, especially the arborization of the la-fibers (26). However, the reciprocal arrangement of the la and Ib fibers with the a-motoneuron fibers of antagonist muscles does not favor formation of zero time shift firing rate fluctuations between the motoneuron pools of the two muscles. [This concept is supported by the data of Fig. 7, which shows that during coactivation, the average value of the maximal cross-correlation of the firing rates of motor units among antagonist muscles is significantly (P < 0.0001) lower (-60%) than that of the motor units in the individual muscles.] Thus it follows that the common drive has a component of central (supra segmental) origin. This interpretation is consistent with the observation of the increasing amount of cross-correlation among the firing rates as they are increasingly low-pass filtered (see Fig. 4) and suggests that common drive is employed in executing the compensatoryforce corrections, which are the filtered force output of the motor-unit twitches.
The notion that the common drive is, at least in part, of central origin is further supported by the observations of Fetz and Cheney (11) and Cheney and Mewes (7). They reported the existence of corticomotoneuronal cells in the premotor cortex and
538 C. J. DE LUCA AND B. MAMBRITO
rubromotoneuronal cells whose activity was noted to be correlated to motor-unit action potentials in groups of simultaneously active muscles in the forearm ofprimates executing coordinated volitional contractions. Their results suggest that individual cortical cells have a connection to motor units in separate muscles. Such an arrangement could be exploited as a mechanism for imparting the common drive.
The existence of common drive among motor units of both muscles during voluntary coactivation indicates that in this mode the FPL and EPL muscles are controlled as if they were one muscle. In this mode, both muscles are performing essentially the same function. It is tempting to suggest that the nervous system is organized to control the motoneuron pools in a manner dependent on the function to be performed by the muscles. The generality of this statement may be limited by the fact that both the FPL and the EPL muscles share the Cg root as their common major source of efferent nerve fibers. Thus the corresponding motoneuron pools would have the anatomical proximity to facilitate interaction.
A model for agonist-antagonist motor-unit control
The behavior of the motor units at force reversals may be explained by considering the existence of reciprocally organized "flex" and "extend" command channels in the central nervous system that act on the motoneuron pool to generate torque on a joint. Let the flex command excite the motoneuron pool of the flexor muscle and inhibit that of the extensor muscle; and let the extend command excite the motoneuron pool of the extensor muscle and inhibit that of the flexor muscle. This reciprocal arrangement of centrally mediated commands finds support in the results of Kasser and Cheney (22) who observed a reciprocal behavior in the myoelectric activity of forearm flexor and extensor muscles of rhesus monkeys when a single corticomotoneuronal cell was discharged during a voluntary contraction. The concept of a command channel is preferable to a designation of a specific neuronal connection because it embodies a variety of possible paths without compromising the purpose. For example, other investigations by Thompson and Fernandez (35) and Asan
uma and Ward (2) have effectively demonstrated that different cortical cells may be involved in eliciting excitation and inhibition to forelimb and hindlimb muscles of the cat.
A force reversal from flexion to extension would be accomplished as follows. The extend channel would be activated while the flex channel is still active. (The continued presence of the flex command is demonstrated by the continued activity of the flexor motor units after the contraction is in the extension mode. See Fig. 8.) This inhibition in the flexor motoneuron pool, which at that instant is the antagonist, would produce the ordered motor-unit firing rate reversals because the earlier recruited motor units are more sensitive to inhibitory inputs (8, 17, 27). The inhibition of the antagonist muscle prior to excitation of the agonist muscle is consistent with numerous observations that have been reported (5, 14, and others). The extend command is simultaneously excitatory to the extensor pool, which at that instant is the agonist. However, the extensor may not necessarily begin to be activated because of the relatively high inhibitory action of the flex command; this behavior is evident to varying degrees in Fig. 8, A-C. The excitation of the flex command would subsequently decrease. The continuously increasing net inhibition to the flexor muscle would cause an ordered derecruitment of motor units, in reverse order of their recruitment. The latter recruited motor units have lower firing rates and thus reach the inactive level earlier when the motoneuron pool receives increased inhibition. The simultaneous and continuously increasing excitation to the extensor muscle would cause an ordered recruitment of motor units to the respective muscles. This complete scenario unfolds in a variety of ways in Fig. 8, A-C. Note that in Fig. 8C the behavior of the motor units during force reversal from extension to flexion may be explained in a parallel fashion.
If the two flex and extend commands are simultaneously activated and if the amount of inhibition is equal to the amount of excitation they exert on the opposite muscle motoneuron pool, it will not be possible to produce a pure cocontraction (zero net force output). In fact, excitation and inhibition will cancel each other. Thus a third coactivation command channel excitatory to both pools is necessary to produce antag
539 MOTOR-UNIT CONTROL IN ANTAGONIST MUSCLES
onist muscle cocontraction. The existence of a coactivation command common to both muscles is supported by the existence of considerable cross-correlation (with essentially zero time shift) among the firing rates of the motor units of the two muscles during voluntary joint stiffening. Red nucleus cells that elicit coactivation excitation to motor units in wrist flexors and extensors of primates have been identified by Cheney and Mewes (7).
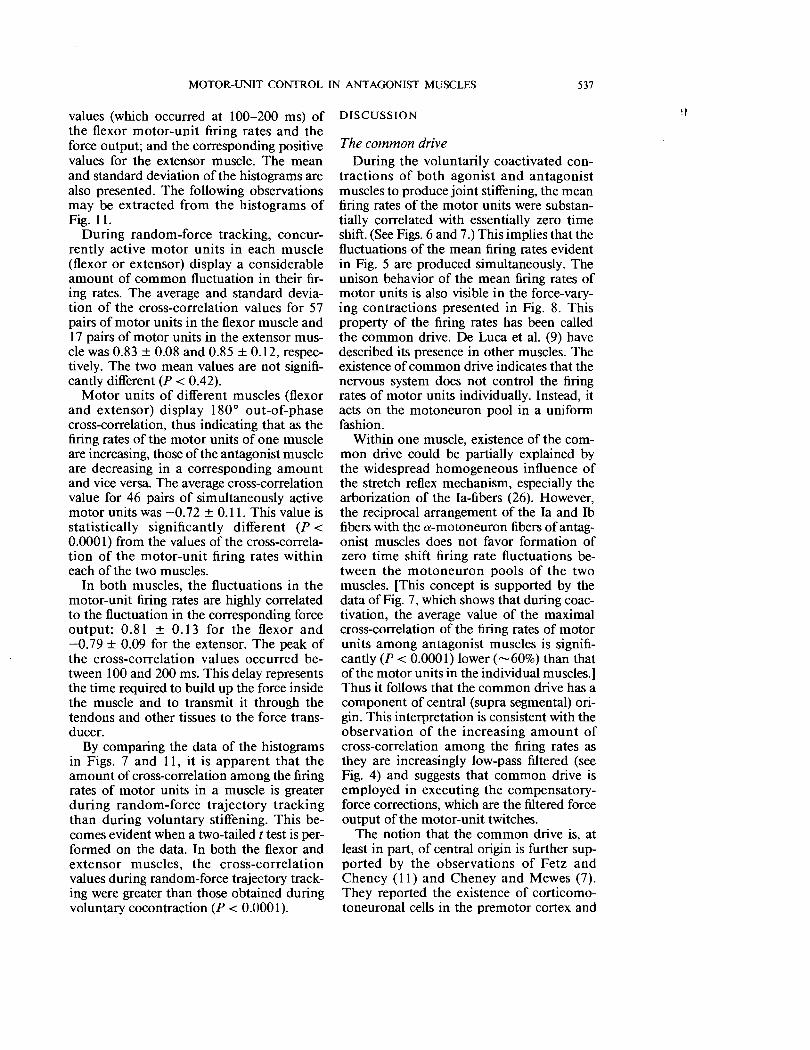
The complete scenario is depicted in the diagram of Fig. 12. In this diagram, the involvement of the stretch reflex and the Renshaw feedback is also presented. Their peripheral and spinal level involvement has the potential of biasing the net excitatory or inhibitory drive to the motoneuron pool. In fact, Hultborn et al. (19) have suggested that the competitive influence of the Ia neurons and the Renshaw collaterals may tilt the resulting activation between coactivation and reciprocal activation. If the intervention of
R
FLEXOR MUSCLE
Renshaw recurrent inhibition is considered to play an active role in gating the command channels, it is possible to suggest other control schemata. However, such explanations would require more detailed knowledge of the Renshaw system than is currently available.
Control strategies during tracking tasks Throughout all the contractions that were
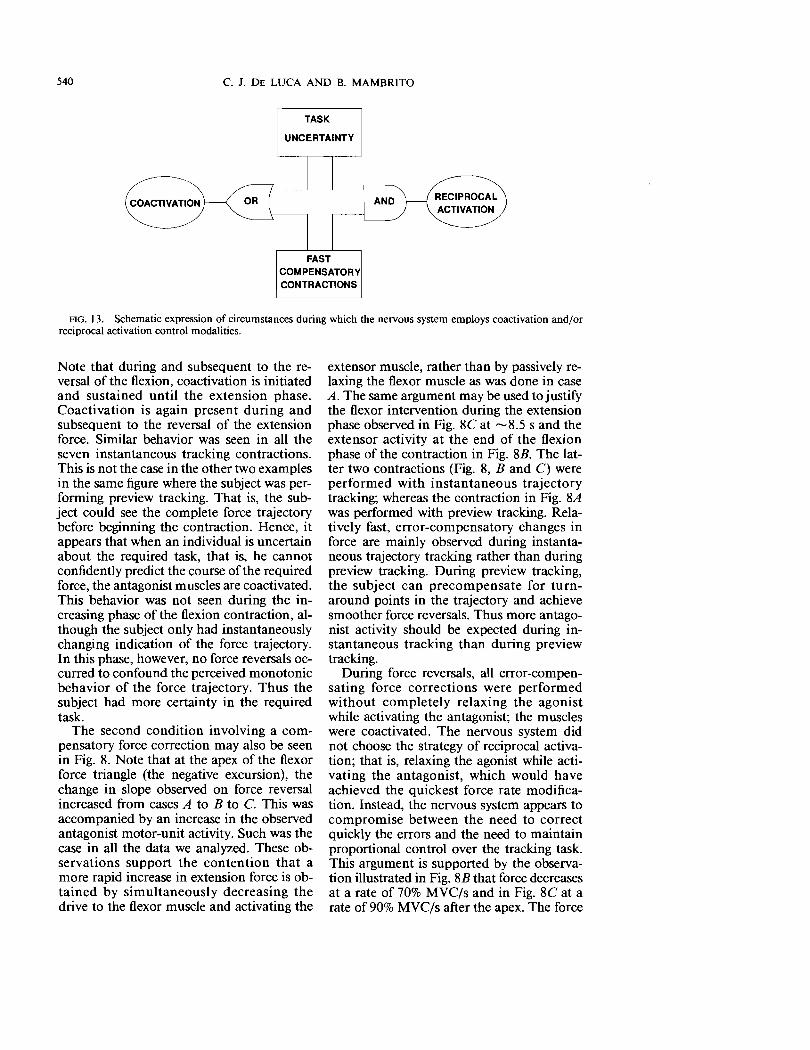
investigated in the course of this study, two modalities of control were noted to regulate the agonist-antagonist interaction: coactivation and reciprocal activation. These two modalities and their associated contraction state are schematically expressed in Fig. 13.
COACTIVATION. This modality was found to be employed in two conditions: either during states of uncertainty about the required task or when a compensatory force correction was required. An example of coactivation behavior is shown in Fig. sc.
R
EXTENSOR MUSCLE
TORQUE
FlG. 12. A suggested model for agonist-antagonist control of the thumb interphalangeal joint. The thick lines represent suprasegmental control channels. The flexion and extension channels are reciprocally organized and the coactivation channel is common to both motoneuron pools. The thin lines represent peripheral feedback paths.
540 C. J. DE LUCA AND B. MAMBRITO
TASK
UNCERTAINTY
fIG. 13. Schematic expression of circumstances during which the nervous system employs coactivation and/or reciprocal activation control modalities.
Note that during and subsequent to the reversal of the flexion, coactivation is initiated and sustained until the extension phase. Coactivation is again present during and subsequent to the reversal of the extension force. Similar behavior was seen in all the seven instantaneous tracking contractions. This is not the case in the other two examples in the same figure where the subject was performing preview tracking. That is, the subject could see the complete force trajectory before beginning the contraction. Hence, it appears that when an individual is uncertain about the required task, that is, he cannot confidently predict the course of the required force, the antagonist muscles are coactivated. This behavior was not seen during the increasing phase of the flexion contraction, although the subject only had instantaneously changing indication of the force trajectory. In this phase, however, no force reversals occurred to confound the perceived monotonic behavior of the force trajectory. Thus the subject had more certainty in the required task.
The second condition involving a compensatory force correction may also be seen in Fig. 8. Note that at the apex of the flexor force triangle (the negative excursion), the change in slope observed on force reversal increased from cases A to B to C. This was accompanied by an increase in the observed antagonist motor-unit activity. Such was the case in all the data we analyzed. These observations support the contention that a more rapid increase in extension force is obtained by simultaneously decreasing the drive to the flexor muscle and activating the
extensor muscle, rather than by passively relaxing the flexor muscle as was done in case A. The same argument may be used to justify the flexor intervention during the extension phase observed in Fig. 8C at -8.5 s and the extensor activity at the end of the flexion phase of the contraction in Fig. 8B. The latter two contractions (Fig. 8, B and C) were performed with instantaneous trajectory tracking; whereas the contraction in Fig. 8A was performed with preview tracking. Relatively fast, error-compensatory changes in force are mainly observed during instantaneous trajectory tracking rather than during preview tracking. During preview tracking, the subject can precompensate for turnaround points in the trajectory and achieve smoother force reversals. Thus more antagonist activity should be expected during instantaneous tracking than during preview tracking.
During force reversals, all error-compensating force corrections were performed without completely relaxing the agonist while activating the antagonist; the muscles were coactivated. The nervous system did not choose the strategy of reciprocal activation; that is, relaxing the agonist while activating the antagonist, which would have achieved the quickest force rate modification. Instead, the nervous system appears to compromise between the need to correct quickly the errors and the need to maintain proportional control over the tracking task. This argument is supported by the observation illustrated in Fig. 8B that force decreases at a rate of 70% MVC/s and in Fig. 8C at a rate of 90% MVC/s after the apex. The force
541 MOTOR-UNIT CONTROL IN ANTAGONIST MUSCLES
rates ofall compensatory adjustments, which were noted in all the experiments, were within the above average range. In all three subjects, the rate ofrelaxation ofthe FPL was found to be 140 ± 17% MVC/s when the subjects were requested to terminate a 30% MVC contraction without activating the antagonist muscle.
RECIPROCAL ACTIVATION. The randomforce tracking paradigm of Fig. 9 may be considered to be an extreme case of error compensation during instantaneous tracking. In this case, the condition of uncertainty and the condition of error compensation are simultaneously present. In this mode, the nervous system reciprocally activates the agonist and antagonist muscles with one muscle completely silent at any time. Such was the case in all 10 random tracking contractions analyzed. The behavior was more clearly evident in the relatively more difficult tracking tasks.
As described in INTRODUCTION, several investigators have reported that during rapid movements, the agonist and antagonist muscles display a triphasic pattern of activity with the antagonist muscle burst of activity being used to decelerate the limb. Our results indicate that the braking action of the antagonist is also used in isometric conditions to reduce or to reverse the rate offorce build-up in the agonist muscle. Thus the antagonist braking action occurs to regulate the net force or torque at a joint and not necessarily the velocity of a joint. Naturally, if the joint is unrestrained, the torque will generate a displacement. It is necessary to make this distinction because during the past two decades numerous studies have focused on studying the velocity ofjoint movement as a function of agonist-antagonist interaction. This ap-
REFERENCES
I. ANGEL, R. W. Antagonist muscle activity during rapid arm movements: central versus proprioceptive influences. Neurol. Neurosurg. Psychiatr. 40: 683-686, 1977.
2. ASANUMA, H. AND WARD, J. E. Patterns of contractions of distal forelimb muscles produced by intracortical stimulation in cats. Brain Res. 27: 97-109, 1971.
3. BARNET, C. H. AND HARDING, D. The activity of antagonist muscles during voluntary movement. Arch. Phys. Med. Rehab. 2: 290-293, 1985.
4. BROMAN, H., DE LUCA, C. J., AND MAMBRITO, B.
proach has led some researchers, such as Lagasse (23), to suggest that separate motor systems control speed and force, and that although interaction between agonist and antagonist limb muscles is fundamental for rapid joint movement, it is relatively unimportant for static force generation. The data in this paper present evidence that negates such a notion.
In conclusion, the observations presented in this paper provide evidence supporting the following notions. 1) The central nervous system may control the motoneuron pools of two (agonist and antagonist) muscles as if they were one pool when the muscles are performing the same task. 2) A centrally mediated control scheme involving three separate command channels may be used to explain the behavior of the agonist-antagonist set in all the paradigms investigated in this work. The command channels are comprised of two reciprocally organized flexion and extension channels and a common coactivation channel. 3) Coactivation of the agonist-antagonist set is present either when the subject is uncertain of the task to be performed or when a quick compensatory force contraction is perceived to be required. On the other hand, reciprocal activation is present when both conditions are present.
ACKNOWLEDGMENTS
We would like to thank SergeRoy and John Creigh for volunteering to be subjects for this arduous experiment. Dr. D. Stashuk and J. Creigh provided computer programming assistance and valuable comments on the manuscript.
This work was supported by Liberty Mutual Insurance.
Received 27 March 1986; accepted in final form 22 April 1987.
Motor unit recruitment and firing rates interaction in the control of human muscles. Brain Res. 337: 311-319, 1985.
5. BROWN, S. H. AND COOKE, J. D. Responses to force perturbations preceding voluntary arm movements. Brain Res. 220: 350-355, 1981.
6. CHENEY, P. D., KASSER, R., AND HOLSAPPLE, J. Reciprocal effect of single corticomotoneuronal cells on wrist extensor and flexor muscle activity in primate. Brain Res. 247: 164-168, 1982.
7. CHENEY, P. D. AND MEWES, K. H. Properties of rubomotoneuronal cells studied in the awake mon
542 C. J. DE LUCA AND B. MAMBRITO
key. Abstracts of Symposium on Neural Control of Limb Movement, Seattle, WA, July 9-1 I, A-I6, 1986.
8. DE LUCA, C. J., LEFEVER, R. S., McCuE, M. P., AND XENAKIS, A. P. Behavior of human motor units in different muscles during linearly varying contractions. J. Physiol. Lond. 329: 113-128, 1982.
9. DE LUCA, C. J., LEFEVER, R. S., MCCUE, M. P., AND XENAKIS, A. P. Controls scheme governing concurrently active human motor units during voluntary contractions. J. Physiol. Lond. 329: 129-142, 1982.
10. DoUBLER, J. A. AND CHILDRESS, D. S. An analysis of extended physiological proprioception as a prosthesis control technique. J. Rehab. Res. Dev. 21: 5-18, 1984.
11. FETZ, E. E. AND CHENEY, P. D. Postspike facilitation offorelimb muscle activity by primate corticomotoneuronal cells. J. Neurophysiol. 44: 751-772, 1980.
12. FREUND, H. J., BUDINGER, H. J., AND DIETZ, V. Activity of single motor units from forearm muscles during voluntary isometric contractions. J. Neurophysiol. 38: 933-946, 1975.
13. GHEZ, C. AND MARTIN, J. H. The control of rapid limb movement in the cat. Exp. Brain Res. 45: 115-125, 1982.
14. HALLETT, M. AND MARSDEN, C. D. Ballistic flexion movements of the human thumb. J. Physiol. 294: 33-50, 1979.
15. HALLETT, M., SHAHANI, B. T., AND YOUNG, E. R. EMG analysis of stereotyped voluntary movements in man. 1. Neurol. Neurosurg. Psychiatr. 38: 1154-1162, 1975.
16. HALLETT, M., SHAHANI, B. T., AND YOUNG, E. R. EMG analysis of patients with cerebellar deficits. J. Neurol. Neurosurg. Psychiatr. 38: 1163-1169, 1975.
17. HENNEMAN, E., CLAMMAN, H. P., GILLES, J. D., AND SKINNER, R. D. Rank order of motor units within a pool: Law of combinations. J. Neurophysiol. 37: 1338-1349, 1974.
18. HUFSCHMIDT, H. I. AND HUFSCHMIDT, T. Antagonist inhibition as the earliest sign of a sensory-motor reaction. Nature Lond. 174: 607, 1954.
19. HULTBORN, H., ILLERT, M., AND SANTINI, M. Convergence on interneurons mediating the reciprocal la inhibition of motoneurons. III. Effects from supraspinal pathways. Acta Physiol. Scand. 96: 368-391,1976.
20. JACOBS, M. B. Antagonist EMG temporal patterns during rapid voluntary movement (PhD dissertation). Toledo, OH: Univ. of Toledo, 1976.
21. JACOBS, M. B., ANDREWS, L. T., IANNONE, A., AND GRENIGER, L. Antagonist EMG temporal patterns during rapid voluntary movement. Neurology 30: 36-41, 1980.
22. KASSER, R. J. AND CHENEY, P. D. Characteristics of corticomotoneuronal postspike facilitation and re
ciprocal suppression of EMG activity in the monkey. 1. Neurophysiol. 53: 959-978, 1985.
23. LAGASSE, P. P. Prediction of maximum speed of human movement by two selected muscular coordination mechanisms and by maximum static strength. Percept. Mot. Skills 49: 151-161, 1979.
24. LEFEVER, R. S. AND DE LUCA, C. J. A procedure for decomposing the myoelectric signal into its constituent action potentials-Part I: technique, theory and implementation. IEEE Trans. Biomed. Eng. 29: 149-157, 1982.
25. LEFEVER, R. S., XENAKIS, A. P., AND DE LUCA, C. J. A procedure for decomposing the myoelectric signal into its constituent action potentials-Part II: execution and test for accuracy. IEEE Trans. Biomed. Eng. 29: 158-164, 1982.
26. LUSCHER, H. R., MATHIS, J., AND HENNEMAN, E. Wiring diagrams of functional connectivity in monosynaptic reflex arcs of the spinal cord. Neurosci. Leu. 45: 217-222,1984.
27. LUSHER, R., RUENZEL, P., AND HENNEMAN, E. How the size of motoneurons determines their susceptibility to discharge. Nature Lond. 282: 859-861, 1979.
28. MAMBRITO, B. AND DE LUCA, C. J. A technique for the detection, decomposition and analysis of the EMG signal. Electroencephalogr. Clin. Neurophysiol. 58: 175-188, 1984.
29. MAMBRITO, B. AND DE LUCA, C. J. Acquisition and decomposition of the electromyographic signal. In: Computer-Aided Electromyography, edited by J. Desmedt. Basel: Karger, 1983, vol. 10, p. 52-72. (Prog. Clin. Neurophysiol. Ser.)
30. SHERRINGTON, C. S. The Integrative Action ofthe Nervous System (2nd ed.). New Haven, CT: Yale Univ. Press, 1906.
31. SHERRINGTON, C. S. Reciprocal innervation of antagonist muscles. Fourteenth note. On double reciprocal innervation. Proc. R. Soc. Lond. B. Bioi. Sci. 91: 249-268, 1909.
32. SMITH, A. M. The co-activation of antagonist muscles. Can. J. Physiol. Pharmacol. 59: 733-747, 1981.
33. TERZUOLO, C. A., SOECHTING, J. F., AND VIVIANI, P. Studies on the control of some simple motor tasks. I. Relations between parameters of movements and EMG activities. Brain Res. 58: 212-216, 1973.
34. TERZUOLO, C. A., SOECHTING, J. F., AND VIVIANI, P. Studies on the control of some simple motor tasks. II. On the cerebellar control of movements in relation to the formulation of intentional commands. Brain Res. 58: 217-222, 1973.
35. THOMPSON, F. J. AND FERNANDEZ, J. J. Patterns of cortical projection to hindlimb muscle motoneuronal pools. Brain Res. 97: 33-46, 1975.
36. TlLNEY, F. AND PiKE, F. H. Muscular coordination experimentally studied in its relation to the cerebellum. Arch. Neurol. Psychiatr. I: 289-334, 1925.


![Peripheral Nervous System Somatic Nervous System the division of the peripheral nervous system that controls the body’s skeletal muscles [VOLUNTARY]](https://img.pdfslide.us/doc/110x75/56649ea05503460f94ba25b5/peripheral-nervous-system-somatic-nervous-system-the-division-of-the.jpg)


![Things to know… Major muscles for movement – location, origin & insertion [Page 140-142] Antagonist vs Agonist [Page 143] Joint movements [135-136] Types](https://img.pdfslide.us/doc/110x75/56649f585503460f94c7d67b/things-to-know-major-muscles-for-movement-location-origin-insertion.jpg)