Embed Size (px)
Citation preview

Volumetric and Sedimentation Survey
of Lake Lyndon B. Johnson
May 2007 Survey
Prepared by:
The Texas Water Development Board
April 2009
Executive Summary
In March of 2007, the Texas Water Development Board (TWDB) entered into
agreement with the U.S. Army Corps of Engineers, Fort Worth District, for the purpose of
conducting an in-depth assessment of TWDB surveying techniques. As part of this
project, TWDB performed a volumetric and sedimentation survey of Lake Lyndon Baines
Johnson (LBJ) using a multi-frequency (200 kHz, 50 kHz, and 24 kHz) sub-bottom
profiling depth sounder. In addition, sediment core samples were collected at selected
locations and used in interpreting the depth sounder signal returns to derive sediment
accumulation estimates. This report presents the results of the Lake LBJ volumetric and
sedimentation survey. A separate report describes the results of the larger project assessing
various hydrographic survey techniques utilizing the LBJ survey data.
Lake LBJ, located on the Colorado River, is a part of the Lower Colorado River
Authority’s Highland Lakes System. Lake LBJ is considered full at elevation 825.68 feet
(NAVD 88). TWDB conducted the initial Lake LBJ survey on May 4th, 7th-10th, and 14th-
16th of 2007 with additional data collected on August 3rd and October 9th of 2007. During
the survey, Lake LBJ water surface elevations ranged between 825.25 and 825.53 feet
(NAVD 88). Reservoir capacities were computed based on a combination of the TWDB
survey data, TWDB interpolated data, and TWDB extrapolated data.
The results of the TWDB 2007 Volumetric Survey indicate Lake LBJ has a
total reservoir capacity of 133,090 acre-feet and encompasses 6,273 acres at
conservation pool elevation (825.68 feet NAVD 88). Due to differences in the
methodologies used in calculating areas and capacities from this 2007 survey and previous
Lake LBJ surveys, comparison of these values is not recommended. The TWDB considers
the 2007 survey to be a significant improvement over previous surveys and recommends
that a similar methodology be used to resurvey Lake LBJ in approximately 10 years or
after a major flood event.
The results of the TWDB 2007 Sedimentation Survey indicate Lake LBJ has
accumulated 5,654 acre-feet of sediment since impoundment began in 1951. Based on
this measured sediment volume and assuming a constant sediment accumulation rate,
Lake LBJ loses approximately 100 acre-feet of capacity per year. The thickest sediment
deposits are in the submerged river channel throughout the main lake body. The maximum
sediment thickness observed in Lake LBJ was 7.1 feet.
Table of Contents Lake LBJ General Information.........................................................................................1
Water Rights .....................................................................................................................4 Volumetric and Sedimentation Survey of Lake LBJ.......................................................5
Datum................................................................................................................................5 TWDB Bathymetric Data Collection................................................................................6
Data Processing ...................................................................................................................6 Model Boundaries.............................................................................................................6 Triangulated Irregular Network (TIN) Model ..................................................................8 Self-Similar Interpolation .................................................................................................9 Line Extrapolation ..........................................................................................................13
Survey Results ...................................................................................................................15 Volumetric Survey ..........................................................................................................15 Sedimentation Survey .....................................................................................................16
TWDB Contact Information............................................................................................18 References..........................................................................................................................19
List of Tables Table 1: Pertinent Data for Wirtz Dam and Lake LBJ Table 2: Comparisons of Historical CPE Volumes of Lake LBJ
List of Figures
Figure 1: Lake LBJ Location Map Figure 2: LCRA Water Service Areas as of January 1, 2003 Figure 3: Spatial extent of data used in creating the Lake LBJ TIN models Figure 4: Elevation Relief Map Figure 5: Depth Ranges Map Figure 6: 10-foot Contour Map Figure 7: Application of the Self-Similar Interpolation technique Figure 8: Application of the Line Extrapolation technique Figure 9: Map of Sediment Thicknesses throughout Lake LBJ
Appendices
Appendix A: Lake LBJ Capacity Table Appendix B: Lake LBJ Area Table Appendix C: Elevation-Area-Capacity Curves Appendix D: Analysis of Sedimentation Data from Lake LBJ
1
Lake LBJ General Information
With recurring drought and devastating flooding, early-day residents of Central
Texas recognized the value of building dams on the Colorado River. Through the passage
of the LCRA Act by the Texas Legislature in 1934, the Lower Colorado River Authority
(LCRA) was established as a “conservation and reclamation district” responsible for
harnessing the Colorado River and its tributaries and making them productive for the
people within its water service area. By 1951, the Lower Colorado River Authority had
completed six dams on the Colorado River. The string of lakes is known as the Highland
Lakes, and includes (from upstream to downstream) Lake Buchanan, Inks Lake, Lake
Lyndon Baines Johnson (LBJ), Lake Marble Falls, Lake Travis, and Lake Austin. All
these lakes are owned and operated by the LCRA with the exception of Lake Austin,
which is owned by the City of Austin but operated by the Lower Colorado River
Authority.1 The Lower Colorado River Authority’s service area originally consisted of
the ten counties that comprise the watershed of the lower Colorado River: Blanco, Burnet,
Fayette, Colorado, Llano, Travis, Bastrop, Wharton, San Saba, and Matagorda. Several
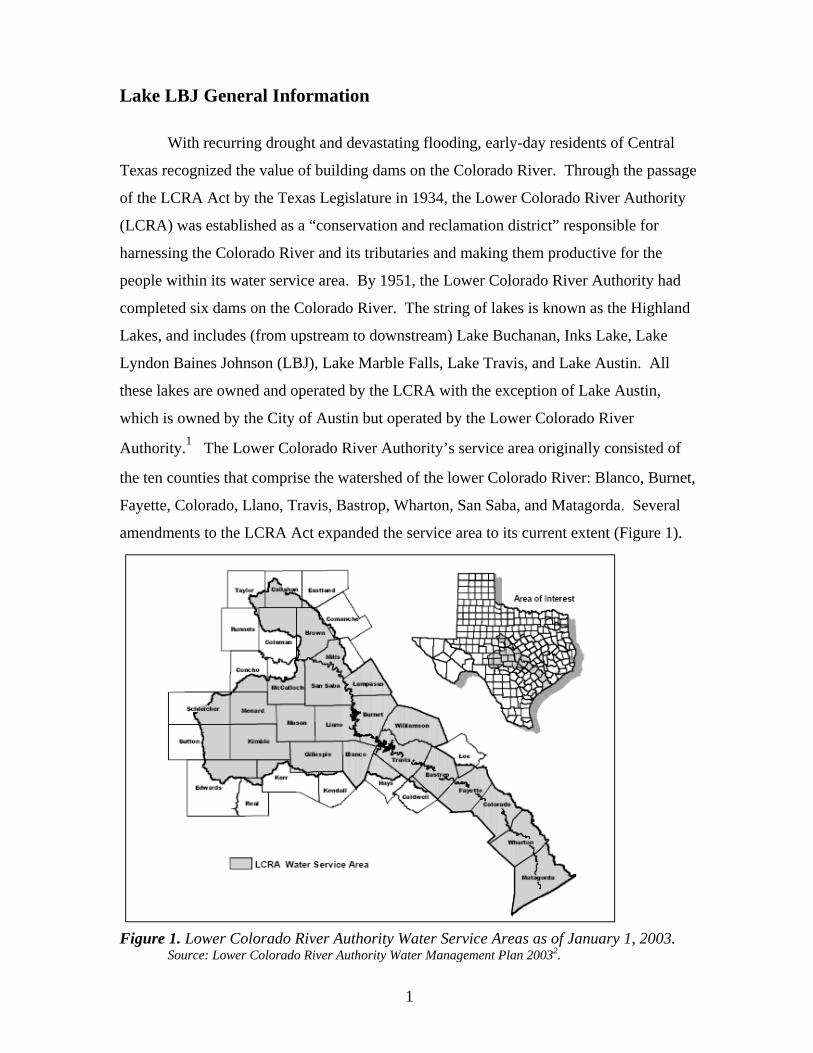
amendments to the LCRA Act expanded the service area to its current extent (Figure 1).
Figure 1. Lower Colorado River Authority Water Service Areas as of January 1, 2003.
Source: Lower Colorado River Authority Water Management Plan 20032.
2
The Lower Colorado River Authority operates the Highland Lakes as a system.
Lakes Buchanan and Travis are water storage reservoirs, while Inks Lake, Lake LBJ, Lake
Marble Falls, and Lake Austin are pass-through reservoirs. Lake Travis is the only lake in
the system truly designed for flood control purposes. The Lower Colorado River
Authority maintains a Water Management Plan as a blueprint for how it will operate the
Highland Lakes System. Water availability is based on the Combined Firm Yield of
Lakes Buchanan and Travis. The Combined Firm Yield is the annual dependable water
supply that can be obtained from Lakes Buchanan and Travis during a repetition of the
drought of record. Any water available for use in excess of the combined firm yield is
considered interruptible water and is sold annually subject to availability. Availability of
interruptible water is projected by the Lower Colorado River Authority each November.
The projected supply depends on the amount of expected combined water storage in Lakes
Buchanan and Travis on January 1, anticipated inflows for the subsequent months through
the irrigation season, and the current demands for firm water.2 The majority of
interruptible water is sold for use in irrigation in the lower Colorado River basin.
The Water Management Plan and a system-operation approach to their water rights
and reservoirs allows the Lower Colorado River Authority to optimize and conserve
available water to meet existing and future water needs while being a steward of the water
and land of the lower Colorado River Basin.3 The complete Lower Colorado River
Authority Water Management Plan is available through the Lower Colorado River
Authority website at http://www.lcra.org/water/wmp.html.
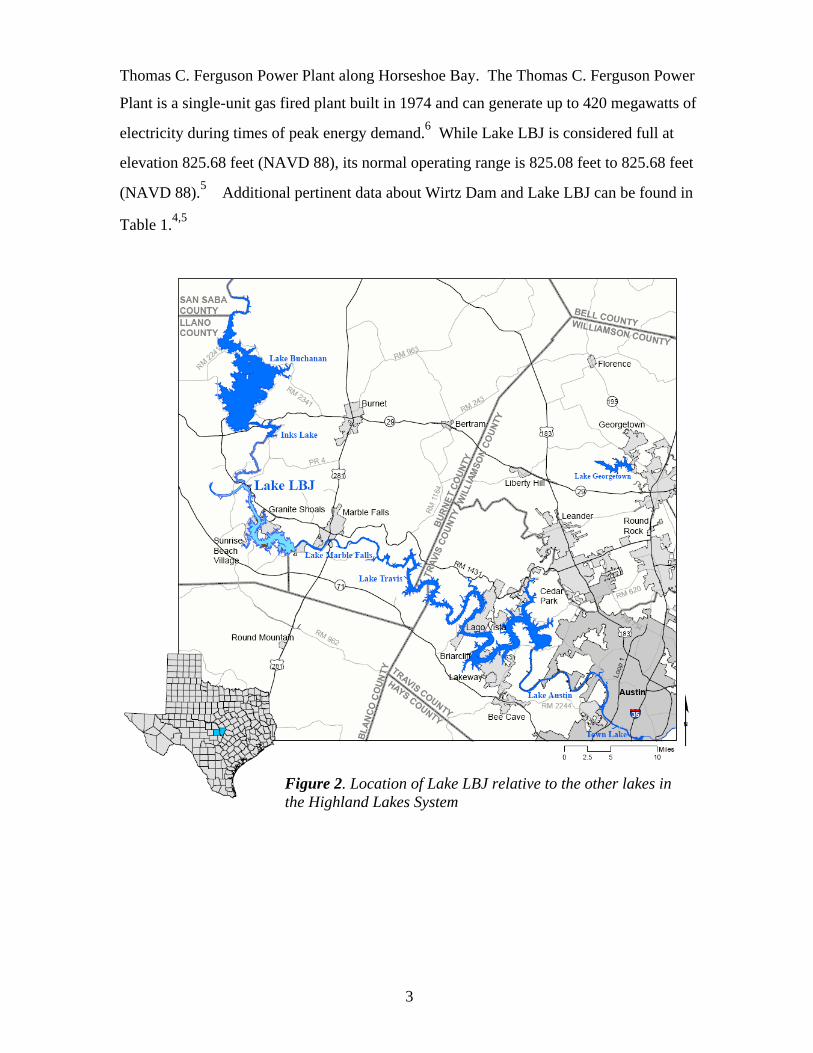
Alvin Wirtz Dam and Lake Lyndon Baines Johnson (LBJ) are located on the
Colorado River in Llano and Burnet Counties, five miles west of Marble Falls, Texas4
(Figure 2). Originally named Granite Shoals Dam and Granite Shoals Lake, dam
construction began in September of 1949, in tandem with Starke Dam and Lake Marble
Falls downstream. The dam was completed in November of 1951, with deliberate
impoundment beginning in May of 1951. Power generation commenced on June 27,
1951.4 In 1952, the dam was renamed for Alvin J. Wirtz who was instrumental in the
creation of the Lower Colorado River Authority and served as its first general counsel. In
1965, the lake was renamed in honor of Lyndon Baines Johnson, the 36th president of the
United States and area resident.5 Although the lake’s primary purpose is hydroelectric
power, the lake also provides cooling water for the Lower Colorado River Authority’s
3
Thomas C. Ferguson Power Plant along Horseshoe Bay. The Thomas C. Ferguson Power
Plant is a single-unit gas fired plant built in 1974 and can generate up to 420 megawatts of
electricity during times of peak energy demand.6 While Lake LBJ is considered full at
elevation 825.68 feet (NAVD 88), its normal operating range is 825.08 feet to 825.68 feet
(NAVD 88).5 Additional pertinent data about Wirtz Dam and Lake LBJ can be found in
Table 1.4,5
Figure 2. Location of Lake LBJ relative to the other lakes in the Highland Lakes System
4
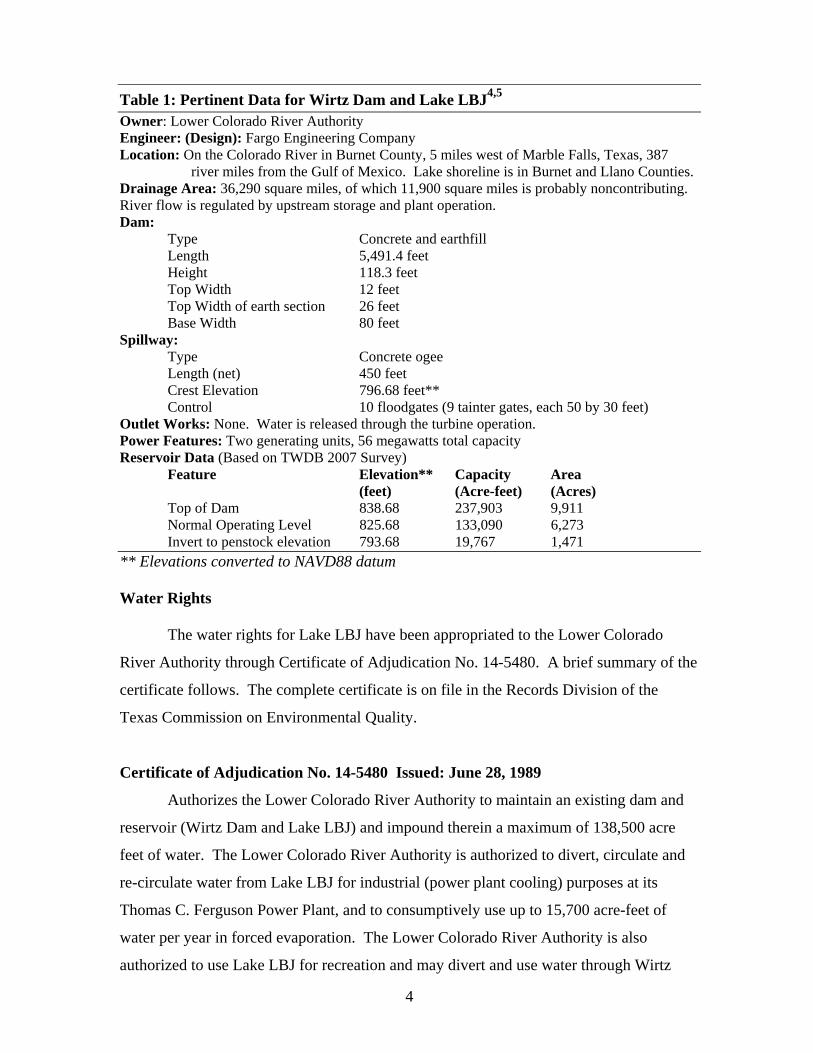
Table 1: Pertinent Data for Wirtz Dam and Lake LBJ4,5 Owner: Lower Colorado River Authority Engineer: (Design): Fargo Engineering Company Location: On the Colorado River in Burnet County, 5 miles west of Marble Falls, Texas, 387
river miles from the Gulf of Mexico. Lake shoreline is in Burnet and Llano Counties. Drainage Area: 36,290 square miles, of which 11,900 square miles is probably noncontributing. River flow is regulated by upstream storage and plant operation. Dam: Type Concrete and earthfill Length 5,491.4 feet Height 118.3 feet Top Width 12 feet
Top Width of earth section 26 feet Base Width 80 feet Spillway: Type Concrete ogee Length (net) 450 feet Crest Elevation 796.68 feet** Control 10 floodgates (9 tainter gates, each 50 by 30 feet) Outlet Works: None. Water is released through the turbine operation. Power Features: Two generating units, 56 megawatts total capacity Reservoir Data (Based on TWDB 2007 Survey) Feature Elevation** Capacity Area (feet) (Acre-feet) (Acres) Top of Dam 838.68 237,903 9,911 Normal Operating Level 825.68 133,090 6,273 Invert to penstock elevation 793.68 19,767 1,471 ** Elevations converted to NAVD88 datum Water Rights The water rights for Lake LBJ have been appropriated to the Lower Colorado
River Authority through Certificate of Adjudication No. 14-5480. A brief summary of the
certificate follows. The complete certificate is on file in the Records Division of the
Texas Commission on Environmental Quality.
Certificate of Adjudication No. 14-5480 Issued: June 28, 1989
Authorizes the Lower Colorado River Authority to maintain an existing dam and
reservoir (Wirtz Dam and Lake LBJ) and impound therein a maximum of 138,500 acre
feet of water. The Lower Colorado River Authority is authorized to divert, circulate and
re-circulate water from Lake LBJ for industrial (power plant cooling) purposes at its
Thomas C. Ferguson Power Plant, and to consumptively use up to 15,700 acre-feet of
water per year in forced evaporation. The Lower Colorado River Authority is also
authorized to use Lake LBJ for recreation and may divert and use water through Wirtz
5
Dam for hydroelectric power generation, subject to certain conditions. The priority date
for impounding water, recreation, and hydroelectric power generation is March 29, 1926.
The priority date for diversion and use of water for cooling purposes is August 24, 1970.
Volumetric and Sedimentation Survey of Lake LBJ
The Texas Water Development Board’s (TWDB) Hydrographic Survey Program
was authorized by the state legislature in 1991. The Texas Water Code authorizes TWDB
to perform surveys to determine reservoir storage capacity, sedimentation levels, rates of
sedimentation, and projected water supply availability.
In March of 2007, the Texas Water Development Board (TWDB) entered into
agreement with the U.S. Army Corps of Engineers, Fort Worth District, for the purpose of
conducting an in-depth assessment of TWDB surveying techniques. As part of this assessment
project, TWDB performed a volumetric and sedimentation survey of Lake Lyndon Baines
Johnson (LBJ) using a multi-frequency (200 kHz, 50 kHz, and 24 kHz) sub-bottom profiling
depth sounder. In addition, sediment core samples were collected at selected locations and
used in interpreting the depth sounder signal returns to derive sediment accumulation
estimates. This report presents the results of the Lake LBJ volumetric and sedimentation
survey. A separate report describes the results of the larger project assessing various
hydrographic survey techniques utilizing the LBJ survey data.
Datum
The vertical datum used during this survey is North American Vertical Datum
1988 (NAVD 88), as requested by the LCRA. Water surface elevations cited in this report
were obtained from the United States Geological Survey (USGS) for the reservoir
elevation gage TX071 08152500, named “LCRA Lk LBJ nr Marble Falls, TX7” located at
Wirtz Dam. The datum for this gage is reported as 795 feet above mean sea level per the
National Geodetic Vertical Datum 1929 (NGVD 29)7, which is 0.68 feet below the
NAVD 88 datum as determined by LCRA.8 Water surface elevations reported here
were derived by adding 0.68 feet to the elevations recorded at the USGS gage TX071
08152500. This datum conversion is only valid for water levels recorded at Wirtz Dam.
The horizontal datum used for this report is the North American Datum of 1983 (NAD83),
and the horizontal coordinate system is State Plane Texas Central Zone (feet).
6
TWDB Bathymetric Data Collection
TWDB conducted the initial Lake LBJ survey on May 4th, 7th-10th, and 14th-16th of
2007 with additional data collected on August 3rd and October 9th of 2007. During the
survey, Lake LBJ water surface elevations ranged between 825.25 and 825.53 feet
(NAVD 88). For data collection, TWDB used a Specialty Devices, Inc., multi-frequency
(200 kHz, 50 kHz, and 24 kHz) sub-bottom profiling depth sounder integrated with
Differential Global Positioning System (DGPS) equipment. Data collection occurred
while navigating along pre-planned range lines oriented perpendicular to the assumed
location of the original river channels and spaced approximately 500 feet apart. The depth
sounder was calibrated daily using a velocity profiler to measure the speed of sound in the
water column and a weighted tape or stadia rod for depth reading verification. During the
2007 survey, team members collected approximately 149,000 data points over cross-
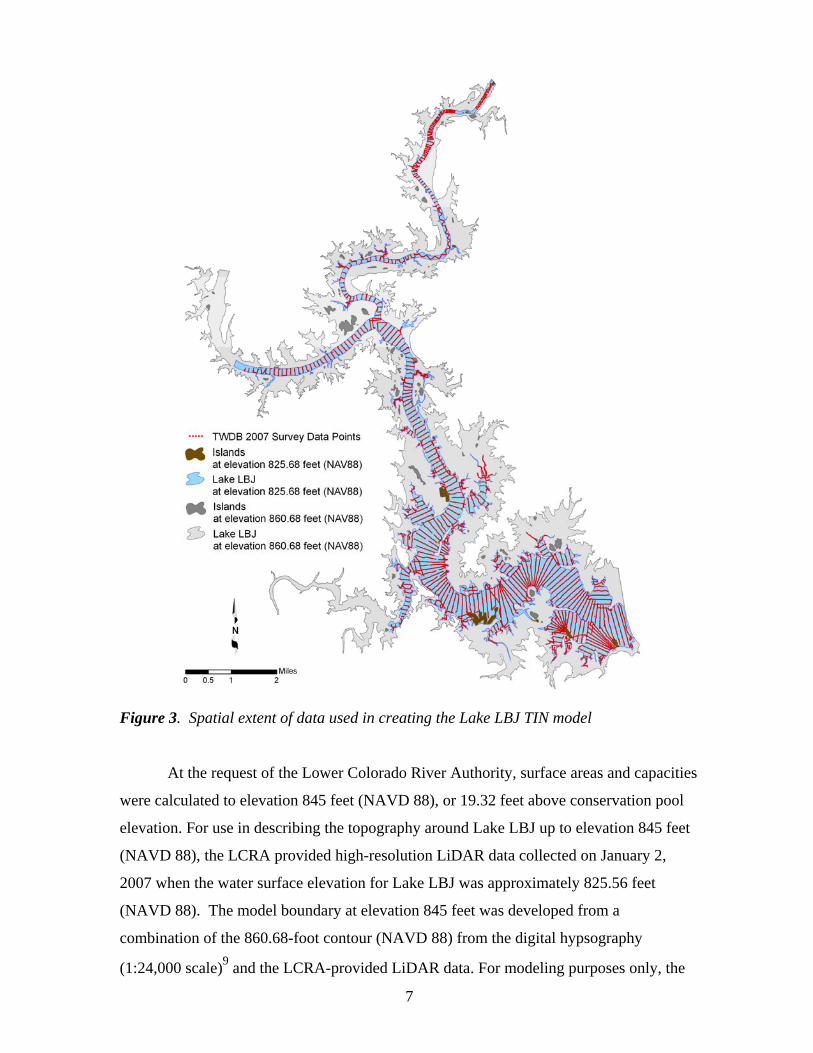
sections totaling nearly 146 miles in length. Figure 3 shows where data points were
collected during the TWDB 2007 survey.
Data Processing
Model Boundaries
The reservoir boundary was digitized from aerial photographs, also known as
digital orthophoto quarter-quadrangle images (DOQQs)9,10, using Environmental Systems
Research Institute’s (ESRI) ArcGIS 9.1 software. The quarter-quadrangles that cover Lake
LBJ are Kingsland NW, NE, SW, and SE, Dunman Mountain NW, NE, SW, and SE, and
Marble Falls NW and SW. These images were photographed on December 7, 2004
during which time the water surface elevation at Lake LBJ measured 825.45 feet (NAVD
88). Although the water surface elevation measured slightly below conservation pool
elevation at the time of the photos, TWDB determined that there was not a significant
difference in lake area between 825.45 feet and 825.68 feet, as discernable from the
photographs and given the photographs have a 1-meter resolution. Therefore, the
boundary was digitized from the land water interface in the photos and labeled 825.68 feet
to allow area and volume to be calculated to the top of conservation pool elevation.
7
Figure 3. Spatial extent of data used in creating the Lake LBJ TIN model
At the request of the Lower Colorado River Authority, surface areas and capacities
were calculated to elevation 845 feet (NAVD 88), or 19.32 feet above conservation pool
elevation. For use in describing the topography around Lake LBJ up to elevation 845 feet
(NAVD 88), the LCRA provided high-resolution LiDAR data collected on January 2,
2007 when the water surface elevation for Lake LBJ was approximately 825.56 feet
(NAVD 88). The model boundary at elevation 845 feet was developed from a
combination of the 860.68-foot contour (NAVD 88) from the digital hypsography
(1:24,000 scale)9 and the LCRA-provided LiDAR data. For modeling purposes only, the
8
860.68-foot contour was closed across the tops of both Inks Dam and Wirtz Dam, and
therefore does not reflect the true elevations near the either dam crest. Figure 3 shows the
860.68-foot contour in the vicinity of Lake LBJ.
Triangulated Irregular Network (TIN) Model
Upon completion of data collection, the raw data files collected by TWDB were
edited using HydroEdit and DepthPic to remove any data anomalies. HydroEdit is used to
automate the editing of the 200 kHz frequency and determine the current bathymetric
surface. DepthPic is used to display, interpret, and edit the multi-frequency data and to
manually interpret the pre-impoundment surface. The water surface elevations at the
times of each sounding are used to convert sounding depths to corresponding bathymetric
elevations. For processing outside of DepthPic, the sounding coordinates (X,Y,Z) were
exported as a MASS points file. A similar MASS points file was created from the LCRA-
provided LiDAR data, although only data outside of the 825.68-foot Lake LBJ boundary
were used (See Figure 3). TWDB also created additional MASS points files of
interpolated and extrapolated data based on the sounding data. Using the “Self-Similar
Interpolation” technique (described in a later section), TWDB interpolated bathymetric
elevation data located in-between surveyed cross sections. To better represent reservoir
bathymetry in shallow regions, TWDB used the “Line Extrapolation” technique
(described in a later section). The point files resulting from both the data interpolation and
extrapolation were exported as MASS points files, and were used in conjunction with the
sounding, LiDAR, and boundary files in creating a Triangulated Irregular Network (TIN)
model with the 3D Analyst Extension of ArcGIS. The 3D Analyst algorithms use
Delaunay’s criteria for triangulation to place a triangle between three non-uniformly
spaced points, including boundary vertices.11
Using Arc/Info software, volumes and areas were calculated from the TIN model
for the entire reservoir at one-tenth of a foot intervals, from elevation 751.0 feet to
elevation 845.0 feet (NAVD 88). The Elevation-Capacity Table and Elevation-Area
Table, updated for 2007, are presented in Appendix A and B, respectively. The Area-
Capacity Curves are presented in Appendix C. The TIN model was interpolated and
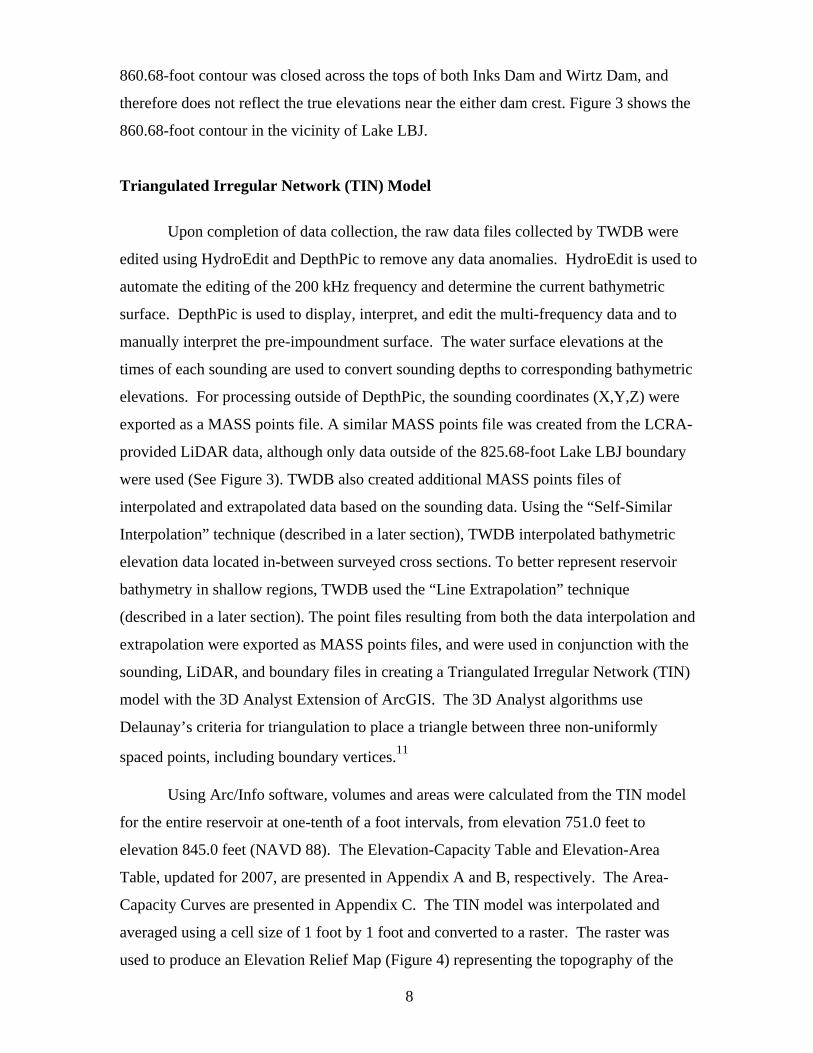
averaged using a cell size of 1 foot by 1 foot and converted to a raster. The raster was
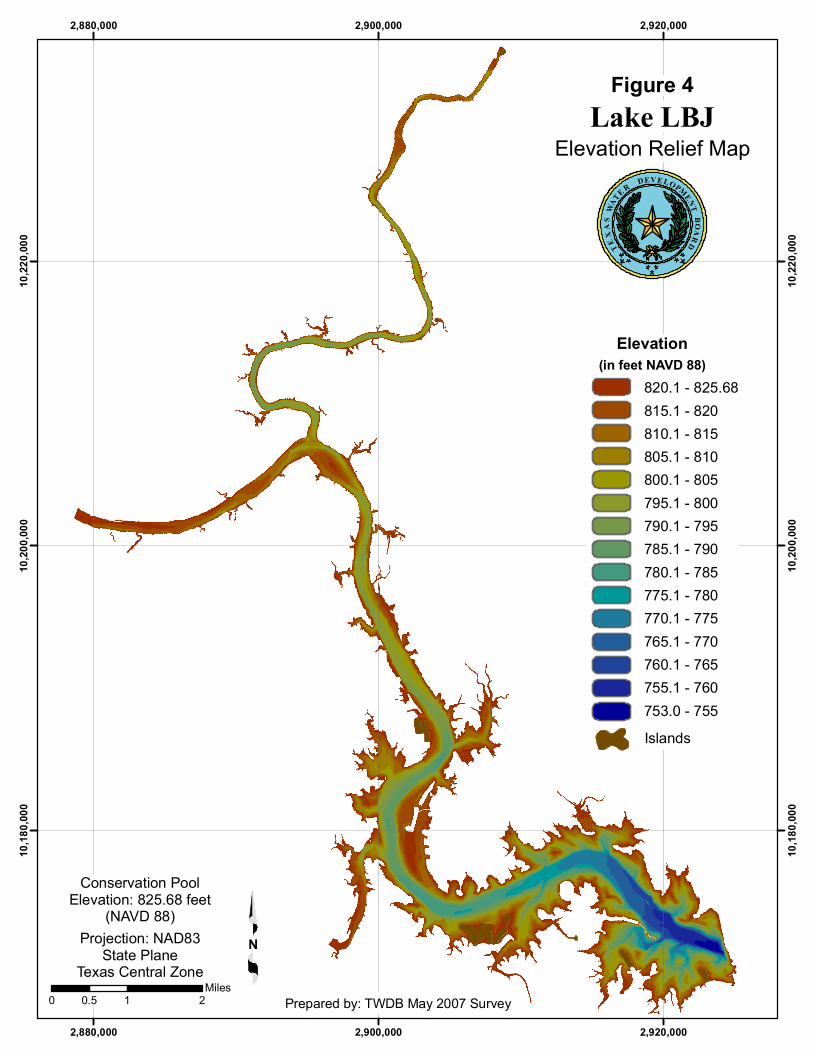
used to produce an Elevation Relief Map (Figure 4) representing the topography of the
9
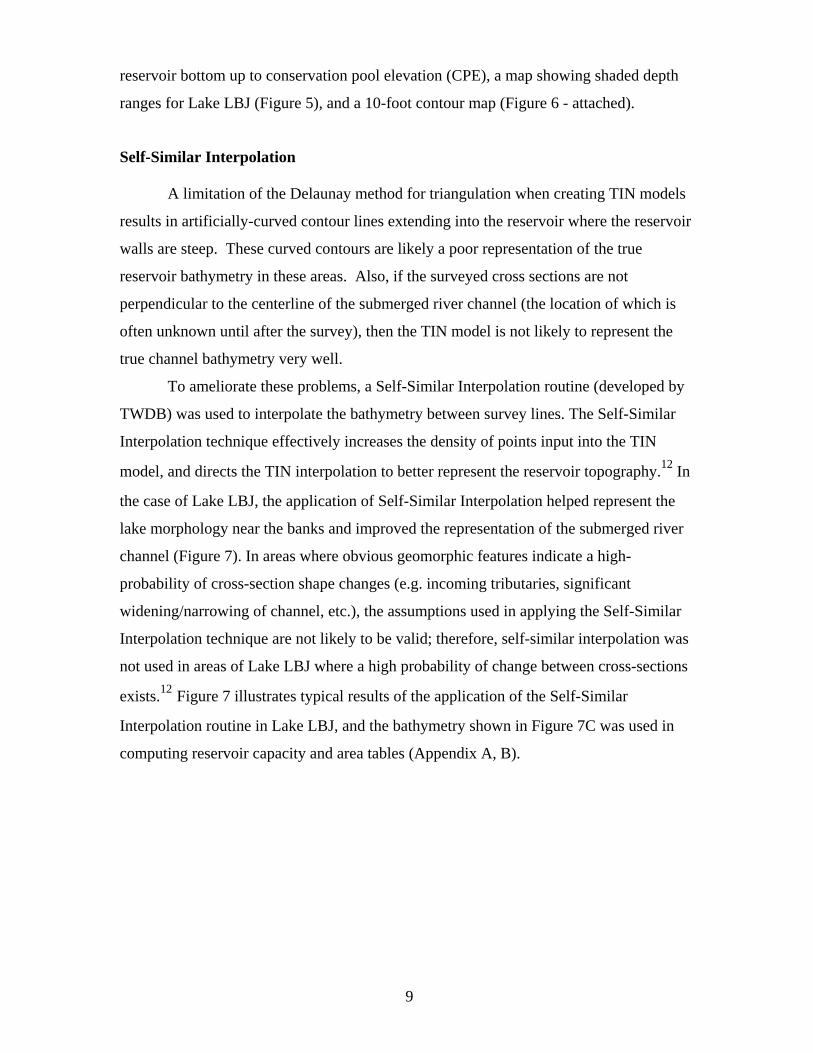
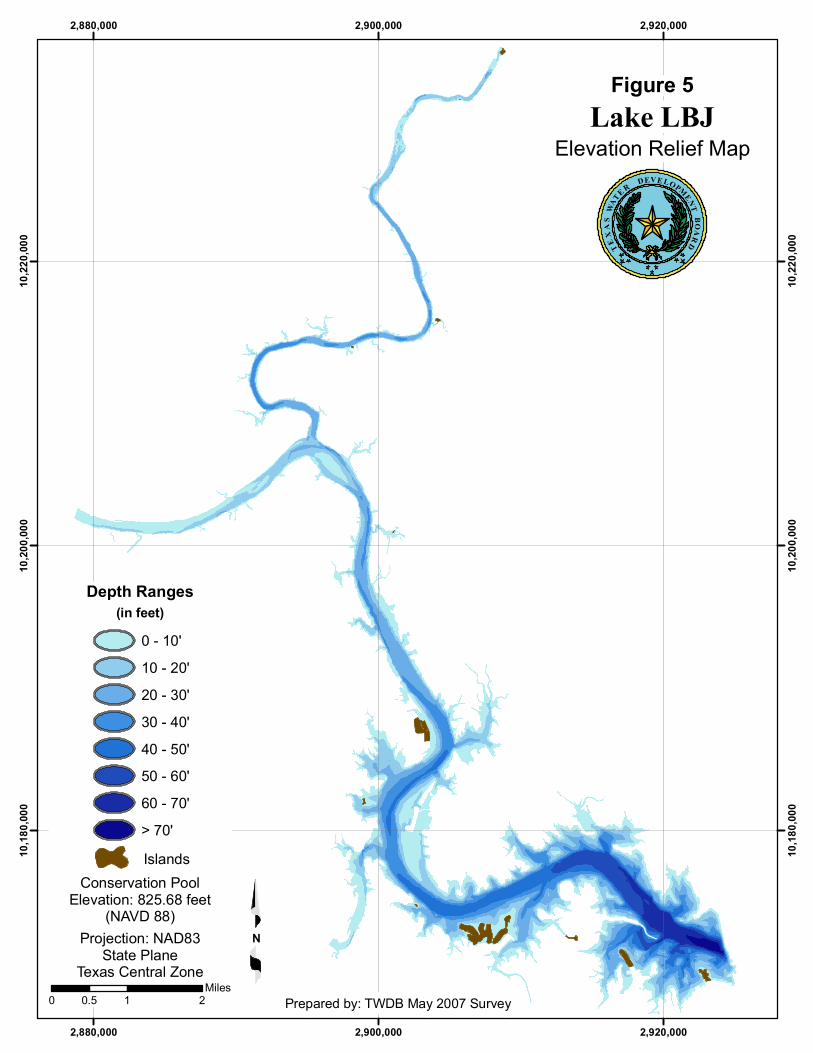
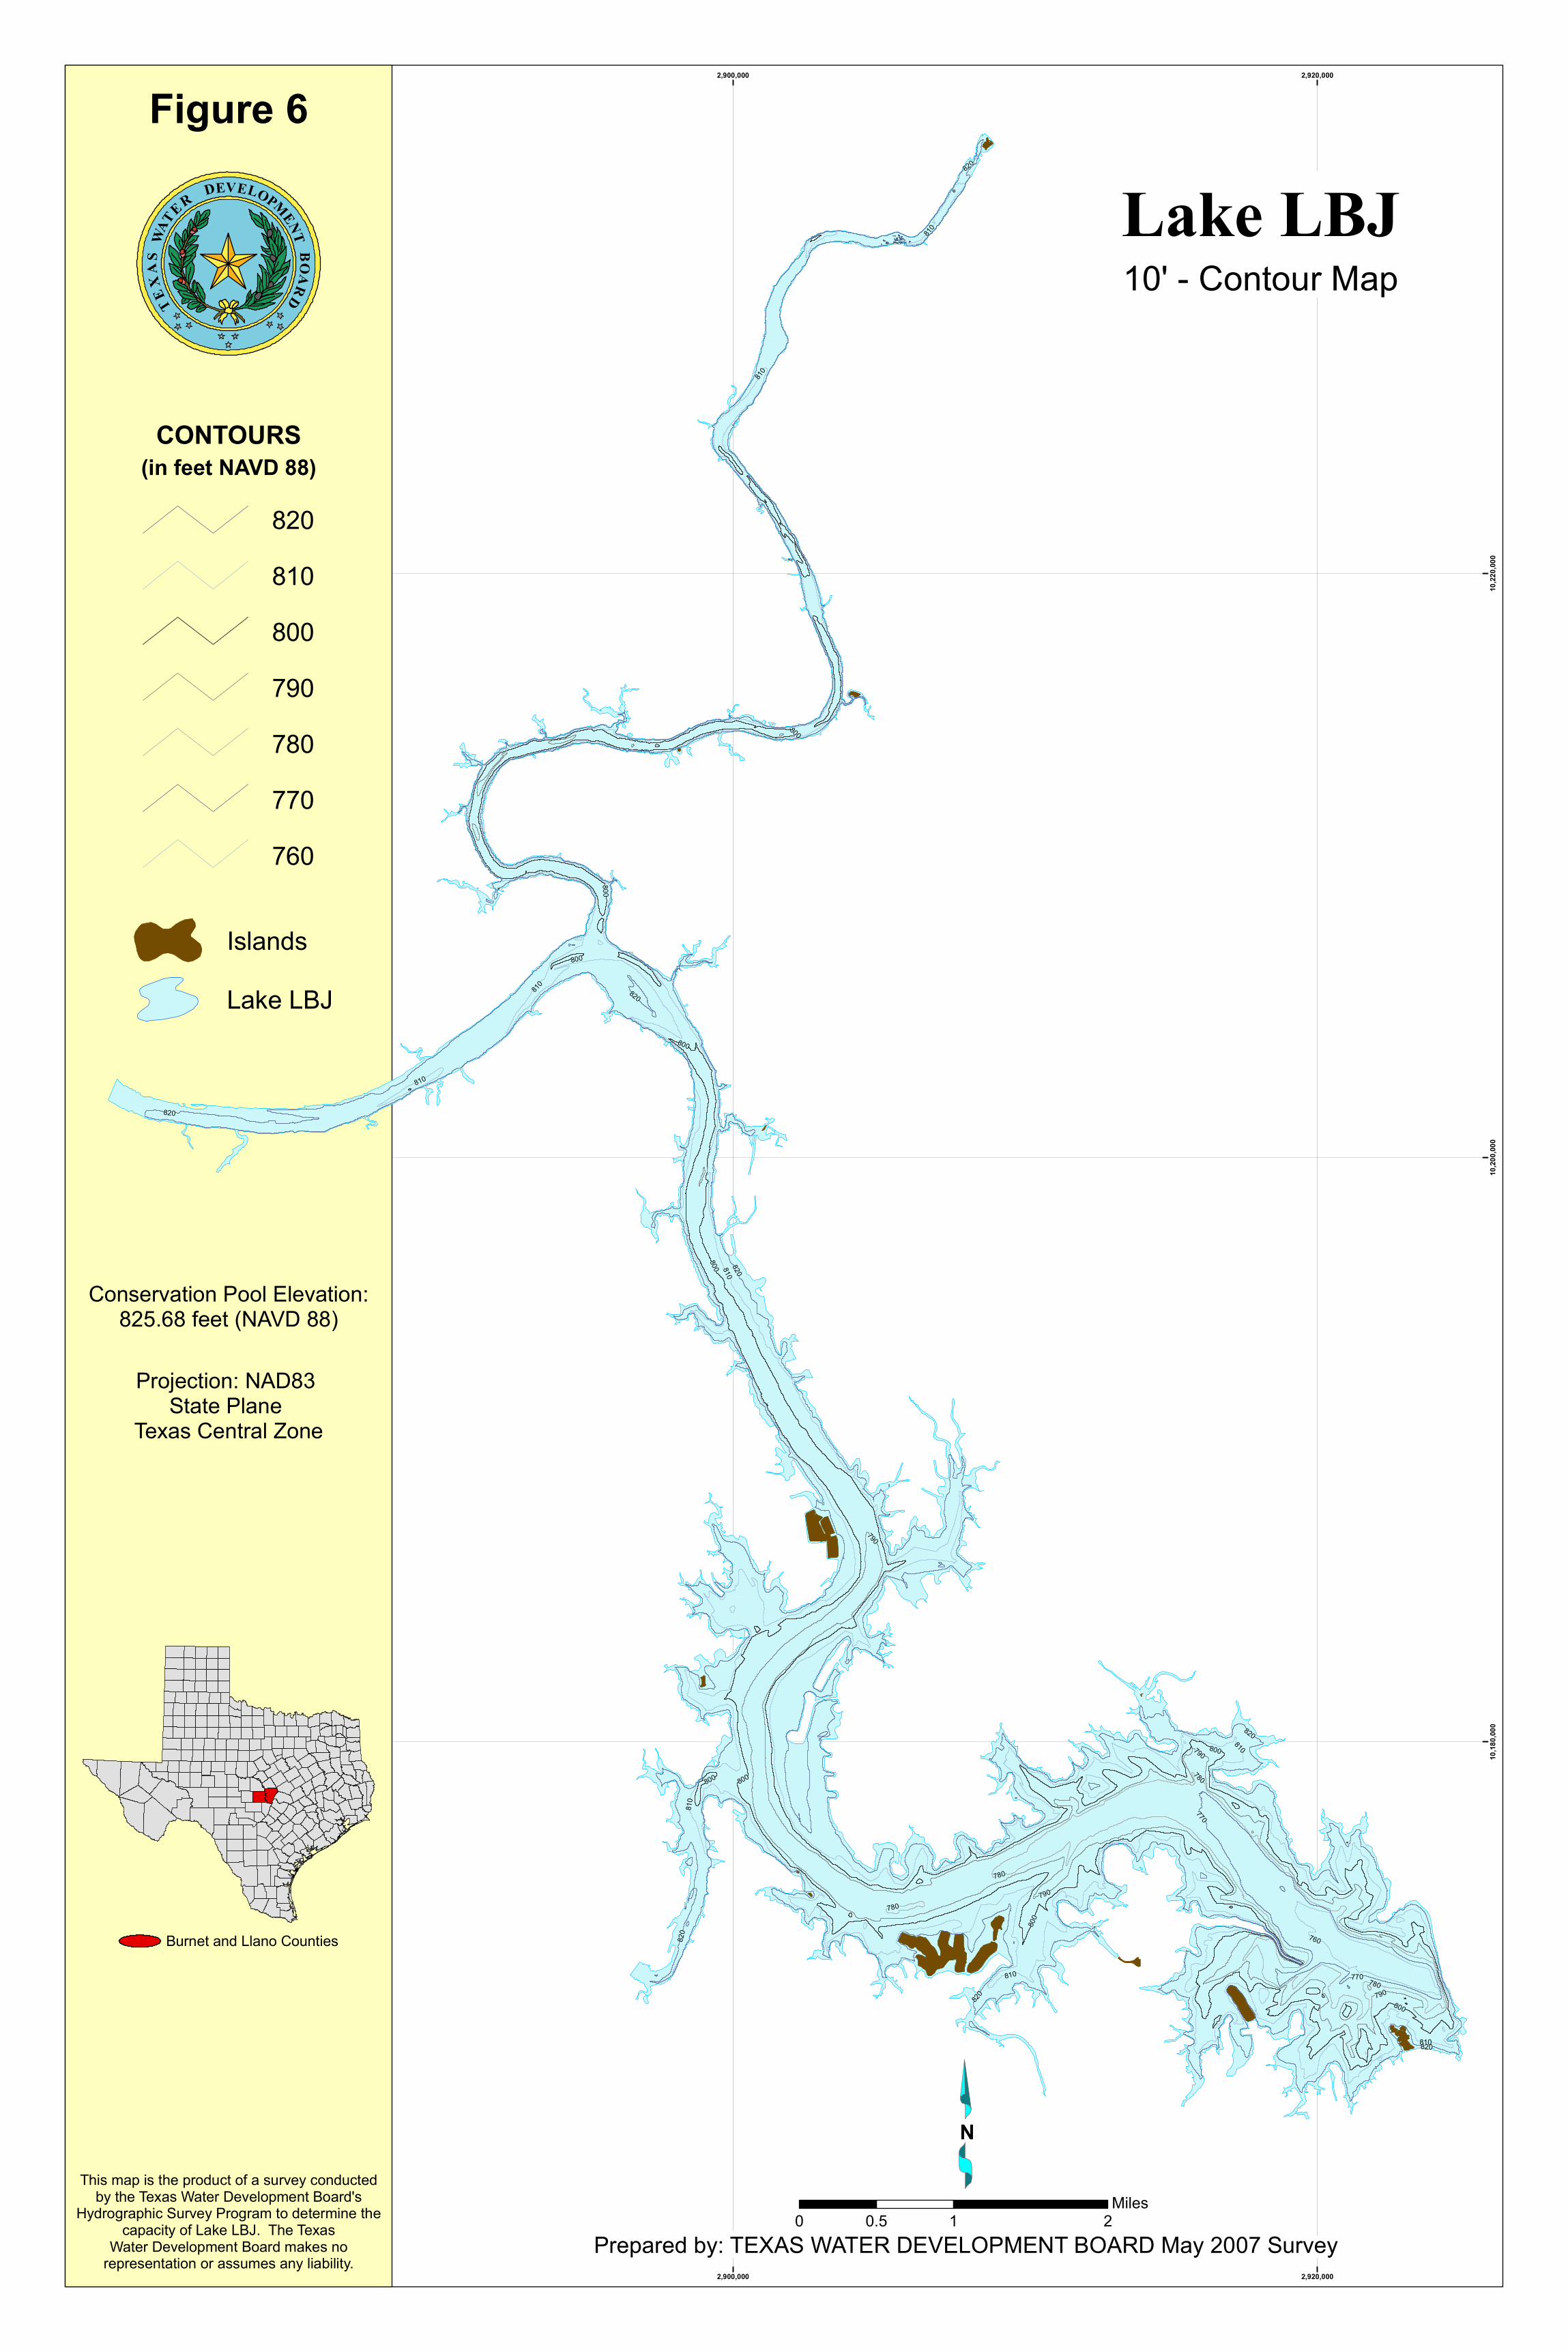
reservoir bottom up to conservation pool elevation (CPE), a map showing shaded depth
ranges for Lake LBJ (Figure 5), and a 10-foot contour map (Figure 6 - attached).
Self-Similar Interpolation
A limitation of the Delaunay method for triangulation when creating TIN models
results in artificially-curved contour lines extending into the reservoir where the reservoir
walls are steep. These curved contours are likely a poor representation of the true
reservoir bathymetry in these areas. Also, if the surveyed cross sections are not
perpendicular to the centerline of the submerged river channel (the location of which is
often unknown until after the survey), then the TIN model is not likely to represent the
true channel bathymetry very well.
To ameliorate these problems, a Self-Similar Interpolation routine (developed by
TWDB) was used to interpolate the bathymetry between survey lines. The Self-Similar
Interpolation technique effectively increases the density of points input into the TIN
model, and directs the TIN interpolation to better represent the reservoir topography.12 In
the case of Lake LBJ, the application of Self-Similar Interpolation helped represent the
lake morphology near the banks and improved the representation of the submerged river
channel (Figure 7). In areas where obvious geomorphic features indicate a high-
probability of cross-section shape changes (e.g. incoming tributaries, significant
widening/narrowing of channel, etc.), the assumptions used in applying the Self-Similar
Interpolation technique are not likely to be valid; therefore, self-similar interpolation was
not used in areas of Lake LBJ where a high probability of change between cross-sections
exists.12 Figure 7 illustrates typical results of the application of the Self-Similar
Interpolation routine in Lake LBJ, and the bathymetry shown in Figure 7C was used in
computing reservoir capacity and area tables (Appendix A, B).
2,880,000
2,880,000
2,900,000
2,900,000
2,920,000
2,920,000
10,18
0,000
10,18
0,000
10,20
0,000
10,20
0,000
10,22
0,000
10,22
0,000
Lake LBJFigure 4
Elevation Relief Map
Prepared by: TWDB May 2007 Survey
TEXA
SWA
TER DEVE LOPMENTB OARD
N
0 1 20.5Miles
Conservation PoolElevation: 825.68 feet
(NAVD 88)Projection: NAD83
State PlaneTexas Central Zone
Elevation(in feet NAVD 88)
820.1 - 825.68815.1 - 820810.1 - 815805.1 - 810800.1 - 805795.1 - 800790.1 - 795785.1 - 790780.1 - 785775.1 - 780770.1 - 775765.1 - 770760.1 - 765755.1 - 760753.0 - 755Islands
2,880,000
2,880,000
2,900,000
2,900,000
2,920,000
2,920,000
10,18
0,000
10,18
0,000
10,20
0,000
10,20
0,000
10,22
0,000
10,22
0,000
Lake LBJFigure 5
Elevation Relief Map
Prepared by: TWDB May 2007 Survey
N
TEXA
SWA
TER DEVE LOPMENTB OARD
Depth Ranges(in feet)
Islands
0 - 10'10 - 20'20 - 30'30 - 40'40 - 50'50 - 60'60 - 70'> 70'
0 1 20.5Miles
Conservation PoolElevation: 825.68 feet
(NAVD 88)Projection: NAD83
State PlaneTexas Central Zone
12
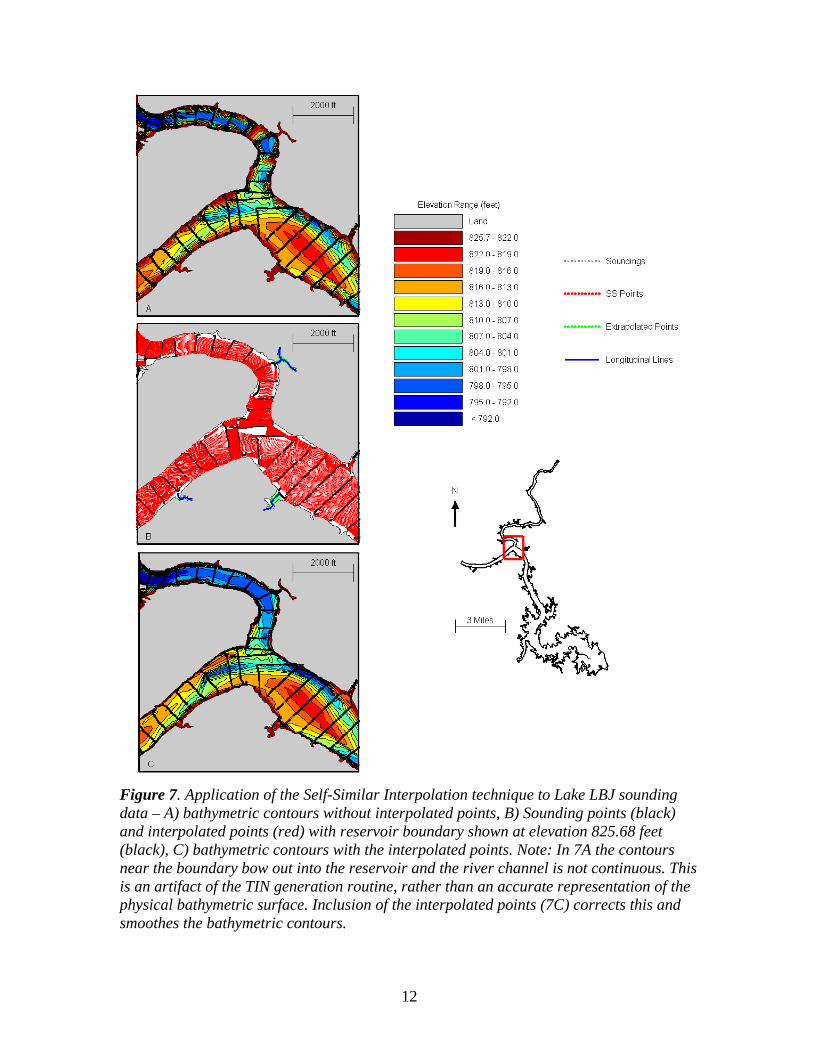
Figure 7. Application of the Self-Similar Interpolation technique to Lake LBJ sounding data – A) bathymetric contours without interpolated points, B) Sounding points (black) and interpolated points (red) with reservoir boundary shown at elevation 825.68 feet (black), C) bathymetric contours with the interpolated points. Note: In 7A the contours near the boundary bow out into the reservoir and the river channel is not continuous. This is an artifact of the TIN generation routine, rather than an accurate representation of the physical bathymetric surface. Inclusion of the interpolated points (7C) corrects this and smoothes the bathymetric contours.
13
Line Extrapolation
In order to estimate the bathymetry in inaccessible portions of Lake LBJ, TWDB
applied a line extrapolation technique12 similar to the Self-Similar interpolation technique
discussed above. The line extrapolation method is often used by TWDB in extrapolating
bathymetries in shallow coves near the upstream ends of reservoirs, where the water is
often too shallow to allow boat passage. The method assumes that cross-sections within
the “extrapolation area” have a “V-shaped” profile, with the deepest section located along
a line drawn along the longitudinal axis of the area. Elevations along this “longitudinal
line” are interpolated linearly based on the distance along the line from the line’s start
(nearest the reservoir interior) to the line’s end (where the line crosses the reservoir
boundary). The elevations at points along each extrapolated cross-section are linearly
interpolated from an elevation on the longitudinal line (at the intersection with the cross-
section) and the elevation at the extrapolation area boundary. The line extrapolation
method requires that the user specify the position of the longitudinal line and the elevation
at the beginning of the longitudinal line. This elevation is usually assumed equivalent to
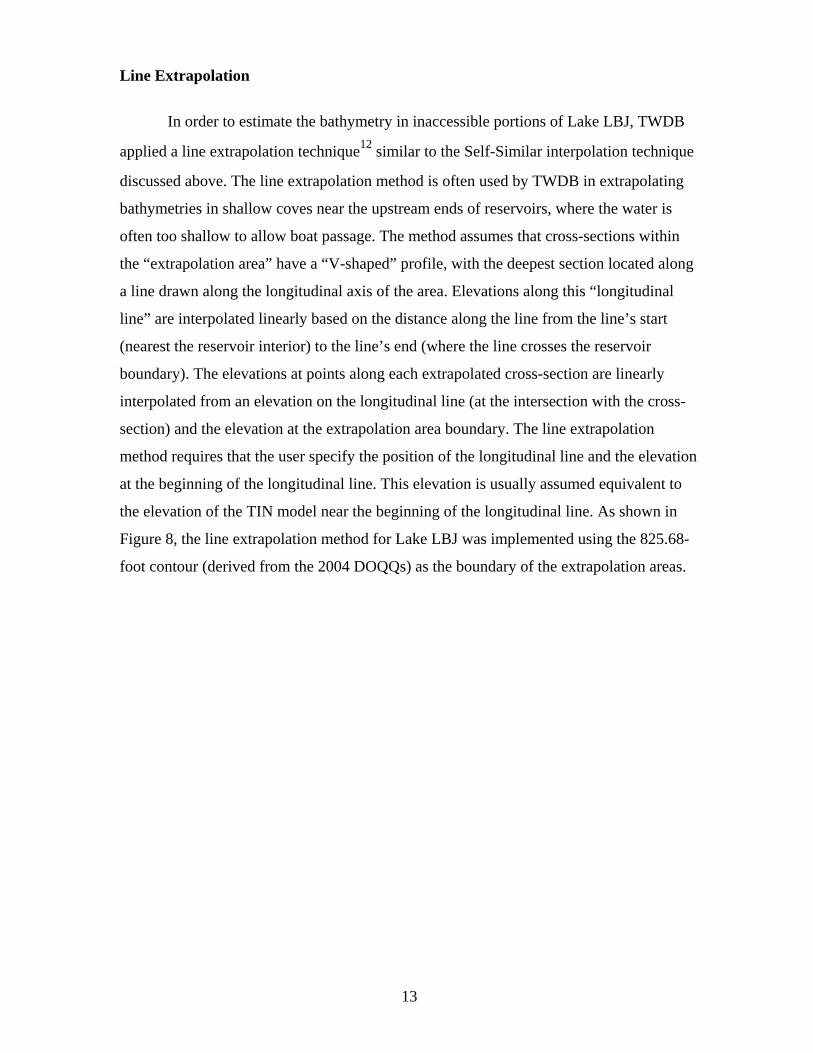
the elevation of the TIN model near the beginning of the longitudinal line. As shown in
Figure 8, the line extrapolation method for Lake LBJ was implemented using the 825.68-
foot contour (derived from the 2004 DOQQs) as the boundary of the extrapolation areas.
14
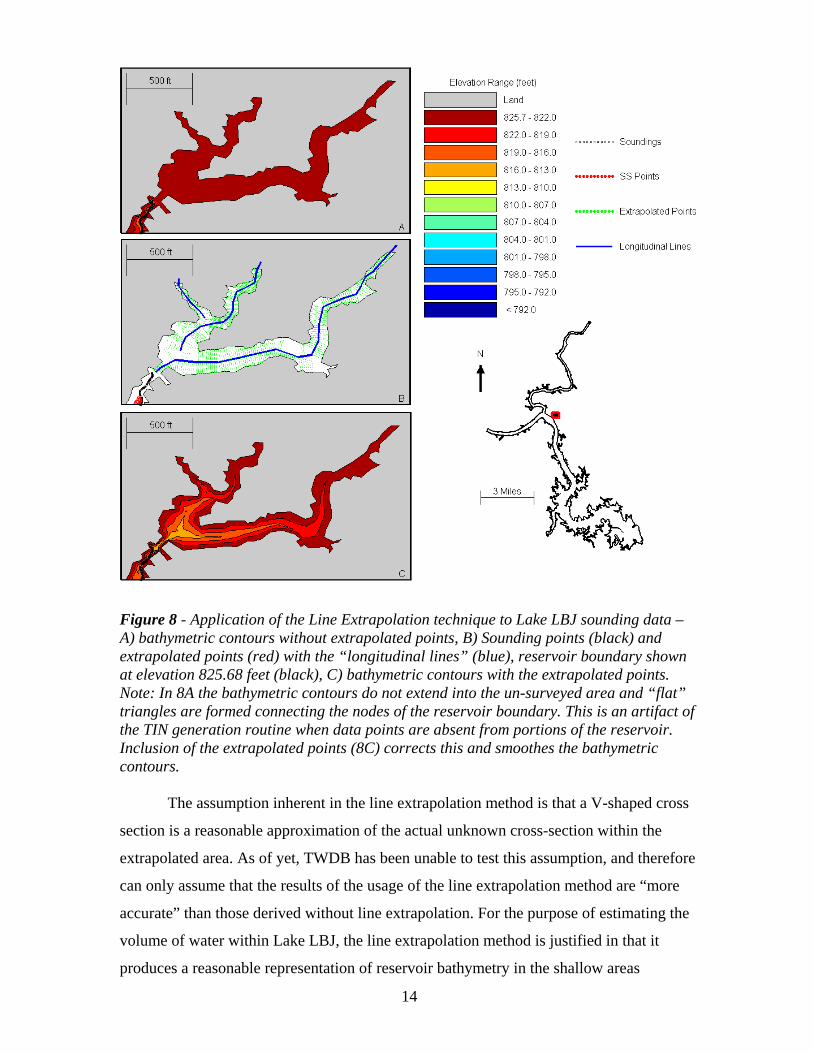
Figure 8 - Application of the Line Extrapolation technique to Lake LBJ sounding data – A) bathymetric contours without extrapolated points, B) Sounding points (black) and extrapolated points (red) with the “longitudinal lines” (blue), reservoir boundary shown at elevation 825.68 feet (black), C) bathymetric contours with the extrapolated points. Note: In 8A the bathymetric contours do not extend into the un-surveyed area and “flat” triangles are formed connecting the nodes of the reservoir boundary. This is an artifact of the TIN generation routine when data points are absent from portions of the reservoir. Inclusion of the extrapolated points (8C) corrects this and smoothes the bathymetric contours. The assumption inherent in the line extrapolation method is that a V-shaped cross
section is a reasonable approximation of the actual unknown cross-section within the
extrapolated area. As of yet, TWDB has been unable to test this assumption, and therefore
can only assume that the results of the usage of the line extrapolation method are “more
accurate” than those derived without line extrapolation. For the purpose of estimating the
volume of water within Lake LBJ, the line extrapolation method is justified in that it
produces a reasonable representation of reservoir bathymetry in the shallow areas
15
accessible by TWDB survey vessels. The use of a V-shaped extrapolated cross-section
likely provides a conservative estimate of the water volume in un-surveyed areas, as most
surveyed cross-sections within Lake LBJ have shapes more similar to U-profiles than to
V-profiles. The V-profiles are thus conservative in that a greater volume of water is
implied by a U-profile than a V-profile. Further information on the line extrapolation
method is provided in the HydroEdit User’s Manual.12
Survey Results
Volumetric Survey
The results of the TWDB 2007 Volumetric Survey indicate Lake LBJ has a
total reservoir capacity of 133,090 acre-feet and encompasses 6,273 acres at
conservation pool elevation (825.68 feet NAVD 88). Per data provided by LCRA13,14,
the capacity of Lake LBJ in 1951 was estimated at 138,460 acre-feet and in 1995 at
134,353 acre-feet. After applying the self-similar and line extrapolation techniques to the
LCRA-collected survey data from 1995 and using 1995 aerial photos to define the lake
boundary, TWDB revised the 1995 capacity estimate to 135,421 acre-feet. Table 2
provides a summary of these results.
Table 2 – Comparisons of Historical CPE Volumes of Lake LBJ
Time Interval
(years) Capacity Loss
(acre-ft) Loss Rate
(acre-ft/year)
Year Capacity (acre-ft) Total* Recent* Total* Recent* Total* Recent*
1951 138,460 -- -- -- -- -- -- 1995 Revised 135,421 45 -- 3,309 -- 67.5 -- 2007 133,090 57 13 5,370 2,331 94.2 179.3 * Total refers to changes from 1951 to the time of interest, Recent refers to changes from 1995 to 2007.
Analysis of the data presented in Table 2 suggests that the rate of capacity loss
(due to sediment accumulation) has nearly tripled during the period from 1995 to 2007
when compared with the period from 1951 to 1995. This increase in sediment
accumulation rates may be attributed to increased development within the Lake LBJ
watershed, although verification of this hypothesis was not attempted within the scope of
this project. Alternative explanations for the increase are that the lake capacities calculated
in 1951, 1995, and/or 2007 include significant error, thus making comparisons unreliable.
16
Sedimentation Survey
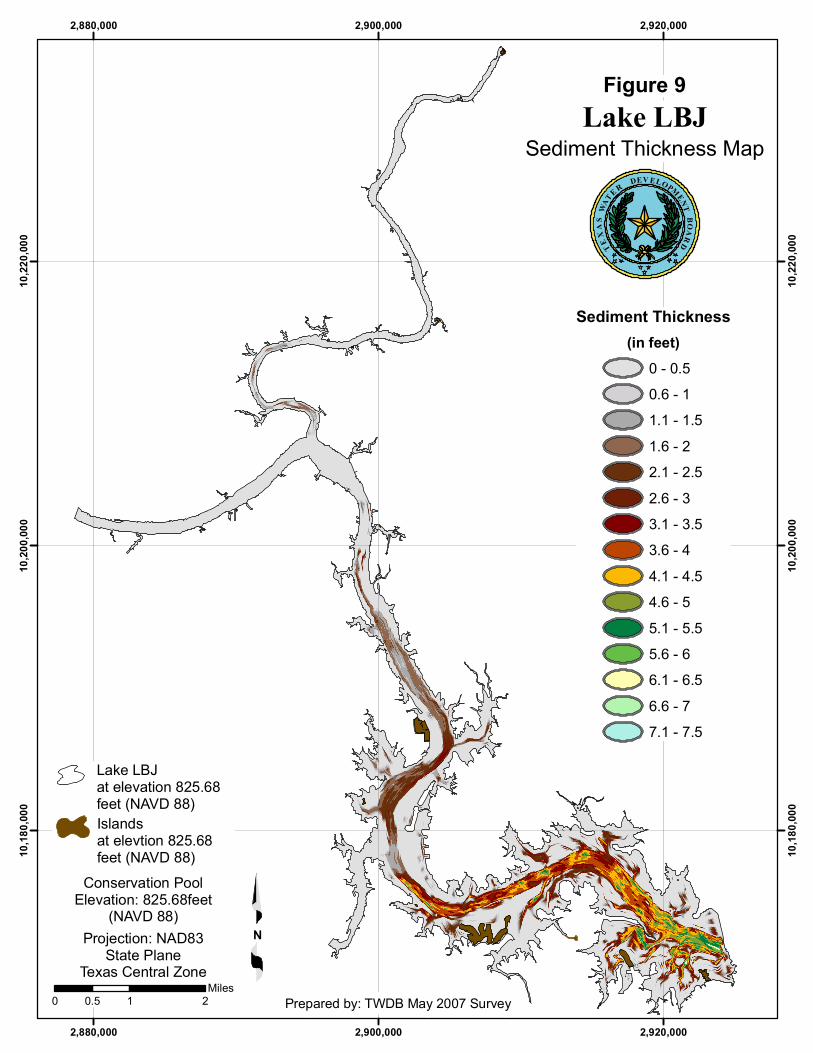
The 200 kHz, 50 kHz, and 24 kHz frequency data were used to interpret the
distribution and accumulation of sediment throughout Lake LBJ. Figure 9 shows the
thickness of sediment throughout the reservoir. To assist in the interpretation of post-
impoundment sediment accumulation, ancillary data was collected in the form of seven
core samples. Sediment cores were collected between July 9th, 2007 and August 1st, 2007
by Professor John Dunbar of Baylor University (under contract with TWDB). Cores were
collected using a Specialty Devices, Inc. VibraCore system and their content was analyzed
by Baylor University staff.
The results of the TWDB 2007 Sedimentation Survey indicate Lake LBJ has
accumulated 5,654 acre-feet of sediment since impoundment began in 1951. Based on
this measured sediment volume and assuming a constant sediment accumulation rate,
Lake LBJ loses approximately 100 acre-feet of capacity per year. This estimated loss rate
is consistent with that calculated from volume comparisons between the 2007 survey and
1951 capacity estimate (Table 2). The thickest sediment deposits are in the submerged river
channel throughout the main lake body, and sediment was not present in the Llano River arm,
Colorado River arm, or Sandy Creek arms of Lake LBJ. This sediment distribution suggests
incoming sediment quickly travels downstream within Lake LBJ, where it settles to the
bottom, upstream of Wirtz Dam. The maximum sediment thickness observed in Lake LBJ
was 7.1 feet. A complete description of the sediment measurement methodology and
sample results is presented in Appendix D.
The TWDB considers the 2007 survey to be significantly more accurate than
previous surveys and recommends that a similar methodology be used to resurvey Lake
LBJ in approximately 10 years, or after a major flood event. Results from such a survey
would allow the sediment accumulation rate for Lake LBJ to be quantified with greater
accuracy. Additional point estimates of sediment accumulation rates may also be obtained
through assessment of the Cesium-137 content within sediment cores.15
2,880,000
2,880,000
2,900,000
2,900,000
2,920,000
2,920,000
10,18
0,000
10,18
0,000
10,20
0,000
10,20
0,000
10,22
0,000
10,22
0,000
Lake LBJFigure 9
Sediment Thickness Map
Prepared by: TWDB May 2007 Survey
TEXAS
WATER DEV ELOPMENT
B OARD
N
Sediment Thickness(in feet)
0 - 0.50.6 - 11.1 - 1.51.6 - 22.1 - 2.52.6 - 33.1 - 3.53.6 - 44.1 - 4.54.6 - 55.1 - 5.55.6 - 66.1 - 6.56.6 - 77.1 - 7.5
Lake LBJat elevation 825.68feet (NAVD 88)Islandsat elevtion 825.68feet (NAVD 88)
0 1 20.5Miles
Conservation PoolElevation: 825.68feet
(NAVD 88)Projection: NAD83
State PlaneTexas Central Zone

18
TWDB Contact Information
More information about the Hydrographic Survey Program can be found at:
http://www.twdb.state.tx.us/assistance/lakesurveys/volumetricindex.asp
Any questions regarding the TWDB Hydrographic Survey Program may be addressed to:
Barney Austin, Ph.D., P.E. Director of the Surface Water Resources Division Phone: (512) 463-8856 Email: [email protected] Or Jason Kemp Team Leader, TWDB Hydrographic Survey Program Phone: (512) 463-2465 Email: [email protected]
19
References
1. Lower Colorado Regional Water Planning Group, Region K, 2006, LCWPG Water Plan, Chapter 3, http://www.twdb.state.tx.us/rwpg/2006_RWP/RegionK/Chapter%203.pdf
2. Lower Colorado River Authority, Water Management Plan for the Lower Colorado
River Basin, Effective September 20, 1989 Including Amendments Through May 14, 2003, http://www.lcra.org/docs/water_RevisedWMP.pdf
3. Lower Colorado Regional Water Planning Group, Region K, 2006, LCWPG Water
Plan, Chapter 4, http://www.twdb.state.tx.us/rwpg/2006_RWP/RegionK/Chapter%204.pdf 4. Texas Water Development Board, Report 126, “Engineering Data on Dams and
Reservoirs in Texas, Part III”, February 1971.
5. Lower Colorado River Authority, Wirtz Dam and Lake LBJ, viewed 25 November 2008, http://www.lcra.org/water/dams/wirtz.html
6. Lower Colorado River Authority, Thomas C. Ferguson Power Plant, viewed 25
November 2008, http://www.lcra.org/energy/power/facilities/ferguson.html 7. U.S. Geological Survey National Water Information System – Site 08045000,
http://waterdata.usgs.gov/tx/nwis/uv/?site_no=08045000 8. LCRA Spreadsheet “Highland Lake Vertical Datum.xls” provided by Melinda Luna,
LCRA in May 2007. Verified through personal comm. on November 15, 2008. 9. Texas Natural Resources Information System (TNRIS), viewed 31 October 2007,
http://www.tnris.state.tx.us/ 10. U.S Department of Agriculture, Farm Service Agency, Aerial Photography Field
Office, National Agriculture Imagery Program, viewed February 10, 2006 http://www.apfo.usda.gov/NAIP.html
11. ESRI, Environmental Systems Research Institute. 1995. ARC/INFO Surface Modeling
and Display, TIN Users Guide. 12. Furnans, Jordan. Texas Water Development Board. 2006. “HydroEdit User’s
Manual.” 13. Johnson, Coleen M. LCRA Surveying & Mapping. 1999 “Report on the History of the
Highland Lakes Capacity Tables”. Provided to TWDB by Melinda Luna, LCRA in 2006.
14. LCRA Spreadsheet “Lake_Capacity_Tables.xls” provided by Melinda Luna, LCRA in
May 2007. Verified through personal comm. on November 15, 2008. 15. Furnans, Jordan. Texas Water Development Board. 2009. “TWDB Hydrographic
Assessment Project Report” (Under Development)
ELEVATION in Feet 0.0 0.1 0.2 0.3 0.4 0.5 0.6 0.7 0.8 0.9
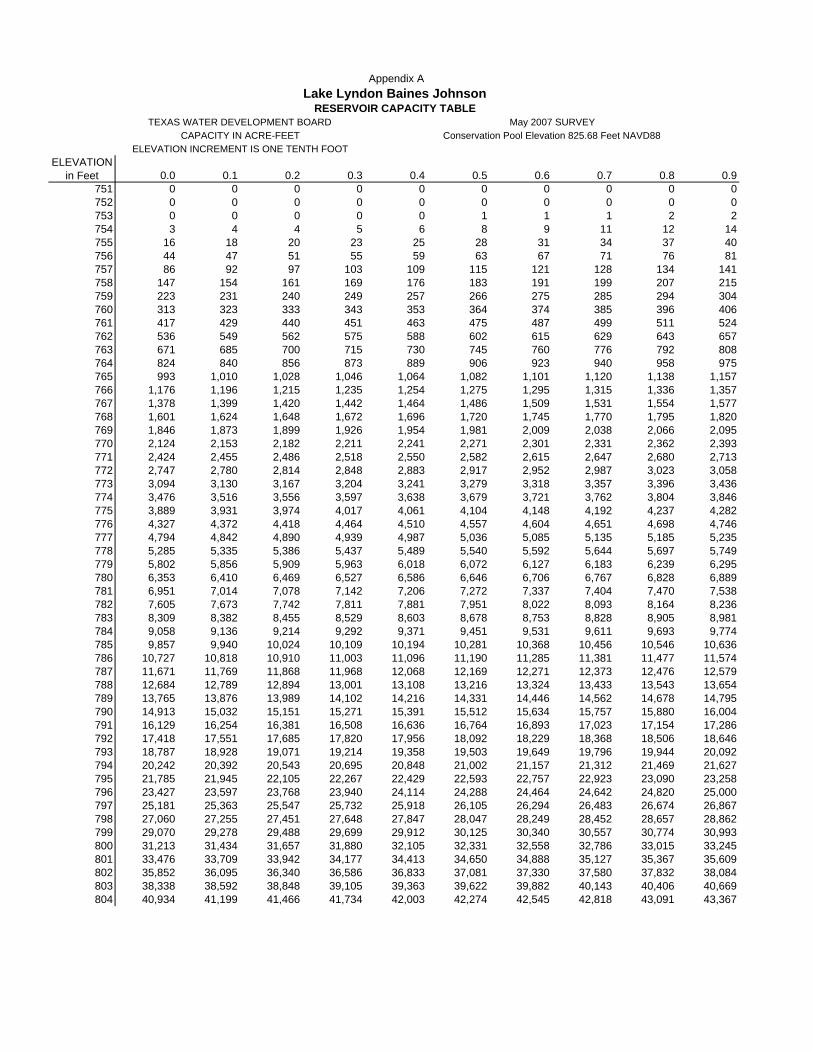
751 0 0 0 0 0 0 0 0 0 0752 0 0 0 0 0 0 0 0 0 0753 0 0 0 0 0 1 1 1 2 2754 3 4 4 5 6 8 9 11 12 14755 16 18 20 23 25 28 31 34 37 40756 44 47 51 55 59 63 67 71 76 81757 86 92 97 103 109 115 121 128 134 141758 147 154 161 169 176 183 191 199 207 215759 223 231 240 249 257 266 275 285 294 304760 313 323 333 343 353 364 374 385 396 406761 417 429 440 451 463 475 487 499 511 524762 536 549 562 575 588 602 615 629 643 657763 671 685 700 715 730 745 760 776 792 808764 824 840 856 873 889 906 923 940 958 975765 993 1,010 1,028 1,046 1,064 1,082 1,101 1,120 1,138 1,157766 1,176 1,196 1,215 1,235 1,254 1,275 1,295 1,315 1,336 1,357767 1,378 1,399 1,420 1,442 1,464 1,486 1,509 1,531 1,554 1,577768 1,601 1,624 1,648 1,672 1,696 1,720 1,745 1,770 1,795 1,820769 1,846 1,873 1,899 1,926 1,954 1,981 2,009 2,038 2,066 2,095770 2,124 2,153 2,182 2,211 2,241 2,271 2,301 2,331 2,362 2,393771 2,424 2,455 2,486 2,518 2,550 2,582 2,615 2,647 2,680 2,713772 2,747 2,780 2,814 2,848 2,883 2,917 2,952 2,987 3,023 3,058773 3,094 3,130 3,167 3,204 3,241 3,279 3,318 3,357 3,396 3,436774 3,476 3,516 3,556 3,597 3,638 3,679 3,721 3,762 3,804 3,846775 3,889 3,931 3,974 4,017 4,061 4,104 4,148 4,192 4,237 4,282776 4,327 4,372 4,418 4,464 4,510 4,557 4,604 4,651 4,698 4,746777 4,794 4,842 4,890 4,939 4,987 5,036 5,085 5,135 5,185 5,235778 5,285 5,335 5,386 5,437 5,489 5,540 5,592 5,644 5,697 5,749779 5,802 5,856 5,909 5,963 6,018 6,072 6,127 6,183 6,239 6,295780 6,353 6,410 6,469 6,527 6,586 6,646 6,706 6,767 6,828 6,889781 6,951 7,014 7,078 7,142 7,206 7,272 7,337 7,404 7,470 7,538782 7,605 7,673 7,742 7,811 7,881 7,951 8,022 8,093 8,164 8,236783 8,309 8,382 8,455 8,529 8,603 8,678 8,753 8,828 8,905 8,981784 9,058 9,136 9,214 9,292 9,371 9,451 9,531 9,611 9,693 9,774785 9,857 9,940 10,024 10,109 10,194 10,281 10,368 10,456 10,546 10,636786 10,727 10,818 10,910 11,003 11,096 11,190 11,285 11,381 11,477 11,574787 11,671 11,769 11,868 11,968 12,068 12,169 12,271 12,373 12,476 12,579788 12,684 12,789 12,894 13,001 13,108 13,216 13,324 13,433 13,543 13,654789 13,765 13,876 13,989 14,102 14,216 14,331 14,446 14,562 14,678 14,795790 14,913 15,032 15,151 15,271 15,391 15,512 15,634 15,757 15,880 16,004791 16,129 16,254 16,381 16,508 16,636 16,764 16,893 17,023 17,154 17,286792 17,418 17,551 17,685 17,820 17,956 18,092 18,229 18,368 18,506 18,646793 18,787 18,928 19,071 19,214 19,358 19,503 19,649 19,796 19,944 20,092794 20,242 20,392 20,543 20,695 20,848 21,002 21,157 21,312 21,469 21,627795 21,785 21,945 22,105 22,267 22,429 22,593 22,757 22,923 23,090 23,258796 23,427 23,597 23,768 23,940 24,114 24,288 24,464 24,642 24,820 25,000797 25,181 25,363 25,547 25,732 25,918 26,105 26,294 26,483 26,674 26,867798 27,060 27,255 27,451 27,648 27,847 28,047 28,249 28,452 28,657 28,862799 29,070 29,278 29,488 29,699 29,912 30,125 30,340 30,557 30,774 30,993800 31,213 31,434 31,657 31,880 32,105 32,331 32,558 32,786 33,015 33,245801 33,476 33,709 33,942 34,177 34,413 34,650 34,888 35,127 35,367 35,609802 35,852 36,095 36,340 36,586 36,833 37,081 37,330 37,580 37,832 38,084803 38,338 38,592 38,848 39,105 39,363 39,622 39,882 40,143 40,406 40,669804 40,934 41,199 41,466 41,734 42,003 42,274 42,545 42,818 43,091 43,367
Appendix ALake Lyndon Baines Johnson
RESERVOIR CAPACITY TABLETEXAS WATER DEVELOPMENT BOARD May 2007 SURVEY
CAPACITY IN ACRE-FEET Conservation Pool Elevation 825.68 Feet NAVD88ELEVATION INCREMENT IS ONE TENTH FOOT
ELEVATION in Feet 0.0 0.1 0.2 0.3 0.4 0.5 0.6 0.7 0.8 0.9
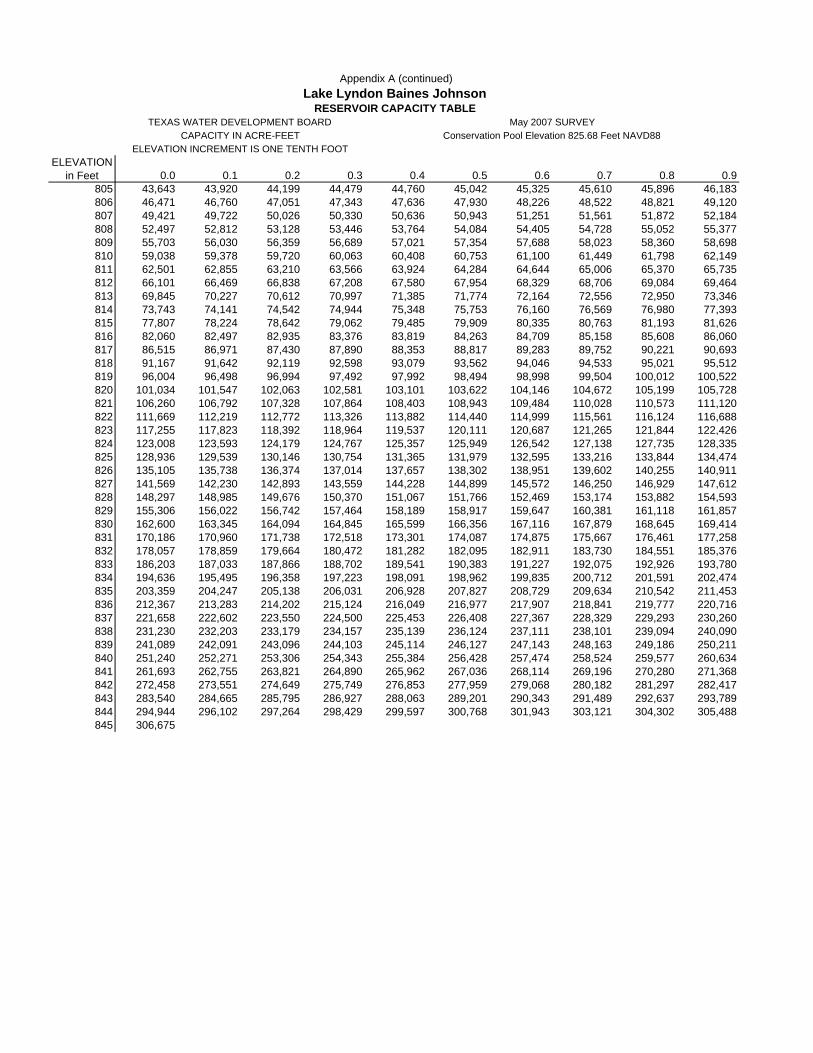
805 43,643 43,920 44,199 44,479 44,760 45,042 45,325 45,610 45,896 46,183806 46,471 46,760 47,051 47,343 47,636 47,930 48,226 48,522 48,821 49,120807 49,421 49,722 50,026 50,330 50,636 50,943 51,251 51,561 51,872 52,184808 52,497 52,812 53,128 53,446 53,764 54,084 54,405 54,728 55,052 55,377809 55,703 56,030 56,359 56,689 57,021 57,354 57,688 58,023 58,360 58,698810 59,038 59,378 59,720 60,063 60,408 60,753 61,100 61,449 61,798 62,149811 62,501 62,855 63,210 63,566 63,924 64,284 64,644 65,006 65,370 65,735812 66,101 66,469 66,838 67,208 67,580 67,954 68,329 68,706 69,084 69,464813 69,845 70,227 70,612 70,997 71,385 71,774 72,164 72,556 72,950 73,346814 73,743 74,141 74,542 74,944 75,348 75,753 76,160 76,569 76,980 77,393815 77,807 78,224 78,642 79,062 79,485 79,909 80,335 80,763 81,193 81,626816 82,060 82,497 82,935 83,376 83,819 84,263 84,709 85,158 85,608 86,060817 86,515 86,971 87,430 87,890 88,353 88,817 89,283 89,752 90,221 90,693818 91,167 91,642 92,119 92,598 93,079 93,562 94,046 94,533 95,021 95,512819 96,004 96,498 96,994 97,492 97,992 98,494 98,998 99,504 100,012 100,522820 101,034 101,547 102,063 102,581 103,101 103,622 104,146 104,672 105,199 105,728821 106,260 106,792 107,328 107,864 108,403 108,943 109,484 110,028 110,573 111,120822 111,669 112,219 112,772 113,326 113,882 114,440 114,999 115,561 116,124 116,688823 117,255 117,823 118,392 118,964 119,537 120,111 120,687 121,265 121,844 122,426824 123,008 123,593 124,179 124,767 125,357 125,949 126,542 127,138 127,735 128,335825 128,936 129,539 130,146 130,754 131,365 131,979 132,595 133,216 133,844 134,474826 135,105 135,738 136,374 137,014 137,657 138,302 138,951 139,602 140,255 140,911827 141,569 142,230 142,893 143,559 144,228 144,899 145,572 146,250 146,929 147,612828 148,297 148,985 149,676 150,370 151,067 151,766 152,469 153,174 153,882 154,593829 155,306 156,022 156,742 157,464 158,189 158,917 159,647 160,381 161,118 161,857830 162,600 163,345 164,094 164,845 165,599 166,356 167,116 167,879 168,645 169,414831 170,186 170,960 171,738 172,518 173,301 174,087 174,875 175,667 176,461 177,258832 178,057 178,859 179,664 180,472 181,282 182,095 182,911 183,730 184,551 185,376833 186,203 187,033 187,866 188,702 189,541 190,383 191,227 192,075 192,926 193,780834 194,636 195,495 196,358 197,223 198,091 198,962 199,835 200,712 201,591 202,474835 203,359 204,247 205,138 206,031 206,928 207,827 208,729 209,634 210,542 211,453836 212,367 213,283 214,202 215,124 216,049 216,977 217,907 218,841 219,777 220,716837 221,658 222,602 223,550 224,500 225,453 226,408 227,367 228,329 229,293 230,260838 231,230 232,203 233,179 234,157 235,139 236,124 237,111 238,101 239,094 240,090839 241,089 242,091 243,096 244,103 245,114 246,127 247,143 248,163 249,186 250,211840 251,240 252,271 253,306 254,343 255,384 256,428 257,474 258,524 259,577 260,634841 261,693 262,755 263,821 264,890 265,962 267,036 268,114 269,196 270,280 271,368842 272,458 273,551 274,649 275,749 276,853 277,959 279,068 280,182 281,297 282,417843 283,540 284,665 285,795 286,927 288,063 289,201 290,343 291,489 292,637 293,789844 294,944 296,102 297,264 298,429 299,597 300,768 301,943 303,121 304,302 305,488845 306,675
Appendix A (continued)Lake Lyndon Baines Johnson
RESERVOIR CAPACITY TABLETEXAS WATER DEVELOPMENT BOARD May 2007 SURVEY
CAPACITY IN ACRE-FEET Conservation Pool Elevation 825.68 Feet NAVD88ELEVATION INCREMENT IS ONE TENTH FOOT
ELEVATION in Feet 0.0 0.1 0.2 0.3 0.4 0.5 0.6 0.7 0.8 0.9
751 0 0 0 0 0 0 0 0 0 0752 0 0 0 0 0 0 0 0 0 0753 0 1 1 2 2 3 3 4 5 5754 6 7 9 10 12 13 15 16 18 19755 21 22 23 25 26 28 29 31 32 33756 35 36 37 38 40 41 44 46 48 50757 52 54 57 59 60 62 63 64 66 67758 68 70 71 73 74 76 77 78 80 81759 83 85 86 87 89 90 92 93 94 96760 97 98 100 102 103 104 106 107 108 110761 111 113 114 115 117 119 120 122 123 125762 127 128 130 132 133 135 137 138 139 141763 143 145 147 149 151 153 155 157 159 160764 162 163 165 166 168 169 170 172 173 175765 176 178 179 181 182 184 185 187 189 190766 192 194 195 197 199 201 203 205 207 209767 212 214 216 219 221 223 225 227 229 231768 234 236 238 240 242 245 247 251 254 257769 261 265 268 272 275 278 280 283 286 288770 290 292 294 296 298 300 302 304 306 308771 311 314 316 319 321 323 326 328 330 332772 335 337 340 342 345 347 350 352 355 358773 361 364 368 372 378 384 388 392 395 397774 400 403 405 408 410 413 415 418 420 423775 425 427 430 432 435 437 440 443 446 449776 452 456 459 462 465 468 470 473 475 477777 479 482 484 486 489 491 493 496 498 501778 504 506 509 512 515 517 520 523 526 529779 532 535 538 542 545 548 552 556 561 569780 576 580 585 589 593 598 602 608 613 619781 626 632 638 644 649 654 659 664 670 675782 680 685 690 694 699 704 708 713 717 722783 726 731 736 740 745 749 754 759 764 769784 773 778 782 787 791 797 803 810 816 822785 829 836 843 850 859 868 879 889 897 904786 911 917 924 931 938 945 951 958 965 972787 979 986 992 999 1,006 1,012 1,019 1,026 1,032 1,039788 1,046 1,053 1,061 1,068 1,075 1,082 1,088 1,095 1,101 1,108789 1,114 1,121 1,128 1,135 1,142 1,149 1,156 1,162 1,169 1,175790 1,182 1,188 1,195 1,202 1,208 1,215 1,222 1,229 1,237 1,244791 1,252 1,259 1,267 1,274 1,281 1,289 1,296 1,304 1,312 1,320792 1,328 1,336 1,344 1,352 1,360 1,369 1,377 1,385 1,393 1,402793 1,410 1,419 1,429 1,438 1,446 1,455 1,464 1,472 1,481 1,490794 1,499 1,507 1,516 1,525 1,534 1,543 1,552 1,561 1,571 1,580795 1,590 1,600 1,610 1,620 1,631 1,641 1,652 1,662 1,673 1,683796 1,694 1,705 1,718 1,729 1,741 1,753 1,766 1,779 1,791 1,804797 1,817 1,830 1,842 1,855 1,867 1,879 1,891 1,904 1,916 1,929798 1,942 1,954 1,968 1,981 1,995 2,009 2,023 2,038 2,052 2,065799 2,079 2,092 2,105 2,118 2,131 2,144 2,156 2,169 2,182 2,195800 2,207 2,219 2,230 2,241 2,252 2,263 2,275 2,286 2,297 2,308801 2,319 2,330 2,341 2,352 2,364 2,375 2,387 2,398 2,410 2,421802 2,432 2,443 2,453 2,464 2,475 2,486 2,497 2,508 2,519 2,530803 2,541 2,552 2,563 2,574 2,585 2,596 2,607 2,618 2,629 2,640804 2,651 2,662 2,674 2,685 2,697 2,708 2,720 2,732 2,744 2,756
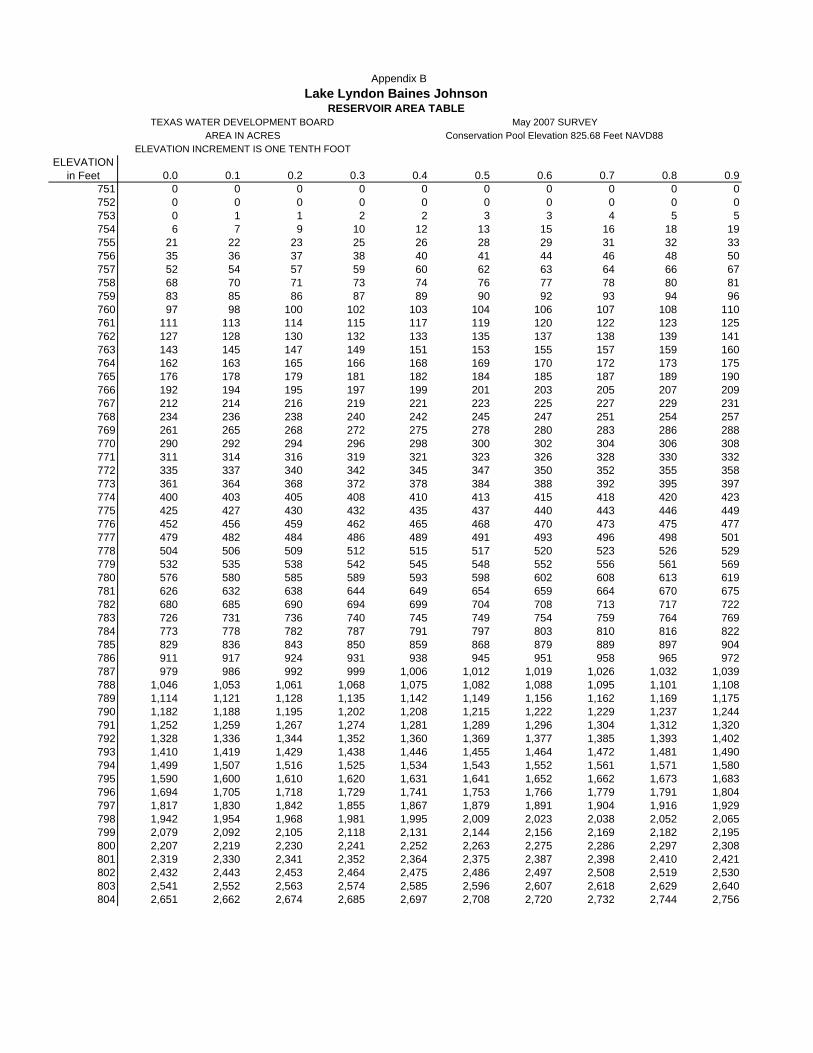
Appendix BLake Lyndon Baines Johnson
RESERVOIR AREA TABLEMay 2007 SURVEY
ELEVATION INCREMENT IS ONE TENTH FOOTConservation Pool Elevation 825.68 Feet NAVD88
TEXAS WATER DEVELOPMENT BOARDAREA IN ACRES
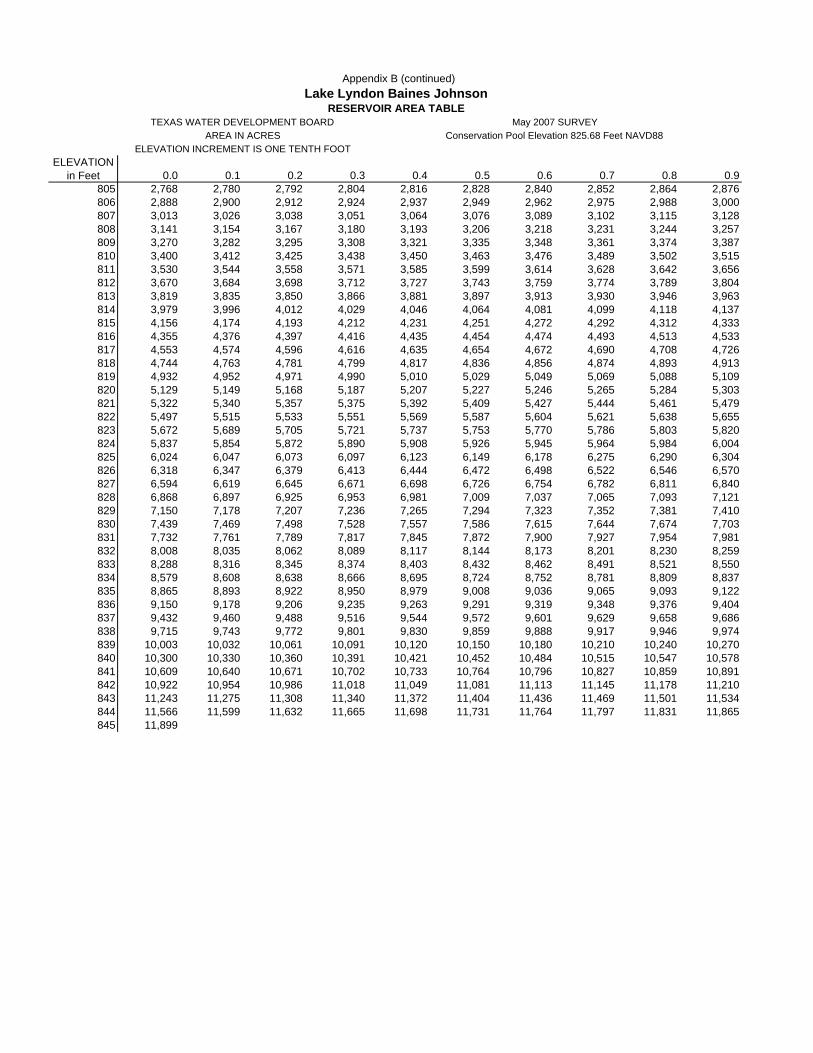
ELEVATION in Feet 0.0 0.1 0.2 0.3 0.4 0.5 0.6 0.7 0.8 0.9
805 2,768 2,780 2,792 2,804 2,816 2,828 2,840 2,852 2,864 2,876806 2,888 2,900 2,912 2,924 2,937 2,949 2,962 2,975 2,988 3,000807 3,013 3,026 3,038 3,051 3,064 3,076 3,089 3,102 3,115 3,128808 3,141 3,154 3,167 3,180 3,193 3,206 3,218 3,231 3,244 3,257809 3,270 3,282 3,295 3,308 3,321 3,335 3,348 3,361 3,374 3,387810 3,400 3,412 3,425 3,438 3,450 3,463 3,476 3,489 3,502 3,515811 3,530 3,544 3,558 3,571 3,585 3,599 3,614 3,628 3,642 3,656812 3,670 3,684 3,698 3,712 3,727 3,743 3,759 3,774 3,789 3,804813 3,819 3,835 3,850 3,866 3,881 3,897 3,913 3,930 3,946 3,963814 3,979 3,996 4,012 4,029 4,046 4,064 4,081 4,099 4,118 4,137815 4,156 4,174 4,193 4,212 4,231 4,251 4,272 4,292 4,312 4,333816 4,355 4,376 4,397 4,416 4,435 4,454 4,474 4,493 4,513 4,533817 4,553 4,574 4,596 4,616 4,635 4,654 4,672 4,690 4,708 4,726818 4,744 4,763 4,781 4,799 4,817 4,836 4,856 4,874 4,893 4,913819 4,932 4,952 4,971 4,990 5,010 5,029 5,049 5,069 5,088 5,109820 5,129 5,149 5,168 5,187 5,207 5,227 5,246 5,265 5,284 5,303821 5,322 5,340 5,357 5,375 5,392 5,409 5,427 5,444 5,461 5,479822 5,497 5,515 5,533 5,551 5,569 5,587 5,604 5,621 5,638 5,655823 5,672 5,689 5,705 5,721 5,737 5,753 5,770 5,786 5,803 5,820824 5,837 5,854 5,872 5,890 5,908 5,926 5,945 5,964 5,984 6,004825 6,024 6,047 6,073 6,097 6,123 6,149 6,178 6,275 6,290 6,304826 6,318 6,347 6,379 6,413 6,444 6,472 6,498 6,522 6,546 6,570827 6,594 6,619 6,645 6,671 6,698 6,726 6,754 6,782 6,811 6,840828 6,868 6,897 6,925 6,953 6,981 7,009 7,037 7,065 7,093 7,121829 7,150 7,178 7,207 7,236 7,265 7,294 7,323 7,352 7,381 7,410830 7,439 7,469 7,498 7,528 7,557 7,586 7,615 7,644 7,674 7,703831 7,732 7,761 7,789 7,817 7,845 7,872 7,900 7,927 7,954 7,981832 8,008 8,035 8,062 8,089 8,117 8,144 8,173 8,201 8,230 8,259833 8,288 8,316 8,345 8,374 8,403 8,432 8,462 8,491 8,521 8,550834 8,579 8,608 8,638 8,666 8,695 8,724 8,752 8,781 8,809 8,837835 8,865 8,893 8,922 8,950 8,979 9,008 9,036 9,065 9,093 9,122836 9,150 9,178 9,206 9,235 9,263 9,291 9,319 9,348 9,376 9,404837 9,432 9,460 9,488 9,516 9,544 9,572 9,601 9,629 9,658 9,686838 9,715 9,743 9,772 9,801 9,830 9,859 9,888 9,917 9,946 9,974839 10,003 10,032 10,061 10,091 10,120 10,150 10,180 10,210 10,240 10,270840 10,300 10,330 10,360 10,391 10,421 10,452 10,484 10,515 10,547 10,578841 10,609 10,640 10,671 10,702 10,733 10,764 10,796 10,827 10,859 10,891842 10,922 10,954 10,986 11,018 11,049 11,081 11,113 11,145 11,178 11,210843 11,243 11,275 11,308 11,340 11,372 11,404 11,436 11,469 11,501 11,534844 11,566 11,599 11,632 11,665 11,698 11,731 11,764 11,797 11,831 11,865845 11,899
ELEVATION INCREMENT IS ONE TENTH FOOT
TEXAS WATER DEVELOPMENT BOARD May 2007 SURVEYAREA IN ACRES Conservation Pool Elevation 825.68 Feet NAVD88
Appendix B (continued)Lake Lyndon Baines Johnson
RESERVOIR AREA TABLE
750.0
760.0
770.0
780.0
790.0
800.0
810.0
820.0
830.0
840.0
850.0
0 20,000 40,000 60,000 80,000 100,000 120,000 140,000 160,000 180,000 200,000 220,000 240,000 260,000 280,000 300,000Storage Capacity (acre-feet)
Elev
atio
n (fe
et N
AVD
88)
750.0
760.0
770.0
780.0
790.0
800.0
810.0
820.0
830.0
840.0
850.001,0002,0003,0004,0005,0006,0007,0008,0009,00010,00011,00012,000
Area (acres)
Elev
atio
n (fe
et N
AVD
88)
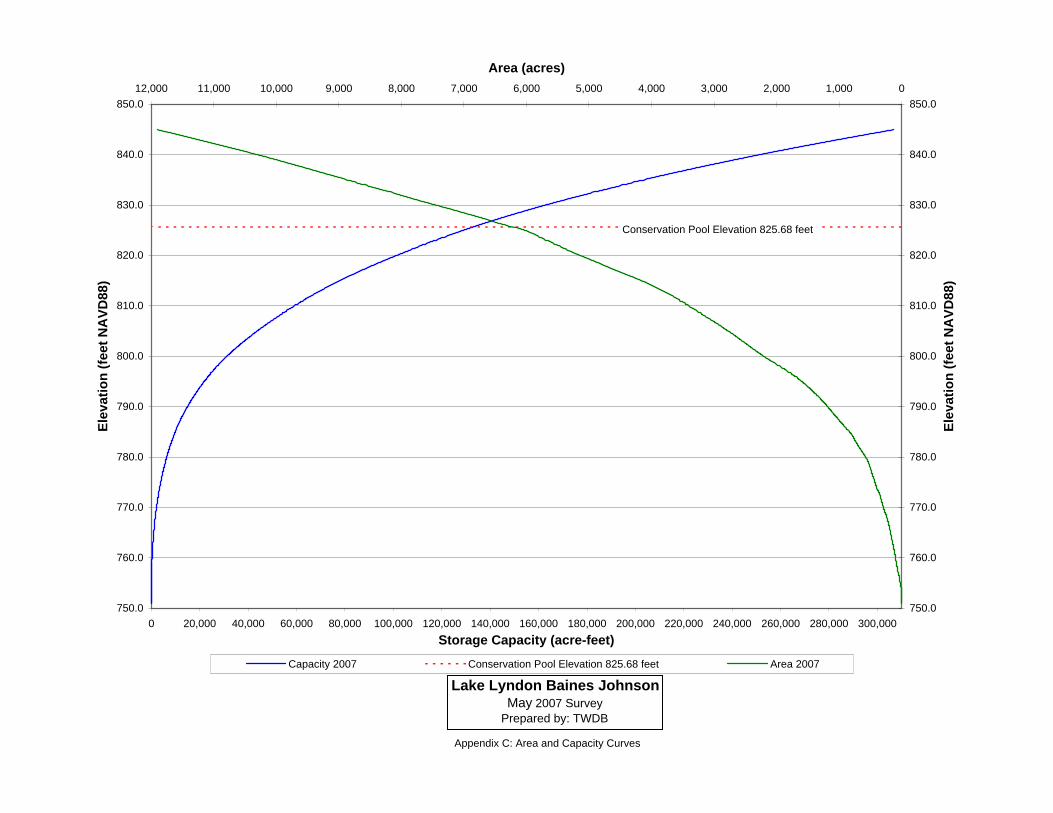
Capacity 2007 Conservation Pool Elevation 825.68 feet Area 2007
Lake Lyndon Baines JohnsonMay 2007 Survey
Prepared by: TWDB
Appendix C: Area and Capacity Curves
Conservation Pool Elevation 825.68 feet
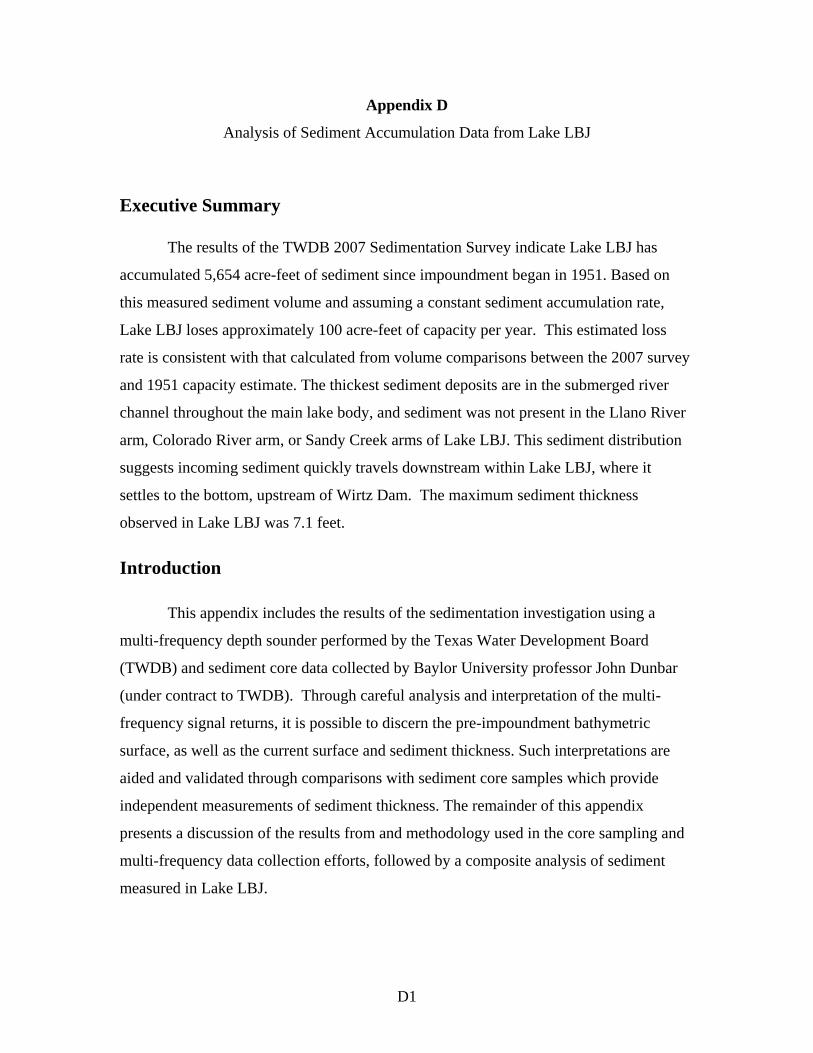
Appendix D
Analysis of Sediment Accumulation Data from Lake LBJ
Executive Summary
The results of the TWDB 2007 Sedimentation Survey indicate Lake LBJ has
accumulated 5,654 acre-feet of sediment since impoundment began in 1951. Based on
this measured sediment volume and assuming a constant sediment accumulation rate,
Lake LBJ loses approximately 100 acre-feet of capacity per year. This estimated loss
rate is consistent with that calculated from volume comparisons between the 2007 survey
and 1951 capacity estimate. The thickest sediment deposits are in the submerged river
channel throughout the main lake body, and sediment was not present in the Llano River
arm, Colorado River arm, or Sandy Creek arms of Lake LBJ. This sediment distribution
suggests incoming sediment quickly travels downstream within Lake LBJ, where it
settles to the bottom, upstream of Wirtz Dam. The maximum sediment thickness
observed in Lake LBJ was 7.1 feet.
Introduction
This appendix includes the results of the sedimentation investigation using a
multi-frequency depth sounder performed by the Texas Water Development Board
(TWDB) and sediment core data collected by Baylor University professor John Dunbar
(under contract to TWDB). Through careful analysis and interpretation of the multi-
frequency signal returns, it is possible to discern the pre-impoundment bathymetric
surface, as well as the current surface and sediment thickness. Such interpretations are
aided and validated through comparisons with sediment core samples which provide
independent measurements of sediment thickness. The remainder of this appendix
presents a discussion of the results from and methodology used in the core sampling and
multi-frequency data collection efforts, followed by a composite analysis of sediment
measured in Lake LBJ.
D1
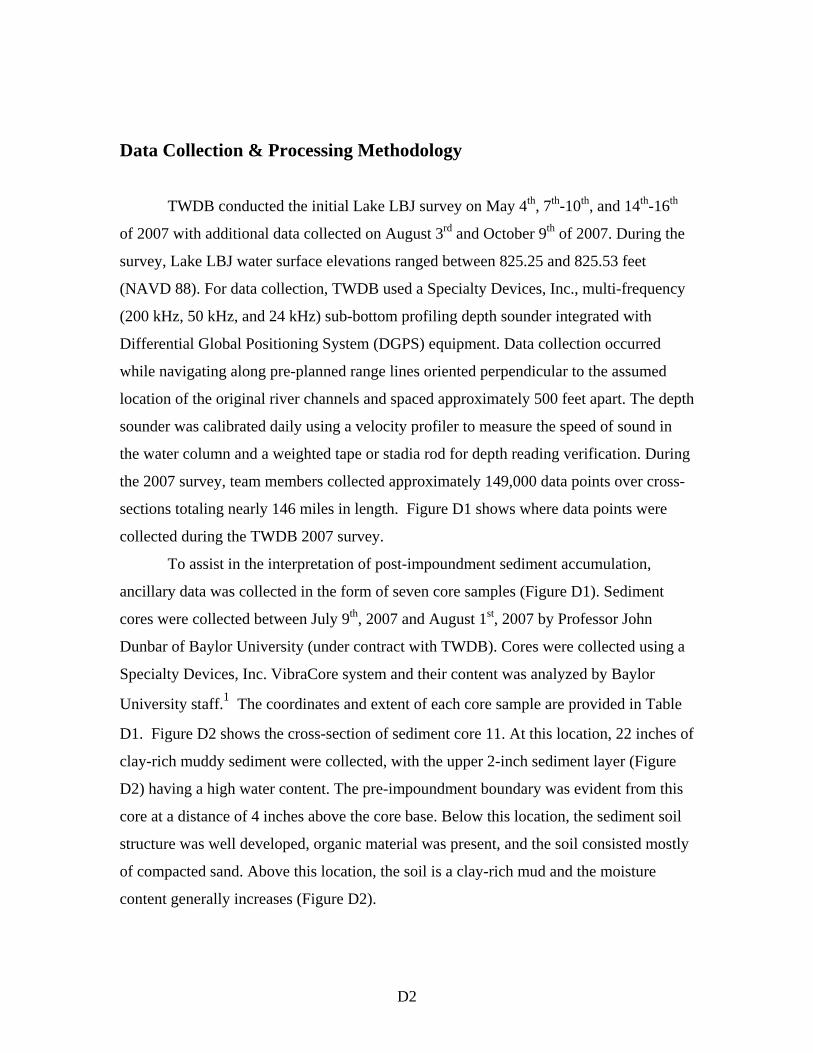
Data Collection & Processing Methodology TWDB conducted the initial Lake LBJ survey on May 4th, 7th-10th, and 14th-16th
of 2007 with additional data collected on August 3rd and October 9th of 2007. During the
survey, Lake LBJ water surface elevations ranged between 825.25 and 825.53 feet
(NAVD 88). For data collection, TWDB used a Specialty Devices, Inc., multi-frequency
(200 kHz, 50 kHz, and 24 kHz) sub-bottom profiling depth sounder integrated with
Differential Global Positioning System (DGPS) equipment. Data collection occurred
while navigating along pre-planned range lines oriented perpendicular to the assumed
location of the original river channels and spaced approximately 500 feet apart. The depth
sounder was calibrated daily using a velocity profiler to measure the speed of sound in
the water column and a weighted tape or stadia rod for depth reading verification. During
the 2007 survey, team members collected approximately 149,000 data points over cross-
sections totaling nearly 146 miles in length. Figure D1 shows where data points were
collected during the TWDB 2007 survey.
To assist in the interpretation of post-impoundment sediment accumulation,
ancillary data was collected in the form of seven core samples (Figure D1). Sediment
cores were collected between July 9th, 2007 and August 1st, 2007 by Professor John
Dunbar of Baylor University (under contract with TWDB). Cores were collected using a
Specialty Devices, Inc. VibraCore system and their content was analyzed by Baylor
University staff.1 The coordinates and extent of each core sample are provided in Table
D1. Figure D2 shows the cross-section of sediment core 11. At this location, 22 inches of
clay-rich muddy sediment were collected, with the upper 2-inch sediment layer (Figure
D2) having a high water content. The pre-impoundment boundary was evident from this
core at a distance of 4 inches above the core base. Below this location, the sediment soil
structure was well developed, organic material was present, and the soil consisted mostly
of compacted sand. Above this location, the soil is a clay-rich mud and the moisture
content generally increases (Figure D2).
D2
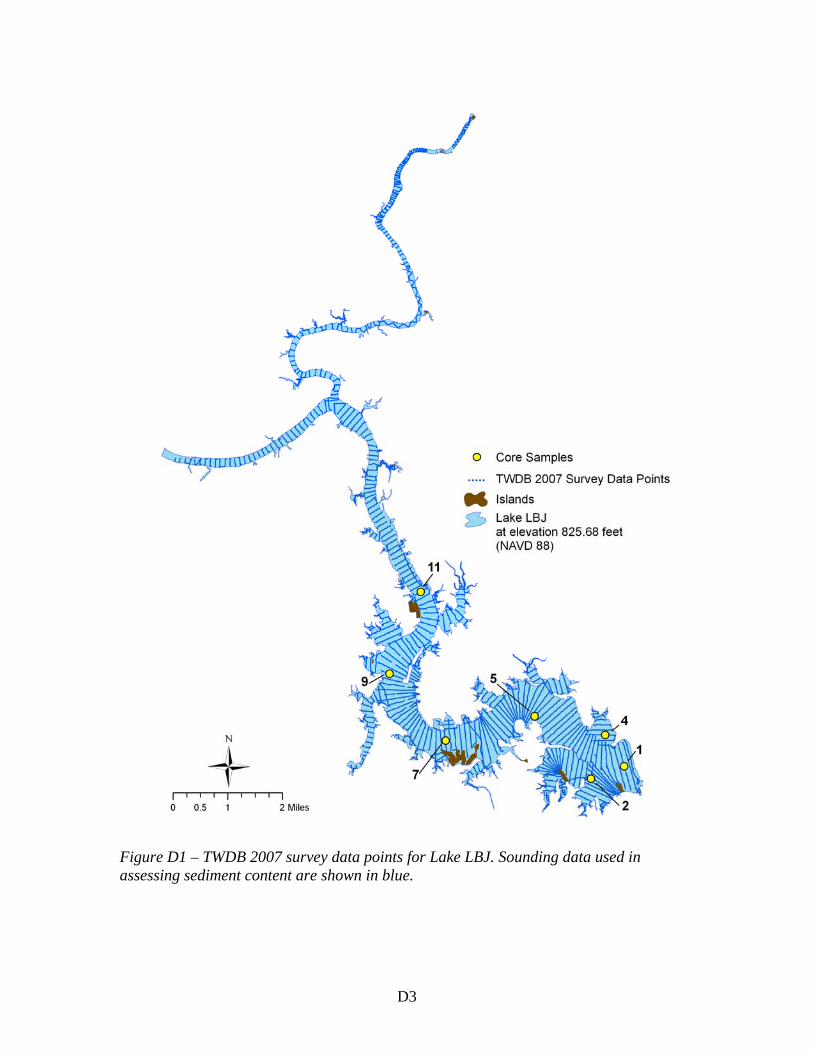
Figure D1 – TWDB 2007 survey data points for Lake LBJ. Sounding data used in assessing sediment content are shown in blue.
D3
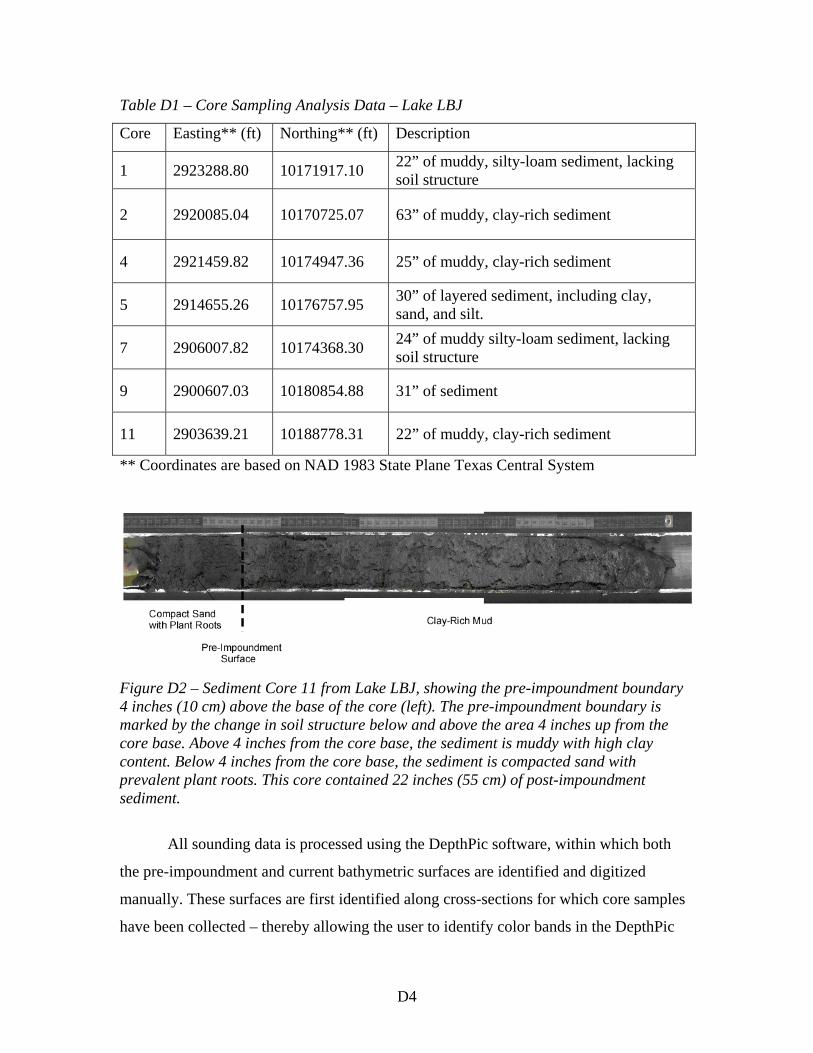
Table D1 – Core Sampling Analysis Data – Lake LBJ
Core Easting** (ft) Northing** (ft) Description
1 2923288.80 10171917.10 22” of muddy, silty-loam sediment, lacking soil structure
2 2920085.04 10170725.07 63” of muddy, clay-rich sediment
4 2921459.82 10174947.36 25” of muddy, clay-rich sediment
5 2914655.26 10176757.95 30” of layered sediment, including clay, sand, and silt.
7 2906007.82 10174368.30 24” of muddy silty-loam sediment, lacking soil structure
9 2900607.03 10180854.88 31” of sediment
11 2903639.21 10188778.31 22” of muddy, clay-rich sediment
** Coordinates are based on NAD 1983 State Plane Texas Central System
Figure D2 – Sediment Core 11 from Lake LBJ, showing the pre-impoundment boundary 4 inches (10 cm) above the base of the core (left). The pre-impoundment boundary is marked by the change in soil structure below and above the area 4 inches up from the core base. Above 4 inches from the core base, the sediment is muddy with high clay content. Below 4 inches from the core base, the sediment is compacted sand with prevalent plant roots. This core contained 22 inches (55 cm) of post-impoundment sediment.
All sounding data is processed using the DepthPic software, within which both
the pre-impoundment and current bathymetric surfaces are identified and digitized
manually. These surfaces are first identified along cross-sections for which core samples
have been collected – thereby allowing the user to identify color bands in the DepthPic
D4
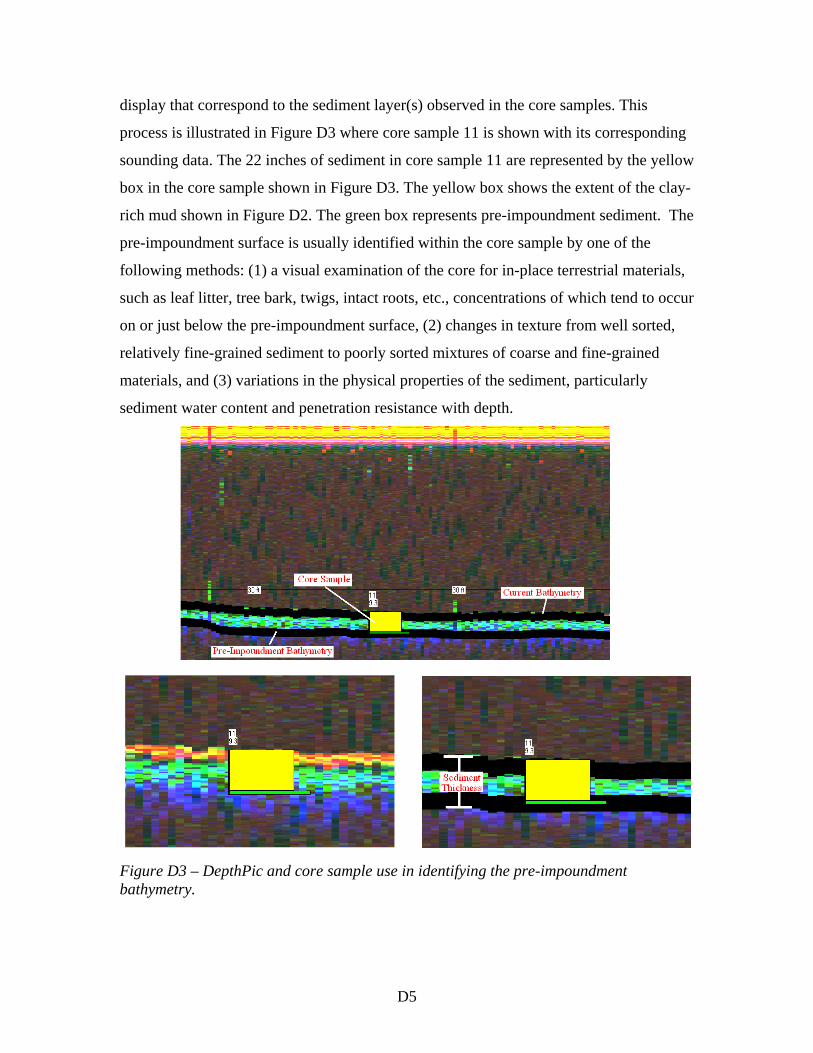
display that correspond to the sediment layer(s) observed in the core samples. This
process is illustrated in Figure D3 where core sample 11 is shown with its corresponding
sounding data. The 22 inches of sediment in core sample 11 are represented by the yellow
box in the core sample shown in Figure D3. The yellow box shows the extent of the clay-
rich mud shown in Figure D2. The green box represents pre-impoundment sediment. The
pre-impoundment surface is usually identified within the core sample by one of the
following methods: (1) a visual examination of the core for in-place terrestrial materials,
such as leaf litter, tree bark, twigs, intact roots, etc., concentrations of which tend to occur
on or just below the pre-impoundment surface, (2) changes in texture from well sorted,
relatively fine-grained sediment to poorly sorted mixtures of coarse and fine-grained
materials, and (3) variations in the physical properties of the sediment, particularly
sediment water content and penetration resistance with depth.
Figure D3 – DepthPic and core sample use in identifying the pre-impoundment bathymetry.
D5
Within DepthPic, the current surface is automatically determined based on the
signal returns from the 200 kHz transducer. The pre-impoundment surface must be
determined visually based on the pixel color display and any available core sample data.
Based on core sample 11, it is clear that the upper-most layer of sediment (with high
water content) is denoted by the band of bright yellow-orange pixels. The underlying
clay-rich muddy sediment with slightly less water content is denoted by the blue-green
pixels in the DepthMap display (Figure D3). The pre-impoundment bathymetric surface
for this cross-section is therefore identified as the base of the blue-green pixel band,
where the pixels in the DepthPic display transition to dark blue. The current bathymetric
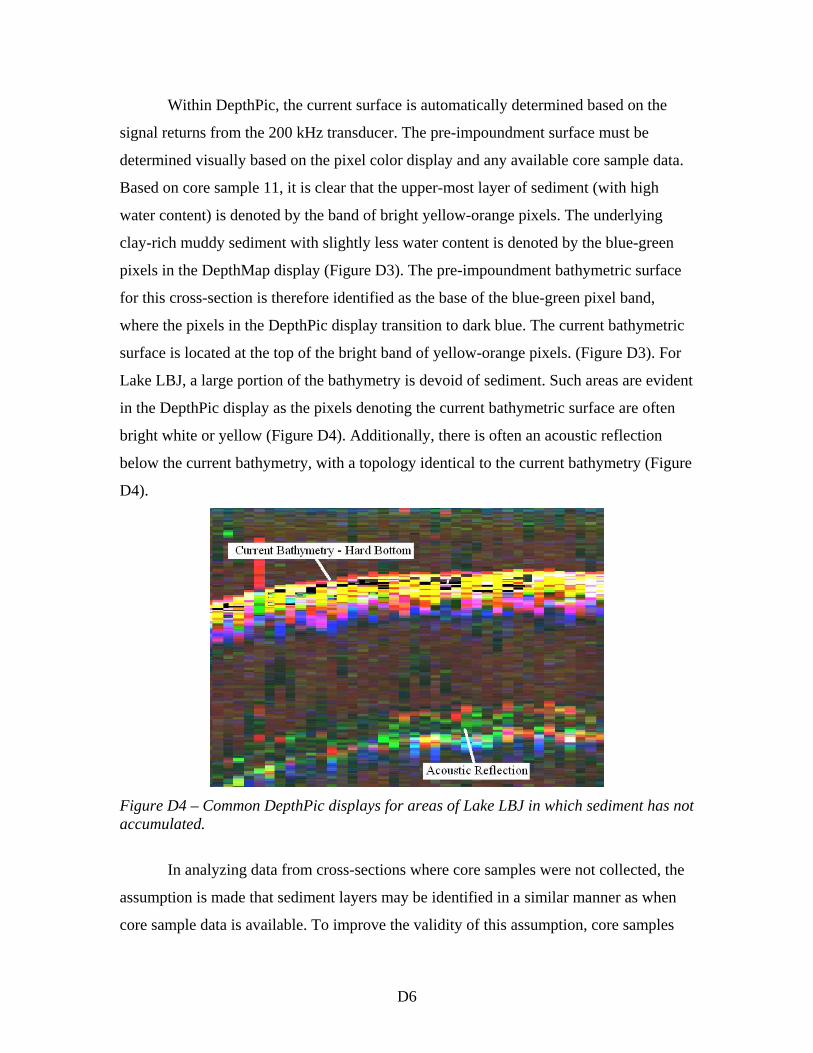
surface is located at the top of the bright band of yellow-orange pixels. (Figure D3). For
Lake LBJ, a large portion of the bathymetry is devoid of sediment. Such areas are evident
in the DepthPic display as the pixels denoting the current bathymetric surface are often
bright white or yellow (Figure D4). Additionally, there is often an acoustic reflection
below the current bathymetry, with a topology identical to the current bathymetry (Figure
D4).
Figure D4 – Common DepthPic displays for areas of Lake LBJ in which sediment has not accumulated.
In analyzing data from cross-sections where core samples were not collected, the
assumption is made that sediment layers may be identified in a similar manner as when
core sample data is available. To improve the validity of this assumption, core samples
D6
are collected at regularly spaced intervals within the lake, or at locations where
interpretation of the DepthPic display would be difficult without site-specific core data.
For this reason, all sounding data is collected and reviewed before core sites are selected
and cores are collected. For shallow areas of the lake within which sounding data were
not collected, sediment thicknesses are assumed negligible. This assumption may lead to
the calculated sediment volume underestimating the physical sediment volume present
within the lake.
After manually digitizing the pre-impoundment surface from all cross-sections,
both the pre-impoundment and current bathymetric surfaces are exported as X-,Y-,Z-
coordinates from DepthPic into text files suitable for use in ArcGIS. Within ArcGIS, the
sounding points are then processed into TIN models following standard GIS techniques2.
The accumulated sediment volume for Lake LBJ was calculated from a sediment
thickness TIN model created in ArcGIS. Sediment thicknesses were computed as the
difference in elevations between the current and pre-impoundment bathymetric surfaces
as determined with the DepthPic software. Sediment thicknesses were interpolated for
locations between surveyed cross-sections using the TWDB self-similar interpolation
technique3. For the purposes of the TIN model creation, TWDB assumed 0-feet sediment
thicknesses at the model boundaries (defined as the 825.68 foot NAVD 88 elevation
contour).
D7
Results
The results of the TWDB 2007 Sedimentation Survey indicate Lake LBJ has
accumulated 5,654 acre-feet of sediment since impoundment began in 1951. The
thickest sediment deposits are in the submerged river channel throughout the main lake body,
and sediment was not present in the Llano River arm, Colorado River arm, or Sandy Creek
arm of Lake LBJ. This sediment distribution suggests incoming sediment quickly travels
downstream within Lake LBJ, where it settles to the bottom, upstream of Wirtz Dam. The
maximum sediment thickness observed in Lake LBJ was 7.1 feet. Figure D5 depicts the
sediment thickness in Lake LBJ.
Based on the measured sediment volume in Lake LBJ and assuming a constant
rate of sediment accumulation over the 56 years since impoundment, Lake LBJ loses
approximately 100 acre-feet of capacity per year. This estimated loss rate is consistent
with that calculated from volume comparisons between the 2007 survey and 1951
capacity estimate (Table 2 – Main Survey Report). To improve the sediment
accumulation rate estimates, TWDB recommends Lake LBJ be re-surveyed using similar
methods in approximately 10 years or after a major flood event. Additional point
estimates of sediment accumulation rates may also be obtained through assessment of the
Cesium-137 content within sediment cores.1
D8
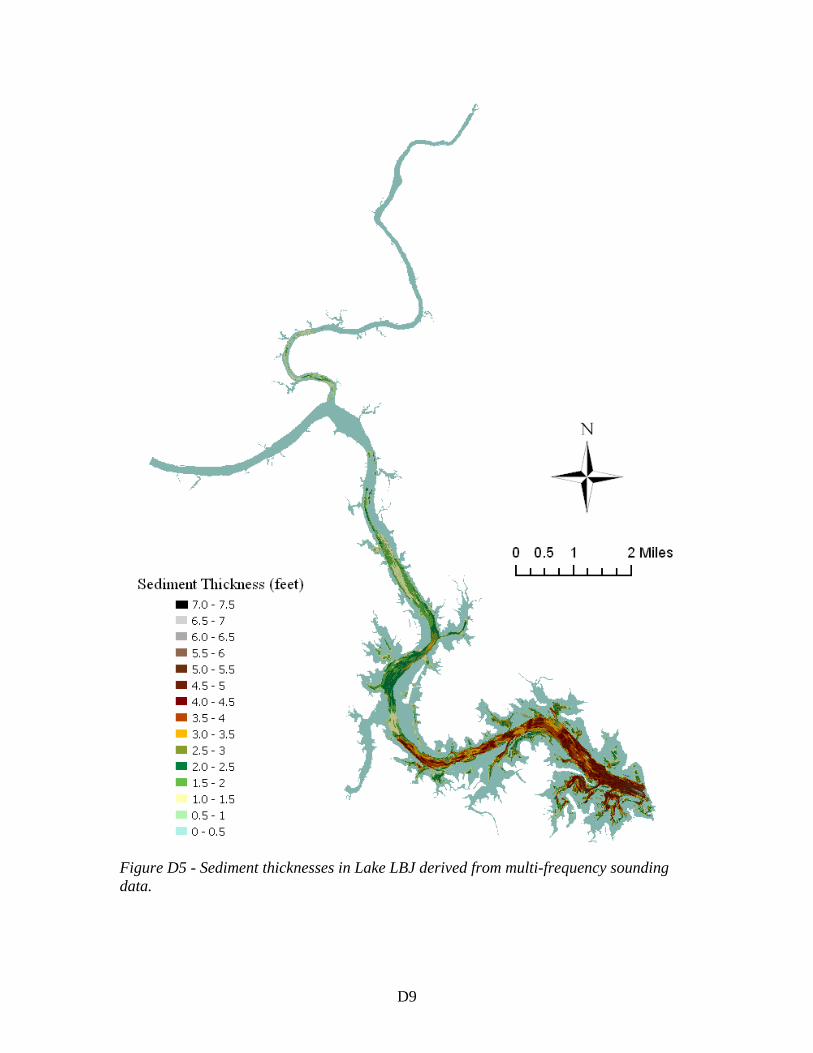
Figure D5 - Sediment thicknesses in Lake LBJ derived from multi-frequency sounding data.
D9
References 1. Dunbar, John and Estep, Heidi. “Hydrographic Survey Program
Assessment – Contract No. 0704800734 Final Report”. Submitted to
TWDB on 12/5/2008 from Baylor University
2. Furnans, J., Austin, B., Hydrographic survey methods for determining
reservoir volume, Environmental Modelling & Software (2007), doi:
10.1016/j.envsoft.2007.05.011
3. Furnans, Jordan. Texas Water Development Board. 2006. “HydroEdit
User’s Manual.”
D10
2,880,000
2,880,000
2,900,000
2,900,000
2,920,000
2,920,000
10,18
0,000
10,18
0,000
10,20
0,000
10,20
0,000
10,22
0,000
10,22
0,000
780
790 800
810
820
820
810
800800
820810
800790
780770
760
770
780
820
810
800
790780
790
800 810820
800
810 820
800
810
820
800
800
810
810
820
Figure 6
Prepared by: TEXAS WATER DEVELOPMENT BOARD May 2007 Survey
Conservation Pool Elevation:825.68 feet (NAVD 88)
Projection: NAD83 State Plane
Texas Central Zone
This map is the product of a survey conductedby the Texas Water Development Board's
Hydrographic Survey Program to determine thecapacity of Lake LBJ. The Texas
Water Development Board makes norepresentation or assumes any liability.
(in feet NAVD 88)CONTOURS
IslandsLake LBJ
820810800790780770760
Burnet and Llano Counties
TEXAS
WATER DEVELOPMENT
BOARD
0 1 20.5Miles
N
Lake LBJ10' - Contour Map