Embed Size (px)
Citation preview
CANADIAN JOURNAL OF EXPLORATION GEOPHYSlCS VOL. 26, NOS 1 B 2 iDECEMBER ,990). Pi 72-86
AVO ANALYSIS AND COMPLEX AlTRiBUTES FOR A GLAUCONITIC
GAS SAND BAR’
HAI-MAN CHUNG* AND DON C. LAWTON~
AtwrRACl
A gas~berring Ghuconiric sand bnr Inm routhcm Alberra was studied in terms of its AVO behaviour and compicx aftrib~~es uf rcnectivn seismic data. The data reveats an intcmting anomaly in the f”,,-offser stuck. In panicuhm the nn”maiy appear, ckxrly ill the
nearxffsct srirck (OL1050 071 hur is poorly outlined in the mid-offscr
stack (1”s”.21”” In). S”hacq”cnt A”0 modelling i”diumS that in the iuhjecr wea under study. for the Ghconitic Mcmhcr. thin-bed
runing effecri ““rrwhelm any A”0 effect\ the f” lateral chnngeb “f lithology Ibr offsets up to 3t100 m. The differences in the anomaly
ai it appears in the near-offset and mid-olt\et stzks can he largely a,,ribu,ed to a lower frequency C”“wa in the “,id~“ffW stack.
The complex auribuw plols show correspondinf2 ditkrencer in
the anomalies in rhe awibulrh al various offsets. In pariicuiar, he
instantancnus frequency for the *mar-Ok? stack Crveak fk ~nOt77al? disrinc,,y. b”, i, i, vinua,,y abb,cnt on the mii,Lorrsci stack. II is Wit denl that complcn arrributes are very sensilivc to rhr frequency Cons
tent ufthe seismic dad.
IN1‘HOUUCTION
In early 1986. Summit Resources Ltd. and Albead Energy Company Ltd. acquired a seismic template over a Cilauconitic gas well in southern Alberta using a 3.km-long seismic line. The purpose was to investigate the seismic signeturc of the gas-bearing sand bar. Since the well does not have a sonic log, no forward seismic modelling could be performed. Geophysically, shooting a seismic line over the well is per- haps the most effective way to study the sand bar in the absence of a corresponding sonic log.
A 21.fold seismic line was subsequently shot over the well in the latter part of January, 1986. The seismic data revealed an identifiable anomaly across the well location. There was drape evident over the sand bar, phase reversal attributed to gas-saturated sands, and an apparent Missis- sippian low structure below the gas-bearing sands. The
objective of this cast study was to investigate the seismic recponsc of the channel sand anomaly in terms of amplitude- versus-offset (AVO) effects and complex attributes. In par- ticular, complex attributes as a function of source-receiver offsets were examined. Because of confidentiality, all seis- mic shotpoint location numbers have been omitted, and the wells are referred to symbolically without revealing their true locations.
The use of AVO analysis to delineate gas reservoirs has been discussed by Ostrander (1984) and Neidell (1986). Wren (1984) also observed AVO changes in some seismic reflection data for the Cardium Formation in central Alberta. However. both Ostrander (1984) and Neidell (1986) cmphasized that there are as m;my as ten or more fxtors thal could affect AVO changes. lain (1987) studied the USC of the method in western Canada and concluded that for Cretaceous gas reservoirs in central Alberta, amplitude ctw~ges on COP gathers are too small to be reliable for practical recording spreads, which are typically about 2500 m. Eaton (19X9) also discussed the importance of the free- sutiace effect on the estimation of Poisson’s ratio.
Complex attributes hew been familiar topics in electri- cal signal analysis ever since the 1940’s, as discussed by Gabor (1946). However, explanations of their possible applications to seismic signal analysis were not available in the geophysical literature until the late 70’s. when Taner (lY77, 1979) published two papers on the subject. He emphasized the advantages of the separation of the phase information from the amplitude information in the use ot complex attributes. Robertson and Nogami (1984) studied the complex attributes of thin beds and reported an anoma- lous increase in the instantaneous frequency when the bed thinned to a quarter of the dominant wavelength.
The reader is assumed to be familiar with the theories of both AVO analysis and complex attributes, as they will not
IP,se”lcd at tix C.S.E.G. Nurionnl Convention. Calgary, Alberta, June 9. I989. Manuscript received hy the Edilor June IS. 1990: revised malluscript received October 12. 1990.
2Drpnnmcnt of Geology and Geophysics. The University of Calgary, Calgary, Alkna TZN IN4
We thank Seir-PK & Consuhan,s Ltd. for providing excellen, processing ,,f the seismic Lint and eking many va,,&,e su~~rstims during Ihe devcLo~- ment of the project. We express our sincere thanks to Albe*a Energy Company Ltd. and Summit Resources Lrd. for ailowing the use of one oflhcir seismic hnec and to Amoco Canadn Petroleum Co. Ltd. for providing a scholarship to the first author. Special thanks are extended to Mr. Andrew Muh and Mr. Brian Doheny for organiring the various materials used *br his study. and to four reviewers who provided many helpful Suggestions.
72

A”0 ANALYSlS AND COMPLEX ATTRIBUTES 73
be discussed here. For review of these subjects, the papers by Ostrander (1984). Taner (1977, 1979) and Robertson and Nogami (1984) are excellent references.
GEOLOGICAL BACK~~ROUND
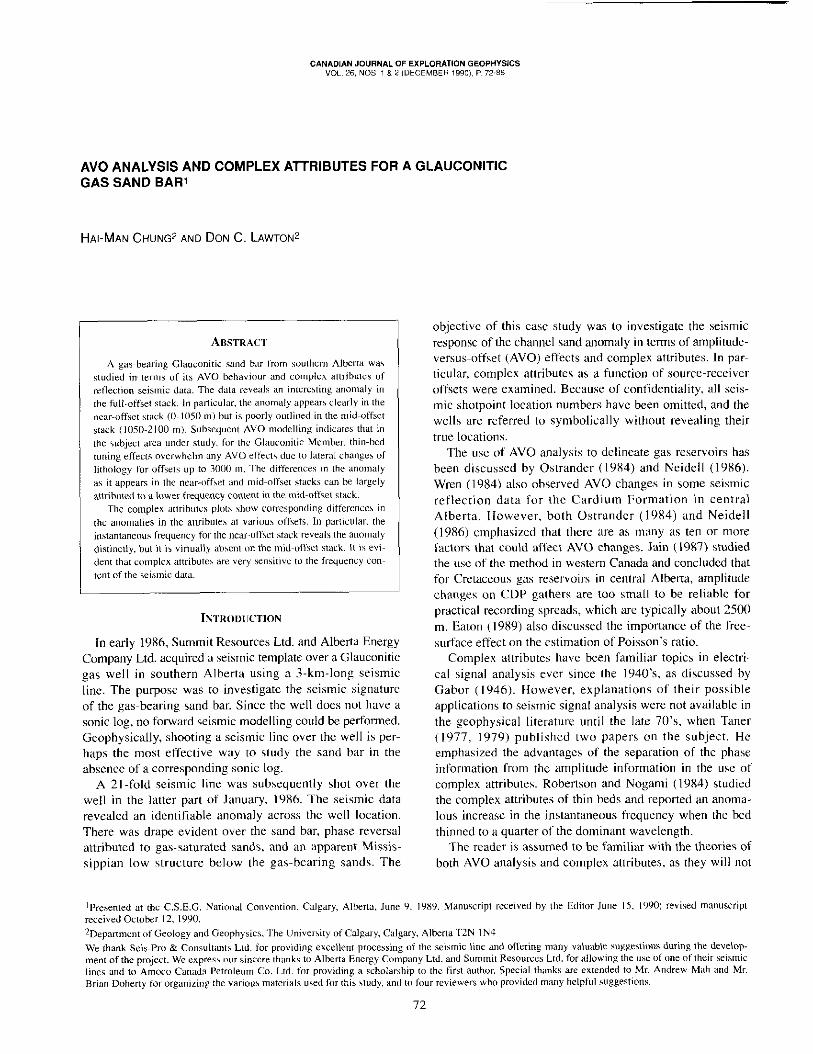
In general, the stratigraphy and regional setting in the sea under study are very similar to those in the Little Bow area, as discussed by Hopkins et al. (1982). Figure 1 shows an informal stratigraphic column for the study area. The Upper Mannville Glauconitic Member is represented by two lithofacies, (a) a regional sequence, and (b) channel features which are shale and sand-filled. The regional sequence consists of a shoaling upward cycle from the Ostracod limestones and Bantry shales. The shoaling sequence carries through to delta plain carbonaceous shales and coals. Delta-front sands and localized shore face sands within the regional sequence can form thin reservoirs if trapping by channel truncation and/or sufficient structural reversal occurs. The entire sequence from the Ostracod limestone to delta-plain sediments is rarely more than 40 m in thickness. Following the deposition of the regional sequence, a series of major channels down-cut through it and generally, but not always, also through the underlying Ostracod and Bantry Members. Within the channels, large, discrete bars of varying thicknesses were deposited which can completely fill the channel with a single, clean, medi- um-to-coarse-grain quartrose sand. The sand bars can be up to 40 m thick with an areal extent of up to 2.5 kmz, though half that size is more common.
The subject well penetrated a 40-m channel section which completely eroded the OstracodlBantry section. The channel fill consists of a basal sand 21 m thick over which lies 18 m of silty/sandy shale and a I-m layer of carbona- ceous shale which caps the entire channel-fill sequence. Logs indicate that the sand bar has an average porosity of 23 per- cent. Production testing and log analysis indicate that 8 m of gas pay are present over a 13-m water leg within the channel sand. Reserves are estimated at five billion cubic feet.
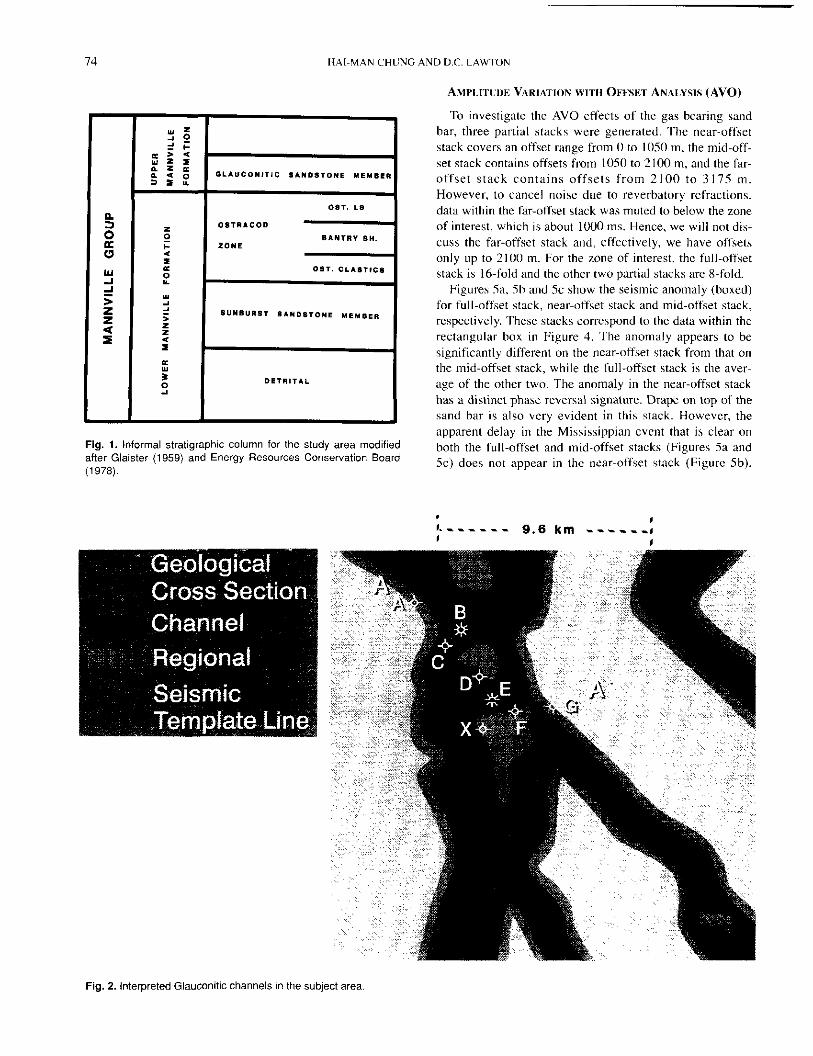
The subsurface interpretation of channel trends in the study area is based on two steps as discussed by Hopkins et al. (1982). The first step is to map the absence of the Ostracod limestones and the Bantry shales: the second step is to map channel-fill deposits from various logs. Figure 2 shows the geologically interpreted channel position in the area, the locations of the subject well E and neighbouring wells, and the location of the template seismic line. Figure 3 is a schematic structural cross-section through well E and some of the neighbouring wells. It clearly illustrates the sand- channel event through the sub.ject well, with the porous sands highlighted in yellow and the gas-producing done in red.
ACQUtStTION AND PROCESSlNG
Tl~e seismic line was acquired with P-wave vibrators as the energy source. Table 1 summarises the acquisition parame- ters. Because we were interested in analyring amplitude
variation with offset, every effort was made to preserve true relative amplitudes during data processing. This included application of gain to compensate for spherical divergence without any trace equaliration. Also, surface- consistent shot deconvolution was applied (i.e., one single deconvolution operator, which was obtained as an average over all traces belonging to the same shot, was applied to those traces.) This contrasts with the normal procedure of obtaining one deconvolution operator for each trace and applying it to that trace alone. The surface-consistent deconvolution was an attempt to preserve the amplitude characteristics for each wavelet corresponding to each shot. After stacking, long-window rms scaling was applied to each trace to ensure that the rms amplitudes did not signifi- cantly differ from trace to trace. The following steps summarix the processing flow:
I. Demultiplex. 2. Gain-spherical divergence only, no trace equalization, 3. Geophone phase compensation, 4. Surface-consistent shot deconvolution, 5. Elevation and weathering corrections, 6. NM0 correction-first pass, 7. Surface-consistent statics, 8. NM0 correction-second pass, 9. Gather,
IO. Trim statics, Il. Stack-21.fold, 12. Filter- band-pass, IO/IS-75/85 Hz, 13. Scaling - multigate window, SO-350 ms, 350.1600
“Is.
SPREAD 1600.25.0-25.1600m~’ (0 25 3200 m for first ml-in and last roll-out shots)
SOURCE INTERVAL: 75 m RECEIVER INTERVAL: 25 m SOURCE: Vibroseis, 4 Mertz vibrators over 32 m, 12
linear sweeps at 14 seconds. 13.55 Hz, 16-59 HZ. ,643 HZ. 22-67 HZ, 26-71 HZ, 28-75 HZ, upsweep and downsweep
RECEIVERS: Mark L~28. 10 Hz, 9 at 2.7 m INSTRUMENTS: Geocor IV, 128 trace NOMINAL FOLD COVERAGE: 21
SAMPLE RATE: 2 ms FIELD FILTERS: Out-out. notch out
Table 1. Acquisition parameters for the template seismic line.
Figure 4 shows a normal polarity display of the final stack. The gas-bearing sand bar is indicated by the arrow within the rectangular box. Here, one can observe drape over the gas sands, phase reversal probably due to their low velocity, and a Mississippian low. Moreover, the ampli- tudes of the peaks along the drape above the sand bar decrease over the sand bar, while the reversal also shows clear amplitude variations. In the following two sections, we will analyze this anomaly in terms of AVO effects and complex attributes.
74 HAlLMAN CHUNG AND D.C. LAWT”N
ILA”CO”ITIC *A*D*TOWE WEtABE* I
081. ,* OtTllCOD BAWTl” S”. ZONE
-4
o*T. CLI*TtC*
*“*B”l*l *A”DPIo*E #AEMBeR
0ETllT.L I
Fig. 1. Informal stratigraphic column for the study area modified after Glaister (1959) and Energy Resources Conservation Board (1978).
AMPI.~‘WE VARIATIOK WITH OFFSET ANALYSIS (AVO)
To investigate the AVO effects of the gas-bearing sand bar, three partial stacks were genrrated. The near-offssct stack ccwers an offset range from 0 to 10.50 m, the mid-off- set stack contains offsets from 1050 to 2100 m, and the far- offset stack contains offsets from 2100 to 3175 m. However. to cancel noise due to reverbatory refractions. data within the far-offset stack was muted to below the zone of interest, which is about 1000 ms. Hence, we will not dis- cuss the far-offset stack and, effectively, we have offsets only up to 2100 m. For the zone of interest, the full-offset stack is lh-fold and the other two partial stacks arc X-fold.
Figures Sa. 5b and SC show the seismic ar~~~~aly (boxed) for full-offset stack, near-offset stack and mid-offset stack, respectively. These stacks correspond to the data within the rectangular box in Figure 4. The anomaly appears to be significantly different on the near-offset stack from that on the mid-offset stack, while the full-offset stack is the aver- age of the other two. The anomaly in the nrar-offset stack has a distinct phase reversal signature. Drape on top of the sand bar is also very evident in this stack. However, the apparent delay in the Mississippian event that is clear on both the lull-offset and mid-offset stacks (Figures %I and 5c) does not appear in the near-offset stack (Figure 5b).
I Lmms--- 9.6 km ------L I I
Fig. 2. Interpreted Glauconitic channels in the wt ,,ect area.

A”0 ANALYSTS AND KmlPLEX ATTRIBUTES 75
This is interpreted to be due to changes in the interference pattern because of changes in apparent time thickness as a function of offset. In the mid-offset stack, the anomaly appears as a very broad and lower-frequency wavelet without showing any overlying drape nor clear reversal character.
To explain the differences between the various stacks in Figure 5, the first step is to investigate the possibility that the differences are caused by changes in Poisson’s ratio. Since low-velocity gas-saturated sands have relatively low Poisson’s ratios, they “ftcn show up as amplitude anoma- lies when the corresponding seismic data arc displayed in
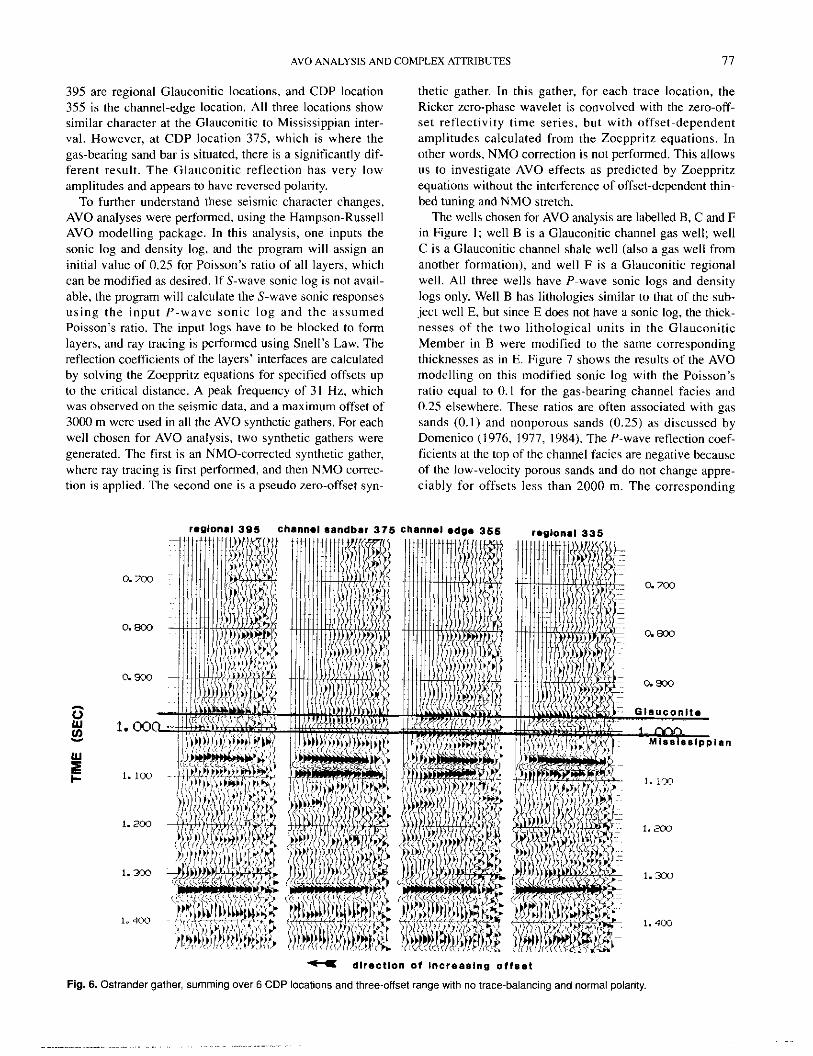
some offset-dependent format such as CDP gather panels (Ostrander, 1984). Figure 6 shows the Ostrander gather (Ostander, 1984) for four CDP locations along the seismic template line. To obtain the gather, six CDP panels across each location are summed with a range of three offsets for each output trace, so that each trace on the Ostrander gather in Figure 6 is the sum of eighteen traces. This effectively smears the reflections over six CDP locations (62.5 mj for an offset range of 75 m. However, the signal-to-noise ratio is enhanced by a factor of four. Note that there has been no trace balancing applied to the data. CDP locations 335 and
Fig. 3. Schematic structural cross-section A-A (Figure 1). The logs are generalized and are plotted for aesthetic purpose “nly.
3
-~ -., ..,I..,~,,,,,.,.. # ,,.......,, “lL,‘t* ,~ .\h
.&:,‘l‘::‘.‘, .I Ivy>
..~~ -,, ,....:.-r:~~~~‘l
‘~~.:~~~:,-i:.!:: ,:!;;;:::;;-:;:~j:,;;;~:~;,,~:‘~~~:~~~,~::~::,::,“““:!““‘,’,!~,:II~:~I,::~,:::,;,‘:~,,!:~~:::-:~‘~,‘:‘~!.,, I: ,i, ,1~1!111,,,I,i~I:!“‘y, ,,,.,I ~~,.n .‘.&
., ..,. ,,..,.,, ,, ,,, ,,,,,,, ,,,,,,, ,,,i ,,,,, .,, ,,, ~, ,,:,I:,,::,.,:,,i::i,?~~,t’~~.~
Fig. 4. Final full-offset stack of the seismic line. The gas sand bar anomaly is indicated inside the rectangle. The Glauconitic reflection is a trough along the top of the sand bar and is a peak in “V-sand bar areas.

W.-MAN CHUNG AND D.C. LAWTON
TRACE NO. 41 21 1
L
Fix- Glauconitic t Mississinnian
: (a) I
,---‘-‘-‘-“-” 650 m ---mm-m-m--e; I
TRACE NO. I
41 21 0.8
h::~ -Glauconitic
!MlssissipDian
(b)
TRACE NO. 21
Glauconitic
Mississippian
Fig. 5. (a) Full-offset stack (21~ fold) of seismic anomaly with normal polarity (P-wave velocity increases correspond to peaks). The offset cov- ers a distance of 0~2100 m. (b) Nearwtiset stack (B-fold) of seismic anomaly with normal polarity. The oflset covers a distance of O-1 050 m. (c) Mid-offset stack (g-fold) of seismic anomaly with normal polarity. The oi+set covers a distance of 1050-2100 m.
A”0 ANAt.YS,S AND COMPLEX .uTRIB”TES 71
395 are regional Glauconitic locations, and CDP location 355 is the channel-edge location. All three locations show similar character at the Glauconitic to Mississippian inter- val. However, at CDP location 375, which is where the gas-bearing sand bar is situated, there is a significantly dif- ferent result. The Glauconitic reflection has very low amplitudes and appears to have reversed polarity.
To further understand these seismic character changes, AVO analyses were performed, using the Hampson-Russell AVO modelling package. In this analysis, one inputs the sonic log and density log, and the program will assign an initial value of 0.25 for Poisson’s ratio of all layers, which can be modified as desired. If S-wave sonic log is not avail- able, the program will calculate the S-wave sonic responses using the input P-wave sonic log and the assumed Poisson’s ratio. The input logs have to be blocked to form layers, and ray tracing is performed using Snell‘s Law. The reflection coefficients of the layers’ interfaces are calculated by solving the Zoeppritz equations for specified offsets up to the critical distance. A peak frequency of 31 Hz, which was observed on the seismic data, and a maximum offset of 3000 m were used in all the AVO synthetic gathers. For each well chosen for AVO analysis, two synthetic gathers were generated. The first is an NMO-corrected synthetic gather, where ray tracing is first performed, and then NM0 correc- tion is applied. The second one is a pseudo zero-offset syn-
a.703
0.803
0.900
1. co
1. 100
1.203
1. 303
thetic gather. In this gather, for each trace location, the Ricker zero-phase wavelet is convolved with the rero-off- set reflectivity time series, but with offset-dependent amplitudes calculated from the Zoeppritz equations. In other words, NM0 correction is not performed. This allows us to investigate AVO effects as predicted by Zoeppritz equations without the interference of offset-dependent thin- bed tuning and NM0 stretch.
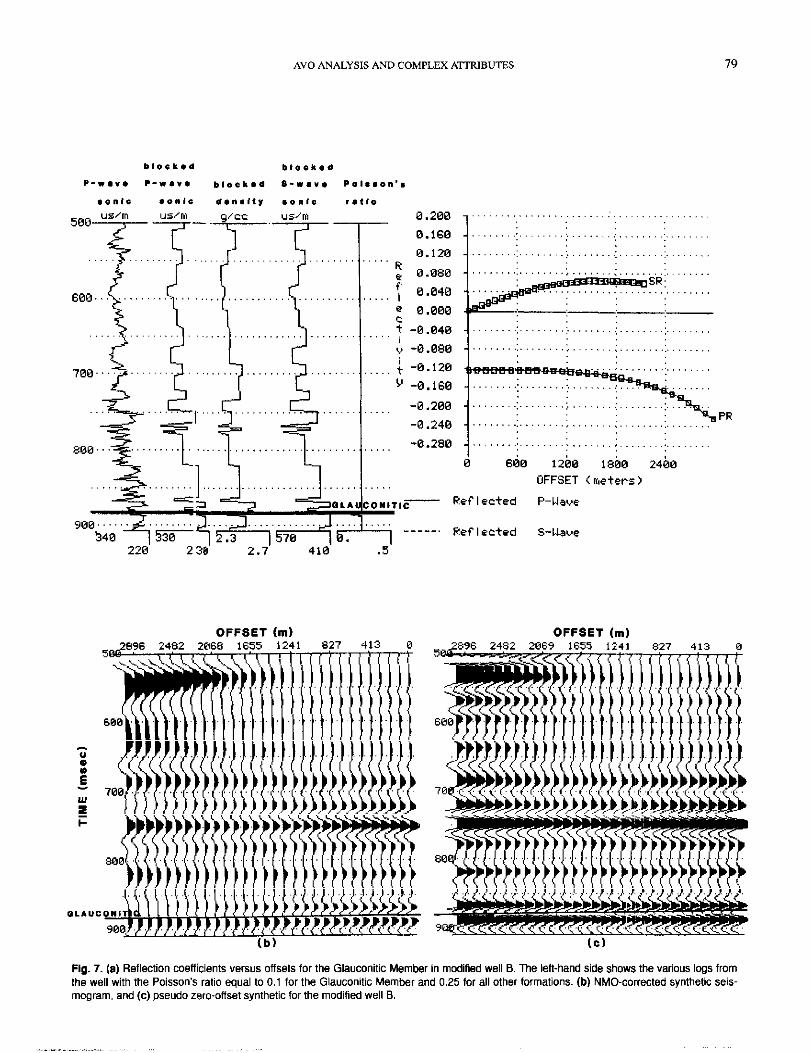
The wells chosen for AVO analysis are labelled B, C and F in Figure I; well B is a Glauconitic channel gas well; well C is a Glauconitic channel shale well (also a gas well from another formation), and well F is a Glauconitic regional well. All three wells have P-wave sonic logs and density logs only. Well B has lithologies similar to that of the sub- ject well E, but since E does not have a sonic log, the thick- nesses of the two lithological units in the Glauconitic Member in B were modified to the same corresponding thicknesses as in E. Figure 7 shows the results of the AVO modelling on this modified sonic log with the Poisson’s ratio equal to 0. I for the gas-bearing channel facies and 0.25 elsewhere. These ratios are often associated with gas sands (0.1) and nonporous sands (0.25) as discussed by Domenico (1976, 1977, 1984). The P-wave reflection coef- ficients at the top of the channel facie are negative because of the low-velocity porous sands and do not change appre- ciably for offsets less than 2000 m. The corresponding
rwat0n.t 336
0.700
0.800
Glaucontt.
Fig. 6. Ostrander gather, summing over 6 CDP locations and three-offset range with no trace-balancing and normal polarity.

7x “AI-MAN CHUNG AND D.C. LAWTON
NMO-corrected synthetic seismogram (Figure 7b) shows some noticeable amplitude changes at an offset of 1800 m or larger, while NMO-stretch effects are observable beyond about 2400 m. In comparison, the pseudo zero-offset seis- mogram (Figure 7c) reveals hardly any amplitude changes.
Figures Xa, 8b and 8c are the models for C, which is a channel silty shale well. The P-wave reflection coefficients (Figure Xa) for the top of Glauconitic Member are positive and start to change significantly only for offsets greater than 2400 m. Both the NMO-corrected synthetic (Figure 8b) and the pseudo zero-offset synthetic seismogram (Figure Xc) reveal insignificant amplitude changes as a func- tion of offset.
Figures 9a, 9b and 9c are the models for F, which is a Glauconitic regional well. The P-wave reflection coefficients (Figure 9a) show a similarity to those from well C. The two synthetic seismograms (Figures 9b and 9c) show similar results to those of Figures 7b and 7c. The NMO-corrected synthetics show some significant amplitude changes at 1800 m or larger &sets, but the pseudo zero-offset synthetic shows negligible amplitude changes with offset.
The three sets of models imply that any observable AVO effects for offscts of 2500 m or less are probably due to off- set-dependent thin-bed tuning effects. The magnitudes of the offset-dependent reflection coefficients calculated from Zoeppritz equations do not show any significant P-wave changes for offsets below 2500 m in all cases. Once thin- bed tuning effects are eliminated, as in the pseudo Lao-off- set synthetic seismograms, there are no significant detectable amplitude variations with offset.
Since the near-offset stack appears to have a higher frequency content than the mid-offset stack, the near-offset stack was then filtered four times, each time with a different filter in order to provide a comparison. The results are shown in Figure IO. In Figure IOa, for a passband of X/16- 35/40 Hz. the phase reversal disappears completely, while the drape is barely observable but has clear amplitude changes. Obviously, the frequency content is too low to reveal the anomaly. In Figure lob, the filter used was X/16- 40145 Hz. The anomaly on this stack is similar to that in the mid-offset stack. Both stacks show broad wavelets for the anomaly with apparently similar bandwidths. This seems to imply that the differences in the anomaly as it appears in the near-offset and mid-offset stacks can be partly attributed to a lower frequency content in the mid-offset stack. Figures 10~ and IOd have filters X/16-45/50 Hz and X/16-SO/55 Hz, respectively. They indicate that with fre- quencies higher than 45 Hz present in the data, the near-off- set stack starts to develop a relatively distinct character for the anomaly.
COMPLEX ATTRIBUTES
Another objective of this case history is to examine the complex attributes of the anomaly, in particular, for various source-receiver offsets. To make the discussion clearer, we shall discuss the attributes separately. The attributes were cal- culated by the Geophysical Micro-Computer Applications Grits package.
Instantaneous amplitude
The instantaneous amplitude is sometimes called the amplitude envelope or the reflection strength. It is simply the amplitude of the complex trace, and is phase-dependent (Taner, 1979). Figures I la, I lb and I Ic show the ampli- tude envelopes for the full-offset stack, the near-offset stack and the mid-offset stack, respectively. The channel is clearly visible in both the full-offset and near-offset ampli- tude envelopes but is virtually unobservable in the mid-off- set stack amplitude envelope. Since the mid-offset stack has a lower frequency content than the other two stacks, its amplitude envelope also appears to have lower frequency content than the other two envelopes. The lower frequency content seems to cause the disappearance of the channel signature in the mid-offset amplitude envelope.
Instantaneous phase
Figures IZa, l2b and l2c show the instantaneous phase plots for the full-offset stack, the near-offset stack and the mid-offset stack, respectively. As pointed out by both Taner (1979) and Robertson and Nogami (1984). instantaneous phase is a very effective tool for delineating discontinuities, faults, pinch outs, angularities and events with different dip attitudes. This is mainly due to the fact that the instantaneous phase is independent of the amplitude. Hcncc. the disconti- nuities that are difficult to observe on conventional seismic data due to low amplitudes will show up more clearly on instantaneous phase displays. For example, on the one for the near-offset stack (Figure 12b), at times of 0.98 to 1.0, discontinuities that are likely channel-edge effects can be seen at Trace IX and between Traces 61 and Xl. They are interpreted as effects of laterally accreted sands that are often associated with channel edges. However, the channel anomaly is not detectable in the mid-offset instantaneous phase plot (Figure 12~). nor are there any channel-edge effects visible.
An additional note is that there is an event detected in the mid-offset stack phase plot that appears to be very dif- ferent in the near-offset phase plot. The event at about 1.020 s between Traces 48 and 6X on the mid-offset phase plot (Figure 12~) appears to have been truncated at both ends and exhibits some overlying drape. The corresponding event in the near-offset phase plot, however, is rather con- tinuous. This event is probably related to Mississippian reflections. Given the differences in the Mississippian reflection charactrr on the nrar-offsrt range and mid-offsrt range stacked sections (Figures Sb and SC), it is not surprising that the corresponding instantaneous phase plots also exhibit differences. Since the Glauconitic reklection is typically only about 30 ms above the Mississippian reflection, it would be very useful to explain the AVO behaviour of the latter so that its effects on the former would be accounted for.
Instantaneous frequency
Figures 13a, l3b and 1% show the instantaneous fre- quency plots for the full-offset stack, the near-offset stack,
A”0 ANALYSIS AND COMPLEX ATTRlS”TES 79
0.200 0.160 0.120
0.080 0.040
0.000
-0.040 -0.080 -0.120
-0.160
-0.200 -0.240 -0.280
~::“‘::i::::::::~:::::::~:::~::::::::::::: . . . . . . . . . . . . . . . ..I . . . . . . . . . . . . . . . . . . . .““.~~~‘.‘....
:. ,‘,
.-:-
OFFSET I reters)
Ref I ected P-Wave
-----. Reflected S-Waue
OFFSET (m)
Fig. 7. (a) Reflection coenicients versus offsets for the Glauconitic Member in modified well 6. The left-hand side shows the various logs from the well with the Poisson’s ratio equal to 0.1 for the Glauconitic Member and 0.25 lor all other formations. (b) NMO-corrected synthetic seis- mogram, and (c)pseudo zero-offset synthetic for the modified well 8.

80 HA,-MAN CHUNG AND DC. LAWTON
DbCk.d bl0EL.d P-w.“. P-w.“. bb2k.d 8-w.“. PO,**cd*
.on,c S0”15 d.“*,,y l 011bz r.tro
US,,0 5QQL!qL- -. g/CC ,,5/,* -
2 c ,T
,,> ..TTF
i- 600..:[.-....
L .!-
.F
.j !) >
: il
0.500 - 0.450
0.400
R 0.350
Y ;:g
‘, 0.200 t 0.150 ” 0.100
. . . . 0.050 Y 0.000
-0.050 -0.100 -0.150 -0 .a30
*-*&, ,;. ,. ;, .i..g .:.?Tt?Fm&*,~. : ..,..... ,........: :.
0 600 1200 lB”0 2400 OFFSET < me.ters >
““” - E:rf,ected P-Wave
; -__- -’ Ref I ected s-uaue
.5
....... . ...... ..j................I p’” ........
..... ..~.........................~ .....
........ j.. ...... j.. I ....... ........ . .... J
OFFSET (ml
5
Fig. 8. (a) Reflection coefficients versus offsets for the Glauconitic Member in the channel shale well C. The left-hand side shows the various logs from the well with the Poisson’s ratio equal to 0.25 for all formations. (b) NMO-corrected synthetic. and (c) pseudo zero-oRset synthetic for the shale weli C.

A”0 ANALYXS AND COMPLEX ,4TTRIBUTES 81
bloc*.d blOCk.d
P-l.“. P-w.“. blocL.d S-w.“. POI**.“‘* .onrc *on15 d.“.W ,0”15 ,.t,o
-00 us4 usa ‘CC
: _1 700.. ,>.
> r
L, us4m -.
..-T .{. l
r
q’ d .F=Y G.L.? Sce’1~ ,iiFFK-
220 2.7 390
L f
OFFSET (ml
(b) (c) (c)
0 600 1200 1:300 2400 OFFSET I riwtew >
- ONlTlC kf I rcted P-klW _
Reflected S-lJ.sve
Fig. 9. (a) Reflection coefficients versw offsets 10~ the Glauconitic Member in the regional well F. The l&hand side shows the various logs from the well with the Poisson’s ratio equal to 0.25 for all formations. (b) NMO-corrected synthetic, and (c) pseudo zero-offset synthetic for the regional well F.

82 “AI-MAN CHUNG AND D.C. LAWTON
TRACE NO.
-Glauconitic -Mississippian
1.2 I (a) I I L-------------650 m------------: : ,
I
TRACE NO.
4,’ 4,’ 0.2 0.2 ? ?
(b) (b)
.Glauconitic Mississippian
Fig. 10 Near-offset stack (O-t 050 m) with a band-pass filter 01 (a) 8-t 6135-40 Hz and (b) 8-16140-45 Hz,

A”0 ANALYSIS AND COMPLEX AXTRIBUTES 83
TRACE NO.
Glauconltic MissIsSippian
TRACE NO.
0.2
0.0
1.0
1.1
(d)
Glauconitic Mississippian
Ptg. 10. Near-ottset stack (O-1050 m) with a band-pass tilter of (c) 8-16145-50 Hz and (d) E-16150-55 Hz.

“AI-MAN CHUNG AND DC LAWTON
(b)
TRACE NO.
(C)
Fig. 11. The instantaneous amplitude plot of the anomaly for the (a) full-o”se, stack (O-2100 m), (b) near-offset stack (O-1050 m), and (c) mid-oftset stack (1050-2100 m).
TRACE NO.
,-w---650 m ._____;
bi TRACE NO.
(b) TRACE NO.
Fig. 12. The instantaneous phase plot of the anomaly for the (a) full-offset stack (O-2100 m). (b) near-offset stack (0~1050 ml. and (c)mid-offset stack (1050~2100 m).
and the mid-offset stack, respectively. Since the instanta- neous frequency is the time derivative of the instantaneous phase, it is also amplitude-independent. For this attribute, only the near-offset instantaneous frequency plot (Figure 13b) shows the anomaly unequivocally, with a dipping event between Traces 19 and 50 at about 0.98 s. This dipping

A”0 ANALYSlS AND COMPLEX ATTRIEtUTES 8.5
TRACE NO.
r-----850 m .*----, (a)
TRACE NO.
(b) TRACE NO.
Fig. 13. The instantaneous frequency plot of the anomaly for the (a) full-offset stack (O-2100 m). (b) near-of&t stack (O-3050 “7). and (c) mid-otfset stack (1050~2tOO m).
event appears to outline the structure of the top of the gas- bearing sand bar. It is virtually absent on the other two fre- quency plots. This seems to imply that, among the three attributes, the instantaneous frequency is the best tool to out- line the channel anomaly. This is probably true whenever a
thin bed is involved. Robertson and Nogami (1984) reported that as a bed thins to a quarter period of the dominant wave- length, there is an anomalous increase in instantaneous fre- quency, which remains high as the bed continues to thin. This agrees with Widess’ (1983) conclusion that when the bed thins to l/x of the predominant wavelength, the wavelet shape will assume the shape of its derivative and remain constant until the thickness approaches zero, while its amplitude will also decrease to zero. As mentioned earlier, the gas-bearing sand bar under study is only 8 m thick and is below tuning thickness (assuming a peak frequency of 40 Hz and a Glauconitic sand velocity of 3700 m/s, which gives a tuning thickness of 23 m). Hence, it should show up in the instantaneous frequency plot. However, it is interest- ing to note that the gas-sand anomaly appears only in the near-offset stack instantaneous frequency plot, not in the other two frequency plots. Obviously, the instantaneous frequency attribute is very sensitive to the frequency con- tent of the data. Note that the “low-frequency shadow” reported by Taner (1979) is not observable on any of the instantaneous frequency plots.
DISCUSSION
The Glauconitic sand bar in well E exhibited a detectable anomaly on conventional seismic data. Although the chan- nel section is 40 m thick, only 8 m of it are gas-bearing. Assuming a peak frequency of 40 Hz and a sand velocity of 3700 m/s, the tuning thickness would be about 23 m. Hence, the gas-bearing zone is well below tuning thickness. This, in turn, means that to fully understand the amplitude behaviour of the anomaly, one should also investigate the effect of tuning on amplitude changes at nonnormal inci- dence. In particular, in Alberta, the AVO effects of many thin hydrocarbon-bearing reservoirs are often obscured by their tuning effects. Therefore, for thin beds below tuning thick- nesses, no AVO analyses are complete without correspond- ing thin-bed tuning analyses. Nevertheless, the AVO analyses performed on the three wells are still informative in a quali- tative manner. Firstly, the analyses imply that for the Glauconitic Member in southern Alberta, AVO effects due to a lateral change of lithology can be observed only for off- sets greater than 2500 m. For our seismic line, the largest effective offset is 2100 m, with any data from larger offsets being muted at the Glauconitic reflection times in order to cut down front-end noise. Hence, one could not observe any conclusive evidence for AVO effects as a result of a lateral change in the Poisson’s ratio of the gas-bearing sand between the near-offset stack and the mid-offset stack, notwithstanding the presence of other character differences. Secondly, the AVO analyses clearly indicate that, for the Glauconitic Member in the study area, thin-bed tuning effects dominate any AVO effect attributed to lateral changes in the Poisson’s ratio. Furthermore, NMO-stretch effects for long offset traces are evident on all the synthetic seismograms. This also makes any AVO effects due to later- al changes of lithology more difficult to observe on large

X6 HAILMAN CH”NF AND D.C. L*WToN
offset traces since it lowers the apparent frequency of those traces. The differences of the anomaly between the near- offset stack and the mid-offset stack are probably largely due to lower frequency content in the mid-offset stack.
The complex attributes for the various offsets indicate that the channel can be recognized clearly on data with a frequency of 45 Hz or higher present. The instantaneous phase outlines the lateral discontinuities at the channel edge remarkably well for the near-offset stack. In particu- lar, the instantaneous frequency is very useful in delineat- ing beds that are thinner than tuning thickness. Furthermore, the differences between the instantaneous phase and frequency plots for the near-offset and mid-off- set stacks suggest that the attributes are very sensitive to the frequency content of the seismic data. Thus, it would be a very useful exercise to study how the apparent frequency content of the attributes relate to the frequency content of the corresponding seismic data. Another potential use of the instantaneous phase and frequency is the possibility of delineating a stratigraphic pinch out. Since the wavelet shape undergoes a definite pattern change as the bed thins from above tuning thickness to zero thickness, the instanta- neous phase and frequency plots will outline the change very clearly, since they are independent of the amplitude,
Finally, the use of AVO analysis to interpret seismic data is far from being unambiguous. Ostrander (1984). Neidell (1986) and Jain (1987) have discussed the limitations of the method. This paper only emphasizes the effect of off- set-depending tuning. More research and case studies are definitely needed to investigate the various aspects of the use of AVO analysis for seismic data interpretation.
This case study does not reveal any significant AVO effects due to a lateral decrease in the Poisson’s ratio of the gas-bearing Glauconitic sands for the modified well B for off- sets up to 2500 m. However, the differences in the character of the anomaly between three different offset stacks suggest that partial stacks are a useful method of evaluating offset- dependent tuning. Their usefulness is further enhanced by the use of their complex attributes, which outline disconti- nuities and thin beds preferentially with frequency content. Since near-offset traces tend to have higher frequency con- tent than mid-offset and far-offset traces, complex attributes are appropriate tools to be used in conjunction with other geophysical methods for analyzing partial stacks.
There are two recommendations for future investigation. The first one is the possible use of convened waves (P-W) in AVO analysis. Figures 7a, 8a and 9a show that the reflection coefficients of the S-wave are changing faster as a function of offset than that of P-wave. Hence, relatively, offset-dependent tuning will have reduced effects on the S- wave data. The second recommendation is to study the effect of the Mississippian reflections on the amplitudes of the Glauconitic reflection whenever the two-way traveltime between the two events is less than about 30 ms. Since the Mississippian reflections are typically much higher-ampli- tude than the Glauconitic reflections, the AVO behaviour of the former could overwhelm the latter when they are in close proximity to each other.
REFERENCES
Domenico. S.N., 1976, Effect on brine-gas mixture on velocity in an unconsolidated sand reswvoir: Geophysics 41,882-894.
1977. Elastic properties of unconsolidated porous sand reser- voirs:‘GeGeophysics42. 1339.1368. ~, 1984, Rock lithology and porosity detemination from shear and
compressional wave velocity: Feophysics 49, I137-1406. Eaton, D.W.S., 1989, The free surface effect: implications for amplitude-
versus-offset inversion: J. Can. Sot. Expl. Geophys. 25.97-103. Energy Rescurces conservation Board, ,978, Table Of formations,
Albemx Calgary Energy Resources canserva,ion Board. Gabor. 0.. ,946, Theory ofcammunication, pan 1: J. Ins,. Elect*. Eng. 93,
w-441. Glaister, R.P, 1959, Lower Cretaceaur of southern Altmla and adjoining
areas: Bull. Am. Assn. Petr. Geol. ‘x3,590-640. Hopkins, I.C., Hermanson. S.W. and Lawton, D.C., 1982, Morphology of
channels and channel-sand bodies in the Glauconitic sandstone member (Upper Mannville), Little Bow area, Athena: Rull. Can. Per. Geol. 30, 274.285.
Jain, S.. 1987, Amplitude-vs-offset analysis: a review with reference to application in western Canada: J. Cm. Sot. Enpl. Geophys. 23,27-K
Neidell, N.S.. 1986. Amplitude variation with offset: The Lading Edge 3, 47~5 I.
Ostrander, W.J., L984, Plane-wave reflection coefficienrs for gas sands a* nonnomkd angles of incidence: Geophysics 49, 1637~1648.
Robertson. I.D. and Nogami, NH., 1984, Complen seismic trace analysis of thin Ma: Geophysics 49.344-352.
Taner, M.T. and Sheriff, R.E., 1977, Applications of amplitude. frequency an* other attribUtes to stratigraphic an* hydrocarbon determination: Am. Assn. Par. Geol., MeIn 26, m-327.
Koehler, E and Sheriff, R.E., IY79, Complex seismic trace analysis: Geophysics 44, 1041-1063.
Widcss. M.B.. 1971, How thin is a thin bed?: Geophysics 38, 1176.1180. Wren, A.E., 1984, Seismic techniques in Cardium exploration: J. Can.
sot. Expl. Feaphys. 20.55-59.