Embed Size (px)
Citation preview
Volume VIII, Issue 3(25), Fall 2013
Volume VIII Issue 3(25)
Fall 2013
I.S.S.N. 1843-6110
Journal of Applied Economic Sciences
Editorial Board
Editor in Chief Laura Ştefănescu
Managing Editor Mădălina Constantinescu
International Relations Responsible Pompiliu Constantinescu
Proof – readers Ana-Maria Trantescu - English
Redactors Andreea-Denisa Ionițoiu Cristiana Bogdănoiu Sorin Dincă
Editorial Advisory Board Claudiu Albulescu, University of Poitiers, France, West University of Timişoara, Romania
Aleksander Aristovnik, Faculty of Administration, University of Ljubljana, Slovenia
Cristina Barbu, Spiru Haret University, Romania
Christoph Barmeyer, Universität Passau, Germany
Amelia Bădică, University of Craiova, Romania
Gheorghe Bică, Spiru Haret University, Romania
Ana Bobîrcă, Academy of Economic Science, Romania
Anca Mădălina Bogdan, Spiru Haret University, Romania
Jean-Paul Gaertner, l'Institut Européen d'Etudes Commerciales Supérieures, France
Shankar Gargh, Editor in Chief of Advanced in Management, India
Emil Ghiţă, Spiru Haret University, Romania
Dragoş Ilie, Spiru Haret University, Romania
Elena Doval, Spiru Haret University, Romania
Arvi Kuura, Pärnu College, University of Tartu, Estonia
Ion Viorel Matei, Spiru Haret University, Romania
Piotr Misztal, Technical University of Radom, Economic Department, Poland
Marco Novarese, University of Piemonte Orientale, Italy
Rajesh Pillania, Management Development Institute, India
Russell Pittman, International Technical Assistance Economic Analysis Group Antitrust Division, USA
Ion Popescu, Spiru Haret University, Romania
Kreitz Rachel Price, l'Institut Européen d'Etudes Commerciales Supérieures, France
Andy Ştefănescu, University of Craiova, Romania
Laura Ungureanu, Spiru Haret University, Romania
Hans-Jürgen Weißbach, University of Applied Sciences - Frankfurt am Main, Germany
Spiru Haret University Faculty of Financial Management Accounting Craiova No 4. Brazda lui Novac Street, Craiova, Dolj, Romania Phone: +40 251 598265 Fax : + 40 251 598265
European Research Center of Managerial Studies in Business Administration http://www.cesmaa.eu Email: [email protected]; [email protected] Web: http://cesmaa.eu/journals/jaes/index.php

Volume VIII, Issue 3(25), Fall 2013
Journal of Applied Economic Sciences
Journal of Applied Economic Sciences
Journal of Applied Economic Sciences is a young economics and interdisciplinary research journal, aimed to publish articles and papers that should contribute to the development of both the theory and practice in the field of Economic Sciences.
The journal seeks to promote the best papers and researches in management, finance, accounting, marketing, informatics, decision/making theory, mathematical modelling, expert systems, decision system support, and knowledge representation. This topic may include the fields indicated above but are not limited to these.
Journal of Applied Economic Sciences be appeals for experienced and junior researchers, who are interested in one or more of the diverse areas covered by the journal. It is currently published quarterly with three general issues in Winter, Spring, Summer and a special one, in Fall.
The special issue contains papers selected from the International Conference organized by the European Research Centre of Managerial Studies in Business Administration (www.cesmaa.eu) and Faculty of Financial Management Accounting Craiova in each October of every academic year. There will prevail the papers containing case studies as well as those papers which bring something new in the field. The selection will be made achieved by:
Journal of Applied Economic Sciences is indexed in SCOPUS www.scopus.com, CEEOL www.ceeol.org, EBSCO www.ebsco.com, RePEc www.repec.org and in IndexCopernicus www.indexcopernicus.com databases.
The journal will be available on-line and will be also being distributed to several universities, research institutes and libraries in Romania and abroad. To subscribe to this journal and receive the on-line/printed version, please send a request directly to [email protected].
Volume VIII, Issue 3(25), Fall 2013
Journal of Applied Economic Sciences
ISSN 1843-6110
Table of Contents
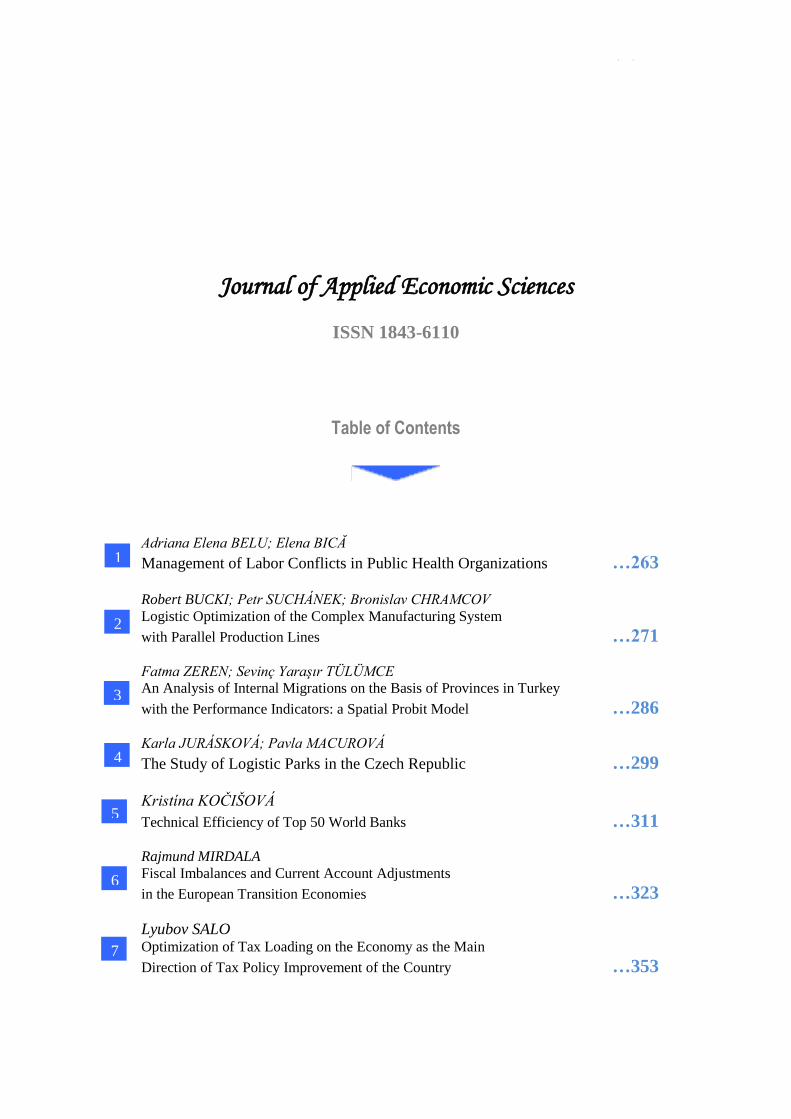
Adriana Elena BELU; Elena BICĂ Management of Labor Conflicts in Public Health Organizations …263
Robert BUCKI; Petr SUCHÁNEK; Bronislav CHRAMCOV Logistic Optimization of the Complex Manufacturing System
with Parallel Production Lines …271
Fatma ZEREN; Sevinç Yaraşır TÜLÜMCE
An Analysis of Internal Migrations on the Basis of Provinces in Turkey
with the Performance Indicators: a Spatial Probit Model …286
Karla JURÁSKOVÁ; Pavla MACUROVÁ
The Study of Logistic Parks in the Czech Republic …299
Kristína KOČIŠOVÁ
Technical Efficiency of Top 50 World Banks …311
Rajmund MIRDALA
Fiscal Imbalances and Current Account Adjustments
in the European Transition Economies …323
Lyubov SALO Optimization of Tax Loading on the Economy as the Main
Direction of Tax Policy Improvement of the Country …353
1
2
3
4
7
6
5
Journal of Applied Economic Sciences
Silvia SIMIONESCU; Simona Viorica MOISE
The Place and Role of Small and Medium Size Enterprise’s in the
Romanian economy. Base for Efficient Use of Resources …361
Marianna SINIČÁKOVÁ; Veronika ŠULIKOVÁ
Interbank Interest Rate Transmission in the Baltic Countries …372
Roman ŠPERKA; Marek SPIŠÁK First Steps of Java-Based Simulation for Decision
Support System of Business Companies …381
George HALKOS Constructing Abatement Cost Curves for F - Gases …388
10
10
9
9
8
8
11
10
Volume VIII, Issue 3(25), Fall 2013
MANAGEMENT OF LABOR CONFLICTS IN PUBLIC HEALTH ORGANIZATIONS
Adriana Elena BELU
Faculty of Law and Public Administration, Craiova
Spiru Haret University, Romania
Elena BICĂ
Faculty of Accounting and Financial Management, Craiova
Spiru Haret University, Romania
Abstract:
The paper treats a very important issue, of the present, with extensive and multiple implications for
public health (Anderson, et al., 2005). The work can be considered as an interdisciplinary study justified by the
following two arguments.
First, it is essential to applied research step, the knowledge and use of enshrined informational content
in management literature, especially of models and mechanisms of managerial activity on the administration of
human resources, managerial style, mobilization capacities, communication, coordination or decision ones and,
not least the mechanisms characteristic to collective relations established between managers and employees.
Second, it is required for the implementation phase of research findings, capitalization of an informational
sphere of law field, specifically, labor law, because labor conflicts are based both on specific regulations of
labor law and on a juridical literature, of great interest and of strict use for a concrete optimization of labor
social relations.
Keywords: management, labor conflicts, public health organizations, manager, public health organizations.
JEL Classification: J40, J41, J50, J53, K31.
1. Introduction
The work highlights, as a work concentrating on labor conflicts management in public health
organizations, the possibilities to improve the relations among the following three factors:
management, understood as the formal ability of the leader to achieve performance in the
organization’s work with people;
labor conflicts, i.e. conflicts between health professionals and public health organizations
with which they concluded the individual employment contract, based on failure to resolve
claims of professional, economic, social character or not giving rights that are based on
labor law, labor collective contract or the individual employment contract;
public healthcare organizations, defined as public institutions entirely financed from own
revenues made under contracts with Social Health Insurance Houses. Without a doubt that
the activity of all healthcare organizations is influenced by economic or social factors, but as
resulting from the findings of this study, internal managerial factors have a determined role
in preventing labor conflicts and, as a consequence, in optimizing psychological climate at
work, thus ensuring a good quality of health services.
We found that healthcare organizations can feel a “management pressure” forcing inert
systems and structures to become more flexible and to be concerned with the implementation of
modern practices specific to management in healthcare organizations. In healthcare there must be
exceeded the “necessity management” characterized by resorting to management only when crises or
conflicts reach climax. It is true that we can learn something from crisis or conflicts, we draw
conclusions, but the consequences of the unsolved crisis or failures of unsolved conflicts, in due time,
are very costly (Bass and Avolio, 1990).
Organizational development and management in healthcare organizations is a productive
orientation. Organizational development process requires common research approaches and particular
needs of each health system hospital organizations. Research can provide decision-makers to
materialize concrete conclusions and proposals which can ensure a better state of the system and a
Journal of Applied Economic Sciences
psycho-socio-professional climate in hospitals that can prevent conflicts and optimize the relationship
with beneficiaries.
Conclusions:
Knowing that the consolidation mechanism of an organizational culture, both managers and
employees, react to internal or external events through the filter of some dominants crystallized in
time, we decided the application of sociological survey made of written questions which will not
disturb and will allow the same interpreting sense for all that there are questioned. The components of
the culture that made the object of the present case study drawn from conclusions from other published
researches by valuable authors and adapted to the realities of Romanian Healthcare Organizations,
were the following: trusting climate, management of change, stressing environment, management of
solving the claims and mentality doubled by daily behavior by which is characterized the working
force in the hospitals.
References:
[1] Bass, B.M., Avolio, B.J. (1990). The implications of transactional and transformational
leadership for individual, team, and organizational development. In W. Pasmore & R.W.
Woodman (Eds.). Research in organizational change and development: Vol.4. Greenwich, CT: JAI
Press. (pp. 231-272).
[2] Constantinescu D., Nistorescu T. (2000). Entreprise economy, Economică Publishing House,
București.
[3] Belu, A. (2004). Introduction to the study of legal personality, Reprograph Publishing House,
Craiova.
[4] Bărbulescu, C., Bâgu, C. (2001). Production management policies, Tribuna Economică Publishing
House, Bucharest.
[5] Băcanu, B. (2008). Public organization. Theory and management, Polirom Publishing House, Iași.
[6] Constantinescu D., Nistorescu T. (2008). Project management. Fundamentals, methodes and și
tehniques, Sitech Publishing House, Craiova.
[7] Mathis, R.L., Nica, P.C., Rusu, C. (1997). Human resources management, Economică Publishing
House, Bucharest.
[8] Maxwell, A. (1999). Supreme law of the 21 management, Amalteea Publishing House, București.
[9] Mayer, R.C., Davis, J.H., Schoorman, F.D. (1995). An integration model of organizational trust,
The Academy of Management Review, 20 (3): 709-734.
Volume VIII, Issue 3(25), Fall 2013
LOGISTIC OPTIMIZATION OF THE COMPLEX MANUFACTURING SYSTEM WITH PARALLEL PRODUCTION LINES
Robert BUCKI
Institute of Management and Information Technology, Bielsko-Biała, Poland
Petr SUCHÁNEK
Silesian University in Opava
School of Business Administration in Karviná, Czech Republic
Bronislav CHRAMCOV
Tomas Bata University in Zlín
Faculty of Applied Informatics, Czech Republic
Abstract: The paper highlights the problem of mathematical modeling of a complex manufacturing system which
is a potential synthetic representation of a real production environment. Production lines are parallel. Each
production line consists of work stations which are placed serially along the predetermined trajectory. Each
work station is equipped with the predefined tool used to manufacture the dedicated product. The system is
controlled by means of heuristic algorithms to meet the manufacturing criteria. Equations of state illustrate the
behavior of the system at every stage.
The paper shows basic characteristics of current manufacturing systems emphasizing models for further
optimization and simulation processing. First of all, the general background related to this topic is given. The
second part of the paper focuses on the specific manufacturing system and suggests the ways of optimizing it to
meet the given criteria with the use of heuristic algorithms.
Keywords: manufacturing system, model, logistics, mathematical modelling, optimization, simulation, heuristic
algorithms, manufacturing criteria.
JEL Classification: C20, C61, C63
1. Introduction
Manufacturing companies in the 21st century face unpredictable, high-frequency market
changes driven by global competition. To stay competitive, companies must possess new types of
manufacturing systems that are cost-effective and very responsive to all these market changes. In this
context, increasing emphasis is put on the so called reconfigurable manufacturing systems (RMS)
whose components are reconfigurable machines and reconfigurable controllers as well as
methodologies for their systematic design and rapid ramp-up. They are the cornerstones of this new
manufacturing paradigm (Koren, 1999). New manufacturing and production systems and requirements
placed on them implement new approaches for their development, optimization and, in general,
management. It is always necessary to take into account the purpose of the system to define its type
and architecture. Other indispensable modeling elements to be considered are monitoring operations,
optimization and simulation. The primary component of each model is, of course, its mathematical
description enabling and facilitating the system optimization. In connection with the above, the main
objective of the article is to present a concrete example of the optimization of the manufacturing
system which consists of production lines which are arranged in a parallel way.
Conclusions
In fact, each manufacturing system must be modelled in an independent way based on
autonomous assumptions. Software engineering is responsible for delivering the ready product in the
form of a simulator imitating the discussed production activity. The specification is the first step and
cannot fail the needs of the synthetic environment representing the real system. The following step is
to carry out the modeling process. These two steps are mutually connected and lead to creating the
software which, after a successful testing process, can be used to train operators of the potential
manufacturing system.
Journal of Applied Economic Sciences
The manufacturing system presented hereby requires the control approach which is based on
heuristic algorithms to meet the stated criterion or criteria. The result of this publication is to lead to
creating fully functional software which could ease a training process for operators of manufacturing
systems similar in nature and minimize the period of time devoted to preparing the staff responsible
for introducing a new set of products in a similar manufacturing environment.
Acknowledgement
This paper was supported in part by project “Innovation of study programs at Silesian
University in Opava, School of Business Administration in Karviná” Nr. CZ.1.07/2.2.00/28.0017 and
in part by European Regional Development Fund within the project CEBIA-Tech No.
CZ.1.05/2.1.00/03.0089.
References
[1] Antonyová A. et al. (2013). Hygrothermal Properties of Building Envelopes: Reliability of the
Effectiveness of Energy Saving, Journal Energy and Buildings, 57: 187–192.
[2] Buzacott, J.A., Shanthikumar, J.G. (1993). Stochastic Models of Manufac-turing Systems, Prentice
Hall, New Jersey.
[3] Charalambous, C., (1997). Applying GAs to complex problems: the case of scheduling multi-stage
intermittent manufacturing systems, in: Proceedings of Second International Conference on
Genetic Algorithms in Engineering Systems: Innovations and Applications, Galesia 97, pp 467 –
471.
[4] Chen, F.F., Thinphangnga, S., (1996). Analytical modeling and analysis of flexible manufacturing
systems considering system component failure/repair rates, Journal of Manufacturing Systems,
15(3): 143-154.
[5] Groover, M.P. (2010). Fundamentals of Modern Manufacturing: Materials, Processes, and
Systems, 4th Edition, Willey.
[6] Josuttis, N., (2012). The C++ Standard Library: A Tutorial and Reference, 2nd
Edition. Addison-
Wesley Professional, p. 1128.
[7] Koren, Y., Heisel, U., Jovane, F., Moriwaki, T., Pritschow, G., Ulsoy, G., Brussel, H. (1999).
Reconfigurable Manufacturing Systems, CIRP Annals - Manufacturing Technology, 48(2):527–
540.
[8] Li, W., Gao, L., Li, X. (2009). Application of Intelligent Strategies for Cooperative Manufacturing
Planning, Journal of Universal Computer Science, 15(9): 1907 – 1923.
[9] Marecki, J., Łużny, D., Marecki, F. (2010). Logistyka informatyczna kompleksów operacji.
Wyższa Szkoła Informatyki i Zarządzania, Bielsko-Biała.
[10] Marzano, A. (2009). Manufacturing system simulation, in: VDM Verlag.
[11] Modrák, V., Moskvich, V. (2012). Impacts of RFID implementation on cost structure in
networked manufacturing, International Journal of Production Research, 50 (14): 3847-3859.
[12] Modrák, V., Pandian, R.S., (2010). Flow shop scheduling algorithm to minimize completion time
for n-jobs m-machines Problem, Tehnicki Vjesnik, 17(3): 273-278.
[13] Padhi, S.S., Wagner, S.M., Niranjan, T.T., Aggarwal, V. (2013). A simulation-based
methodology to analyse production line disruptions, International Journal of Production
Research, 51(6): 1885-1897.
[14] Pardalos, P. (1999). Parallel processing of discrete problems, The IMA Volumes in Mathematics
and its Applications, 106: 1 – 54.
[15] Rezaie, K., Shirkouhi, S.N., Alem, S.M. (2009). Evaluating and selecting flexible manufacturing
systems by integrating data envelopment analysis and analytical hierarchy process model,
Proceedings of Third Asia International Conference on Modelling & Simulation, Volume 1 and
2, pp. 460-464.
[16] Řepa, V. (2006). Podnikové procesy - Procesní řízení a modelování, Praha: Grada Publishing.

Volume VIII, Issue 3(25), Fall 2013
[17] Shivanand, H.K., Benal, M.M., Koti, V. (2006). Flexible Manufacturing System, New Age
International Pvt Ltd Publishers.
[18] Šperka, R., Spišák, M. (2012). Tobin tax introduction and risk analysis in the Java simulation,
Proceedings of 30th International Conference Mathematical Methods in Economics, Part II.
Silesian University in Opava, pp. 885-890.
[19] Vuuren, M. (2007). Performance Analysis of Manufacturing Systems, Technische Universiteit
Eindhoven.
[20] Vymětal, D. (2009). Value chain and process models. Is the gap between them real?, Proceedings
of International Conference on Distance Learning, Simulation and Communication, Brno.
[21] Worswick, G. (1957). The convexity of the production possibility function, The Economic
Journal, 67(268): 748-750.
[22] Wright, T.R. (2000). Manufacturing Systems. Goodheart-Willcox Co Inc., US; 2nd
Revised
edition.
Journal of Applied Economic Sciences
AN ANALYSIS OF INTERNAL MIGRATIONS ON THE BASIS OF PROVINCES IN TURKEY WITH THE PERFORMANCE INDICATORS:
A SPATIAL PROBIT MODEL
Fatma ZEREN
1Inonu University, Department of Econometrics, Malatya, Turkey
Sevinç Yaraşır TÜLÜMCE
Department of Public Finance, Pamukkale University, Turkey
Abstract:
As a controversial topic in developed and developing countries, migration has been a dynamic field
explained on the basis of cause and effect by economists. Migration is the movement of people from one
settlement to another. In all countries, migration occurs as the result of economic, social, and political causes.
In Turkey, the migration from east to the west mostly results from regional and provincial disparities. The
advancement and industrialization of western provinces in comparison to the eastern provinces is deemed a
critical factor in the rise of Turkey’s internal wave of migration. As a result, it became necessary to analyze the
migration-triggering factors on a provincial basis. In this study, determinants of the net migration level in the
NUTS 3 level of 81 provinces in Turkey for the year 2000 have been estimated by using a spatial probit model.
Findings demonstrate the positive and significant effects of industrialization, welfare, and human capital on the
level of net migration. Another finding of this research is that there is spatial dependence between provinces.
Keywords: migration, ınternal migration, spatial econometrics, spatial probit models, Turkey, critical cut-off
neighbourhood.
JEL: C31, C34, F22, R23
1. Introduction
Movement of people from one geographical territory to another is called migration. There are
many causes of migration, including the economic, social, and cultural. Migrations are analyzed with
respect to their causes in relevant literature, and there are some studies focusing on their effects.
In relevant literature, the migration phenomenon is treated within the framework of diversified
approaches. A group of researchers has focused on migration decisions with respect to the return-costs
approach; some have analyzed migration on the basis of push-pull approach, while others have
concentrated on the qualifications of migrants by employing a selective approach.
In the present study, the first step has been to render a perspective on migration literature by
providing information on internal migrations and migration approaches. Next, numerical analysis of
migration figures between provinces in Turkey has been given, and determinants of internal migration
have been tested by using a set of industrialization and development performance indicators. The
empirical analysis for the 81 provinces at a NUTS 3 level by employing the Spatial Probit Model is
provided.
Conclusion
Migration is described as the movement of people from one settlement to another, and
migrations are studied under a set of classifications. Nonetheless, many literature studies dwell on
causes and effects of internal and external migration. Labor is treated within the framework of
different questions by regional and development economists. There is a wide scope of literature
focusing on the triggering factors of migration, effects of push-pull factors, whether the qualifications
of people affect their migration decisions, the way migration takes place, and effects of migration on
the labor market. In the studies, these questions are treated according to return-costs, pull-push, and
selective approaches. Contrary to the great number of studies on developed states and external
migration, there are many studies focusing on the internal migration phenomenon in developing
countries. Nonetheless, the internal migration phenomenon in Turkey has been the focal point of
several studies.
Volume VIII, Issue 3(25), Fall 2013
In Turkey, the migration phenomenon started in the 1950s and gained impetus in the 1980s.
The migration movement after the 1980s has mostly taken place from rural areas to the city and from
city to city. Migration is bound to several factors including the economic, social, and cultural.
Nevertheless, the intercity migration in Turkey is generally directed to developed and industrialized
western provinces. It can thus reasonably be argued that one of the most salient economic causes of
intercity migration is development disparities and inequalities between provinces.
In this paper, the determinants of interprovince migration have been analyzed with particular
performance indicators by using the spatial probit model. These findings demonstrate that the variable
IND indicating industrialization level, variable EDU indicating human capital, and variable ELEC
indicating welfare level are positively effected by the level of net migration. Accordingly,
industrialized provinces with high welfare levels that provide job opportunities for a qualified labor
force, including higher numbers of small industry sites, receive higher levels of migration.
Parallel to the population rise in western provinces as a result of migration, there is an
increased demand for public services, which inevitably introduces a set of problems. Within this
vicious cycle, the spending directed to industrialized western provinces is also elevated. Toward the
aim of mitigating migration and filling the disparity across provinces, it is necessary to turn
unindustrialized and underdeveloped provinces into attraction centers. To achieve that objective,
effects of push-pull factors causing intercity migration need to be removed and policies should be put
into effect in a macro framework. The foremost objective in all envisaged state policies should
consider the individual qualities of every single province, thus removing existing disparities between
provinces.
References
[1] Akarca, A.T. and Aysit T. (2002). South-West as the new internal migration destination in Turkey.
Discussion Paper, 6627: 1-17.
[2] Bahar, O. and Fehime K. Bingöl. (2010). Türkiye’deki İç Göç Hareketlerinin İstihdam ve İşgücü
Piyasalarına Etkileri, SDÜ İİBF Dergisi, 15(2): 43-61.
[3] Başel, Halis. (2007). Türkiye’de Nüfus Hareketlerinin ve İç Göçün Nedenleri. İ.Ü. Sosyal Siyaset
Konferansları Dergisi, 53: 516-542.
[4] Beyene, Barhe M. (2011). determinants of internal and international migration in Ethiopia.
Memorandum, 24: 1-48.
[5] Bodvarsson, O.B., Van Berg, H. (2009). The Economics of Immigration Theory and Policy. New
York: NY, Springer.
[6] Brown, A.N. (1997). The economic determinants of internal migration flows in Russia during
translation. Working Paper, 89: 1-33.
[7] Bülbül, S., Köse, A. (2010). Türkiye’de Bölgelerarası İç Göç Hareketlerinin Çok Boyutlu
Ölçekleme Yöntemi İle İncelenmesi. İ.Ü. İşletme Fakültesi Dergisi, 39(1): 75-94.
[8] Case, A. (1992). Neighborhood influence and technological change. Regional Science and Urban
Economics, 22: 491-508.
[9] Çelik, F. (2002). İç Göçlerin Seçkinlik Yaklaşımı İle Analizi. EU. Sosyal Bilimler Enstitüsü
Dergisi, 13: 275-296.
[10] Çelik, F. (2007). Türkiye’de İç Göçler: 1980-2000. Erciyes Üniversitesi Sosyal Bilimler Enstitüsü
Dergisi, 22: 87-109.
[11] Çiftçi, M. (2010). 1995-2000 Dönemi İç Göç Hareketlerinde Emeğin Varış Yerlerindeki Çekim
Güçlerine Göre Mukayeseli Duyarlılık Düzeyleri. Çalışma ve Toplum, 24(1): 277-292.
[12] Ercilasun, M.., E. Ayşen Hiç Gencer and Özgür Emir Ersin. (2011). Türkiye’deki İç Göçleri
Belirleyen Faktörlerin Modellenmesi. International Conference on Eurasian Economies 12(14):
319-324
Journal of Applied Economic Sciences
[13] Evcil, Nilay, Vedia Dökmeci and Gülay Kiroplu. (2006). Regional Migration in Turkey Its
Directions and Determinants. Paper presented at the international meeting for 46th European
Congress of the Regional Science Association, August 30th -September 3
rd, Volos, Greece
[14] Farwick, A. (2009). Internal migration-challenges and perspectives for the research infrastructure.
Working Paper Series, 97: 1-16.
[15] Gedik, Ayşe. (1992). The effects of in-and out-migration on urban growth in Turkey (1965-1985)
and a comparison with the developed countries. Papers in Regional Science, 71(4): 405-419.
[16] Gezici, F.; and Berna Keskin (2005). Interaction between regional inequalities and internal
migration in Turkey. ERSA Conference Papers, 1-18.
[17] Greenwood, M.J. (1995). Human Migration: Theory, Models and Empirical Studies. Journal of
Regional Science, 25: 521-544.
[18] Gürbüz, M., Karabulut, M. (2008). Kırsal Göçler ile Sosyo-Ekonomik Özellikler Arasındaki
İlişkilerin Analizi. Türk Coğrafya Dergisi, 50: 37-60
[19] Han, E., Kaya, A.A. (2006). Kalkınma Ekonomisi Teori ve Politika. Ankara: Nobel Yayınları
[20] Harris, J., Todaro M. (1970). Migration, Unemployment and Development: A Two Sector
Analysis. American Economic Review, 60(1): 126-142.
[21] Kainth, Gursharan Singh (2009). Push and Pull Factors of Migration: A Case of Brick Kiln
Industry of Punjab State, Asia Pasific Journal of Social Sciences, 1(1): 82-116.
[22] Karabulut, Kerem and Dilek, Polat. (2007). Türkiye’de Yaşanan Göç Olgusu Üzerine Bir Alt
Bölge Uygulaması. 8. Türkiye Ekonometri ve İstatistik Kongresi, İnönü Üniversitesi, Malatya, 1-
15.
[23] Kırdar, M. and Şirin Saraçoğlu. (2012). İç Göç, Bölgesel Yakınsama Sorunu ve Ekonomik
Büyüme: Türkiye Örneği. Türkiye Ekonomi Kurumu Tartışma Metni 1-16.
[24] Lee, Everett S. (1996). A theory of migration. Demography, 2: 47-57.
[25] Martin, P., Gottfried Zurcher. (2008). 9 Managing Migration: The Global Challence. Population
Bulletin, 63(1): 1-19
[26] McArthur, D. Thorsen, I. (2010). Determinants of internal migration in Norway. ERSA
Conference Papers, 1-25.
[27] McMillen, Daniel P. (1992). Probit with spatial autocorrelation. Journal of Regional Science, 32:
335-348.
[28] Öztürk, Mustafa and Nihat Altıntepe. (2008). Türkiye’de Kentsel Alana Göç Edenlerin Kent ve
Çalışma Hayatına Uyum Durumları: Bir Alan Araştırması. Journal of Yasar University, 3(11):
1587-1625.
[29] Pazarlıoğlu, V. (2007). İzmir Örneğinde İç Göçün Ekonometrik Analizi. Yönetim ve Ekonomi,
14(1): 121-135.
[30] Tekeli, İ. (1975). Göç Teorileri ve Politikaları Arasındaki İlişkiler. ODTÜ Mimarlık Fakültesi
Dergisi, 1(1): 153-176.
[31] Todaro, M. (1980). Internal Migration in Developing Countries: A Survey, NBER, 361-402.
[32] Topbaş, Ferhat and Banu, Tanrıöver. (2009). Türkiye’de İç Göç Akımları Üzerine Bir Çalışma:
Lowry Hipotezi. DEU İİBF Dergisi, 24(1): 93-104.
[33] Velazques, F.C. (2000). Approaches to the Study of International Migratin: A Review. Estudios
Fronterizos, 1(1): 137-168.
[34] Yakar, M. and Hakkı, Yazıcı. (2009). Afyonkarahisar Kentinde Göçlerin Seçkinlik Yaklaşımı İle
Analizi (1990-2000). SDU Fen Edebiyat Fakültesi Sosyal Bilimler Dergisi, 20: 55-172.

Volume VIII, Issue 3(25), Fall 2013
[35] Yamak, R., Yamak, N. (1999). Türkiye’de Gelir Dağılımı ve İç Göç. DEU Sosyal Bilimler
Enstitüsü Dergisi, 1(1): 16-29.
*** Packages McSpatial http://cran.r-project.org/web/packages/McSpatial/McSpatial.pdf, (accessed
18. 12.2012)
Journal of Applied Economic Sciences
THE STUDY OF LOGISTIC PARKS IN THE CZECH REPUBLIC
Karla JURÁSKOVÁ
VŠB - Technical University of Ostrava, Czech Republic
Pavla MACUROVÁ
VŠB - Technical University of Ostrava, Czech Republic
Abstract:
The article examines the representation and structure of logistic parks in the Czech Republic. Logistic
parks in the article are complexes rented by park operators where more providers of logistics services perform
their activities. A database of logistic parks has been created and analyzed by descriptive statistics and Pareto
analysis methods. At the same time, two detailed case studies were carried out and information from secondary
sources related to logistic real estate property was analyzed. It was found that there are many new logistic parks
in the Czech Republic, whose launch was often facilitated by the state and more parks are under construction.
The parks are exclusively privately owned and have a mixed structure of tenants (logistic firms and
manufacturing companies). The providers of logistic services begin to prefer renting space in logistic parks to
building and managing their own capacities. The following issues have been identified: the location of parks
usually does not allow taking advantage of multimodality in transport, there are environmental constraints
regarding the expansion of existing parks, and random method of tenant selection brings little support of
synergy.
Key words: logistic park, logistic centre, supply chain, third party of logistics, logistic providers, multimodality.
JEL Classification: C83, D39, L87, L98, M19, O14, O18, R33, R58, R14
1. Introduction and objective of the article
This article was written as part of a research project focused on examining the trends of
development of providers of complex logistic services. The development of activities of organizations
providing complex logistic services is, among other things, dependent on the capacities and on the
level of the logistic infrastructure in question, which also includes logistic parks.
The objective of this article is to map the character and representation of logistic parks in the
Czech Republic, to assess the approaches to their building, to identify other anticipated trends and to
formulate the questions for further research and practice.
When the topic of this article is elaborated, the initial part discusses the terminology regarding
logistic parks and defines the theoretical requirements concerning the purpose of the parks. Once the
research questions have been formulated, Paragraph 3 describes the methodology used for the
conducted investigations, which combined the results of a statistical survey and two case studies with
insights acquired from secondary sources. The results of the data analysis are presented in detail in
Paragraph 4 and their synthesis is performed in the final part of this article, where the possible
directions for further research are also formulated.
Conclusions
The conducted surveys lead to a conclusion that building numerous logistic parks in a
relatively short period of time after 2000 has led to the creation of large capacities for logistic
operations and has made the development of logistic service providers easier, including the
introduction of modern logistics technologies. It is not insignificant that thousands of jobs have been
created as well.
An important fact is that all the parks are private, although the start of many of them was
facilitated by the state and territorial administration authorities. The occurrence of a public logistic
park operating on the principle of Public-Private Partnership has not been recorded.
The discovered fact that both logistic and manufacturing companies are located in the parks,
brings hope that there may be synergies in the supply chain, but research has indicated that the
structure of the tenants in the same park is created quite randomly, which means the elements of
synergy among the logistic companies, or between manufacturing and logistics firms are sporadic.
Volume VIII, Issue 3(25), Fall 2013
Uneven spatial distribution of the parks revealed by the analysis is partly due to limited
available space in the densely populated Czech Republic. However, it can also be attributed to some
misconceptions influenced by the actual needs of private investors. It seems that the needs to
rationalize traffic flows in terms of larger areas were not sufficiently taken into account during the
construction of parks. The construction of parks mainly in green fields has caused environmental
burden to countryside.
Multimodal logistic parks are not represented in the Czech Republic. The park mentioned in
case study no. 2 may become an exception. In some parks that are connected only to road transport,
there is a possibility to consider the completion of a railway spur track; however, this solution may
face significant territorial and financial limitations. For many supply chains, the absence of the
connection of parks to railway transport may become a handicap if the pressure on the economic
efficiency and the use of environmentally friendly types of transport is increasing. The question
therefore is whether some tenants of existing parks won´t leave in the future for that very reason.
The need to build more logistic parks in areas that will be carefully selected in order to support
multimodality, to streamline the flows and to protect the inhabitants from the negative effects of traffic
is expected to intensify. This is the reason why the challenge in such a situation is to join the forces of
public resources and private investors so as to build public logistic parks funded and managed using
the principle of Public-Private Partnership.
The authors of this article are aware of the limitations of the conclusions drawn from the
study, as the range of logistic parks that have been identified was not complete and the depth of the
analysis was limited by the available data. With regard to the dynamics of the business environment, it
is also necessary to count with very limited validity of the findings in time. The interest in logistic
parks and the tenant structure may change in the future, among other factors, depending on the overall
economic development not only in the Czech Republic but also in the world.
It will be desirable to continue in the research of logistic parks. The directions we consider to
be suitable for further research include searching for ways to enhance synergies in logistics through
well-situated and well-occupied logistic parks. For this purpose, it would be appropriate to conduct a
survey of public logistic parks abroad, and to identify good practices in this area.
Acknowledgement
This article was created with the support of specific research project SP2013/21 Research of
factors and tendencies of development of organizations provided complex logistics services with stress
on integrating function in supply chains.
References
[1] Dutková, M., Dutko, S., Bigoš, P. (2009). Logistické centrá na Slovensku. Zdvihací zařízení
v teorii a praxi 71, no. 2, [cit. 2013-5-6]. http://www.342.vsb.cz/zdvihacizarizeni/zz-2009-2.pdf.
[2] Gardner, K. (2013). What is a Logistic Park?. [cit. 2013-7-5]. http://www.gardnerkansas.
gov/images/uploads/Administration/Intermodal/WhatisaLogisticsPark.pdf.
[3] Hendl, J. (2005). Kvalitativní výzkum.Thirth Edition. Portál.
[4] Karlsson, C. (2009). Research in operations management. First Edition. Routledge.
[5] Libora, P. (2013). Firmy hledají peníze pro své investice. Systémy logistiky, 13(122) : 16-17.
[6] Ludvík, L., Peterková, J. (2013). Specifics of size structure and managing role of the large
companies in enterprise environment in the Czech Republic. Journal of Applied Economic
Sciences, VII (1(23)): 63 – 72.
[7] Míková, J., Dorda, M. Famfulík, J. (2008). Veřejné logistické centrum v Moravskoslezském kraji.
PernersContact, Univerzita Pardubice, [cit. 2013-5-4]. http://pernerscontacts.upce.cz/11_
2008/mikova.pdf.
[8] Roudná, J. (2001). Prostorová lokalizace logistických center v ČR, PhD diss., University of
Pardubice.
Journal of Applied Economic Sciences
[9] Soukup, L. (2009). Koncepce veřejných logistických center. [cit. 2013-6-14]. http://logistika.ihned.
cz/c1-38232480-koncepce-verejnych-logistickych-center.
*** Atoz Logistics. 2013. Logistická kniha seznamů 2012. Systémy Logistiky.
*** CBRE. Labour & Warehouse Availability – CZ. MarketView. CBRW Global Research and
Consulting. http://www.cbre.eu/portal/pls/portal/res_rep.show_report?report_id=2793.
*** CzechInvest. Strategické průmyslové zóny. [cit. 2013-11-6]. http://www.czechinvest.org/
strategicke-prumyslove-zony.
*** DTZ. Property Times. Czech Republic Industrial Q1 2013. www.dtz.com.
*** Europlatforms. 2004. Logistics Centres Directionsfor Use. A report by EUROPLATFORMS
EEIG January 2004. [cit. 2013-6-14]. http://www.unece.org/fileadmin/DAM/trans/main/eatl/
docs/EN-REV-What_is_a_Freight_VillageFinalcorretto.pdf.
*** City of Ostrava. 2013. City of Ostrava - Real Estate Report – April 2013.
Volume VIII, Issue 3(25), Fall 2013
TECHNICAL EFFICIENCY OF TOP 50 WORLD BANKS
Kristína KOČIŠOVÁ
Technical University of Košice
Faculty of Economics, Slovak Republic
Abstract:
This study investigated the relative technical efficiency of top 50 world banks in 2011. In particular, the
overall technical efficiency, pure technical efficiency and scale inefficiency were estimated and the reasons of
inefficiency were defined. We distinguished three main approaches in evaluating efficiency: production,
intermediation and operational approach to find out, which banks were the most efficient. The average efficiency
scores were evaluated separately on the “national” and “international” level. In case of “international”
approach the average efficiency scores were calculated from data of all 50 banks. If “national” approach was
applied the average efficiency scores were calculated from data of banks in four regions, determined by the
world´s continents (America, Asia, Australia, and Europe).
The study concludes that almost all banks reported lower intermediation efficiency than the operating
efficiency; the production efficiency was the lowest one. The results suggest that American and European banks
were less efficient than Asian and Australian, which may be due to lingering financial crisis, which affected
mainly the American and European financial market. In this study we also investigated the interaction between
efficiency and other bank specific variables like total assets, indicators of profitability, intermediation ratio, etc.
The results suggest that variables total assets and loan to deposit ratio were significantly positively, and variable
cost to income ratio was significantly negatively related to the pure technical efficiency.
Keywords: bank efficiency, data envelopment analysis, top 50 world banks.
JEL Classification: C14, G21
1. Introduction
Efficiency of banks and other financial institutions is very frequently discussed topic in
literature. Efficiency of banking system is one of the most important issues in the financial market as
efficiency of banks can affect the stability of the banking industry and thus the effectiveness of whole
monetary system. (Yilmaz, 2013)
Bank efficiency can be measured by different methods. The earliest techniques, used to
measure efficiency through ratio analysis, which examined the financial statements of individual
banks and compared them with benchmark. Now, there is also number of other methods for efficiency
measuring. We can talk about the parametric and non-parametric methods, which employ different
techniques to envelop a data set with different assumption for random noise and for the structure of
production technology (Stavarek and Repkova, 2012). Parametric methods include the Stochastic
Frontier Approach (SFA), Thick Frontier Approach (TFA) and Distribution Free Approach (DFA).
These methods measure economic efficiency. Non-parametric methods include Data Envelopment
Analysis (DEA) and the Free Disposal Hull (FDH) and measure technical efficiency of production
units.
This study had three objectives. The first objective was to estimate the overall technical
efficiency, pure technical efficiency, scale efficiency of top 50 commercial banks in the world and to
identify the reasons of efficiency. For estimation of relative efficiency, non-parametric method of Data
envelopment analysis (DEA) has been used. We evaluated relative technical efficiency of top 50 world
banks in 2011. The Banker Database published list of top 50 world banks. The criterion for selecting
the top 50 world banks was the value of Tier 1 capital. The second objective was to compare the
average efficiency of banks in different regions. Since we know that averaging without any respect of
size of banks causes loss of information, we implemented into analysis also sized-adjusted average
efficiency to compare the average efficiency in different regions. The third objective was to define the
input and output variables (strengths and weaknesses) that influence efficiency of evaluated banks, and
to find out the factors (bank specific variables like total assets, profitability, rate of intermediation etc.)
positively and negatively related to the pure technical efficiency. The strengths and weaknesses that
Journal of Applied Economic Sciences
influence efficiency were defined through the values of weights calculated in the DEA models and
regression analysis was used to explain the factors that were related to efficiency.
The structure of the paper is following. Section 2 presents review of literature about usage of
DEA model in banking area; section 3 presents methodology; selection of variables and results of
analysis are described in section 4; and the last section concludes the paper with summary of key
findings.
Conclusion
In this study, efficiency of top 50 world banks was investigated using DEA. The highest level
of average overall efficiency (CCR model) was obtained in case of operating approach; so we can say
that the banks were the most efficient in management of costs and revenues. On the other hand
average pure technical efficiency (BCC model) was highest under the intermediation approach,
indicating the highest economic viability of banks. The average efficiency under production approach
was the lowest one, in both CCR and BCC model, which means, that the banks achieved the lowest
cost efficiency.
In case of production approach, efficiency was negative influence mainly by input “personal
costs” and the output “total loans” positive influenced on efficiency. Under intermediation approach
the efficiency was negative influence by input “fixed assets”; positive by output “total loans”. If the
operating approach was applied the efficiency was negative affected by input “personal costs” and
positive affected by output “interest income”.
It was found that that as the international frontier was divided into national frontiers, the
average efficiency scores decline in case of American and European banks; and increased in case of
Asian and Australian banks. On the “national” level almost all of banks reported lower intermediation
efficiency than the operating efficiency; the production efficiency was the lowest one.
Regression was used to identify factors that influence efficiency. From the group of variables
of bank size, profitability and rate of intermediation, only in case of three variables were found
significant impact. It was found that variables total assets and loan to deposit ratio were significantly
positively related, and variable cost to income ratio was significantly negatively related to the pure
technical efficiency.
References
[1] Banker, R.D., Charnes, A., Cooper, W.W. (1984). Some models for estimating technical and scale
inefficiencies in data envelopment analysis. Management Science, 9: 1078–1092.
[2] Casu, B., Molyneux, P. (2003). A comparative study of efficiency in European banking. Applied
Economics, 17: 1865-1876.
[3] Charnes, A., Cooper, W., Rhodes, E. (1978). Measuring the Efficiency of Decision-making Units.
European Journal of Operational Research, 6: 429-444.
[4] Karimzadeh, M. (2012). Efficiency analysis by using Data Envelop Analysis model: evidence from
Indian banks. International Journal of Latest Trends in Finance and Economic Sciences, 3: 228-
237.
[5] Kočišová, K. (2013). An analysis of bank efficiency in the Slovak and the Czech Republic by data
envelopment analysis. Paper presented at the International Conference QUAERE 2013, May 20 –
24, in Hradec Králové, Czech Republic. http://www.vedeckekonference.cz/library/proceedings/
quaere_2013.pdf.
[6] Mostafa, M.M. (2009). Modeling the efficiency of top Arab banks: A DEA-neutral network
approach. Expert Systems with Applications, 36: 309-320.
[7] Pastor, J.M., Pérez, F., Quesada, J. (1997). Efficiency analysis in banking firms: An international
comparison. European Journal of Operational Research, 2: 395-407.
[8] Seiford, L.M., Zhu, J. (1999). Profitability and marketability of the top 55 US commercial banks.
Management science, 9: 1270-1288.
Volume VIII, Issue 3(25), Fall 2013
[9] Sherman, D., Gold, F. (1985). Branch operating efficiency: Evaluation with data envelopment
analysis. Journal of Banking and Finance, 9: 297-315.
[10] Stavárek, D. (2003). European Banking Efficiency: A Cross-Country Analysis of Transition and
Developed Banking Sectors. Paper presented at the Fifth International Conference Aidea Giovani:
Information, Markets and Firms, in Milano, Italy.
[11] Stavárek, D. (2004). Banking efficiency in Visegrad countries before joining the EU. European
Review of Economics and Finance, 3: 129-167.
[12] Stavárek, D., Řepková, I. (2012). Measuring the efficiency in the Czech banking industry: a non-
parametric approach. Acta Universitatis Agriculturae et Silviculturae Mendelianea Brunensis, 2:
357-366.
[13] Yilmaz, A.A., (2013). Bank efficiency analysis in Turkish banking system. Paper presented at the
WEI International Academic Conference, in Antalya, Turkey. http://www.westeastinstitute.com/
wp-content/uploads/2013/02/ANT13-260-Ayse-Altiok-Yilmaz-Full-Paper.pdf.
[14] Yue, P. (1992). Data Envelopment Analysis and Commercial Bank Performance: A Primer with
Applications to Missouri Bank. Federal Reserve Bank of St. Louis, Economic Review, 74
(January/February): 31-45.
[15] Zijang, Y. (2006). A two-stage DEA model to evaluate the overall performance of Canadian life
and health insurance companies. Mathematical and computer modelling, 7-8: 910-919.
Journal of Applied Economic Sciences
FISCAL IMBALANCES AND CURRENT ACCOUNT ADJUSTMENTS IN THE EUROPEAN TRANSITION ECONOMIES
Rajmund MIRDALA
Faculty of Economics
Technical University of Košice, Slovakia
Abstract
Origins and implications of twin deficits occurrence in a large scale of countries seems to be a center of
rigorous empirical as well as theoretical investigation for decades. The reality of persisting fiscal and current
account deficits became obvious in many advanced as well as advancing, emerging and low-income countries
seemingly without a direct association with the phase of business cycle or trends in key fundamental indicators.
European transition economies experienced current account deficits during the most of the pre-crisis period.
Despite generally improved economic environment and high rates of economic growth it seems that countries
with weaker nominal anchor experienced periods of persisting fiscal imbalances during the most of the pre-crisis
period. Crises period affected both fiscal stance of government budgets and current account pre-crisis levels and
trends in all countries from the group. As a result, leading path of both indicators significantly changed.
In the paper we analyze effects of fiscal policies on current accounts in the European transition
economies. Our main objective is to investigate causal relationship between fiscal policy discretionary changes
and associated current account adjustments. We identify large episodes of current account and fiscal policy
changes to provide an in-depth insight into frequency as well as parallel occurrence of deteriorations
(improvements) in current accounts and fiscal stance of government budgets. From employed VAR model we
estimate responses of current accounts in each individual country to the cyclically adjusted primary balance
shocks.
Keywords: fiscal imbalances, current account adjustments, economic crisis, vector autoregression, impulse-
response function.
JEL Classification: C32, E62, F32, F41, H60
1. Introduction
Origins and implications of twin deficits occurrence in a large scale of countries seem to be a
center of rigorous empirical as well as theoretical investigation for decades. The reality of persisting
fiscal and current account deficits became obvious in many advanced as well as advancing, emerging
and low-income countries seemingly without a direct association with the phase of business cycle or
trends in key fundamental indicators. However, flows of capital resulted from excessive external
imbalances followed by the periods of large current account deficits obviously strengthened intention
of policy makers as well as academics to investigate the contribution of internal and external sources
of current account imbalances to associated foreign debt accumulation.
European transition economies experienced periods of improved conditions for maintaining
the overall macroeconomic stability during the last decade. Accelerated convergence toward western
European countries associated with high real output growth rates implied increased intention to reduce
excessive internal (fiscal deficit) and external imbalances (current account deficit) to maintain fast
economic growth. Despite relatively high rates of growth in export performance, all countries from the
group experienced current account deficits during the most of the pre-crisis period.
Fast economic growth, EU membership as well as euro adoption perspectives strengthened
appreciation pressures on nominal exchange rates in all European transition economies but countries
with pegged exchange rate arrangements (Bulgaria, Estonia, Latvia and Lithuania) (Stavarek, 2012).
At the same time, real exchange rates in all countries from the group appreciated steadily despite
adopted exchange rate arrangement while having relatively low negative interference with their export
performance (Mirdala, 2013b). As a result, exchange rate leading paths seem to have just negligible
negative effects on the current account determination in the European transition economies during the
last decade.
Despite generally improved economic environment and high rates of economic growth,
countries with weaker nominal anchor experienced periods of persisting fiscal imbalances during the
Volume VIII, Issue 3(25), Fall 2013
most of the pre-crisis period. As a result, sovereign debt accumulation in Czech republic, Hungary,
Poland, Romania, Slovak republic and Slovenia resulted from persisting fiscal deficits. Contrary, in
Bulgaria, Estonia, Latvia and Lithuania we have observed a significant improvement in the sovereign
debt to GDP ratio followed by the periods of much more prudential fiscal discipline necessary to
maintain a sustainability of tough exchange rate arrangement.
Crises period affected both fiscal stance of government budgets and current account pre-crisis
levels and trends in all countries from the group. As a result, leading path of both indicators
significantly changed. Negative implications of the economic and debt crisis revealed questions
associated with disputable implications of fiscal incentives that seem to be contrary to the crucial need
of the effective fiscal consolidation that is necessary to reduce excessive fiscal deficits and high
sovereign debts. While the challenges addressed to the fiscal policy and its anti-cyclical potential rose
steadily but not desperately since the beginning of the economic crisis, the call for fiscal consolidation
became urgent almost immediately and this need significantly strengthen after the debt crisis
contagion flooded Europe. Overall fiscal budgetary stance thus became determined by mutually
contrary discretionary fiscal forces while remained affected by lagging recession. Economic crisis has
also intensified redistributive effects (cross-country expenditure shifting) that provided quite diverse
and thus spurious effects on current account adjustments. Immediately after the beginning of the crisis
the current accounts temporary deteriorated (with quite differing intensity in each particular economy).
However, we have soon observed a positive trend (either by improvement or stable outlook) in almost
all countries reflecting intensified redistributive effects of the crisis on the cross-country expenditure
shifting.
In the paper we analyze effects of fiscal policies on current accounts in the European transition
economies. Our main objective is to investigate causal relationship between fiscal policy discretionary
changes and associated current account adjustments. From employed VAR model we estimate
responses of current accounts in each individual country to the cyclically adjusted primary balance
shocks. To provide more rigorous insight into the problem of the current account adjustments
according to discreet changes in fiscal policy associated with cyclically adjusted primary balance
changes we estimate models for each particular country employing data for two subsequent periods
2000-2007 (pre-crisis period) and 2000-2012 (extended period). This approach should help us to
examine specific features in the process of the current account determination according to the different
overall macroeconomic conditions. We suggest that a comparison of the results for models with
different time period is crucial to understand redistributive effects of the economic crisis in the view of
changes in the cyclically adjusted primary balance determination capabilities in the group of ten
countries from the past Eastern block.
Following the introduction, we provide brief overview of theoretical concepts referring to the
relationship between fiscal policy changes and current account adjustments in Section 2. In Section 3
we provide an overview of the current empirical evidence about current account adjustments and fiscal
policy stance. While the area of our research seems to be well documented in current empirical
literature it seems that causal relationship between fiscal policy changes and associated current
account adjustments are unclear or even puzzled. In Section 4 we observe main trends in fiscal
imbalances and current account adjustments in the European transition economies and highlight some
simplified stylized facts about investigated causal relationship. At the beginning of the Section 5 we
summarize key methodological remarks to episodes of large current account and fiscal policy changes.
Subsequent analysis of large current account and fiscal policy episodes provides an in-depth insight
into frequency as well as parallel occurrence of deteriorations (improvements) in current accounts and
fiscal stance of government budgets. In Section 6 we provide a brief overview of the VAR model
(recursive Cholesky decomposition is employed to identify structural shocks) we employ to
investigate responses of the current account to negative one standard deviation cyclically adjusted
primary balance shocks. In Section 7 we discuss main results.
Conclusion
Current account adjustments revealed crucial implications of the continuously rising
international economic and financial integration of this group of countries (increased indebtedness,
lacking competitiveness, fiscal imbalances, foreign capital inflows, etc.), there seems to be still enough
Journal of Applied Economic Sciences
room to investigate partial effects of dynamic changes in key current account determinants to observe
associated current account adjustments.
Changes in the fiscal policy stance associated with changes in CAPB affected current accounts
in the European transition economies. Despite some differences, we have observed similar trend in the
leading paths of current accounts and savings-investments gaps clearly following main outcomes of an
intertemporal approach. However, expenditure shifting effects associated with current account
imbalances in each individual country do not seem to be determined solely by internal balance
between savings and investments. Countries from the group of “peggers” experienced periods with
generally higher discrepancies in CAPB and current account balances. However, the beginning of the
crisis period clearly reduced these misalignments. In the group of “floaters” we examined persisting
negative SI imbalances originated in excessive fiscal deficits.
Occurrence of episodes of large CAPB changes seems to be uniformly distributed across the
whole period. Durability of continuous CAPB improvements is clearly higher in Baltic countries (with
rigorous exchange rate anchoring) highlighting a commitment to conduct prudential fiscal policies
necessary to maintain a sustainability of tough exchange rate arrangement. In countries with flexible
exchange rate arrangements (“floaters”) we observed some sort of alteration in episodes of CAPB
improvement and deterioration in the medium term period. All countries (except for Hungary)
experienced large deteriorating episode at the beginning of the crisis period followed by improving
episode (except for Poland) with differing lag revealing a crucial need of a fiscal consolidation. Large
CAPB improvements and deteriorations revealed significant responsiveness of large current account
adjustments to the fiscal incentives (0.65+) in the whole group of countries. The ratio is slightly higher
for CAPB deteriorating episodes.
Regression results indicate that a decrease in CAPB at 1 percent point caused current account
deterioration at a range of 0.05-0.26 percent points for model A (2000-2007) and 0.07-0.2 percent
points for model B (2000-2012). However, the current account interference to CAPB changes seems to
be lowest in big and low performing countries, followed by the group of “floaters” and then “peggers”.
Crisis period reduced exposure of external imbalances to CAPB changes resulted in decreased
regression coefficients in all countries.
Results of impulse-response functions revealed some differences in responses of current
accounts in each country to the negative one standard deviation CAPB shock. While big and low
performing economies experienced slow and less intensive current account deterioration, “peggers”
experienced less dynamic current account deterioration low smaller durability and “floaters”
experienced more dynamic and more durable current account deterioration. Crisis period slightly
changed short-term response patterns in all countries. Durability of the current account deterioration in
big and low performing economies together with “peggers” slightly increased while immediate
response increased in both groups of countries with pegged and flexible exchange rate arrangements.
Despite euro adoption in Slovenia (2007) and Slovak republic (2009), regression results as well as
impulse-response functions do not provide any empirical evidence about similar patterns comparable
with the results for countries in the group of “peggers” in model for extended period.
Acknowledgement
This paper was written in connection with scientific project VEGA no. 1/0892/13. Financial
support from this Ministry of Education’s scheme is also gratefully acknowledged.
References
[1] Abbas, S.M. Ali, Bouhga-Hagbe, J., Fatás, A., Mauro, P., Velloso, R.C. (2011). Fiscal policy and
the current account, IMF Economic Review 59(4): 603-629.
[2] Arghyrou, M.G., Chortareas, G. (2008). Current account imbalances and real exchange rates in
the Euro area, Review of International Economics, 9(5): 747-764.
[3] Bouthevillain et al (2001). Cyclically adjusted budget balances: An alternative approach,
European Central Bank Working Paper No. 77, Frankfurt am Main, European Central Bank, 73 p.
[4] Bussiere, M., Fratzscher, M., Muller, G.J. (2004). Current Account Dynamics in OECD and EU
acceding countries - An intertemporal approach, European Central Bank, Working Paper, No.
Volume VIII, Issue 3(25), Fall 2013
311, Frankfurt, European Central Bank, 38 p.
[5] Caldara, D. - Camps, C. (2008). What are the effects of fiscal policy shocks, European Central
Bank Working Paper No. 877, Frankfurt am Main, European Central Bank, 47 p.
[6] Corsetti, G., Gernot, J.M., (2006). Budget deficits and current accounts: Openness and fiscal
persistence, Economic Policy, 21(48): 597-638.
[7] Corsetti, G., Müller, G. (2006). Twin deficits: squaring theory, evidence and common sense.
Economic Policy 48: 597-638.
[8] Fidrmuc, J. (2002). Twin deficits: Implications of current account and fiscal imbalances for the
accession countries, Focus on Transition, 2: 72-83.
[9] Glick, R., Rogoff, K. (1995). Global versus country-specific productivity shocks and the current
account, Journal of Monetary Economics, 35(1): 159-192.
[10] Gruber, J.W., Kamin, S. (2005). Explaining the global pattern of current account imbalances,
board of governors of the Federal Reserve System, International Finance Discussion Papers 846,
2005.
[11] Hassan, M. (2004). Budget deficits and the current account balance: New evidence from panel
data, Journal of Economics and Finance, 28(1): 39-45.
[12] Chinn, M.D., Prasad, E.S. (2003). Medium-term determinants of current accounts in industrial
and developing countries: An empirical exploration, Journal of International Economics, 59(1):
47-76.
[13] Javid, A.Y., Javid, M., Arif, U. (2010). Fiscal policy and current account dynamics in case of
Pakistan, The Pakistan Development Review, 49(4): 577-592.
[14] Kim, S., Roubini, N. (2008). Twin Deficit or Twin Divergence? Fiscal policy, current account
and real exchange rate in the US, Journal of International Economics 74: 362-383.
[15] Kumhof, M., Laxton, D. (2009). Fiscal deficits and current account deficits, International
Monetary Fund, Working Paper, No. 237, Washington, International Monetary Fund, 35 p.
[16] Lane, P. R. (2010). External imbalances and fiscal policy, institute for international integration
studies, Working Paper, No. 314, Dublin, Trinity College Dublin and CEPR, 24 p.
[17] Lee, J., Chinn, M.D. (2006). Current account and real exchange rate dynamics in the G7
countries, Journal of International Money and Finance, 25: 257-274.
[18] Mirdala, R. (2013a). Lessons Learned from Tax versus Expenditure Based Fiscal Consolidation
in the European transition economies, Journal of Applied Economic Sciences, 8(1): 73-98.
[19] Mirdala, R. (2013b). Current account adjustments and real exchange rates in the European
Transition economies, Journal of Applied Economic Sciences, 8(2): 210-227.
[20] Obstfeld, M., Rogoff, K.S. (2005). Global current account imbalances and exchange rate
adjustments, Brookings Papers on Economic Activity, 36(1): 67-123.
[21] Obstfeld, M., Rogoff, K. (1995). The intertemporal approach to the current account, [National
Bureau of Economic Research Working Paper No. 4893, New York, National Bureau of
Economic Research, 75 p.
[22] Roubini, N. (1988). Current account and budget deficits in an intertemporal model of
consumption and taxation smoothing. A solution to the Feldstein-Horioka puzzle? National
Bureau of Economic Research Working Paper No. 2773, New York, National Bureau of
Economic Research, 52 p.
[23] Rusek, A. (2013). The competitiveness dynamics in the Eurozone, Global Journal of
Management and Business Research Finance, 13(5): 33-38.
[24] Schnabl, G., Wollmershäuser, T. (2012). Fiscal divergence and current account imbalances in
Europe, CESifo, Working Paper No. 4108, Munich, CESifo, 38 p.
[25] Sek, S.K., Chuah, C.L. (2013). The dynamic of the current account in emerging East-Asian: Does
exchange rate matter? International Journal of Trade, Economics and Finance, 2(4): 293-299.
[26] Soyoung, K., Roubini, N. (2008). Twin deficit and twin divergence? Fiscal policy, current
account, and real exchange rate in the US, Journal of Economic Literature, 74: 362-383.

Journal of Applied Economic Sciences
[27] Stavárek, R. (2013). Cyclical relationship between exchange rates and macro-fundamentals in
Central and Eastern Europe, Economic Research (Ekonomska istraživanja), 26(2): 83-98.
[28] Uroševic, B. (2012). Jackknife model averaging of the current account determinants,
Panoeconomicus, 59(3): 267-281.
Volume VIII, Issue 3(25), Fall 2013
OPTIMIZATION OF TAX LOADING ON THE ECONOMY AS THE MAIN DIRECTION OF TAX POLICY IMPROVEMENT OF THE COUNTRY
Lyubov SALO
Department of Finance, Lviv State Academy of Finance, Ukraine
Abstract:
The approaches to the definition of the concept “tax loading” have been discussed in the article. The
evaluation of widely used methods of tax loading calculation on macrolevel has been performed. The level of this
index throughout Ukraine and in the light of some taxes and collections has been analysed. The estimation and
comparison of calculation results in accordance to social and economic development of the country have been
conducted. The dynamics of this development has been analysed in comparison with the same indices of the
developed countries of the world. The expediency of the optimization of tax loading level of domestic ecenomy
has been argued. The main problems on the way to the optimization of tax loading and possible ways of their
solution have been indicated. Special attention has been paid to the policy of tax benefits and preferences as the
main direction of stimulatin of the economic development of the country.
Key words: tax loading, economic activity, tax coefficient, effective tax rate, economic entity, financial
provision.
JEL Classification: E 62, H 21, H 22, H 26
1. Introduction
The development of domestic economy is impossible without formation and realization of an
effective tax policy. Taxes have a strong influence on the tempos and proportions of social and
economical development of the country. They stimulate business and innovative and investing activity
of the country and facilitate the increase of factors of production and employment. Conducting tax
policy the state should keep to the optimal level of tax loading by means of effective combination of
the indices of some taxes and collections and general harmonization of the structure of tax system. Tax
loading index helps to determine the real fiscal influence of tax system on the economy of the country.
Nowadays we can observe the situation when exceeding tax loading has a bad influence on the
economic growth of Ukraine. Tax loading facilitates the decrease of entrepreneurial activity, destroys
favourable market environment, raises the shadow sector of the economy and causes crisis effects in
the society. This is the reason to ground such level of tax loading which will correspond to the present-
day social and economic situation in Ukraine. Thus, the importance and insufficient investigation of
the problem define the choice of the theme of research and prove its actuality in present-day
conditions.
Conclusions
Summarising the results of conducted investigation it should be noted that the level of tax
loading in Ukraine is more moderate than in developed countries of the world while the mechanism of
administration of taxes and collections is much more complicated. However, some scientists consider
that a real level of tax loading is much higher and it has a bad influence on the economy of the country
and causes social tension in the society. The problem of the equality and proportionality of the
apportionment of tax pressure among tax payers is still unsolved.
The main task of officials, experts and scientists is to balance the tax loading level through
offering benefits and preferences which would stimulate the economy of the country and will not
cause aggravation of the problem of relocating tax loading from one tax payer to another. This
problem can be solved by means of improving the mechanisms of tax administration since the
expenses for the management of tax payments are not always grounded within the period they were
spent. The solution as to the offering benefits should be taken on the account of the sphere of tax payer
activity; i. e. the benefits should be given mainly to the investment and innovational enterprises to
attract investors to concrete regions or branches of the economy which are not interesting for running
entrepreneurial business under the regime of general system of taxation. It is necessary to emphasize
Journal of Applied Economic Sciences
that one of the most important ways of the optimization of tax pressure on payers is efficient policy of
tax planning. It helps the economic entities to regulate the level of tax loading independently and
legally by means of their own method of tax loading estimation and analysis of taxes which have to be
paid.
The vital tasks on the way to the optimization of tax loading in Ukraine are the following:
legislative improvement of the system of tax control with the aim of creating conditions
which make tax and collections evasion impossible;
regulation of taxation and accounting systems.
The tasks determine the urgency of the theme of investigation and emphasize the necessity of
conducting further research in this direction.
References
[1] Barulin, S. (2011). Tax management. Dashkov I K.
[2] Gajdar, E. (2005). State Burden on Economy. Questions Economy, 9: 4-21.
[3] Godovatets O. (2008). Tax loading: important factor in the socio-economic strategy of the state.
Economic analysis, 3(19): 85-89.
[4] Drop Y., Chaban, U. (2009). Tax loading and its impact on the economy of Ukraine. Formation
of a market economy in Ukraine, 219: 213-219.
[5] Ivanov U. (2009). Functions of taxes and tax regulation. Formation of a market economy in
Ukraine 19: 36-43.
[6] Kuzmin, O. (2010). Forming the base budgets for companies by using the regional factors.
Regional Economics, 1: 177-185.
[7] Preston, J., Peckman, A., Howlett, N., Claros, A., Solf, S., and Trumbic, T. (2011). Paying Taxes
2012. The global picture. Doing business.
[8] Prytuliak, N. (2009). On the issue of tax planning in the company. Proceedings of the National
University of State Tax service of Ukraine, 16: 243-429.
[9] Savchenko, V., Los, A. (2011). Evaluetion the level of tax loading in Ukraine. Economic Journal,
XXI 9: 25-28.
[10] Sokolovska, A. (2008). Metodological and methodical aspects of determining the tax loading on
labour, capital and consumption. Finance of Ukraine, 1: 65-76.
[11] Sokolovska, A. (2010). Fundamentals of the theory of finance. Kondor.
[12] Sukhoruko, O. (2011). Fiscal efficiency of the tax component of budget of different levels.
Journal Berdyansk University Management 1(17): 93-96.
[13] Fradynsky, O. (2010). The concept of the tax loading and approaches to its definition. Journal
Khmelnitsky National University, 1(1): 79-82.
*** Tax Code of Ukraine. (2010). No. 2755-IV, http://zakon2.rada.gov.ua/laws/show/2755-17
*** Heritage Foundation. (2012). Ranking the Countries. Heritage Foundation, http://www.heritage.
org/index/Ranking.
*** Ministry of finance of Ukraine. (2010). Tax revenues of the Consolidated Budget of Ukraine,
http://www.minfin.gov.ua/control/uk/publish/archive/main? cat_id=77643.
*** Pension Fund of Ukraine. (2012). Admission to the extra-budgetary funds. Pension Fund of
Ukraine, http://www.pfu.gov.ua/pfu/control/uk/publish/category?cat_id=95533.
*** State Statistics Committee of Ukraine, http://www.ukrstat.gov.ua
*** State treasure service of UK. (2012). Indicators of the state budget. State treasure service of UK,
www.treasury.gov.ua/main/uk/publish/category/23593;jsessionid=b5b1048bf511eb6fd9565d744
1f36e1b
Volume VIII, Issue 3(25), Fall 2013
THE PLACE AND ROLE OF SMALL AND MEDIUM SIZE ENTERPRISE’S IN THE ROMANIAN ECONOMY. BASE FOR
EFFICIENT USE OF RESOURCES
Silvia SIMIONESCU
Spiru Haret University, Romania
Faculty of Financial Management and Accounting Craiova
Simona MOISE
Spiru Haret University, Romania
Faculty of Financial Management and Accounting Craiova
Abstract:
For large firms, SMEs are the world from which they have come and where their future competition will
arise. For individuals, SMEs are often a first job, the first step in their careers. They are also a first step towards
the world of entrepreneurs. For the whole economy, SMEs are launchers of new ideas and new assembly
processes that accelerate growth based on a more efficient use of resources.
Firms will not be able to capitalize on the advantages arising from the internationalization will not keep
within the limits of economic efficiency and default, will come out of the international economic relations. It is
for this reason that, any undertaking, regardless of its size, must master the costs and revenues.
Keywords: SME, economic and financial crisis, opportunities providers, business environment, market
economy.
JEL Classification: M12, M54, J53
1. Introduction
Events that occurred 20 years ago in Romania as in other Central and Eastern European
countries have caused evolution of two components, namely: the transfer of ownership of enterprises
from state to private persons and the emergence of new private enterprises following independent
private initiatives.
The two paths of development occurred more or less simultaneously and at different speeds,
both having repercussions on the labor market. Thus, while privatization has reduced the number of
jobs, boosting unemployment, private sector induced an opposite effect, creating new jobs.
Analyzing characteristics of the Romanian economy, according to data provided by the NSI
and Eurostat, note that they tend to approach those of a functioning market economy.
SMEs have become increasingly important in our society as providers of employment
opportunities and key elements for the welfare of local and regional communities.
Conclusions
In our opinion, given constant change of a changing economic environment, SMEs are flexible
and possess a great capacity for adaptation, facilitated by the small size and rapid decision making
process. They easily adapt to the needs and demands of consumers, being closer to the market.
Growing economies, whose demand is increasing or at least stabilized, help the SMEs to
maintain or develop their business. On the other hand, increasing the real added value is a combined
result of increased employment and real productivity, contribution of the first factor is clearly
dominant. If an economy is strong in terms of high-tech and medium industry and services based on
intensive use of knowledge, this is also a positive factor. Reducing employment in SMEs in Member
States with above features was also more modest than in SMEs in other Member States.
In the same time, we note that in the economic environment in our country which is still
hostile, in 2012 it has been felt a rising trend of development characterized by achieving the highest
levels of performance indicators. Although SMEs face difficulties in the current economic and
financial crisis context, from the above it results that they will remain at the forefront of economic
development in the future.
Journal of Applied Economic Sciences
References
[1] Iacob C., Ionescu, I., Goagără, D. (2007). Management accounting in accordance with
international practiced, Universitaria Publishing House, Craiova.
[2] Hirschman, A.O. (1964). The Paternity of an Index. The American Economic Review, American
Economic Association, 54 (5): 761. http://jstor.org/stable/1818582.
[3] Zaman Ghe. (1999). The coexistence of large and small enterprises, Economic Tribune. 45,
Bucharest.
*** GO nr. 99/August 29, 2000 on the marketing of products and market services, republished in the
Official Gazette nr. 603/31 august 2007, approved by Law 650/December 7, 2002 published in the
Official Gazette nr. 914/December 16, 2002, amended by Law 211/2008;
*** EXW – Ex Works is the most convenient delivery condition for the seller as it provides minimum
requirements for it; the buyer has to bear all risks and costs involved in taking over the goods at
the agreed place.
*** OMPF 1826 for approving the Specifications regarding some measures for the organization and of
management of accounting management, Official Gazette 23/2004;
*** OMPF 3055/2009 for the approval of the Accounting regulations in compliance to the European
Directives, Official Gazette, Part I, nr.766 of November 10, 2009.
*** http://www.contabilizat.ro/dictionar_economic_si_financiar~termen garantie_de_terminare.html
Volume VIII, Issue 3(25), Fall 2013
INTERBANK INTEREST RATE TRANSMISSION IN THE BALTIC COUNTRIES
Marianna SINIČÁKOVÁ
Faculty of Economics, Technical University of Košice, Slovakia
Veronika ŠULIKOVÁ
Faculty of Economics, Technical University of Košice, Slovakia
Abstract:
Integration process, harmonisation of bank legislation and mutual economic interdependence among
European countries contribute to similar evolution of several financial indicators in the European Union.
Current financial and economic crisis has revealed that some indicators evolved similarly only in short run and
their symmetry among countries was not justified. This was the case of e.g. bond interest rates. However, we
supposed that interbank interest rates reflected mutual transmission among the Baltic countries and the
European Union in long run. We wondered whether this symmetry was not shattered by the recent financial and
crisis. This assumption has not been confirmed using the vector error correction model. Our results show that
interbank interest rates transmission was maintained even during the crisis. In addition, this transmission in the
Baltic countries was significant also due to fixed exchange rate regimes which they applied. The paper was
elaborated within the project VEGA 1/0973/11.
Keywords: interbank interest rate, transmission, vector error correction model, the Baltic countries
JEL Classification: E43, G15
1. Introduction
The monetary policy is based on several transmission mechanisms by which changes in the
settings of monetary policy instruments lead to targeted macroeconomic result (the most often
inflation). The first step in the transmission mechanism is a change of the monetary policy instrument
setting. This implies a change in the intermediary objectives, e.g. in banking markets. The change in
these markets in turn leads to modifications in the field of final goals such as inflation. The
transmission mechanism acts through several channels simultaneously. Here, we will focus on the
interest rate channel of the transmission mechanism. An increase or decrease in a base rate leads first
to an increase or decrease of interest rates in interbank markets. This in turn motivates banks to raise
or lower their rates on credits and deposits. Changed interest rates will restrain or stimulate
investments, aggregate demand and will finally weaken or strengthen inflation pressures.
Consequently, the reaction of interbank rates to monetary policy base rate is very important for final
objective result.
However, we suppose that interbank interest rates do not respond only to monetary policy
measurements in a given country but react also to interbank rates in foreign countries. This
interdependence among interbank rates is influenced by international synchronisation of business
cycles, by integration process at macroeconomic level, by harmonisation of financial market and
banking legislation, by capital interconnection of banking sector throughout the European Monetary
Union and the world as a whole. Therefore we can observe certain symmetry of interest rates evolution
in financial markets. However, some symmetry does not have to be justified by economic
fundamentals and is rather implied by political background or other shocks (Ďurčová, 2012). This is
the case of bond interest rates in the European Union. Debt and financial crisis revealed that their
setting at almost the same level from 1998 to 2008 was incorrect (Micossi, 2012).
Our research takes into account interest rate theories summarised e.g. by Revenda (2005) or
Polouček (2010). It respects principles of Dornbush model (Dornbush, 1976) according to which
nominal variables, such as interest and exchange rates, respond more quickly to money supply than
prices and wages. The relationship between interest rates is studies by several authors. Arghyrou et al.
(2009) study real interest rate convergence in the European countries. Heryán and Stavárek (2010)
observe relationship between interbank interest rates and corporate loan rates in the European Union.
Applied cointegration methodology and Granger causality testing detect different relations in
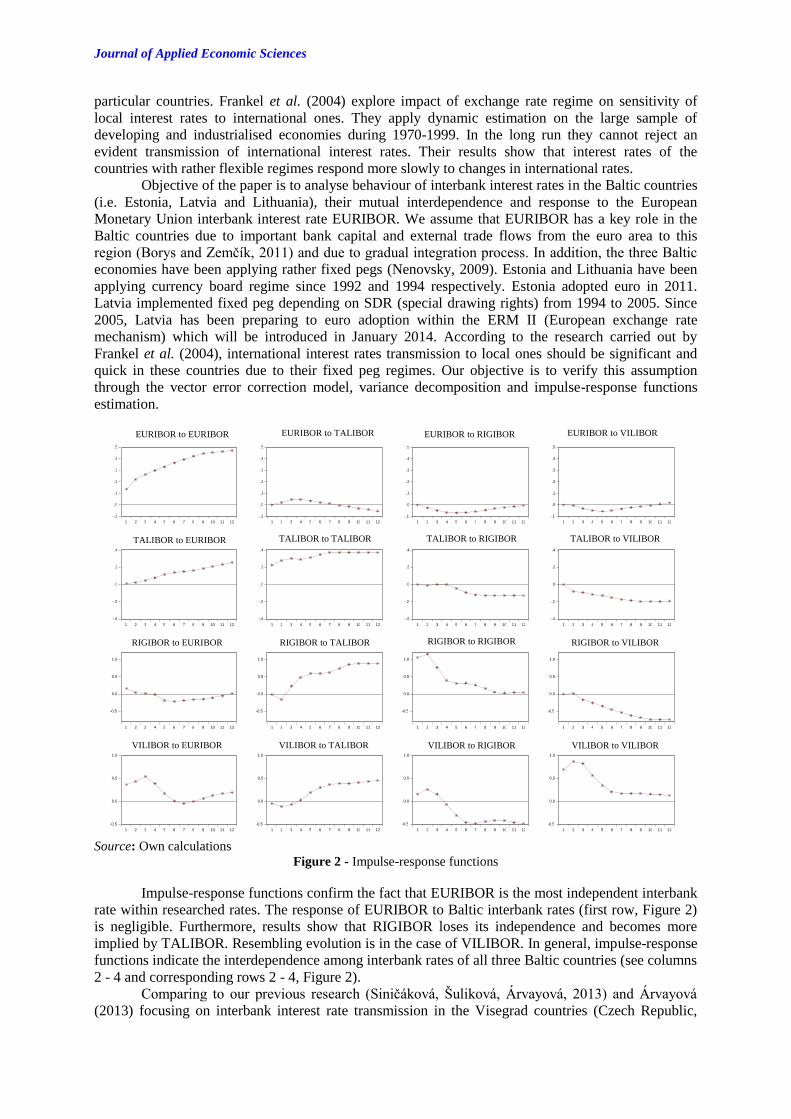
Journal of Applied Economic Sciences
particular countries. Frankel et al. (2004) explore impact of exchange rate regime on sensitivity of
local interest rates to international ones. They apply dynamic estimation on the large sample of
developing and industrialised economies during 1970-1999. In the long run they cannot reject an
evident transmission of international interest rates. Their results show that interest rates of the
countries with rather flexible regimes respond more slowly to changes in international rates.
Objective of the paper is to analyse behaviour of interbank interest rates in the Baltic countries
(i.e. Estonia, Latvia and Lithuania), their mutual interdependence and response to the European
Monetary Union interbank interest rate EURIBOR. We assume that EURIBOR has a key role in the
Baltic countries due to important bank capital and external trade flows from the euro area to this
region (Borys and Zemčík, 2011) and due to gradual integration process. In addition, the three Baltic
economies have been applying rather fixed pegs (Nenovsky, 2009). Estonia and Lithuania have been
applying currency board regime since 1992 and 1994 respectively. Estonia adopted euro in 2011.
Latvia implemented fixed peg depending on SDR (special drawing rights) from 1994 to 2005. Since
2005, Latvia has been preparing to euro adoption within the ERM II (European exchange rate
mechanism) which will be introduced in January 2014. According to the research carried out by
Frankel et al. (2004), international interest rates transmission to local ones should be significant and
quick in these countries due to their fixed peg regimes. Our objective is to verify this assumption
through the vector error correction model, variance decomposition and impulse-response functions
estimation.
Source: Own calculations
Figure 2 - Impulse-response functions
Impulse-response functions confirm the fact that EURIBOR is the most independent interbank
rate within researched rates. The response of EURIBOR to Baltic interbank rates (first row, Figure 2)
is negligible. Furthermore, results show that RIGIBOR loses its independence and becomes more
implied by TALIBOR. Resembling evolution is in the case of VILIBOR. In general, impulse-response
functions indicate the interdependence among interbank rates of all three Baltic countries (see columns
2 - 4 and corresponding rows 2 - 4, Figure 2).
Comparing to our previous research (Siničáková, Šuliková, Árvayová, 2013) and Árvayová
(2013) focusing on interbank interest rate transmission in the Visegrad countries (Czech Republic,
-.1 .0 .1 .2 .3 .4 .5
1 2 3 4 5 6 7 8 9 10 11 12
R e s p o n s e o f
E U R I B O R
t o
E U R I B O R
-.1 .0 .1 .2 .3 .4 .5
1 2 3 4 5 6 7 8 9 10 11 12
R e s p o n s e o f
E U R I B O R
t o
T A L I B O R
-.1 .0 .1 .2 .3 .4 .5
1 2 3 4 5 6 7 8 9 10 11 12
R e s p o n s e o f
E U R I B O R
t o
R I G I B O R
-.1 .0 .1 .2 .3 .4 .5
1 2 3 4 5 6 7 8 9 10 11 12
R e s p o n s e o f
E U R I B O R
t o
V I L I B O R
-.4 -.2 .0 .2 .4
1 2 3 4 5 6 7 8 9 10 11 12
R e s p o n s e o f
T A L I B O R
t o
E U R I B O R
-.4 -.2 .0 .2 .4
1 2 3 4 5 6 7 8 9 10 11 12
R e s p o n s e o f
T A L I B O R
t o
T A L I B O R
-.4 -.2 .0 .2 .4
1 2 3 4 5 6 7 8 9 10 11 12
R e s p o n s e o f
T A L I B O R
t o
R I G I B O R
-.4 -.2 .0 .2 .4
1 2 3 4 5 6 7 8 9 10 11 12
R e s p o n s e o f
T A L I B O R
t o
V I L I B O R
-0.5 0.0 0.5 1.0
1 2 3 4 5 6 7 8 9 10 11 12
R e s p o n s e o f
R I G I B O R
t o
E U R I B O R
-0.5 0.0 0.5 1.0
1 2 3 4 5 6 7 8 9 10 11 12
R e s p o n s e o f
R I G I B O R
t o
T A L I B O R
-0.5 0.0 0.5 1.0
1 2 3 4 5 6 7 8 9 10 11 12
R e s p o n s e o f
R I G I B O R
t o
R I G I B O R
-0.5 0.0 0.5 1.0
1 2 3 4 5 6 7 8 9 10 11 12
R e s p o n s e o f
R I G I B O R
t o
V I L I B O R
-0.5
0.0
0.5
1.0
1 2 3 4 5 6 7 8 9 10 11 12
R e s p o n s e o f
V I L I B O R
t o
E U R I B O R
-0.5
0.0
0.5
1.0
1 2 3 4 5 6 7 8 9 10 11 12
R e s p o n s e o f
V I L I B O R
t o
T A L I B O R
-0.5
0.0
0.5
1.0
1 2 3 4 5 6 7 8 9 10 11 12
R e s p o n s e o f
V I L I B O R
t o
R I G I B O R
-0.5
0.0
0.5
1.0
1 2 3 4 5 6 7 8 9 10 11 12
R e s p o n s e o f
V I L I B O R
t o
V I L I B O R
R e s p o n s e t o
C h o l e s k y
O n e
S . D .
I n n o v a t i o n s
RIGIBOR to EURIBOR
TALIBOR to EURIBOR
EURIBOR to EURIBOR EURIBOR to RIGIBOR
TALIBOR to TALIBOR TALIBOR to RIGIBOR TALIBOR to VILIBOR
RIGIBOR to TALIBOR RIGIBOR to RIGIBOR RIGIBOR to VILIBOR
VILIBOR to EURIBOR VILIBOR to TALIBOR VILIBOR to RIGIBOR VILIBOR to VILIBOR
EURIBOR to TALIBOR EURIBOR to VILIBOR
Volume VIII, Issue 3(25), Fall 2013
Hungary, Poland and Slovakia), interdependence in the case of the Baltic countries and the euro area
seems to be more significant and quicker. Consequently, results of international interest rate
transmission in the Baltic countries are in line with findings by Frankel et al. (2004) that local interest
rates are more sensitive to international ones if fixed peg is applied. The more exchange rates are
fixed, the more local interest rates are sensitive. Interest rates in Estonia (i.e. TALIBOR) and those in
Lithuania (i.e. VILIBOR) reacted more flexibly to EURIBOR fluctuation as interbank rates in Latvia
which has been applying less fixed regime comparing to its neighbouring countries (see Table 5 and
Figure 2).
Generally speaking, similar phenomenon as in the bond interest rate market appears in
interbank interest rate. Economies and their macroeconomic indicators have tendency to converge in
the times of prosperity. However, many indicators have divergent trends in the period of crisis
(Horváth et al., 2013 and Mirdala, 2012). Our previous observations focusing on the Visegrad
countries (Siničáková et al., 2013 and Árvayová, 2013) are in line with these findings. The Visegrad
interbank interest rates are significantly influenced by EURIBOR evolution. Relevant investors in
financial markets including banking markets, take the European Union as comparatively homogeneous
region during times of prosperity. Yet, during the crisis, investors and so do interest rates, behave
rather independently and in respect to actual economic situation in a particular country.
Nevertheless, situation in the Baltic countries is quite different. Convergence of their interbank
interest rates has not been shattered by recent financial and economic crisis. Interbank interest rate
evolution in the Baltic countries is obviously symmetric with EURIBOR. The transmission is quite
strong due to fixed peg and currency board regimes in these countries. Nominal convergence has been
priority of the Baltic economies as they have been planning their integration into the European
Monetary Union for long time. Nominal goals were often maintained at the expense of real indicators.
The three countries experienced very important fall of economic output and employment in 2009.
Their remarkable economic growth of 5.4% in Estonia, 12.5% in Latvia and 9.6% in Lithuania in 2008
dropped to -1.4%, -1.6% and -3.4% in 2009 (Eurostat, 2013). However they managed to maintain
exchange rate stability with euro and symmetric evolution of their interbank rates with EURIBOR.
As interbank interest rate evolution has been converging with EURIBOR at least for last
decade, exchange rate is fixed to euro, the three countries are small and open economies highly
dependent on the euro area trade; introduction of euro and application of EURIBOR in these countries
seems to be from our point of view a reasonable solution.
5. Conclusion
Interbank interest rates evolution in the Baltic countries reflects quite significant level of
mutual interdependencies. This phenomenon is obvious not only in the pre-crisis period but even
during crisis. Crises, in general, stress differences and particularities among countries. Thus, evolution
of economic variables such as interest rates differs in a more visible way. Nevertheless, variance
decomposition approach detects rather important impact of EURIBOR on the Baltic interbank interest
rates even during crisis. Effect of exchange rate regimes on interest rate transmission seems to be very
significant. The Baltic countries applied fixed pegs eventually currency board regime which is also
rather fixed exchange regime. Sensitivity of their interbank interest rates to international rates is
therefore higher than in the case of countries with more flexible exchange rates.
References
[1] Arghyrou, M.G., Gregoriou, A., Kontonikas, A. (2009). Do Real Interest Rates Converge?
Evidence from the European Union, Journal of International Financial Markets, Institutions and
Money, 19(3): 447-460.
[2] Árvayová, S. (2013). Transmisný mechanizmus medzibankových úrokových mier vo vybraných
krajinách (Interbank Interest Rates Transmission Mechanism in Chosen Countries). Diplomová
práca. Technická univerzita v Košiciach, Ekonomická fakulta, p. 76.
[3] Borys, M. M., Zemčík, P. (2011). Size and Value Effects in the Visegrad Countries, Emerging
Markets Finance and Trade Journal, 47(3): 50–68.
[4] Dickey, D., Fuller, W. (1981). Likelihood Ratio Statistics for Autoregressive Time Series with
Unit Root, Econometrica, 49(4): 1057-1072.
Journal of Applied Economic Sciences
[5] Dolado J. J., Jenkinson, T., Sosvilla-Rivero, S. (1990). Cointegration and Unit Roots, Journal of
Economic Surveys, 3: 249-273.
[6] Dornbusch, R. (1976). Expectations and exchange rate dynamics, Journal of Political
Economy, 84(6): 1161–1176.
[7] Ďurčová, J. (2012). Macroeconomic impacts of the interest rate shocks in the selected euro area
countries, Journal of Advanced Studies in Finance, 3(2): 140-150.
[8] Frankel, J., Schmukler, S. L., Serven, L. (2004). Global transmission of interest rates: monetary
independence and currency regime, Journal of International Money and Finance, 23(5): 701-733.
[9] Heryán, T., Stavárek, D. (2010). How related are interbank and lending interest rates? Evidence on
selected European Union countries, European Financial and Accounting Journal, 5(3-4): 42-55.
[10] Horváth, D., Šuliková, V., Gazda, V., Siničáková, M. (2013). The distance-based approach to the
quantification of the world convergences and imbalances - comparisons across countries and
factors. MPRA Paper, pp. 1-33.
[11] Johansen, S., Juselius, K. (1990). Maximum likelihood estimation and inference on cointegration
– with applications to the demand for money, Oxford Bulletin of Economics and Statistics, 52(2):
169-210.
[12] Micossi, S. (2012). Bring the Eurozone Back from The Precipice: An agenda for the European
Council. [online]. [cit. 2013-01-17]. Available at: http://www.voxeu.org/article/bringing-
eurozone-back-precipice-proposal
[13] Mirdala, R., (2012), Interest rates determination and crisis puzzle (Empirical Evidence from the
European transition economies), Journal of Applied Economic Science, 7(4): 418-436.
[14] Nenovsky, N. (2009). Monetary Regimes in Post-Communist Countries. Some Long-Term
Reflections, Agency for Economic Analysis and Forecasting, Working paper series 2009-1.
[15] Phillips, P., Perron, P. (1988). Testing for unit root in time series regression, Biometrika, 75(2):
335-346.
[16] Polouček, S. (2010). Peniaze, banky, finančné trhy. Iura Edition, Bratislava, pp. 89-90.
[17] Revenda, Z. (2005). Peněžní ekonomie a bankovnictví. 4th Ed. Management Press, Praha, p. 627.
[18] Schwert, G.W. (1989). Tests for unit roots: A Monte Carlo investigation, Journal of Business &
Economic Statistics, 7(2): 147-59.
[19] Siničáková, M., Šuliková, V., Árvayová, S. (2013). Interbank interest rate transmission in the V4
countries, Emerging Markets Queries in Finance and Business, Tirgu-Mures, Romania, October,
in print.
*** Bank of Estonia. (2012). Financial Sector Statistics. Talin.
*** Bank of Latvia. (2012). Annual Report of the Bank of Latvia. Riga.
*** Bank of Lithuania. (2012). Banking Statistics Yearbook. Vilnus.
*** Eurostat. (2013). GDP and main components – price indices. [online]. [cit. 2013-05-16].
Available at: http://epp.eurostat.ec.europa.eu/portal/page/portal/statistics/search_database
Volume VIII, Issue 3(25), Fall 2013
FIRST STEPS OF JAVA-BASED SIMULATION FOR DECISION SUPPORT SYSTEM OF BUSINESS COMPANIES
Roman ŠPERKA
School of Business Administration in Karvina, Department of informatics
Silesian University in Opava, Czech Republic
Marek SPIŠÁK
School of Business Administration in Karvina, Department of informatics
Silesian University in Opava, Czech Republic
Abstract:
The motivation of this paper was to model and to implement an innovative approach to simulate the
trading processes of a virtual business company. Agent-based methods together with the Java development
platform are used to implement a multi-agent system to serve as a simulation framework. The framework should
be a basic part of a decision support system operating in the integration with real system of a company (e.g.
ERP system) to investigate and to predict chosen business metrics of a company. This will ensure the
management of a company to work with the simulation possibilities of this framework and to support their
decision-making processes. The paper firstly introduces some of the existing theories about consumer behavior
and the types of factors influencing it. Secondly, characterizes multi-agent model of a virtual company, the
agents participating in the trading processes, and the production function. Finaly, the simulation results and
their validation are described. To conclude, the proposed approach to the simulation of trading processes in an
agent-based model could properly contribute to better decision-making process.
Keywords: system modeling, agent, business company, multi-agent systems, negotiation, decision support,
trading processes.
JEL Classification: C63; C81; C92; D12; D22
1. Introduction
In the contemporary, dynamic, global and competitive market environment, consumer
behavior depends on many different types of factors, which are difficult to grasp. With personal and
social factors deals e.g. Enis (1974), with physical factors deals, e.g. McCarthy and Perreault (1993).
More complex view on the social, economic, geography and culture factors gave Keegan et al. (1992).
Schiffman (2007) brought marketing mix and environment into the types of factors mentioned herein
above. Previous discussions have so far either relied on an objectivist (complete information of
customers, constant decision mechanism, constant consumer preferences) or a constructivist view
(consumption discourses, consumption as a crucial aspect in the construction of identity). However,
both have failed to integrate the consumers’ interactions with their social behavior and physical
environment as well as the materiality of consumption (Gregson et al. 2002, Jackson et al. 2006). The
complexity of the factors influencing consumer behavior and their changes in the time shows relations
between external stimuli, consumer’s features, the course of decision-making process and reaction
expressed in his choices. As a result, the investigation of consumer behavior seems to be too
complicated for traditional analytical approaches (Forrester 1971, Challet and Krause, 2006).
Agent-based modeling and simulation (ABMS) provides some opportunities and benefits
resulting from using multi-agent systems as a platform for simulations with the aim to investigate the
consumers’ behavior and trading processes (Spišák and Šperka 2011, Šperka 2012). Agent-based
models are able to integrate individually differentiated types of consumer behavior. They are
characterized by a distributed control and data organisation, which enables to represent complex
decision processes with only few specifications. In the recent past there were published many
scientific works in this area. They concern in the analysis of companies positioning and the impact on
the consumer behavior (e.g. Tay and Lusch 2002, Wilkinson and Young 2002, Casti 1997). Often
discussed is the reception of the product by the market (Goldenberg et al. 2010, Heath et al. 2009),
innovation difussion (Rahmandad and Sterman 2008, Shaikh et al. 2005, Toubia et al. 2008). More
general deliberations on the ABMS in the investigating of consumer behavior shows e.g. (Adjali et al.
2005, Ben 2002, Collings et al. 1999).
Journal of Applied Economic Sciences
The approach introduced in this paper uses an agent-based model in the form of multi-agent
system to serve as a simulation platform for the seller-customer negotiation in a virtual trading
company. The overall idea comes from the research of Barnett (2003). He proposed the integration of
the real system models with the management models to work together in real-time. The real system
(e.g. ERP system) outputs proceed to the management system (e.g. simulation framework) to be used
to investigate and to predict important company’s results (metrics). Actual and simulated metrics are
compared and evaluated in a management model that identifies the steps to take to respond in a
manner that drives the system metrics towards their desired values. We used a generic control loop
model of a company (Wolf 2006) and implemented multi-agent simulation framework, which
represents the management system. This task was rather complex, therefore we took only a part of the
model – trading processes and the negotiation of seller and customer.
The work described in this paper aims at proposing an approach to describe the customer
behavior in the trading processes of a virtual company. Implemented simulation framework will be a
basic part of a future management system simulating business metrics – key performance indicators
(KPIs) of a real company’s system. The paper is structured as follows. In the section 2 the multi-agent
model is described. In the section 3 the seller-customer negotiation is introduced. The core of this
section is the production function definition. The simulation results are presented in section 4.
Acknowledgment
This work was supported by grant of Silesian University no. SGS/6/2013 "Advanced
Modeling and Simulation of Economic Systems”.
References
[1] Adjali, I., Dias B., Hurling, B. (2005). Agent based modeling of consumer behavior. Proceedings
of the North American Association for Computational Social and Organizational Science Annual
Conference. University of Notre Dame. Notre Dame. Indiana.
[2] Barnett, M.W. (2003). Modeling & Simulation in Business Process Management. Gensym
Corporation, pp. 6-7.
[3] Said, L.B., Bouron, T., Drogoul, A. (2002). Agent-based interaction analysis of consumer
behavior. Proceedings of the First International Joint Conference on Autonomous agents and
multiagent systems: part 1. ACM. New York, pp. 184-190.
[4] Casti, J.L. (1997). Would-be Worlds. How simulation is changing the World of Science. Wiley.
New York, ISBN: 978-0788196768.
[5] Challet, D. and Krause, A. (2006). What questions to ask in order to validate an agent-based
model. Report of the 56th European Study Group with Industry. pp. J1-J9. Available from:
http://www.maths-in-industry.org/miis/107/1/Unilever-ABM-Report.pdf. [Accessed 28 March
2013].
[6] Collings, D.A., Reeder, I., Adjali, P., Crocker, Lyons, M. (1999). Agent based customer
modelling. Computing in Economics and Finance. (1352). Available from:
http://econpapers.repec.org/paper /scescecf9/1352.htm [Accessed 28 March 2013].
[7] Enis, B.M. (1974). Marketing principles: the management process. Goodyear Pub. Co. (Pacific
Palisades, Calif). 608 p., ISBN 0876205503.
[8] Forrester, Jay. 1971. Planung unter dem Einfluss komplexer Sozialer Systeme. Politische Planung
in Theorie und Praxis. Ed by. G. Schmieg. Piper Verlag. München. p. 88.
[9] Goldenberg, J., Libai B., Muller, E. (2010). The chilling effect of network externalities.
International Journal of Research in Marketing, 27(1): 4-15.
[10] Gregson, N., Crewe, L., Brooks, K. (2002). Shopping, space, and practice, Environment and
Planning D, 20 (5): 597–617. DOI: 10.1068/d270t.
[11] Heath, B., Raymond H., Ciarallo, F. (2009). A survey of agent-based modeling practices, Journal
of Artificial Societies and Social Simulation, 12(4): 5-32.
Volume VIII, Issue 3(25), Fall 2013
[12] Jackson, P., Perez Del Aguila, R., Clarke I., Hallsworth, A., De Kervenoael, R., Kirkup, M.
(2006). Retail restructuring and consumer choice 2. Understanding consumer choice at the
household level, Environment and Planning A, 38(1): 47–67. DOI:10.1068/a37208
[13] Keegan, W.J., Moriarty, S.E., Duncan, T.R. (1992). Marketing. Prentice-Hall. Englewood Cliffs.
New Jersey. 193 p.
[14] McCarthy, E.J., Perreault W.D. (1993). Basic marketing: a global-managerial approach. Irwin,
792 p., ISBN 025610509X.
[15] Rahmandad, H., Sterman, J. (2008). Heterogeneity and network structure in the dynamics of
diffusion: Comparing agent-based and differential equation models, Management Science, 54(5):
998-1014.
[16] Shaikh, N.I., Ragaswamy, A., Balakrishnan, A. (2005). Modelling the Diffusion of Innovations
Using Small World Networks. Working Paper, Penn State University. Philadelphia.
[17] Schiffman, L., Kanuk, L. (2007). Purchasing Behavior, 9th Ed. Upper Saddle River, NJ: Pearson
Prentice Hall.
[18] Spišák, M., Šperka, R. (2011). Financial market simulation based on intelligent agents. Case
study. Journal of Applied Economic Sciences, VI, 3(17): 249-256.
[19] Šperka, R. (2012). Agent-based design of business intelligence system architecture. Journal of
Applied Economic Sciences, VII, 3(21): 326-333.
[20] Šperka, R., Vymětal D., Spišák, M. (2013). Validation of agent-based BPM simulation, Proc.
Advanced Methods and Technologies for Agent and Multi-agent Systems. Frontiers in Artificial
Intelligence and Applications. 7th International Conference KES-AMSTA`13, Hue city, Vietnam,
27.-29.5.2013. Amsterdam: IOS Press BV, Netherlands, 2013, Volume 252, pp. 276-283. ISBN
978-1-61499-253-0 (print), ISBN 978-61499-254-7 (online).
[21] Tay, N., Lusch. R.F. (2002). Agent-Based Modeling of Ambidextrous Organizations:
Virtualizing Competitive Strategy. IEEE Transactions on Intelligent Systems, 22(5): 50-57.
[22] Toubia, O., Goldenberg, J., Garcia, R. (2008). A New approach to modeling the adoption of new
products: Aggregated Diffusion Models. MSI Reports: Working Papers Series. 8(1): 65-76.
[23] Wilkinson, I., Young, L. (2002). On cooperating: Firms. Relations. Networks. Journal of
Business Research, 55: 123-132.
[24] Wolf, P. (2006). Úspěšný podnik na globálním trhu. Bratislava: CS Profi-Public. ISBN 80-
969546-5-2.
[25] Vymětal, D., Spišák, M., Šperka, R. (2012). An Influence of Random Number Generation
Function to Multiagent Systems, Proc. LNAI 7327. Agent and Multi-Agent Systems.
Technologies and Applications. 6th KES International Conference, KES AMSTA 2012,
Dubrovnik, Croatia. Berlin Heidelberg: Springer-Verlag, Germany. pp. 340-349. DOI
10.1007/978-3-642-30946-5, http://www.springerlink.com/ content/g71k68505h76x1wx/
*** Foundation for Intelligent Physical Agents, FIPA. 2002. FIPA Contract Net Interaction Protocol.
Available from: http://www.fipa.org/specs/fipa00029/SC00029H.pdf. [Accessed 13 June 2011].
Journal of Applied Economic Sciences
CONSTRUCTING ABATEMENT COST CURVES FOR F-GASES
George E. HALKOS
Laboratory of Operations Research, Department of Economics
University of Thessaly, Volos, Greece
Abstract
Scientific research on Greenhouse Gases (GHG) focuses mainly on CO2 emissions. But non-CO2 gases
(mainly F-gases in the form of HFCs, PFCs, SF6) are more potent at trapping heat within the atmosphere.
Currently, F-gases constitute a small proportion of GHG emissions but they are extremely high Global Warming
Potential gases with very high atmospheric lifetimes. They are also expected to increase massively due to
expansion of some emitting industries. This study constructs the least-cost curve of F-gases control for the EU-
27 and for the year 2020. It seems more cost-effective to abate SF6 first, then PFCs and then control HFCs.
Keywords: F-gases, control methods, emissions, GWP.
JEL Classification: Q00, Q01, Q53, L52; L95.
1. Introduction
Greenhouse gases (GHGs) include carbon dioxide (CO2), methane (CH4), nitrous oxide (N2O)
and a number of high Global Warming Potential gases such as hydrofluorocarbons (HFCs),
perfluorocarbons (PFCs) and sulphur hexafluoride (SF6), also known as F-gases. The Kyoto Protocol
regulates all these GHGs. CO2 emissions from the burning of fossil fuels and the change in the use of
human land may be considered as the most important anthropogenic effect. The rest of the GHGs (the
non-CO2 gases) are also important. Methane and nitrous oxide are naturally present in the atmosphere
while the F-gases are industrial gases. The F-gases are used as substitutes for the Ozone Depleting
Substances (ODS, chlorofluorocarbons CFCs and hydrochlorofluorocarbons HCFCs) that were going
to be phased out under the Montreal Protocol. They are also used and emitted from a number of
industrial sources like the use of PFCs in aluminium smelting or in semiconductor manufacture or the
use of SF6 as an insulating gas in various electrical systems.
The full set of fluorinated gases (CFC, PCFC, HFC, PFC, SF6) comprised almost 25% of the
added anthropogenic radiative forcing of the climate in 1980 and 1990 (IPCC, 1990). The main
responsibility for this percentage may be attributed to the chemically related anthropogenic gases
CFCs and PCFCs. Due to their depleting influence on stratospheric ozone, CFCs and PCFCs were
regulated, as mentioned, by the Montreal Protocol but were not considered in the Kyoto Protocol.
The majority of scientific research concerns CO2 emissions, although non-CO2 gases, especially
F-gases, are more potent at trapping heat within the atmosphere. F-gases are expected to rise quickly
due to the rapid expansion of some emitting industries such as semiconductor manufacture and
magnesium production, and the replacement of ODSs (CFCs and HCFCs) with HFCs in various
applications like air-conditioning, fire fighting, foams, refrigeration, solvents and aerosols. Moreover,
the atmospheric lifetimes of PFCs and SF6 are very long, ranging from 3200 years for SF6 to 50000
years for CF4 (Schaefer et al., 2006). For these reasons, F-gases are considered extremely harmful for
the environment, so they have been included in the Kyoto-Protocol.
Even if F-gases constitute only a small fraction of present GHG emissions they are responsible
for a more considerable amount of climate degradation, compared to other GHGs, because of their
high Global Warming Potentials[1]
(GWPs), which range from 140 for HFC-152a to 23900 for SF6.
The marginal costs of achieving reduction of high-GWP gases, such as F-gases, are less than
achieving reductions of CO2 gases. According to several studies, the inclusion of the abatement of
non-CO2 GHGs, reduces dramatically the overall implementation cost of the Kyoto Protocol (Reilly et
al., 1999, 2000, 2006; Jensen and Thelle, 2001).
The purpose of this study is the construction of the F-gases control cost curve for the year 2020
and for the EU-27. The structure is as follows. Section 2 reviews the existing relative efforts of
research and academic institutions on constructing abatement cost curves for F-gases. Section 3
Volume VIII, Issue 3(25), Fall 2013
explains the estimation of F-gases emissions by activity and sector. Section 4 derives the stepwise
abatement cost curve in the case of F-gases. The last section concludes this1.
Concluding remarks and limitations
In abating F-gases, it is found as more cost-effective to start abating SF6 gases first, then moving
to PFCs and then applying control methods to HFCs. Important activities emitting F-gases in 2020 are
air conditioning and refrigerator sectors and aluminium industry. More than 20 abatement options to
mitigate F-gases and their costs were presented. The existing results show average cost per ton CO2
controlled using these methods to range from 0.11 to 50 €/t CO2 eq. Half of these options have cost
below 15 €/t CO2 eq.
The policy implications are interesting. Concerning domestic refrigeration attention must be given
to the improvement of recovery efficiency for old equipments containing still HFC-134a instead of
isobutane (HC-600a) or propane (HC-290). Better recovery to prevent emissions at the end of life stage
is necessary. In industrial refrigeration, leak detectors are important in order to reduce emissions by
leakages while regular service inspections are required. Ammonia (R-717) is used as refrigerant in large
installations worldwide while CO2 can be used as a secondary refrigerant and it can also be used in
applications with evaporation temperatures down to -52o C and up to 5
o C (Rhiemeier and Harnisch,
2009).
In stationary A/C improvement in the design and installation of systems, maintenance and
repairing of systems, refrigerant recovery during servicing, recycling of recovered refrigerants are some
of the ways to reduce leakages. In mobile A/C inspections are important. For PU foams a main
mitigation option is the use of hydrocarbons instead of HFCs.
In the case of sulphur hexafluoride emission abatement the main control methods are improved
recovery, minimization of leakages and optimal use. In the case of the manufacture and use of GIS, the
main control methods are proper design, gas recovery, re-use and training of personnel handling SF6.
At last, it is worth mentioning that, as in any environmental problem, we may expect synergies to
be present in the case of F-gases mitigation. Tohka (2005) claims that using alternative refrigerants may
increase electricity use in some sectors like commercial, industry and air-conditioning. At the same time,
mobile air-conditioning increases both HFCs emissions and fuel consumption leading to more emissions
of other gases too. Primary aluminium production is also associated with particulate matter (PM)
emissions and its abatement will also influence PM emissions (Klimont et al., 2002). Finally, mitigation
of PFC emissions influences also CO2 emissions.
References
[1] Blok, K., De Jager, D. and Hendriks, C. (2001). Economic Evaluation of Sectoral Emission
Reduction Objectives for Climate Change - Summary Report for Policy Makers. Ecofys, Utrecht,
The Netherlands.
[2] Chesnaye F., Harvey R., Kruger D. and Laitner J. (2001). Cost-effective reductions of non-CO2
greenhouse gases, Energy Policy, 29: 1325-1331.
[5] Gallaher, M.P., Petrusa, J.E. and Delhotal, K.C. (2005). International marginal abatement costs of
non-CO2 greenhouse gases, Environmental Science, 2 (2/3): 327–337.
[6] Halkos, G. (1995), Evaluation of the direct cost of sulphur abatement under the main
desulfurization technologies, Energy Sources, 17: 391-412.
[7] Halkos, G. (1998). Evaluating the direct costs of controlling NOX emissions in Europe, Energy
Sources, 20(3): 223-239.
[8] Harmelink, M.G.M., Blok, K. and Ter Avest, G.H. (2005). Evaluation of non-CO2 greenhouse gas
emission reductions in The Netherlands in the period 1990–2003, Environmental Science, 2(2/3):
339–349.
1 An earlier draft of this study was presented in the Workshop on Abatement Costs of Chemicals at the European
Chemical Agency Conference Centre in Helsinki Finland 5-6 October 2010 organized by the European
Chemicals Agency (ECHA).
Journal of Applied Economic Sciences
[9] Hyman, R.C., Reilly, J.M., Babiker, M.H., De Masin, A. and Jacoby, H.D. (2002). Modeling non-
CO2 greenhouse gas abatement, Environmental Modelling and Assessment, 8(3): 175–186.
[13] Klimont Z., Cofala J., Berto I., Amann M., Heyes C., and Gyarfas, F. (2002). Modelling Particulate
Emissions in Europe, IR-02-076, IIASA, Laxenburg.
[14] Jensen, J. and Thelle, M.H. (2001). What are the gains from a multi-gas strategy?, Fondazione
Eni Enrico Mattei, Milano, Italy.
[15] Lucas, P.L., Den Elzen, M.G.J., and Van Vuuren, D.P. (2005). Multi-gas abatement analysis of
the Kyoto Protocol, Report no. 550006001. Netherlands Environmental Assessment Agency
(MNP), Bilthoven, The Netherlands.
[16] Manne, A.S., and Richels, R.G. (2001). An alternative approach to establishing trade-offs among
greenhouse gasses, Nature, (5): 675–677.
[17] Reilly, J., Prinn, R., Harnisch, J., Fitzmaurice, J., Jacoby, H., Kicklighter, D., Melillo, J., Stone, P.,
Sokolov, A. and Wang, C. (1999). Multi-gas assessment of the Kyoto Protocol, Nature, 3: 549-
555.
[18] Reilly, J., Mayer, M., and Harnisch, J. (2000). Multi gas control under the Kyoto Agreement,
Report No. 58, Cambridge, MA.
[19] Reilly J., Sarofim M., Paltsev S. and Prinn R. (2006). The role of non-CO2 GHGs in climate
policy: Analysing using the MIT IGSM, Energy Journal Special Issue, 503-520.
[20] Rhiemeier J.M. and Harnisch, J. (2009). F-gases (HFCs, PFCs and SF6): Sectoral emission
reduction and Economic Costs for Climate Change (SERPEC-CC). ECOFYS, Utrecht, The
Netherlands
[21] Schaefer, O.D., Godwin, D. and Harnisch J. (2006). Estimating Future Emissions and Potential
Reductions of HFCs, PFCs, and SF6, Energy Journal Multi-Greenhouse Mitigation and Climate
Policy Special Issue, pp. 63-88.
[22] Schwarz, W., Rhiemeier, J.M. (2007). The analysis of the emissions of fluorinated greenhouse
gases from refrigeration and air conditioning equipment used in the transport sector other than
road transport and options for reducing these emissions, prepared for the European Commission
(DG Environment), 2 November 2007.
[23] Tohka, A. (2005). The GAINS Model for Greenhouse Gases - Version 1.0: HFC, PFC and SF6,
IIASA Interim Report IR-05-056, IIASA, Laxenburg..
[27] Van Vuuren, D.P., Den Elzen, M.G.J., Berk, M.M., Lucas, P.L., Eickhout, B., Eerens, H., and
Oostenrijk, R. (2003). Regional costs and benefits of alternative post-Kyoto climate regimes:
comparison of variants of the multi-stage and per capita convergence regimes. Report no.
728001025. National Institute for Public Health and the Environment, Bilthoven, The Netherlands.
[28] Van Vuuren, D.P., Weyant, J.P. and De la Chesnaye, F.C. (2006). Multigas scenarios to stabilise
radiative forcing, Energy Economics, 28: 102–120.
[29] Weyant, J.P. and De la Chesnaye, F.C. (2006). Overview of EMF-21: multigas mitigation and
climate change, Energy Journal Multi-Greenhouse Mitigation and Climate Policy Special Issue,
pp. 1-32.
*** ESIA (2006). European Semiconductor Industry Association: Intermediate Staus Report of the
Progress towards the reduction of PFC emissions from European semiconductor manufacturing.
ESIA, Brussels.
*** Eurostat (2006). Eurostat: Passenger transport in the European Union - Issue number 9/2006,
Luxembourg, September 2006. http://epp.eurostat.ec.europa.eu/cache/ITY_ OFFPUB/KS-NZ-06-
009/EN/KS-NZ-06-009-EN.PDF. Accessed 11 July 2008
*** UNEP (2006), Report of the Refrigeration, Air conditioning, and Heat Pumps Technical Options
Committee, Assessment, Nairobi, January 2007.
*** USEPA (2006a), Global Mitigation of Non- CO2 Greenhouse Gases, United States
Environmental Protection Agency, Washington, DC, EPA Report 430-R-06-005,
http://www.epa.gov/nonco2/econ-inv/international.html

Volume VIII, Issue 3(25), Fall 2013
*** USEPA (2006b), Global Emissions of Non-CO2 Greenhouse Gases: 1990-2020. United States
Environmental Protection Agency (US-EPA), Washington, D.C., EPA Report 430-R-06-003,
http://www.epa.gov/nonco2/econ-inv/international.html

Journal of Applied Economic Sciences
The 6th Online International Conference on „Advanced Researches in Management, Finance and Accounting"
Craiova, Romania, 22th November, 2013 Maintaining the tradition of annual conferences, Faculty of Financial Accounting Management
and CESMAA organize this year the International Conference dedicated to the „Advanced Researches in Management, Finance and Accounting". Each year, Research Center, CESMAA of Faculty of Accounting and Financial Management, Craiova provides an opportunity to meet and network with a diverse range of industry leaders and senior professionals through the academic area from the entire world of Economic Sciences.
To resolve the funding issue concerning the conference expenses, European Research Center of Managerial Studies in Business Administration will organize, in 22th November, an online session as an alternative approach for participation. Those who would attend to International online conference will be awarded with a certificate and their accepted papers will be considered for publications in Journal of Applied Economic Sciences and Journal of Applied Research in Finance.
Conference aims is to promoting research and provides an opportunity for intensive interdisciplinary interaction and debate between academics and practitioners with research interests in the field of economics, finance, accounting, business, marketing, management, and information technology. The conference has grown over the years and now attracts researchers of major institutions internationally.
CALL FOR PAPERS: The conference provides a forum for disseminating new research findings, practices and
techniques in management, finances, accounting, business, marketing, international affairs and information technology and exchanging ideas among academicians and practitioners to promote a better understanding of contemporary issues and solutions to the challenges. This conference would encourage the young generation to pursue research interests in the areas of economic sciences. Academicians and researchers are invited to share their unpublished research findings in all areas mentioned below, but are not limited to:
• Accounting Challenges – Strategic Accounting;
• Management Control Systems;
• Creative Accounting and Earnings;
Management;
• Forensic Accounting and Fraud;
• Tax Accounting and Fraud;
• Prevention of fraud and
unacceptable accounting practices;
• Information security audits;
• Best Practices in Corporate Governance;
• Asset-liability management;
• Bank assurance;
• Banking crises;
• Corporate finance;
• Credit risk modelling and management;
• Financial engineering;
• Foreign exchange markets;
• Law and finance;
• Mergers and acquisitions;
• Mutual funds management;
• Portfolio management;
• Regulations of financial markets;
• Accounting and Finance;
• Accounting, Auditing and Performance;
Evaluation;
• Auditing Technology;

Volume VIII, Issue 3(25), Fall 2013
• Organizational Reengineering;
• Efficiency and performance of
financial institutions and bank branches;
• Financing decisions of banks;
• Investment banking;
• Management of financial institutions;
• Regulation and supervision of the
banking industry, both nationally
and internationally;
• Technological progress and banking;
• The role of central banks;
• Accountability;
• Accounting standards and regulations;
• Environmental accounting;
• Financial accounting;
• Management accounting;
• Risk management and internal control;
• Social accounting;
• Asset pricing;
• Bankruptcy prediction and determinants;
• Banking, Accounting and Finance;
• Behavioral Accounting and Finance;
• Corporate Governance;
• Business Intelligence;
• Economics and Accounting;
• Education Economics and Development;
• Electronic Banking;
• Electronic Finance;
• Financial Markets and Derivatives;
• Financial Services Management;
• Culture and Business Management;
• Managerial and Financial Accounting;
• Monetary Economics and Finance;
• Revenue Management;
• Strategic Engineering Asset Management;
• Applied Economic Studies;
• Complexity in Business and Economics;
• Business and Economics Engineering;
• Experimental Design and Process Optimization;
• Product Development.
Papers have to submit electronically at this e-mail address [email protected] in
MS Word also in PowerPoint format (see Instructions for Authors). All papers are double peer reviewed by members of the Scientific Committee. Papers accepted will be published in official Conference eProceedings on CD, which will have assigned ISBN. Papers received after the deadline will not be included in the proceedings.
The best papers will be published in Journal of Applied Economic Sciences http://www.cesmaa.eu/journals/jaes/index.php which is indexed in SCOPUS, RePEc, CEEOL, Index Copernicus and EBSCO databases as well as in Journal of Applied Research in Finance (http://www.cesmaa.eu/journals/jarf/index), also indexed. Important Dates:
20 October, 2013 - Abstract submission deadline; 25 October, 2013 - Notification of acceptance/rejection; 5 November, 2013 - Deadline for payments and Final paper submission deadline; 22 November, 2013 – Conference.
Conference Fee covers conference materials, (book of abstracts, eProceedings, Certification of participate).
100 Euro for foreign participants; 200 Lei/paper for Romanians participants; 50 Lei/paper for CESMAA members.
Payment will be to perform immediately after notification of acceptance of your paper until 2013, November 5. All fees derived by the bank transfer will be supported by the sender. Bank: Raiffeisen Bank – Victoria Agency IBAN ACCOUNT for EURO: RO 25RZBR0000060014384461 IBAN ACCOUNT for LEI: RO 04RZBR0000060014384451

Journal of Applied Economic Sciences
Account holder: Spiru Haret University, Central Research Institute Address: No.1, Tineretului Street, District 4, Bucharest, Romania Please mention on the payment form that the fee is for the CESMAA Conference and your name (e.g. CESMAAConference_2013_Smith). It is essential to send a copy of Payment Form (Bank Transfer):
copy by fax: 40 251 598265; or a scanned copy by email to: [email protected]
For more details please visit our conference`s website at: http://www.cesmaa.eu/conferences

Volume VIII, Issue 3(25), Fall 2013
Call for Papers
The Editor in Chief would like to invite submissions for the 8th Volume, Issue 4(26),
Winter 2013 of the Journal of Applied
Economic Sciences (JAES).
The primary aim of the Journal has been and remains the provision of a forum for the dissemination of a variety of international issues, empirical research and other matters
of interest to researchers and practitioners in a diversity of subject areas linked to the broad theme of economic, business, management, accounting, finance, information technologies.
Subject areas include, but not restricted to: Quantitative and qualitative research methodology and practice Strategic, public sector and human resource management Entrepreneurship and Small & Medium Sized Enterprises (SME’s) Marketing and e-business Economics, finance and financial management Organizational theory and behavior Supply chain management Information systems, technology, innovation and operations management Educational management and leadership
All papers will first be considered by the Editors for general relevance, originality and significance. If accepted for review, papers will then be subject to double blind peer review. Deadline for Submission: 15th November 2013 Expected Publication Date: December 2013 Web: http://www.cesmaa.eu/journals/jaes/ E-mail: [email protected]
Full author guidelines are available from: http://www.cesmaa.eu/journals/jaes/instructions_for_authors.php

Journal of Applied Economic Sciences
ISSN 1843-6110