Embed Size (px)
Citation preview
.
.
Riding high on better growth prospects…
Grasim Industries Ltd, flagship company of Aditya Birla Group is a diversified company
with interests in cement, textiles, retail and chemicals.
Investment Rationale
Strong growth outlook for VSF business
Grasim is a pioneer in the viscose staple fibre (VSF) business with an aggregate capacity of
498 ktpa. Grasim’s VSF business commands 9% market share globally. It is continuously
focusing on increasing the usage of VSF in India by leveraging its Brand Liva and enriching the
product mix through a larger share of specialty fibre. Besides, the company is expanding its
VSF capacity by 161 tpd by Q4FY18 (of which 54 tpd has already comes on stream) through
debottlenecking. Besides the management has guided for a stable outlook for VSF over the
next two years due to lack of fresh capacity additions globally. All these factors would augur
well for margin going forward. In chemical business, the company is expanding its caustic
soda capacity to 1048 KTPA from 840 KTPA currently which is expected to be completed by
Q4FY18. The company is also expanding its caustic soda capacity through debottlenecking of
its existing capacities. Further it is doubling its phosphoric acid capacity to 54 KT from 25KT
which is expected to be completed by Q2FY18. We believe the company’s capacity expansion
of caustic soda will further strengthen its leadership position. However, the volumes growth
in VSF & chemicals businesses are expected to remain restricted as the company is operating
at near full capacity utilisation.
Well positioned to gain from demand upsurge
Grasim operates its cement business through its subsidiary, UltraTech Cement Ltd with a
capacity of 69.3 mtpa in FY17. UltraTech’s position as the largest cement player is poised to
be consolidated with the acquisition of Jaiprakash Associates’ 21.2 MTPA cement capacity
which is expected to be complete by Q2FY18. The acquisition will provide Ultratech an entry
into central India and also strengthens its presence in north and south India. The acquisition
is likely to be EPS accretive only after two years given the low capacity utilization level of the
latter. Besides, Ultratech’s 3.5 MT per annum integrated cement plant at Dhar, Madhya
Pradesh is on track and is expected to commence commercial production by Q4FY19. Post
the above expansion and acquisition, the total capacity of Ultratech will increase to 95.4
MTPA. This will provide Ultratech with a competitive edge and we believe it will be a key
beneficiary of any uptick in demand from housing & infrastructure sectors.
Restructuring to complete by Q2FY18
In a mega restructuring of the business, Aditya Birla Group plans to merge Aditya Birla Nuvo
into Grasim. The merger of Aditya Birla Nuvo with Grasim is in advanced stage and is
expected to be complete by H1FY18. The merger will lead to Grasim becoming holding
company for ABFSL, Idea, Hindalco and Aditya Birla fashion & retail (ABFRL). The
restructuring will also lead to listing of the financial services arm - Aditya Birla Financial
Services (ABFSL).
Valuations: Given its leadership position globally, better product mix (higher proportion of
Speciality fibre) coupled with firm VSF demand, we expect consolidated revenue/PAT to
grow at a CAGR of 10%/22% over FY17-19E. Further, steady ramp up in capacities at
Ultratech and uptick in demand from housing and infrastructure bodes well for the cement
business. We value Grasim based on SOTP, valuing standalone business at 5.5x EV/EBITDA,
60% holding in Ultratech at our TP and stake in others post 40% discount at CMP.
Recommend BUY with a TP of Rs1,222.
Rating BUY CMP (Rs.) 1,109
Target (Rs.) 1,222
Potential Upside 10%
Duration Long Term
Face Value (Rs.) 2
52 week H/L (Rs.) 1,237/782
Adj. all time High (Rs.) 1,237
Decline from 52WH (%) 10.3
Rise from 52WL (%) 41.8
Beta 1.1
Mkt. Cap (Rs.Cr) 51,755
Market Data
May 26th, 2017
BSE Code: 500300 NSE Code: GRASIM Reuters Code: GRAS.NS Bloomberg Code: GRASIM:IN
Fiscal Year Ended
For private circulation only
Y/E FY16 FY17 FY18E FY19E
Revenue (Rs.Cr) 36,218 36,068 39,434 43,929
Adj. profit (Rs.Cr)
2,387 3,167 3,635 4,691
Adj. EPS (Rs.) 51.1 67.8 77.9 100.5
P/E (x) 21.7 16.3 14.2 11.0
P/BV (x) 2.0 1.6 1.5 1.3
ROE (%) 9.8 11.1 11.0 12.7
Shareholding Pattern
Mar-17 Dec-16 Chg.
Promoters 31.3 31.3 -
FII’s 21.7 21.8 (0.1)
MFs/Insti 14.6 19.7 (5.1)
Public 9.2 14.9 (5.7)
Others 9.7 12.3 (2.6)
Source: Company, In-house research
700800900
100011001200
May
-16
Jun
-16
Jul-
16
Au
g-1
6
Sep
-16
Oct
-16
No
v-1
6
Dec
-16
Jan
-17
Feb
-17
Mar
-17
Ap
r-1
7
May
-17
GRASIM Sensex (Rebased)
One year Price Chart
Volume No. I Issue No. 122 Grasim Industries Ltd.
.
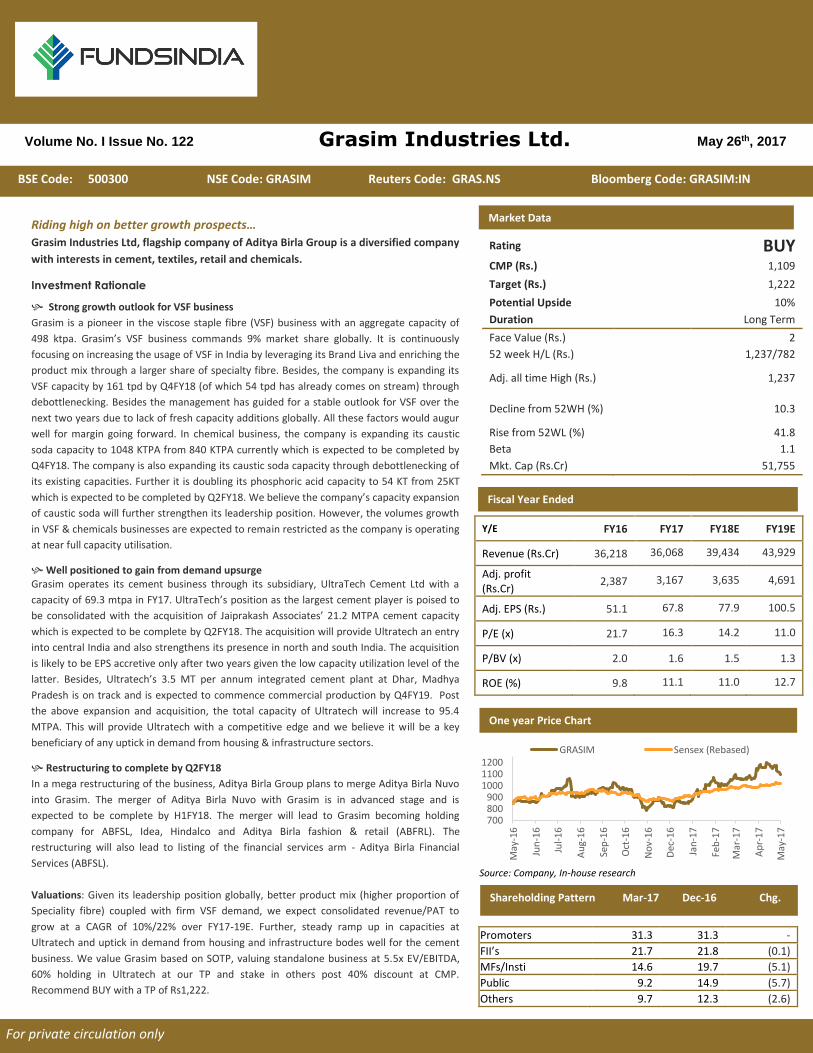
Grasim Industries: Business overview
Grasim Industries Ltd, flagship company of Aditya Birla Group is a diversified company with
interests in cement, textiles, retail and chemicals. Grasim is also into cement business
through its subsidiary, UltraTech Cement Ltd. The company’s core businesses include Viscose
Staple Fibre (VSF) and Cement, contributing over 90% of its revenues. Its chemicals business
is a backward integration for VSF. Grasim Industries is a leading global player in Viscose Staple
Fibre (9% global market share) and the largest player in the Cement and Chlor Alkali
Chemicals in India. Grasim is embarking on ambitious growth plans through capacity
expansions in VSF and Cement, which will further consolidate its leadership position in both
the businesses.
Grasim group structure
Source: Company
Strong growth outlook for VSF business
The company is a pioneer in the viscose staple fibre (VSF) business with an aggregate capacity
of 498 ktpa. Grasim’s VSF business commands 9% market share globally. Grasim's VSF plants
are located at Nagda in Madhya Pradesh, Kharach and Vilayat in Gujarat and Harihar in
Karnataka. The ramp up of its VSF capacity through a Greenfield project at Vilayat (Gujarat) -
120,000 TPA and Brownfield expansions at Harihar (Karnataka) - 36,500 TPA has further
consolidate its leadership position in this space. Hence it has led to 25% growth in sales
volumes over last two years.
Further the company is expanding its VSF capacity by 161 tpd (of which 54 tpd has already
comes on stream) through debottlenecking. The company is awaiting environmental
clearance for this and is expected to be complete by Q4FY18. Besides the company is
continuously focusing on increasing the usage of VSF in India by leveraging its Brand Liva,
enriching the product mix through a larger share of specialty fibre and partnering with the
textile value chain. All these factors would augur well for VSF margin going forward.
For private circulation only
VSF capacities as a glance
Source: Company
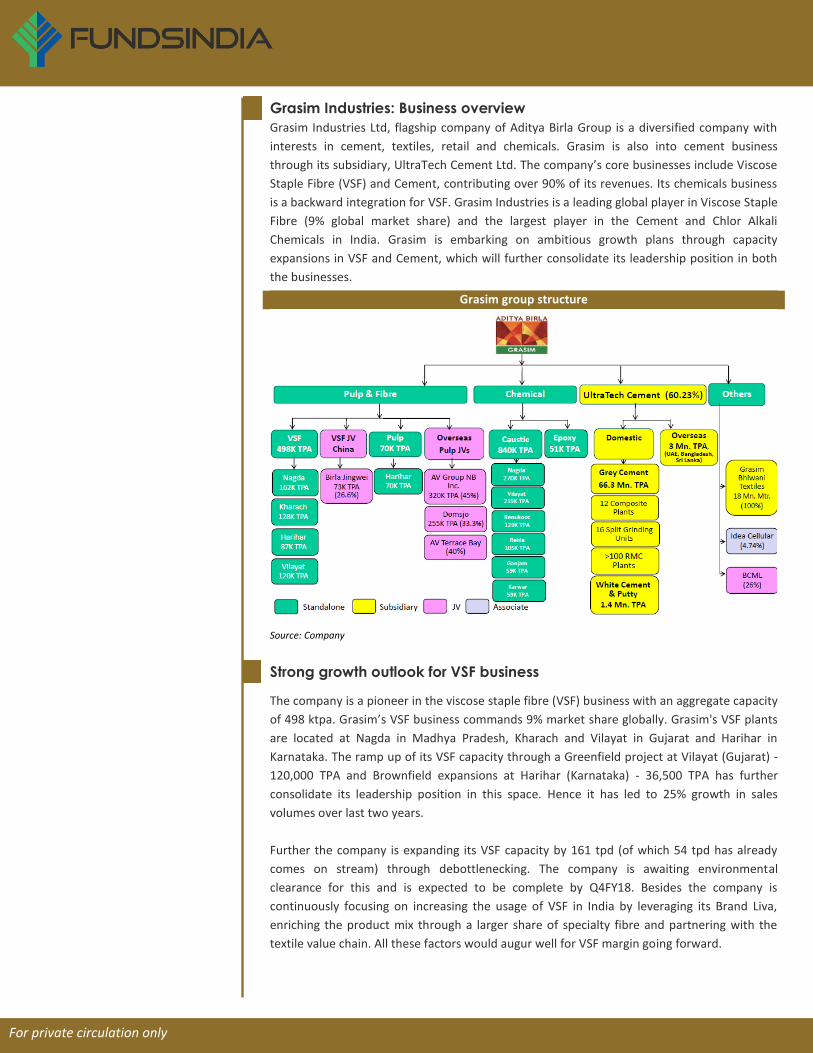
Deepening its foothold in chemicals business
The company also has presence in chemicals business which is essentially a backward
integration for its VSF business. The chemicals business accounts for mere 10% of the overall
revenue in FY17. Grasim is the largest player in India in chlor alkali with caustic soda capacity
of 452K TPA in India. Over the years, the company has increased its capacity by more than
double to 840 ktpa in FY17 from 258 ktpa in FY11. In order to consolidate its leadership
position, the company has merged Aditya Birla Chemicals with itself in FY16. The merger has
provided the company with a pan-India presence. With the company’s chlor alkali plants
operating at near full capacity levels, the company is expanding its caustic soda capacity to
1048 KTPA from 840 KTPA currently which is expected to be complete by Q4FY18 through
both brownfield expansion and debottlenecking of its existing plants. It is also doubling its
phosphoric acid capacity to 54 KT from 25KT which is expected to be complete by Q2FY18. We
believe the company’s capacity expansion of caustic soda will further strengthen its leadership
position.
Capacity to witness three-fold jump post expansion (in KTPA)
Source: Company, In-house research
Cement business: Well positioned to gain from demand upsurge
The company operates its cement business through its subsidiary, UltraTech Cement Ltd. Post
the acquisition of Ultratech business in 2004, the company has increased its overall cement
capacity (through both organic and inorganic route) by more than four-fold over FY04-17 from
17 mtpa to 69.3 mtpa. Ultratech is the largest manufacturer of grey cement in India and is also
India's largest exporter of cement and clinker. It has an overall installed grey cement capacity
of 69.3 MTPA. UltraTech is also the largest producer of white cement and ready-mix concrete
in India. Besides, Ultratech has entered into an agreement to acquire Jaiprakash Associates’
21.2 MTPA cement capacity which is expected to be complete in Q2FY18.
258
840
1048
0
200
400
600
800
1000
1200
FY11 FY17 Post-ongoing expansion
For private circulation only
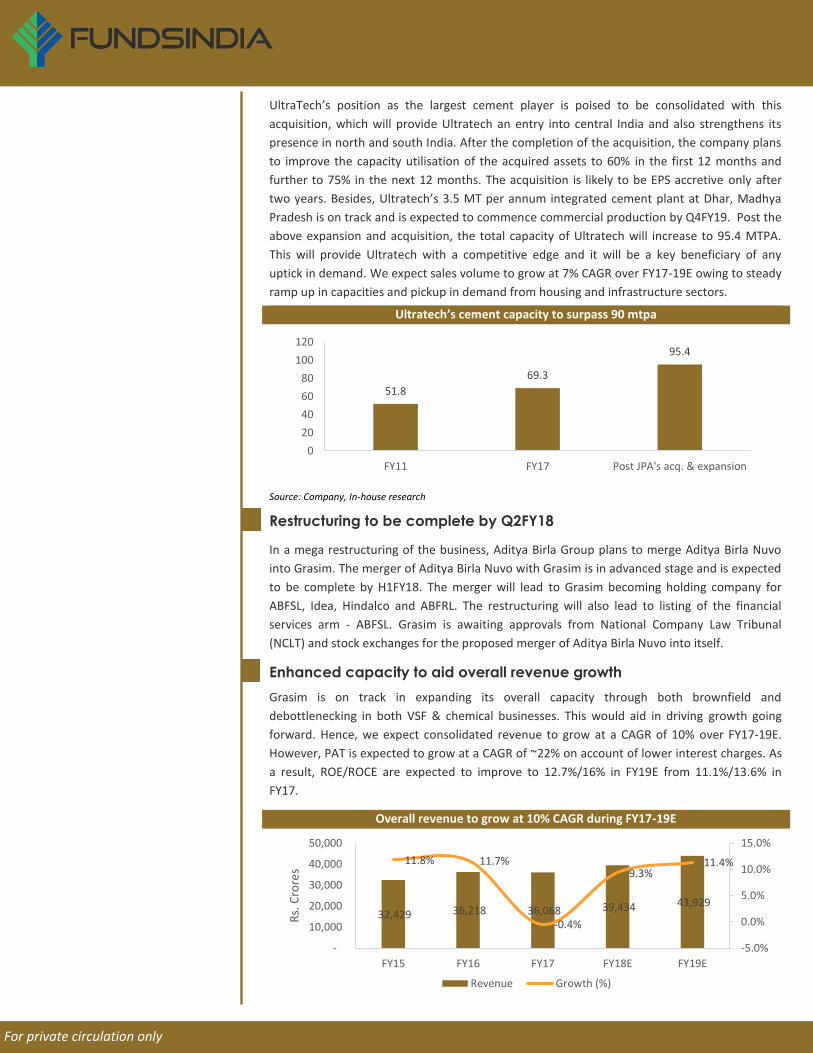
UltraTech’s position as the largest cement player is poised to be consolidated with this
acquisition, which will provide Ultratech an entry into central India and also strengthens its
presence in north and south India. After the completion of the acquisition, the company plans
to improve the capacity utilisation of the acquired assets to 60% in the first 12 months and
further to 75% in the next 12 months. The acquisition is likely to be EPS accretive only after
two years. Besides, Ultratech’s 3.5 MT per annum integrated cement plant at Dhar, Madhya
Pradesh is on track and is expected to commence commercial production by Q4FY19. Post the
above expansion and acquisition, the total capacity of Ultratech will increase to 95.4 MTPA.
This will provide Ultratech with a competitive edge and it will be a key beneficiary of any
uptick in demand. We expect sales volume to grow at 7% CAGR over FY17-19E owing to steady
ramp up in capacities and pickup in demand from housing and infrastructure sectors.
Ultratech’s cement capacity to surpass 90 mtpa
Source: Company, In-house research
Restructuring to be complete by Q2FY18
In a mega restructuring of the business, Aditya Birla Group plans to merge Aditya Birla Nuvo
into Grasim. The merger of Aditya Birla Nuvo with Grasim is in advanced stage and is expected
to be complete by H1FY18. The merger will lead to Grasim becoming holding company for
ABFSL, Idea, Hindalco and ABFRL. The restructuring will also lead to listing of the financial
services arm - ABFSL. Grasim is awaiting approvals from National Company Law Tribunal
(NCLT) and stock exchanges for the proposed merger of Aditya Birla Nuvo into itself.
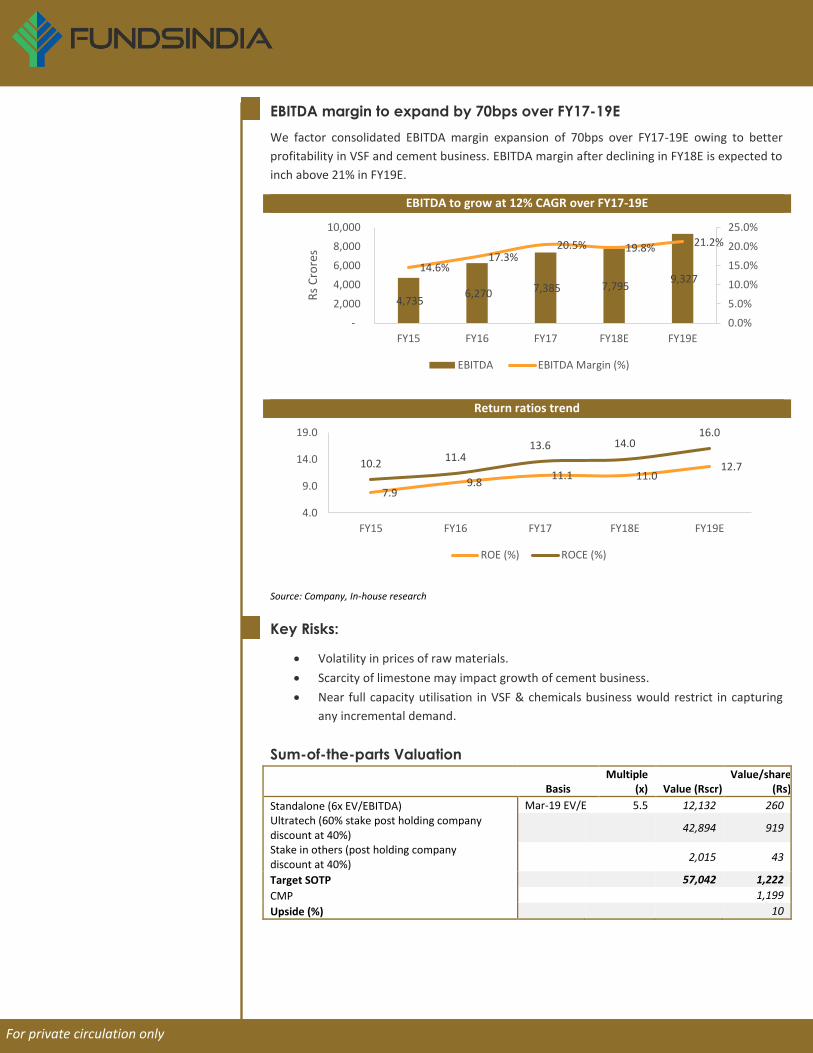
Enhanced capacity to aid overall revenue growth
Grasim is on track in expanding its overall capacity through both brownfield and
debottlenecking in both VSF & chemical businesses. This would aid in driving growth going
forward. Hence, we expect consolidated revenue to grow at a CAGR of 10% over FY17-19E.
However, PAT is expected to grow at a CAGR of ~22% on account of lower interest charges. As
a result, ROE/ROCE are expected to improve to 12.7%/16% in FY19E from 11.1%/13.6% in
FY17.
Overall revenue to grow at 10% CAGR during FY17-19E
51.8
69.3
95.4
0
20
40
60
80
100
120
FY11 FY17 Post JPA's acq. & expansion
32,429 36,218 36,068 39,434 43,929
11.8% 11.7%
-0.4%
9.3%11.4%
-5.0%
0.0%
5.0%
10.0%
15.0%
-
10,000
20,000
30,000
40,000
50,000
FY15 FY16 FY17 FY18E FY19E
Rs.
Cro
res
Revenue Growth (%)
For private circulation only
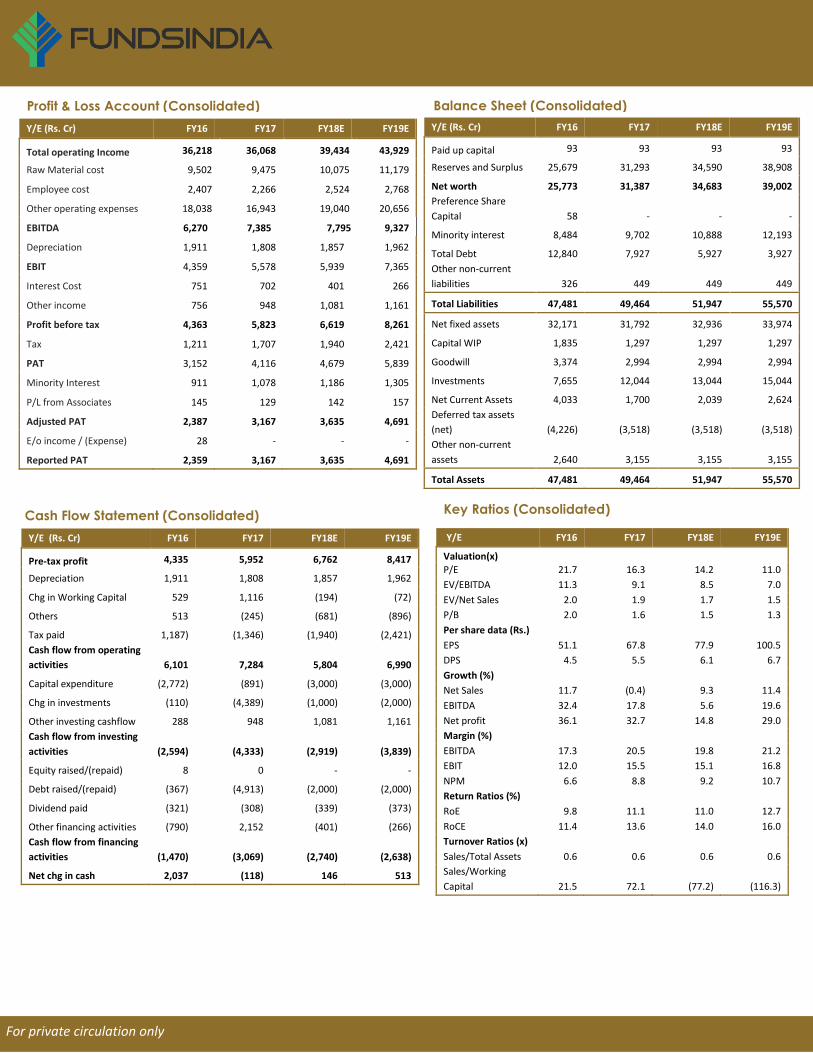
EBITDA margin to expand by 70bps over FY17-19E
We factor consolidated EBITDA margin expansion of 70bps over FY17-19E owing to better
profitability in VSF and cement business. EBITDA margin after declining in FY18E is expected to
inch above 21% in FY19E.
EBITDA to grow at 12% CAGR over FY17-19E
Return ratios trend
Source: Company, In-house research
Key Risks:
• Volatility in prices of raw materials.
• Scarcity of limestone may impact growth of cement business.
• Near full capacity utilisation in VSF & chemicals business would restrict in capturing
any incremental demand.
Sum-of-the-parts Valuation
Basis Multiple
(x) Value (Rscr) Value/share
(Rs)
Standalone (6x EV/EBITDA) Mar-19 EV/E 5.5 12,132 260
Ultratech (60% stake post holding company discount at 40%)
42,894 919
Stake in others (post holding company discount at 40%)
2,015 43
Target SOTP 57,042 1,222
CMP 1,199
Upside (%) 10
4,735 6,270 7,385 7,795
9,327 14.6%
17.3%20.5% 19.8% 21.2%
0.0%
5.0%
10.0%
15.0%
20.0%
25.0%
-
2,000
4,000
6,000
8,000
10,000
FY15 FY16 FY17 FY18E FY19E
Rs
Cro
res
EBITDA EBITDA Margin (%)
7.99.8
11.1 11.012.710.2
11.413.6 14.0
16.0
4.0
9.0
14.0
19.0
FY15 FY16 FY17 FY18E FY19E
ROE (%) ROCE (%)
For private circulation only
Y/E (Rs. Cr) FY16 FY17 FY18E FY19E
Pre-tax profit 4,335 5,952 6,762 8,417
Depreciation 1,911 1,808 1,857 1,962
Chg in Working Capital 529 1,116 (194) (72)
Others 513 (245) (681) (896)
Tax paid 1,187) (1,346) (1,940) (2,421)
Cash flow from operating
activities 6,101 7,284 5,804 6,990
Capital expenditure (2,772) (891) (3,000) (3,000)
Chg in investments (110) (4,389) (1,000) (2,000)
Other investing cashflow 288 948 1,081 1,161
Cash flow from investing
activities (2,594) (4,333) (2,919) (3,839)
Equity raised/(repaid) 8 0 - -
Debt raised/(repaid) (367) (4,913) (2,000) (2,000)
Dividend paid (321) (308) (339) (373)
Other financing activities (790) 2,152 (401) (266)
Cash flow from financing
activities
(1,470) (3,069) (2,740) (2,638)
Net chg in cash 2,037 (118) 146 513
Cash Flow Statement (Consolidated)
Key Ratios (Consolidated)
Y/E FY16 FY17 FY18E FY19E
Valuation(x)
P/E 21.7 16.3 14.2 11.0
EV/EBITDA 11.3 9.1 8.5 7.0
EV/Net Sales 2.0 1.9 1.7 1.5
P/B 2.0 1.6 1.5 1.3
Per share data (Rs.)
EPS 51.1 67.8 77.9 100.5
DPS 4.5 5.5 6.1 6.7
Growth (%)
Net Sales 11.7 (0.4) 9.3 11.4
EBITDA 32.4 17.8 5.6 19.6
Net profit 36.1 32.7 14.8 29.0
Margin (%)
EBITDA 17.3 20.5 19.8 21.2
EBIT 12.0 15.5 15.1 16.8
NPM 6.6 8.8 9.2 10.7
Return Ratios (%)
RoE 9.8 11.1 11.0 12.7
RoCE 11.4 13.6 14.0 16.0
Turnover Ratios (x)
Sales/Total Assets 0.6 0.6 0.6 0.6
Sales/Working
Capital 21.5 72.1 (77.2) (116.3)
Balance Sheet (Consolidated)
Profit & Loss Account (Consolidated)
Y/E (Rs. Cr) FY16 FY17 FY18E FY19E
Paid up capital 93 93 93 93
Reserves and Surplus 25,679 31,293 34,590 38,908
Net worth 25,773 31,387 34,683 39,002
Preference Share
Capital 58 - - -
Minority interest 8,484 9,702 10,888 12,193
Total Debt 12,840 7,927 5,927 3,927
Other non-current
liabilities 326 449 449 449
Total Liabilities 47,481 49,464 51,947 55,570
Net fixed assets 32,171 31,792 32,936 33,974
Capital WIP 1,835 1,297 1,297 1,297
Goodwill 3,374 2,994 2,994 2,994
Investments 7,655 12,044 13,044 15,044
Net Current Assets 4,033 1,700 2,039 2,624
Deferred tax assets
(net) (4,226) (3,518) (3,518) (3,518)
Other non-current
assets 2,640 3,155 3,155 3,155
Total Assets 47,481 49,464 51,947 55,570
Profit & Loss Account (Consolidated)
Profit & Loss Account (Consolidated)
For private circulation only
Y/E (Rs. Cr) FY16 FY17 FY18E FY19E
Total operating Income 36,218 36,068 39,434 43,929
Raw Material cost 9,502 9,475 10,075 11,179
Employee cost 2,407 2,266 2,524 2,768
Other operating expenses 18,038 16,943 19,040 20,656
EBITDA 6,270 7,385 7,795 9,327
Depreciation 1,911 1,808 1,857 1,962
EBIT 4,359 5,578 5,939 7,365
Interest Cost 751 702 401 266
Other income 756 948 1,081 1,161
Profit before tax 4,363 5,823 6,619 8,261
Tax 1,211 1,707 1,940 2,421
PAT 3,152 4,116 4,679 5,839
Minority Interest 911 1,078 1,186 1,305
P/L from Associates 145 129 142 157
Adjusted PAT 2,387 3,167 3,635 4,691
E/o income / (Expense) 28 - - -
Reported PAT 2,359 3,167 3,635 4,691
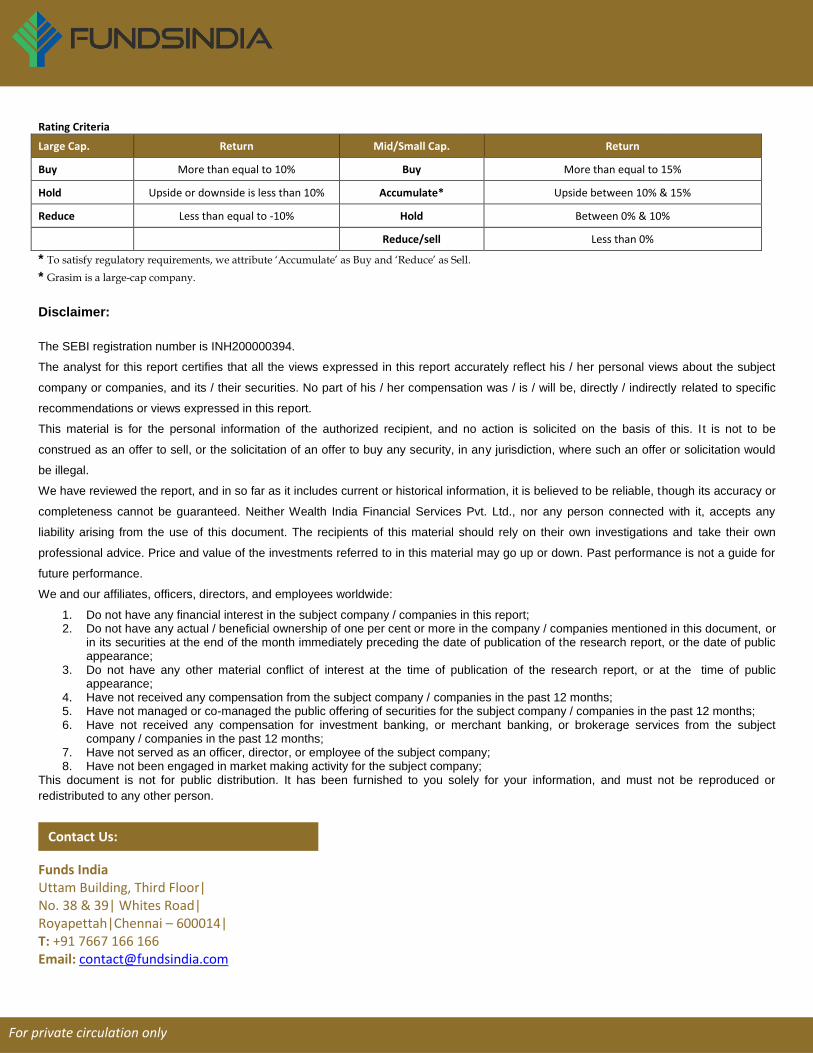
Rating Criteria Large Cap. Return Mid/Small Cap. Return
Buy More than equal to 10% Buy More than equal to 15%
Hold Upside or downside is less than 10% Accumulate* Upside between 10% & 15%
Reduce Less than equal to -10% Hold Between 0% & 10%
Reduce/sell Less than 0%
* To satisfy regulatory requirements, we attribute ‘Accumulate’ as Buy and ‘Reduce’ as Sell.
* Grasim is a large-cap company.
Disclaimer:
The SEBI registration number is INH200000394.
The analyst for this report certifies that all the views expressed in this report accurately reflect his / her personal views about the subject
company or companies, and its / their securities. No part of his / her compensation was / is / will be, directly / indirectly related to specific
recommendations or views expressed in this report.
This material is for the personal information of the authorized recipient, and no action is solicited on the basis of this. I t is not to be
construed as an offer to sell, or the solicitation of an offer to buy any security, in any jurisdiction, where such an offer or solicitation would
be illegal.
We have reviewed the report, and in so far as it includes current or historical information, it is believed to be reliable, though its accuracy or
completeness cannot be guaranteed. Neither Wealth India Financial Services Pvt. Ltd., nor any person connected with it, accepts any
liability arising from the use of this document. The recipients of this material should rely on their own investigations and take their own
professional advice. Price and value of the investments referred to in this material may go up or down. Past performance is not a guide for
future performance.
We and our affiliates, officers, directors, and employees worldwide:
1. Do not have any financial interest in the subject company / companies in this report; 2. Do not have any actual / beneficial ownership of one per cent or more in the company / companies mentioned in this document, or
in its securities at the end of the month immediately preceding the date of publication of the research report, or the date of public appearance;
3. Do not have any other material conflict of interest at the time of publication of the research report, or at the time of public appearance;
4. Have not received any compensation from the subject company / companies in the past 12 months; 5. Have not managed or co-managed the public offering of securities for the subject company / companies in the past 12 months; 6. Have not received any compensation for investment banking, or merchant banking, or brokerage services from the subject
company / companies in the past 12 months; 7. Have not served as an officer, director, or employee of the subject company; 8. Have not been engaged in market making activity for the subject company;
This document is not for public distribution. It has been furnished to you solely for your information, and must not be reproduced or
redistributed to any other person.
Funds India Uttam Building, Third Floor| No. 38 & 39| Whites Road| Royapettah|Chennai – 600014| T: +91 7667 166 166 Email: [email protected]
Contact Us:
For private circulation only
Dion’s Disclosure and Disclaimer I, Abhijit Kumar Das, employee of Dion Global Solutions Limited (Dion) is engaged in preparation of this report and hereby certify that all the views expressed in this research report (report) reflect my personal views about any or all of the subject issuer or securities.
Disclaimer
This report has been prepared by Dion and the report & its contents are the exclusive property of the Dion and the client cannot
tamper with the report or its contents in any manner and the said report, shall in no case, be further distributed to any third party
for commercial use, with or without consideration.
Recipient shall not further distribute the report to a third party for a commercial consideration as this report is being furnished to the recipient solely for the purpose of information. Dion has taken steps to ensure that facts in this report are based on reliable information but cannot testify, nor make any representation or warranty, express or implied, to the accuracy, contents or data contained within this report. It is hereby confirmed that wherever Dion has employed a rating system in this report, the rating system has been clearly defined including the time horizon and benchmarks on which the rating is based. Descriptions of any company or companies or their securities mentioned herein are not intended to be complete and this report is not, and should not be construed as an offer or solicitation of an offer, to buy or sell any securities or other financial instruments. Dion has not taken any steps to ensure that the securities referred to in this report are suitable for any particular investor. This report is not to be relied upon in substitution for the exercise of independent judgment. Opinions or estimates expressed are current opinions as of the original publication date appearing on this report and the information, including the opinions and estimates contained herein, are subject to change without notice. Dion is under no duty to update this report from time to time. Dion or its associates including employees engaged in preparation of this report and its directors do not take any responsibility, financial or otherwise, of the losses or the damages sustained due to the investments made or any action taken on basis of this report, including but not restricted to, fluctuation in the prices of securities, changes in the currency rates, diminution in the NAVs, reduction in the dividend or income, etc. The investments or services contained or referred to in this report may not be suitable for all equally and it is recommended that an independent investment advisor be consulted. In addition, nothing in this report constitutes investment, legal, accounting or tax advice or a representation that any investment or strategy is suitable or appropriate to individual circumstances or otherwise constitutes a personal recommendation of Dion. REGULATORY DISCLOSURES:
Dion is engaged in the business of developing software solutions for the global financial services industry across the entire
transaction lifecycle and inter-alia provides research and information services essential for business intelligence to global companies
and financial institutions. Dion is listed on BSE Limited (BSE) and is also registered under the SEBI (Research Analyst) Regulations,
2014 (SEBI Regulations) as a Research Analyst vide Registration No. INH100002771. Dion’s activities were neither suspended nor has
it defaulted with requirements under the Listing Agreement and / or SEBI (Listing Obligations and Disclosure Requirements)
Regulations, 2015 with the BSE in the last five years. Dion has not been debarred from doing business by BSE / SEBI or any other
authority.
In the context of the SEBI Regulations, we affirm that we are a SEBI registered Research Analyst and in the course of our business,
we issue research reports /research analysis etc that are prepared by our Research Analysts. We also affirm and undertake that no
disciplinary action has been taken against us or our Analysts in connection with our business activities.
In compliance with the above mentioned SEBI Regulations, the following additional disclosures are also provided which may be
considered by the reader before making an investment decision:
For private circulation only
1. Disclosures regarding Ownership
Dion confirms that:
(i) Dion/its associates have no financial interest or any other material conflict in relation to the subject company (ies)
covered herein at the time of publication of this report.
(ii) It/its associates have no actual / beneficial ownership of 1% or more securities of the subject company (ies) covered
herein at the end of the month immediately preceding the date of publication of this report.
Further, the Research Analyst confirms that:
(i) He, his associates and his relatives have no financial interest in the subject company (ies) covered herein, and they
have no other material conflict in the subject company at the time of publication of this report.
(ii) he, his associates and his relatives have no actual/beneficial ownership of 1% or more securities of the subject
company (ies) covered herein at the end of the month immediately preceding the date of publication of this report.
2. Disclosures regarding Compensation:
During the past 12 months, Dion or its Associates:
(a) Have not managed or co-managed public offering of securities for the subject company (b) Have not received any compensation
for investment banking or merchant banking or brokerage services from the subject company (c) Have not received any
compensation for products or services other than investment banking or merchant banking or brokerage services from the subject.
(d) Have not received any compensation or other benefits from the subject company or third party in connection with this report
3. Disclosure regarding the Research Analyst’s connection with the subject company:
It is affirmed that I, Abhijit Kumar Das employed as Research Analyst by Dion and engaged in the preparation of this report have not
served as an officer, director or employee of the subject company
4. Disclosure regarding Market Making activity:
Neither Dion /its Research Analysts have engaged in market making activities for the subject company.
Copyright in this report vests exclusively with Dion.
For private circulation only


![INDEX [] · 2018-07-18 · Pre - Feasibility Report M/s. Grasim Industries Ltd. 4 (Grasim Cellulosic Division) M/s. Grasim Industries Ltd. has its VSF Plant at Nagda (Madhya Pradesh),](https://img.pdfslide.us/doc/110x75/5e98fff07ae4e733db3d1d5a/index-2018-07-18-pre-feasibility-report-ms-grasim-industries-ltd-4-grasim.jpg)
![Index [bsmedia.business-standard.com] · Hero MotoCorp Ltd. INE158A01026 Auto 92 2.86 0.58 JSW Steel Ltd. INE019A01038 Ferrous Metals 704 2.73 0.55 Grasim Industries Ltd. INE047A01021](https://img.pdfslide.us/doc/110x75/60dee37cc864837bbf16bdbd/index-hero-motocorp-ltd-ine158a01026-auto-92-286-058-jsw-steel-ltd-ine019a01038.jpg)