Embed Size (px)
Citation preview
Volume IIIAppendix E.2
STS-107 Image Analysis TeamFinal Report
This Appendix contains NSTS-37384, STS-107 Image Analysis Team Final Report in support of the Columbia Accident Investigation, 30 June 2003.
REPORT VOLUME III OCTOBER 2003 27

THIS PAGE INTENTIONALLY LEFT BLANK
28
NSTS-37384
STS-107 Image Analysis Team
Final Report
in support of the Columbia Accident Investigation
June 30, 2003
Submitted by
________________________ _______________________ Dr. Gregory J. Byrne, NASA Dr. Cynthia A. Evans, Lockheed Team Lead Martin, Co-Team Lead
This information is being distributed to aid in the investigation of the Columbia mishap and should only be distributed to personnel who are actively involved in this investigation.
1
NSTS-37384STS-107 Image Analysis Team Final Report.pdf
C0-000045
CAB066-0953
COLUMBIAACCIDENT INVESTIGATION BOARD
REPORT VOLUME III OCTOBER 2003 29
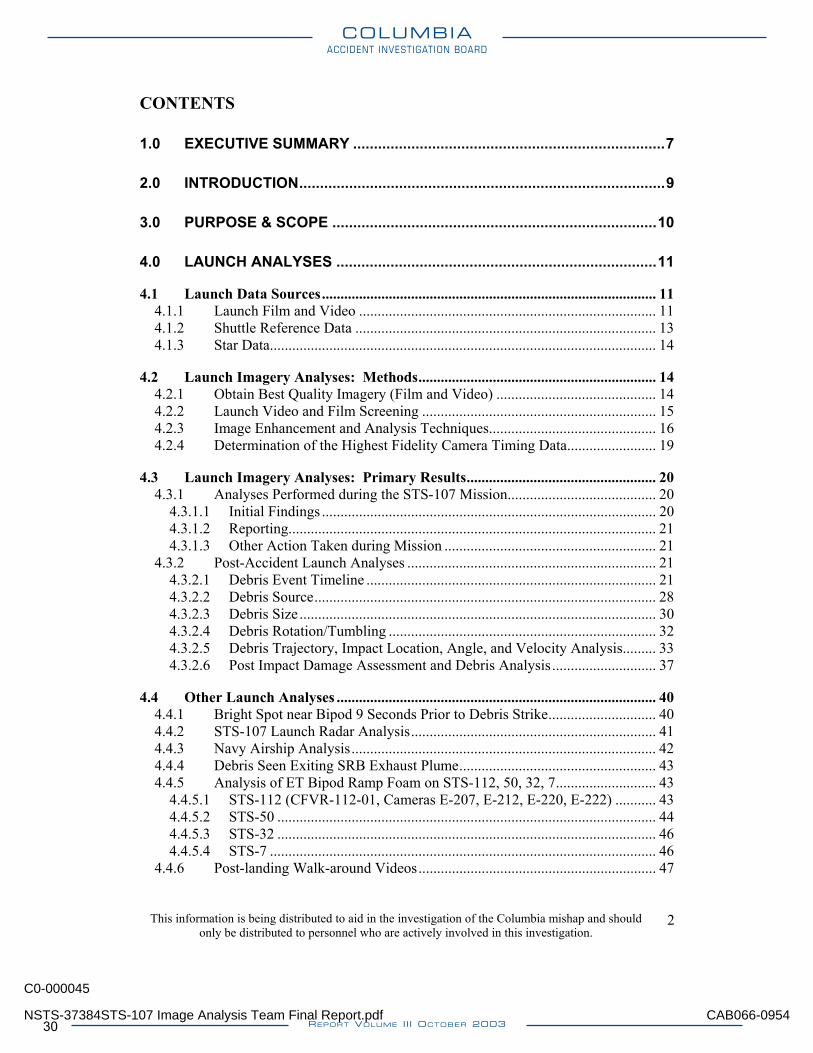
CONTENTS
1.0 EXECUTIVE SUMMARY ...........................................................................7
2.0 INTRODUCTION........................................................................................9
3.0 PURPOSE & SCOPE ..............................................................................10
4.0 LAUNCH ANALYSES .............................................................................11
4.1 Launch Data Sources.......................................................................................... 11 4.1.1 Launch Film and Video ................................................................................ 11 4.1.2 Shuttle Reference Data ................................................................................. 13 4.1.3 Star Data........................................................................................................ 14
4.2 Launch Imagery Analyses: Methods................................................................ 14 4.2.1 Obtain Best Quality Imagery (Film and Video) ........................................... 14 4.2.2 Launch Video and Film Screening ............................................................... 15 4.2.3 Image Enhancement and Analysis Techniques............................................. 16 4.2.4 Determination of the Highest Fidelity Camera Timing Data........................ 19
4.3 Launch Imagery Analyses: Primary Results................................................... 20 4.3.1 Analyses Performed during the STS-107 Mission........................................ 20
4.3.1.1 Initial Findings .......................................................................................... 20 4.3.1.2 Reporting................................................................................................... 21 4.3.1.3 Other Action Taken during Mission ......................................................... 21
4.3.2 Post-Accident Launch Analyses ................................................................... 21 4.3.2.1 Debris Event Timeline .............................................................................. 21 4.3.2.2 Debris Source............................................................................................ 28 4.3.2.3 Debris Size ................................................................................................ 30 4.3.2.4 Debris Rotation/Tumbling ........................................................................ 32 4.3.2.5 Debris Trajectory, Impact Location, Angle, and Velocity Analysis......... 33 4.3.2.6 Post Impact Damage Assessment and Debris Analysis............................ 37
4.4 Other Launch Analyses ...................................................................................... 40 4.4.1 Bright Spot near Bipod 9 Seconds Prior to Debris Strike............................. 40 4.4.2 STS-107 Launch Radar Analysis.................................................................. 41 4.4.3 Navy Airship Analysis.................................................................................. 42 4.4.4 Debris Seen Exiting SRB Exhaust Plume..................................................... 43 4.4.5 Analysis of ET Bipod Ramp Foam on STS-112, 50, 32, 7........................... 43
4.4.5.1 STS-112 (CFVR-112-01, Cameras E-207, E-212, E-220, E-222) ........... 43 4.4.5.2 STS-50 ...................................................................................................... 44 4.4.5.3 STS-32 ...................................................................................................... 46 4.4.5.4 STS-7 ........................................................................................................ 46
4.4.6 Post-landing Walk-around Videos................................................................ 47
This information is being distributed to aid in the investigation of the Columbia mishap and should only be distributed to personnel who are actively involved in this investigation.
2
NSTS-37384STS-107 Image Analysis Team Final Report.pdf
C0-000045
CAB066-0954
COLUMBIAACCIDENT INVESTIGATION BOARD
REPORT VOLUME III OCTOBER 200330
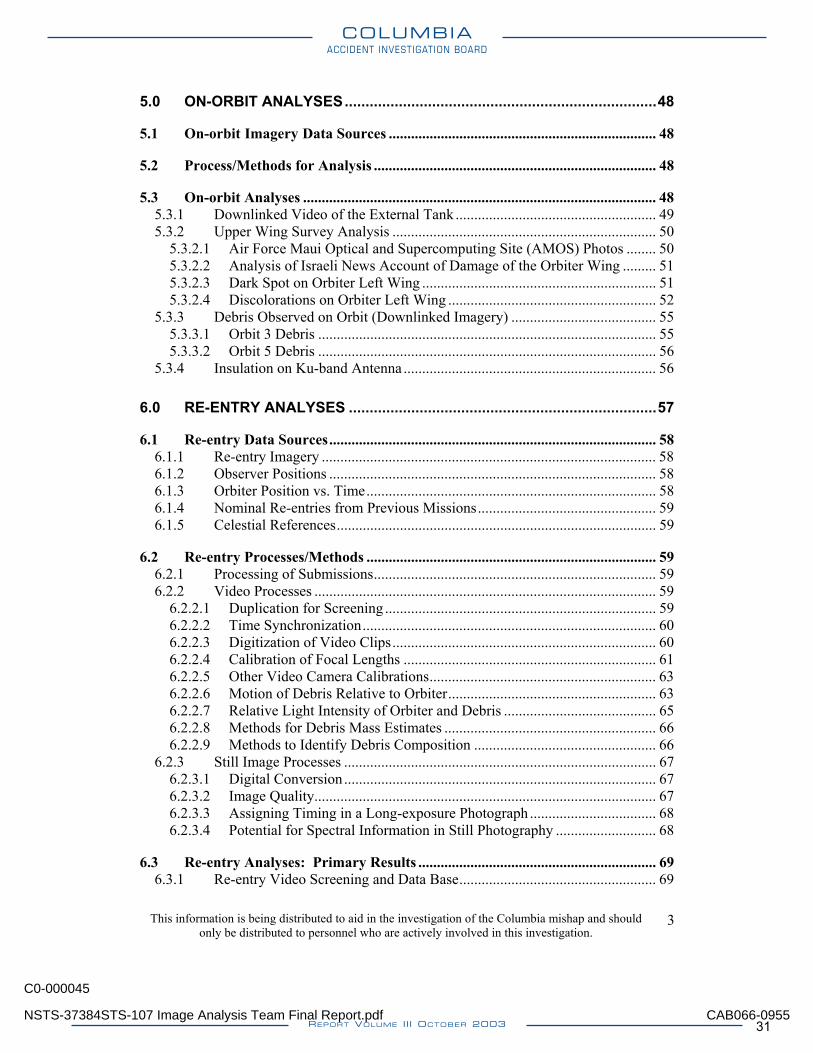
5.0 ON-ORBIT ANALYSES...........................................................................48
5.1 On-orbit Imagery Data Sources ........................................................................ 48
5.2 Process/Methods for Analysis ............................................................................ 48
5.3 On-orbit Analyses ............................................................................................... 48 5.3.1 Downlinked Video of the External Tank ...................................................... 49 5.3.2 Upper Wing Survey Analysis ....................................................................... 50
5.3.2.1 Air Force Maui Optical and Supercomputing Site (AMOS) Photos ........ 50 5.3.2.2 Analysis of Israeli News Account of Damage of the Orbiter Wing ......... 51 5.3.2.3 Dark Spot on Orbiter Left Wing ............................................................... 51 5.3.2.4 Discolorations on Orbiter Left Wing ........................................................ 52
5.3.3 Debris Observed on Orbit (Downlinked Imagery) ....................................... 55 5.3.3.1 Orbit 3 Debris ........................................................................................... 55 5.3.3.2 Orbit 5 Debris ........................................................................................... 56
5.3.4 Insulation on Ku-band Antenna .................................................................... 56
6.0 RE-ENTRY ANALYSES ..........................................................................57
6.1 Re-entry Data Sources........................................................................................ 58 6.1.1 Re-entry Imagery .......................................................................................... 58 6.1.2 Observer Positions ........................................................................................ 58 6.1.3 Orbiter Position vs. Time.............................................................................. 58 6.1.4 Nominal Re-entries from Previous Missions................................................ 59 6.1.5 Celestial References...................................................................................... 59
6.2 Re-entry Processes/Methods .............................................................................. 59 6.2.1 Processing of Submissions............................................................................ 59 6.2.2 Video Processes ............................................................................................ 59
6.2.2.1 Duplication for Screening ......................................................................... 59 6.2.2.2 Time Synchronization............................................................................... 60 6.2.2.3 Digitization of Video Clips....................................................................... 60 6.2.2.4 Calibration of Focal Lengths .................................................................... 61 6.2.2.5 Other Video Camera Calibrations............................................................. 63 6.2.2.6 Motion of Debris Relative to Orbiter........................................................ 63 6.2.2.7 Relative Light Intensity of Orbiter and Debris ......................................... 65 6.2.2.8 Methods for Debris Mass Estimates ......................................................... 66 6.2.2.9 Methods to Identify Debris Composition ................................................. 66
6.2.3 Still Image Processes .................................................................................... 67 6.2.3.1 Digital Conversion.................................................................................... 67 6.2.3.2 Image Quality............................................................................................ 67 6.2.3.3 Assigning Timing in a Long-exposure Photograph .................................. 68 6.2.3.4 Potential for Spectral Information in Still Photography ........................... 68
6.3 Re-entry Analyses: Primary Results ................................................................ 69 6.3.1 Re-entry Video Screening and Data Base..................................................... 69
This information is being distributed to aid in the investigation of the Columbia mishap and should only be distributed to personnel who are actively involved in this investigation.
3
NSTS-37384STS-107 Image Analysis Team Final Report.pdf
C0-000045
CAB066-0955
COLUMBIAACCIDENT INVESTIGATION BOARD
REPORT VOLUME III OCTOBER 2003 31
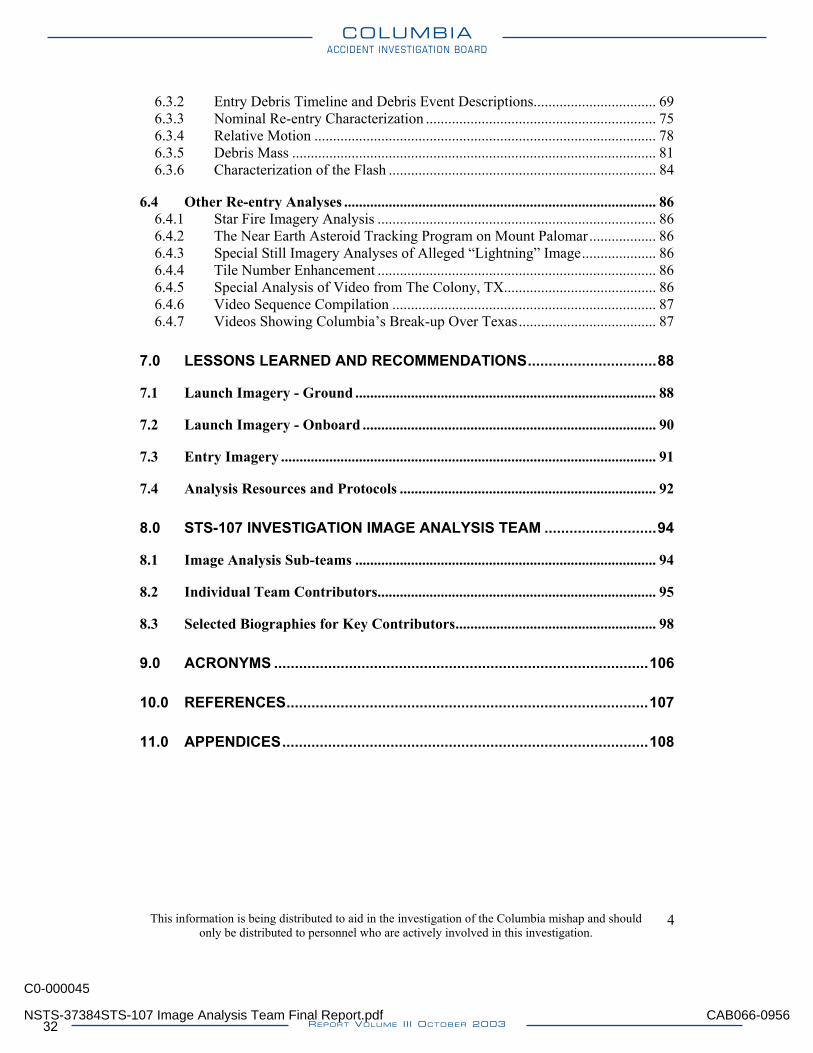
6.3.2 Entry Debris Timeline and Debris Event Descriptions................................. 69 6.3.3 Nominal Re-entry Characterization .............................................................. 75 6.3.4 Relative Motion ............................................................................................ 78 6.3.5 Debris Mass .................................................................................................. 81 6.3.6 Characterization of the Flash ........................................................................ 84
6.4 Other Re-entry Analyses .................................................................................... 86 6.4.1 Star Fire Imagery Analysis ........................................................................... 86 6.4.2 The Near Earth Asteroid Tracking Program on Mount Palomar.................. 86 6.4.3 Special Still Imagery Analyses of Alleged “Lightning” Image.................... 86 6.4.4 Tile Number Enhancement ........................................................................... 86 6.4.5 Special Analysis of Video from The Colony, TX......................................... 86 6.4.6 Video Sequence Compilation ....................................................................... 87 6.4.7 Videos Showing Columbia’s Break-up Over Texas..................................... 87
7.0 LESSONS LEARNED AND RECOMMENDATIONS...............................88
7.1 Launch Imagery - Ground ................................................................................. 88
7.2 Launch Imagery - Onboard ............................................................................... 90
7.3 Entry Imagery ..................................................................................................... 91
7.4 Analysis Resources and Protocols ..................................................................... 92
8.0 STS-107 INVESTIGATION IMAGE ANALYSIS TEAM ...........................94
8.1 Image Analysis Sub-teams ................................................................................. 94
8.2 Individual Team Contributors........................................................................... 95
8.3 Selected Biographies for Key Contributors...................................................... 98
9.0 ACRONYMS ..........................................................................................106
10.0 REFERENCES.......................................................................................107
11.0 APPENDICES........................................................................................108
This information is being distributed to aid in the investigation of the Columbia mishap and should only be distributed to personnel who are actively involved in this investigation.
4
NSTS-37384STS-107 Image Analysis Team Final Report.pdf
C0-000045
CAB066-0956
COLUMBIAACCIDENT INVESTIGATION BOARD
REPORT VOLUME III OCTOBER 200332
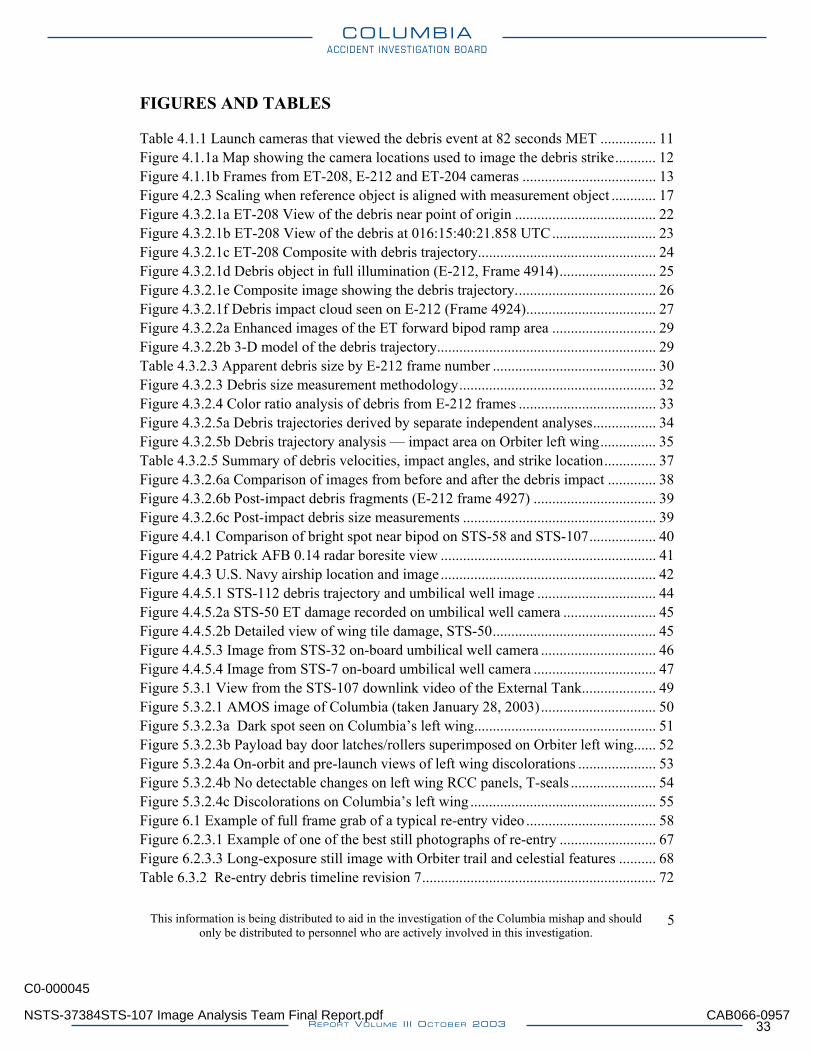
FIGURES AND TABLES Table 4.1.1 Launch cameras that viewed the debris event at 82 seconds MET ............... 11 Figure 4.1.1a Map showing the camera locations used to image the debris strike........... 12 Figure 4.1.1b Frames from ET-208, E-212 and ET-204 cameras .................................... 13 Figure 4.2.3 Scaling when reference object is aligned with measurement object ............ 17 Figure 4.3.2.1a ET-208 View of the debris near point of origin ...................................... 22 Figure 4.3.2.1b ET-208 View of the debris at 016:15:40:21.858 UTC............................ 23 Figure 4.3.2.1c ET-208 Composite with debris trajectory................................................ 24 Figure 4.3.2.1d Debris object in full illumination (E-212, Frame 4914).......................... 25 Figure 4.3.2.1e Composite image showing the debris trajectory...................................... 26 Figure 4.3.2.1f Debris impact cloud seen on E-212 (Frame 4924)................................... 27 Figure 4.3.2.2a Enhanced images of the ET forward bipod ramp area ............................ 29 Figure 4.3.2.2b 3-D model of the debris trajectory........................................................... 29 Table 4.3.2.3 Apparent debris size by E-212 frame number ............................................ 30 Figure 4.3.2.3 Debris size measurement methodology..................................................... 32 Figure 4.3.2.4 Color ratio analysis of debris from E-212 frames ..................................... 33 Figure 4.3.2.5a Debris trajectories derived by separate independent analyses................. 34 Figure 4.3.2.5b Debris trajectory analysis — impact area on Orbiter left wing............... 35 Table 4.3.2.5 Summary of debris velocities, impact angles, and strike location.............. 37 Figure 4.3.2.6a Comparison of images from before and after the debris impact ............. 38 Figure 4.3.2.6b Post-impact debris fragments (E-212 frame 4927) ................................. 39 Figure 4.3.2.6c Post-impact debris size measurements .................................................... 39 Figure 4.4.1 Comparison of bright spot near bipod on STS-58 and STS-107.................. 40 Figure 4.4.2 Patrick AFB 0.14 radar boresite view .......................................................... 41 Figure 4.4.3 U.S. Navy airship location and image .......................................................... 42 Figure 4.4.5.1 STS-112 debris trajectory and umbilical well image ................................ 44 Figure 4.4.5.2a STS-50 ET damage recorded on umbilical well camera ......................... 45 Figure 4.4.5.2b Detailed view of wing tile damage, STS-50............................................ 45 Figure 4.4.5.3 Image from STS-32 on-board umbilical well camera ............................... 46 Figure 4.4.5.4 Image from STS-7 on-board umbilical well camera ................................. 47 Figure 5.3.1 View from the STS-107 downlink video of the External Tank.................... 49 Figure 5.3.2.1 AMOS image of Columbia (taken January 28, 2003)............................... 50 Figure 5.3.2.3a Dark spot seen on Columbia’s left wing................................................. 51 Figure 5.3.2.3b Payload bay door latches/rollers superimposed on Orbiter left wing...... 52 Figure 5.3.2.4a On-orbit and pre-launch views of left wing discolorations ..................... 53 Figure 5.3.2.4b No detectable changes on left wing RCC panels, T-seals ....................... 54 Figure 5.3.2.4c Discolorations on Columbia’s left wing .................................................. 55 Figure 6.1 Example of full frame grab of a typical re-entry video ................................... 58 Figure 6.2.3.1 Example of one of the best still photographs of re-entry .......................... 67 Figure 6.2.3.3 Long-exposure still image with Orbiter trail and celestial features .......... 68 Table 6.3.2 Re-entry debris timeline revision 7............................................................... 72
This information is being distributed to aid in the investigation of the Columbia mishap and should only be distributed to personnel who are actively involved in this investigation.
5
NSTS-37384STS-107 Image Analysis Team Final Report.pdf
C0-000045
CAB066-0957
COLUMBIAACCIDENT INVESTIGATION BOARD
REPORT VOLUME III OCTOBER 2003 33
Figure 6.3.2a Map summarizing locations of observed debris events............................. 73 Figure 6.3.2b Detailed map of the Western U.S. re-entry debris event locations ............ 74 Figure 6.3.2c Detailed map of the Texas re-entry debris event locations......................... 75 Table 6.3.3 Nominal entry videos screened to compare with STS-107 videos ............... 76 Figure 6.3.3a Video image of normal Shuttle re-entry, STS-109..................................... 77 Figure 6.3.3b Video image of normal Shuttle re-entry, STS-109..................................... 77 Figure 6.3.3.c Summary of Events not seen in Nominal Re-entry Video ........................ 78 Figure 6.3.4.a Debris 6 position relative to Orbiter measured from three videos............. 79 Figure 6.3.4b Debris 14 position relative to Orbiter measured from four videos............. 80 Table 6.3.4 Calculated separation times and ballistic coefficients ................................... 81 Figure 6.3.5a Debris 6 intensity versus time..................................................................... 82 Figure 6.3.5b Field-by-field Debris 6/Shuttle intensity ratio versus times....................... 83 Table 6.3.5 Estimated masses for Debris events 6, 14, 1 and 2........................................ 83 Figure 6.3.6a Frame grabs from the Sparks, NV video .................................................... 84 Figure 6.3.6b Preliminary Orbiter light curve from the Springville, CA video................ 85
This information is being distributed to aid in the investigation of the Columbia mishap and should only be distributed to personnel who are actively involved in this investigation.
6
NSTS-37384STS-107 Image Analysis Team Final Report.pdf
C0-000045
CAB066-0958
COLUMBIAACCIDENT INVESTIGATION BOARD
REPORT VOLUME III OCTOBER 200334
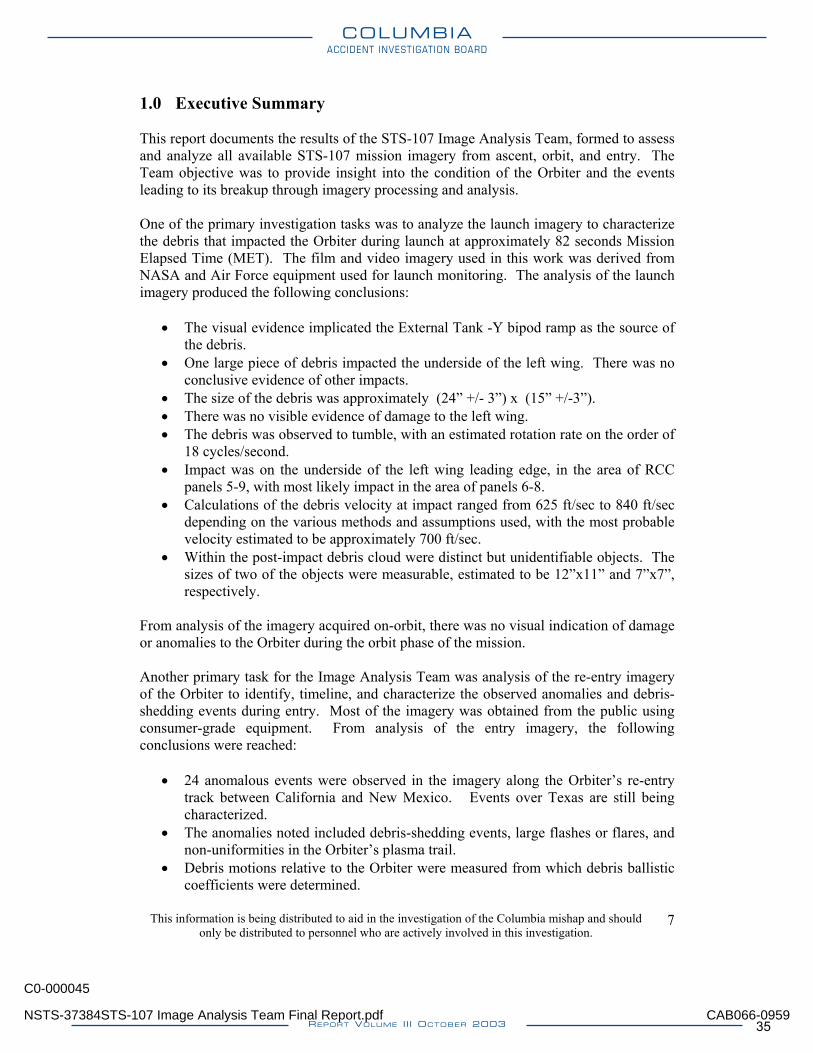
1.0 Executive Summary This report documents the results of the STS-107 Image Analysis Team, formed to assess and analyze all available STS-107 mission imagery from ascent, orbit, and entry. The Team objective was to provide insight into the condition of the Orbiter and the events leading to its breakup through imagery processing and analysis. One of the primary investigation tasks was to analyze the launch imagery to characterize the debris that impacted the Orbiter during launch at approximately 82 seconds Mission Elapsed Time (MET). The film and video imagery used in this work was derived from NASA and Air Force equipment used for launch monitoring. The analysis of the launch imagery produced the following conclusions:
• The visual evidence implicated the External Tank -Y bipod ramp as the source of the debris.
• One large piece of debris impacted the underside of the left wing. There was no conclusive evidence of other impacts.
• The size of the debris was approximately (24” +/- 3”) x (15” +/-3”). • There was no visible evidence of damage to the left wing. • The debris was observed to tumble, with an estimated rotation rate on the order of
18 cycles/second. • Impact was on the underside of the left wing leading edge, in the area of RCC
panels 5-9, with most likely impact in the area of panels 6-8. • Calculations of the debris velocity at impact ranged from 625 ft/sec to 840 ft/sec
depending on the various methods and assumptions used, with the most probable velocity estimated to be approximately 700 ft/sec.
• Within the post-impact debris cloud were distinct but unidentifiable objects. The sizes of two of the objects were measurable, estimated to be 12”x11” and 7”x7”, respectively.
From analysis of the imagery acquired on-orbit, there was no visual indication of damage or anomalies to the Orbiter during the orbit phase of the mission. Another primary task for the Image Analysis Team was analysis of the re-entry imagery of the Orbiter to identify, timeline, and characterize the observed anomalies and debris-shedding events during entry. Most of the imagery was obtained from the public using consumer-grade equipment. From analysis of the entry imagery, the following conclusions were reached:
• 24 anomalous events were observed in the imagery along the Orbiter’s re-entry track between California and New Mexico. Events over Texas are still being characterized.
• The anomalies noted included debris-shedding events, large flashes or flares, and non-uniformities in the Orbiter’s plasma trail.
• Debris motions relative to the Orbiter were measured from which debris ballistic coefficients were determined.
This information is being distributed to aid in the investigation of the Columbia mishap and should only be distributed to personnel who are actively involved in this investigation.
7
NSTS-37384STS-107 Image Analysis Team Final Report.pdf
C0-000045
CAB066-0959
COLUMBIAACCIDENT INVESTIGATION BOARD
REPORT VOLUME III OCTOBER 2003 35
• Mass estimates of the shedding debris were determined from the imagery. The estimates ranged from ~ 0.2-8 lbs for small debris events, to 20-500 lbs for the largest debris events, with the most probable masses for those large events in the 100-200 lb range.
This information is being distributed to aid in the investigation of the Columbia mishap and should only be distributed to personnel who are actively involved in this investigation.
8
NSTS-37384STS-107 Image Analysis Team Final Report.pdf
C0-000045
CAB066-0960
COLUMBIAACCIDENT INVESTIGATION BOARD
REPORT VOLUME III OCTOBER 200336
2.0 Introduction In response to the Shuttle Columbia accident, the Image Analysis Team was activated in accordance with JSC-14273, “Space Shuttle Program Contingency Action Plan for Johnson Space Center”. The Team was responsible for assessing and analyzing all available visual imagery from ascent, orbit, and entry to provide insight into the condition of the Orbiter and the events leading to its breakup. Of particular interest during ascent was analysis of the debris impact event at approximately 82 seconds Mission Elapsed Time (MET), and during entry, analysis of the debris-shedding events emanating from the Orbiter. The Team reported its findings directly to the Orbiter Vehicle Engineering Working Group (OVEWG). The primary sources of imagery for the ascent analysis included launch film and video from tracking cameras located around the launch complex. On-orbit imagery was either downlinked during the mission or recovered from the Orbiter debris on the ground. Entry analysis was accomplished primarily with video and still photos submitted to NASA by the public after the accident. The image processing and analysis tasks for this investigation were numerous and diverse, many involving low quality imagery. In some cases the analyses required problem solving for which there were no established methods, such as characterizing the entry debris events from consumer-grade videos. To address these challenges, a wide variety of resources and expertise was called upon from various centers within NASA, as well as from industry and organizations outside of NASA. A complete listing of Image Analysis Team contributing organizations and personnel is provided in Section 8.
This information is being distributed to aid in the investigation of the Columbia mishap and should only be distributed to personnel who are actively involved in this investigation.
9
NSTS-37384STS-107 Image Analysis Team Final Report.pdf
C0-000045
CAB066-0961
COLUMBIAACCIDENT INVESTIGATION BOARD
REPORT VOLUME III OCTOBER 2003 37
3.0 Purpose & Scope This report documents the processes and findings of the Image Analysis Team based upon analysis of STS-107 imagery from launch, orbit, and entry. The main body of the report presents a summary of the analysis techniques and primary results. These summarized results represent the consensus of the Image Analysis Team, and are in some cases compilations of independent analyses by multiple contributors within the Team. Additional details of all the individual analyses are attached as appendices and are referenced in the report. The primary findings from analysis of STS-107 launch imagery are summarized in Section 4. The launch analysis centered on characterizing the impact parameters for the debris strike event at approximately 82 seconds MET. Other launch-related analyses included in this report were in support of requests from the Columbia Accident Investigation Board (CAIB). Analyses from imagery acquired from orbit are summarized in Section 5, and the entry analyses are found in Section 6. Section 7 provides lessons learned and recommendations for enhancements of NASA’s capabilities for imagery acquisition and imagery analysis to support human space flight missions. Finally, Chapter 8 lists the contributors to the Image Analysis Team.
This information is being distributed to aid in the investigation of the Columbia mishap and should only be distributed to personnel who are actively involved in this investigation.
10
NSTS-37384STS-107 Image Analysis Team Final Report.pdf
C0-000045
CAB066-0962
COLUMBIAACCIDENT INVESTIGATION BOARD
REPORT VOLUME III OCTOBER 200338
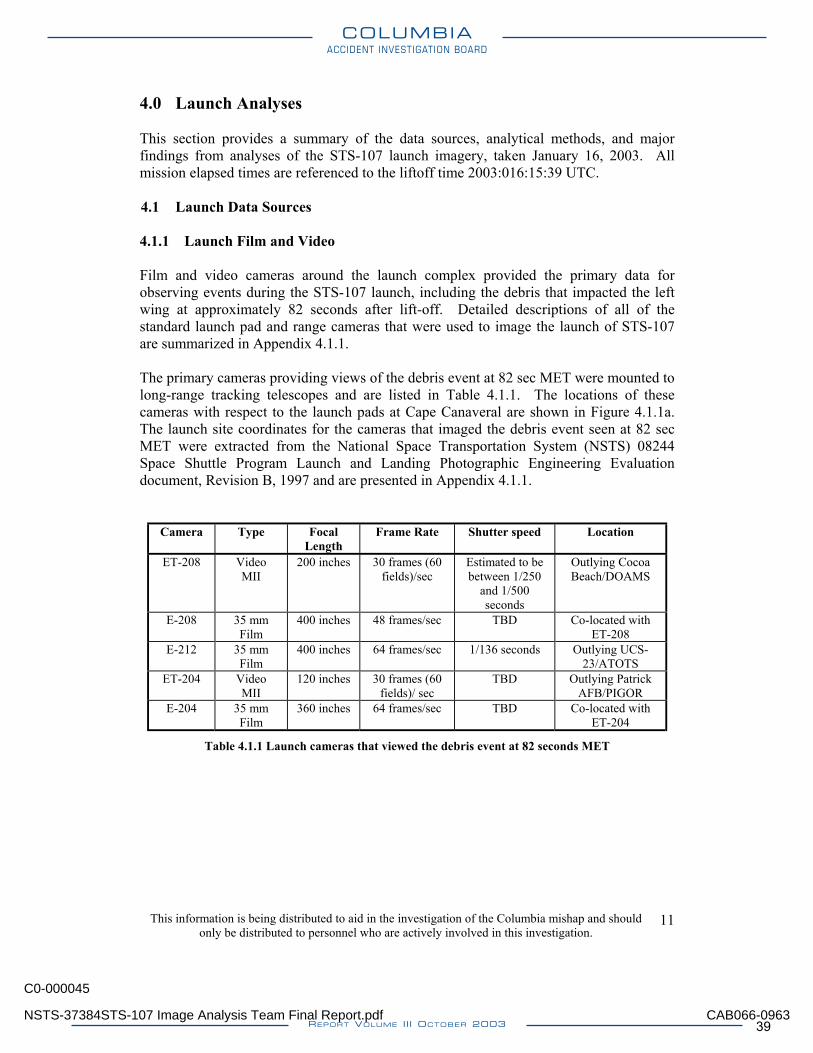
4.0 Launch Analyses This section provides a summary of the data sources, analytical methods, and major findings from analyses of the STS-107 launch imagery, taken January 16, 2003. All mission elapsed times are referenced to the liftoff time 2003:016:15:39 UTC. 4.1 Launch Data Sources 4.1.1 Launch Film and Video Film and video cameras around the launch complex provided the primary data for observing events during the STS-107 launch, including the debris that impacted the left wing at approximately 82 seconds after lift-off. Detailed descriptions of all of the standard launch pad and range cameras that were used to image the launch of STS-107 are summarized in Appendix 4.1.1. The primary cameras providing views of the debris event at 82 sec MET were mounted to long-range tracking telescopes and are listed in Table 4.1.1. The locations of these cameras with respect to the launch pads at Cape Canaveral are shown in Figure 4.1.1a. The launch site coordinates for the cameras that imaged the debris event seen at 82 sec MET were extracted from the National Space Transportation System (NSTS) 08244 Space Shuttle Program Launch and Landing Photographic Engineering Evaluation document, Revision B, 1997 and are presented in Appendix 4.1.1.
Camera Type Focal Length
Frame Rate Shutter speed Location
ET-208 Video MII
200 inches 30 frames (60 fields)/sec
Estimated to be between 1/250
and 1/500 seconds
Outlying Cocoa Beach/DOAMS
E-208 35 mm Film
400 inches 48 frames/sec TBD Co-located with ET-208
E-212 35 mm Film
400 inches 64 frames/sec 1/136 seconds Outlying UCS-23/ATOTS
ET-204 Video MII
120 inches 30 frames (60 fields)/ sec
TBD Outlying Patrick AFB/PIGOR
E-204 35 mm Film
360 inches 64 frames/sec TBD Co-located with ET-204
Table 4.1.1 Launch cameras that viewed the debris event at 82 seconds MET
This information is being distributed to aid in the investigation of the Columbia mishap and should only be distributed to personnel who are actively involved in this investigation.
11
NSTS-37384STS-107 Image Analysis Team Final Report.pdf
C0-000045
CAB066-0963
COLUMBIAACCIDENT INVESTIGATION BOARD
REPORT VOLUME III OCTOBER 2003 39
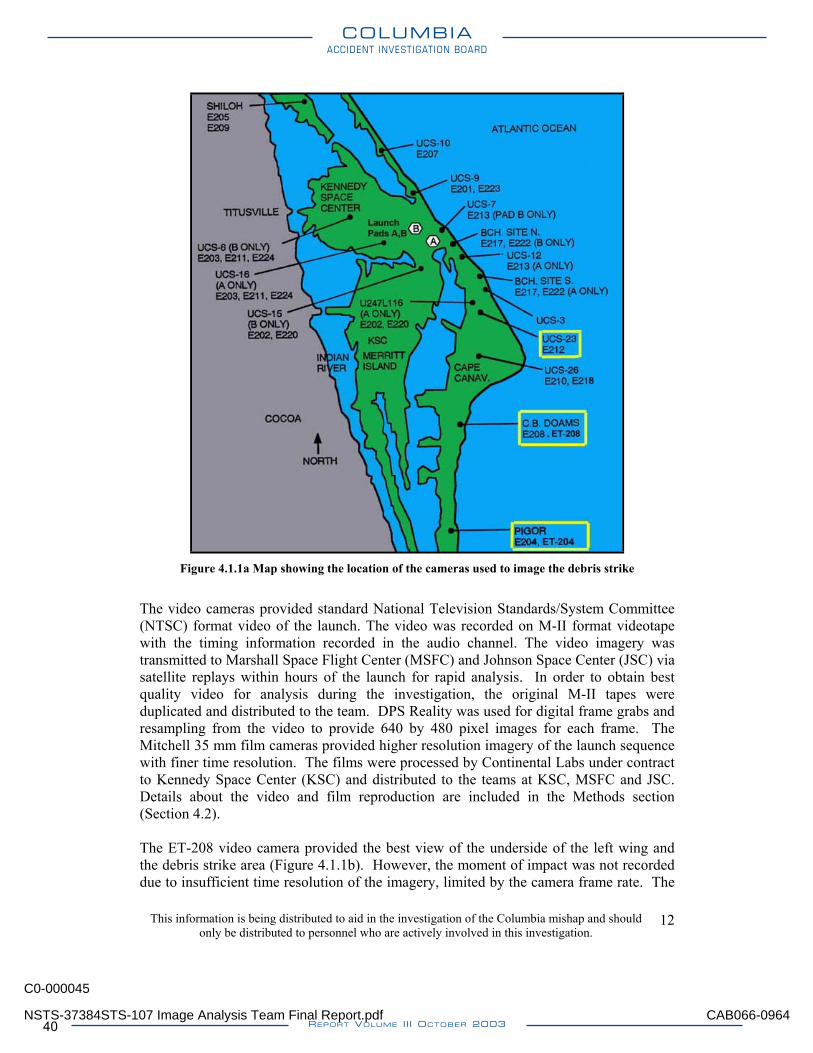
Figure 4.1.1a Map showing the location of the cameras used to image the debris strike
The video cameras provided standard National Television Standards/System Committee (NTSC) format video of the launch. The video was recorded on M-II format videotape with the timing information recorded in the audio channel. The video imagery was transmitted to Marshall Space Flight Center (MSFC) and Johnson Space Center (JSC) via satellite replays within hours of the launch for rapid analysis. In order to obtain best quality video for analysis during the investigation, the original M-II tapes were duplicated and distributed to the team. DPS Reality was used for digital frame grabs and resampling from the video to provide 640 by 480 pixel images for each frame. The Mitchell 35 mm film cameras provided higher resolution imagery of the launch sequence with finer time resolution. The films were processed by Continental Labs under contract to Kennedy Space Center (KSC) and distributed to the teams at KSC, MSFC and JSC. Details about the video and film reproduction are included in the Methods section (Section 4.2). The ET-208 video camera provided the best view of the underside of the left wing and the debris strike area (Figure 4.1.1b). However, the moment of impact was not recorded due to insufficient time resolution of the imagery, limited by the camera frame rate. The
This information is being distributed to aid in the investigation of the Columbia mishap and should only be distributed to personnel who are actively involved in this investigation.
12
NSTS-37384STS-107 Image Analysis Team Final Report.pdf
C0-000045
CAB066-0964
COLUMBIAACCIDENT INVESTIGATION BOARD
REPORT VOLUME III OCTOBER 200340
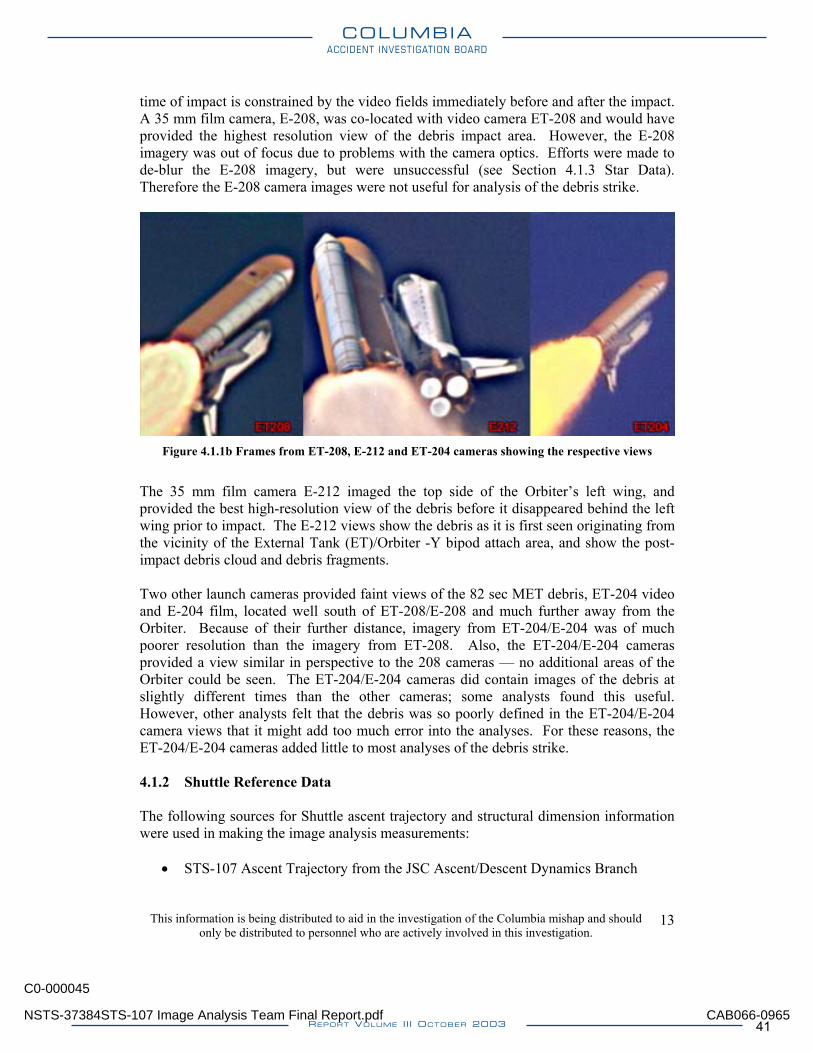
time of impact is constrained by the video fields immediately before and after the impact. A 35 mm film camera, E-208, was co-located with video camera ET-208 and would have provided the highest resolution view of the debris impact area. However, the E-208 imagery was out of focus due to problems with the camera optics. Efforts were made to de-blur the E-208 imagery, but were unsuccessful (see Section 4.1.3 Star Data). Therefore the E-208 camera images were not useful for analysis of the debris strike.
Figure 4.1.1b Frames from ET-208, E-212 and ET-204 cameras showing the respective views
The 35 mm film camera E-212 imaged the top side of the Orbiter’s left wing, and provided the best high-resolution view of the debris before it disappeared behind the left wing prior to impact. The E-212 views show the debris as it is first seen originating from the vicinity of the External Tank (ET)/Orbiter -Y bipod attach area, and show the post-impact debris cloud and debris fragments. Two other launch cameras provided faint views of the 82 sec MET debris, ET-204 video and E-204 film, located well south of ET-208/E-208 and much further away from the Orbiter. Because of their further distance, imagery from ET-204/E-204 was of much poorer resolution than the imagery from ET-208. Also, the ET-204/E-204 cameras provided a view similar in perspective to the 208 cameras — no additional areas of the Orbiter could be seen. The ET-204/E-204 cameras did contain images of the debris at slightly different times than the other cameras; some analysts found this useful. However, other analysts felt that the debris was so poorly defined in the ET-204/E-204 camera views that it might add too much error into the analyses. For these reasons, the ET-204/E-204 cameras added little to most analyses of the debris strike. 4.1.2 Shuttle Reference Data The following sources for Shuttle ascent trajectory and structural dimension information were used in making the image analysis measurements:
• STS-107 Ascent Trajectory from the JSC Ascent/Descent Dynamics Branch
This information is being distributed to aid in the investigation of the Columbia mishap and should only be distributed to personnel who are actively involved in this investigation.
13
NSTS-37384STS-107 Image Analysis Team Final Report.pdf
C0-000045
CAB066-0965
COLUMBIAACCIDENT INVESTIGATION BOARD
REPORT VOLUME III OCTOBER 2003 41
• Computer Aided Design (CAD) Models compatible with the Shuttle Master Dimensions Book MD-V70, supplied by the JSC Aeroscience and Flight Mechanics Division/EG.
• On-line Shuttle Reference Manual at http://spaceflight.nasa.gov/shuttle/reference/shutref/index.html.
4.1.3 Star Data In an effort to de-blur the E-208 film and enhance the E-212 film, imagery of several stars was acquired with the respective cameras. The imagery was collected at KSC using the launch configuration of the cameras, and the film and video were processed according to launch imagery protocols. The purpose was to use the star images to determine the point spread function of the cameras for de-blurring algorithms to be applied to the out-of-focus E-208 imagery, and also to enhance the E-212 views. The primary result was a determination that the E-208 camera optics were significantly compromised. Details of the star imagery and recommendations resulting from these data are discussed in Appendix 4.1.3. 4.2 Launch Imagery Analyses: Methods The methods and procedures for analyzing the launch imagery, including the reproduction of the imagery to obtain the highest quality for analysis, protocols for documenting anomalies during the imagery screening, and specific methods for digital enhancements of the imagery are summarized in this section. Initial analyses of the launch imagery, including a description of the debris that impacted the left wing, were performed immediately after launch and reported in the STS-107 Launch +4 Report (See Section 4.3.1). These initial results provided the basis for subsequent analyses of the debris event after the Columbia accident. Additional image analysis methods evolved throughout the investigation. New findings and hypotheses drove requirements for increasingly sophisticated image enhancements. This section describes key elements of the image enhancement and analysis approaches. 4.2.1 Obtain Best Quality Imagery (Film and Video) The investigation tasks required that the team use the highest quality imagery, thereby allowing detection and enhancement of details defined by the limits of resolution of the imagery. Film Reproduction During the STS-107 mission, standard procedures for film distribution were followed: after the launch, engineering launch film prints were provided to other centers by KSC for analysis. These film duplicates were second-generation positive copies made directly from the original negative films (Kodak 250 daylight film). However, these engineering copies were used extensively during the mission for screening and analysis and had been distorted by heat from projectors and scratched by extensive handling. Additional third
This information is being distributed to aid in the investigation of the Columbia mishap and should only be distributed to personnel who are actively involved in this investigation.
14
NSTS-37384STS-107 Image Analysis Team Final Report.pdf
C0-000045
CAB066-0966
COLUMBIAACCIDENT INVESTIGATION BOARD
REPORT VOLUME III OCTOBER 200342
generation copies of key films such as E-208 and E-212 were also used for early analyses. Important segments of the films were scanned at the JSC Digital Imaging Lab using a Kodak scanner to produce digital imagery for analysis. The image analysis team had concerns about the potential loss of detail on the third generation imagery. The most detailed analysis of the debris strike to the left wing required the highest quality imagery to be copied directly from the original camera E-208 and E-212 launch films. To accomplish this, the original E-208 and E-212 film negatives were hand-carried to Kodak facilities in Rochester, New York for scanning in a clean room environment. Kodak scanned the E-208 and E-212 frames using two different digital scanning systems (Spirit Data Cine 2K film scanner providing 10 bit, 2048 x 1556 pixel images, and Genesis 4K scanner providing 12 bit, 4096 x 3112 pixel images). A total of three scans at a range of exposure stops (-1, normal, and +1) were performed. The Genesis digital scans (files) were printed directly back to film providing positive engineering prints for the different analysis groups. The digital scans were made available to the investigators via an ftp computer site. This scanning process eliminated the slight data loss inherent in making contact prints from the original film with minimum degradation to the original film. Video Reproduction During the mission, the original ET-208 video was recorded on an M-II recorder. KSC screened the original ET-208 video one day after launch to verify that there was no loss of quality on the copies of the tape and transmitted the video via satellite to JSC and MSFC. The satellite-routed ET-208 video was used by JSC and MSFC during the remainder of the STS-107 flight for the analysis of the debris strike to the Orbiter left wing. Inherent in the satellite transmission was a slight reduction in the quality and resolution of the video available at JSC and MSFC for analysis. During the investigation, KSC copied the M-II tape to a state-of-the-art digital Betacam (Digi-beta) format tape in order to capture the best quality ET-208 camera video of the debris strike to the left wing. These first generation Digi-beta clones from the original Digi-beta tape and DVCAM format copies were provided to the various analysis groups. 4.2.2 Launch Video and Film Screening Video and film screening is the initial step for all subsequent image analyses. For each mission all launch imagery is screened in parallel by the KSC, MSFC, JSC and System Integration image analysis groups. Each of the image analysis groups thoroughly review the launch videos and films within the first few days of launch. All anomalies are visually described and documented in a mission-specific screening database, and significant events are illustrated, reported to other teams and the Mission Evaluation Room (MER), and posted to the Image Science and Analysis web page (references/shuttleweb/mission_support/missions.html). Following the STS-107 accident, the image analysis groups re-screened the STS-107 launch films and video using their traditional equipment and procedures in order to document any additional events that could possibly provide information of value to the investigation. KSC was the lead center for the re-screening of the launch imagery. KSC also re-screened the STS-107
This information is being distributed to aid in the investigation of the Columbia mishap and should only be distributed to personnel who are actively involved in this investigation.
15
NSTS-37384STS-107 Image Analysis Team Final Report.pdf
C0-000045
CAB066-0967
COLUMBIAACCIDENT INVESTIGATION BOARD
REPORT VOLUME III OCTOBER 2003 43
pre-launch imagery data, including all Operation Television and Infrared videos from ET loading (T-6 hours through launch.). Any additional observations were added to the launch film screening data sheets; however, no significant new observations were reported by any of the analysis groups. 4.2.3 Image Enhancement and Analysis Techniques Enhancement A number of different techniques were employed to bring out additional detail in both the film and the video imagery. Most of the analyses of the launch imagery involved digital enhancements, including intensity contrast stretching and sharpening. For specific tasks, more sophisticated image enhancements were applied to the launch imagery. Image enhancement and analysis techniques included:
• Spatial filtering aided in removing noise and sharpening the detail in the images (examples include median filters, Gaussian blur filters, unsharp mask).
• Frequency domain methods were used to design deconvolution filters for reducing focus and motion blur, thus reducing image noise, and sharpening the image.
• Standard contrast stretching was used to make low contrast areas more readily visible for analysis.
• Image stabilization and registration methods were used to remove camera motion when analyzing the motion of debris in digital movies or for performing frame averages.
• Frame averaging from stabilized image sequences was used to reduce noise and enhance subtle details that could not be seen in a single image.
• Color analysis of the debris in the Red, Green, and Blue (RGB) bands, including band ratioing.
• Analysis of the data in color spaces other than RGB was also employed. Images were converted to the L*a*b color mode, which separates luminosity information in the ‘L’ channel from color information in the ‘a’ and ‘b’ channels, so that sharpening of the luminosity does not enhance noise patterns in the color channels.
• Intensity profiles across the debris were used to help determine debris sizes and distinguish the true extent of the debris from focus and atmospheric blurring of the edges.
• Image differencing from consecutive frames/fields as well as differencing consecutive frames/fields from an average image were used to help determine debris location and size.
Measurements of the debris sizes, impact velocity, impact location, and impact angle were all made from the launch imagery. To obtain the best quantitative results from the imagery, the Image Analysis Team focused on image scaling, edge detection, centroid measurement, motion blur correction, and the use of CAD models, as addressed below.
This information is being distributed to aid in the investigation of the Columbia mishap and should only be distributed to personnel who are actively involved in this investigation.
16
NSTS-37384STS-107 Image Analysis Team Final Report.pdf
C0-000045
CAB066-0968
COLUMBIAACCIDENT INVESTIGATION BOARD
REPORT VOLUME III OCTOBER 200344
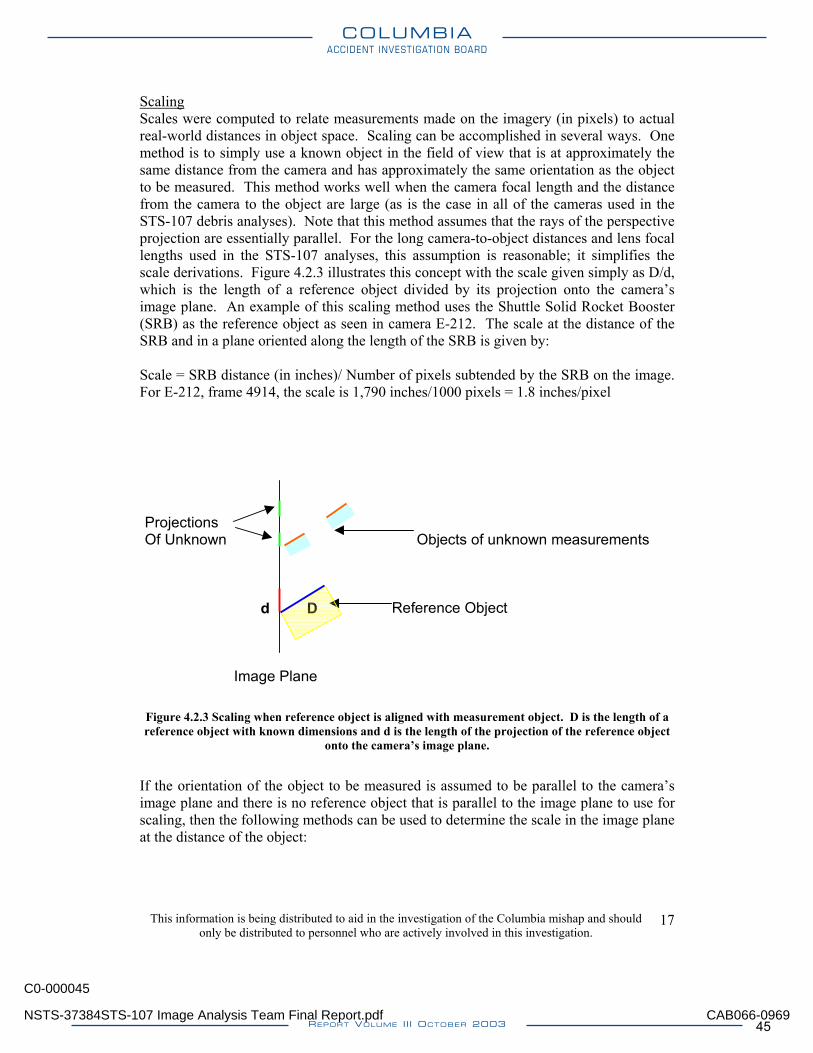
Scaling Scales were computed to relate measurements made on the imagery (in pixels) to actual real-world distances in object space. Scaling can be accomplished in several ways. One method is to simply use a known object in the field of view that is at approximately the same distance from the camera and has approximately the same orientation as the object to be measured. This method works well when the camera focal length and the distance from the camera to the object are large (as is the case in all of the cameras used in the STS-107 debris analyses). Note that this method assumes that the rays of the perspective projection are essentially parallel. For the long camera-to-object distances and lens focal lengths used in the STS-107 analyses, this assumption is reasonable; it simplifies the scale derivations. Figure 4.2.3 illustrates this concept with the scale given simply as D/d, which is the length of a reference object divided by its projection onto the camera’s image plane. An example of this scaling method uses the Shuttle Solid Rocket Booster (SRB) as the reference object as seen in camera E-212. The scale at the distance of the SRB and in a plane oriented along the length of the SRB is given by: Scale = SRB distance (in inches)/ Number of pixels subtended by the SRB on the image. For E-212, frame 4914, the scale is 1,790 inches/1000 pixels = 1.8 inches/pixel
Projections Of Unknown Objects of unknown measurements d D Reference Object Image Plane
Figure 4.2.3 Scaling when reference object is aligned with measurement object. D is the length of a reference object with known dimensions and d is the length of the projection of the reference object
onto the camera’s image plane.
If the orientation of the object to be measured is assumed to be parallel to the camera’s image plane and there is no reference object that is parallel to the image plane to use for scaling, then the following methods can be used to determine the scale in the image plane at the distance of the object:
This information is being distributed to aid in the investigation of the Columbia mishap and should only be distributed to personnel who are actively involved in this investigation.
17
NSTS-37384STS-107 Image Analysis Team Final Report.pdf
C0-000045
CAB066-0969
COLUMBIAACCIDENT INVESTIGATION BOARD
REPORT VOLUME III OCTOBER 2003 45
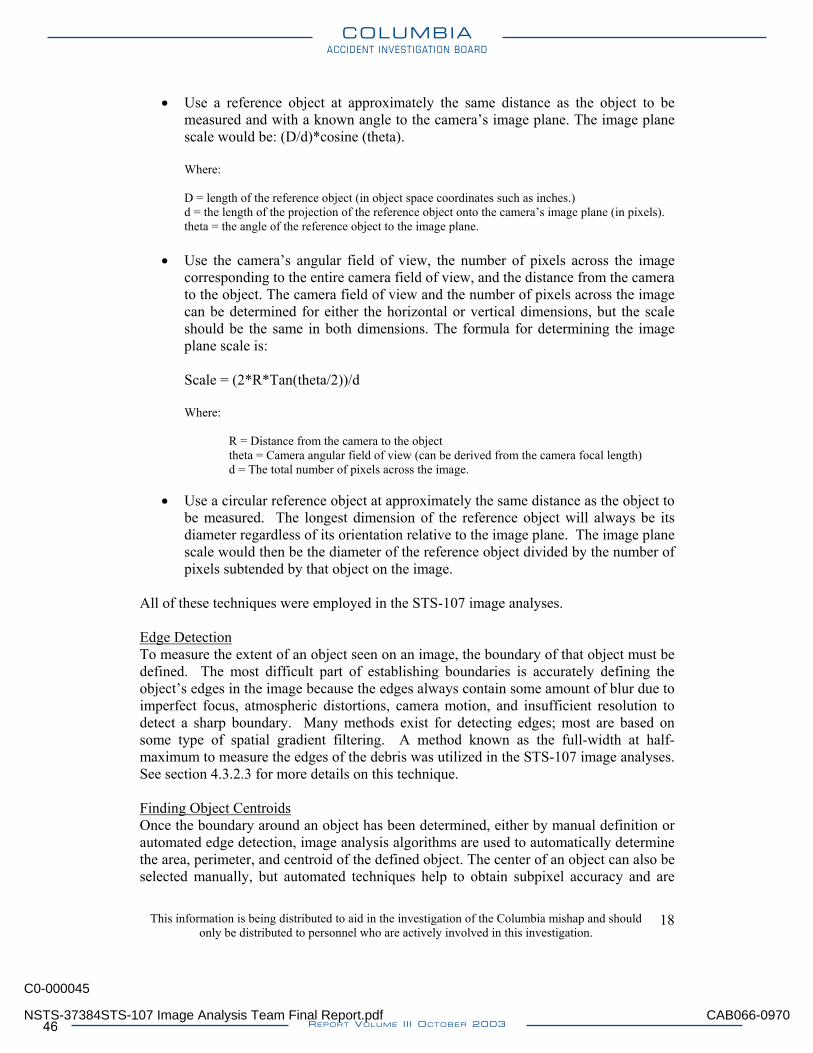
• Use a reference object at approximately the same distance as the object to be measured and with a known angle to the camera’s image plane. The image plane scale would be: (D/d)*cosine (theta). Where: D = length of the reference object (in object space coordinates such as inches.) d = the length of the projection of the reference object onto the camera’s image plane (in pixels). theta = the angle of the reference object to the image plane.
• Use the camera’s angular field of view, the number of pixels across the image corresponding to the entire camera field of view, and the distance from the camera to the object. The camera field of view and the number of pixels across the image can be determined for either the horizontal or vertical dimensions, but the scale should be the same in both dimensions. The formula for determining the image plane scale is:
Scale = (2*R*Tan(theta/2))/d Where: R = Distance from the camera to the object theta = Camera angular field of view (can be derived from the camera focal length) d = The total number of pixels across the image.
• Use a circular reference object at approximately the same distance as the object to be measured. The longest dimension of the reference object will always be its diameter regardless of its orientation relative to the image plane. The image plane scale would then be the diameter of the reference object divided by the number of pixels subtended by that object on the image.
All of these techniques were employed in the STS-107 image analyses. Edge Detection To measure the extent of an object seen on an image, the boundary of that object must be defined. The most difficult part of establishing boundaries is accurately defining the object’s edges in the image because the edges always contain some amount of blur due to imperfect focus, atmospheric distortions, camera motion, and insufficient resolution to detect a sharp boundary. Many methods exist for detecting edges; most are based on some type of spatial gradient filtering. A method known as the full-width at half-maximum to measure the edges of the debris was utilized in the STS-107 image analyses. See section 4.3.2.3 for more details on this technique. Finding Object Centroids Once the boundary around an object has been determined, either by manual definition or automated edge detection, image analysis algorithms are used to automatically determine the area, perimeter, and centroid of the defined object. The center of an object can also be selected manually, but automated techniques help to obtain subpixel accuracy and are
This information is being distributed to aid in the investigation of the Columbia mishap and should only be distributed to personnel who are actively involved in this investigation.
18
NSTS-37384STS-107 Image Analysis Team Final Report.pdf
C0-000045
CAB066-0970
COLUMBIAACCIDENT INVESTIGATION BOARD
REPORT VOLUME III OCTOBER 200346
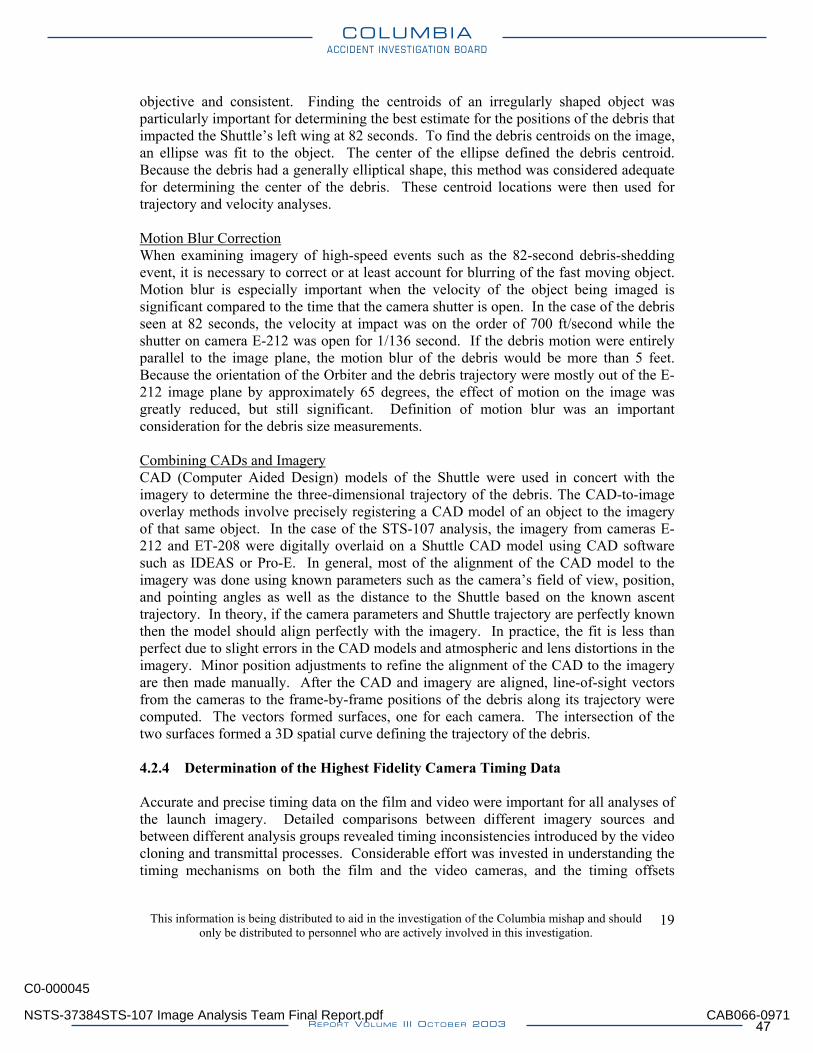
objective and consistent. Finding the centroids of an irregularly shaped object was particularly important for determining the best estimate for the positions of the debris that impacted the Shuttle’s left wing at 82 seconds. To find the debris centroids on the image, an ellipse was fit to the object. The center of the ellipse defined the debris centroid. Because the debris had a generally elliptical shape, this method was considered adequate for determining the center of the debris. These centroid locations were then used for trajectory and velocity analyses. Motion Blur Correction When examining imagery of high-speed events such as the 82-second debris-shedding event, it is necessary to correct or at least account for blurring of the fast moving object. Motion blur is especially important when the velocity of the object being imaged is significant compared to the time that the camera shutter is open. In the case of the debris seen at 82 seconds, the velocity at impact was on the order of 700 ft/second while the shutter on camera E-212 was open for 1/136 second. If the debris motion were entirely parallel to the image plane, the motion blur of the debris would be more than 5 feet. Because the orientation of the Orbiter and the debris trajectory were mostly out of the E-212 image plane by approximately 65 degrees, the effect of motion on the image was greatly reduced, but still significant. Definition of motion blur was an important consideration for the debris size measurements. Combining CADs and Imagery CAD (Computer Aided Design) models of the Shuttle were used in concert with the imagery to determine the three-dimensional trajectory of the debris. The CAD-to-image overlay methods involve precisely registering a CAD model of an object to the imagery of that same object. In the case of the STS-107 analysis, the imagery from cameras E-212 and ET-208 were digitally overlaid on a Shuttle CAD model using CAD software such as IDEAS or Pro-E. In general, most of the alignment of the CAD model to the imagery was done using known parameters such as the camera’s field of view, position, and pointing angles as well as the distance to the Shuttle based on the known ascent trajectory. In theory, if the camera parameters and Shuttle trajectory are perfectly known then the model should align perfectly with the imagery. In practice, the fit is less than perfect due to slight errors in the CAD models and atmospheric and lens distortions in the imagery. Minor position adjustments to refine the alignment of the CAD to the imagery are then made manually. After the CAD and imagery are aligned, line-of-sight vectors from the cameras to the frame-by-frame positions of the debris along its trajectory were computed. The vectors formed surfaces, one for each camera. The intersection of the two surfaces formed a 3D spatial curve defining the trajectory of the debris. 4.2.4 Determination of the Highest Fidelity Camera Timing Data Accurate and precise timing data on the film and video were important for all analyses of the launch imagery. Detailed comparisons between different imagery sources and between different analysis groups revealed timing inconsistencies introduced by the video cloning and transmittal processes. Considerable effort was invested in understanding the timing mechanisms on both the film and the video cameras, and the timing offsets
This information is being distributed to aid in the investigation of the Columbia mishap and should only be distributed to personnel who are actively involved in this investigation.
19
NSTS-37384STS-107 Image Analysis Team Final Report.pdf
C0-000045
CAB066-0971
COLUMBIAACCIDENT INVESTIGATION BOARD
REPORT VOLUME III OCTOBER 2003 47
introduced by reproduction of the launch video due to the timing data recorded into the audio channel. Data about the respective camera timing parameters are provided in Appendix 4.2.4. 4.3 Launch Imagery Analyses: Primary Results This section contains an overview of the analyses performed on the launch imagery. The analyses focused on fully characterizing the debris that impacted the left wing at approximately 82 seconds MET. Early work performed immediately after launch and throughout the STS-107 mission is summarized in Section 4.3.1, and the analyses performed after the accident are presented in Section 4.3.2. 4.3.1 Analyses Performed during the STS-107 Mission The KSC, MSFC, JSC and Systems Integration imagery screening groups submitted initial launch video screening reports the day after the launch of STS-107 describing the debris impact to the Orbiter left wing at approximately 81.86 seconds MET. Due to a problem with receiving and transmitting the second video replays, the review of the long range tracking camera videos was delayed until the day after launch. In the next few days, the film imagery was reviewed and each group provided additional screening reports based on the findings from the launch films. Appendix 4.3.1 contains the Intercenter Launch +4 day Screening Report. 4.3.1.1 Initial Findings The key findings reported in the Launch +4 day Screening Report include a description of the debris anomaly. The source was determined to be from an area near the ET/Orbiter -Y bipod. The report documents four distinct objects — the initial analyses could not discern whether the objects originated as separate pieces or were derived from a single piece that breaks apart. The physical description and motion of all four pieces are qualitatively described, including the impact under the leading edge of the left wing by the largest piece of debris. The report also references comparison views of the impact area immediately before and after the event for indications of damage to the wing. Because of the poor resolution of the imagery, the initial analyses could reach no conclusions about the extent of any damage that may have occurred from the debris strike event. The early pre-accident screening reports stated that evidence of a smaller, second debris impact to the Orbiter left wing also occurred. During the post-accident investigation, subsequent detailed analysis using “best quality” enhanced imagery showed that only one debris object definitely struck the wing and that there was no visual evidence of a second impact to the wing. What appeared to be a faint cloud indicating a second debris strike on the pre-accident imagery was later determined to be several smaller pieces of debris that had passed under the wing with no apparent vehicle contact.
This information is being distributed to aid in the investigation of the Columbia mishap and should only be distributed to personnel who are actively involved in this investigation.
20
NSTS-37384STS-107 Image Analysis Team Final Report.pdf
C0-000045
CAB066-0972
COLUMBIAACCIDENT INVESTIGATION BOARD
REPORT VOLUME III OCTOBER 200348
4.3.1.2 Reporting
• The Intercenter Launch +4 Day Screening Report was not received by the Shuttle Program management and engineers until approximately launch + 8 days due to an unknown computer error at KSC.
• The JSC video and film screening reports documenting the debris strike were delivered to the Shuttle MER (Mission Evaluation Room) on schedule prior to the delivery of the Launch +4 day Intercenter report.
• The daily video and film screening reports from JSC, KSC, and MSFC were also sent to a wide distribution that included key personnel at all levels of the Shuttle program management and engineering at each of the three NASA centers.
• For Shuttle Program reference, the preliminary information and imagery of the STS-107 debris impact to the left wing were placed on the web sites at the three NASA centers prior to the re-entry of Columbia. The web-based products included:
o Preliminary measurement of the debris size on STS-107. o ‘Before’ and ‘After’ views of the debris impact showing no visible
damage to the vehicle. o Debris trajectory plot of the debris seen on ET-208 and E-212 imagery o CAD images overlaid to ET-208 and E-212. o Views of the STS-112 and STS-50 damage caused by missing Thermal
Protection System (TPS) from the ET/Orbiter -Y bipod ramp and measurement of debris size seen on STS-112.
4.3.1.3 Other Action Taken during Mission
• JSC and KSC imagery analysts supported a Shuttle engineering teleconference on “Preliminary Debris Transport Assessment of Debris Impacting Orbiter Lower Surface in the STS-107 Mission” prior to landing day (1/22/03).
• The Intercenter Photo Working Group (IPWG) chairman made a request for additional on-orbit photographic coverage of the Orbiter prior to landing (this was not approved).
4.3.2 Post-Accident Launch Analyses This section summarizes the major findings from detailed analyses of the launch imagery after the Columbia accident occurred on February 1, 2003. It includes a description of the imagery that documents the debris that struck the left wing, and quantitative characterization of the debris using the imagery as the primary data source. Details of the analyses are presented in Appendices that are referenced in the report. 4.3.2.1 Debris Event Timeline The debris that struck the Orbiter during ascent was first seen near the ET/Orbiter -Y bipod attach area at approximately 81.7 seconds MET, and it impacted the left wing at approximately 81.86 seconds MET (016:15:40:21.86 Universal Time Code or UTC).
This information is being distributed to aid in the investigation of the Columbia mishap and should only be distributed to personnel who are actively involved in this investigation.
21
NSTS-37384STS-107 Image Analysis Team Final Report.pdf
C0-000045
CAB066-0973
COLUMBIAACCIDENT INVESTIGATION BOARD
REPORT VOLUME III OCTOBER 2003 49
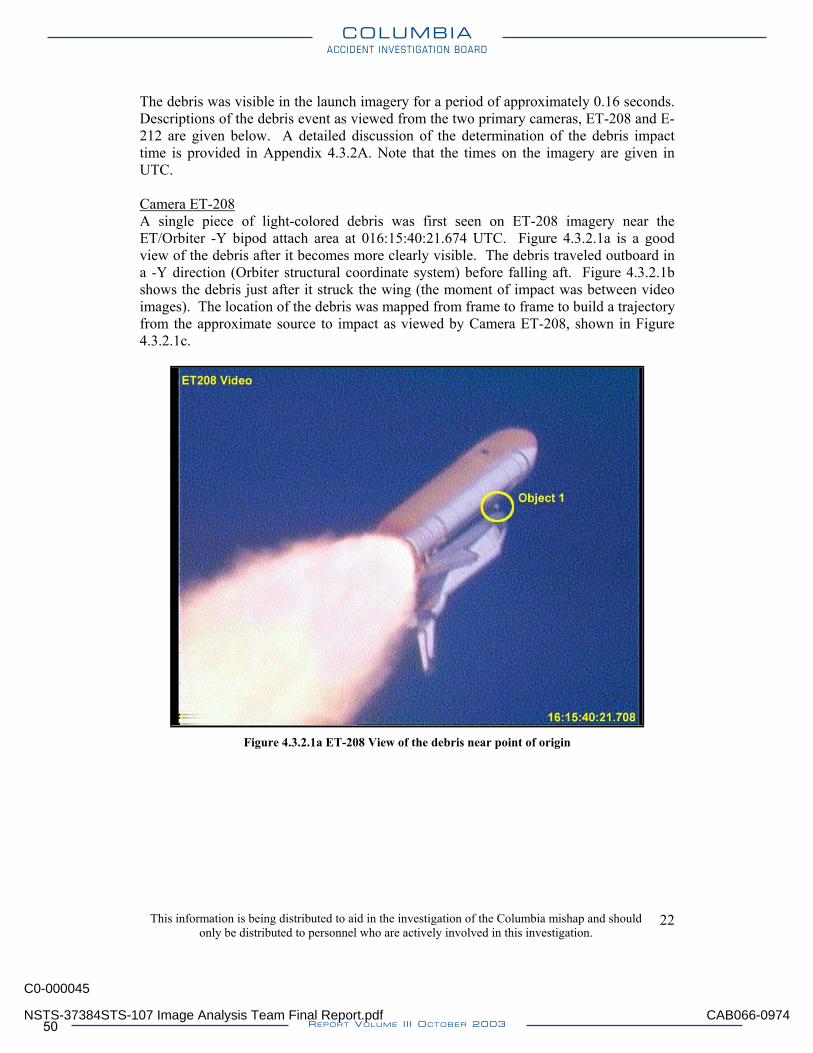
The debris was visible in the launch imagery for a period of approximately 0.16 seconds. Descriptions of the debris event as viewed from the two primary cameras, ET-208 and E-212 are given below. A detailed discussion of the determination of the debris impact time is provided in Appendix 4.3.2A. Note that the times on the imagery are given in UTC. Camera ET-208 A single piece of light-colored debris was first seen on ET-208 imagery near the ET/Orbiter -Y bipod attach area at 016:15:40:21.674 UTC. Figure 4.3.2.1a is a good view of the debris after it becomes more clearly visible. The debris traveled outboard in a -Y direction (Orbiter structural coordinate system) before falling aft. Figure 4.3.2.1b shows the debris just after it struck the wing (the moment of impact was between video images). The location of the debris was mapped from frame to frame to build a trajectory from the approximate source to impact as viewed by Camera ET-208, shown in Figure 4.3.2.1c.
Figure 4.3.2.1a ET-208 View of the debris near point of origin
This information is being distributed to aid in the investigation of the Columbia mishap and should only be distributed to personnel who are actively involved in this investigation.
22
NSTS-37384STS-107 Image Analysis Team Final Report.pdf
C0-000045
CAB066-0974
COLUMBIAACCIDENT INVESTIGATION BOARD
REPORT VOLUME III OCTOBER 200350
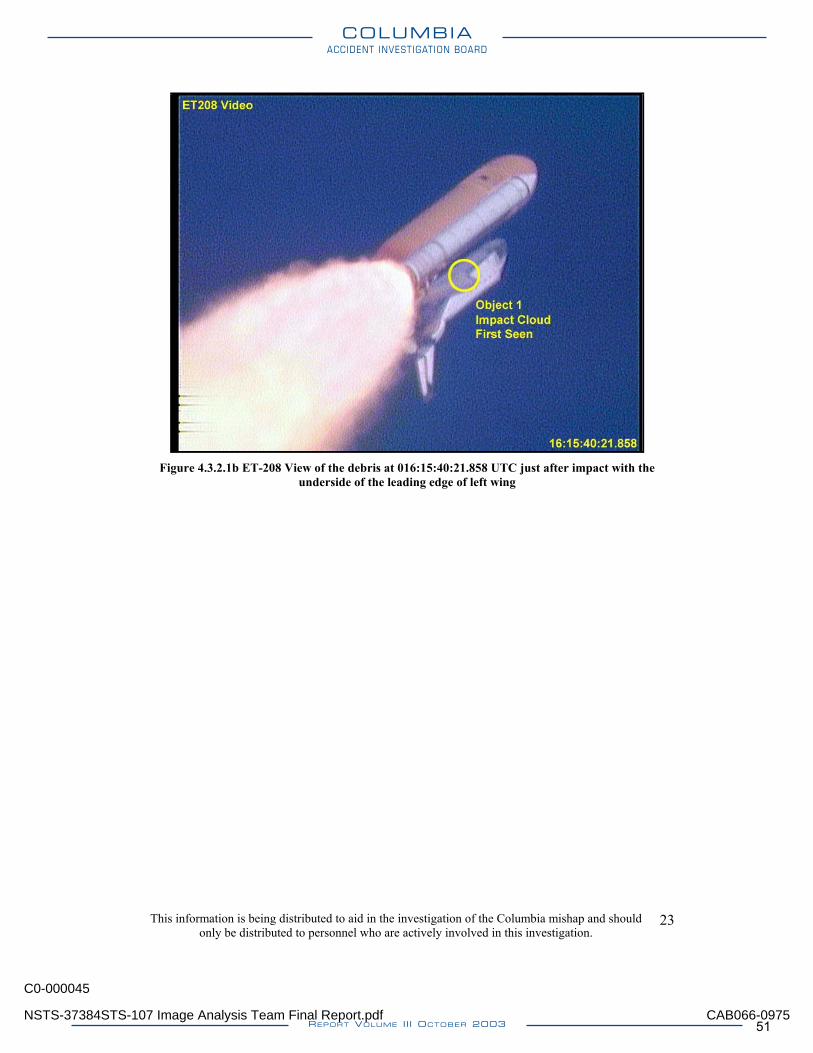
Figure 4.3.2.1b ET-208 View of the debris at 016:15:40:21.858 UTC just after impact with the
underside of the leading edge of left wing
This information is being distributed to aid in the investigation of the Columbia mishap and should only be distributed to personnel who are actively involved in this investigation.
23
NSTS-37384STS-107 Image Analysis Team Final Report.pdf
C0-000045
CAB066-0975
COLUMBIAACCIDENT INVESTIGATION BOARD
REPORT VOLUME III OCTOBER 2003 51
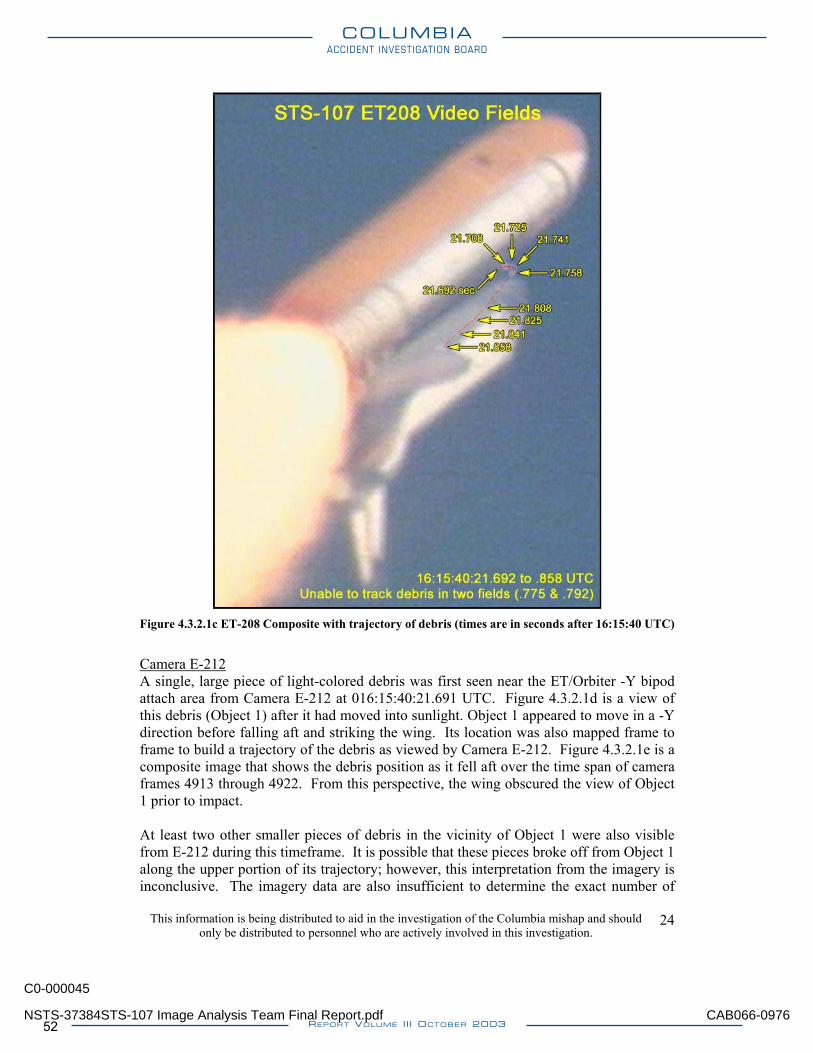
Figure 4.3.2.1c ET-208 Composite with trajectory of debris (times are in seconds after 16:15:40 UTC)
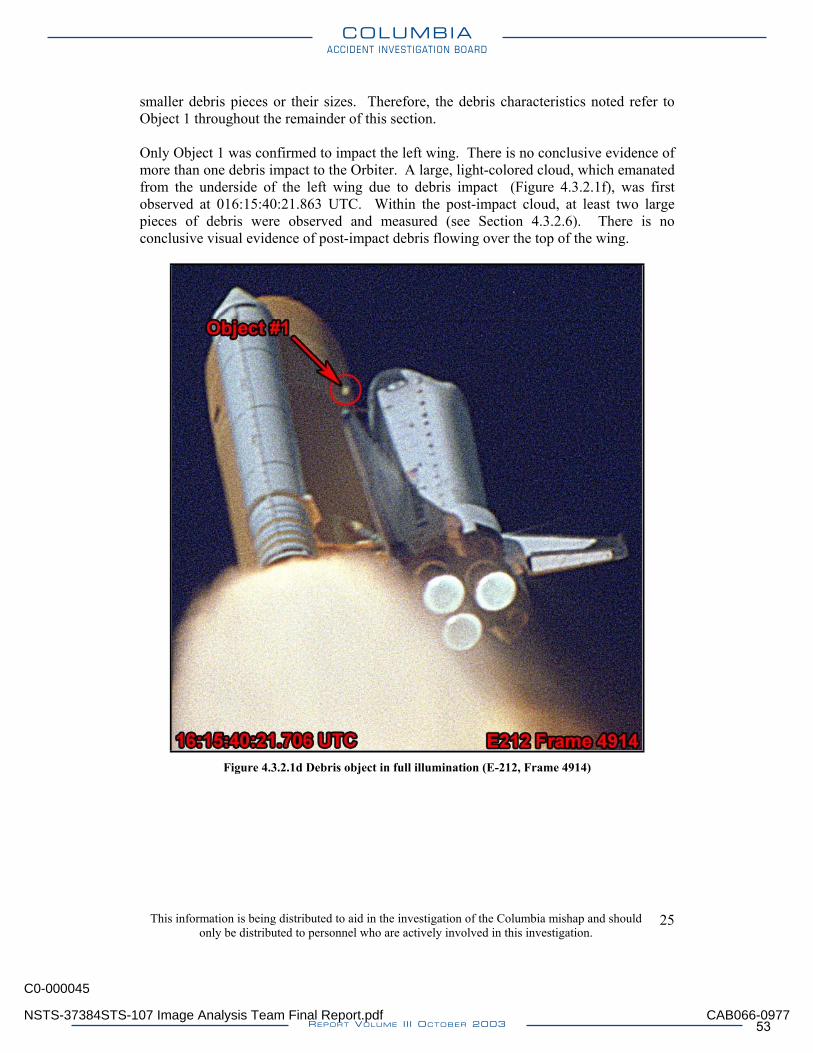
Camera E-212 A single, large piece of light-colored debris was first seen near the ET/Orbiter -Y bipod attach area from Camera E-212 at 016:15:40:21.691 UTC. Figure 4.3.2.1d is a view of this debris (Object 1) after it had moved into sunlight. Object 1 appeared to move in a -Y direction before falling aft and striking the wing. Its location was also mapped frame to frame to build a trajectory of the debris as viewed by Camera E-212. Figure 4.3.2.1e is a composite image that shows the debris position as it fell aft over the time span of camera frames 4913 through 4922. From this perspective, the wing obscured the view of Object 1 prior to impact. At least two other smaller pieces of debris in the vicinity of Object 1 were also visible from E-212 during this timeframe. It is possible that these pieces broke off from Object 1 along the upper portion of its trajectory; however, this interpretation from the imagery is inconclusive. The imagery data are also insufficient to determine the exact number of
This information is being distributed to aid in the investigation of the Columbia mishap and should only be distributed to personnel who are actively involved in this investigation.
24
NSTS-37384STS-107 Image Analysis Team Final Report.pdf
C0-000045
CAB066-0976
COLUMBIAACCIDENT INVESTIGATION BOARD
REPORT VOLUME III OCTOBER 200352
smaller debris pieces or their sizes. Therefore, the debris characteristics noted refer to Object 1 throughout the remainder of this section. Only Object 1 was confirmed to impact the left wing. There is no conclusive evidence of more than one debris impact to the Orbiter. A large, light-colored cloud, which emanated from the underside of the left wing due to debris impact (Figure 4.3.2.1f), was first observed at 016:15:40:21.863 UTC. Within the post-impact cloud, at least two large pieces of debris were observed and measured (see Section 4.3.2.6). There is no conclusive visual evidence of post-impact debris flowing over the top of the wing.
Figure 4.3.2.1d Debris object in full illumination (E-212, Frame 4914)
This information is being distributed to aid in the investigation of the Columbia mishap and should only be distributed to personnel who are actively involved in this investigation.
25
NSTS-37384STS-107 Image Analysis Team Final Report.pdf
C0-000045
CAB066-0977
COLUMBIAACCIDENT INVESTIGATION BOARD
REPORT VOLUME III OCTOBER 2003 53
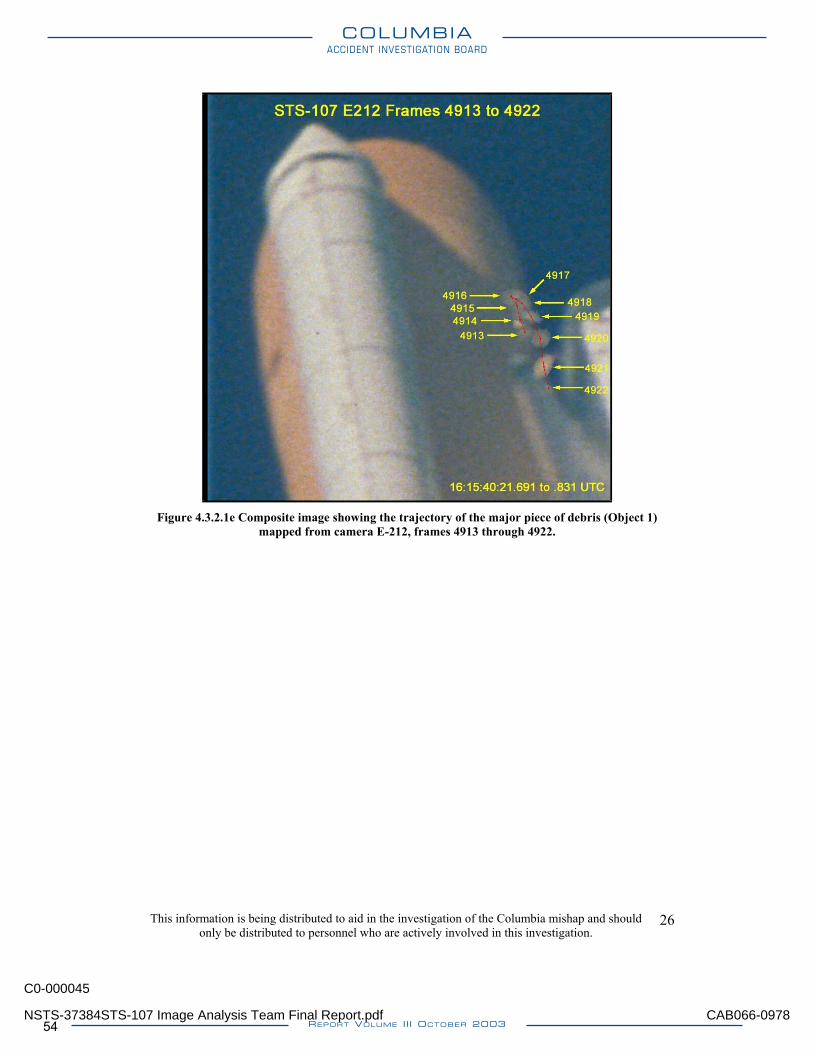
Figure 4.3.2.1e Composite image showing the trajectory of the major piece of debris (Object 1)
mapped from camera E-212, frames 4913 through 4922.
This information is being distributed to aid in the investigation of the Columbia mishap and should only be distributed to personnel who are actively involved in this investigation.
26
NSTS-37384STS-107 Image Analysis Team Final Report.pdf
C0-000045
CAB066-0978
COLUMBIAACCIDENT INVESTIGATION BOARD
REPORT VOLUME III OCTOBER 200354
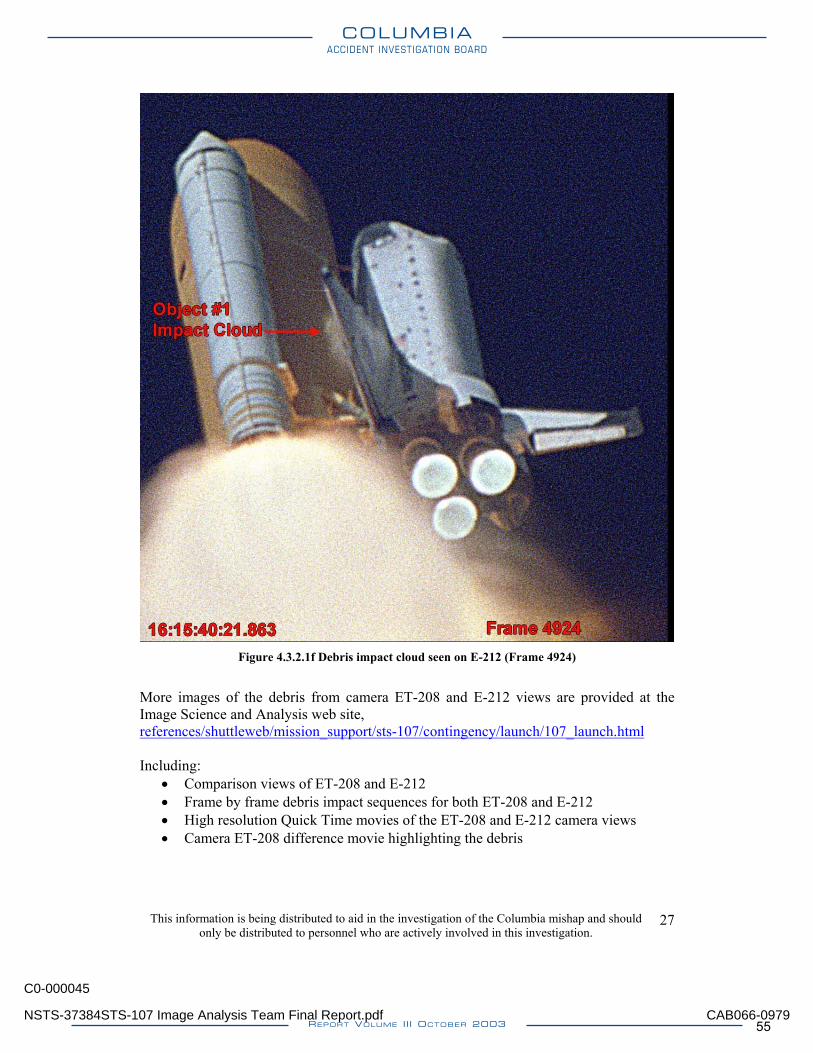
Figure 4.3.2.1f Debris impact cloud seen on E-212 (Frame 4924)
More images of the debris from camera ET-208 and E-212 views are provided at the Image Science and Analysis web site, references/shuttleweb/mission_support/sts-107/contingency/launch/107_launch.html Including:
• Comparison views of ET-208 and E-212 • Frame by frame debris impact sequences for both ET-208 and E-212 • High resolution Quick Time movies of the ET-208 and E-212 camera views • Camera ET-208 difference movie highlighting the debris
This information is being distributed to aid in the investigation of the Columbia mishap and should only be distributed to personnel who are actively involved in this investigation.
27
NSTS-37384STS-107 Image Analysis Team Final Report.pdf
C0-000045
CAB066-0979
COLUMBIAACCIDENT INVESTIGATION BOARD
REPORT VOLUME III OCTOBER 2003 55
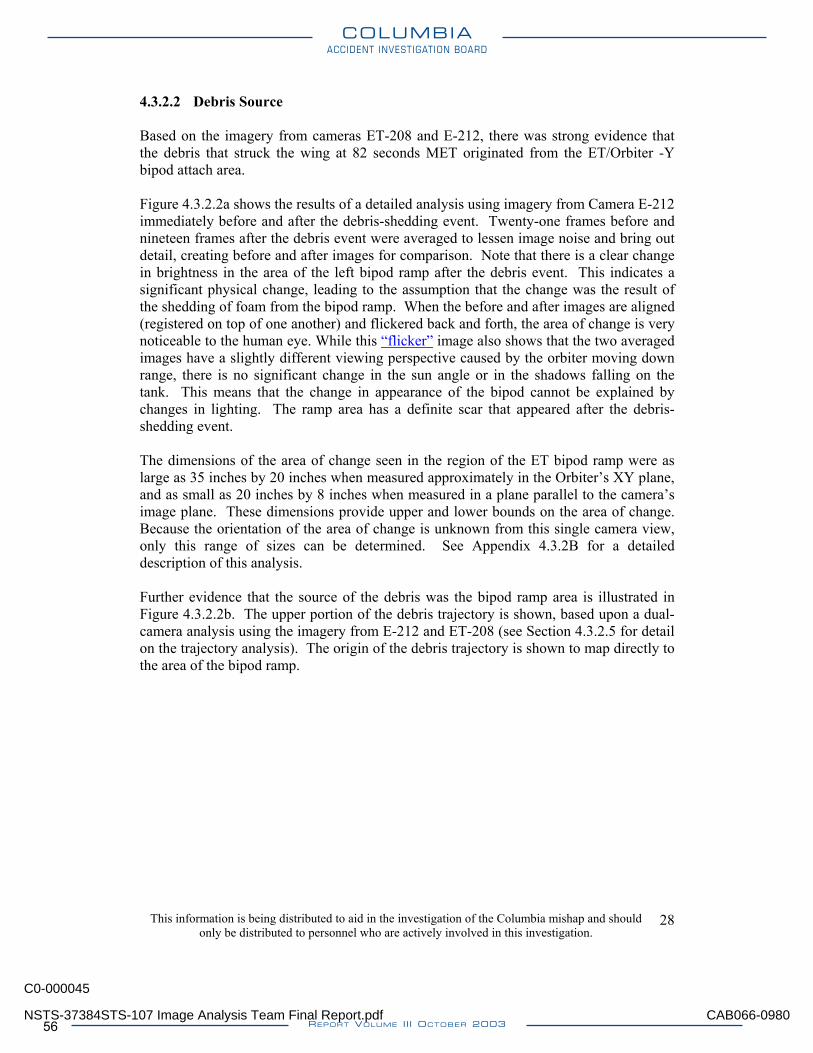
4.3.2.2 Debris Source Based on the imagery from cameras ET-208 and E-212, there was strong evidence that the debris that struck the wing at 82 seconds MET originated from the ET/Orbiter -Y bipod attach area. Figure 4.3.2.2a shows the results of a detailed analysis using imagery from Camera E-212 immediately before and after the debris-shedding event. Twenty-one frames before and nineteen frames after the debris event were averaged to lessen image noise and bring out detail, creating before and after images for comparison. Note that there is a clear change in brightness in the area of the left bipod ramp after the debris event. This indicates a significant physical change, leading to the assumption that the change was the result of the shedding of foam from the bipod ramp. When the before and after images are aligned (registered on top of one another) and flickered back and forth, the area of change is very noticeable to the human eye. While this “flicker” image also shows that the two averaged images have a slightly different viewing perspective caused by the orbiter moving down range, there is no significant change in the sun angle or in the shadows falling on the tank. This means that the change in appearance of the bipod cannot be explained by changes in lighting. The ramp area has a definite scar that appeared after the debris-shedding event. The dimensions of the area of change seen in the region of the ET bipod ramp were as large as 35 inches by 20 inches when measured approximately in the Orbiter’s XY plane, and as small as 20 inches by 8 inches when measured in a plane parallel to the camera’s image plane. These dimensions provide upper and lower bounds on the area of change. Because the orientation of the area of change is unknown from this single camera view, only this range of sizes can be determined. See Appendix 4.3.2B for a detailed description of this analysis. Further evidence that the source of the debris was the bipod ramp area is illustrated in Figure 4.3.2.2b. The upper portion of the debris trajectory is shown, based upon a dual-camera analysis using the imagery from E-212 and ET-208 (see Section 4.3.2.5 for detail on the trajectory analysis). The origin of the debris trajectory is shown to map directly to the area of the bipod ramp.
This information is being distributed to aid in the investigation of the Columbia mishap and should only be distributed to personnel who are actively involved in this investigation.
28
NSTS-37384STS-107 Image Analysis Team Final Report.pdf
C0-000045
CAB066-0980
COLUMBIAACCIDENT INVESTIGATION BOARD
REPORT VOLUME III OCTOBER 200356
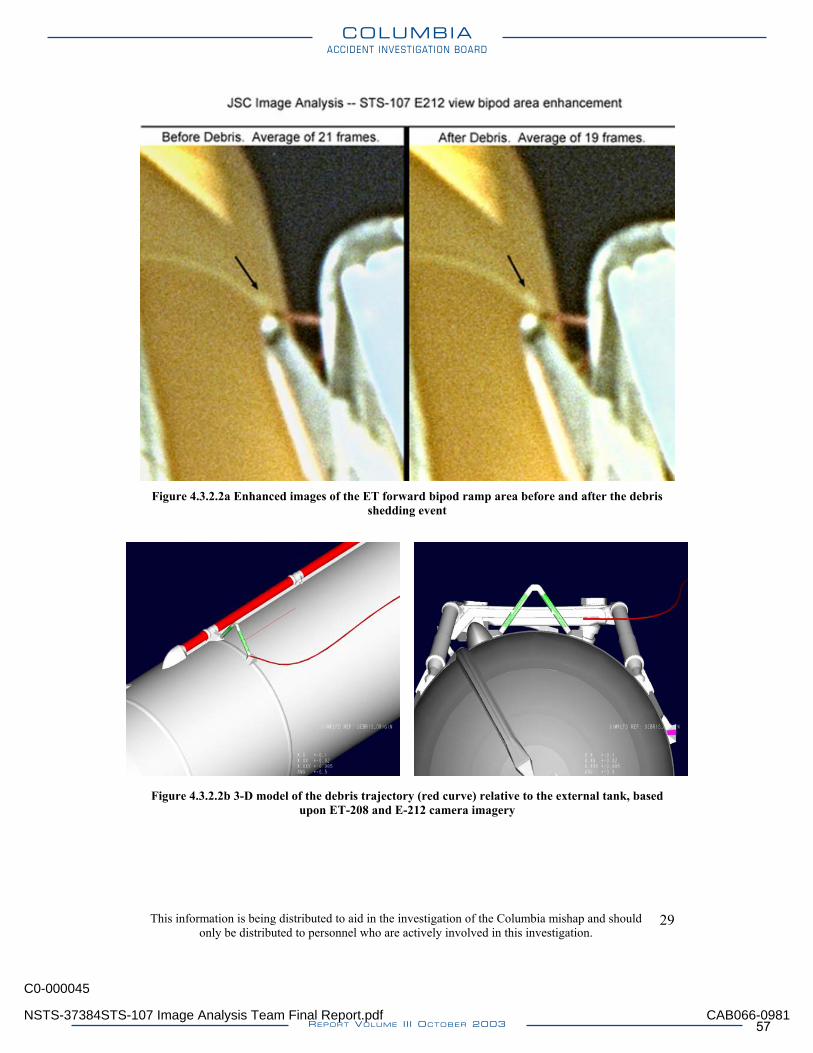
Figure 4.3.2.2a Enhanced images of the ET forward bipod ramp area before and after the debris
shedding event
Figure 4.3.2.2b 3-D model of the debris trajectory (red curve) relative to the external tank, based upon ET-208 and E-212 camera imagery
This information is being distributed to aid in the investigation of the Columbia mishap and should only be distributed to personnel who are actively involved in this investigation.
29
NSTS-37384STS-107 Image Analysis Team Final Report.pdf
C0-000045
CAB066-0981
COLUMBIAACCIDENT INVESTIGATION BOARD
REPORT VOLUME III OCTOBER 2003 57
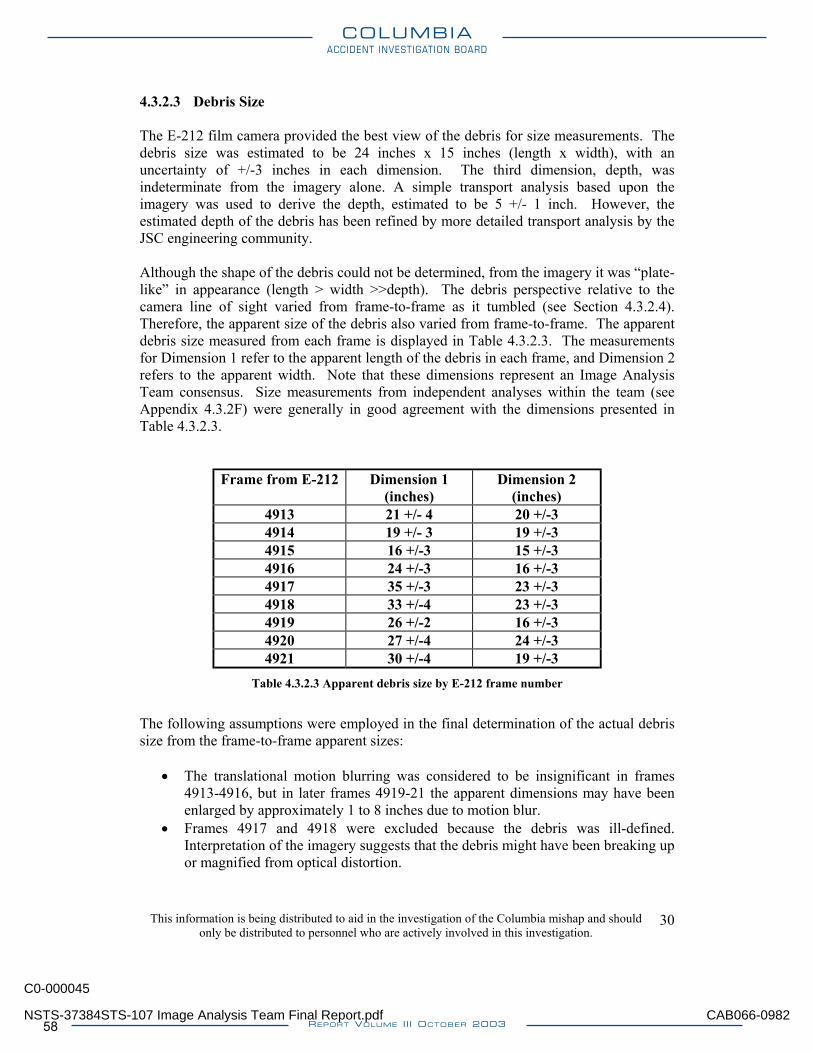
4.3.2.3 Debris Size The E-212 film camera provided the best view of the debris for size measurements. The debris size was estimated to be 24 inches x 15 inches (length x width), with an uncertainty of +/-3 inches in each dimension. The third dimension, depth, was indeterminate from the imagery alone. A simple transport analysis based upon the imagery was used to derive the depth, estimated to be 5 +/- 1 inch. However, the estimated depth of the debris has been refined by more detailed transport analysis by the JSC engineering community. Although the shape of the debris could not be determined, from the imagery it was “plate-like” in appearance (length > width >>depth). The debris perspective relative to the camera line of sight varied from frame-to-frame as it tumbled (see Section 4.3.2.4). Therefore, the apparent size of the debris also varied from frame-to-frame. The apparent debris size measured from each frame is displayed in Table 4.3.2.3. The measurements for Dimension 1 refer to the apparent length of the debris in each frame, and Dimension 2 refers to the apparent width. Note that these dimensions represent an Image Analysis Team consensus. Size measurements from independent analyses within the team (see Appendix 4.3.2F) were generally in good agreement with the dimensions presented in Table 4.3.2.3.
Frame from E-212 Dimension 1 (inches)
Dimension 2 (inches)
4913 21 +/- 4 20 +/-3 4914 19 +/- 3 19 +/-3 4915 16 +/-3 15 +/-3 4916 24 +/-3 16 +/-3 4917 35 +/-3 23 +/-3 4918 33 +/-4 23 +/-3 4919 26 +/-2 16 +/-3 4920 27 +/-4 24 +/-3 4921 30 +/-4 19 +/-3
Table 4.3.2.3 Apparent debris size by E-212 frame number
The following assumptions were employed in the final determination of the actual debris size from the frame-to-frame apparent sizes:
• The translational motion blurring was considered to be insignificant in frames 4913-4916, but in later frames 4919-21 the apparent dimensions may have been enlarged by approximately 1 to 8 inches due to motion blur.
• Frames 4917 and 4918 were excluded because the debris was ill-defined. Interpretation of the imagery suggests that the debris might have been breaking up or magnified from optical distortion.
This information is being distributed to aid in the investigation of the Columbia mishap and should only be distributed to personnel who are actively involved in this investigation.
30
NSTS-37384STS-107 Image Analysis Team Final Report.pdf
C0-000045
CAB066-0982
COLUMBIAACCIDENT INVESTIGATION BOARD
REPORT VOLUME III OCTOBER 200358
• Frame 4916 appeared to provide the best representation of the actual debris shape, and provided an approximate minimum length of 24 inches for the long dimension and minimum width of 16 inches. As additional compensation for motion blur, the width measurement was biased downward to 15 inches because the motion of the debris during that frame appeared to be mostly in the direction of the debris width.
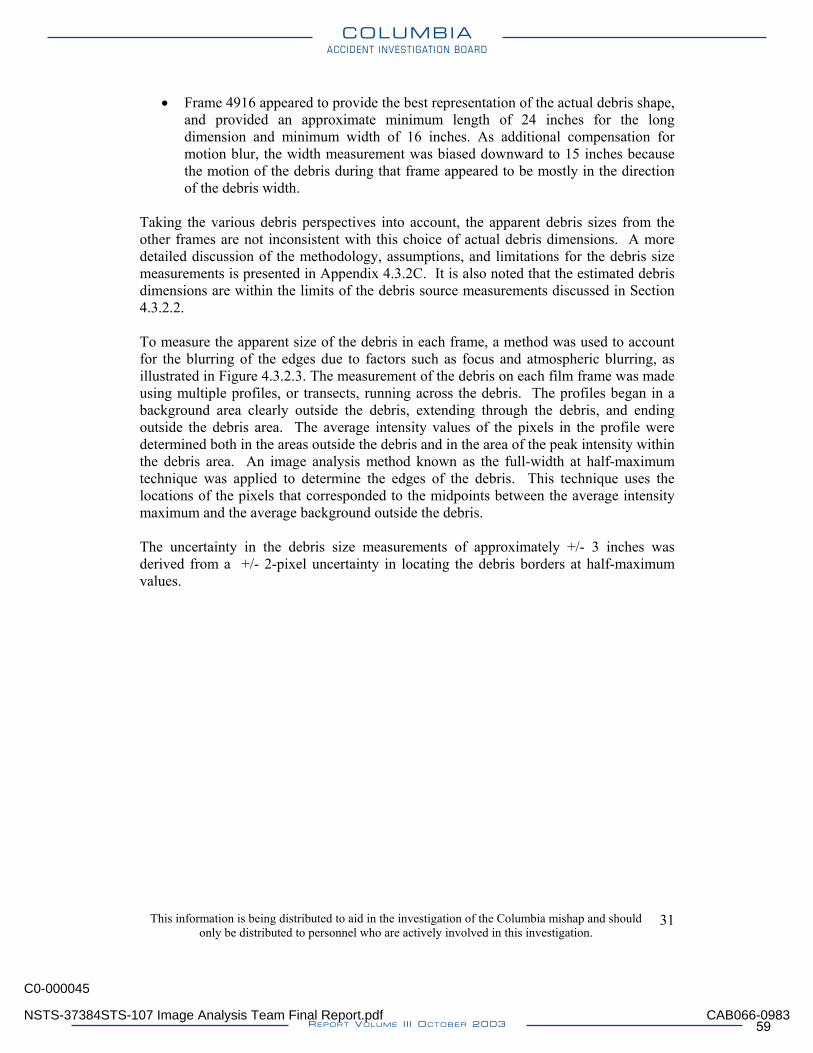
Taking the various debris perspectives into account, the apparent debris sizes from the other frames are not inconsistent with this choice of actual debris dimensions. A more detailed discussion of the methodology, assumptions, and limitations for the debris size measurements is presented in Appendix 4.3.2C. It is also noted that the estimated debris dimensions are within the limits of the debris source measurements discussed in Section 4.3.2.2. To measure the apparent size of the debris in each frame, a method was used to account for the blurring of the edges due to factors such as focus and atmospheric blurring, as illustrated in Figure 4.3.2.3. The measurement of the debris on each film frame was made using multiple profiles, or transects, running across the debris. The profiles began in a background area clearly outside the debris, extending through the debris, and ending outside the debris area. The average intensity values of the pixels in the profile were determined both in the areas outside the debris and in the area of the peak intensity within the debris area. An image analysis method known as the full-width at half-maximum technique was applied to determine the edges of the debris. This technique uses the locations of the pixels that corresponded to the midpoints between the average intensity maximum and the average background outside the debris. The uncertainty in the debris size measurements of approximately +/- 3 inches was derived from a +/- 2-pixel uncertainty in locating the debris borders at half-maximum values.
This information is being distributed to aid in the investigation of the Columbia mishap and should only be distributed to personnel who are actively involved in this investigation.
31
NSTS-37384STS-107 Image Analysis Team Final Report.pdf
C0-000045
CAB066-0983
COLUMBIAACCIDENT INVESTIGATION BOARD
REPORT VOLUME III OCTOBER 2003 59
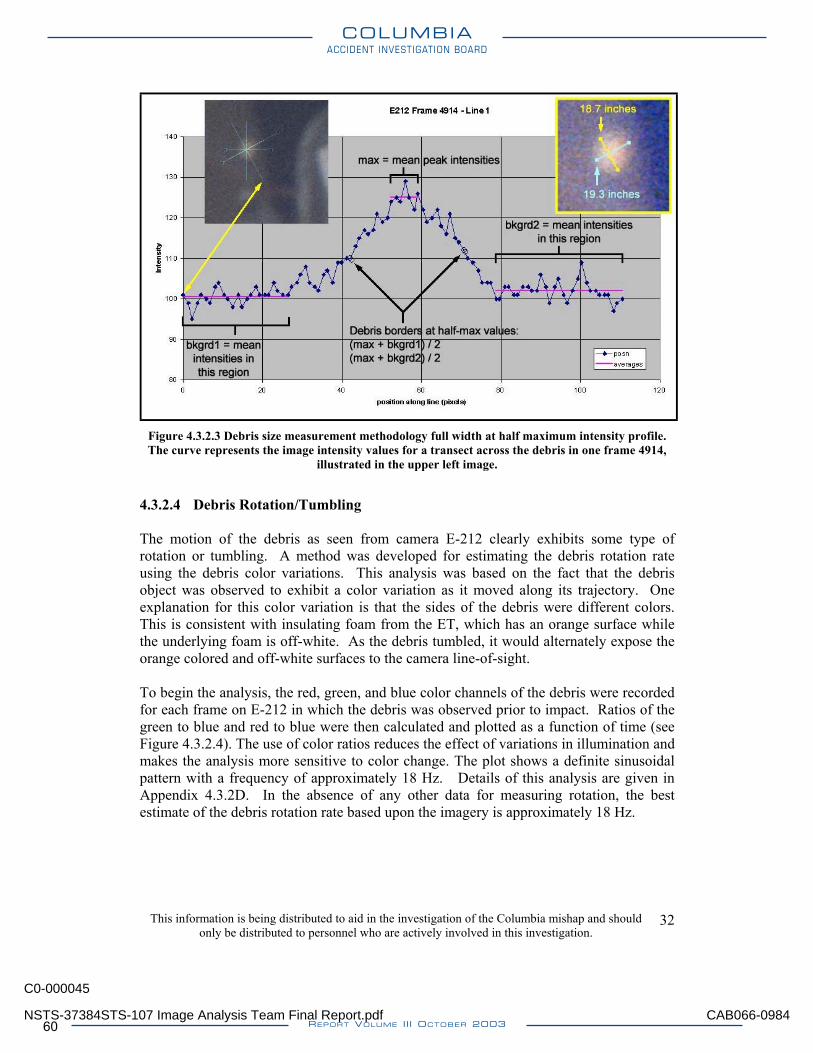
Figure 4.3.2.3 Debris size measurement methodology full width at half maximum intensity profile. The curve represents the image intensity values for a transect across the debris in one frame 4914,
illustrated in the upper left image.
4.3.2.4 Debris Rotation/Tumbling The motion of the debris as seen from camera E-212 clearly exhibits some type of rotation or tumbling. A method was developed for estimating the debris rotation rate using the debris color variations. This analysis was based on the fact that the debris object was observed to exhibit a color variation as it moved along its trajectory. One explanation for this color variation is that the sides of the debris were different colors. This is consistent with insulating foam from the ET, which has an orange surface while the underlying foam is off-white. As the debris tumbled, it would alternately expose the orange colored and off-white surfaces to the camera line-of-sight. To begin the analysis, the red, green, and blue color channels of the debris were recorded for each frame on E-212 in which the debris was observed prior to impact. Ratios of the green to blue and red to blue were then calculated and plotted as a function of time (see Figure 4.3.2.4). The use of color ratios reduces the effect of variations in illumination and makes the analysis more sensitive to color change. The plot shows a definite sinusoidal pattern with a frequency of approximately 18 Hz. Details of this analysis are given in Appendix 4.3.2D. In the absence of any other data for measuring rotation, the best estimate of the debris rotation rate based upon the imagery is approximately 18 Hz.
This information is being distributed to aid in the investigation of the Columbia mishap and should only be distributed to personnel who are actively involved in this investigation.
32
NSTS-37384STS-107 Image Analysis Team Final Report.pdf
C0-000045
CAB066-0984
COLUMBIAACCIDENT INVESTIGATION BOARD
REPORT VOLUME III OCTOBER 200360
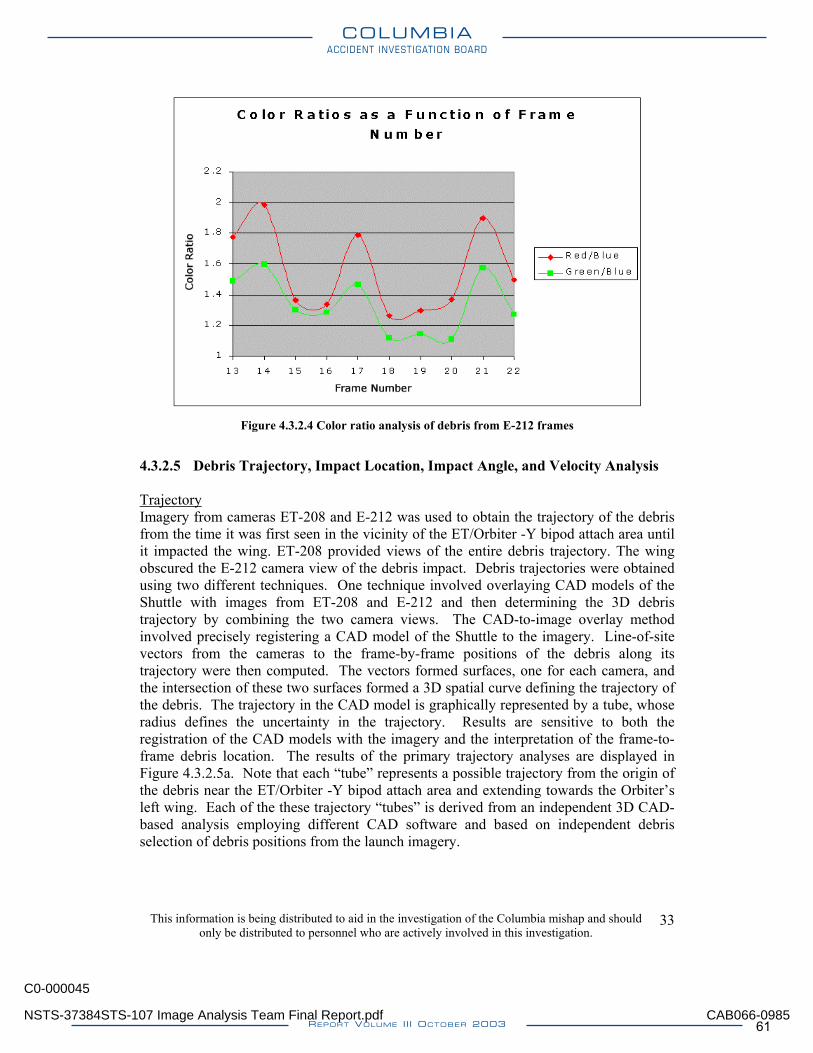
Figure 4.3.2.4 Color ratio analysis of debris from E-212 frames
4.3.2.5 Debris Trajectory, Impact Location, Impact Angle, and Velocity Analysis Trajectory Imagery from cameras ET-208 and E-212 was used to obtain the trajectory of the debris from the time it was first seen in the vicinity of the ET/Orbiter -Y bipod attach area until it impacted the wing. ET-208 provided views of the entire debris trajectory. The wing obscured the E-212 camera view of the debris impact. Debris trajectories were obtained using two different techniques. One technique involved overlaying CAD models of the Shuttle with images from ET-208 and E-212 and then determining the 3D debris trajectory by combining the two camera views. The CAD-to-image overlay method involved precisely registering a CAD model of the Shuttle to the imagery. Line-of-site vectors from the cameras to the frame-by-frame positions of the debris along its trajectory were then computed. The vectors formed surfaces, one for each camera, and the intersection of these two surfaces formed a 3D spatial curve defining the trajectory of the debris. The trajectory in the CAD model is graphically represented by a tube, whose radius defines the uncertainty in the trajectory. Results are sensitive to both the registration of the CAD models with the imagery and the interpretation of the frame-to-frame debris location. The results of the primary trajectory analyses are displayed in Figure 4.3.2.5a. Note that each “tube” represents a possible trajectory from the origin of the debris near the ET/Orbiter -Y bipod attach area and extending towards the Orbiter’s left wing. Each of the these trajectory “tubes” is derived from an independent 3D CAD-based analysis employing different CAD software and based on independent debris selection of debris positions from the launch imagery.
This information is being distributed to aid in the investigation of the Columbia mishap and should only be distributed to personnel who are actively involved in this investigation.
33
NSTS-37384STS-107 Image Analysis Team Final Report.pdf
C0-000045
CAB066-0985
COLUMBIAACCIDENT INVESTIGATION BOARD
REPORT VOLUME III OCTOBER 2003 61
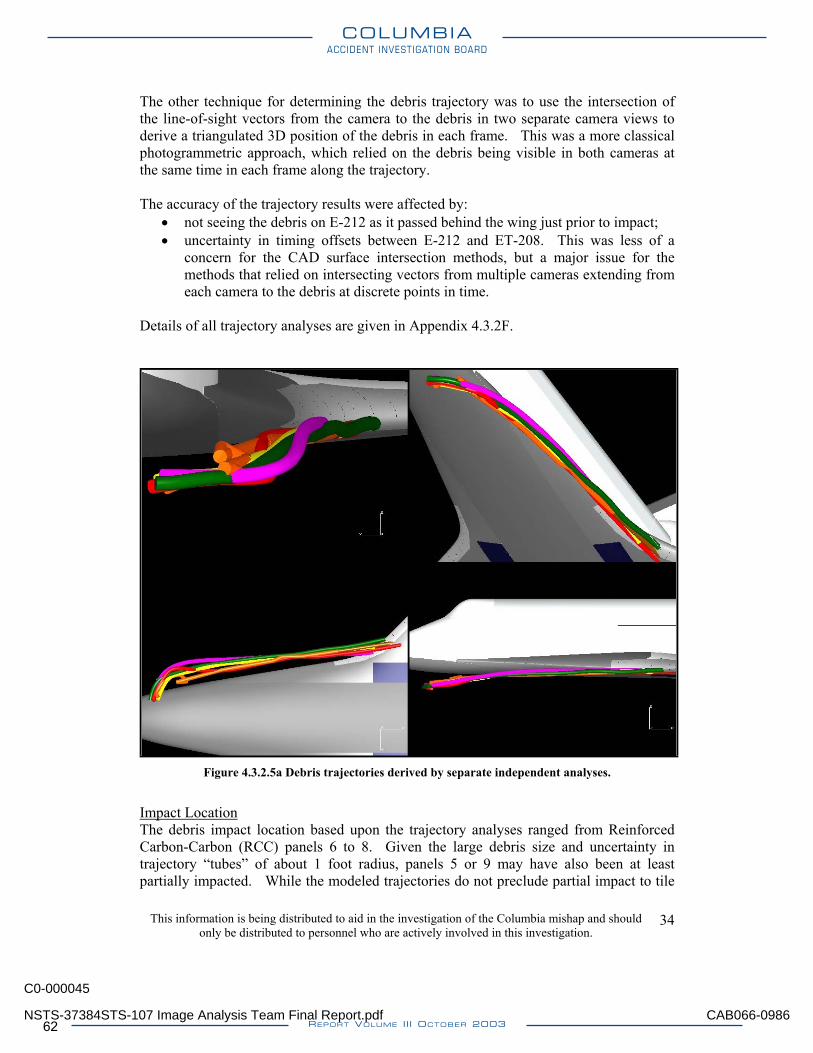
The other technique for determining the debris trajectory was to use the intersection of the line-of-sight vectors from the camera to the debris in two separate camera views to derive a triangulated 3D position of the debris in each frame. This was a more classical photogrammetric approach, which relied on the debris being visible in both cameras at the same time in each frame along the trajectory. The accuracy of the trajectory results were affected by:
not seeing the debris on E-212 as it passed behind the wing just prior to impact; • • uncertainty in timing offsets between E-212 and ET-208. This was less of a
concern for the CAD surface intersection methods, but a major issue for the methods that relied on intersecting vectors from multiple cameras extending from each camera to the debris at discrete points in time.
Details of all trajectory analyses are given in Appendix 4.3.2F.
Figure 4.3.2.5a Debris trajectories derived by separate independent analyses.
Impact Location The debris impact location based upon the trajectory analyses ranged from Reinforced Carbon-Carbon (RCC) panels 6 to 8. Given the large debris size and uncertainty in trajectory “tubes” of about 1 foot radius, panels 5 or 9 may have also been at least partially impacted. While the modeled trajectories do not preclude partial impact to tile
This information is being distributed to aid in the investigation of the Columbia mishap and should only be distributed to personnel who are actively involved in this investigation.
34
NSTS-37384STS-107 Image Analysis Team Final Report.pdf
C0-000045
CAB066-0986
COLUMBIAACCIDENT INVESTIGATION BOARD
REPORT VOLUME III OCTOBER 200362
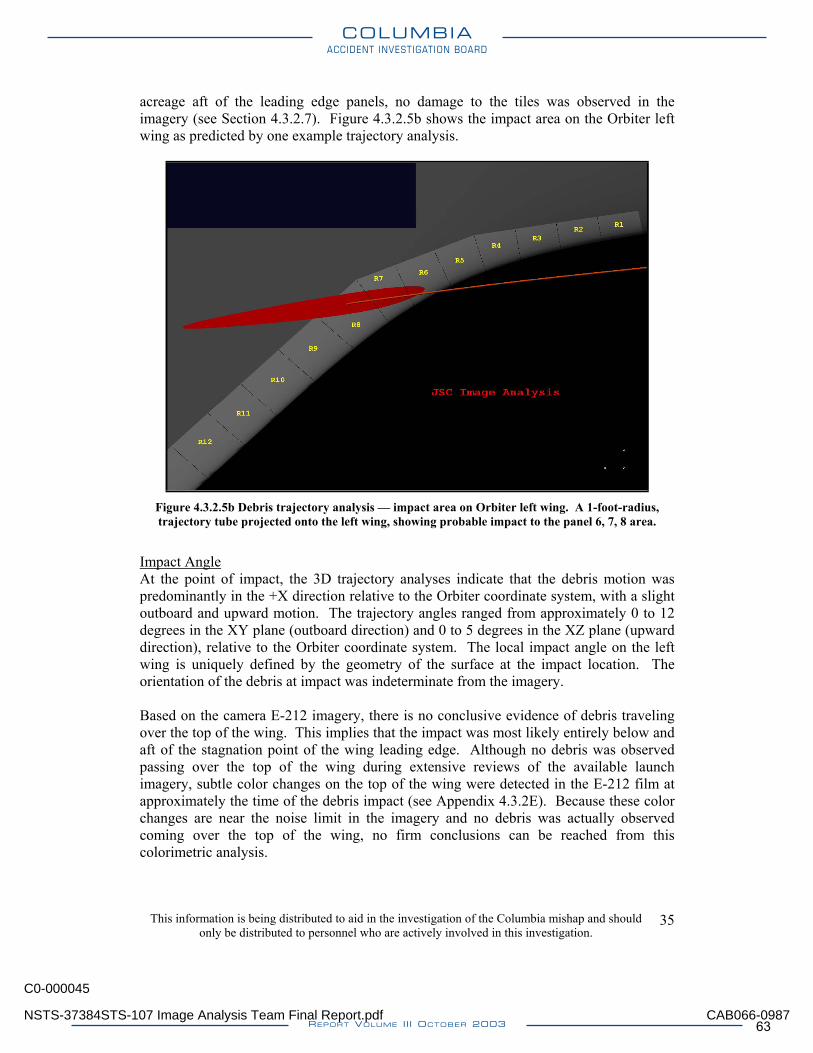
acreage aft of the leading edge panels, no damage to the tiles was observed in the imagery (see Section 4.3.2.7). Figure 4.3.2.5b shows the impact area on the Orbiter left wing as predicted by one example trajectory analysis.
Figure 4.3.2.5b Debris trajectory analysis — impact area on Orbiter left wing. A 1-foot-radius, trajectory tube projected onto the left wing, showing probable impact to the panel 6, 7, 8 area.
Impact Angle At the point of impact, the 3D trajectory analyses indicate that the debris motion was predominantly in the +X direction relative to the Orbiter coordinate system, with a slight outboard and upward motion. The trajectory angles ranged from approximately 0 to 12 degrees in the XY plane (outboard direction) and 0 to 5 degrees in the XZ plane (upward direction), relative to the Orbiter coordinate system. The local impact angle on the left wing is uniquely defined by the geometry of the surface at the impact location. The orientation of the debris at impact was indeterminate from the imagery. Based on the camera E-212 imagery, there is no conclusive evidence of debris traveling over the top of the wing. This implies that the impact was most likely entirely below and aft of the stagnation point of the wing leading edge. Although no debris was observed passing over the top of the wing during extensive reviews of the available launch imagery, subtle color changes on the top of the wing were detected in the E-212 film at approximately the time of the debris impact (see Appendix 4.3.2E). Because these color changes are near the noise limit in the imagery and no debris was actually observed coming over the top of the wing, no firm conclusions can be reached from this colorimetric analysis.
This information is being distributed to aid in the investigation of the Columbia mishap and should only be distributed to personnel who are actively involved in this investigation.
35
NSTS-37384STS-107 Image Analysis Team Final Report.pdf
C0-000045
CAB066-0987
COLUMBIAACCIDENT INVESTIGATION BOARD
REPORT VOLUME III OCTOBER 2003 63
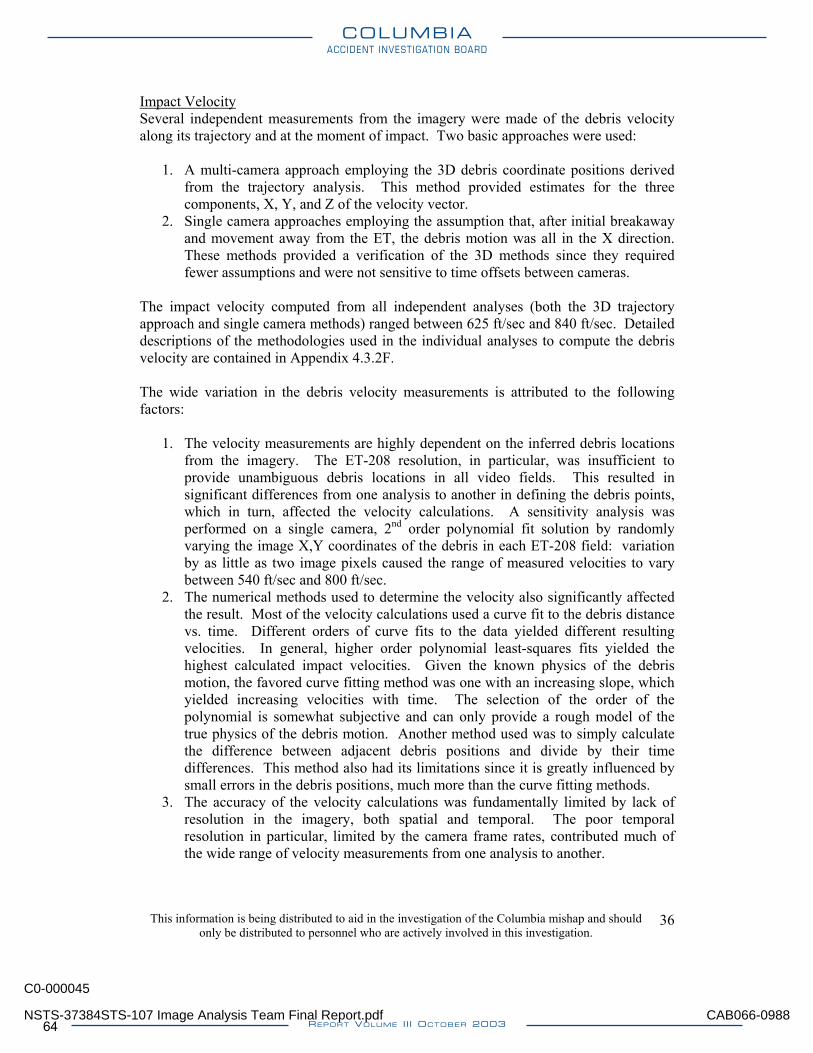
Impact Velocity Several independent measurements from the imagery were made of the debris velocity along its trajectory and at the moment of impact. Two basic approaches were used:
1. A multi-camera approach employing the 3D debris coordinate positions derived from the trajectory analysis. This method provided estimates for the three components, X, Y, and Z of the velocity vector.
2. Single camera approaches employing the assumption that, after initial breakaway and movement away from the ET, the debris motion was all in the X direction. These methods provided a verification of the 3D methods since they required fewer assumptions and were not sensitive to time offsets between cameras.
The impact velocity computed from all independent analyses (both the 3D trajectory approach and single camera methods) ranged between 625 ft/sec and 840 ft/sec. Detailed descriptions of the methodologies used in the individual analyses to compute the debris velocity are contained in Appendix 4.3.2F. The wide variation in the debris velocity measurements is attributed to the following factors:
1. The velocity measurements are highly dependent on the inferred debris locations from the imagery. The ET-208 resolution, in particular, was insufficient to provide unambiguous debris locations in all video fields. This resulted in significant differences from one analysis to another in defining the debris points, which in turn, affected the velocity calculations. A sensitivity analysis was performed on a single camera, 2nd order polynomial fit solution by randomly varying the image X,Y coordinates of the debris in each ET-208 field: variation by as little as two image pixels caused the range of measured velocities to vary between 540 ft/sec and 800 ft/sec.
2. The numerical methods used to determine the velocity also significantly affected the result. Most of the velocity calculations used a curve fit to the debris distance vs. time. Different orders of curve fits to the data yielded different resulting velocities. In general, higher order polynomial least-squares fits yielded the highest calculated impact velocities. Given the known physics of the debris motion, the favored curve fitting method was one with an increasing slope, which yielded increasing velocities with time. The selection of the order of the polynomial is somewhat subjective and can only provide a rough model of the true physics of the debris motion. Another method used was to simply calculate the difference between adjacent debris positions and divide by their time differences. This method also had its limitations since it is greatly influenced by small errors in the debris positions, much more than the curve fitting methods.
3. The accuracy of the velocity calculations was fundamentally limited by lack of resolution in the imagery, both spatial and temporal. The poor temporal resolution in particular, limited by the camera frame rates, contributed much of the wide range of velocity measurements from one analysis to another.
This information is being distributed to aid in the investigation of the Columbia mishap and should only be distributed to personnel who are actively involved in this investigation.
36
NSTS-37384STS-107 Image Analysis Team Final Report.pdf
C0-000045
CAB066-0988
COLUMBIAACCIDENT INVESTIGATION BOARD
REPORT VOLUME III OCTOBER 200364
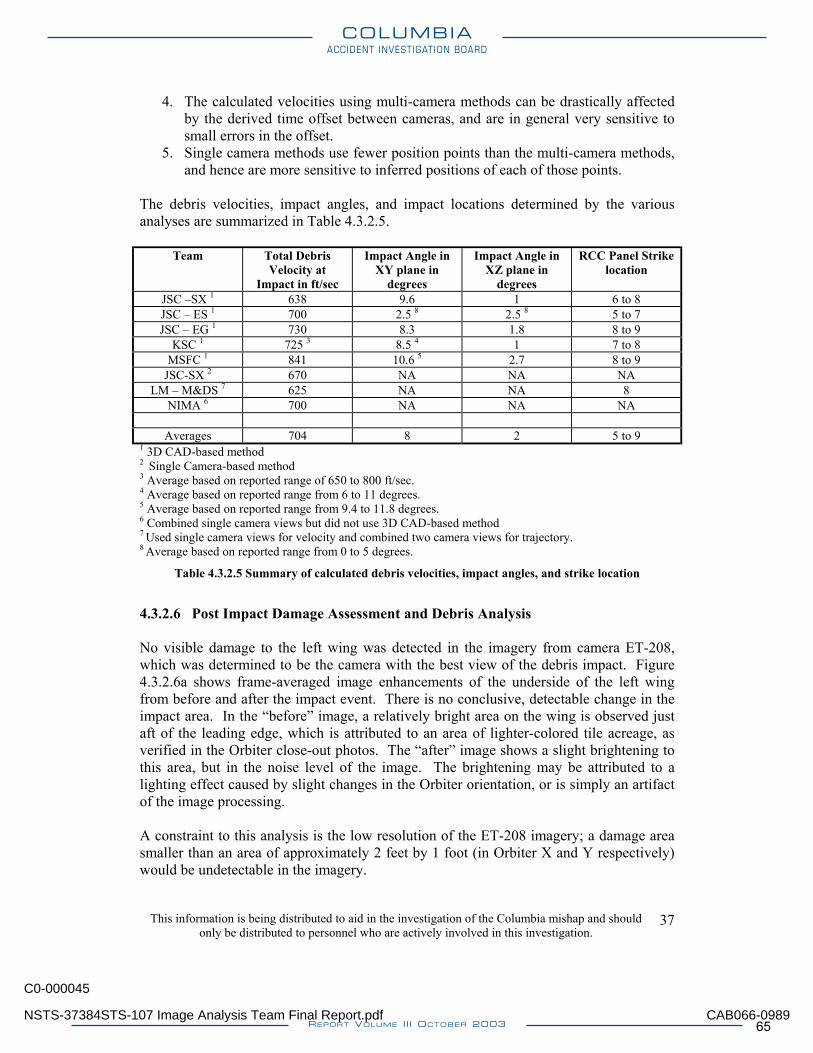
4. The calculated velocities using multi-camera methods can be drastically affected by the derived time offset between cameras, and are in general very sensitive to small errors in the offset.
5. Single camera methods use fewer position points than the multi-camera methods, and hence are more sensitive to inferred positions of each of those points.
The debris velocities, impact angles, and impact locations determined by the various analyses are summarized in Table 4.3.2.5.
Team Total Debris Velocity at
Impact in ft/sec
Impact Angle in XY plane in
degrees
Impact Angle in XZ plane in
degrees
RCC Panel Strike location
JSC –SX 1 638 9.6 1 6 to 8 JSC – ES 1 700 2.5 8 2.5 8 5 to 7 JSC – EG 1 730 8.3 1.8 8 to 9
KSC 1 725 3 8.5 4 1 7 to 8 MSFC 1 841 10.6 5 2.7 8 to 9
JSC-SX 2 670 NA NA NA LM – M&DS 7 625 NA NA 8
NIMA 6 700 NA NA NA
Averages 704 8 2 5 to 9 1 3D CAD-based method 2 Single Camera-based method 3 Average based on reported range of 650 to 800 ft/sec. 4 Average based on reported range from 6 to 11 degrees. 5 Average based on reported range from 9.4 to 11.8 degrees. 6 Combined single camera views but did not use 3D CAD-based method 7 Used single camera views for velocity and combined two camera views for trajectory. 8 Average based on reported range from 0 to 5 degrees.
Table 4.3.2.5 Summary of calculated debris velocities, impact angles, and strike location
4.3.2.6 Post Impact Damage Assessment and Debris Analysis No visible damage to the left wing was detected in the imagery from camera ET-208, which was determined to be the camera with the best view of the debris impact. Figure 4.3.2.6a shows frame-averaged image enhancements of the underside of the left wing from before and after the impact event. There is no conclusive, detectable change in the impact area. In the “before” image, a relatively bright area on the wing is observed just aft of the leading edge, which is attributed to an area of lighter-colored tile acreage, as verified in the Orbiter close-out photos. The “after” image shows a slight brightening to this area, but in the noise level of the image. The brightening may be attributed to a lighting effect caused by slight changes in the Orbiter orientation, or is simply an artifact of the image processing. A constraint to this analysis is the low resolution of the ET-208 imagery; a damage area smaller than an area of approximately 2 feet by 1 foot (in Orbiter X and Y respectively) would be undetectable in the imagery.
This information is being distributed to aid in the investigation of the Columbia mishap and should only be distributed to personnel who are actively involved in this investigation.
37
NSTS-37384STS-107 Image Analysis Team Final Report.pdf
C0-000045
CAB066-0989
COLUMBIAACCIDENT INVESTIGATION BOARD
REPORT VOLUME III OCTOBER 2003 65
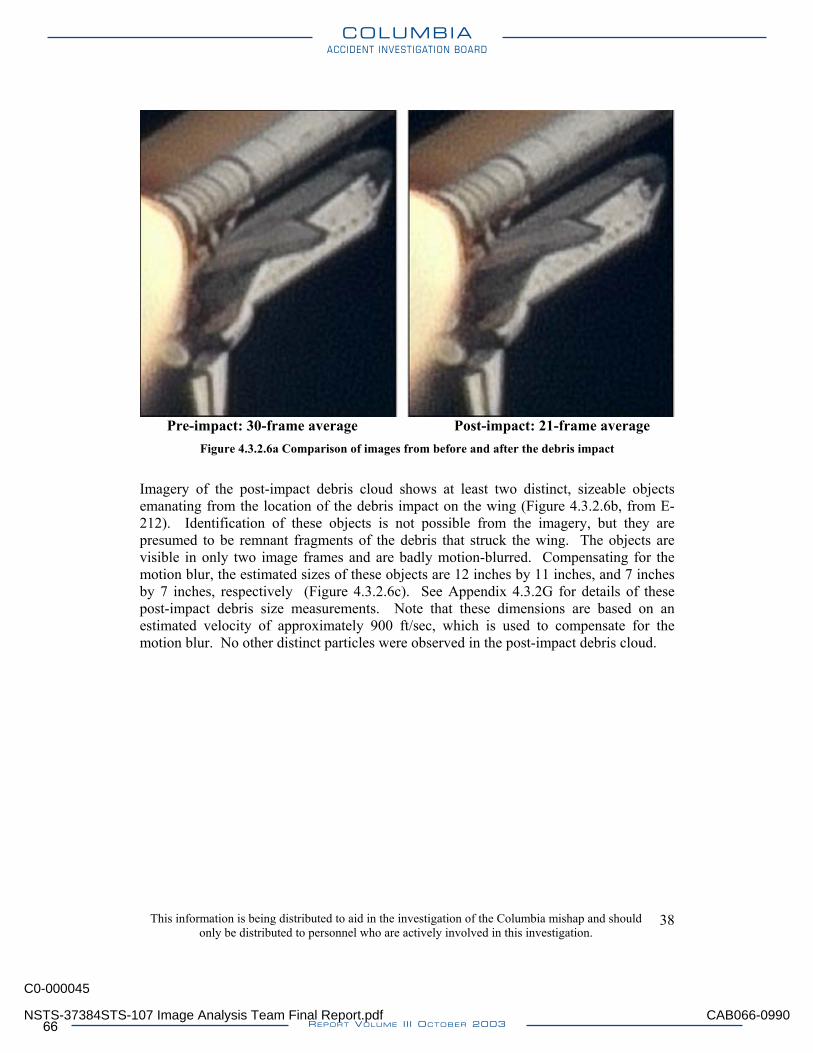
Pre-impact: 30-frame average Post-impact: 21-frame average
Figure 4.3.2.6a Comparison of images from before and after the debris impact
Imagery of the post-impact debris cloud shows at least two distinct, sizeable objects emanating from the location of the debris impact on the wing (Figure 4.3.2.6b, from E-212). Identification of these objects is not possible from the imagery, but they are presumed to be remnant fragments of the debris that struck the wing. The objects are visible in only two image frames and are badly motion-blurred. Compensating for the motion blur, the estimated sizes of these objects are 12 inches by 11 inches, and 7 inches by 7 inches, respectively (Figure 4.3.2.6c). See Appendix 4.3.2G for details of these post-impact debris size measurements. Note that these dimensions are based on an estimated velocity of approximately 900 ft/sec, which is used to compensate for the motion blur. No other distinct particles were observed in the post-impact debris cloud.
This information is being distributed to aid in the investigation of the Columbia mishap and should only be distributed to personnel who are actively involved in this investigation.
38
NSTS-37384STS-107 Image Analysis Team Final Report.pdf
C0-000045
CAB066-0990
COLUMBIAACCIDENT INVESTIGATION BOARD
REPORT VOLUME III OCTOBER 200366
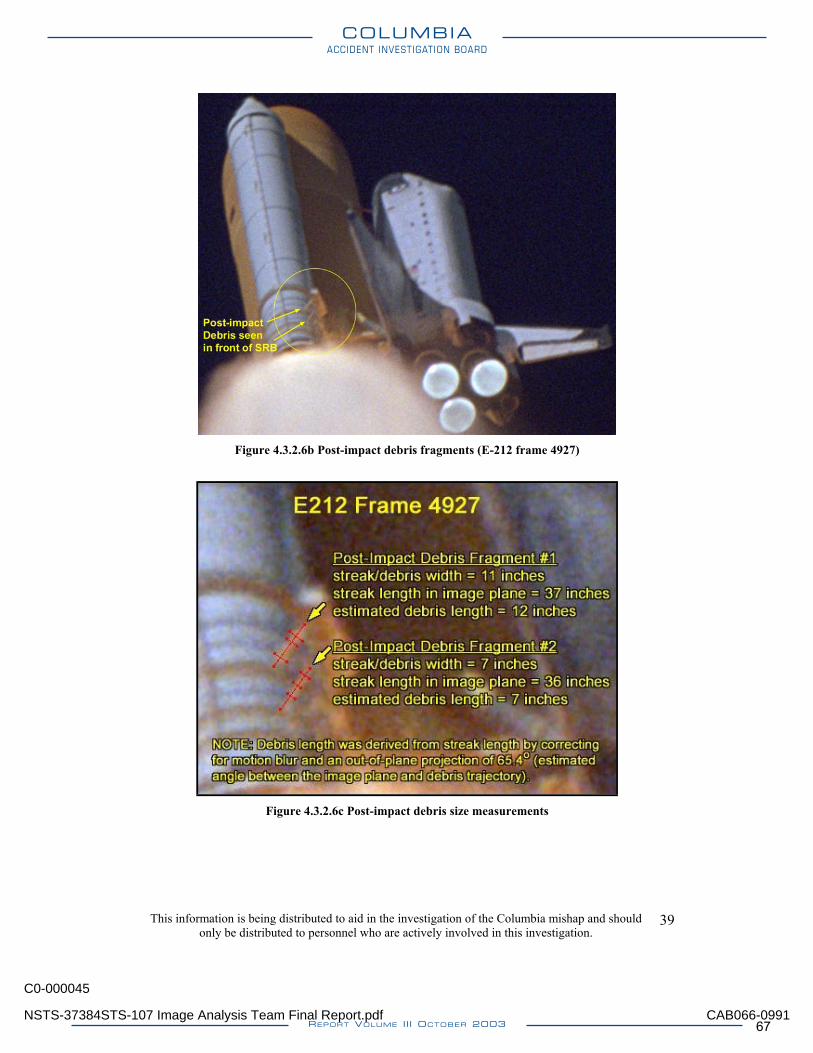
Figure 4.3.2.6b Post-impact debris fragments (E-212 frame 4927)
Figure 4.3.2.6c Post-impact debris size measurements
This information is being distributed to aid in the investigation of the Columbia mishap and should only be distributed to personnel who are actively involved in this investigation.
39
NSTS-37384STS-107 Image Analysis Team Final Report.pdf
C0-000045
CAB066-0991
COLUMBIAACCIDENT INVESTIGATION BOARD
REPORT VOLUME III OCTOBER 2003 67
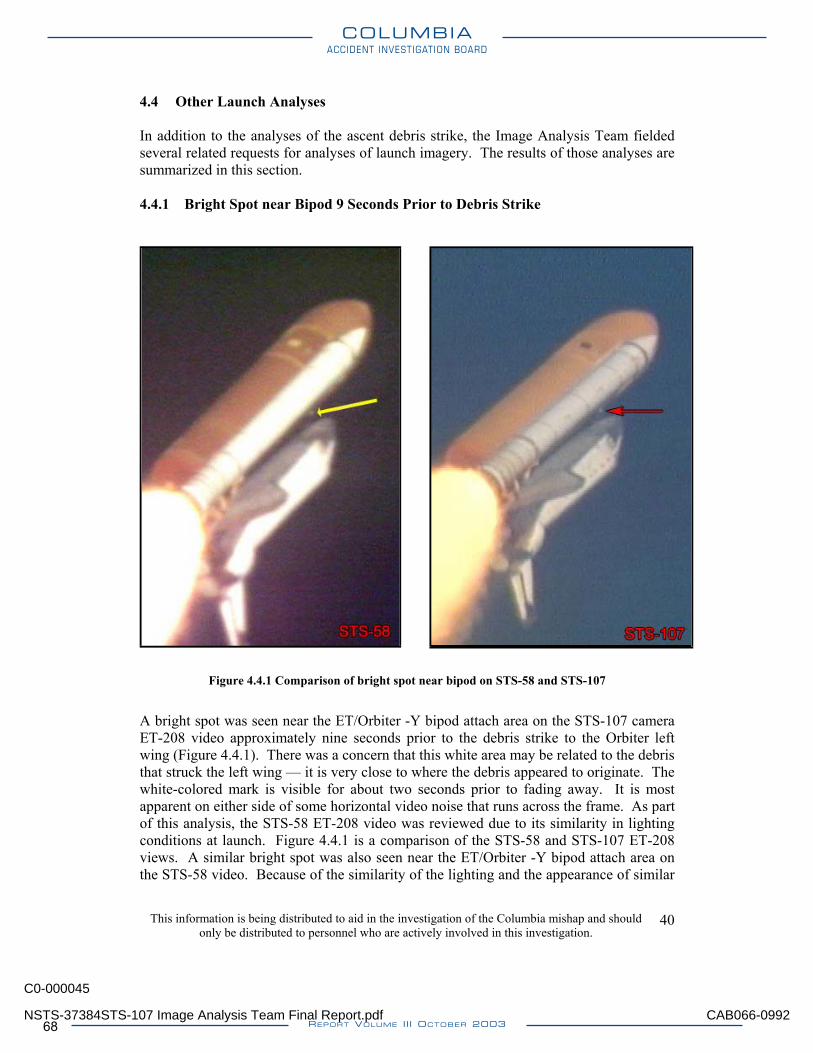
4.4 Other Launch Analyses In addition to the analyses of the ascent debris strike, the Image Analysis Team fielded several related requests for analyses of launch imagery. The results of those analyses are summarized in this section. 4.4.1 Bright Spot near Bipod 9 Seconds Prior to Debris Strike
Figure 4.4.1 Comparison of bright spot near bipod on STS-58 and STS-107
A bright spot was seen near the ET/Orbiter -Y bipod attach area on the STS-107 camera ET-208 video approximately nine seconds prior to the debris strike to the Orbiter left wing (Figure 4.4.1). There was a concern that this white area may be related to the debris that struck the left wing — it is very close to where the debris appeared to originate. The white-colored mark is visible for about two seconds prior to fading away. It is most apparent on either side of some horizontal video noise that runs across the frame. As part of this analysis, the STS-58 ET-208 video was reviewed due to its similarity in lighting conditions at launch. Figure 4.4.1 is a comparison of the STS-58 and STS-107 ET-208 views. A similar bright spot was also seen near the ET/Orbiter -Y bipod attach area on the STS-58 video. Because of the similarity of the lighting and the appearance of similar
This information is being distributed to aid in the investigation of the Columbia mishap and should only be distributed to personnel who are actively involved in this investigation.
40
NSTS-37384STS-107 Image Analysis Team Final Report.pdf
C0-000045
CAB066-0992
COLUMBIAACCIDENT INVESTIGATION BOARD
REPORT VOLUME III OCTOBER 200368
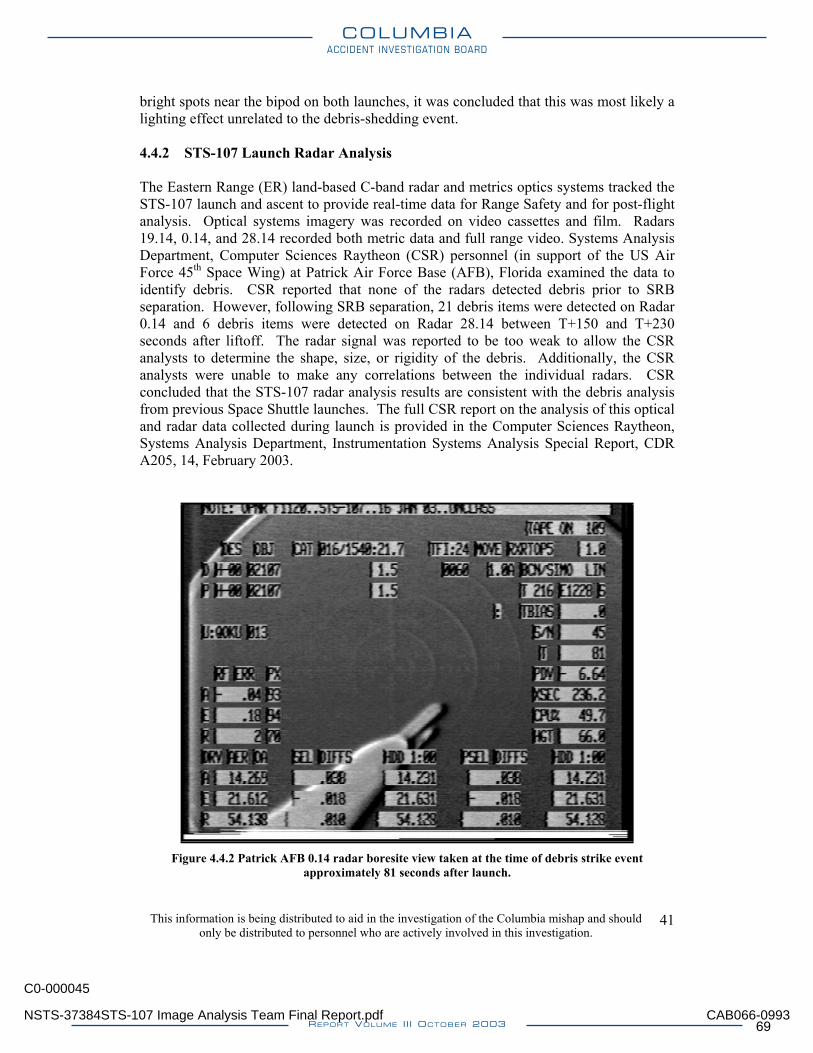
bright spots near the bipod on both launches, it was concluded that this was most likely a lighting effect unrelated to the debris-shedding event. 4.4.2 STS-107 Launch Radar Analysis The Eastern Range (ER) land-based C-band radar and metrics optics systems tracked the STS-107 launch and ascent to provide real-time data for Range Safety and for post-flight analysis. Optical systems imagery was recorded on video cassettes and film. Radars 19.14, 0.14, and 28.14 recorded both metric data and full range video. Systems Analysis Department, Computer Sciences Raytheon (CSR) personnel (in support of the US Air Force 45th Space Wing) at Patrick Air Force Base (AFB), Florida examined the data to identify debris. CSR reported that none of the radars detected debris prior to SRB separation. However, following SRB separation, 21 debris items were detected on Radar 0.14 and 6 debris items were detected on Radar 28.14 between T+150 and T+230 seconds after liftoff. The radar signal was reported to be too weak to allow the CSR analysts to determine the shape, size, or rigidity of the debris. Additionally, the CSR analysts were unable to make any correlations between the individual radars. CSR concluded that the STS-107 radar analysis results are consistent with the debris analysis from previous Space Shuttle launches. The full CSR report on the analysis of this optical and radar data collected during launch is provided in the Computer Sciences Raytheon, Systems Analysis Department, Instrumentation Systems Analysis Special Report, CDR A205, 14, February 2003.
Figure 4.4.2 Patrick AFB 0.14 radar boresite view taken at the time of debris strike event
approximately 81 seconds after launch.
This information is being distributed to aid in the investigation of the Columbia mishap and should only be distributed to personnel who are actively involved in this investigation.
41
NSTS-37384STS-107 Image Analysis Team Final Report.pdf
C0-000045
CAB066-0993
COLUMBIAACCIDENT INVESTIGATION BOARD
REPORT VOLUME III OCTOBER 2003 69
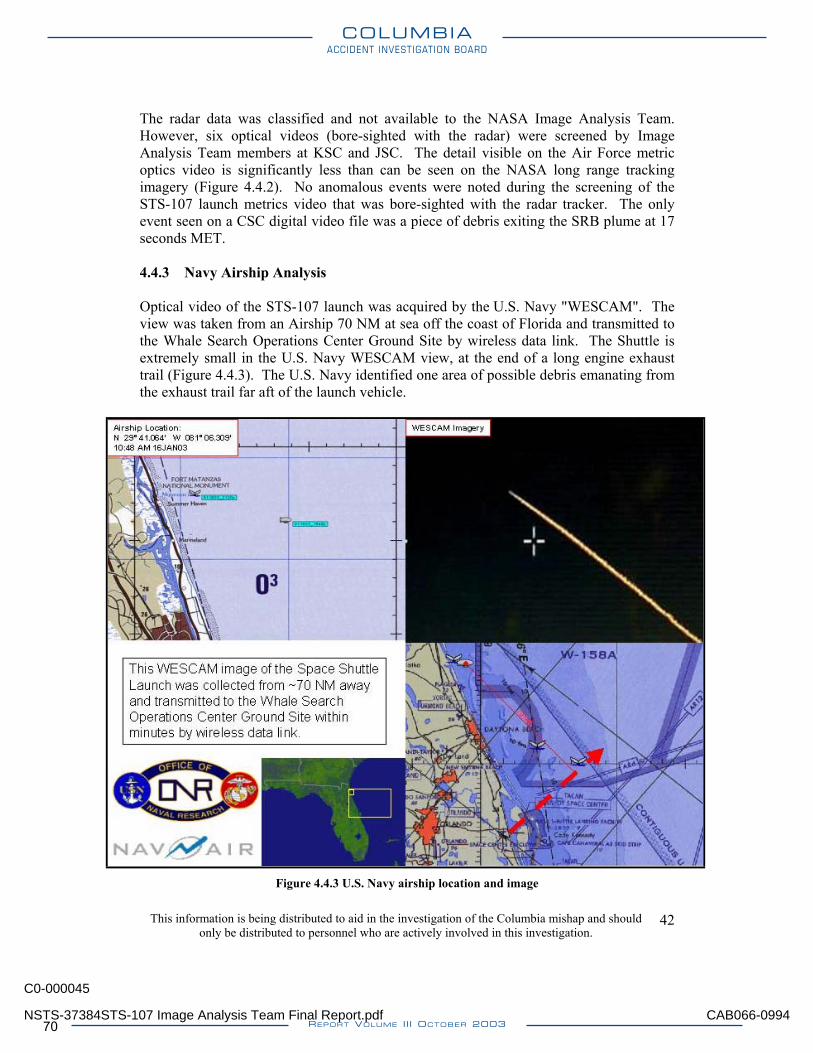
The radar data was classified and not available to the NASA Image Analysis Team. However, six optical videos (bore-sighted with the radar) were screened by Image Analysis Team members at KSC and JSC. The detail visible on the Air Force metric optics video is significantly less than can be seen on the NASA long range tracking imagery (Figure 4.4.2). No anomalous events were noted during the screening of the STS-107 launch metrics video that was bore-sighted with the radar tracker. The only event seen on a CSC digital video file was a piece of debris exiting the SRB plume at 17 seconds MET. 4.4.3 Navy Airship Analysis Optical video of the STS-107 launch was acquired by the U.S. Navy "WESCAM". The view was taken from an Airship 70 NM at sea off the coast of Florida and transmitted to the Whale Search Operations Center Ground Site by wireless data link. The Shuttle is extremely small in the U.S. Navy WESCAM view, at the end of a long engine exhaust trail (Figure 4.4.3). The U.S. Navy identified one area of possible debris emanating from the exhaust trail far aft of the launch vehicle.
Figure 4.4.3 U.S. Navy airship location and image
This information is being distributed to aid in the investigation of the Columbia mishap and should only be distributed to personnel who are actively involved in this investigation.
42
NSTS-37384STS-107 Image Analysis Team Final Report.pdf
C0-000045
CAB066-0994
COLUMBIAACCIDENT INVESTIGATION BOARD
REPORT VOLUME III OCTOBER 200370
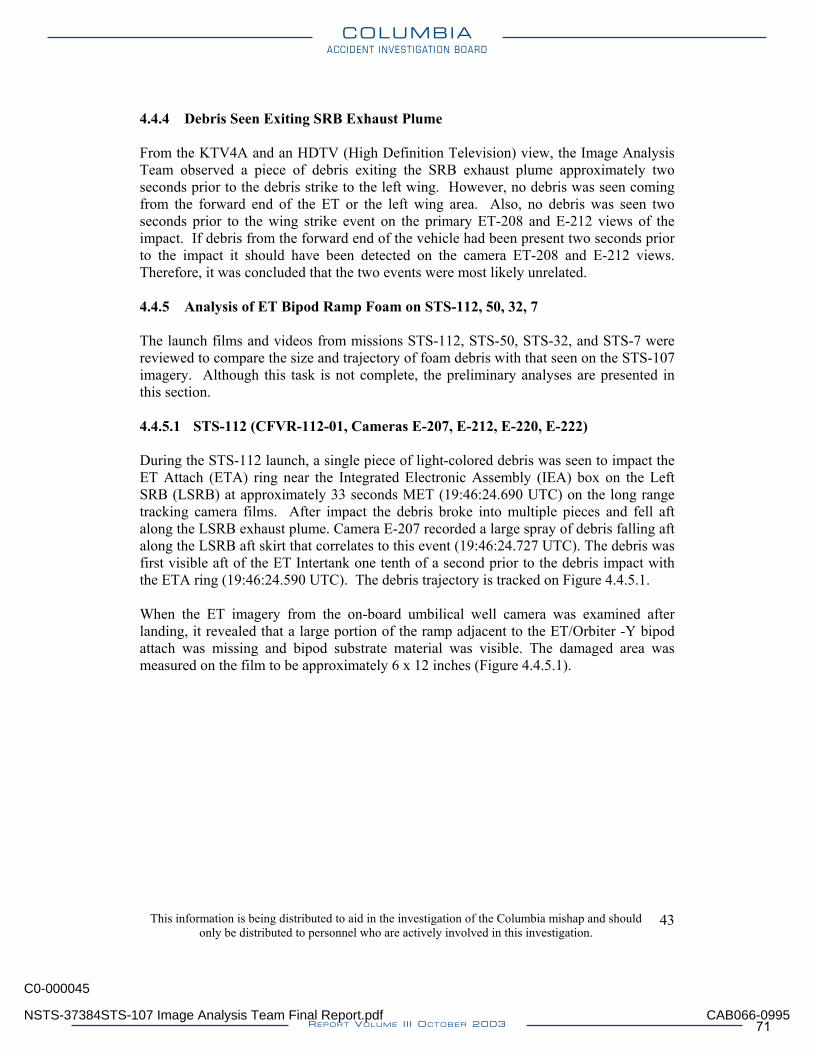
This information is being distributed to aid in the investigation of the Columbia mishap and should only be distributed to personnel who are actively involved in this investigation.
43
4.4.4 Debris Seen Exiting SRB Exhaust Plume From the KTV4A and an HDTV (High Definition Television) view, the Image Analysis Team observed a piece of debris exiting the SRB exhaust plume approximately two seconds prior to the debris strike to the left wing. However, no debris was seen coming from the forward end of the ET or the left wing area. Also, no debris was seen two seconds prior to the wing strike event on the primary ET-208 and E-212 views of the impact. If debris from the forward end of the vehicle had been present two seconds prior to the impact it should have been detected on the camera ET-208 and E-212 views. Therefore, it was concluded that the two events were most likely unrelated. 4.4.5 Analysis of ET Bipod Ramp Foam on STS-112, 50, 32, 7 The launch films and videos from missions STS-112, STS-50, STS-32, and STS-7 were reviewed to compare the size and trajectory of foam debris with that seen on the STS-107 imagery. Although this task is not complete, the preliminary analyses are presented in this section. 4.4.5.1 STS-112 (CFVR-112-01, Cameras E-207, E-212, E-220, E-222) During the STS-112 launch, a single piece of light-colored debris was seen to impact the ET Attach (ETA) ring near the Integrated Electronic Assembly (IEA) box on the Left SRB (LSRB) at approximately 33 seconds MET (19:46:24.690 UTC) on the long range tracking camera films. After impact the debris broke into multiple pieces and fell aft along the LSRB exhaust plume. Camera E-207 recorded a large spray of debris falling aft along the LSRB aft skirt that correlates to this event (19:46:24.727 UTC). The debris was first visible aft of the ET Intertank one tenth of a second prior to the debris impact with the ETA ring (19:46:24.590 UTC). The debris trajectory is tracked on Figure 4.4.5.1. When the ET imagery from the on-board umbilical well camera was examined after landing, it revealed that a large portion of the ramp adjacent to the ET/Orbiter -Y bipod attach was missing and bipod substrate material was visible. The damaged area was measured on the film to be approximately 6 x 12 inches (Figure 4.4.5.1).
NSTS-37384STS-107 Image Analysis Team Final Report.pdf
C0-000045
CAB066-0995
COLUMBIAACCIDENT INVESTIGATION BOARD
REPORT VOLUME III OCTOBER 2003 71
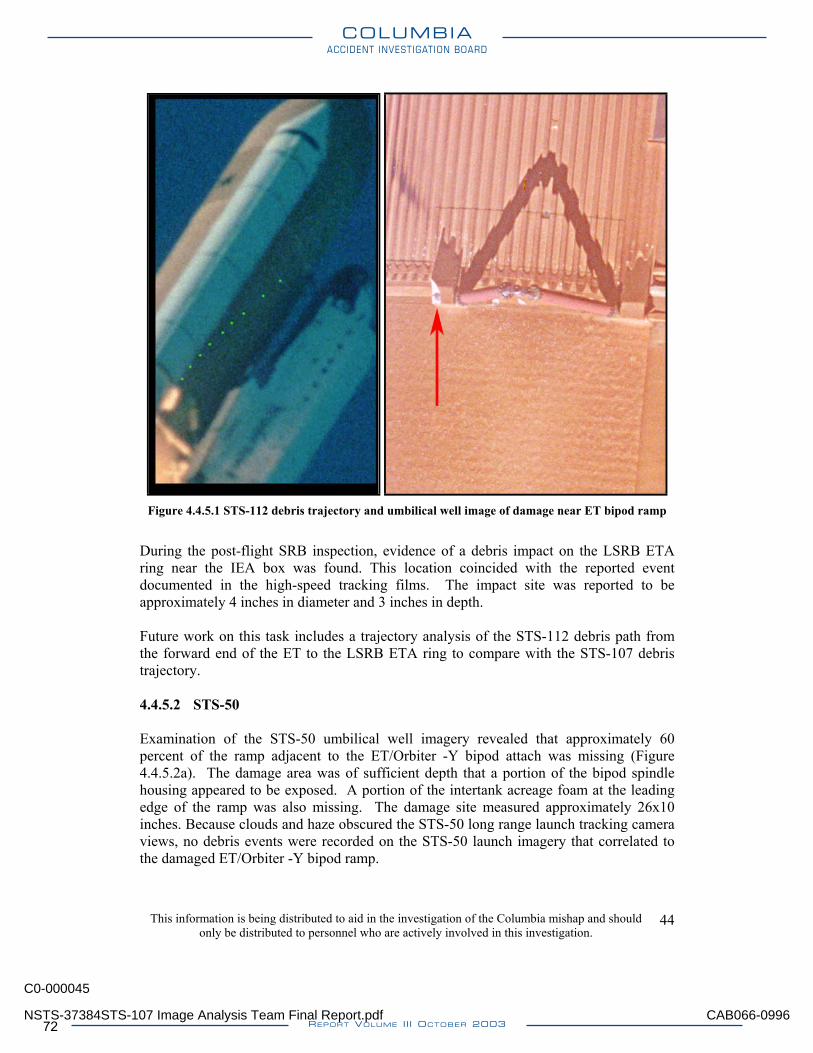
Figure 4.4.5.1 STS-112 debris trajectory and umbilical well image of damage near ET bipod ramp
During the post-flight SRB inspection, evidence of a debris impact on the LSRB ETA ring near the IEA box was found. This location coincided with the reported event documented in the high-speed tracking films. The impact site was reported to be approximately 4 inches in diameter and 3 inches in depth. Future work on this task includes a trajectory analysis of the STS-112 debris path from the forward end of the ET to the LSRB ETA ring to compare with the STS-107 debris trajectory. 4.4.5.2 STS-50 Examination of the STS-50 umbilical well imagery revealed that approximately 60 percent of the ramp adjacent to the ET/Orbiter -Y bipod attach was missing (Figure 4.4.5.2a). The damage area was of sufficient depth that a portion of the bipod spindle housing appeared to be exposed. A portion of the intertank acreage foam at the leading edge of the ramp was also missing. The damage site measured approximately 26x10 inches. Because clouds and haze obscured the STS-50 long range launch tracking camera views, no debris events were recorded on the STS-50 launch imagery that correlated to the damaged ET/Orbiter -Y bipod ramp.
This information is being distributed to aid in the investigation of the Columbia mishap and should only be distributed to personnel who are actively involved in this investigation.
44
NSTS-37384STS-107 Image Analysis Team Final Report.pdf
C0-000045
CAB066-0996
COLUMBIAACCIDENT INVESTIGATION BOARD
REPORT VOLUME III OCTOBER 200372
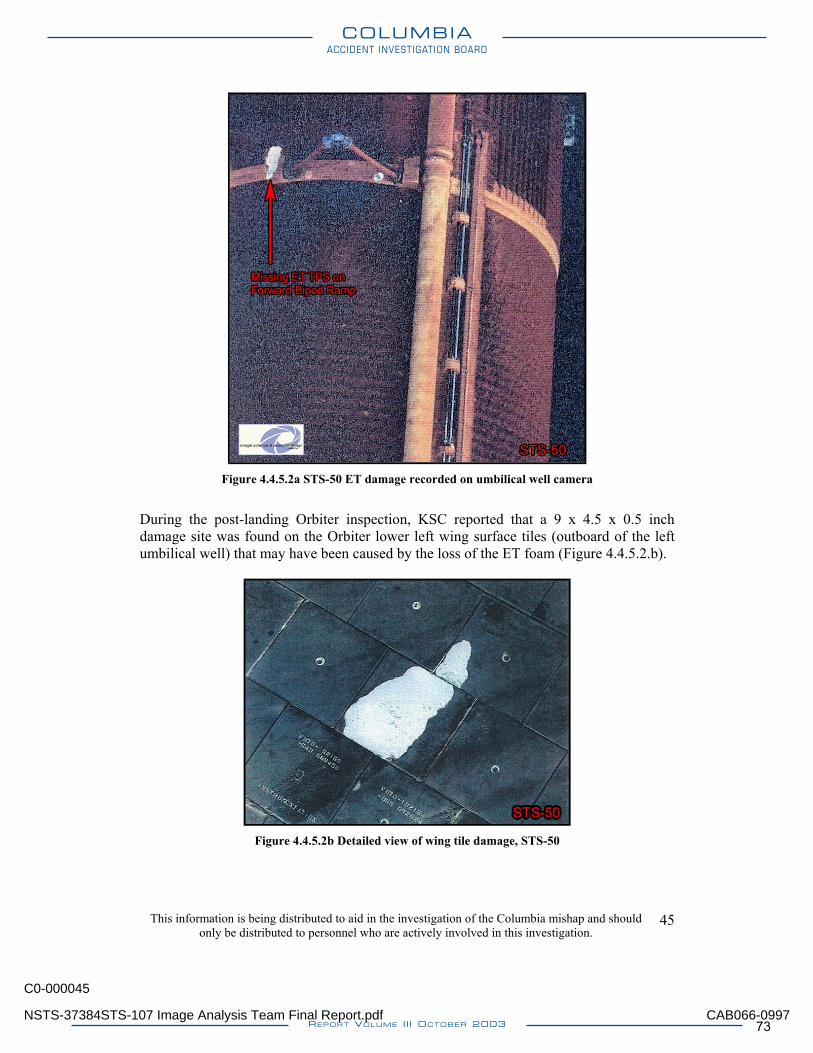
Figure 4.4.5.2a STS-50 ET damage recorded on umbilical well camera
During the post-landing Orbiter inspection, KSC reported that a 9 x 4.5 x 0.5 inch damage site was found on the Orbiter lower left wing surface tiles (outboard of the left umbilical well) that may have been caused by the loss of the ET foam (Figure 4.4.5.2.b).
Figure 4.4.5.2b Detailed view of wing tile damage, STS-50
This information is being distributed to aid in the investigation of the Columbia mishap and should only be distributed to personnel who are actively involved in this investigation.
45
NSTS-37384STS-107 Image Analysis Team Final Report.pdf
C0-000045
CAB066-0997
COLUMBIAACCIDENT INVESTIGATION BOARD
REPORT VOLUME III OCTOBER 2003 73
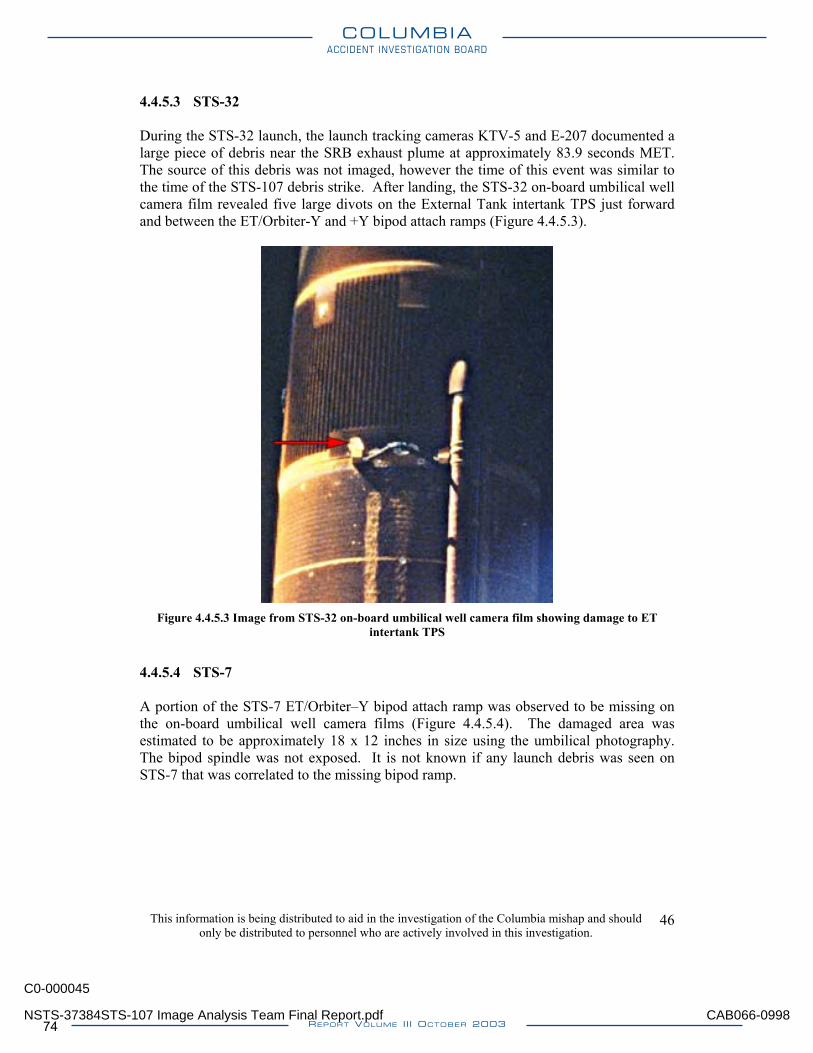
4.4.5.3 STS-32 During the STS-32 launch, the launch tracking cameras KTV-5 and E-207 documented a large piece of debris near the SRB exhaust plume at approximately 83.9 seconds MET. The source of this debris was not imaged, however the time of this event was similar to the time of the STS-107 debris strike. After landing, the STS-32 on-board umbilical well camera film revealed five large divots on the External Tank intertank TPS just forward and between the ET/Orbiter-Y and +Y bipod attach ramps (Figure 4.4.5.3).
Figure 4.4.5.3 Image from STS-32 on-board umbilical well camera film showing damage to ET
intertank TPS
4.4.5.4 STS-7 A portion of the STS-7 ET/Orbiter–Y bipod attach ramp was observed to be missing on the on-board umbilical well camera films (Figure 4.4.5.4). The damaged area was estimated to be approximately 18 x 12 inches in size using the umbilical photography. The bipod spindle was not exposed. It is not known if any launch debris was seen on STS-7 that was correlated to the missing bipod ramp.
This information is being distributed to aid in the investigation of the Columbia mishap and should only be distributed to personnel who are actively involved in this investigation.
46
NSTS-37384STS-107 Image Analysis Team Final Report.pdf
C0-000045
CAB066-0998
COLUMBIAACCIDENT INVESTIGATION BOARD
REPORT VOLUME III OCTOBER 200374
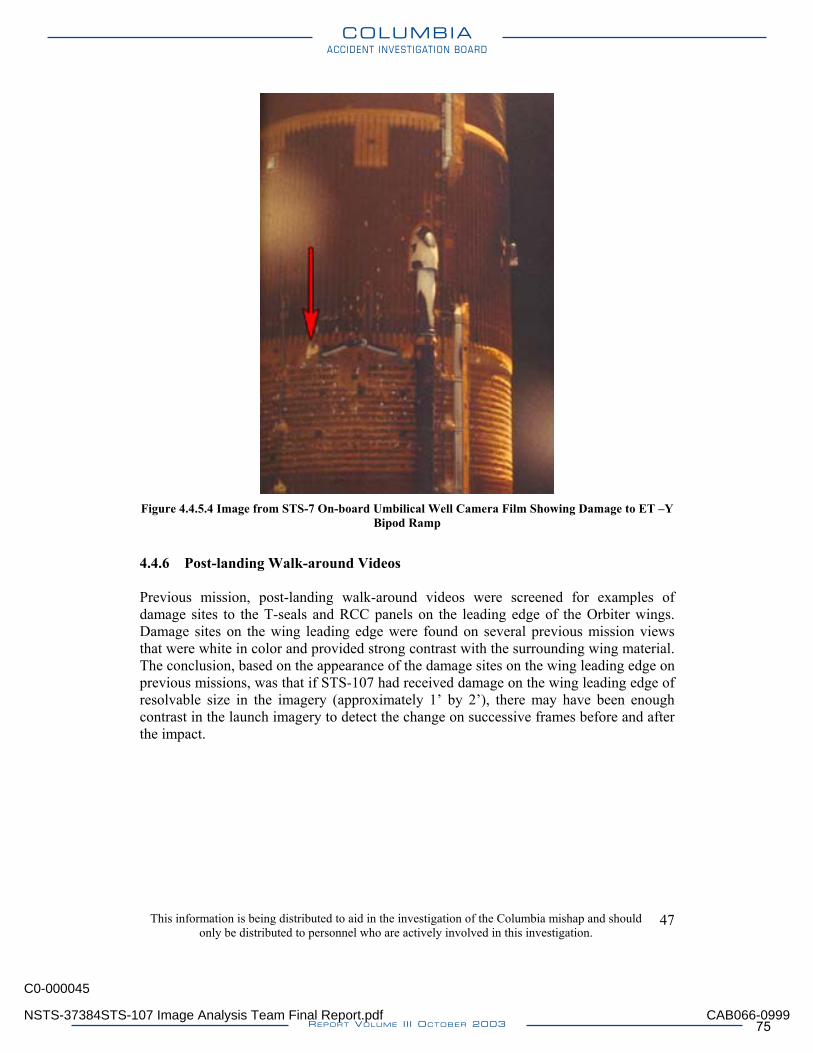
Figure 4.4.5.4 Image from STS-7 On-board Umbilical Well Camera Film Showing Damage to ET –Y
Bipod Ramp
4.4.6 Post-landing Walk-around Videos Previous mission, post-landing walk-around videos were screened for examples of damage sites to the T-seals and RCC panels on the leading edge of the Orbiter wings. Damage sites on the wing leading edge were found on several previous mission views that were white in color and provided strong contrast with the surrounding wing material. The conclusion, based on the appearance of the damage sites on the wing leading edge on previous missions, was that if STS-107 had received damage on the wing leading edge of resolvable size in the imagery (approximately 1’ by 2’), there may have been enough contrast in the launch imagery to detect the change on successive frames before and after the impact.
This information is being distributed to aid in the investigation of the Columbia mishap and should only be distributed to personnel who are actively involved in this investigation.
47
NSTS-37384STS-107 Image Analysis Team Final Report.pdf
C0-000045
CAB066-0999
COLUMBIAACCIDENT INVESTIGATION BOARD
REPORT VOLUME III OCTOBER 2003 75
5.0 On-orbit Analyses The Image Analysis Team screened all imagery downlinked during the STS-107 mission and recovered on the ground. A few pieces of debris near the Orbiter were observed in the downlinked video taken during orbit. The debris were analyzed, and interpreted to be pieces of ice. Imagery taken from the Orbiter viewed the top of the wing and the RCC panels (above the stagnation point) except for areas of the wing that were either outside of the field-of-view or obscured. The team detected no visible damage or anomalies on the left wing from any of the STS-107 on-orbit camera imagery. 5.1 On-orbit Imagery Data Sources The data sources for on-orbit imagery were:
• Video downlink from the Orbiter Payload Bay cameras • Video downlink from in-cabin camcorders • Electronic still imagery from the in-cabin Kodak DCS-760 digital cameras • On-board film recovered from the East Texas debris field, including experiment
and Earth Observations imagery • Closeout imagery from pre-launch imagery surveys of the Orbiter
5.2 Process/Methods for Analysis Many of the same methods that were employed for the launch imagery analyses were also used for the on-orbit analysis. Most of the analyses involved enhancements of the on-orbit imagery for comparison with pre-flight closeout photography. Image enhancement methods included simple intensity contrast stretching and sharpening using unsharp masking. More sophisticated image enhancements were generally not required for the on-orbit imagery. The imagery was of sufficient quality to make adequate comparisons with the closeout photography to assess if any damage or anomalies were visible. 5.3 On-orbit Analyses Several analyses of on-orbit imagery were conducted as part of the STS-107 mishap investigation. Shuttle crew members commonly observe pieces of debris in the vicinity of the Orbiter after the Payload Bay Doors open, and the STS-107 crew documented a few such pieces of debris on the first day of the mission. Also, although much of the left wing was outside the camera viewing fields, the Image Analysis Team examined all potentially anomalous aspects of Columbia’s left wing. Finally, downlinked imagery of the ET was reviewed. Summaries of significant analyses are presented below.
This information is being distributed to aid in the investigation of the Columbia mishap and should only be distributed to personnel who are actively involved in this investigation.
48
NSTS-37384STS-107 Image Analysis Team Final Report.pdf
C0-000045
CAB066-1000
COLUMBIAACCIDENT INVESTIGATION BOARD
REPORT VOLUME III OCTOBER 200376
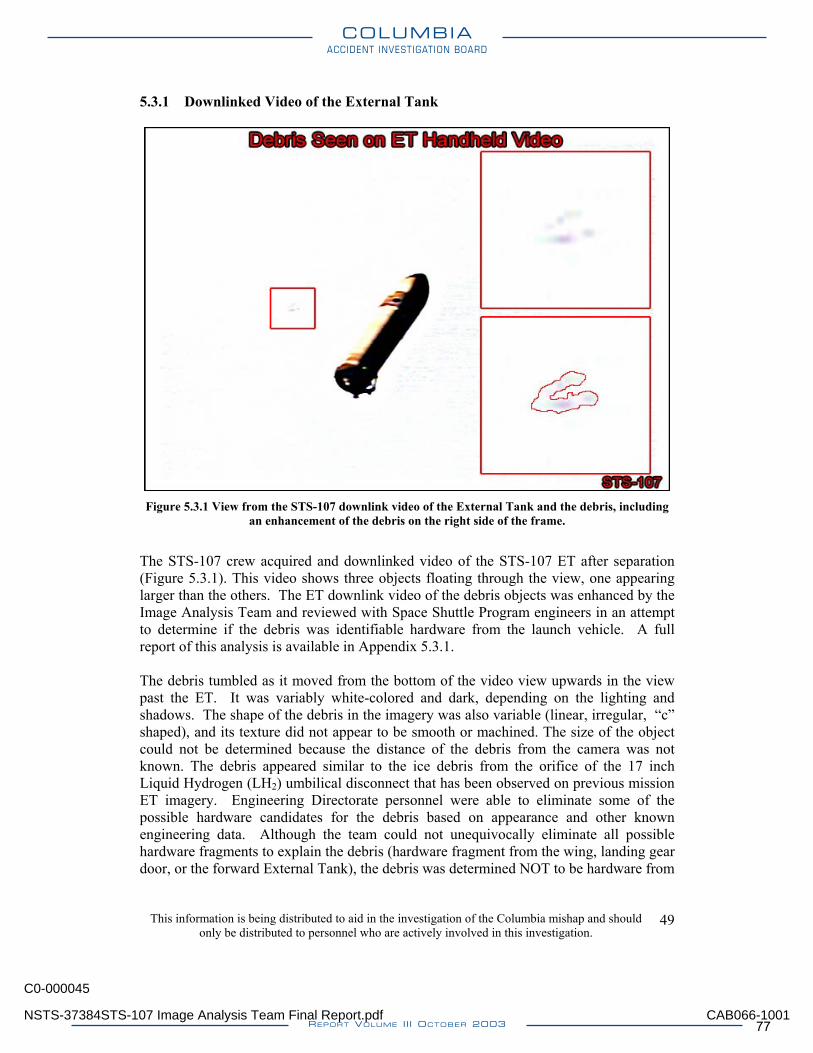
5.3.1 Downlinked Video of the External Tank
Figure 5.3.1 View from the STS-107 downlink video of the External Tank and the debris, including
an enhancement of the debris on the right side of the frame.
The STS-107 crew acquired and downlinked video of the STS-107 ET after separation (Figure 5.3.1). This video shows three objects floating through the view, one appearing larger than the others. The ET downlink video of the debris objects was enhanced by the Image Analysis Team and reviewed with Space Shuttle Program engineers in an attempt to determine if the debris was identifiable hardware from the launch vehicle. A full report of this analysis is available in Appendix 5.3.1. The debris tumbled as it moved from the bottom of the video view upwards in the view past the ET. It was variably white-colored and dark, depending on the lighting and shadows. The shape of the debris in the imagery was also variable (linear, irregular, “c” shaped), and its texture did not appear to be smooth or machined. The size of the object could not be determined because the distance of the debris from the camera was not known. The debris appeared similar to the ice debris from the orifice of the 17 inch Liquid Hydrogen (LH2) umbilical disconnect that has been observed on previous mission ET imagery. Engineering Directorate personnel were able to eliminate some of the possible hardware candidates for the debris based on appearance and other known engineering data. Although the team could not unequivocally eliminate all possible hardware fragments to explain the debris (hardware fragment from the wing, landing gear door, or the forward External Tank), the debris was determined NOT to be hardware from
This information is being distributed to aid in the investigation of the Columbia mishap and should only be distributed to personnel who are actively involved in this investigation.
49
NSTS-37384STS-107 Image Analysis Team Final Report.pdf
C0-000045
CAB066-1001
COLUMBIAACCIDENT INVESTIGATION BOARD
REPORT VOLUME III OCTOBER 2003 77
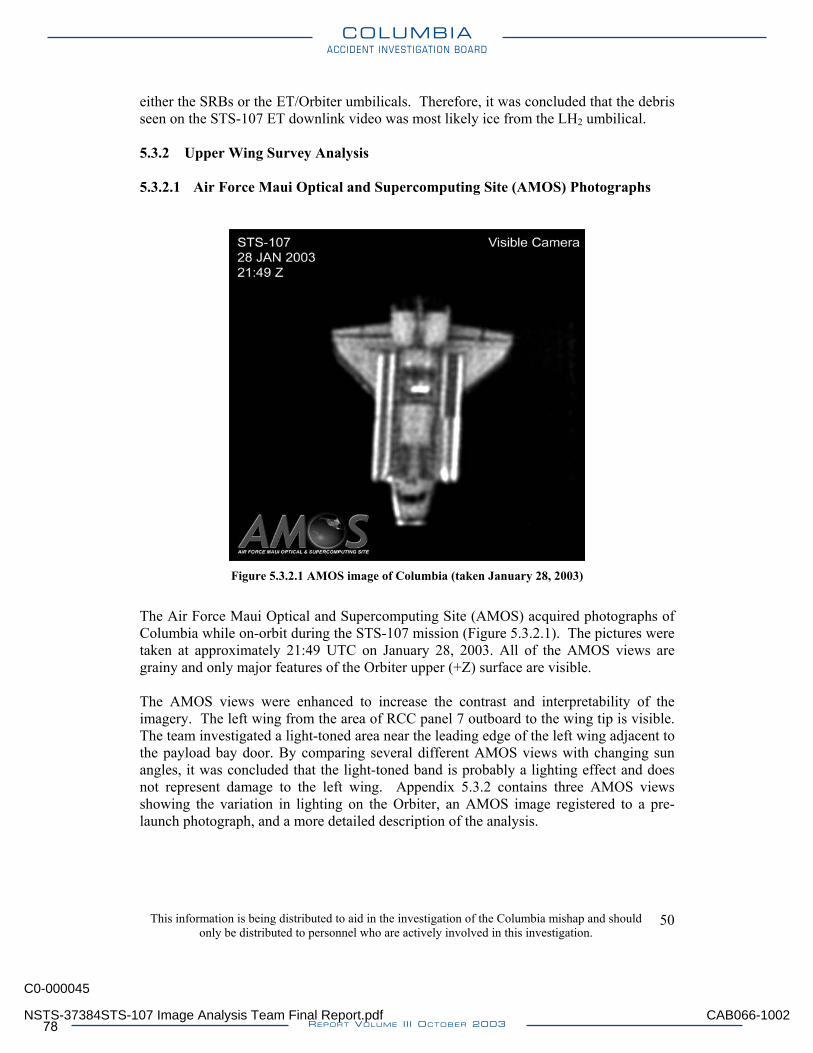
either the SRBs or the ET/Orbiter umbilicals. Therefore, it was concluded that the debris seen on the STS-107 ET downlink video was most likely ice from the LH2 umbilical. 5.3.2 Upper Wing Survey Analysis 5.3.2.1 Air Force Maui Optical and Supercomputing Site (AMOS) Photographs
Figure 5.3.2.1 AMOS image of Columbia (taken January 28, 2003)
The Air Force Maui Optical and Supercomputing Site (AMOS) acquired photographs of Columbia while on-orbit during the STS-107 mission (Figure 5.3.2.1). The pictures were taken at approximately 21:49 UTC on January 28, 2003. All of the AMOS views are grainy and only major features of the Orbiter upper (+Z) surface are visible. The AMOS views were enhanced to increase the contrast and interpretability of the imagery. The left wing from the area of RCC panel 7 outboard to the wing tip is visible. The team investigated a light-toned area near the leading edge of the left wing adjacent to the payload bay door. By comparing several different AMOS views with changing sun angles, it was concluded that the light-toned band is probably a lighting effect and does not represent damage to the left wing. Appendix 5.3.2 contains three AMOS views showing the variation in lighting on the Orbiter, an AMOS image registered to a pre-launch photograph, and a more detailed description of the analysis.
This information is being distributed to aid in the investigation of the Columbia mishap and should only be distributed to personnel who are actively involved in this investigation.
50
NSTS-37384STS-107 Image Analysis Team Final Report.pdf
C0-000045
CAB066-1002
COLUMBIAACCIDENT INVESTIGATION BOARD
REPORT VOLUME III OCTOBER 200378
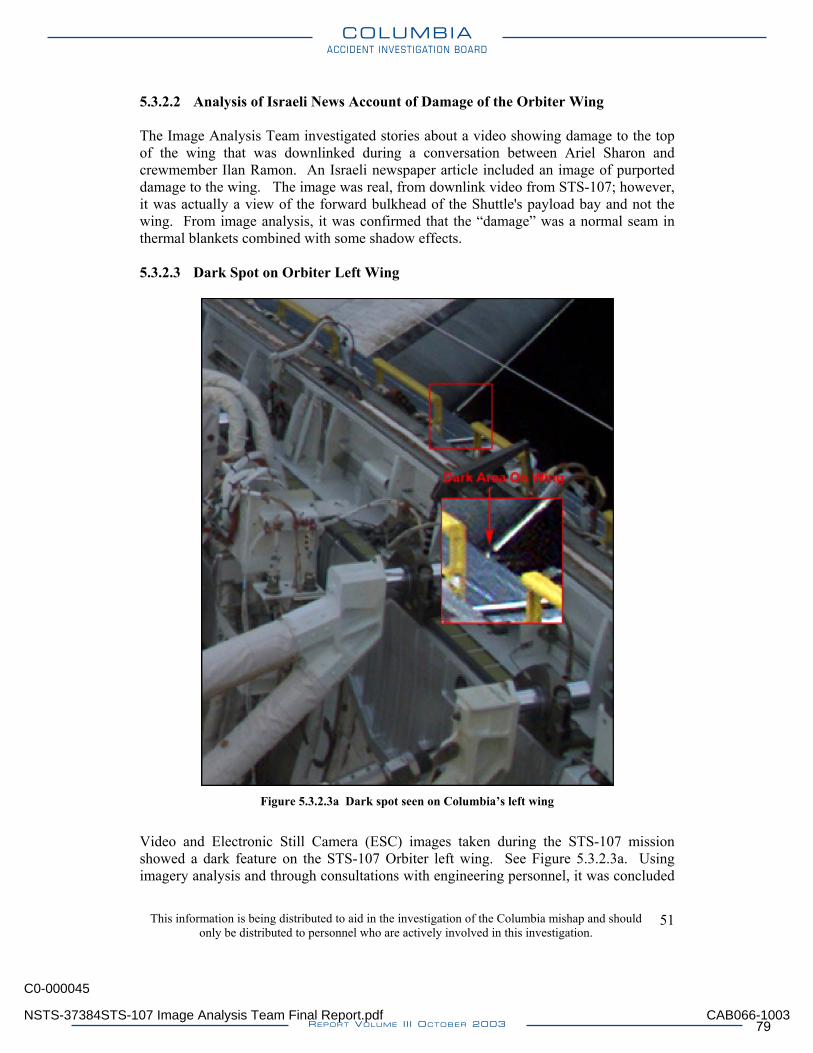
5.3.2.2 Analysis of Israeli News Account of Damage of the Orbiter Wing The Image Analysis Team investigated stories about a video showing damage to the top of the wing that was downlinked during a conversation between Ariel Sharon and crewmember Ilan Ramon. An Israeli newspaper article included an image of purported damage to the wing. The image was real, from downlink video from STS-107; however, it was actually a view of the forward bulkhead of the Shuttle's payload bay and not the wing. From image analysis, it was confirmed that the “damage” was a normal seam in thermal blankets combined with some shadow effects. 5.3.2.3 Dark Spot on Orbiter Left Wing
Figure 5.3.2.3a Dark spot seen on Columbia’s left wing
Video and Electronic Still Camera (ESC) images taken during the STS-107 mission showed a dark feature on the STS-107 Orbiter left wing. See Figure 5.3.2.3a. Using imagery analysis and through consultations with engineering personnel, it was concluded
This information is being distributed to aid in the investigation of the Columbia mishap and should only be distributed to personnel who are actively involved in this investigation.
51
NSTS-37384STS-107 Image Analysis Team Final Report.pdf
C0-000045
CAB066-1003
COLUMBIAACCIDENT INVESTIGATION BOARD
REPORT VOLUME III OCTOBER 2003 79
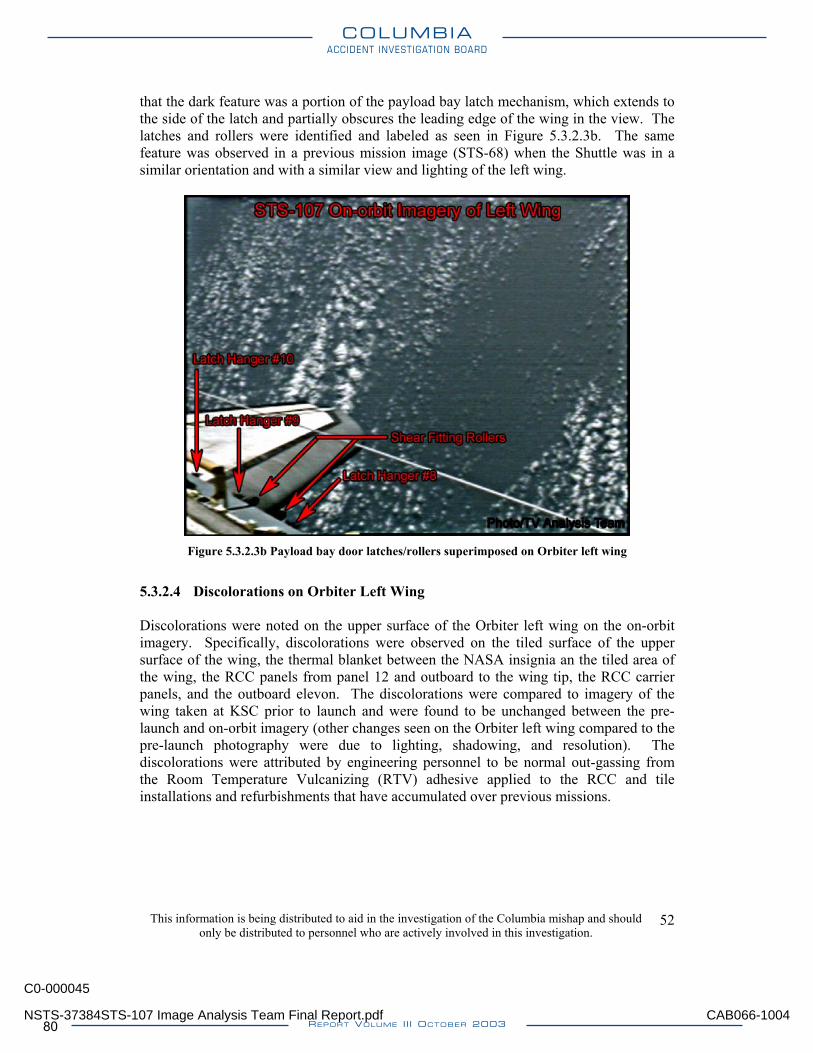
that the dark feature was a portion of the payload bay latch mechanism, which extends to the side of the latch and partially obscures the leading edge of the wing in the view. The latches and rollers were identified and labeled as seen in Figure 5.3.2.3b. The same feature was observed in a previous mission image (STS-68) when the Shuttle was in a similar orientation and with a similar view and lighting of the left wing.
Figure 5.3.2.3b Payload bay door latches/rollers superimposed on Orbiter left wing
5.3.2.4 Discolorations on Orbiter Left Wing Discolorations were noted on the upper surface of the Orbiter left wing on the on-orbit imagery. Specifically, discolorations were observed on the tiled surface of the upper surface of the wing, the thermal blanket between the NASA insignia an the tiled area of the wing, the RCC panels from panel 12 and outboard to the wing tip, the RCC carrier panels, and the outboard elevon. The discolorations were compared to imagery of the wing taken at KSC prior to launch and were found to be unchanged between the pre-launch and on-orbit imagery (other changes seen on the Orbiter left wing compared to the pre-launch photography were due to lighting, shadowing, and resolution). The discolorations were attributed by engineering personnel to be normal out-gassing from the Room Temperature Vulcanizing (RTV) adhesive applied to the RCC and tile installations and refurbishments that have accumulated over previous missions.
This information is being distributed to aid in the investigation of the Columbia mishap and should only be distributed to personnel who are actively involved in this investigation.
52
NSTS-37384STS-107 Image Analysis Team Final Report.pdf
C0-000045
CAB066-1004
COLUMBIAACCIDENT INVESTIGATION BOARD
REPORT VOLUME III OCTOBER 200380
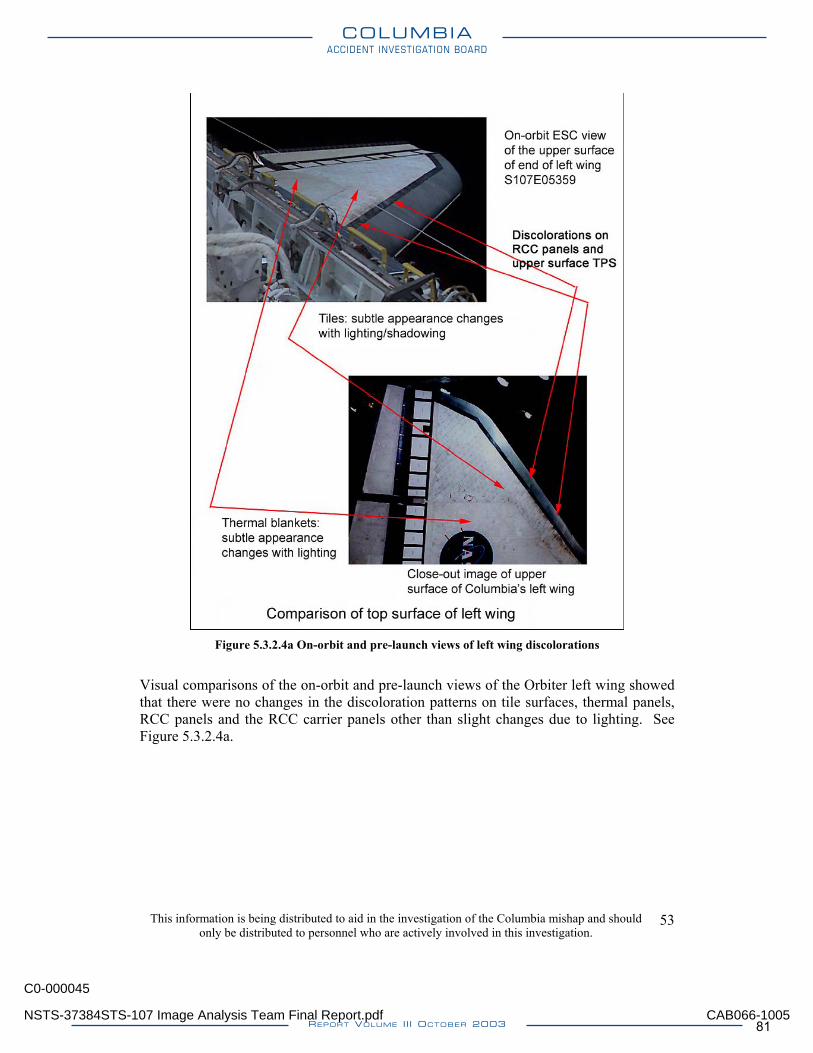
Figure 5.3.2.4a On-orbit and pre-launch views of left wing discolorations
Visual comparisons of the on-orbit and pre-launch views of the Orbiter left wing showed that there were no changes in the discoloration patterns on tile surfaces, thermal panels, RCC panels and the RCC carrier panels other than slight changes due to lighting. See Figure 5.3.2.4a.
This information is being distributed to aid in the investigation of the Columbia mishap and should only be distributed to personnel who are actively involved in this investigation.
53
NSTS-37384STS-107 Image Analysis Team Final Report.pdf
C0-000045
CAB066-1005
COLUMBIAACCIDENT INVESTIGATION BOARD
REPORT VOLUME III OCTOBER 2003 81
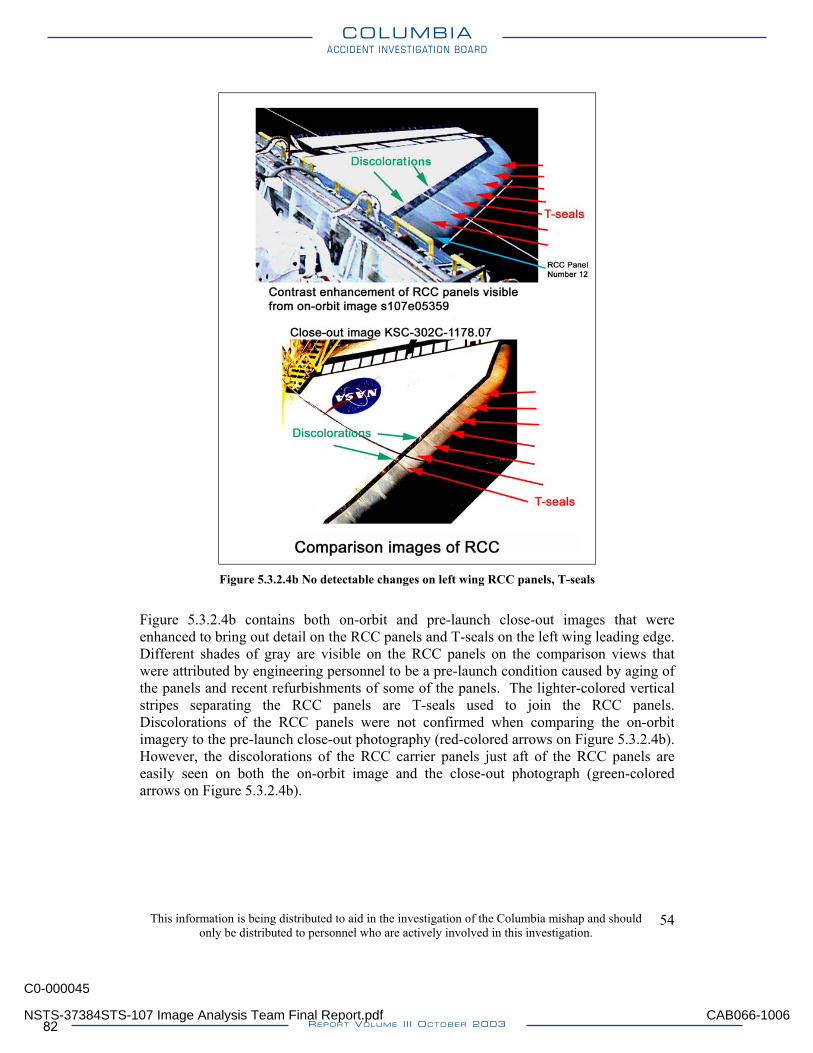
Figure 5.3.2.4b No detectable changes on left wing RCC panels, T-seals
Figure 5.3.2.4b contains both on-orbit and pre-launch close-out images that were enhanced to bring out detail on the RCC panels and T-seals on the left wing leading edge. Different shades of gray are visible on the RCC panels on the comparison views that were attributed by engineering personnel to be a pre-launch condition caused by aging of the panels and recent refurbishments of some of the panels. The lighter-colored vertical stripes separating the RCC panels are T-seals used to join the RCC panels. Discolorations of the RCC panels were not confirmed when comparing the on-orbit imagery to the pre-launch close-out photography (red-colored arrows on Figure 5.3.2.4b). However, the discolorations of the RCC carrier panels just aft of the RCC panels are easily seen on both the on-orbit image and the close-out photograph (green-colored arrows on Figure 5.3.2.4b).
This information is being distributed to aid in the investigation of the Columbia mishap and should only be distributed to personnel who are actively involved in this investigation.
54
NSTS-37384STS-107 Image Analysis Team Final Report.pdf
C0-000045
CAB066-1006
COLUMBIAACCIDENT INVESTIGATION BOARD
REPORT VOLUME III OCTOBER 200382
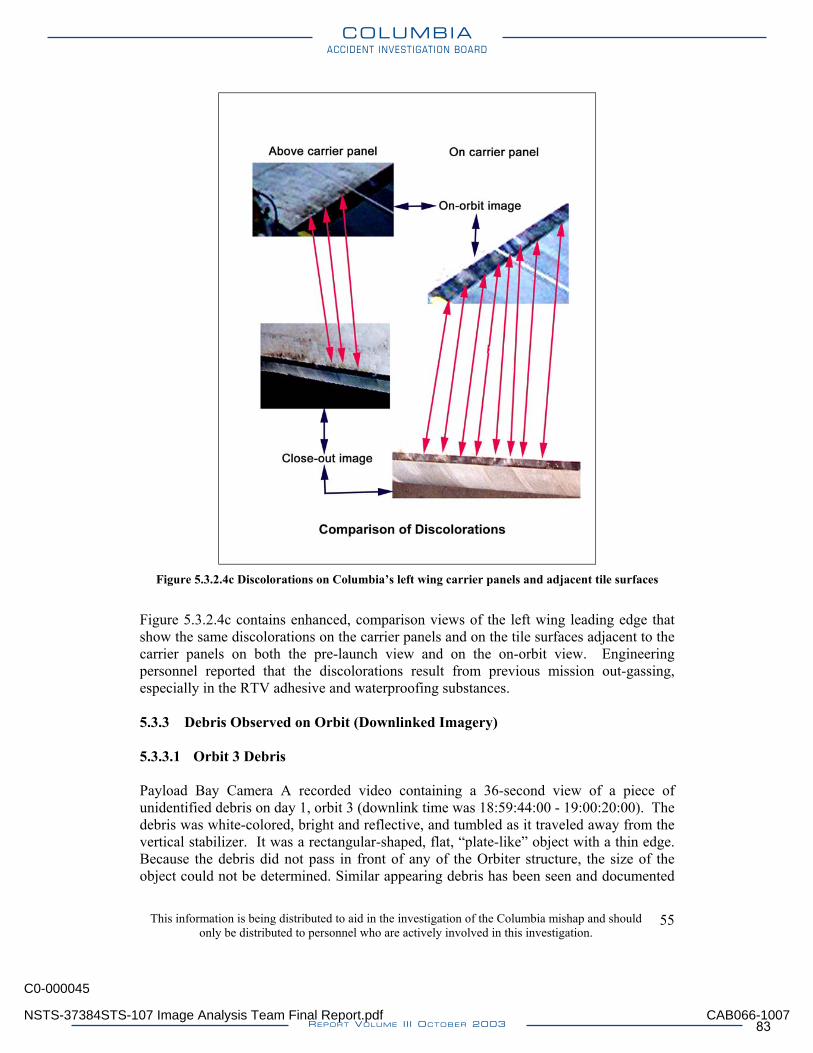
Figure 5.3.2.4c Discolorations on Columbia’s left wing carrier panels and adjacent tile surfaces
Figure 5.3.2.4c contains enhanced, comparison views of the left wing leading edge that show the same discolorations on the carrier panels and on the tile surfaces adjacent to the carrier panels on both the pre-launch view and on the on-orbit view. Engineering personnel reported that the discolorations result from previous mission out-gassing, especially in the RTV adhesive and waterproofing substances. 5.3.3 Debris Observed on Orbit (Downlinked Imagery) 5.3.3.1 Orbit 3 Debris Payload Bay Camera A recorded video containing a 36-second view of a piece of unidentified debris on day 1, orbit 3 (downlink time was 18:59:44:00 - 19:00:20:00). The debris was white-colored, bright and reflective, and tumbled as it traveled away from the vertical stabilizer. It was a rectangular-shaped, flat, “plate-like” object with a thin edge. Because the debris did not pass in front of any of the Orbiter structure, the size of the object could not be determined. Similar appearing debris has been seen and documented
This information is being distributed to aid in the investigation of the Columbia mishap and should only be distributed to personnel who are actively involved in this investigation.
55
NSTS-37384STS-107 Image Analysis Team Final Report.pdf
C0-000045
CAB066-1007
COLUMBIAACCIDENT INVESTIGATION BOARD
REPORT VOLUME III OCTOBER 2003 83
on previous mission payload bay camera views. KSC payload bay close-out engineers reported that it is possible that the debris was a piece of blanket material from inside the payload bay or from the SpaceHab module. 5.3.3.2 Orbit 5 Debris Downlinked video obtained from a Shuttle payload bay camera during orbit 5 showed a bright circular shaped object moving in a generally vertical direction in the image and apparently away from the Orbiter. During the time that the debris was observed the primary debris appeared to eject a small piece of debris. The Image Analysis Team performed an extensive analysis of this object and concluded that the debris was probably ice that dislodged from within the payload bay. Appendix 5.3.3 contains the details of the analysis. No other Orbiter hardware was in the field of view for reference, so scaling the object was impossible, and no size or velocity measurements could be made. 5.3.4 Insulation on Ku-band Antenna The Image Analysis Team attempted to verify whether or not the thermal blankets on the Ku-band antenna dish were in place during the mission to address a concern that a detached thermal blanket could have been the object seen by radar on flight day 2. Due to the poor quality of the available imagery, it could not be conclusively determined if the insulation was still in place, but the imagery analyses indicated that it probably was.
This information is being distributed to aid in the investigation of the Columbia mishap and should only be distributed to personnel who are actively involved in this investigation.
56
NSTS-37384STS-107 Image Analysis Team Final Report.pdf
C0-000045
CAB066-1008
COLUMBIAACCIDENT INVESTIGATION BOARD
REPORT VOLUME III OCTOBER 200384
6.0 Re-Entry Analyses Immediately after the accident, NASA was inundated with information from the public on their observations of re-entry. Information submitted included verbal descriptions of observations, digital files of still images and video, videotapes, and still photographs (prints, slides, and negatives). The Image Analysis Team reviewed and prioritized all the re-entry information, identified the pieces most likely to contribute to the investigation, and then conducted the primary analyses. The analyses included extracting any quantitative data and converting it to a form that would provide insights into problems occurring during re-entry. The primary useful data sources that emerged were a small subset of 25 key video tapes showing debris coming off the Orbiter as it entered over the western United States. Twenty-four anomalous events were documented as the Orbiter passed from California to Texas. Detailed analysis of late breakup events over Texas is still in work and will be reported separately. Throughout the process, close cooperation was required with personnel from JSC-Mission Operations Directorate (Flight Design and Dynamics, and Systems Divisions) and the Early Sightings Assessment Team. In addition, team members with the appropriate knowledge base for gleaning technical information from the non-technical data sources joined the team, including JSC-Orbital Debris, KSC-Applied Physics Lab, MSFC-Space Environments, and ARC-Reacting Flow Environments Branch. Three main efforts for analyzing re-entry imagery emerged during the investigation and were handled by three matrixed groups within the Image Analysis Team. The first effort from the Timeline Group focused on creating a database of imagery information and connecting the information to absolute time references. The resulting “Debris Event Timeline” product was integrated into the Orbiter Vehicle Engineering Working Group (OVEWG) configuration controlled “Data Review & Timeline”. Also from the timeline activity, key cameras were identified and acquired from the public for calibration of field-of-view, point spread function, signal response, noise characteristics, and other parameters relevant to subsequent analyses. A second group, the Debris Motion Tracking Group, performed detailed video analysis to characterize the relative motion of the key debris events compared to the motion of the Orbiter. This relative motion data was provided to the Early Sightings Assessment Team who applied it to determine ballistic numbers, and identify possible areas in the western United States where debris might be found on the ground. The third group, the Luminosity Working Group, measured the luminous intensities of the Orbiter and debris in the videos, and developed models of the physics of debris re-entry that could be used to estimate the masses for the debris. The mass estimates were provided to various teams for use in developing the consolidated re-entry scenario.
This information is being distributed to aid in the investigation of the Columbia mishap and should only be distributed to personnel who are actively involved in this investigation.
57
NSTS-37384STS-107 Image Analysis Team Final Report.pdf
C0-000045
CAB066-1009
COLUMBIAACCIDENT INVESTIGATION BOARD
REPORT VOLUME III OCTOBER 2003 85
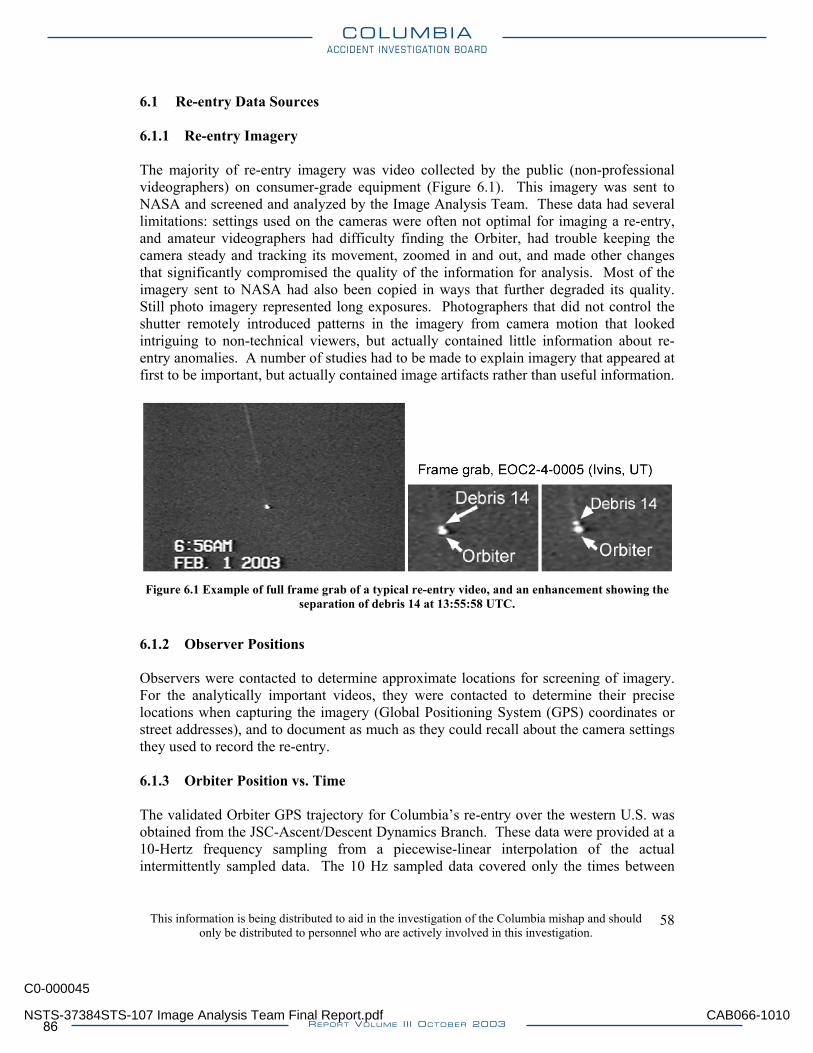
6.1 Re-entry Data Sources 6.1.1 Re-entry Imagery The majority of re-entry imagery was video collected by the public (non-professional videographers) on consumer-grade equipment (Figure 6.1). This imagery was sent to NASA and screened and analyzed by the Image Analysis Team. These data had several limitations: settings used on the cameras were often not optimal for imaging a re-entry, and amateur videographers had difficulty finding the Orbiter, had trouble keeping the camera steady and tracking its movement, zoomed in and out, and made other changes that significantly compromised the quality of the information for analysis. Most of the imagery sent to NASA had also been copied in ways that further degraded its quality. Still photo imagery represented long exposures. Photographers that did not control the shutter remotely introduced patterns in the imagery from camera motion that looked intriguing to non-technical viewers, but actually contained little information about re-entry anomalies. A number of studies had to be made to explain imagery that appeared at first to be important, but actually contained image artifacts rather than useful information.
Figure 6.1 Example of full frame grab of a typical re-entry video, and an enhancement showing the
separation of debris 14 at 13:55:58 UTC.
6.1.2 Observer Positions Observers were contacted to determine approximate locations for screening of imagery. For the analytically important videos, they were contacted to determine their precise locations when capturing the imagery (Global Positioning System (GPS) coordinates or street addresses), and to document as much as they could recall about the camera settings they used to record the re-entry. 6.1.3 Orbiter Position vs. Time The validated Orbiter GPS trajectory for Columbia’s re-entry over the western U.S. was obtained from the JSC-Ascent/Descent Dynamics Branch. These data were provided at a 10-Hertz frequency sampling from a piecewise-linear interpolation of the actual intermittently sampled data. The 10 Hz sampled data covered only the times between
This information is being distributed to aid in the investigation of the Columbia mishap and should only be distributed to personnel who are actively involved in this investigation.
58
NSTS-37384STS-107 Image Analysis Team Final Report.pdf
C0-000045
CAB066-1010
COLUMBIAACCIDENT INVESTIGATION BOARD
REPORT VOLUME III OCTOBER 200386
UTC 13:53:00.00 and 13:58:00.00 on February 1, 2003. A projected trajectory generated by the Ascent/Descent Branch was used for times after 13:58 UTC. 6.1.4 Nominal Re-entries from Previous Missions Videos and still images of re-entries from previous missions were obtained for comparative analysis. In several cases the videographers of analytically important videos also provided video of previous re-entries. 6.1.5 Celestial References Several software packages were used to identify and correlate celestial fields seen in the videos. A commercial program, TOPO USA, converted observer locations (street addresses) to latitudes and longitudes and altitude. These data were input into celestial reference programs. Skywatch is a Java-based celestial acquisition program developed by the Flight Design and Dynamics Division, and was used for initial time synchronization. Supersighter is a celestial acquisition program certified for operational use in the Mission Control Center for the STS and International Space Station (ISS) Programs. Sky, a commercial program, was used to determine identities and magnitudes of celestial objects seen in the videos. 6.2 Re-entry Processes/Methods 6.2.1 Processing of Submissions Most imagery submitted by the public was delivered to the Emergency Operations Center (EOC). The Early Sightings Assessment Team (ESAT) pre-screened the submissions and then hand-carried items to the Mission Video Lab (videos) or Digital Imaging Lab (for still images). The ESAT Final Report contains details of the process. 6.2.2 Video Processes 6.2.2.1 Duplication for Screening The Mission Video lab duplicated the tapes received each day and delivered copies to the Image Analysis Team, Early Sightings Assessment Team, and other NASA Centers. The Image Analysis team received this screening tape in D2 digital format. All videos that were digitally acquired were also delivered to us in DVCam format. The Mission Video Lab maintains tape duplication and archive records. Video quality The D2 copy of the original submission was of sufficient quality for the timelining group and relative motion analysis. The luminosity team required best quality duplication from original material. Original tapes were obtained from the submitters for all analytically important videos in order to make the best possible quantitative measurements. These tapes were duplicated to DVCam format under our supervision to insure that the
This information is being distributed to aid in the investigation of the Columbia mishap and should only be distributed to personnel who are actively involved in this investigation.
59
NSTS-37384STS-107 Image Analysis Team Final Report.pdf
C0-000045
CAB066-1011
COLUMBIAACCIDENT INVESTIGATION BOARD
REPORT VOLUME III OCTOBER 2003 87
duplicating system configuration maintained the best quality. Then the DVCam was cloned, and the clone used for JSC analysis. The DVCam clone was also converted to Digital8 format for use by MSFC team members. Details of tape duplication and video quality are tracked in the “Entry Video and Still Database” (http://vdas-huey.jsc.nasa.gov/Contingency/107/web/) and in the document Appendix 6.2A. 6.2.2.2 Time Synchronization Time code standardization In order to maintain a standard time code that would be accurate within 1/60th of a second on repeat viewings, a digital copy of each D2 with the SMPTE (Society of Motion Picture and Television Engineers) time code standard embedded into the video image was made and used for timing video events. Relating SMPTE time to UTC time A variety of techniques were used to get the best possible timing of events in videos with little or no time information. Military-provided videos included verified embedded UTC timing. Whenever possible, times for the events were based upon passage of the Orbiter envelope near celestial objects recorded in the videos. Longer-duration videos were used as a unified time check between the celestial time-referenced events early in the sequence and later in the sequence. Key overlapping events were then cross-referenced from UTC-embedded or celestially synchronized videos with other videos that did not have a time reference. Uncertainties for each time the debris was first observed were determined based on the estimated accuracy of the time synchronization. As ballistic modeling was completed for events seen in multiple videos, improved estimates of debris separation time were used to improve the accuracy of the time synchronization for videos with overlapping events. During the screening and timing process, the “Entry Video and Still Database” (http://vdas-huey.jsc.nasa.gov/Contingency/107/web/) was expanded to track and display the most current metadata, including time synchronization, screen captures, and other information. 6.2.2.3 Digitization of Video Clips Events from previously screened videos that were given high priority for analysis were captured from the Sony D2 format master tapes or from DVCam copies of the submitted tapes. Although these digital movies were captured from duplicate generation tapes having relatively high background noise, they were adequate for motion analysis of the larger, brighter debris events. Single debris events were captured as separate short movie clips using DPS Reality software with image dimensions 720 horizontal by 486 vertical samples.
This information is being distributed to aid in the investigation of the Columbia mishap and should only be distributed to personnel who are actively involved in this investigation.
60
NSTS-37384STS-107 Image Analysis Team Final Report.pdf
C0-000045
CAB066-1012
COLUMBIAACCIDENT INVESTIGATION BOARD
REPORT VOLUME III OCTOBER 200388
De-interlacing All the consumer cameras employed a standard NTSC video format, which groups two interlaced video fields to make a single video frame. Each field consists of a set of alternate (odd or even numbered) horizontal video lines separated in time by 1/59.97 seconds. By default, the frame capture process combines successive pairs of these odd and even fields into full size frames which must then be separated out, or de-interlaced, for proper analysis. The default 720 x 486 size movies were de-interlaced into field movies sized 720 x 243 using the Video Investigator software developed by Cognitech, Inc. Restoration of Aspect Ratio The capture and de-interlacing process created images which were geometrically distorted, or stretched, in the horizontal direction relative to the vertical direction in two ways. First, the initial 720 x 486 frame size stretches the image horizontally by a factor of 1.1 relative to the vertical. This distortion factor was confirmed with test imagery prior to analysis. Second, the de-interlacing reduces the vertical dimension by a factor of 2. Restoration of the proper aspect ratio was accomplished in one step by resizing the vertical dimension by a factor of 2.2, (from 243 to 533). The resizing was done using a cubic spline interpolation in Video Investigator. The movies were also converted from color to monochrome to conserve hard disk space. Intensity measurements A modified digitization method was used for intensity measurements. DVCam tapes were captured using DPS Reality Software. When images were captured in digital form, meaningful signal above the arbitrary 100 IRE level was truncated (IRE is a scale defined by the Institute of Radio Engineers to measure the amplitude of a video signal; an IRE unit is equal to 1/140 volts). To prevent this truncation, the “digital proc amp” level control in DPS reality was used to bring the video peak to peak signal within the dynamic range of the capture system and eliminate inadvertent clipping. The signal was then converted back to its original levels as part of the intensity measurement analysis. 6.2.2.4 Calibration of Focal Lengths From early screening and preliminary identification of key imagery in February 2003, 17 video and 8 still cameras were procured from the public for calibration. One important input needed for the motion analysis was the focal length setting of the lens or, as an equivalent, a value for the Horizontal Field of View (HFOV) for each observation. This input was crucial because the larger the focal length (smaller the HFOV) used by the observer, the more the lens will have magnified the distance between the debris and the Shuttle. See Appendix 6.2B for a table of calculated fields-of-view for the various videos.
All the cameras used to capture video for this analysis had variable focal length zoom lenses and many observers zoomed in and out numerous times. Some observers made statements that they were at the maximum magnification or fully zoomed during certain events. If software magnification (digital zoom) was not enabled for these videos, then
This information is being distributed to aid in the investigation of the Columbia mishap and should only be distributed to personnel who are actively involved in this investigation.
61
NSTS-37384STS-107 Image Analysis Team Final Report.pdf
C0-000045
CAB066-1013
COLUMBIAACCIDENT INVESTIGATION BOARD
REPORT VOLUME III OCTOBER 2003 89
the focal length and HFOV was either based on the camera specifications from the manufacturer or was determined empirically by the Image Analysis Team once the actual camera was received. For all other videos, a focal length had to be determined based on additional information in the image. In most of the videos, the only objects in view are the Shuttle, the luminous trail behind it and occasional debris events. Both the debris and the Shuttle are too small to be resolved in detail and appear only as points or spots. The sizes of these points depend on several things: the resolving power of the lens, the apparent brightness of the objects (which was not constant), and the exposure and gain settings of the camera (some of which were automatically set and variable). So for these reasons, spot size could not be used reliably to measure changes in focal length. There were, however, circumstances that allowed calibration of the HFOV. One observer remembered his zoom setting and calibrated his camera’s HFOV the next day using the diameter of the full moon. Two videos had stars or a planet in view near the time of a debris event, and some observers enabled a digital zoom setting in their cameras which magnified the imagery beyond the optical zoom limit at the time of observations. Use of Stars and Planets In some key videos, a debris event was observed soon before or after the appearance of the star or planet and with no apparent change in zoom. These observations allowed the image motion of the Shuttle to be measured relative to a fixed point in the sky, and through this, the field of view could be determined. Initially, a method was developed to compare the angular separation between the Shuttle and the star (based on Orbiter positional data) with the separation measured in image pixels. However, because the Shuttle was moving so rapidly across the sky, (about one degree per second for some observers) this method required a very accurate knowledge of the absolute time that events were recorded onto tape. A small error in timing the video had a drastic effect on the angle-to-pixel comparison, and timing uncertainty was estimated to be at least 1 or 2 seconds. Our other method for deriving field-of-view relied less on the absolute timing of events, and more on the relative timing of the Shuttle motion. This method simply used the position of the Shuttle at two different times and compared the change in its image position relative to the fixed sky object (in pixels) with its change in angular position in the sky. This relative change in angular position of the Shuttle is much less affected by timing uncertainty than is the absolute position, so it provided a more reliable estimate of the field-of-view. Maximum Optical Zoom Calibrations Cameras purchased from the public were received at Johnson Space Center and quick measurements were made with each to calibrate the HFOV at the maximum optical zoom setting (maximum focal length). These quick measures were done using rulers observed through the eyepiece of each camera and served as temporary initial values for the
This information is being distributed to aid in the investigation of the Columbia mishap and should only be distributed to personnel who are actively involved in this investigation.
62
NSTS-37384STS-107 Image Analysis Team Final Report.pdf
C0-000045
CAB066-1014
COLUMBIAACCIDENT INVESTIGATION BOARD
REPORT VOLUME III OCTOBER 200390
analysis until more thorough calibrations were conducted by Neptec, Inc. Field-of-view calibrations at multiple camera settings were performed by Neptec, and are summarized in Appendix 6.2A. Digital Zoom Estimations Some observers enabled a camera setting called digital zoom, which magnifies the image beyond the optical zoom limit. The magnification is applied within the camera using software to “blow up” a centralized sub-region of the image. It becomes noticeable as a change in the pixelation or granularity of the image. The granularity increases because the image is being generated from a smaller and smaller number of pixels on the imaging chip. Images of the Shuttle re-entry in digital zoom are easy to identify because of the highly amplified noise in the dark background sky. This noise is not generated optically, but is a random fluctuation generated while the image is captured, but before the digital zoom software acts on the image. Because it is not an optical signal, it will not change character during optical zooming, but it will change during digital zooming. So, measuring a change in the background noise characteristics can provide a measure of the amount of digital zoom applied by the software. A technique was developed to use measurements of background noise and maximum focal length to estimate the degree of digital zoom and accurately calibrate the effective focal length (or horizontal field of view) used during the videos. Estimations of the amount of digital zoom based on background noise characteristics were made for observations from Flagstaff, AZ, Mount Hamilton, CA, and St. George, UT. Details of the new technique are documented in Appendix 6.2B. 6.2.2.5 Other Video Camera Calibrations Additional camera calibrations were conducted to support the measurements of signal intensity. The gamma curve was determined empirically for the black to peak white region (0 to 100 IRE units). In addition, the linearity of the signal above peak white was determined. Both tests were performed using a gamma gray scale chart. Saturation response and point spread function were measured using an artificial variable star source comprised of a collimator, pinhole, rotating neutral density filter and a stable light source. By recording the response to the artificial star, an empirical correction for the response of each camera could be made so that stellar photometry techniques could also be employed in measuring the intensity of the debris recorded in the videos. A minimum illumination test was performed by testing the light received (at the camera location) with a light meter and then recording the corresponding video output of the camera. Minimum illumination is considered the first light level that can be distinguished above the noise floor. 6.2.2.6 Motion of Debris Relative to Orbiter Tracking of Orbiter and Debris In order to calculate ballistic coefficients for individual debris objects, the Image Analysis Team tracked the relative position for each named debris object in the debris timeline relative to the Orbiter in priority video imagery. De-interlaced digital field
This information is being distributed to aid in the investigation of the Columbia mishap and should only be distributed to personnel who are actively involved in this investigation.
63
NSTS-37384STS-107 Image Analysis Team Final Report.pdf
C0-000045
CAB066-1015
COLUMBIAACCIDENT INVESTIGATION BOARD
REPORT VOLUME III OCTOBER 2003 91
movies of the debris were imported into a tracking program called ISee (developed by Inovision, Inc.). The software facilitated automatic tracking of the Orbiter and any bright stars or planets using a centroid algorithm, or “p-node” that was applied within a customized multiple p-node routine, or “network”. The network contained a number of parameters, which had to be adjusted for each debris movie based on aspects like the brightness, contrast, and the presence of text within the field. One important parameter was a threshold value used for binarizing the grayscale values, reducing the fields down to two values, black and white. This threshold was set to a high enough grayscale value so that the luminous trail behind the Orbiter would not seriously affect the shape of the Orbiter outline and centroid. The automatic tracking network worked extremely well for objects that remained consistently bright or were saturated, and it produced centroid positions with a sub-pixel precision better than 0.1 pixel. The debris pieces, however, were often too dim or fluctuated in brightness too greatly for the automatic tracking to work effectively. Therefore the dim debris pieces were tracked manually using the same Isee software in an interactive mode. Sub-pixel precision of 0.25 to 0.5 pixels was obtainable in this interactive mode. Assumptions about Debris Trajectory It was necessary to make some assumptions about the motion of the debris shed during re-entry in order to determine its distance from the Orbiter using only a single camera view. Two independent groups worked with the video tracking data to determine the relative motion of the debris and these groups used different assumptions and scaling methods. The JSC Image Analysis Group (JSC-SX) assumed that, relative to the Orbiter’s forward motion, the luminous debris pieces traveled along the trajectory path but behind the Orbiter. The debris still had forward motion relative to the ground, but relative to the Orbiter, the motion was exactly opposite the Orbiter velocity vector. The Flight Design and Dynamics Group (JSC-DM44) assumed the debris fell behind the Orbiter but could have fallen anywhere in a plane perpendicular to the ground that also contains the Orbiter trajectory path. The first assumption places a greater constraint on the debris motion, allowing for a very simple and straightforward photogrammetric solution to the one-camera problem. The second assumption places looser constraints on the debris motion, which, in turn, requires greater knowledge about the camera’s orientation (including camera roll) relative to the horizon and requires the curvature of the earth be taken into account in order to derive the plane containing the debris. There was generally good agreement between relative motion solutions between the two groups, except for debris events that were observed from southwestern Utah. It is assumed those differences result from the viewing geometry of the observers (the Orbiter passed almost directly overhead). Image to Object Scale Positional GPS data for the orbiter was combined with the observer locations, camera field-of-view calibrations and the time-sequenced video tracking data to precisely define the geometry for each observation. Understanding this geometry made it possible to
This information is being distributed to aid in the investigation of the Columbia mishap and should only be distributed to personnel who are actively involved in this investigation.
64
NSTS-37384STS-107 Image Analysis Team Final Report.pdf
C0-000045
CAB066-1016
COLUMBIAACCIDENT INVESTIGATION BOARD
REPORT VOLUME III OCTOBER 200392
directly calculate the relative feet of separation between the debris and the orbiter by applying the law of sines and law of cosines for triangular relationships. Once the debris distance was calculated, a scale factor, in feet-per-pixel, was then calculated as a final step. Because the orbiter was moving very fast, the perspective geometry of the observations changed quickly, and so this calculation was made separately for every video field that contained both the debris and the orbiter. The calculation was applied as an Excel spreadsheet program. The generalized solution for calculating the debris separation as a function of time without a fixed sky reference is provided in detail in Appendix 6.2A. 6.2.2.7 Relative Light Intensity of Orbiter and Debris Determining relative light intensities of the debris and the Orbiter in each video was a complex task. Video data of the Orbiter were often saturated in intensity, videos may have been acquired in different camcorder modes (e.g. night shot), and the camcorder operators frequently used both optical and digital zoom features of their camcorders, making direct comparisons difficult. Two methods of measuring the intensities were developed. Methods were validated using consumer-grade videos of stars of known intensities. Depending on the characteristics of a particular event and video, one or both methods were applied. Photometry method The first method was based on a circular aperture photometry technique that is normally conducted on saturated video images of meteor showers. The automated software that does the measurements from Digital 8 tapes was modified for application to Columbia re-entry videos. Empirical calibrations of the cameras were used to model the photometric response of each camera. Saturation of the camera detectors clips the signal above the maximum intensity. A double Moffit fit is used to estimate the intensity of the signal above the saturation threshold. Calibration is needed to determine the response of each camera to signals brighter than the saturation threshold. This method requires a calibration tape taken under similar conditions to the original video, and a sufficient duration of record to get a good signal. These methods are described in more detail in Appendix 6.2A. Video engineering method The second method is based on understanding the electronic signal response of the camera and the algorithms used to record and display that signal. Equations were developed to relate the observed signal to the actual intensity of the event recorded. The intensity of the signal is integrated across the frame for an irregular area around the “blob” of light that is the Orbiter or debris. This method can be done on single frames, and can compensate for low levels of signal clipping, but cannot compensate for high degrees of saturation of the video. These methods are described in more detail in Appendix 6.2A.
This information is being distributed to aid in the investigation of the Columbia mishap and should only be distributed to personnel who are actively involved in this investigation.
65
NSTS-37384STS-107 Image Analysis Team Final Report.pdf
C0-000045
CAB066-1017
COLUMBIAACCIDENT INVESTIGATION BOARD
REPORT VOLUME III OCTOBER 2003 93
6.2.2.8 Methods for Debris Mass Estimates Prior to the Columbia investigation, there was not an established method for characterizing the Orbiter’s re-entry radiative signature, including the re-entry debris events seen on the publicly acquired videos. Despite this challenge, several models were developed to use the relative intensities of the visual signature of the debris as recorded in the videos to estimate the debris mass. All the models assumed that the visible light was produced by the change in kinetic energy as the debris moved through the upper atmosphere and decelerated. If the debris is treated as a non-ablative object, the kinetic energy from deceleration is “dumped” into the atmosphere, causing the atmospheric molecules to become excited and emit light with no mass loss of the debris. A simple non-ablative approach established the upper bound for debris mass. A modified non-ablative approach, modeled on an object of known shape and orientation for the debris that would give the maximum possible brightness per unit mass, established an absolute lower bound for debris mass. A total ablative approach (assuming the debris completely ablates) was also considered as a model for estimating mass. However, light curves for the debris events do not support the use of a total ablative approach. Instead, a moderate ablative approach was applied to estimate debris mass by using the trajectory and deceleration of the debris and the observed light curve to estimate an ablation rate. Whenever the debris is visible in the videos for long enough to measure intensity curves to provide a good ablation estimate, the moderate ablative methods were applied, providing our best estimate for debris mass. The methods are described in detail in Appendix 6.2A. A final report from the Luminosity Working Group will include additional debris mass estimates and other debris characterization. 6.2.2.9 Methods to Identify Debris Composition If different Orbiter materials have different spectral signatures in the re-entry environment, it may be possible to determine the composition of the debris material by examining signal intensities in the red, green, and blue channels of video and still imagery. This is also a complex task and the challenges include acquiring spectral data from the imagery, acquiring the spectral sensitivity data from the individual cameras, and determining if the debris itself is the source of the luminosity or whether the source is the associated shock wave. Arcjet testing at Ames will determine if luminosity characteristics depend on material characteristics. If luminosity characteristics do not depend on material characteristics, the material composition cannot be determined from the data available. Additional information on the potential for spectral information in the publicly acquired videos can be found in Appendix 6.2A. The results of this testing and additional information on debris composition will be included in the “Luminosity Working Group Columbia Re-entry Debris Characteristics Final Report”.
This information is being distributed to aid in the investigation of the Columbia mishap and should only be distributed to personnel who are actively involved in this investigation.
66
NSTS-37384STS-107 Image Analysis Team Final Report.pdf
C0-000045
CAB066-1018
COLUMBIAACCIDENT INVESTIGATION BOARD
REPORT VOLUME III OCTOBER 200394
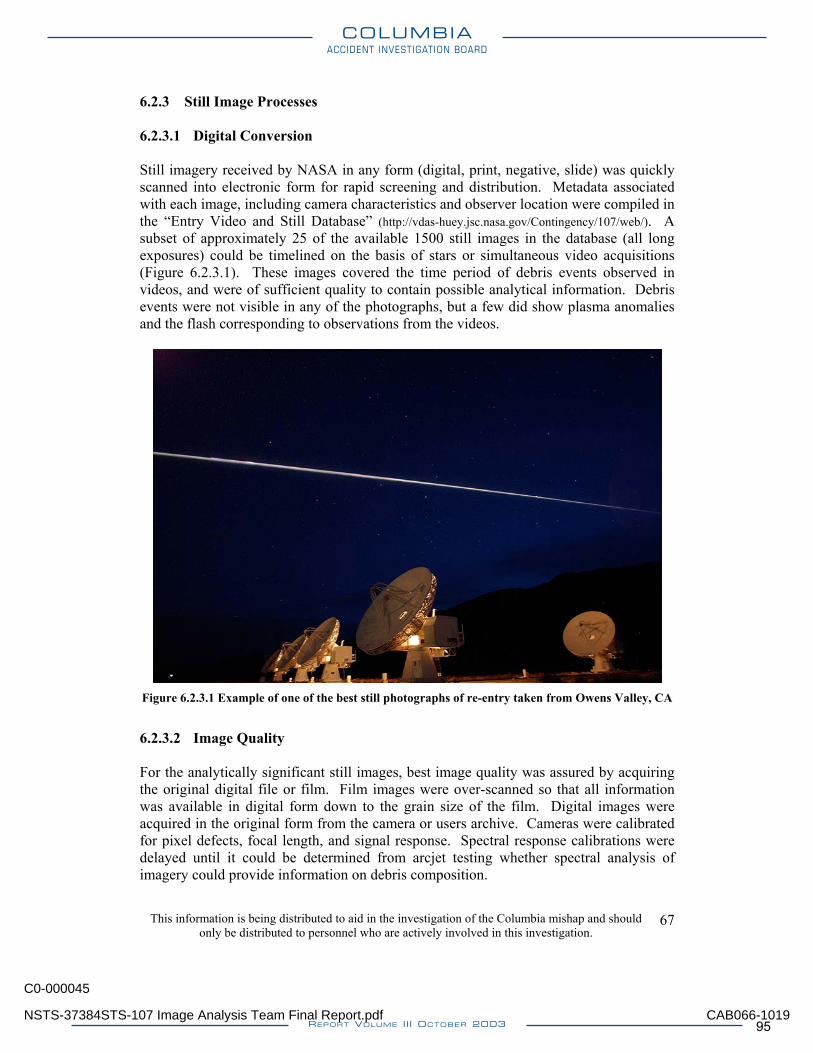
6.2.3 Still Image Processes 6.2.3.1 Digital Conversion Still imagery received by NASA in any form (digital, print, negative, slide) was quickly scanned into electronic form for rapid screening and distribution. Metadata associated with each image, including camera characteristics and observer location were compiled in the “Entry Video and Still Database” (http://vdas-huey.jsc.nasa.gov/Contingency/107/web/). A subset of approximately 25 of the available 1500 still images in the database (all long exposures) could be timelined on the basis of stars or simultaneous video acquisitions (Figure 6.2.3.1). These images covered the time period of debris events observed in videos, and were of sufficient quality to contain possible analytical information. Debris events were not visible in any of the photographs, but a few did show plasma anomalies and the flash corresponding to observations from the videos.
Figure 6.2.3.1 Example of one of the best still photographs of re-entry taken from Owens Valley, CA
6.2.3.2 Image Quality For the analytically significant still images, best image quality was assured by acquiring the original digital file or film. Film images were over-scanned so that all information was available in digital form down to the grain size of the film. Digital images were acquired in the original form from the camera or users archive. Cameras were calibrated for pixel defects, focal length, and signal response. Spectral response calibrations were delayed until it could be determined from arcjet testing whether spectral analysis of imagery could provide information on debris composition.
This information is being distributed to aid in the investigation of the Columbia mishap and should only be distributed to personnel who are actively involved in this investigation.
67
NSTS-37384STS-107 Image Analysis Team Final Report.pdf
C0-000045
CAB066-1019
COLUMBIAACCIDENT INVESTIGATION BOARD
REPORT VOLUME III OCTOBER 2003 95
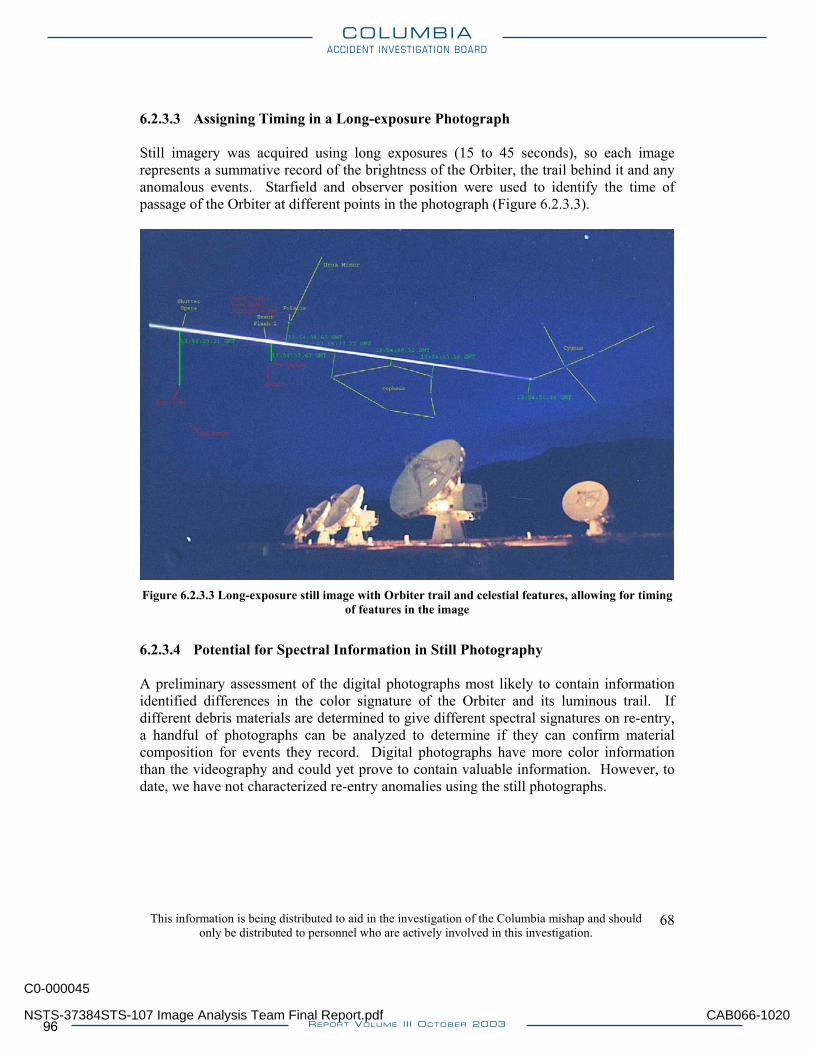
6.2.3.3 Assigning Timing in a Long-exposure Photograph Still imagery was acquired using long exposures (15 to 45 seconds), so each image represents a summative record of the brightness of the Orbiter, the trail behind it and any anomalous events. Starfield and observer position were used to identify the time of passage of the Orbiter at different points in the photograph (Figure 6.2.3.3).
Figure 6.2.3.3 Long-exposure still image with Orbiter trail and celestial features, allowing for timing
of features in the image
6.2.3.4 Potential for Spectral Information in Still Photography A preliminary assessment of the digital photographs most likely to contain information identified differences in the color signature of the Orbiter and its luminous trail. If different debris materials are determined to give different spectral signatures on re-entry, a handful of photographs can be analyzed to determine if they can confirm material composition for events they record. Digital photographs have more color information than the videography and could yet prove to contain valuable information. However, to date, we have not characterized re-entry anomalies using the still photographs.
This information is being distributed to aid in the investigation of the Columbia mishap and should only be distributed to personnel who are actively involved in this investigation.
68
NSTS-37384STS-107 Image Analysis Team Final Report.pdf
C0-000045
CAB066-1020
COLUMBIAACCIDENT INVESTIGATION BOARD
REPORT VOLUME III OCTOBER 200396
6.3 Re-entry Analyses: Primary Results 6.3.1 Re-entry Video Screening and Data Base A total of 150 videos and over 1500 still images were sent to NASA. A few submitters provided both video and still imagery acquired simultaneously. Other submitters supplied information on previous nominal re-entries. The Image Analysis Team screened video and still images, created a searchable database for imagery, and added metadata through the screening and cataloging process. The metadata records include cross-referenced EOC and NASA-JSC numbers, media type, contact information about the observer, observer location, camera type and setting information, any comments supplied by the observer, detailed screening notes, frame captures, timing data, light curves for selected frames, and other cross-referenced media such as original tape or copies, or other imagery acquired by the same observer. The STS-107 Entry Video and Still Database can be accessed at http://vdas-huey.jsc.nasa.gov/Contingency/107/web/. 6.3.2 Entry Debris Timeline and Debris Event Descriptions A total of 23 videos submitted by the public and two videos from military sources (one from Kirtland AFB, NM and one from an Apache FLIR near Fort Hood, TX) contained records of anomalous events on re-entry that could be correlated to absolute time. From this information, an imagery time line was established which was integrated into the OVEWG configuration controlled “Data Review & Timeline”. A total of 24 anomalous visual events were detected between California and New Mexico, and another 10 events were identified from Texas videos (Figure 6.3.2a). NASA did not receive good quality video that covers Eastern Arizona and New Mexico, and no video at all that covers Eastern New Mexico to Central Texas (Figures 6.3.2b and c). Because of the gap in video coverage, it was impossible to link the Western and Eastern segments of the entry debris timeline into a single unified timeline. Also, all of the videos contain short periods when the Orbiter is out of the camera's field of view, obscured by clouds, or is out of focus. As a result, there is a high probability that additional events occurred which are not visible on the available videos. The anomalies in the timeline include debris shedding events, large flashes, flares, and non-uniformities in the Orbiter’s plasma trail. The times recorded in the timeline represent the earliest moment in time when the team could distinguish an event outside the Orbiter plasma envelope. These debris times do not represent the actual time when debris physically separated from Columbia because the Orbiter is not visible in the luminous envelope. However, the STS-107 Early Sighting Assessment Team estimated the actual debris separation times based on ballistic calculations derived from the videos (Table 6.3.4 and ESAT Final Report). Table 6.3.2 presents Version 7 of the re-entry debris timeline. A complete and updated copy of the “Entry Debris Events Timeline” can be found at references/shuttleweb/mission_support/sts-107/contingency/entry/reports/107_reports.html. Figures
This information is being distributed to aid in the investigation of the Columbia mishap and should only be distributed to personnel who are actively involved in this investigation.
69
NSTS-37384STS-107 Image Analysis Team Final Report.pdf
C0-000045
CAB066-1021
COLUMBIAACCIDENT INVESTIGATION BOARD
REPORT VOLUME III OCTOBER 2003 97
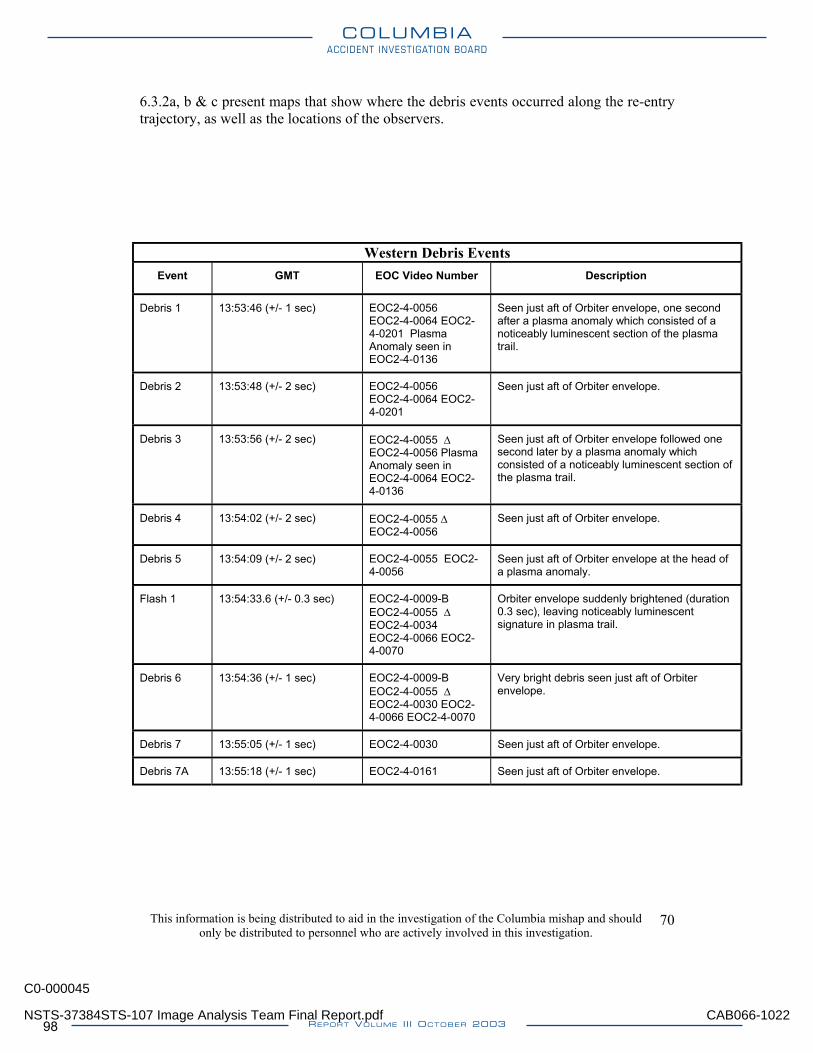
6.3.2a, b & c present maps that show where the debris events occurred along the re-entry trajectory, as well as the locations of the observers.
Western Debris Events Event GMT EOC Video Number Description
Debris 1 13:53:46 (+/- 1 sec) EOC2-4-0056 EOC2-4-0064 EOC2-4-0201 Plasma Anomaly seen in EOC2-4-0136
Seen just aft of Orbiter envelope, one second after a plasma anomaly which consisted of a noticeably luminescent section of the plasma trail.
Debris 2 13:53:48 (+/- 2 sec) EOC2-4-0056 EOC2-4-0064 EOC2-4-0201
Seen just aft of Orbiter envelope.
Debris 3 13:53:56 (+/- 2 sec) EOC2-4-0055 ∆ EOC2-4-0056 Plasma Anomaly seen in EOC2-4-0064 EOC2-4-0136
Seen just aft of Orbiter envelope followed one second later by a plasma anomaly which consisted of a noticeably luminescent section of the plasma trail.
Debris 4 13:54:02 (+/- 2 sec) EOC2-4-0055 ∆ EOC2-4-0056
Seen just aft of Orbiter envelope.
Debris 5 13:54:09 (+/- 2 sec) EOC2-4-0055 EOC2-4-0056
Seen just aft of Orbiter envelope at the head of a plasma anomaly.
Flash 1 13:54:33.6 (+/- 0.3 sec) EOC2-4-0009-B EOC2-4-0055 ∆ EOC2-4-0034 EOC2-4-0066 EOC2-4-0070
Orbiter envelope suddenly brightened (duration 0.3 sec), leaving noticeably luminescent signature in plasma trail.
Debris 6 13:54:36 (+/- 1 sec) EOC2-4-0009-B EOC2-4-0055 ∆ EOC2-4-0030 EOC2-4-0066 EOC2-4-0070
Very bright debris seen just aft of Orbiter envelope.
Debris 7 13:55:05 (+/- 1 sec) EOC2-4-0030 Seen just aft of Orbiter envelope.
Debris 7A 13:55:18 (+/- 1 sec) EOC2-4-0161 Seen just aft of Orbiter envelope.
This information is being distributed to aid in the investigation of the Columbia mishap and should only be distributed to personnel who are actively involved in this investigation.
70
NSTS-37384STS-107 Image Analysis Team Final Report.pdf
C0-000045
CAB066-1022
COLUMBIAACCIDENT INVESTIGATION BOARD
REPORT VOLUME III OCTOBER 200398
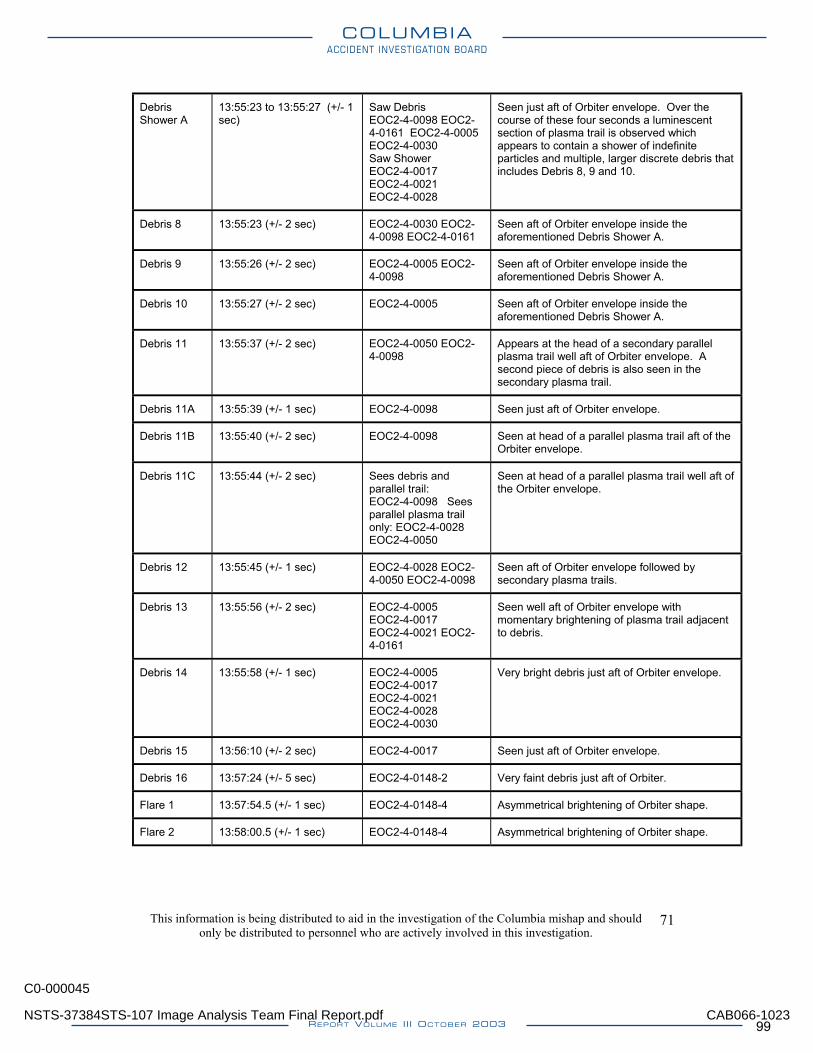
Debris Shower A
13:55:23 to 13:55:27 (+/- 1 sec)
Saw Debris EOC2-4-0098 EOC2-4-0161 EOC2-4-0005 EOC2-4-0030 Saw Shower EOC2-4-0017 EOC2-4-0021 EOC2-4-0028
Seen just aft of Orbiter envelope. Over the course of these four seconds a luminescent section of plasma trail is observed which appears to contain a shower of indefinite particles and multiple, larger discrete debris that includes Debris 8, 9 and 10.
Debris 8 13:55:23 (+/- 2 sec) EOC2-4-0030 EOC2-4-0098 EOC2-4-0161
Seen aft of Orbiter envelope inside the aforementioned Debris Shower A.
Debris 9 13:55:26 (+/- 2 sec) EOC2-4-0005 EOC2-4-0098
Seen aft of Orbiter envelope inside the aforementioned Debris Shower A.
Debris 10 13:55:27 (+/- 2 sec) EOC2-4-0005 Seen aft of Orbiter envelope inside the aforementioned Debris Shower A.
Debris 11 13:55:37 (+/- 2 sec) EOC2-4-0050 EOC2-4-0098
Appears at the head of a secondary parallel plasma trail well aft of Orbiter envelope. A second piece of debris is also seen in the secondary plasma trail.
Debris 11A 13:55:39 (+/- 1 sec) EOC2-4-0098 Seen just aft of Orbiter envelope.
Debris 11B 13:55:40 (+/- 2 sec) EOC2-4-0098 Seen at head of a parallel plasma trail aft of the Orbiter envelope.
Debris 11C 13:55:44 (+/- 2 sec) Sees debris and parallel trail: EOC2-4-0098 Sees parallel plasma trail only: EOC2-4-0028 EOC2-4-0050
Seen at head of a parallel plasma trail well aft of the Orbiter envelope.
Debris 12 13:55:45 (+/- 1 sec) EOC2-4-0028 EOC2-4-0050 EOC2-4-0098
Seen aft of Orbiter envelope followed by secondary plasma trails.
Debris 13 13:55:56 (+/- 2 sec) EOC2-4-0005 EOC2-4-0017 EOC2-4-0021 EOC2-4-0161
Seen well aft of Orbiter envelope with momentary brightening of plasma trail adjacent to debris.
Debris 14
13:55:58 (+/- 1 sec) EOC2-4-0005
EOC2-4-0017 EOC2-4-0021 EOC2-4-0028 EOC2-4-0030
Very bright debris just aft of Orbiter envelope.
Debris 15 13:56:10 (+/- 2 sec) EOC2-4-0017 Seen just aft of Orbiter envelope.
Debris 16 13:57:24 (+/- 5 sec) EOC2-4-0148-2 Very faint debris just aft of Orbiter.
Flare 1 13:57:54.5 (+/- 1 sec) EOC2-4-0148-4 Asymmetrical brightening of Orbiter shape.
Flare 2 13:58:00.5 (+/- 1 sec) EOC2-4-0148-4 Asymmetrical brightening of Orbiter shape.
This information is being distributed to aid in the investigation of the Columbia mishap and should only be distributed to personnel who are actively involved in this investigation.
71
NSTS-37384STS-107 Image Analysis Team Final Report.pdf
C0-000045
CAB066-1023
COLUMBIAACCIDENT INVESTIGATION BOARD
REPORT VOLUME III OCTOBER 2003 99
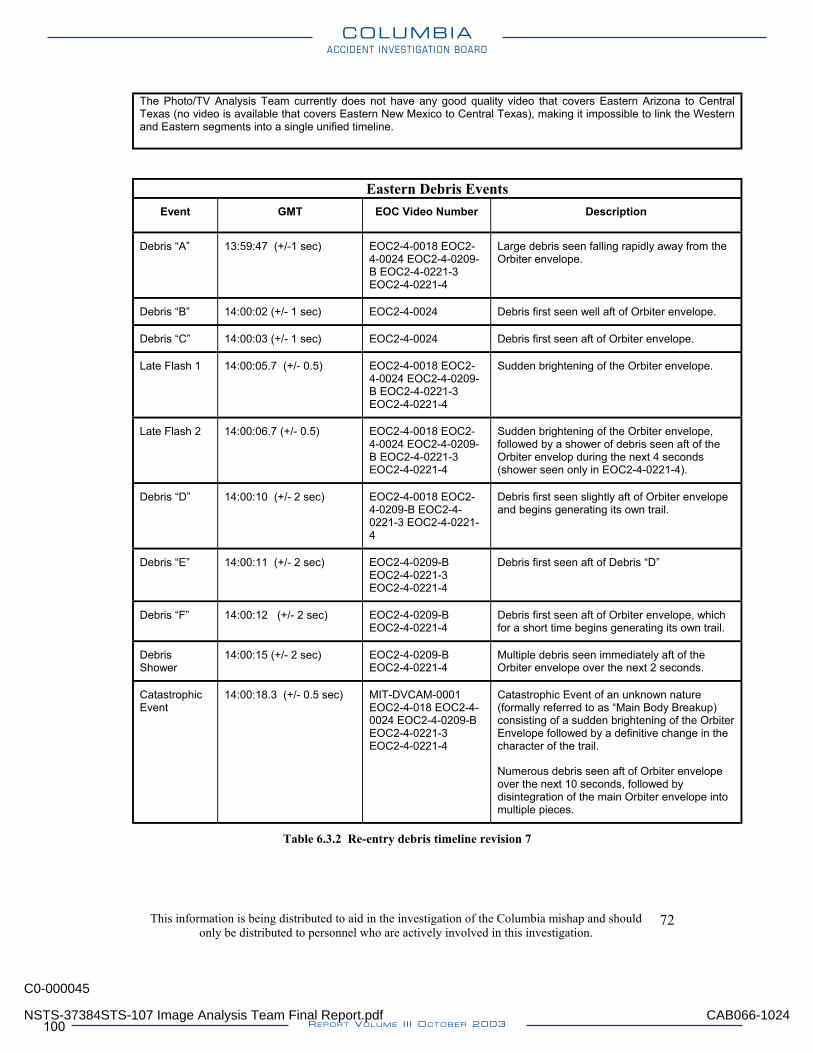
The Photo/TV Analysis Team currently does not have any good quality video that covers Eastern Arizona to Central Texas (no video is available that covers Eastern New Mexico to Central Texas), making it impossible to link the Western and Eastern segments into a single unified timeline.
Eastern Debris Events Event GMT EOC Video Number Description
Debris “A” 13:59:47 (+/-1 sec) EOC2-4-0018 EOC2-4-0024 EOC2-4-0209-B EOC2-4-0221-3 EOC2-4-0221-4
Large debris seen falling rapidly away from the Orbiter envelope.
Debris “B” 14:00:02 (+/- 1 sec) EOC2-4-0024 Debris first seen well aft of Orbiter envelope.
Debris “C” 14:00:03 (+/- 1 sec) EOC2-4-0024 Debris first seen aft of Orbiter envelope.
Late Flash 1 14:00:05.7 (+/- 0.5) EOC2-4-0018 EOC2-4-0024 EOC2-4-0209-B EOC2-4-0221-3 EOC2-4-0221-4
Sudden brightening of the Orbiter envelope.
Late Flash 2 14:00:06.7 (+/- 0.5) EOC2-4-0018 EOC2-4-0024 EOC2-4-0209-B EOC2-4-0221-3 EOC2-4-0221-4
Sudden brightening of the Orbiter envelope, followed by a shower of debris seen aft of the Orbiter envelop during the next 4 seconds (shower seen only in EOC2-4-0221-4).
Debris “D” 14:00:10 (+/- 2 sec) EOC2-4-0018 EOC2-4-0209-B EOC2-4-0221-3 EOC2-4-0221-4
Debris first seen slightly aft of Orbiter envelope and begins generating its own trail.
Debris “E” 14:00:11 (+/- 2 sec) EOC2-4-0209-B EOC2-4-0221-3 EOC2-4-0221-4
Debris first seen aft of Debris “D”
Debris “F” 14:00:12 (+/- 2 sec) EOC2-4-0209-B EOC2-4-0221-4
Debris first seen aft of Orbiter envelope, which for a short time begins generating its own trail.
Debris Shower
14:00:15 (+/- 2 sec) EOC2-4-0209-B EOC2-4-0221-4
Multiple debris seen immediately aft of the Orbiter envelope over the next 2 seconds.
Catastrophic Event
14:00:18.3 (+/- 0.5 sec) MIT-DVCAM-0001 EOC2-4-018 EOC2-4-0024 EOC2-4-0209-B EOC2-4-0221-3 EOC2-4-0221-4
Catastrophic Event of an unknown nature (formally referred to as “Main Body Breakup) consisting of a sudden brightening of the Orbiter Envelope followed by a definitive change in the character of the trail.
Numerous debris seen aft of Orbiter envelope over the next 10 seconds, followed by disintegration of the main Orbiter envelope into multiple pieces.
Table 6.3.2 Re-entry debris timeline revision 7
This information is being distributed to aid in the investigation of the Columbia mishap and should only be distributed to personnel who are actively involved in this investigation.
72
NSTS-37384STS-107 Image Analysis Team Final Report.pdf
C0-000045
CAB066-1024
COLUMBIAACCIDENT INVESTIGATION BOARD
REPORT VOLUME III OCTOBER 2003100
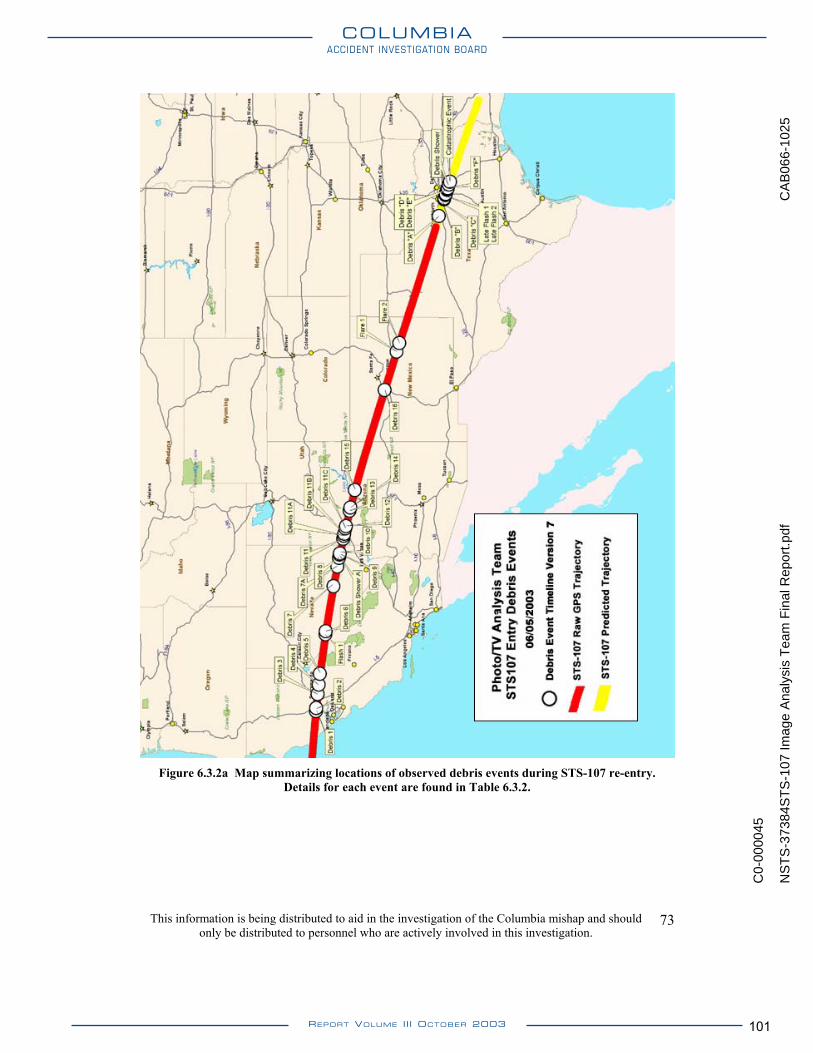
Figure 6.3.2a Map summarizing locations of observed debris events during STS-107 re-entry.
Details for each event are found in Table 6.3.2.
This information is being distributed to aid in the investigation of the Columbia mishap and should only be distributed to personnel who are actively involved in this investigation.
73
NS
TS
-373
84S
TS
-107
Imag
e A
naly
sis
Tea
m F
inal
Rep
ort.p
df
C0-
0000
45
CA
B06
6-10
25
COLUMBIAACCIDENT INVESTIGATION BOARD
REPORT VOLUME III OCTOBER 2003 101
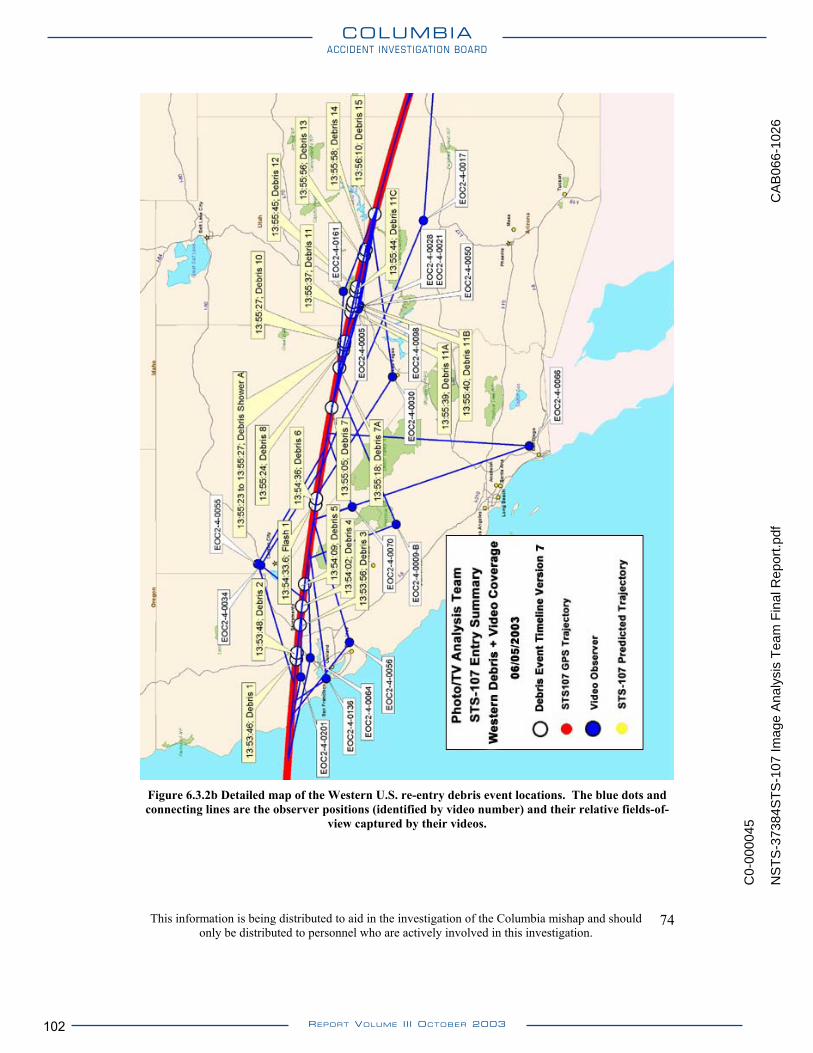
Figure 6.3.2b Detailed map of the Western U.S. re-entry debris event locations. The blue dots and connecting lines are the observer positions (identified by video number) and their relative fields-of-
view captured by their videos.
This information is being distributed to aid in the investigation of the Columbia mishap and should only be distributed to personnel who are actively involved in this investigation.
74
NS
TS
-373
84S
TS
-107
Imag
e A
naly
sis
Tea
m F
inal
Rep
ort.p
df
C0-
0000
45
CA
B06
6-10
26
COLUMBIAACCIDENT INVESTIGATION BOARD
REPORT VOLUME III OCTOBER 2003102
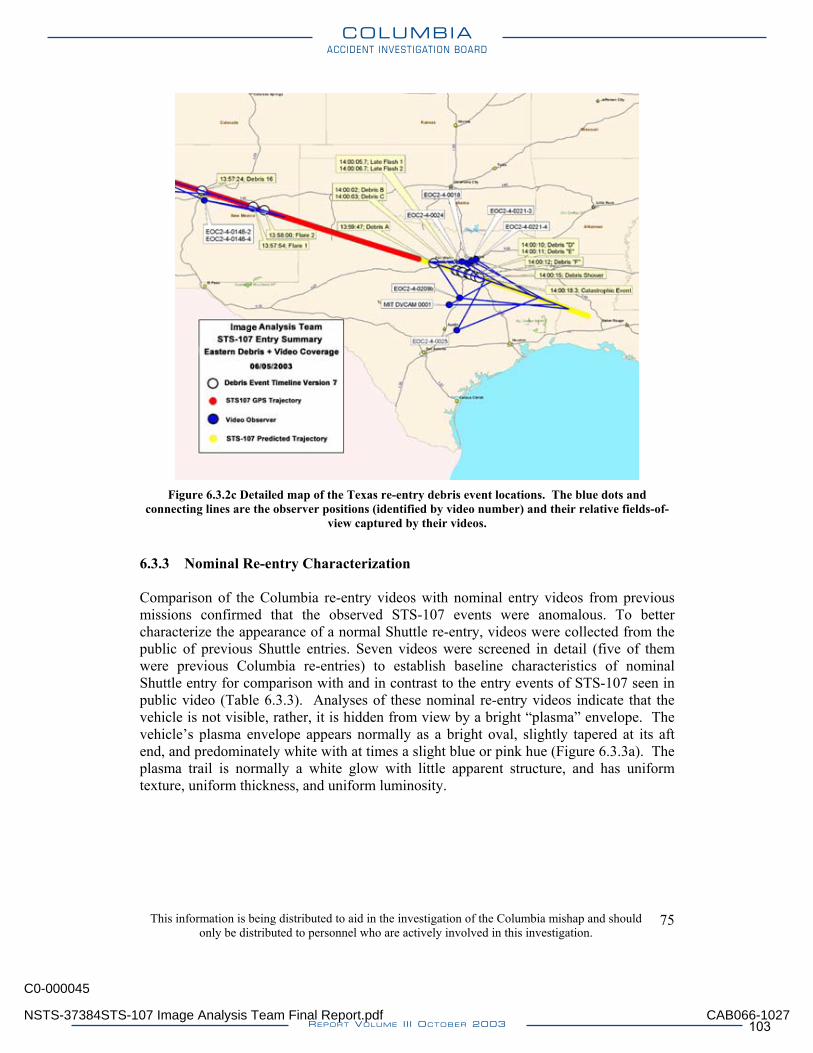
Figure 6.3.2c Detailed map of the Texas re-entry debris event locations. The blue dots and
connecting lines are the observer positions (identified by video number) and their relative fields-of-view captured by their videos.
6.3.3 Nominal Re-entry Characterization Comparison of the Columbia re-entry videos with nominal entry videos from previous missions confirmed that the observed STS-107 events were anomalous. To better characterize the appearance of a normal Shuttle re-entry, videos were collected from the public of previous Shuttle entries. Seven videos were screened in detail (five of them were previous Columbia re-entries) to establish baseline characteristics of nominal Shuttle entry for comparison with and in contrast to the entry events of STS-107 seen in public video (Table 6.3.3). Analyses of these nominal re-entry videos indicate that the vehicle is not visible, rather, it is hidden from view by a bright “plasma” envelope. The vehicle’s plasma envelope appears normally as a bright oval, slightly tapered at its aft end, and predominately white with at times a slight blue or pink hue (Figure 6.3.3a). The plasma trail is normally a white glow with little apparent structure, and has uniform texture, uniform thickness, and uniform luminosity.
This information is being distributed to aid in the investigation of the Columbia mishap and should only be distributed to personnel who are actively involved in this investigation.
75
NSTS-37384STS-107 Image Analysis Team Final Report.pdf
C0-000045
CAB066-1027
COLUMBIAACCIDENT INVESTIGATION BOARD
REPORT VOLUME III OCTOBER 2003 103
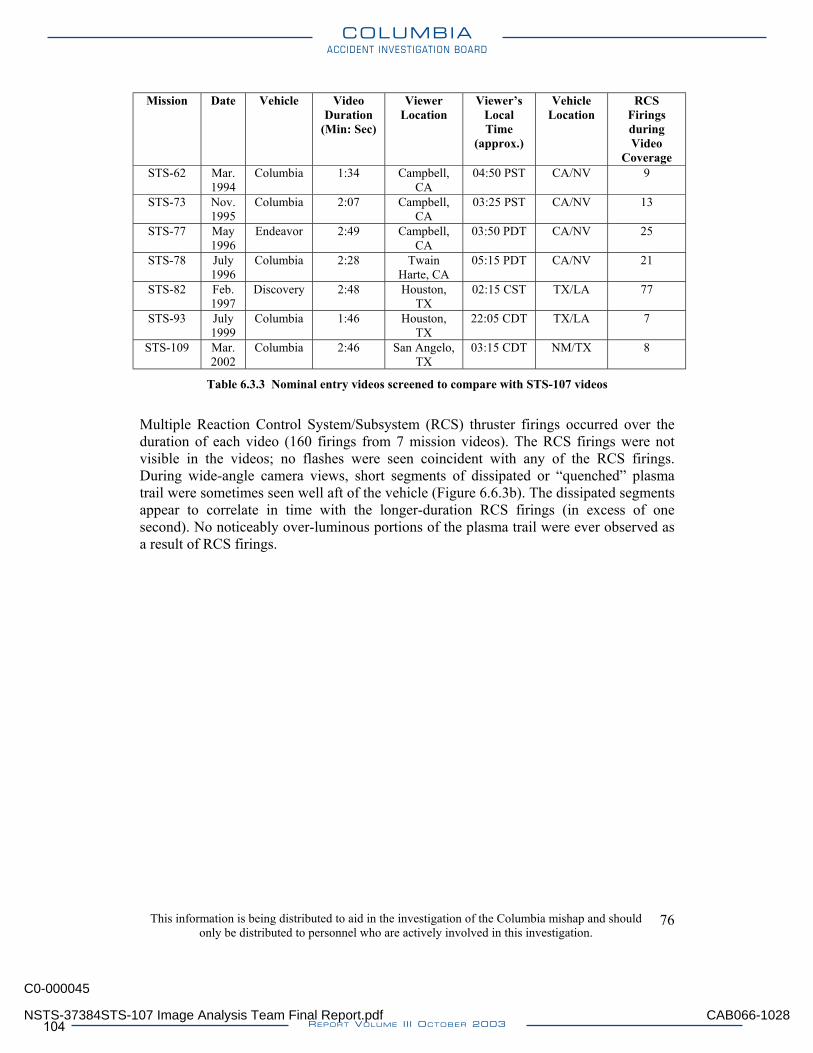
Mission Date Vehicle Video Duration
(Min: Sec)
Viewer Location
Viewer’s Local Time
(approx.)
Vehicle Location
RCS Firings during Video
Coverage STS-62 Mar.
1994 Columbia 1:34 Campbell,
CA 04:50 PST CA/NV 9
STS-73 Nov. 1995
Columbia 2:07 Campbell, CA
03:25 PST CA/NV 13
STS-77 May 1996
Endeavor 2:49 Campbell, CA
03:50 PDT CA/NV 25
STS-78 July 1996
Columbia 2:28 Twain Harte, CA
05:15 PDT CA/NV 21
STS-82 Feb. 1997
Discovery 2:48 Houston, TX
02:15 CST TX/LA 77
STS-93 July 1999
Columbia 1:46 Houston, TX
22:05 CDT TX/LA 7
STS-109 Mar. 2002
Columbia 2:46 San Angelo, TX
03:15 CDT NM/TX 8
Table 6.3.3 Nominal entry videos screened to compare with STS-107 videos
Multiple Reaction Control System/Subsystem (RCS) thruster firings occurred over the duration of each video (160 firings from 7 mission videos). The RCS firings were not visible in the videos; no flashes were seen coincident with any of the RCS firings. During wide-angle camera views, short segments of dissipated or “quenched” plasma trail were sometimes seen well aft of the vehicle (Figure 6.6.3b). The dissipated segments appear to correlate in time with the longer-duration RCS firings (in excess of one second). No noticeably over-luminous portions of the plasma trail were ever observed as a result of RCS firings.
This information is being distributed to aid in the investigation of the Columbia mishap and should only be distributed to personnel who are actively involved in this investigation.
76
NSTS-37384STS-107 Image Analysis Team Final Report.pdf
C0-000045
CAB066-1028
COLUMBIAACCIDENT INVESTIGATION BOARD
REPORT VOLUME III OCTOBER 2003104
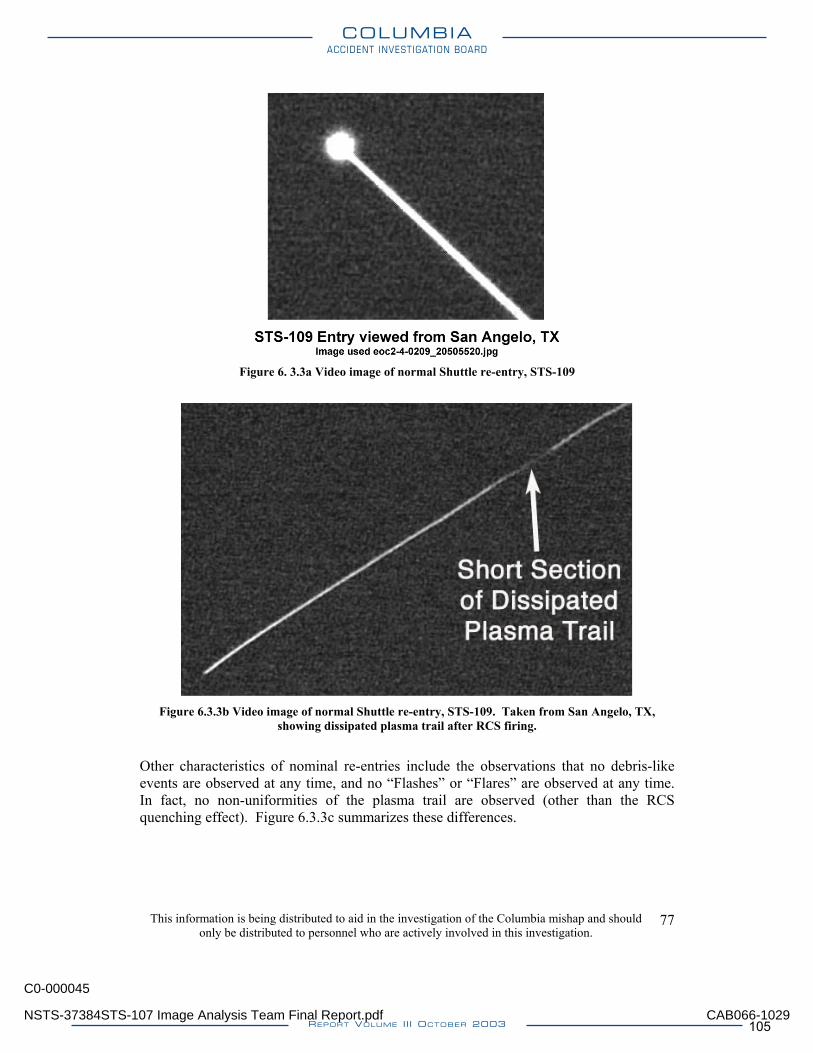
Figure 6. 3.3a Video image of normal Shuttle re-entry, STS-109
Figure 6.3.3b Video image of normal Shuttle re-entry, STS-109. Taken from San Angelo, TX,
showing dissipated plasma trail after RCS firing.
Other characteristics of nominal re-entries include the observations that no debris-like events are observed at any time, and no “Flashes” or “Flares” are observed at any time. In fact, no non-uniformities of the plasma trail are observed (other than the RCS quenching effect). Figure 6.3.3c summarizes these differences.
This information is being distributed to aid in the investigation of the Columbia mishap and should only be distributed to personnel who are actively involved in this investigation.
77
NSTS-37384STS-107 Image Analysis Team Final Report.pdf
C0-000045
CAB066-1029
COLUMBIAACCIDENT INVESTIGATION BOARD
REPORT VOLUME III OCTOBER 2003 105
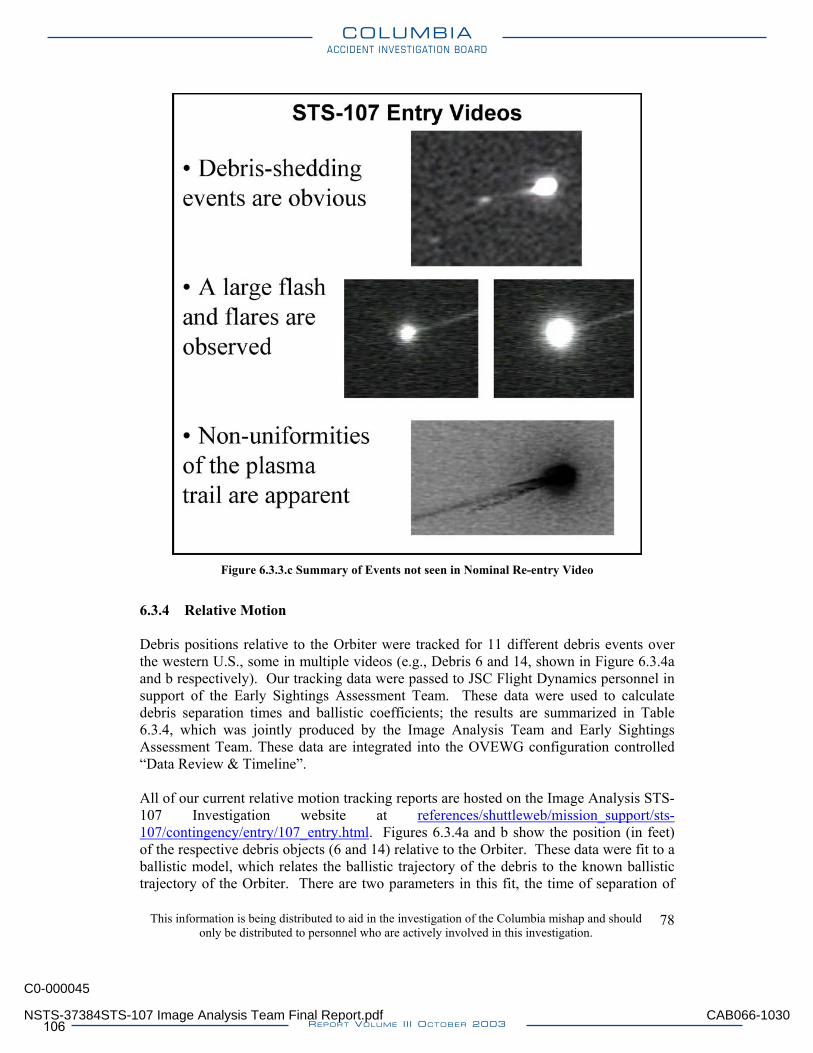
Figure 6.3.3.c Summary of Events not seen in Nominal Re-entry Video
6.3.4 Relative Motion Debris positions relative to the Orbiter were tracked for 11 different debris events over the western U.S., some in multiple videos (e.g., Debris 6 and 14, shown in Figure 6.3.4a and b respectively). Our tracking data were passed to JSC Flight Dynamics personnel in support of the Early Sightings Assessment Team. These data were used to calculate debris separation times and ballistic coefficients; the results are summarized in Table 6.3.4, which was jointly produced by the Image Analysis Team and Early Sightings Assessment Team. These data are integrated into the OVEWG configuration controlled “Data Review & Timeline”. All of our current relative motion tracking reports are hosted on the Image Analysis STS-107 Investigation website at references/shuttleweb/mission_support/sts-107/contingency/entry/107_entry.html. Figures 6.3.4a and b show the position (in feet) of the respective debris objects (6 and 14) relative to the Orbiter. These data were fit to a ballistic model, which relates the ballistic trajectory of the debris to the known ballistic trajectory of the Orbiter. There are two parameters in this fit, the time of separation of
This information is being distributed to aid in the investigation of the Columbia mishap and should only be distributed to personnel who are actively involved in this investigation.
78
NSTS-37384STS-107 Image Analysis Team Final Report.pdf
C0-000045
CAB066-1030
COLUMBIAACCIDENT INVESTIGATION BOARD
REPORT VOLUME III OCTOBER 2003106
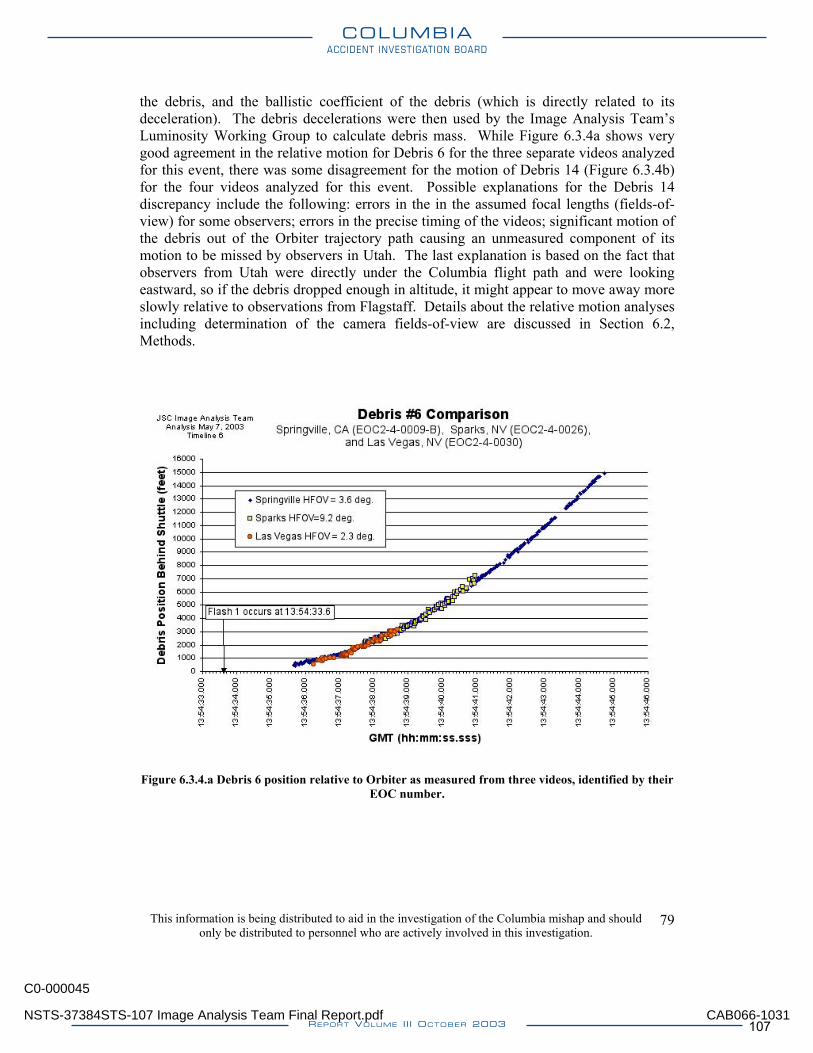
the debris, and the ballistic coefficient of the debris (which is directly related to its deceleration). The debris decelerations were then used by the Image Analysis Team’s Luminosity Working Group to calculate debris mass. While Figure 6.3.4a shows very good agreement in the relative motion for Debris 6 for the three separate videos analyzed for this event, there was some disagreement for the motion of Debris 14 (Figure 6.3.4b) for the four videos analyzed for this event. Possible explanations for the Debris 14 discrepancy include the following: errors in the in the assumed focal lengths (fields-of-view) for some observers; errors in the precise timing of the videos; significant motion of the debris out of the Orbiter trajectory path causing an unmeasured component of its motion to be missed by observers in Utah. The last explanation is based on the fact that observers from Utah were directly under the Columbia flight path and were looking eastward, so if the debris dropped enough in altitude, it might appear to move away more slowly relative to observations from Flagstaff. Details about the relative motion analyses including determination of the camera fields-of-view are discussed in Section 6.2, Methods.
Figure 6.3.4.a Debris 6 position relative to Orbiter as measured from three videos, identified by their
EOC number.
This information is being distributed to aid in the investigation of the Columbia mishap and should only be distributed to personnel who are actively involved in this investigation.
79
NSTS-37384STS-107 Image Analysis Team Final Report.pdf
C0-000045
CAB066-1031
COLUMBIAACCIDENT INVESTIGATION BOARD
REPORT VOLUME III OCTOBER 2003 107
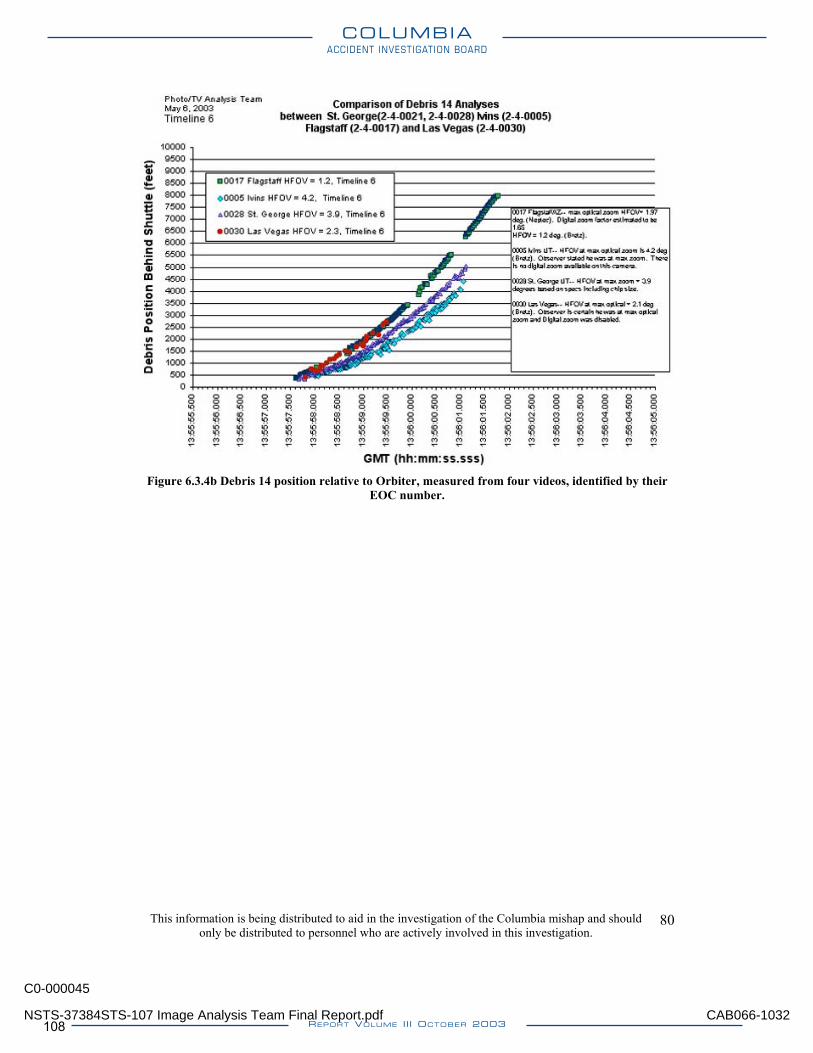
Figure 6.3.4b Debris 14 position relative to Orbiter, measured from four videos, identified by their
EOC number.
This information is being distributed to aid in the investigation of the Columbia mishap and should only be distributed to personnel who are actively involved in this investigation.
80
NSTS-37384STS-107 Image Analysis Team Final Report.pdf
C0-000045
CAB066-1032
COLUMBIAACCIDENT INVESTIGATION BOARD
REPORT VOLUME III OCTOBER 2003108
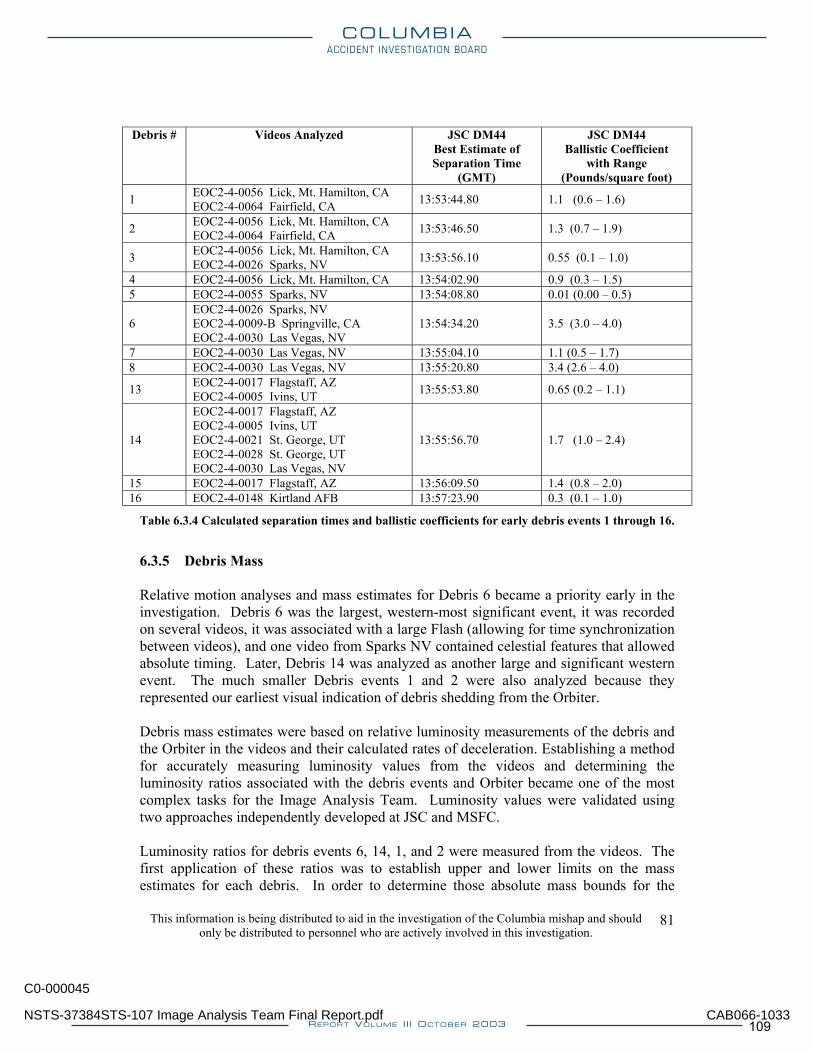
Debris # Videos Analyzed JSC DM44 Best Estimate of Separation Time
(GMT)
JSC DM44 Ballistic Coefficient
with Range (Pounds/square foot)
1 EOC2-4-0056 Lick, Mt. Hamilton, CA EOC2-4-0064 Fairfield, CA 13:53:44.80 1.1 (0.6 – 1.6)
2 EOC2-4-0056 Lick, Mt. Hamilton, CA EOC2-4-0064 Fairfield, CA 13:53:46.50 1.3 (0.7 – 1.9)
3 EOC2-4-0056 Lick, Mt. Hamilton, CA EOC2-4-0026 Sparks, NV 13:53:56.10 0.55 (0.1 – 1.0)
4 EOC2-4-0056 Lick, Mt. Hamilton, CA 13:54:02.90 0.9 (0.3 – 1.5) 5 EOC2-4-0055 Sparks, NV 13:54:08.80 0.01 (0.00 – 0.5)
6 EOC2-4-0026 Sparks, NV EOC2-4-0009-B Springville, CA EOC2-4-0030 Las Vegas, NV
13:54:34.20 3.5 (3.0 – 4.0)
7 EOC2-4-0030 Las Vegas, NV 13:55:04.10 1.1 (0.5 – 1.7) 8 EOC2-4-0030 Las Vegas, NV 13:55:20.80 3.4 (2.6 – 4.0)
13 EOC2-4-0017 Flagstaff, AZ EOC2-4-0005 Ivins, UT 13:55:53.80 0.65 (0.2 – 1.1)
14
EOC2-4-0017 Flagstaff, AZ EOC2-4-0005 Ivins, UT EOC2-4-0021 St. George, UT EOC2-4-0028 St. George, UT EOC2-4-0030 Las Vegas, NV
13:55:56.70 1.7 (1.0 – 2.4)
15 EOC2-4-0017 Flagstaff, AZ 13:56:09.50 1.4 (0.8 – 2.0) 16 EOC2-4-0148 Kirtland AFB 13:57:23.90 0.3 (0.1 – 1.0)
Table 6.3.4 Calculated separation times and ballistic coefficients for early debris events 1 through 16.
6.3.5 Debris Mass Relative motion analyses and mass estimates for Debris 6 became a priority early in the investigation. Debris 6 was the largest, western-most significant event, it was recorded on several videos, it was associated with a large Flash (allowing for time synchronization between videos), and one video from Sparks NV contained celestial features that allowed absolute timing. Later, Debris 14 was analyzed as another large and significant western event. The much smaller Debris events 1 and 2 were also analyzed because they represented our earliest visual indication of debris shedding from the Orbiter. Debris mass estimates were based on relative luminosity measurements of the debris and the Orbiter in the videos and their calculated rates of deceleration. Establishing a method for accurately measuring luminosity values from the videos and determining the luminosity ratios associated with the debris events and Orbiter became one of the most complex tasks for the Image Analysis Team. Luminosity values were validated using two approaches independently developed at JSC and MSFC. Luminosity ratios for debris events 6, 14, 1, and 2 were measured from the videos. The first application of these ratios was to establish upper and lower limits on the mass estimates for each debris. In order to determine those absolute mass bounds for the
This information is being distributed to aid in the investigation of the Columbia mishap and should only be distributed to personnel who are actively involved in this investigation.
81
NSTS-37384STS-107 Image Analysis Team Final Report.pdf
C0-000045
CAB066-1033
COLUMBIAACCIDENT INVESTIGATION BOARD
REPORT VOLUME III OCTOBER 2003 109
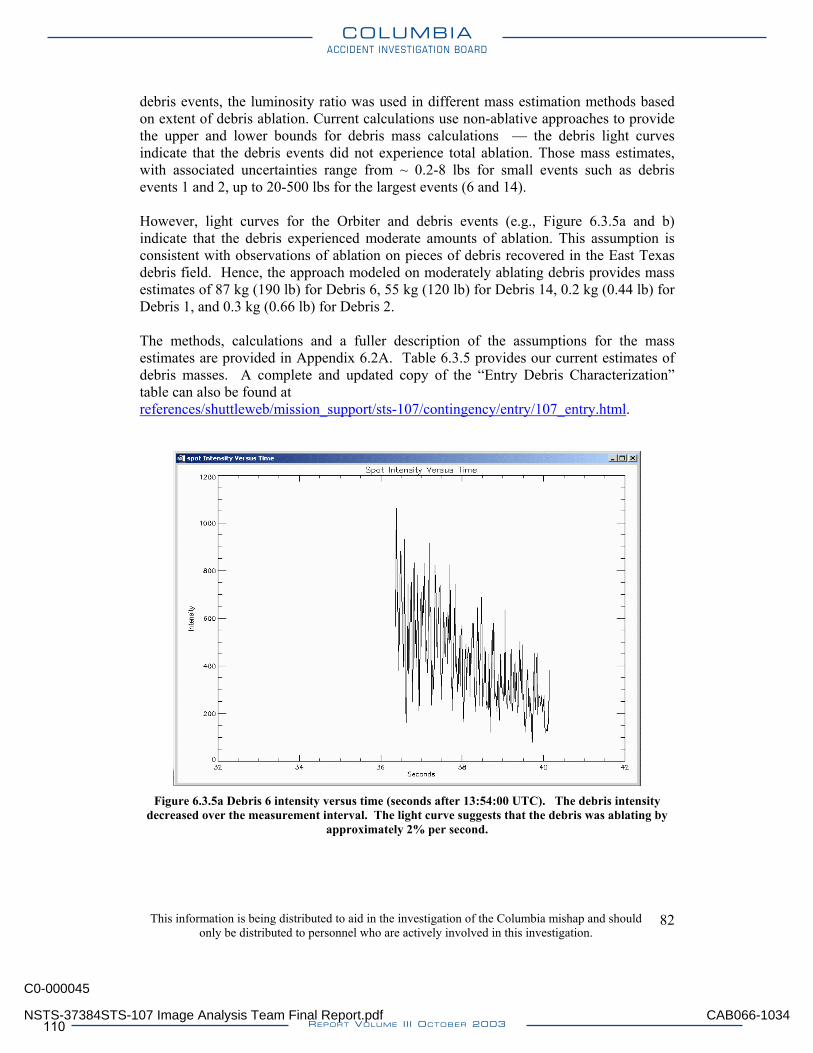
debris events, the luminosity ratio was used in different mass estimation methods based on extent of debris ablation. Current calculations use non-ablative approaches to provide the upper and lower bounds for debris mass calculations — the debris light curves indicate that the debris events did not experience total ablation. Those mass estimates, with associated uncertainties range from ~ 0.2-8 lbs for small events such as debris events 1 and 2, up to 20-500 lbs for the largest events (6 and 14). However, light curves for the Orbiter and debris events (e.g., Figure 6.3.5a and b) indicate that the debris experienced moderate amounts of ablation. This assumption is consistent with observations of ablation on pieces of debris recovered in the East Texas debris field. Hence, the approach modeled on moderately ablating debris provides mass estimates of 87 kg (190 lb) for Debris 6, 55 kg (120 lb) for Debris 14, 0.2 kg (0.44 lb) for Debris 1, and 0.3 kg (0.66 lb) for Debris 2. The methods, calculations and a fuller description of the assumptions for the mass estimates are provided in Appendix 6.2A. Table 6.3.5 provides our current estimates of debris masses. A complete and updated copy of the “Entry Debris Characterization” table can also be found at references/shuttleweb/mission_support/sts-107/contingency/entry/107_entry.html.
Figure 6.3.5a Debris 6 intensity versus time (seconds after 13:54:00 UTC). The debris intensity
decreased over the measurement interval. The light curve suggests that the debris was ablating by approximately 2% per second.
This information is being distributed to aid in the investigation of the Columbia mishap and should only be distributed to personnel who are actively involved in this investigation.
82
NSTS-37384STS-107 Image Analysis Team Final Report.pdf
C0-000045
CAB066-1034
COLUMBIAACCIDENT INVESTIGATION BOARD
REPORT VOLUME III OCTOBER 2003110
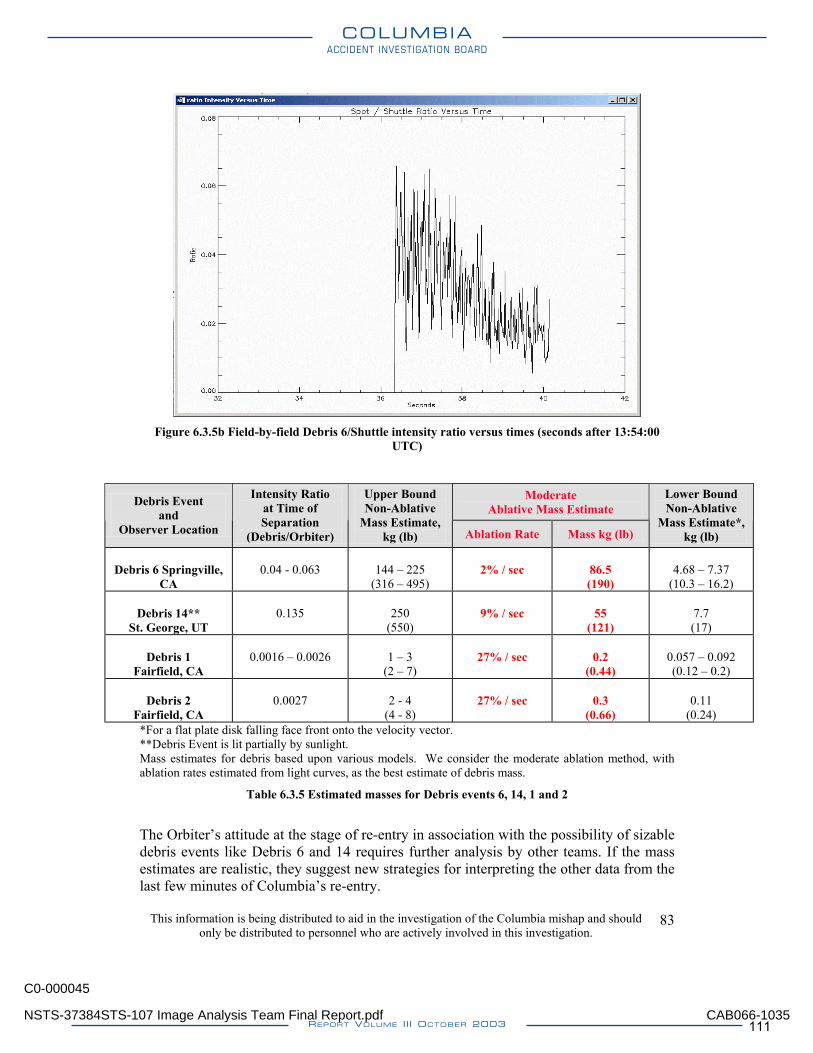
Figure 6.3.5b Field-by-field Debris 6/Shuttle intensity ratio versus times (seconds after 13:54:00
UTC)
Moderate Ablative Mass Estimate
Debris Event and
Observer Location
Intensity Ratio at Time of Separation
(Debris/Orbiter)
Upper Bound Non-Ablative
Mass Estimate, kg (lb) Ablation Rate Mass kg (lb)
Lower Bound Non-Ablative
Mass Estimate*, kg (lb)
Debris 6 Springville,
CA
0.04 - 0.063
144 – 225
(316 – 495)
2% / sec
86.5 (190)
4.68 – 7.37
(10.3 – 16.2)
Debris 14** St. George, UT
0.135
250
(550)
9% / sec
55
(121)
7.7 (17)
Debris 1
Fairfield, CA
0.0016 – 0.0026
1 – 3
(2 – 7)
27% / sec
0.2
(0.44)
0.057 – 0.092 (0.12 – 0.2)
Debris 2
Fairfield, CA
0.0027
2 - 4
(4 - 8)
27% / sec
0.3
(0.66)
0.11
(0.24) *For a flat plate disk falling face front onto the velocity vector. **Debris Event is lit partially by sunlight. Mass estimates for debris based upon various models. We consider the moderate ablation method, with ablation rates estimated from light curves, as the best estimate of debris mass.
Table 6.3.5 Estimated masses for Debris events 6, 14, 1 and 2
The Orbiter’s attitude at the stage of re-entry in association with the possibility of sizable debris events like Debris 6 and 14 requires further analysis by other teams. If the mass estimates are realistic, they suggest new strategies for interpreting the other data from the last few minutes of Columbia’s re-entry.
This information is being distributed to aid in the investigation of the Columbia mishap and should only be distributed to personnel who are actively involved in this investigation.
83
NSTS-37384STS-107 Image Analysis Team Final Report.pdf
C0-000045
CAB066-1035
COLUMBIAACCIDENT INVESTIGATION BOARD
REPORT VOLUME III OCTOBER 2003 111
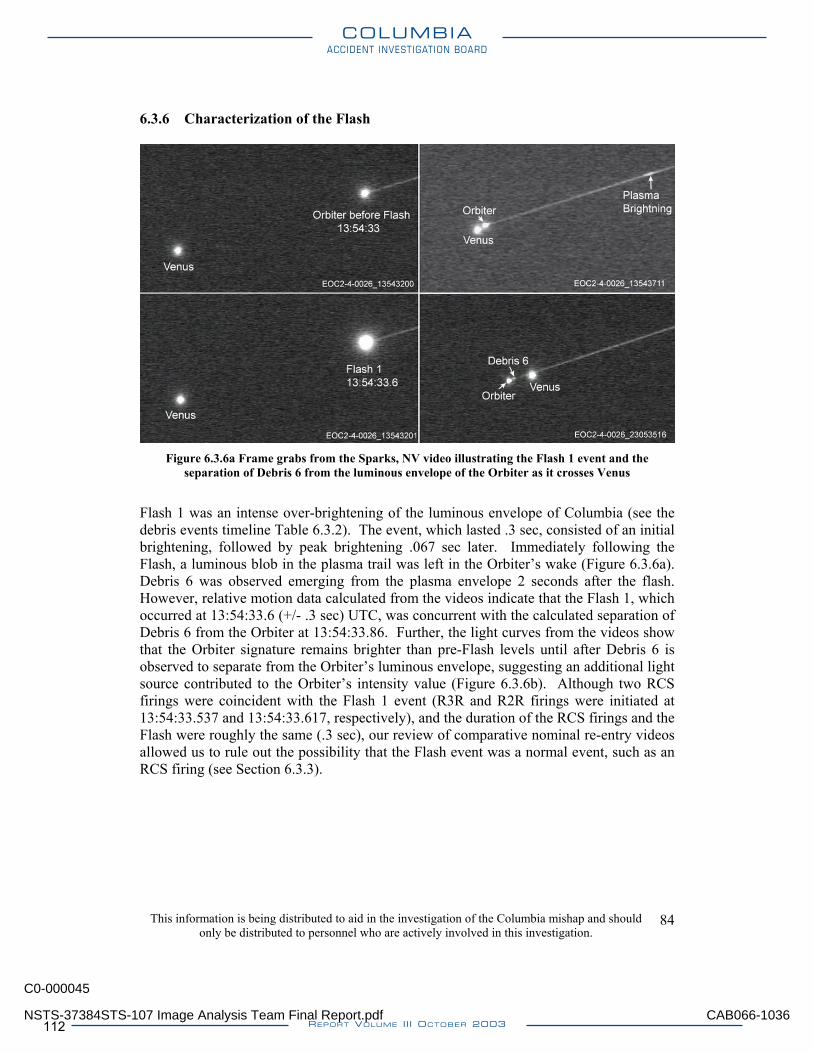
6.3.6 Characterization of the Flash
Figure 6.3.6a Frame grabs from the Sparks, NV video illustrating the Flash 1 event and the
separation of Debris 6 from the luminous envelope of the Orbiter as it crosses Venus
Flash 1 was an intense over-brightening of the luminous envelope of Columbia (see the debris events timeline Table 6.3.2). The event, which lasted .3 sec, consisted of an initial brightening, followed by peak brightening .067 sec later. Immediately following the Flash, a luminous blob in the plasma trail was left in the Orbiter’s wake (Figure 6.3.6a). Debris 6 was observed emerging from the plasma envelope 2 seconds after the flash. However, relative motion data calculated from the videos indicate that the Flash 1, which occurred at 13:54:33.6 (+/- .3 sec) UTC, was concurrent with the calculated separation of Debris 6 from the Orbiter at 13:54:33.86. Further, the light curves from the videos show that the Orbiter signature remains brighter than pre-Flash levels until after Debris 6 is observed to separate from the Orbiter’s luminous envelope, suggesting an additional light source contributed to the Orbiter’s intensity value (Figure 6.3.6b). Although two RCS firings were coincident with the Flash 1 event (R3R and R2R firings were initiated at 13:54:33.537 and 13:54:33.617, respectively), and the duration of the RCS firings and the Flash were roughly the same (.3 sec), our review of comparative nominal re-entry videos allowed us to rule out the possibility that the Flash event was a normal event, such as an RCS firing (see Section 6.3.3).
This information is being distributed to aid in the investigation of the Columbia mishap and should only be distributed to personnel who are actively involved in this investigation.
84
NSTS-37384STS-107 Image Analysis Team Final Report.pdf
C0-000045
CAB066-1036
COLUMBIAACCIDENT INVESTIGATION BOARD
REPORT VOLUME III OCTOBER 2003112
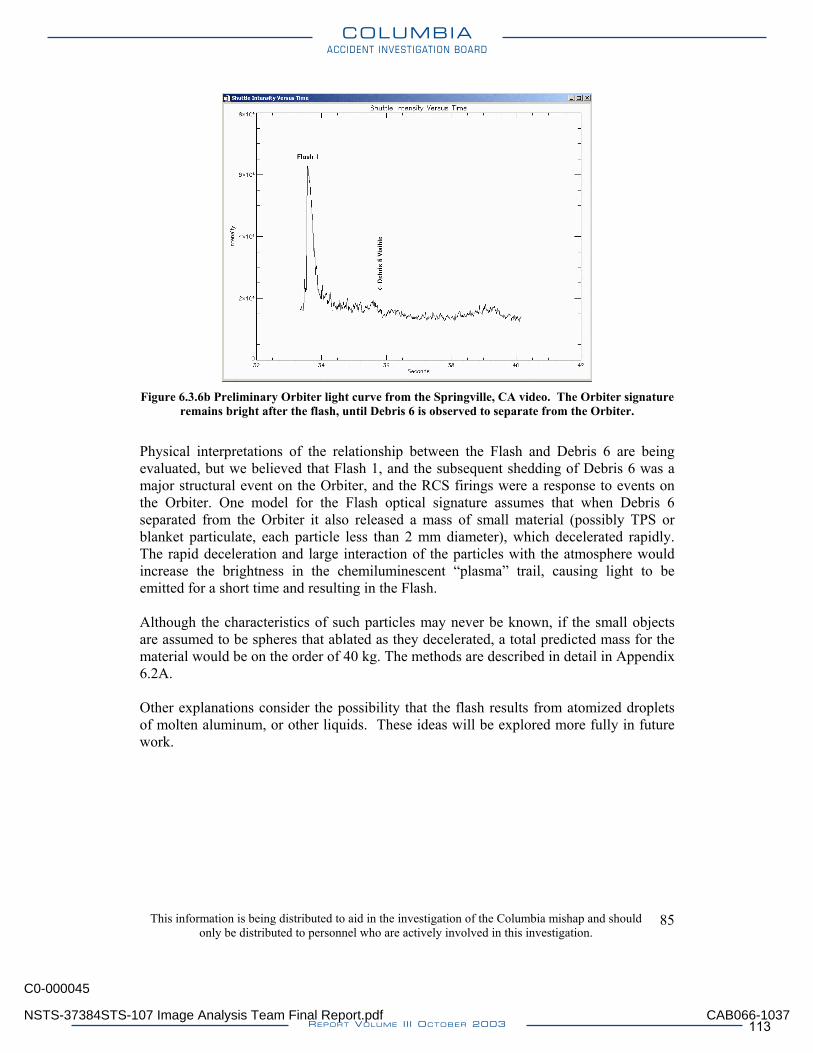
Figure 6.3.6b Preliminary Orbiter light curve from the Springville, CA video. The Orbiter signature
remains bright after the flash, until Debris 6 is observed to separate from the Orbiter.
Physical interpretations of the relationship between the Flash and Debris 6 are being evaluated, but we believed that Flash 1, and the subsequent shedding of Debris 6 was a major structural event on the Orbiter, and the RCS firings were a response to events on the Orbiter. One model for the Flash optical signature assumes that when Debris 6 separated from the Orbiter it also released a mass of small material (possibly TPS or blanket particulate, each particle less than 2 mm diameter), which decelerated rapidly. The rapid deceleration and large interaction of the particles with the atmosphere would increase the brightness in the chemiluminescent “plasma” trail, causing light to be emitted for a short time and resulting in the Flash. Although the characteristics of such particles may never be known, if the small objects are assumed to be spheres that ablated as they decelerated, a total predicted mass for the material would be on the order of 40 kg. The methods are described in detail in Appendix 6.2A. Other explanations consider the possibility that the flash results from atomized droplets of molten aluminum, or other liquids. These ideas will be explored more fully in future work.
This information is being distributed to aid in the investigation of the Columbia mishap and should only be distributed to personnel who are actively involved in this investigation.
85
NSTS-37384STS-107 Image Analysis Team Final Report.pdf
C0-000045
CAB066-1037
COLUMBIAACCIDENT INVESTIGATION BOARD
REPORT VOLUME III OCTOBER 2003 113
6.4 Other Re-entry Analyses 6.4.1 Star Fire Imagery Analysis A unique set of re-entry videos was obtained through telescopes at the Starfire Optical Range, in Albuquerque, New Mexico. Image Analysis Team members participated on the Starfire Analysis Team. The work of that team will be reported separately as the “Starfire Team Final Report”. 6.4.2 The Near Earth Asteroid Tracking Program on Mount Palomar A California citizen provided a 60-second-exposure telescope image of the Columbia re-entry taken from Mount Palomar. After examining the image, it was determined that the long exposure and low spatial resolution of the image limited its ability to provide information on debris shedding or other re-entry anomalies. 6.4.3 Special Still Imagery Analyses of Alleged “Lightning” Image A still image taken from California was submitted to NASA by a member of the public. A superficial look at the image suggested that it might record an anomalous re-entry event that was claimed to be lightning striking the Orbiter. Our analysis suggested that the pattern was due to camera vibrations during a long-exposure. A separate upper atmospheric scientific team also investigated the image. The results of those analyses are being reported separately. 6.4.4 Tile Number Enhancement A tile that was recovered on the ground in Lufkin, TX had numbers that were impossible to read. The Image Analysis Team received a digital photograph taken of the tile. Image enhancements and noise reduction were performed to bring out information on the number that was not readily visible to the eye. Based on this information, the tile could be located to a location on the Orbiter. 6.4.5 Special Analysis of Video from The Colony, TX A view of the Orbiter in one of the publicly acquired videos caused speculation from within NASA and the general public that video EOC2-4-0012 taken over Texas showed Orbiter detail. The Image Analysis Team conducted a detailed analysis of the imagery and cameras, and analysts at Aerospace were involved as an independent validation. It was concluded that given the spatial resolution of the camera, it would be impossible for the image to show Orbiter detail. The observed pattern was actually an artifact created by a combination of the following factors: the camera was out of focus, the object was too bright for the camera causing pixel saturation and blooming, a diffraction pattern from the triangular shape of the camera aperture produced the observed geometry, and the camera’s internal digital magnification increased the effects. To put all speculation to
This information is being distributed to aid in the investigation of the Columbia mishap and should only be distributed to personnel who are actively involved in this investigation.
86
NSTS-37384STS-107 Image Analysis Team Final Report.pdf
C0-000045
CAB066-1038
COLUMBIAACCIDENT INVESTIGATION BOARD
REPORT VOLUME III OCTOBER 2003114
rest, the effect was also simulated using the same camera model. The full report of this analysis can be obtained at shuttleweb/mission_support/sts-107/contingency/other/Aero.pdf. 6.4.6 Video Sequence Compilation At the request of the OVEWG and CAIB, broadcast-quality compilations of the re-entry video sequence were produced to accompany the written timeline of events. They were produced by the Image Analysis Team with support from JSC Public Affairs. NASA public affairs sought permissions from the videographers and the compilation was shown to Congress and in CAIB public hearings. The final version produced, “Photo/TV Analysis Team – Entry Debris Events Version 7” master is archived by the Imagery Services Branch (Video), Information Systems Directorate. 6.4.7 Videos Showing Columbia’s Break-up Over Texas As of the date of this report, support for additional analyses of videos showing Columbia’s break-up over Texas has been requested. These analyses will not be included in this report.
This information is being distributed to aid in the investigation of the Columbia mishap and should only be distributed to personnel who are actively involved in this investigation.
87
NSTS-37384STS-107 Image Analysis Team Final Report.pdf
C0-000045
CAB066-1039
COLUMBIAACCIDENT INVESTIGATION BOARD
REPORT VOLUME III OCTOBER 2003 115
7.0 Lessons Learned and Recommendations The investigation following the STS-107 accident demonstrated the importance of imagery to observe, document, and analyze key elements of a Shuttle mission and off-nominal events. The investigation also demonstrated that existing imagery resources are inadequate in every phase of flight - launch, orbit, and entry. In the wake of this investigation, the Image Analysis Team recommends upgrades and improvements to the imaging capabilities for all phases of Shuttle flights and the analytical capabilities to interpret that imagery. The recommendations address lessons learned specifically from STS-107 and from the limitations of the Shuttle imaging capabilities that have been encountered over the course of the Shuttle Program. After the Shuttle Challenger accident in 1986, the Shuttle Program implemented significant improvements to the Shuttle imaging and image analysis capabilities, including greatly expanded camera coverage for launches and the establishment of imagery review and analysis facilities at the NASA centers. Since the post-Challenger return to flight, the Shuttle imagery capabilities have weakened considerably. For example, camera coverage for launch and landing has been significantly reduced and camera systems are outdated or in need of upgrades. In the post-Columbia era, a continuous improvement in imaging capabilities is needed to fully support Shuttle missions with imagery analysis and to avoid a repeat of post-Challenger decay of Shuttle imaging capabilities. This report contains recommendations for the launch and entry phases of flight. For the orbit phase, the Shuttle Program has begun to establish the capability for comprehensive on-orbit imagery inspection of the Orbiter. At the time of this writing, the Image Analysis Team is engaged in the definition of the on-orbit capability, which is beyond the scope of this document. 7.1 Launch Imagery - Ground Both during the STS-107 mission and post-accident, the image analyses of the debris-impact event during ascent were severely hindered by limitations of the launch imagery. The need for the most sophisticated and detailed analyses underscored other limitations of the launch imagery. Key limitations included insufficient spatial and temporal resolution of the imagery, indeterminate variations in the timing data for the film and video, and late access to reproductions of the best quality imagery. Recommendations are given below for improvements to the launch camera hardware, coverage, and imagery reproduction and distribution. Launch Camera Upgrades
Increase the frame rates of all 35 mm film trackers to at least 100 frames per second. The current frame rates for the tracking cameras provide inadequate temporal resolution for analyzing high-speed, transient events during ascent, such as debris shedding.
•
This information is being distributed to aid in the investigation of the Columbia mishap and should only be distributed to personnel who are actively involved in this investigation.
88
NSTS-37384STS-107 Image Analysis Team Final Report.pdf
C0-000045
CAB066-1040
COLUMBIAACCIDENT INVESTIGATION BOARD
REPORT VOLUME III OCTOBER 2003116
Replace all video cameras with HDTV or high-speed digital cameras. The current NTSC-format video cameras provide insufficient spatial and temporal resolution for detailed analysis.
•
•
•
•
•
•
•
•
•
Increase the focal lengths for selected long-range tracking cameras. Current focal lengths for some tracking cameras provide inadequate spatial resolution for assessing vehicle details during ascent.
Upgrade the timing data on all tracking film cameras to digital timing. Current IRIG timing must be manually decoded. This can introduce error and is a slow process.
Time-sync selected launch cameras. Currently, the launch cameras are not synchronized, resulting in indeterminate timing offsets from one camera to another, hampering image analyses that employ multi-camera solutions.
Improve launch pad lighting for night launches. Currently, prior to SRB ignition on night launches, critical areas of the launch vehicle are in darkness resulting in severely underexposed imagery of those areas.
Implement auto-tracking on selected long-range tracking cameras. The current manual tracking for some cameras is often inadequate, causing loss of image coverage.
Modernize the Operational TV system. The cameras are old, and some are black and white. Higher resolution technology is available.
Evaluate new camera locations east of the launch site (via aircraft/ships). Currently, camera coverage east of the launch site is unavailable and it would provide additional data for triangulation and new views of the vehicle.
Evaluate reinstating cameras deleted in the FY95 Program Requirements Definition scrub. The numbers of launch-site cameras were greatly decreased in this cost-savings scrub, which adversely reduced the launch imagery coverage.
Camera Maintenance
Revise camera maintenance protocols to ensure consistent focus and exposure. Currently, out-of-focus imagery for the launch cameras is a common problem. Technologies for improved image focus should be investigated.
•
•
Establish routine optical calibrations for all tracking camera systems. Currently, the camera systems are uncalibrated for removing distortions in the optics, hindering detailed image analyses.
This information is being distributed to aid in the investigation of the Columbia mishap and should only be distributed to personnel who are actively involved in this investigation.
89
NSTS-37384STS-107 Image Analysis Team Final Report.pdf
C0-000045
CAB066-1041
COLUMBIAACCIDENT INVESTIGATION BOARD
REPORT VOLUME III OCTOBER 2003 117
Establish protocols for routine camera inspections to detect and repair optical problems. The loss of critical launch imagery due to camera optics problems, such as with E-208 during STS-107, is unacceptable.
•
Data Handling and Distribution
Provide consistent, stabilized timing on the launch + 5 hours video tracking camera replays. Currently, the timing data for these replays are often missing or inaccurate.
•
•
•
•
Improve the timeliness for distributing the launch +5 hours video tracking camera replays. On STS-107, the replays were not received outside of KSC until the day after the launch.
Replace analog video recorders with digital recording for the video data. The current analog recording results in loss of data, degrading the image resolution and timing accuracy.
Improve the timeliness for distributing the highest quality imagery for analysis. On STS-107, a great deal of time was spent analyzing and re-analyzing imagery each time a better copy of the imagery (i.e., closer to the original) was obtained. The processes for acquiring the best quality imagery, developed on STS-107 and documented in this report, should be implemented on a routine basis.
Other Recommendations
Provide more complete, higher resolution closeout photography of the entire vehicle prior to launch. The current coverage and quality of the pre-mission closeout imagery is often inadequate for detailed comparison with on-orbit imagery of the vehicle.
•
•
Add requirements that specify a minimum, critical subset of launch camera systems that must be operational prior to launch. Currently, the minimum imagery capability required to support launch is undefined.
7.2 Launch Imagery - Onboard The primary imagery for post-launch evaluation of the ET is acquired onboard by the umbilical well film cameras and by the crews (video and photography) after ET separation. The STS-107 ET video imagery was downlinked by the crew early in the mission, but the umbilical well images and crew photography of the ET were unrecovered after the accident. This resulted in the loss of critical data for the accident investigation to assess the condition of the ET foam insulation. The recommendations below are made to improve the onboard imaging capabilities for assessments of the conditions of the ET and Orbiter during ascent.
This information is being distributed to aid in the investigation of the Columbia mishap and should only be distributed to personnel who are actively involved in this investigation.
90
NSTS-37384STS-107 Image Analysis Team Final Report.pdf
C0-000045
CAB066-1042
COLUMBIAACCIDENT INVESTIGATION BOARD
REPORT VOLUME III OCTOBER 2003118
Provide at least one digital video, digital still, or digital motion camera in an Orbiter umbilical well, with downlink capability for the umbilical well imagery early in the mission. Currently, the umbilical well imagery is all film, which is unavailable for screening and analysis until processed post-landing.
•
•
•
Provide crew-handheld, high-resolution digital video and still cameras for ET imaging. Institute a crew procedure to expedite downlink of the imagery early in the mission. Currently, the crew film photography of the ET is unavailable for analysis until post-landing. Video cameras with higher resolution than those currently flown are available.
Install digital, down-linkable video cameras on the SRBs and the ET to provide views of critical areas of the Orbiter and ET during ascent on every mission. Onboard imaging assets are currently not employed. These onboard assets are needed to improve overall imagery coverage during ascent and to extend coverage beyond the range of the launch-site cameras.
7.3 Entry Imagery Analyses of the Columbia debris-shedding events during STS-107 re-entry were severely hindered by the poor quality of the imagery available for analysis. Analyses were also hindered by the general lack of information on the optical signatures, visual and spectral, of nominal Shuttle re-entries for comparison with the anomalies observed in the STS-107 re-entry imagery. As a result of the STS-107 experience, the Image Analysis Team recommends that the Shuttle Program develop the capability to image Shuttle re-entries with scientific instrumentation. Analysis techniques, such as those reported in Section 6 of this document, also need further development to provide a better understanding of the visual characteristics of Shuttle re-entries and the physical nature of the optical radiation. Specific recommendations are given below for the systematic acquisition of imagery for future Shuttle re-entries and imagery analysis. Also, recommendations are provided for improved imagery coverage for the primary landing sites. Re-Entry Imagery Acquisition
Deploy ground-based scientific instrumentation near ground-track locations for imaging Shuttle re-entries. This instrumentation should be selected to have the spatial resolution, spectral response, and timing accuracy needed for identification and analyses of off-nominal events. Make use of outside agency resources for observations when applicable. It is unacceptable to rely solely on the general public with consumer grade equipment to provide critical imagery of Shuttle re-entries, as was the case for STS-107.
•
•
Investigate the use of airborne observations of Shuttle re-entries. Aircraft equipped with imaging sensors operating above the cloud level have successfully imaged spacecraft re-entries, and would provide valuable data for understanding the optical signatures of Shuttle re-entry.
This information is being distributed to aid in the investigation of the Columbia mishap and should only be distributed to personnel who are actively involved in this investigation.
91
NSTS-37384STS-107 Image Analysis Team Final Report.pdf
C0-000045
CAB066-1043
COLUMBIAACCIDENT INVESTIGATION BOARD
REPORT VOLUME III OCTOBER 2003 119
Investigate the use of re-entry imagery acquired from the crew cabin through the Shuttle windows. In-situ observations of the Orbiter’s plasma environment would provide a valuable perspective for comparison with ground- or airborne-based imagery of re-entry.
•
Re-Entry Analysis
Research the nature of the optical radiation generated during Shuttle re-entries. The Shuttle's optical signature via interaction with the upper atmosphere has not been researched in detail, which is necessary to detect and characterize off-nominal conditions. The research initiated by the STS-107 investigation, reported in Section 6 of this document, should continue and be expanded to develop imaging techniques for assessing Orbiter health during entry.
•
•
•
Conduct spectral analysis from the arcjet testing of Orbiter materials and compare with imagery from Shuttle re-entries. In addition to the basic research noted above, the arcjet laboratory studies address the fundamental lack of knowledge of the optical characteristics of Shuttle re-entry.
Adopt the video reproduction methods developed during the STS-107 investigation as the protocol for video imagery duplication. Image Analysis Team re-entry analyses were compromised early in the investigation by not having access to the highest quality imagery for analysis.
Landing Site Imagery
Evaluate reinstating landing-site cameras deleted in the FY95 Program Requirements Definition scrub, in particular, for Dryden and White Sands. For trans-Atlantic landing sites, provide a minimum set of video tracking and landing cameras. The numbers of landing-site cameras were greatly decreased in this cost-savings scrub, which adversely reduced the imagery coverage for landing.
•
7.4 Analysis Resources and Protocols The Image Analysis Team recommends continuous upgrades to existing image analysis facilities to handle the anticipated larger volume of mission imagery and associated analyses, such as from on-orbit inspections, and to facilitate the steady improvements in the state-of-the-art analysis hardware and software. Of greatest importance is the capability to quickly ingest, manipulate, duplicate, and distribute best digital formats of all imagery. Upgrades for server systems to accommodate the new imagery and database requirements, software for data analysis, and display and reproduction to facilitate communications are important components of the analysis facilities. Together, these upgrades will enhance the quality of imagery analysis products and reduce the turn-around time for delivery. Other recommendations include the following:
This information is being distributed to aid in the investigation of the Columbia mishap and should only be distributed to personnel who are actively involved in this investigation.
92
NSTS-37384STS-107 Image Analysis Team Final Report.pdf
C0-000045
CAB066-1044
COLUMBIAACCIDENT INVESTIGATION BOARD
REPORT VOLUME III OCTOBER 2003120
Utilize the NASA Intercenter Photographic and Television Analysis Contingency Action Plan (NSTS 08218). The Program decision to not implement NSTS 08218 following the accident led to duplication of work, confusion on tasks to be performed, and miscommunication within the image analysis community and with external organizations. Ultimately, the Team reported to Orbiter Vehicle Engineering Working Group, however, NSTS 08218 specified direct reporting to Space Shuttle Program management.
•
•
•
Maintain a pool of contingency image analysts. The STS-107 investigation demonstrated the need to maintain a complement of imagery specialists that can be quickly matrixed to support a large number of unplanned image analysis tasks. For example, the JSC Earth Observations image specialists were immediately assimilated into the STS-107 Image Analysis Team, and were crucial to the quick response to the many varied image analyses.
Establish and maintain a state-of-the-art imagery analysis database for Shuttle engineering performance assessments, anomaly and contingency support, quick reference, and comparisons across missions. The need for this type of database was clearly demonstrated throughout the STS-107 investigation, a massive undertaking for analyses of imagery from all phases of the mission with cross-references to previous missions. The database, once developed, would be an invaluable and long overdue resource for cataloging and archiving imagery and supporting data for observed events, nominal and anomalous, for all phases of flight.
This information is being distributed to aid in the investigation of the Columbia mishap and should only be distributed to personnel who are actively involved in this investigation.
93
NSTS-37384STS-107 Image Analysis Team Final Report.pdf
C0-000045
CAB066-1045
COLUMBIAACCIDENT INVESTIGATION BOARD
REPORT VOLUME III OCTOBER 2003 121
8.0 STS-107 Investigation Image Analysis Team This section provides an overview of the structure and personnel of the STS-107 Image Analysis Team. The launch and entry analyses were highly disparate in terms of the imagery to work with and analysis processes and objectives. Therefore the Image Analysis Team was broadly partitioned into two major sub-teams, launch and entry, each with a unique set of expertise for the analysis tasks at hand. Groups from multiple NASA centers and organizations outside of NASA contributed to the Team effort; a short description of their roles is provided in Section 8.1. Individual contributors are listed in Section 8.2, with biographies of key contributors provided in Section 8.3. 8.1 Image Analysis Sub-teams Launch and On-orbit Analysis Sub-team
• JSC-SX – Image Science and Analysis Group – Performed full characterization of the launch debris event including a complete frame-by-frame description of the debris shedding, calculation of debris size, trajectory, impact velocity, impact angle, and impact location on the Orbiter’s left wing. In addition, JSC-SX, compiled and evaluated the debris characterization results obtained by the other Image Analysis team members. JSC-SX also performed a thorough review of all on-orbit imagery of the Orbiter’s left wing and debris seen in downlinked imagery.
• JSC-ES – Structural Engineering Division – Performed trajectory, impact velocity, impact angle, and impact location for the launch debris event.
• JSC-EG – Aeroscience and Flight Mechanics Division – Supplied key reference data such as the Shuttle CAD models and performed trajectory, impact velocity, impact angle, and impact location for launch debris event.
• MSFC – Engineering Photographic Analysis Team – Provided image analysis of the primary STS-107 launch events with an emphasis on the debris event. A complete frame-by-frame description of the debris shedding event as well as analyses for the debris size, trajectory, impact velocity, impact angle, and impact location were performed.
• KSC – Ice/Debris and Image Analysis Team – Performed a detailed re-screening of all STS-107 launch video and film cameras. Also provided analysis of the debris seen at 82 seconds MET. A complete frame-by-frame description of the debris shedding event as well as analyses for the debris size, trajectory, impact velocity, impact angle, and impact location were performed.
• LaRC – NASA Langley Research Center performed image enhancements on the launch video and film.
• National Imagery and Mapping Agency (NIMA) – At the request of NASA, NIMA provided specific analyses of the debris seen at 82 seconds MET. NIMA analyses focused primarily on the debris velocity, rotation rate, and whether any debris was detected coming over the top of the wing after the main debris impact.
• Lockheed Martin Management and Data Systems (LM–M&DS) and Advanced Technology Center – At the request of NASA, industry experts in
This information is being distributed to aid in the investigation of the Columbia mishap and should only be distributed to personnel who are actively involved in this investigation.
94
NSTS-37384STS-107 Image Analysis Team Final Report.pdf
C0-000045
CAB066-1046
COLUMBIAACCIDENT INVESTIGATION BOARD
REPORT VOLUME III OCTOBER 2003122
image analysis were brought in to help with the investigation. Lockheed Martin analyses for the STS-107 investigation focused on image deblurring and sharpening as well as determining the 82 second MET debris size, velocity and trajectory.
Entry Analysis Sub-team
• JSC-SX – Human Exploration Science Office – Three groups from within SX collaborated to support the re-entry image analysis. The Image Science and Analysis Group, the Earth Observations group, and the Orbital Debris group all worked together to coordinate and perform all phases of the re-entry analysis, including the imagery screening, cataloging and timelining, debris relative motion analyses and debris luminosity characterization and mass estimates.
• JSC-DM – Flight Design and Dynamics Branch, Mission Operations Directorate – Members from JSC-DM performed relative motion analyses in conjunction with JSC-SX in order to derive ballistic coefficients, and reviewed re-entry videos as part of the timelining team.
• MSFC Space Environments Team – Contributed to the Luminosity Working Group analysis. They applied their techniques for analyzing videos of meteorites to the STS-107 re-entry videos to facilitate the calculation of mass estimates for the re-entry debris events.
• KSC Applied Physics Lab – Participated in the Luminosity Working Group to help define the physics equations for interpreting the light curves of the debris events and calculate mass estimates for events.
• AMES Reacting Flow Environments Lab – Participated in the Luminosity Working Group to coordinate the arcjet testing to determine whether the debris spectral signatures could be interpreted, and helped to frame the lower bound conditions for a non-ablating object.
• Neptec – Characterized key optical properties of the cameras used by the public to capture imagery of the entry that was later used for analysis. This effort was made possible by a team effort that consisted of a group of 2 engineers, 1 physicist and 1 technologist. The team gained its experience in the characterization of optical systems through the operational support of their Space Vision System and Laser Camera System.
8.2 Individual Team Contributors (Biographies for key contributors are given in
Section 8.3) Image Analysis Team Contributors - Launch and Orbit Analyses Greg Byrne/JSC/SX Mike Snyder/JSC/Lockheed Martin/SX Jon Disler/JSC/Lockheed Martin/SX Cynthia Evans/JSC/Lockheed Martin/SX David Bretz/JSC/Hernandez/SX Fred Martin/JSC/EG
This information is being distributed to aid in the investigation of the Columbia mishap and should only be distributed to personnel who are actively involved in this investigation.
95
NSTS-37384STS-107 Image Analysis Team Final Report.pdf
C0-000045
CAB066-1047
COLUMBIAACCIDENT INVESTIGATION BOARD
REPORT VOLUME III OCTOBER 2003 123
Joe Gessler/JSC/ES Robert Page/KSC Armando Oliu/KSC Robbie Robinson/KSC/Johnson Controls Tom Rieckhoff/MSFC Michael O’Farrell/MSFC Ivar Svendson/NIMA Jim Salacain/NIMA/Spatial Analytics Dwight Divine/Lockheed Martin Management & Data Systems Eamon Barrett/Lockheed Martin Management & Data Systems Marv Klein/Lockheed Martin Management & Data Systems Lorelei Lohrli-Kirk/Boeing Travis Bailey/JSC/Lockheed Martin/EA Joe Caruana/JSC/Lockheed Martin/SX Ken Castleman/ADIR/SX Fred Clark/JSC/Lockheed Martin/EA Chris Cloudt/JSC/Hernandez/SX Michael Cohen/Lockheed Martin Management & Data Systems Richard Coles/JSC/Lockheed Martin/EV Dean Coleman/JSC/Lockheed Martin/EA Kevin Crosby/JSC/Lockheed Martin/SX Don Curry/JSC/ES Horacio de la Fuente/JSC/ES Jim Dragg/JSC/LZ Tech/SX Curt Erck/JSC/Lockheed Martin/EA Mansour Falou/JSC/Lockheed Martin/EA Steve Frick/JSC/CB Jeff Froemming/JSC/Lockheed Martin/EA Ray Gomez/JSC/EG Susan Gomez/JSC/ES Brad Henry/JSC/Lockheed Martin/EA James Heydorn/JSC/Lockheed Martin/SX William Kleinfelder/KSC John Lane/KSC/ASRC Aerospace Brad Lawrence/KSC/USA Brett McRay/JSC/Lockheed Martin/SX Erica Miles/JSC/Lockheed Martin/SX Teresa Morris/JSC/Lockheed Martin/SX Eric Nielsen/JSC/Hernandez/SX Carlos Ortiz/Boeing Ed Oshel/JSC/Hernandez/SX Philip Peterson/Boeing Michelle Phlegley/KSC/USA Mark Pritt/Lockheed Martin Management & Data Systems Jerry Posey/JSC/Lockheed Martin/EA Brian Rochon/JSC/Lockheed Martin/EA
This information is being distributed to aid in the investigation of the Columbia mishap and should only be distributed to personnel who are actively involved in this investigation.
96
NSTS-37384STS-107 Image Analysis Team Final Report.pdf
C0-000045
CAB066-1048
COLUMBIAACCIDENT INVESTIGATION BOARD
REPORT VOLUME III OCTOBER 2003124
Rob Scharf/JSC/Lockheed Martin/SX Leslie Upchurch/JSC/Lockheed Martin/SX Benjamin Quasius/JSC/ES Rich Ulrich/JSC/Lockheed Martin/EA Glenn Woodell/LaRC Tom Scully/Lockheed Martin Management & Data Systems David A. Bennett/Lockheed Martin Advanced Technology Center Dr. Don Flaggs/Lockheed Martin Advanced Technology Center Constantine Orogo/Lockheed Martin Advanced Technology Center Paul Payton/Lockheed Martin Advanced Technology Center Dr. Bob Remington/Lockheed Martin Advanced Technology Center Dr. Gary Mastin/Lockheed Martin Management & Data Systems Sean Hatch/Lockheed Martin Management & Data Systems Doug Rohr/Lockheed Martin Management & Data Systems Dave Goodwin/Lockheed Martin Management & Data Systems Dr. Bryan Stossel/Lockheed Martin Management & Data Systems Dr. David Tyler/Lockheed Martin Management & Data Systems Rod Pickens/Lockheed Martin Management & Data Systems Dr. Randy Thompson/Lockheed Martin Management & Data Systems
Image Analysis Team Contributors – Entry Analyses Greg Byrne/JSC/SX Cynthia Evans/JSC/Lockheed Martin/SX David Bretz/JSC/Hernandez/SX Donn Liddle/JSC/Lockheed Martin/SX Julie Robinson/JSC/Lockheed Martin/SX Kandy Jarvis/JSC/Lockheed Martin/SX Kira Jorgensen/JSC/SX Nicole Stott/JSC/CB Doug Holland/JSC/EV Bob Youngquist/KSC Applied Physics Lab Phil Metzger/KSC Applied Physics Lab George Raiche/ARC Reacting Flow Environments Bill Cooke/MSFC Space Environments Team Rob Suggs/MSFC Space Environments Team Wes Swift/MSFC Space Environments Team Jeff Anderson/MSFC Space Environments Team Heather Lewis/MSFC Space Environments Team Kevin Crosby/JSC/Lockheed Martin/SX James Heydorn/JSC/Lockheed Martin/SX Amanda Johnson/JSC/Lockheed Martin/SX Brett McRay/JSC/Lockheed Martin/SX Teresa Morris/JSC/Lockheed Martin/SX Eric Nielsen/JSC/Hernandez/SX Ed Oshel/JSC/Hernandez/SX
This information is being distributed to aid in the investigation of the Columbia mishap and should only be distributed to personnel who are actively involved in this investigation.
97
NSTS-37384STS-107 Image Analysis Team Final Report.pdf
C0-000045
CAB066-1049
COLUMBIAACCIDENT INVESTIGATION BOARD
REPORT VOLUME III OCTOBER 2003 125
Rob Scharf/JSC/Lockheed Martin/SX Mike Snyder/JSC/Lockheed Martin/SX Alan Spraggins/JSC/Hernandez/SX Leslie Upchurch/JSC/Lockheed Martin/SX Justin Wilkinson/JSC/Lockheed Martin/SX Kim Willis/JSC/Lockheed Martin/SX Glynda Robbins/Lockheed Martin/ Prem Saganti/JSC/Lockheed Martin/SX Tracy Thumm/JSC/Lockheed Martin/SX Mark Matney/JSC/Lockheed Martin/SX Barbara Nowakowski/LZ Tech/JSC/SX Jim Dragg/JSC/LZ Tech/SX Steve Frick/JSC/CB John Gowan/JSC/DM4 Mark Abadie/JSC/DM4 Ryan Proud/JSC/DM4 Chris Edelen/JSC/DM4 Dennis Bentley/JSC/DM4 Tom Schmidt/JSC/DM4 Ron Spencer/JSC/DM4 Jenney Gruber/JSC/DM3 Jeff Kling/JSC/DF5 Kevin McCluney/JSC/DF5 Ken Smith/JSC/DF5 Dana Jake/JSC/DF5 Ovideo Oliveras/JSC/Lockheed Martin/ER Chris Bennett/Neptec Jean-Sebastien Valois/Neptec Doug Aikman/Neptec Adam DesLauriers/Neptec Dewey Houck/Boeing/Autometrics 8.3 Selected Biographies for Key Contributors Johnson Space Center Dr. Gregory Byrne served as the NASA lead of the Image Analysis Team for the STS-107 investigation. He is currently the Assistant Manager of the Space and Life Sciences Directorate (SLSD) Human Exploration Science Office and manager of the Earth and Image Sciences Laboratory within that office. He has 12 years of NASA experience, beginning in the Mission Operations Directorate at JSC, where he was certified as a Space Shuttle flight instructor of astronaut crews. He joined the SLSD in 1996 as a senior scientist in the Earth and Image Sciences. He earned a B.S. in Physics from Syracuse University and a Ph.D. in Space Physics and Astronomy from Rice University in 1985. His doctoral work at Rice centered on atmospheric processes. He joined the Space Physics group at the University of Houston (U of H) in 1986 as a Research
This information is being distributed to aid in the investigation of the Columbia mishap and should only be distributed to personnel who are actively involved in this investigation.
98
NSTS-37384STS-107 Image Analysis Team Final Report.pdf
C0-000045
CAB066-1050
COLUMBIAACCIDENT INVESTIGATION BOARD
REPORT VOLUME III OCTOBER 2003126
Associate and then as an Assistant Professor researching the upper atmosphere. He continues his affiliation with U of H as an adjunct assistant professor. Dr. Cynthia Evans served as co-lead of the Image Analysis Team for the STS-107 investigation. Her current position is Manager and Research Scientist for Lockheed Martin Space Operations’ Image Analysis Section at the NASA Johnson Space Center. Evans has more than 20 years professional experience in the Earth sciences and remote sensing. Her tenure at the NASA Johnson Space Center includes direct planning and operational Earth observations support to more than 100 Shuttle, Mir and ISS missions. She received her Ph.D. in Earth Sciences from Scripps Institute of Oceanography, U.C. San Diego, and a B.S. in Geology from University of Rochester. Before coming to NASA, Evans was an Assistant Professor in the Colgate University Geology Department, and a Visiting Professor at Columbia University’s Lamont–Doherty Earth Observatory. Michael Snyder was team lead for the launch imagery analyses for the STS-107 Image Analysis Team. He is a Staff Research Scientist with Lockheed Martin Space Operations. Mr. Snyder has over 19 years of professional experience in the fields of image analysis and remote sensing. He is the Lockheed Martin project manager for the Image Science and Analysis group; a position he has held for the past 3 years. Mike holds an M.S. degree in Geography from the University of Illinois and a B.S. degree in Geography from the University of Texas at Austin. Jon Disler is JSC’s liaison with the Intercenter Photo Working Group. He is a Staff Research Scientist with Lockheed Martin Space Operations. Mr. Disler has more than 34 years experience in remote sensing and image analysis. He has supported remote sensing and imagery analysis for NASA in the LACIE/Agristars and STS Earth Observations, and JSC’s Shuttle image science group since 1986. He leads JSC’s STS launch and landing image analysis effort. He received his B.S. in Biology from Roanoke College. Donn Liddle, Senior Research Engineer, Lockheed Martin Space Operations. For the STS-107 investigation, he was the Team lead for the re-entry video timelining, and the Image Analysis lead for imagery and photogrammetry recommendations for return-to-flight activities. Mr. Liddle is a photogrammetric engineer with more than 10 years professional experience in photogrammetry and digital image analysis. Mr. Liddle received his B.S. and M.S. in Survey and Photogrammetric Engineering, and has completed post-graduate work in Digital Photogrammetry. Since joining Lockheed Martin in 1997 he has designed and implemented photogrammetry analyses for several STS, ISS and HST surveys. Dr. Julie Robinson, was the re-entry timelining co-lead and instrumental in facilitating analyses of re-entry imagery of the Columbia accident. She is a Senior Scientist for Lockheed Martin Space Operations, NASA Johnson Space Center. Dr. Robinson received her Ph.D. in Ecology, Evolution, and Conservation Biology, University of Nevada, Reno; a B.S. in Biology and a B.S. in Chemistry, Utah State University, Logan, Utah. She is part of an interdisciplinary team of scientists that work on remote sensing of Earth from human spaceflights, including astronaut training, data distribution, and
This information is being distributed to aid in the investigation of the Columbia mishap and should only be distributed to personnel who are actively involved in this investigation.
99
NSTS-37384STS-107 Image Analysis Team Final Report.pdf
C0-000045
CAB066-1051
COLUMBIAACCIDENT INVESTIGATION BOARD
REPORT VOLUME III OCTOBER 2003 127
research collaborations. She is the Project Lead for using Landsat-7 data to develop global maps of coral reef areas for distribution in the third world, participates in scientific collaborations involving coral reef remote sensing in French Polynesia, and classification of coastal land use in Thailand. She also managed the implementation of Web-based database searching, browsing, and distribution of the nearly 400,000 photographs taken by astronauts. Dr. Kira Jorgensen was the co-lead for the STS-107 Luminosity Working Group. She aided in the development and then processing of the JSC method for determining the ratio of intensities used to obtain an estimate of mass for the debris events. In addition, she will assist in the analysis of the spectral characteristics of the re-entry, if future testing warrants the procedure. Dr. Jorgensen currently holds a post-doctorate position through the National Research Council (NRC) in the Orbital Debris Program Office (SX2) at Johnson Space Center. Her main area of research uses remote reflectance spectra to obtain physical properties of orbiting objects, specifically orbital debris. She works closely with scientists at the Air Force Maui Optical and Supercomputing (AMOS) site where most of the observations for the project are taken. In addition to her spectral project, she assists the orbital debris group in obtaining and reducing optical observations of the LEO and GEO debris environment. Nicole Stott, NASA Astronaut (Mission Specialist). Ms. Stott was team lead for the Image Analysis Team’s Luminosity Working Group, and provided interfaces with several other STS-107 investigation teams. She received her M.S. in Engineering Management, University of Central Florida, and a B.S. in Aeronautical Engineering, Embry-Riddle Aeronautical University. Ms. Stott began her career as a structural design engineer with Pratt and Whitney Government Engines, then worked with the Advanced Engines Group performing structural analyses of advanced jet engine component designs. She joined NASA in 1988 at the Kennedy Space Center (KSC), Florida as an Operations Engineer in the Orbiter Processing Facility (OPF). She worked with the Director of Shuttle Processing as part of a two-person team tasked with assessing the overall efficiency of Shuttle processing flows, identifying and implementing process improvements, and implementing tools for measuring the effectiveness of improvements. She was the NASA KSC Lead for a joint Ames/KSC software project to develop intelligent scheduling tools. During her time at KSC, Ms. Stott also held a variety of positions within NASA Shuttle Processing, including Vehicle Operations Engineer; NASA Convoy Commander; Shuttle Flow Director for Endeavour; and Orbiter Project Engineer for Columbia. During her last two years at KSC, she was a member of the Space Station Hardware Integration Office where she served as the NASA Project Lead for the ISS truss elements under construction at the Boeing Space Station facility. In 1998, she joined the Johnson Space Center (JSC) team as a member of the NASA Aircraft Operations Division., where she served as a Flight Simulation Engineer (FSE) on the Shuttle Training Aircraft (STA) before joining the Astronaut Office. S. Douglas Holland (MSEE, BSEE), NASA / EV2. Currently detailed to NASA / SX as member of the Luminosity Working Group (LWG). Prior to joining the LWG served 16 years at NASA / JSC as Project Engineer for the following systems: a) Shuttle Digital
This information is being distributed to aid in the investigation of the Columbia mishap and should only be distributed to personnel who are actively involved in this investigation.
100
NSTS-37384STS-107 Image Analysis Team Final Report.pdf
C0-000045
CAB066-1052
COLUMBIAACCIDENT INVESTIGATION BOARD
REPORT VOLUME III OCTOBER 2003128
Television (DTV), b) Shuttle Sequential Still Video (SSV), c) Shuttle High Definition Television (HDTV) DTO, d) X-38 Imaging Systems, e) Shuttle and Station M-JPEG Compression Encoder, f) Shuttle Hercules Payload, g) Electronic X-Ray Camera (EXC), h) Shuttle Electronic Still Camera (ESC) DTO, and i) Shuttle Camcorder DTO. Served 107 Image Analysis Team / LWG in developing methods of obtaining quantitative intensity characteristics of debris events from consumer camcorders. Prior to coming to NASA, employed by commercial companies including: Sony Electronics International (5 years), AT&T, and General Instruments. Master of Science thesis, 'Video Compression for Space Based Applications'. Multiple publications including: IGARSS, NASA Tech Briefs, International Journal of Remote Sensing, NASA Spinoffs, TV Technology. David R. Bretz was team lead for the STS-107 Image Analysis Team for re-entry debris relative motion analysis, and the Image Analysis team interface with the Early Sightings and Assessment Team. He also performed stabilization and enhancement of launch film showing change to the External Tank bipod ramp area. He is currently a Senior Scientist with Hernandez Engineering, in JSC Image Science & Analysis Group, and the lead image analyst for activities in support of Hubble Space Telescope Servicing Missions including 2D motion analysis and 3D measurements of solar arrays, photographic surveys of the damage to the insulation blankets and study of orbital debris strikes to the exterior surfaces. Bretz received special recognition for assisting local law enforcement by enhancing video images of suspected criminals. He has a M.S. in Imaging Science from Rochester Institute of Technology. Fred W. Martin has 23 years of experience in the Engineering Directorate at the Johnson Space Center in aerodynamics, aerothermodynamics, and computational fluid dynamics. He has had unique experience in solving fluid mechanics related problems on the Space Shuttle; including Orbiter transonic ascent venting problems and main engine feed line disconnect valve issues. Following the Challenger accident, he led a multi-center NASA/contractor team that created the Space Shuttle ascent vehicle CFD capability that was used to refine the vehicle’s transonic aerodynamic loads. He has also had considerable experience in visualizing engineering data, from animating the STS-5 windward surface entry temperatures, comparing the Space Shuttle ascent pressure measurements to wind tunnel and flight data, and comparing the X-38 flight imaged streamlines to wind tunnel data and numerical predictions. Joe Gessler, JSC ES5 (Mech Design & Analysis). Aerospace Engineer in the Structural Engineering Division at the NASA/Johnson Space Center for the past three years, specializes in the area of structural analysis. Over the course of several weeks, Joe mapped the ascent debris' 3-D trajectory. In addition, he estimated the possible impact areas and impact angles with respect to both the orbiter's orthogonal planes and the local impact area. Kennedy Space Center Armando Oliu, Lead of the NASA Ice/Debris Team; which includes leading the Space Shuttle Final Inspection Team and the KSC Image Analysis Team. Mr. Oliu received his
This information is being distributed to aid in the investigation of the Columbia mishap and should only be distributed to personnel who are actively involved in this investigation.
101
NSTS-37384STS-107 Image Analysis Team Final Report.pdf
C0-000045
CAB066-1053
COLUMBIAACCIDENT INVESTIGATION BOARD
REPORT VOLUME III OCTOBER 2003 129
B.S. in Mechanical Engineering from the University of Miami, FL. He has been involved with Flight Hardware processing since joining NASA in 1988, and currently serves as Co-Lead of the KSC Image Analysis Team for the STS-107 Investigation. John Lane received his B.S. and M.S. in Physics from Florida Atlantic University where his thesis research involved measurement of electronic transport properties of organic semiconductors. His Ph.D. dissertation research at the University of Central Florida involved hydro meteorological instrumentation, modeling, and analysis, in support of the NASA Tropical Rainfall Measurement Mission (TRMM). Dr. Lane is presently an Applications Scientist for ASRC Aerospace at Kennedy Space Center, FL where he specializes in mathematical and numerical modeling and simulation of a variety of problems such as: analysis of magnetic force fields of air core solenoids; 3D image processing algorithms for precision position measurement; and development of instrumentation and analysis techniques for measurement of rainfall and hail size distributions. Charles G. (Robbie) Robinson is the Photo Instrumentation Planner for Johnson Controls at KSC, providing visual services at CCAFS and KSC since 1992. His positions over the years as Quality Assurance and Safety Manager; Maintenance Manager; Production Manager; and now in his current position gives him a broad understanding of contract requirements. His former management of Still and Motion Picture Laboratories; Film and Video Production; Metric Instrumentation; Optics; and Camera Operations make him uniquely qualified as Space Shuttle Photo Instrumentation Planner. His leadership, management and keen attention to detail led the company's support through 17 Space Shuttle launch cycles - with excellent results. He has over 33 years total in providing audiovisual support, including 23 years in the Air Force. Robert Youngquist heads the Applied Physics Laboratory in the Spaceport Engineering and Technology Directorate at the Kennedy Space Center. During most of his 15 years at KSC he has been active in resolving a wide variety of Shuttle ground processing issues. His primary background is optics--his Ph.D. thesis was in the development of fiber optic components--but he has developed Shuttle hardware utilizing most of the electromagnetic spectra as well as ultrasonics, novel sensor designs, fluid dynamics, and other fields. His primary role in the 107 Image Analysis Team investigation was to develop the nonablative models whereby the mass and effective area of debris could be determined from luminosity and trajectory data. He also developed a possible model to explain the flash events and developed a method to obtain debris deceleration data from trajectory data supplied to the team. Marshall Space Flight Center Tom Rieckhoff has served as the Engineering Photographic Analysis Team Lead, responsible for photographic review and analytical support to the MSFC Shuttle Projects for the past 15 years. He graduated from the University of South Florida with a degree in Motion Picture Film Production in 1973. He worked in the Marshall Space Flight Center Photographic Laboratory as a motion picture cameraman, film editor and Director.
This information is being distributed to aid in the investigation of the Columbia mishap and should only be distributed to personnel who are actively involved in this investigation.
102
NSTS-37384STS-107 Image Analysis Team Final Report.pdf
C0-000045
CAB066-1054
COLUMBIAACCIDENT INVESTIGATION BOARD
REPORT VOLUME III OCTOBER 2003130
Dr. Michael O'Farrell graduated from Auburn University in 1982 with Ph.D. in Mathematics. His current position is a Senior Engineering Specialist for United Space Alliance at MSFC. His primary activities at USA include engineering evaluation of ground-based and on-board camera film and video for launch of the Space Shuttle vehicle and image analyses for specialized propulsion related tests. Dr. O’Farrell has held a wide range of positions Rockwell International Space Systems Division (statistical analyst for the NASA Space Shuttle Problem Assessment Center) and Boeing North American (Senior Engineering Specialist). His work includes flow modeling of vortex induced vibrations, construction of optimal Space Shuttle ascent trajectories, determination of the effectiveness of turbulence models to estimate convective heating in space vehicle base flow recirculation regions, performing acoustic environment analyses during liftoff conditions for the proposed Liquid Flyback Booster (LFBB) and investigating the re-entry aeroheating environments for a modified Space Shuttle vehicle. He authored several technical aerospace engineering related works, including the "Handbook of High Frequency Flow/Structural Interactions in Dense Subsonic Fluids”. Bill Cooke, Computer Sciences Corporation contractor supporting MSFC Space Environments Team - In the decade since receiving his PhD in astronomy, Dr. Cooke has become one of NASA's experts on meteoroids and their effects on spacecraft, especially in the area of meteor shower forecasting. As a member of the Luminosity Working Group, he provides expertise in meteor physics, especially with regard to ablative processes, and in astrometry, determining which (if any) stars ought to be visible in the various videos analyzed by the group. Wesley R. Swift earned his MS (physics) at the University of Alabama in Huntsville and was employed by the Optical Aeronomy Laboratory (OAL) at UAH from 1986 to 2001. NASA/OAL projects include the ISUS, a balloon instrument, the ISO, which flew on ATLAS I, and the UVI on the POLAR satellite. He is presently employed by Raytheon and is located at MSFC/ED44 in the Space Environments group. His duties include the adaptation of multisatellite data archives and space science models for space weather engineering applications. He participated in the 2001 and 2002 Leonid Global Video Meteor campaigns and has developed calibration methods and software to significantly improve meteor photometry. He is the recipient of a 2002 NASA Technology Achievement Award, the 2003 Raytheon Peer Award and numerous group achievement awards. As a member of the Luminosity Working Group, he adapted his meteor photometry method to obtain valuable information regarding the intensity ratios of the debris objects with respect to the orbiter. Ames Research Center George A. Raiche has been a Research Scientist in the Reacting Flow Environments Branch at NASA's Ames Research Center for six years. His Ph.D. is in physical chemistry and spectroscopy, and he has published over 15 technical papers on the topics of spectroscopy of high-temperature gases, hypersonic facility instrumentation, and optical diagnostics. He is group leader for ARC's Arcjet Characterization Group, which develops spectroscopic techniques for measuring arcjet test environments. His role in the
This information is being distributed to aid in the investigation of the Columbia mishap and should only be distributed to personnel who are actively involved in this investigation.
103
NSTS-37384STS-107 Image Analysis Team Final Report.pdf
C0-000045
CAB066-1055
COLUMBIAACCIDENT INVESTIGATION BOARD
REPORT VOLUME III OCTOBER 2003 131
Image Analysis Team investigation has been to provide expertise on the physics and chemistry of shock-induced luminosity phenomena. He is also principal investigator for the arcjet testing described in Luminosity Working Group report. NIMA Ivar Svendsen was an Imagery Analyst for 28 years most recently in the NIMA Missiles and Space Issues Branch. During his career Mr. Svendsen had participated in a temporary reassignment to NASA to participate in the first launches of the Space Transport System, and, as NIMA's space systems expert, Mr. Svendsen was eager and able to lend his experience and support to all of the Hubble Space Telescope servicing missions. At the time of his sudden death on May 20, Mr. Svendsen was an active leader of NIMA's efforts to support the NASA Columbia accident investigation. James Salacain is president of Spatial Analytics, Inc., an imaging and visualization-consulting firm and serves as the chief system engineer for the National Imagery and Mapping Agency (NIMA) Image Quality and Utility Program. He has a B.S in Photographic Science and Instrumentation and an M.S. in Imaging Science, both from the Rochester Institute of Technology. Mr. Salacain was employed as an Image Scientist by Eastman Kodak Co. for 15 years and was responsible for performing image quality optimization and image chain analysis for a wide variety of imaging systems and imaging technologies. Lockheed Martin Dwight Divine, III, Chief Scientist, Imagery & Geospatial Solutions, M&DS, Lockheed Martin. Mr. Divine coordinated Lockheed Martin Management & data Systems’ STS-107 analyses. He has worked for over 35 years in the fields of optics, data estimation and prediction, and image and signal processing. He joined IBM's T .J. Watson Research Center in New York to work on solid-state laser development (GaAs lasers) after graduating from the University of Florida with a BSEE in 1964. He worked on the development of the laser video disc (including initial development of CD sound and data storage formats and techniques) from 1976 through 1982. From 1982 through 1985, Mr. Divine helped develop, model, and test the estimation and prediction approach used in the Global Positioning System (GPS). He has been working in the field of image processing for classified applications since 1989. Mr. Divine has authored eight patents in varying fields and a number of papers, articles, and presentations. Dr. Marvin Kleine is the Chief Scientist for Lockheed Martin Management & Data Systems ISR Systems. He received his Ph.D. in Physics from Arizona State University in 1994. Dr. Kleine's technical strengths are in the areas of SAR and optical signal processing, ground processing architectures, molecular spectroscopy, hyperspectral imaging, data compression, radiation transfer modeling, and electromagnetic scattering. For the past 22 years, Dr. Kleine has been responsible for the management, development, and insertion of new technology to strategically place Lockheed Martin ISR Systems for the next generation of remote sensing systems.
This information is being distributed to aid in the investigation of the Columbia mishap and should only be distributed to personnel who are actively involved in this investigation.
104
NSTS-37384STS-107 Image Analysis Team Final Report.pdf
C0-000045
CAB066-1056
COLUMBIAACCIDENT INVESTIGATION BOARD
REPORT VOLUME III OCTOBER 2003132
Dr. Eamon B. Barrett, Image Scientist, Lockheed Martin Advanced Technology Center (LM/ATC); Modeling, Simulation and Information Sciences Dept., Sunnyvale, CA. Dr. Barrett received a Ph.D. in Mathematics from Stanford University in 1968. He has over 40 years of experience conducting and directing R&D projects in applied physics, imagery science, automated change detection and cartography. Dr. Barrett joined Lockheed in 1986 as a research scientist. His previous positions include: President, Smart Systems Technology Inc., 1980-1985; Director, Intelligent Systems Program, National Science Foundation, 1977-1980; Senior Imagery Scientist, ESL Inc., 1971-1977; Associate Professor in Operations Research, Naval Postgraduate School, 1966-1971. Since 1960 he has authored more than 50 technical publications in physics, mathematics and image science. Boeing Lorelei Lohrli-Kirk, Boeing Senior Engineer. Bachelor of Science in Aerospace Engineering, Master of Science in Systems Architecture and Engineering. Lohrli-Kirk has supported the Space Shuttle Program for 16 years in several disciplines including: integrated vehicle guidance, navigation and control; liftoff and ascent trajectory analysis; liftoff sub-system performance and design; and photographic evaluation and analysis. She provided Boeing System Integration support for the STS-107 Mishap Investigation. Neptec Jean-Sebastien Valois, Operations Analyst: BSc Mech Eng, Ecole Polytechnique de Montreal, MS Elect Eng, McGill University, Montreal. Chris Bennett, Operations Engineer: B.S. Mech Eng, University of Virginia, M.S. for Neptec, Inc.
This information is being distributed to aid in the investigation of the Columbia mishap and should only be distributed to personnel who are actively involved in this investigation.
105
NSTS-37384STS-107 Image Analysis Team Final Report.pdf
C0-000045
CAB066-1057
COLUMBIAACCIDENT INVESTIGATION BOARD
REPORT VOLUME III OCTOBER 2003 133
9.0 Acronyms AFB Air Force Base AMOS Air Force Maui Optical and Supercomputing Site AZ Arizona CA California CAD Computer Aided Design CAIB Columbia Accident Investigation Board CSR Computer Sciences Raytheon EOC Emergency Operations Center ER Eastern Range ESAT Early Sighting Assessment Team ESC Electronic Still Camera ET External Tank ETA ET Attach GPS Global Positioning System HDTV High Definition Television HFOV Horizontal Field of View IEA Integrated Electronic Assembly IRE Institute of Radio Engineers ISS International Space Station JSC Johnson Space Center KSC Kennedy Space Center LH2 Liquid Hydrogen LSRB Left Solid Rocket Booster LWG Luminosity Working Group MER Mission Evaluation Room MET Mission Elapsed Time MSFC Marshall Space Flight Center NASA National Aeronautics and Space Administration NSTS National Space Transportation System NTSC National Television Standards/System Committee OVEWG Orbiter Vehicle Engineering Working Group RCC Reinforced Carbon Carbon RCS Reaction Control System/Subsystem RTV Room Temperature Vulcanizing SMPTE Society of Motion Picture and Television Engineers SRB Solid Rocket Booster STS Space Transportation System TPS Thermal Protection System UT Utah UTC Universal Time Code
This information is being distributed to aid in the investigation of the Columbia mishap and should only be distributed to personnel who are actively involved in this investigation.
106
NSTS-37384STS-107 Image Analysis Team Final Report.pdf
C0-000045
CAB066-1058
COLUMBIAACCIDENT INVESTIGATION BOARD
REPORT VOLUME III OCTOBER 2003134
10.0 References Computer Sciences Raytheon, Systems Analysis Department, Instrumentation Systems Analysis Special Report, CDR A205, 14, February 2003 “Entry Debris Characterization” references/shuttleweb/mission_support/sts-107/contingency/entry/107_entry.html “Entry Debris Events Timeline” references\shuttleweb\mission_support\sts-107\contingency\entry\107_reports.html “Entry Video and Still Database” http://vdas-huey.jsc.nasa.gov/Contingency/107/web/ Image Analysis STS-107 Investigation website at references/shuttleweb/mission_support/sts-107/contingency/entry/107_entry.html Image Science and Analysis web page references/shuttleweb/mission_support/missions.html Image Science and Analysis web site references/shuttleweb/mission_support/sts-107/contingency/launch/107_launch.html JSC-14273, Space Shuttle Program Contingency Action Plan for Johnson Space Center NSTS 08244 Space Shuttle Program Launch and Landing Photographic Engineering Evaluation document, Revision B, 1997 Shuttle Reference Manual at http://spaceflight.nasa.gov/shuttle/reference/shutref/index.html Video from The Colony, TX shuttleweb/mission_support/sts-107/contingency/other/Aero.pdf Columbia Earth Sighting Assessment Team Final Report, 13 June 2003. Starfire Team Final Report
This information is being distributed to aid in the investigation of the Columbia mishap and should only be distributed to personnel who are actively involved in this investigation.
107
NSTS-37384STS-107 Image Analysis Team Final Report.pdf
C0-000045
CAB066-1059
COLUMBIAACCIDENT INVESTIGATION BOARD
REPORT VOLUME III OCTOBER 2003 135
11.0 Appendices Appendix 4.1.1 Launch Camera Tracking Site Locations KSC Launch Camera Documentation Appendix 4.1.3 E208 and E212 Tracking Camera Star Shots for Image Enhancement Appendix 4.2.4 Camera Timing Appendix 4.3.1 STS-107 Launch+4 Day Consolidated Film/Video Report KSC, JSC, MSFC and Program Integration Film/Video Analysis Teams Appendix 4.3.2A Debris Impact Timing Appendix 4.3.2B E212 Bipod Area Enhancements Appendix 4.3.2C Debris Size Measurement Issues Appendix 4.3.2D Verification of Color Analysis Repeatability for Estimating Debris Rotation Rate Appendix 4.3.2E Examination E212 Frames During Debris Impact Appendix 4.3.2F STS-107 Mishap Investigation Sub-team Reports NASA-JSC/SX – Debris Trajectory, impact location, velocity, and impact angle NASA-JSC/ES – Debris Trajectory, impact location, velocity, and impact angle NASA-JSC/EG – Debris Trajectory, impact location, velocity, and impact angle NASA-KSC – Debris Trajectory, impact location, velocity, impact angle, and size NASA-MSFC – Debris Trajectory, impact location, velocity, impact angle, and size NASA-JSC/SX – Single Camera Velocity Lockheed Martin Management and Data Systems – Debris Velocity Lockheed Martin Management and Data Systems – Trajectory National Imagery and Mapping Agency – Debris Velocity Appendix 4.3.2G Post-Impact Debris Size Estimates
This information is being distributed to aid in the investigation of the Columbia mishap and should only be distributed to personnel who are actively involved in this investigation.
108
NSTS-37384STS-107 Image Analysis Team Final Report.pdf
C0-000045
CAB066-1060
COLUMBIAACCIDENT INVESTIGATION BOARD
REPORT VOLUME III OCTOBER 2003136
This information is being distributed to aid in the investigation of the Columbia mishap and should only be distributed to personnel who are actively involved in this investigation.
109
Appendix 5.3.1 ET Downlink Video Analysis Appendix 5.3.2 Air Force Maui Optical and Supercomputing Site (AMOS) STS-107 Photographs Appendix 5.3.3 Analysis of STS-107 On-Orbit Debris – Orbit 5 Appendix 6.2A Luminosity Working Group Columbia Re-entry Debris Characteristics Preliminary Report – May 6, 2003 Luminosity Working Group Columbia Re-entry Debris Characteristics Interim Report – June 6, 2003 Appendix 6.2B Video Scale and Zoom Determination
NSTS-37384STS-107 Image Analysis Team Final Report.pdf
C0-000045
CAB066-1061
COLUMBIAACCIDENT INVESTIGATION BOARD
REPORT VOLUME III OCTOBER 2003 137
THIS PAGE INTENTIONALLY LEFT BLANK
COLUMBIAACCIDENT INVESTIGATION BOARD
REPORT VOLUME III OCTOBER 2003138