Embed Size (px)
Citation preview

Page | 682
Effect of different fabrics types on the adsorption of air pollution in residential and
industrial atmosphere in Cairo-Egypt
Naglaa S. Elshemy 1
, Sahar H. Nassar 1
, Nadia M. El-Taieb 2
, Alia A. Abdel Shakour 2, Asmaa M.
Elmekawy 2, Ahmed G. Hassabo
3, *
1National Research Centre (NRC, Scopus affiliation ID 60014618), Textile Industries Research Division (TRID), Dyeing, Printing and Textile Intermediate Department
(DPTID), El-Behouth St. (former El-Tahrir str.), Dokki, P.O. 12622, Giza, Egypt
2National Research Centre (NRC, Scopus affiliation ID 60014618), Environmental Research Division, Air Pollution Department, El-Behouth St. (former El-Tahrir str.),
Dokki, P.O. 12622, Giza, Egypt
3National Research Centre (NRC, Scopus affiliation ID 60014618), Textile Industries Research Division (TRID), Pre-treatment and Finishing of Cellulose based Textiles
Department (PFCFD), El-Behouth St. (former El-Tahrir str.), Dokki, P.O. 12622, Giza, Egypt
*corresponding author e-mail address: [email protected]| Scopus ID: 55909104700
ABSTRACT
Different natural, synthetic fabrics and their blend (silk, wool, cotton, nylon, polyester nylon/polyester and wool/polyester) were exposed
at two selected sites in residential and industrial atmosphere in Cairo city (Dokki and Helwan) for a period of 4 months. The changes in
the whiteness, mechanical properties of the exposed textiles were investigated in both places. Isothermal study was estimated using
yellowness index values over exposed fabrics for a different time.
Keywords: Air pollution; different fabrics type; residential and industrial atmosphere.
1. INTRODUCTION
As the environmental atmosphere gets more crowded and
polluted without using clean fuels or technologies, the air that we
breathe becomes dangerously polluted and cause kills for millions
people around the world every year because of stroke, lung cancer
and heart disease. Air pollution can penetrating deeply into our
respiratory and circulatory system causing damaging to our lungs,
heart and brain [1-4].
One of the main air pollution reasons is industrial processes and
traffic. Tackling air pollution has significant economic benefits. In
addition, it is not indication that the air is good, not polluted and
healthy if we seeing the lack of visible smog [5, 6].
Furthermore, air pollution destroy the textile materials. Losing in
tensile strength, fading of the dyes and degradation in weight are
the most factors affected by air pollution [7, 8]. In addition, some
dangerous gasses, which presented as pollutants in air atmosphere,
cause deterioration of natural and synthetic fabrics such as sulfur
and nitrogen oxides [7, 9, 10].
Therefore, air pollution is one of the most reason for degradation
cellulosic fabrics. It known before that, exposed natural yarn
affected by losing in tensile strength in winter more than in
summer which ascribed to one or all of the triple increment in coal
utilization, together with a high incidence of quiet, foggy days that
brought about a higher acidity (sulfuric) in the winter [10, 11].
Natural fabrics consist mainly of the cellulosic materials (cotton,
viscose and viscose rayon) and fibers as silk, wool, flax, hemp and
jute [12]. Effects of air pollution particles on the natural fabrics
have been generally confined specially on the cotton, because
cotton used communally as a workhorse in the textile industry, and
it has several utilisation with low resistant to environmental
degradation. The effect of air pollution on the photochemical
degradation of wool is similar to that of cotton exposures [13].
As the synthetic fibers are now used in textile industry more than
natural one, soiling problems and air pollution have greater
important. In addition, because of the nature of synthetic fibers it
is difficult to clean. Furthermore, the effects of air pollutions on
synthetic fabrics have been limited studied, because the synthetic
fibers are normally chemically stable. Nevertheless, with the
possibility of synergistic effects this idea may be inaccurate [14].
Sulfur and nitrogen dioxide (SO2 and NO2) are a gaseous formed
during the combustion of fuels containing one or both element
(sulfur or nitrogen) and they are a major atmospheric pollutant.
Tensile strength and elongation at a breack for exposed fabrics to
industerial or residential atmosphere offers possibility of
determining the change in physical properties and measuring the
atmospheric affect textile fabrics.
However, the effect of air pollutants on the stability of nature and
synthetic fabrics exposed in Egypt industerial or residential
atmosphere on textile during the present study was carried out by
examine the physical properties of different fabrics exposed over
120 days. In addition its isothermal model has been investigated to
determine the ability of these fabrics to adsorp air pollutions.
Moreover, the exposure of textile to atmospheric pollutants in
Cairo city results in significant deterioration and weakening of
textile fibers [15]. The major effects of air pollution on fabrics are
soiling, loss of tensile strength and degradation in weight,
Moreover, sulfur oxides (SOx and NOx) are capable of causing
deterioration to natural and synthetic fibers [16, 17]. However,
there is only irregular information on the effect of air pollutants on
textile. Consequently, this part of the present study was carried out
to determine the effect of air pollutants and climate on the stability
of cotton and synthetic fabrics exposed in Cairo's atmosphere.
Volume 8, Issue 4, 2019, 682 - 691 ISSN 2284-6808
Open Access Journal Received: 20.08.2019 / Revised: 15.10.2019 / Accepted: 20.10.2019 / Published on-line: 28.10.2019
Original Research Article
Letters in Applied NanoBioScience https://nanobioletters.com/
https://doi.org/10.33263/LIANBS84.682691
Effect of different fabrics types on the adsorption of air pollution in residential and industrial atmosphere in Cairo-Egypt
Page | 683
During this research textile samples (natural, synthetic and some
blends between each other’s) were exposed at two sites, selected
in El-Dokki residential area and at Helwan industrial area in Cairo
City, which represents different loads of air pollutants for a period
of 4 months (starting from October to January). During this period
October to January, heavy smog days struck greater in Cairo
having high concentrations of pollutants, which depends on the
stability of the atmosphere such as temperature inversion and the
prevailing winds [18, 19].
2. MATERIALS AND METHODS
2.1. Materials
Textile used fabrics used in this study are natural, synthetic and
some blends between each other’s. Natural used fabrics are silk
(165 g/m2), wool (210 g/m2) and cotton (158 g/m2) fabrics.
Synthetic used fabrics are nylon (145 g/m2) and polyester (160
g/m2). Blended used fabrics are nylon/polyester (50/50, 165 g/m2)
and wool/polyester (45/55, 165 g/m2). All used fabrics have been
found in the local market.
2.2. Methods.
2.2.1. Exposed profile for fabrics to air pollution.
Textile samples were exposed at two different places for 120 days,
the first place at residential atmosphere in Cairo city (Dokki place)
and the second place at industrial atmosphere in Cairo city
(Helwan place) which represent loads of air pollutants. The textile
fabrics were hanged over roofs of building in both selected area
for 120 days. After exposure for 30, 60, 90 and 120 days, samples
of each fabrics were removed and going to measurements.
2.3. Characterisation of the exposed fabrics.
2.3.1. Determination of Suspended Particulate Matter (SPM).
Suspended dust was collected at three sites (outdoor, reception
tower and residence palace, due to security instruction), on pre-
weighted whatman 42 filters, open face filter holder and a vacuum
pump calibrated to draw 7 L/min for 24 hrs. The filters were
weighted (Sartorius TE2145, Germany) and along with sampling
time and flow rate, concentration was calculated and expressed as
microgram per cubic meter of the air (µg/m3).
2.3.2. Determination of Gaseous air pollutants.
Sulphur dioxide (SO2), nitrogen dioxide (NO2) and ammonia
(NH3) were measured using gas bubblers and vacuum pumps
calibrated to draw air at flow rate of 1 L/min. The absorbance of
the solution was measured by means of a UV–Visible
spectrophotometer (Novaspec – LKB model 4049 – Biochrom,
Cambridge, England), and concentration of gaseous air pollutant
was expressed as µg/m3.
2.3.2.1. Sulphur dioxide. SO2 was collected using absorbent
solution of 0.1M sodium tetra-chloromercurate as an absorbing
reagent using improved West and Gaeke method (West and
Gaeke, 1986, CPCB, 2011) followed by adding para rosaniline
and formaldehyde to form the pararosaniline methyl sulfonic acid.
The blank solution was prepared in the same manner using
unexposed absorbing reagent.
2.3.2.2. Nitrogen dioxide. NO2 was collected using absorbent
solution of 0.1N sodium hydroxide as an absorbing reagent
(CPCB, 2011). Nitrite ion (NO2-) concentration was determined
calorimetrically by reacting nitrite ion with phosphoric acid,
sulfanilamide, and N-(1-naphthyl)-thylenediamine di-
hydrochloride, and colorimetric measured at 550 nm. The blank
solution was prepared in the same manner using unexposed
absorbing reagent.
2.3.2.3. Ammonia. NH3 levels were determined using dilute
sulfuric acid as an absorbing reagent, followed by reaction with
Nessler's reagent and colorimetric estimated at wavelength 460 nm
[20]. The blank solution was prepared in the same manner using
unexposed absorbing reagent.
2.3.3. Yellowness and whiteness measurements.
The yellowness and 0 degrees of the samples were evaluated by
Hunter Lab Ultra Scan PRO (USA) [21-25].
2.3.4. Mechanical properties of exposed fabrics.
Tensile strength and elongation at break are carried out according
to the ASTM Standard Test Method D–1682–2011 [26] on a
tensile strength apparatus type FMCW 500 (Veb Thuringer
Industrie Werk Rauenstein 11/2612 Germany) at 25°C and 65%
relative humidity. The results quoted are the mean of 5 breaks for
the warp direction with test length of 20 cm at a constant breaking
time of 20 seconds, load scale 10–50 Kg.
2.4. Isothermal studies.
Isotherms experiments were carried out for the sorption of the
exposed fabrics. Langmuir, Freundlich and Dubinin –
Radushkevich isotherm models with some modification were used
during this study. [27-29] The first isothermal method is Langmuir
isotherm which given by the following equation:
=====>
(
) (
)
By modification of this isothermal model, it was converted to be:
(
) (
)
where t is the exposure time of fabrics (days), ∆ whiteness is the
difference between whiteness at 0 and 120 days exposure time and
KL is the Langmuir constant. From the linearization of the
Langmuir isotherm plotting of 1/t versus 1/∆ whiteness gives a
straight line with a slope of 1/∆ whitenessmax KL and an intercept
of 1/∆ whitenessmax.
Freundlich isotherm used to describe the heterogeneous systems
and its equation given below [29]
=====> ( ) ( )
( )
By modification of this isothermal model, it was converted to be:
( ) ( )
( )
where t is the exposure time of fabrics (days), ∆ whiteness is the
difference between whiteness at 0 and 120 days exposure time, KF
is the Freundlich constant, and n is the heterogeneity factor. The
plot of ln(t) versus ln(∆ whiteness) gives a straight line with the
slope of 1/n and an intercept of ln(KF).
Dubinin–Radushkevich isotherm model was used in this study
also. The liner form of this model written as: [30]
By modification of this isothermal model, it was converted to be:
( ) ( )
where t is the exposure time of fabrics (days), ∆ whiteness is the
difference between whiteness at 0 and 120 days exposure time, β
(mol2.kJ−2) is a constant related to adsorption energy while ε is the
Polanyi sorption potential and can be calculated by
(
)

Naglaa S. Elshemy, Sahar Galal, Nadia M. El-Taieb, Alia A. Shakour, Asmaa M. Elmekawy, Ahmed G. Hassabo
Page | 684
where R is the gas constant 8.314J.mol−1K−1and T is the
temperature in Kelvin.
The values of β and∆ whiteness max were calculated from the slope
and intercept of the plot ln(∆ whiteness) vs ε2. The mean free
energy of sorption E (kJ.mol−1) required to transfer one mole of
pollutant from the air pollutions to the fabric surface can be
determined using the following equation:
( )
Furthermore, some error functions were utilized for the nature of
fitting [31-34]. The root means square error (RMSE) has been
utilized to test the sufficiency and precision of the model fit with
the results. Second statistical method is the chi-squared test (X2)
which has some comparability with the root mean square error.
The third statistical method is the sum of absolute errors (SAE),
which aggregate of total errors. The fourth statistical method is the
average relative error (ARE) which endeavours to limit the
fractional error conveyance over the whole range. All the error
models can be calculated through the following equations:
√
∑ ( )
, ∑
( )
,
∑ | | ,
∑ |
|
where W is the test sorption limit from the batch analysed i,
Weis the sorption capacity evaluated from the sorption model for
comparing Wi and n is the quantity of perceptions in the batch
experimental.
3. RESULTS
3.1. Estimation of Gaseous Air Pollutants.
The sources and composition of air pollutants being the current
major concern from a public health perspective and it is resulted
from interaction of multiple emissions and chemical reactions.
[35, 36]. in addition, air pollutants consisting of ozone (O3),
nitrogen dioxide (NO2), volatile organic compounds, carbon
monoxide (CO), carbon dioxide (CO2) and sulfur dioxide (SO2).
Some of the most aggressive pollutants being generated during hot
periods with high UV index also contribute directly to global
warming, which thus can influence cardiovascular health [37, 38].
Suspended particulate matter (SPM), nitrogen dioxide (NO2),
sulphur dioxide (SO2) and ammonia (NH3) concentrations as air
pollutants in the either residential or industrial atmosphere; Dokki
and Helwan; were illustrated in Table 1. Air pollutants
concentrations in Table 1 represent the mean concentrations of
four air pollutants (SPM, NO2, SO2 and NH3) during the whole
month and the mean concentration values of these pollutants over
the four examined month in either residential or industrial
atmosphere; Dokki and Helwan. From these data, it is clear that,
concentration of all pollutants in industrial atmosphere are higher
than its values in residential atmosphere. In addition, ammonia gas
in both atmosphere are almost similar, but other two gases (NO2
and SO2) have difference in gas concentration between both
atmospheres, which is a result from the industrial output
pollutants.
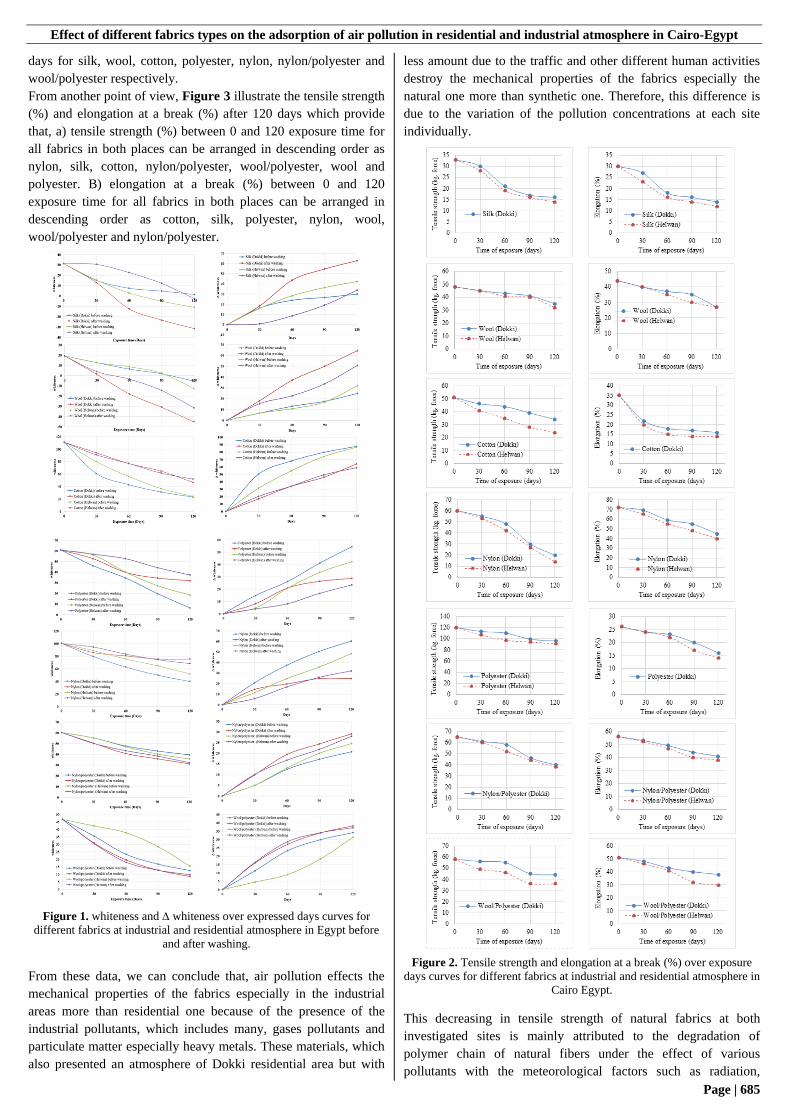
3.2. Whiteness of exposed fabrics.
Difference in whiteness between exposed fabrics and blank one
which expressed as ( whiteness) at different exposed time (0 –
120 days) are shown in Figure 1. Whiteness for the blank fabrics
has been recorded as 31.3, 100.33, 19.4, 111.08, 60.82, 60.24 and
46.8 for silk, nylon, wool, cotton, polyester, nylon/polyester and
wool/polyester respectively. From Figure 1, as the whiteness
increased before and after washing, the whiteness values for
exposed fabrics
In addition, it is clear that, whiteness of all types of exposed
fabrics decreased as the exposure time increases even after
washing in both sites (residential or industrial atmosphere).In
addition, from whiteness values it is clear that, natural fabrics
have whiteness values lower than synthetic or blended fabrics
which provide the ability of natural fabrics type to adsorb the
pollution from the atmosphere more than synthetic or blended one.
Table 1. Gaseous air pollutants concentration in both Helwan and Dokki destinations.
SPM (µg/m3) NO2 (µg/m
3) SO2 (µg/m
3) NH3 (µg/m
3)
Dokki Helwan Dokki Helwan Dokki Helwan Dokki Helwan
October 336.51 417.12 32.95 39.38 50.42 56.88 37.45 40.81
November 232.31 500.81 35.67 40.48 52.92 57.88 39.3 41.48
December 242.33 355.08 36.56 44.87 55.77 61.45 41.06 41.73
January 226.01 359.25 39.32 49.38 57.51 65.64 43.55 42.48
Mean 259.29 408.07 36.16 43.53 54.15 60.46 40.34 41.63
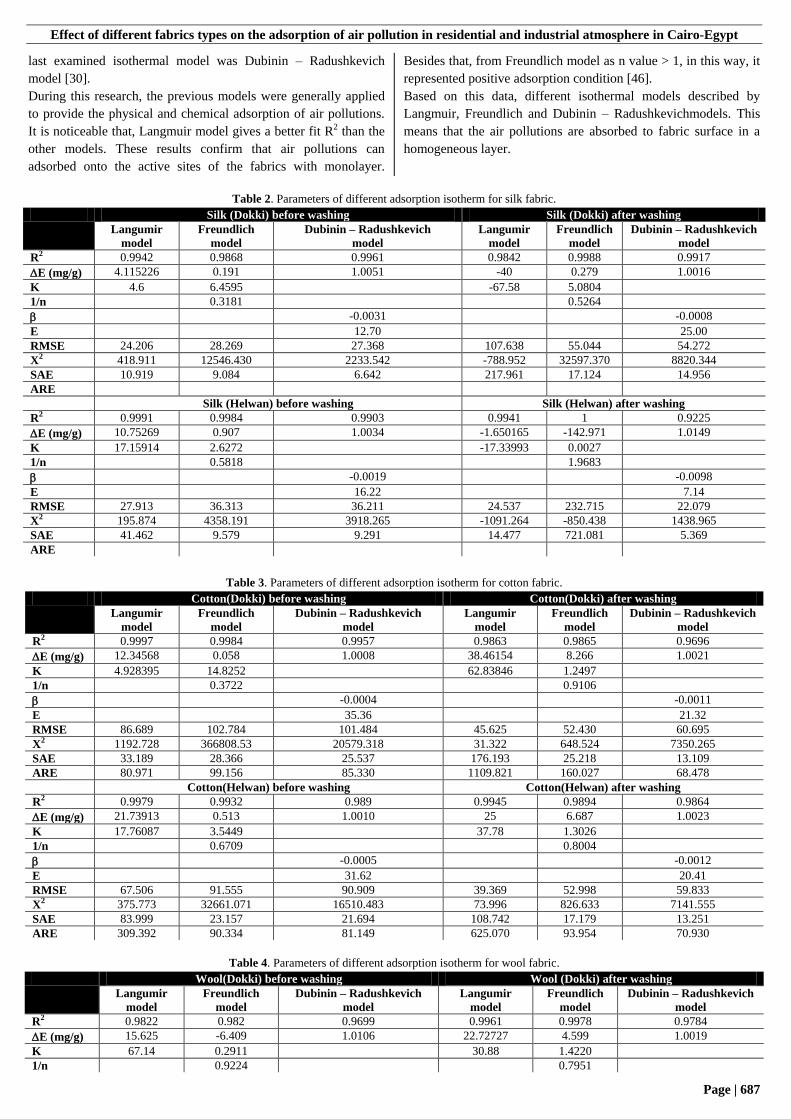
3.3. Mechanical properties of exposed fabrics.
Mechanical properties of exposure fabrics after different period
(30, 60, 90 and 120 days) have been investigated in terms of
tensile strength and elongation. Both results for exposed fabrics
(natural, synthetic, or blended fabrics) are shown in Figure
2.From Figure 2 it can be noticed that, the tensile strength and
elongation (%) of all the exposed fabrics were decreased at both
places as a function of the exposure time. Therefore, it is clear
that, all exposed fabrics in industrial atmosphere (Helwan
Industrial Area) have decreasing in both examined mechanical
properties more than exposed fabrics at residential atmosphere
(Dokki residential area) as the exposure time increased.
One can notice that, tensile strength of exposed fabrics was
decrease from the initial values of 33, 48, 51, 120, 60, 65 and 58
kg (force) to about 16, 35, 34, 96, 20, 40 and 44 kg at Dokki and
14, 32, 24, 91, 14, 38 and 36 kg at Helwan after 120 days for silk,
wool, cotton, polyester, nylon, nylon/polyester and wool/polyester
fabrics; respectively. In addition, elongation at a break (%) of
exposed fabrics was decrease from the initial values of 30, 44, 35,
26, 72, 56 and 51 (%) to about 14, 27, 16, 16, 45, 41 and 38 (%) at
Dokki and 12, 27, 14, 14, 40, 38 and 30 (%) at Helwan after 120
Effect of different fabrics types on the adsorption of air pollution in residential and industrial atmosphere in Cairo-Egypt
Page | 685
days for silk, wool, cotton, polyester, nylon, nylon/polyester and
wool/polyester respectively.
From another point of view, Figure 3 illustrate the tensile strength
(%) and elongation at a break (%) after 120 days which provide
that, a) tensile strength (%) between 0 and 120 exposure time for
all fabrics in both places can be arranged in descending order as
nylon, silk, cotton, nylon/polyester, wool/polyester, wool and
polyester. B) elongation at a break (%) between 0 and 120
exposure time for all fabrics in both places can be arranged in
descending order as cotton, silk, polyester, nylon, wool,
wool/polyester and nylon/polyester.
Figure 1. whiteness and whiteness over expressed days curves for
different fabrics at industrial and residential atmosphere in Egypt before
and after washing.
From these data, we can conclude that, air pollution effects the
mechanical properties of the fabrics especially in the industrial
areas more than residential one because of the presence of the
industrial pollutants, which includes many, gases pollutants and
particulate matter especially heavy metals. These materials, which
also presented an atmosphere of Dokki residential area but with
less amount due to the traffic and other different human activities
destroy the mechanical properties of the fabrics especially the
natural one more than synthetic one. Therefore, this difference is
due to the variation of the pollution concentrations at each site
individually.
Figure 2. Tensile strength and elongation at a break (%) over exposure
days curves for different fabrics at industrial and residential atmosphere in
Cairo Egypt.
This decreasing in tensile strength of natural fabrics at both
investigated sites is mainly attributed to the degradation of
polymer chain of natural fibers under the effect of various
pollutants with the meteorological factors such as radiation,

Naglaa S. Elshemy, Sahar Galal, Nadia M. El-Taieb, Alia A. Shakour, Asmaa M. Elmekawy, Ahmed G. Hassabo
Page | 686
temperature, and relative humidity, which causes a reduction in
average molecular weight and loss in tensile strength. Moreover,
degradation of biopolymers chain depends on the number of
pollutants. Increasing the exposure time let to that, the fibers
become dry, brittle, and easy to rupture. Exposure fabrics to
atmospheric pollutants may result in significant deterioration and
weakening. [39] Moreover, higher temperature in summer with the
relative humidity accelerate the action of acidic gases such as SO2,
NO2 and photochemical oxidants that affect the fabric
deterioration [40, 41]. These results are in agreement with those of
stated that fabrics are subjected to damage due to industrial
pollutants emissions. [42, 43].
In addition, it is clearly indicate that, the natural fabrics provide a
higher loss in tensile strength compared to that for synthetic or
blended fabrics at both investigated sites. This difference increases
with increasing the concentrations of pollutants in the atmosphere
(in industrial atmosphere more than residential atmosphere).
Changing in the elongation at a break of textile fabrics after
exposure illustrated in Figure 2 provides that, the percentage loss
of elongation for natural, synthetic or blended fabrics increases as
time of exposure increased. In addition, the changing from
residential to industrial atmosphere as in the same manner
discussed in the case of tensile strength.
It is noticeable that, the natural fabrics at both sites lost their
elongation after 30 days exposure time while synthetic or blended
fabrics lost their elongation after 60 days exposure time. The
decreasing in elongation for natural fabrics in both sites was
attributed to the degradation of biopolymer chain resulting from
the effect of various pollutants and other factors such as
temperature and relative humidity, which cause breaking of the
biopolymer chains and reduction of their elasticity [44, 45].
Figure 3. Tensile strength (%) and elongation at a break (%) after 120
exposure days for different fabrics at industrial and residential areas in
Cairo Egypt.
3.4. Isothermal Studies.
The yellowness index values over exposed fabrics for different
time (0, 30, 60, 90 and 120 days) were presented in Error!
Reference source not found.. Yellowness index for the blank
fabrics has been recorded as 10.53, -19.48, 16.98, -18.2, 0.72, 1.16
and 3.5 for silk, nylon, wool, cotton, polyester, nylon/polyester
and wool/polyester respectively. From Error! Reference source
not found., as the exposure time increasing the yellowness index
values increased for all exposed fabrics type in both examined
sites (residential or industrial atmosphere) even before or after
washing. In addition, it is clear that, natural fabrics have
yellowness index values higher than synthetic or blended fabrics
which provide more ability of natural fabrics to adsorb the air
pollutants from the residential or industrial atmosphere more than
synthetic or blended one.
Figure 4. Yellowness index values over expressed days for different
fabrics at industrial and residential areas in Cairo Egypt before and after
washing
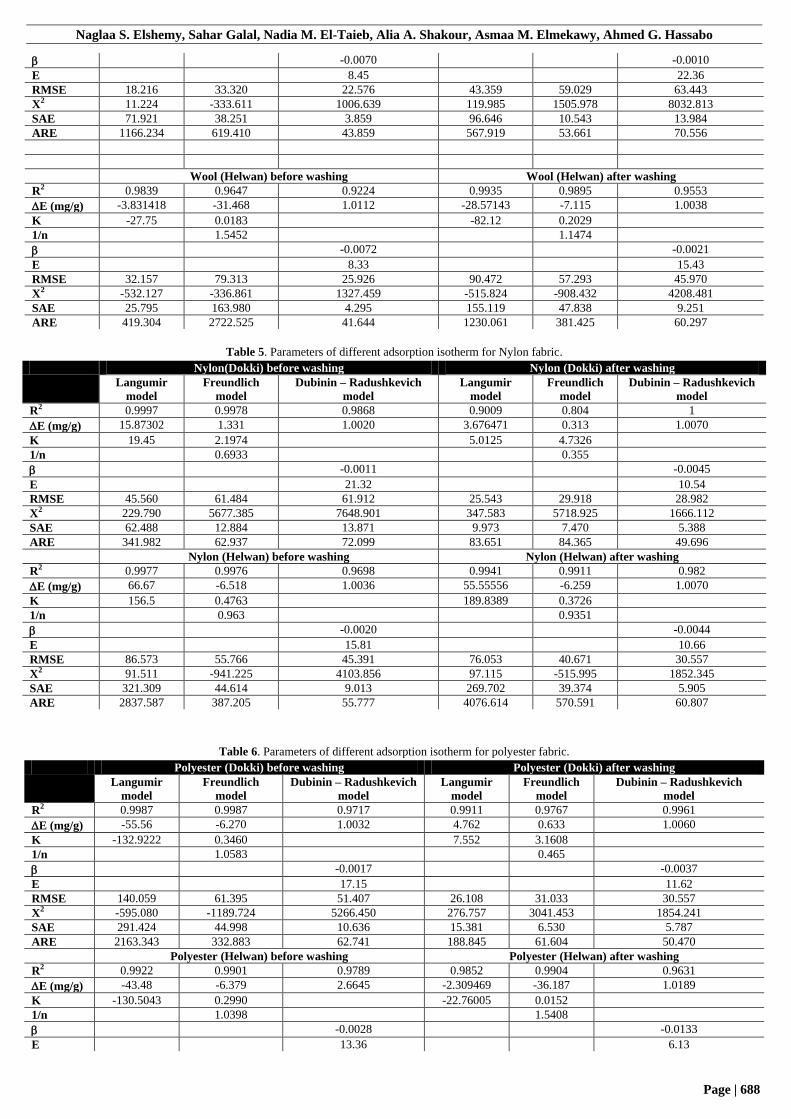
Different isothermal models have been investigated to describe the
behaviour of air pollution to adsorb on the fabrics surface, the
most used models for textile fibers are Langmuir, Freundlich and
Dubinin – Radushkevich models [27, 28]. The parameters of the
isothermal models with different errors function are listed in
Table 2 - Table 8 for each examined fabrics at both investigated
sites (Dokki and Helwan) before and after washing.
Langmuir isothermal model has been used to describe the mono
layer adsorbed pollution onto the surface of exposed fabrics. As
known, the expectation using this model that, the intermolecular
forces decrease quickly with separation with monolayer coating on
the external fabric surface with homogeneous distribution.
Freundlich isothermal model is a good model to characterise the
heterogeneity adsorption of pollutants onto the fabric surface. The
Effect of different fabrics types on the adsorption of air pollution in residential and industrial atmosphere in Cairo-Egypt
Page | 687
last examined isothermal model was Dubinin – Radushkevich
model [30].
During this research, the previous models were generally applied
to provide the physical and chemical adsorption of air pollutions.
It is noticeable that, Langmuir model gives a better fit R2 than the
other models. These results confirm that air pollutions can
adsorbed onto the active sites of the fabrics with monolayer.
Besides that, from Freundlich model as n value > 1, in this way, it
represented positive adsorption condition [46].
Based on this data, different isothermal models described by
Langmuir, Freundlich and Dubinin – Radushkevichmodels. This
means that the air pollutions are absorbed to fabric surface in a
homogeneous layer.
Table 2. Parameters of different adsorption isotherm for silk fabric.
Silk (Dokki) before washing Silk (Dokki) after washing
Langumir
model
Freundlich
model
Dubinin – Radushkevich
model
Langumir
model
Freundlich
model
Dubinin – Radushkevich
model
R2 0.9942 0.9868 0.9961 0.9842 0.9988 0.9917
E (mg/g) 4.115226 0.191 1.0051 -40 0.279 1.0016
K 4.6 6.4595 -67.58 5.0804
1/n 0.3181 0.5264
-0.0031 -0.0008
E 12.70 25.00
RMSE 24.206 28.269 27.368 107.638 55.044 54.272
X2 418.911 12546.430 2233.542 -788.952 32597.370 8820.344
SAE 10.919 9.084 6.642 217.961 17.124 14.956
ARE
Silk (Helwan) before washing Silk (Helwan) after washing
R2 0.9991 0.9984 0.9903 0.9941 1 0.9225
E (mg/g) 10.75269 0.907 1.0034 -1.650165 -142.971 1.0149
K 17.15914 2.6272 -17.33993 0.0027
1/n 0.5818 1.9683
-0.0019 -0.0098
E 16.22 7.14
RMSE 27.913 36.313 36.211 24.537 232.715 22.079
X2 195.874 4358.191 3918.265 -1091.264 -850.438 1438.965
SAE 41.462 9.579 9.291 14.477 721.081 5.369
ARE
Table 3. Parameters of different adsorption isotherm for cotton fabric.
Cotton(Dokki) before washing Cotton(Dokki) after washing
Langumir
model
Freundlich
model
Dubinin – Radushkevich
model
Langumir
model
Freundlich
model
Dubinin – Radushkevich
model
R2 0.9997 0.9984 0.9957 0.9863 0.9865 0.9696
E (mg/g) 12.34568 0.058 1.0008 38.46154 8.266 1.0021
K 4.928395 14.8252 62.83846 1.2497
1/n 0.3722 0.9106
-0.0004 -0.0011
E 35.36 21.32
RMSE 86.689 102.784 101.484 45.625 52.430 60.695
X2 1192.728 366808.53 20579.318 31.322 648.524 7350.265
SAE 33.189 28.366 25.537 176.193 25.218 13.109
ARE 80.971 99.156 85.330 1109.821 160.027 68.478
Cotton(Helwan) before washing Cotton(Helwan) after washing
R2 0.9979 0.9932 0.989 0.9945 0.9894 0.9864
E (mg/g) 21.73913 0.513 1.0010 25 6.687 1.0023
K 17.76087 3.5449 37.78 1.3026
1/n 0.6709 0.8004
-0.0005 -0.0012
E 31.62 20.41
RMSE 67.506 91.555 90.909 39.369 52.998 59.833
X2 375.773 32661.071 16510.483 73.996 826.633 7141.555
SAE 83.999 23.157 21.694 108.742 17.179 13.251
ARE 309.392 90.334 81.149 625.070 93.954 70.930
Table 4. Parameters of different adsorption isotherm for wool fabric.
Wool(Dokki) before washing Wool (Dokki) after washing
Langumir
model
Freundlich
model
Dubinin – Radushkevich
model
Langumir
model
Freundlich
model
Dubinin – Radushkevich
model
R2 0.9822 0.982 0.9699 0.9961 0.9978 0.9784
E (mg/g) 15.625 -6.409 1.0106 22.72727 4.599 1.0019
K 67.14 0.2911 30.88 1.4220
1/n 0.9224 0.7951
Naglaa S. Elshemy, Sahar Galal, Nadia M. El-Taieb, Alia A. Shakour, Asmaa M. Elmekawy, Ahmed G. Hassabo
Page | 688
-0.0070 -0.0010
E 8.45 22.36
RMSE 18.216 33.320 22.576 43.359 59.029 63.443
X2 11.224 -333.611 1006.639 119.985 1505.978 8032.813
SAE 71.921 38.251 3.859 96.646 10.543 13.984
ARE 1166.234 619.410 43.859 567.919 53.661 70.556
Wool (Helwan) before washing Wool (Helwan) after washing
R2 0.9839 0.9647 0.9224 0.9935 0.9895 0.9553
E (mg/g) -3.831418 -31.468 1.0112 -28.57143 -7.115 1.0038
K -27.75 0.0183 -82.12 0.2029
1/n 1.5452 1.1474
-0.0072 -0.0021
E 8.33 15.43
RMSE 32.157 79.313 25.926 90.472 57.293 45.970
X2 -532.127 -336.861 1327.459 -515.824 -908.432 4208.481
SAE 25.795 163.980 4.295 155.119 47.838 9.251
ARE 419.304 2722.525 41.644 1230.061 381.425 60.297
Table 5. Parameters of different adsorption isotherm for Nylon fabric.
Nylon(Dokki) before washing Nylon (Dokki) after washing
Langumir
model
Freundlich
model
Dubinin – Radushkevich
model
Langumir
model
Freundlich
model
Dubinin – Radushkevich
model
R2 0.9997 0.9978 0.9868 0.9009 0.804 1
E (mg/g) 15.87302 1.331 1.0020 3.676471 0.313 1.0070
K 19.45 2.1974 5.0125 4.7326
1/n 0.6933 0.355
-0.0011 -0.0045
E 21.32 10.54
RMSE 45.560 61.484 61.912 25.543 29.918 28.982
X2 229.790 5677.385 7648.901 347.583 5718.925 1666.112
SAE 62.488 12.884 13.871 9.973 7.470 5.388
ARE 341.982 62.937 72.099 83.651 84.365 49.696
Nylon (Helwan) before washing Nylon (Helwan) after washing
R2 0.9977 0.9976 0.9698 0.9941 0.9911 0.982
E (mg/g) 66.67 -6.518 1.0036 55.55556 -6.259 1.0070
K 156.5 0.4763 189.8389 0.3726
1/n 0.963 0.9351
-0.0020 -0.0044
E 15.81 10.66
RMSE 86.573 55.766 45.391 76.053 40.671 30.557
X2 91.511 -941.225 4103.856 97.115 -515.995 1852.345
SAE 321.309 44.614 9.013 269.702 39.374 5.905
ARE 2837.587 387.205 55.777 4076.614 570.591 60.807
Table 6. Parameters of different adsorption isotherm for polyester fabric.
Polyester (Dokki) before washing Polyester (Dokki) after washing
Langumir
model
Freundlich
model
Dubinin – Radushkevich
model
Langumir
model
Freundlich
model
Dubinin – Radushkevich
model
R2 0.9987 0.9987 0.9717 0.9911 0.9767 0.9961
E (mg/g) -55.56 -6.270 1.0032 4.762 0.633 1.0060
K -132.9222 0.3460 7.552 3.1608
1/n 1.0583 0.465
-0.0017 -0.0037
E 17.15 11.62
RMSE 140.059 61.395 51.407 26.108 31.033 30.557
X2 -595.080 -1189.724 5266.450 276.757 3041.453 1854.241
SAE 291.424 44.998 10.636 15.381 6.530 5.787
ARE 2163.343 332.883 62.741 188.845 61.604 50.470
Polyester (Helwan) before washing Polyester (Helwan) after washing
R2 0.9922 0.9901 0.9789 0.9852 0.9904 0.9631
E (mg/g) -43.48 -6.379 2.6645 -2.309469 -36.187 1.0189
K -130.5043 0.2990 -22.76005 0.0152
1/n 1.0398 1.5408
-0.0028 -0.0133
E 13.36 6.13

Effect of different fabrics types on the adsorption of air pollution in residential and industrial atmosphere in Cairo-Egypt
Page | 689
RMSE 108.459 49.750 37.961 24.268 83.184 20.083
X2 -454.159 -763.270 1076.355 -505.406 -310.059 789.669
SAE 227.525 42.028 7.712 16.752 186.142 3.816
ARE 3526.972 602.777 138.855 378.448 4463.057 70.367
Table 7. Parameters of different adsorption isotherm for Nylon/polyesterfabric.
Nylon/Polyester (Dokki) before washing Nylon/Polyester (Dokki) after washing
Langumir
model
Freundlich
model
Dubinin – Radushkevich
model
Langumir
model
Freundlich
model
Dubinin – Radushkevich
model
R2 0.9995 0.9974 0.9863 0.9961 0.9993 0.9887
E (mg/g) 6.25 -7.803 1.0125 5.617978 2.175 1.0064
K 23.93 0.6224 11.35899 1.8005
1/n 0.7344 0.581
-0.0086 -0.0040
E 7.62 11.18
RMSE 14.992 33.173 20.045 24.318 28.268 29.716
X2 59.422 -266.461 791.633 199.294 730.570 1752.790
SAE 25.701 44.562 3.535 19.789 4.596 5.311
ARE 502.831 852.592 53.389 219.297 41.830 43.527
Nylon/Polyester (Helwan) before washing Nylon/Polyester (Helwan) after washing
R2 0.994 0.9906 0.9832 0.9898 0.9933 0.9812
E (mg/g) 27.77778 -6.323 1.0108 7.518797 -15.606 1.0075
K 120.0528 0.3167 21.0188 0.8387
1/n 0.9134 0.7299
-0.0072 -0.0048
E 8.33 10.21
RMSE 34.245 33.730 23.262 20.394 53.617 27.385
X2 28.882 -347.200 1068.722 95.599 -337.200 1486.658
SAE 132.614 37.892 4.256 29.914 85.713 4.657
ARE 2436.511 677.419 57.977 350.775 1035.660 39.595
Table 8. Parameters of different adsorption isotherm for wool/polyesterfabric.
Wool/Polyester (Dokki) before washing Wool/Polyester (Dokki) after washing
Langumir
model
Freundlich
model
Dubinin –
Radushkevich model
Langumir
model
Freundlich
model
Dubinin – Radushkevich
model
R2 0.9994 0.9951 0.9921 0.9989 0.9931 0.9938
E (mg/g) 6.452 1.049 1.0048 6.536 0.507 1.0038
K 10.5271 2.4502 8.419 3.5686
1/n 0.5525 0.4972
-0.0029 -0.0022
E 13.13 15.08
RMSE 29.266 35.625 35.681 34.316 41.777 41.118
X2 252.616 2418.450 2532.098 347.261 6881.493 3366.609
SAE 22.381 6.731 6.863 21.151 10.007 8.518
ARE 212.952 49.133 51.259 153.433 80.334 61.077
Wool/Polyester (Helwan) before washing Wool/Polyester (Helwan) after washing
R2 0.9975 0.9996 0.9274 0.9989 0.9911 0.9966
E (mg/g) -2.02 -77.855 1.0145 5.263 0.197 1.0037
K -19.36384 0.0057 4.973 6.3329
1/n 1.7963 0.3707
-0.0096 -0.0021
E 7.22 15.43
RMSE 29.150 163.832 25.485 35.845 42.317 41.235
X2 -837.207 -533.810 1278.302 477.727 18180.306 3386.086
SAE 16.416 395.588 4.632 14.694 11.031 8.611
ARE 312.502 8289.406 62.811 100.312 92.503 61.799
4. CONCLUSIONS
Three fabrics type namely natural (silk, wool and cotton),
synthetic (nylon and polyester) and some blends between each
other’s (nylon/polyester and wool/polyester) were exposed at two
different places for 120 days, the first place at residential
atmosphere in Cairo city (Dokki place) and the second place at
industrial atmosphere in Cairo city (Helwan place) which
represent loads of air pollutants.
Whiteness of exposed fabrics have been investigated at different
exposed time (0 – 120 days) and it is clear that, natural fabrics
have whiteness values lower than synthetic or blended fabrics
which provide the ability of natural fabrics type to adsorb the
pollution from the atmosphere more than synthetic or blended one.
Mechanical properties of exposed fabrics after different period
(30, 60, 90 and 120 days) have been investigated in terms of

Naglaa S. Elshemy, Sahar Galal, Nadia M. El-Taieb, Alia A. Shakour, Asmaa M. Elmekawy, Ahmed G. Hassabo
Page | 690
tensile strength and elongation. It is clearly indicated that, the
natural fabrics provide a higher loss in tensile strength compared
to that for synthetic or blended fabrics at both investigated sites.
This difference increases with increasing the concentrations of
pollutants in the atmosphere (in industrial atmosphere more than
residential atmosphere).
Different isothermal models have been investigated to describe the
behaviour of air pollution to adsorb on the fabrics surface, the
most used models for textile fibers are Langmuir, Freundlich and
Dubinin – Radushkevich models, and they confirm that the air
pollutions are absorbed to fabric surface in a homogeneous layer.
5. REFERENCES
1. Tang, W.; Du, L.; Sun, W.; Yu, Z.; He, F.; Chen, J.; Li, X.;
Li, X.; Yu, L.; Chen, D. Maternal exposure to fine particulate air
pollution induces epithelial-to-mesenchymal transition resulting
in postnatal pulmonary dysfunction mediated by transforming
growth factor-beta/Smad3 signaling. Toxicology Letters 2017,
267, 11-20. https://doi.org/10.1016/j.toxlet.2016.12.016.
2. Seposo, X.; Ueda, K.; Park, S.S.; Sudo, K.; Takemura, T.;
Nakajima, T. Effect of global atmospheric aerosol emission
change on PM(2.5)-related health impacts. Global health action
2019, 12, 1664130-
1664130.https://doi.org/10.1080/16549716.2019.166413.
3. Pallarés, S.; Gómez, E.; Martínez, A.; Jordán, M.M. The
relationship between indoor and outdoor levels of PM10 and its
chemical composition at schools in a coastal region in Spain.
Heliyon 2019, 5, e02270-e02270.
https://doi.org/10.1016/j.heliyon.2019.e02270.
4. Cheng, C.-Y.; Cheng, S.-Y.; Chen, C.-C.; Pan, H.-Y.; Wu,
K.-H.; Cheng, F.-J. Ambient air pollution is associated with
pediatric pneumonia: a time-stratified case-crossover study in an
urban area. Environmental health: a global access science source
2019, 18, 77-77. https://doi.org/10.1186/s12940-019-0520-4.
5. Ghorani-Azam, A.; Riahi-Zanjani, B.; Balali-Mood, M.
Effects of air pollution on human health and practical measures
for prevention in Iran. Journal of research in medical sciences :
the official journal of Isfahan University of Medical Sciences
2016, 21, 65-65. https://doi.org/10.4103/1735-1995.189646.
6. Bai, L.; Wang, J.; Ma, X.; Lu, H. Air Pollution Forecasts: An
Overview. International Journal of Environmental Research and
Public Health 2018, 15. https://doi.org/10.3390/ijerph15040780.
7. Heinsohn, R.J.; Kabel, R.L. Sources and control of air
pollution In: Horton, S.B.M. (Eds.), Prentice-Hall, Inc., Upper
Saddle River, New Jersey, USA, 1999.
8. Orru, H.; Ebi, K.L.; Forsberg, B. The Interplay of Climate
Change and Air Pollution on Health. Curr Environ Health Rep
2017, 4, 504-513. https://doi.org/10.1007/s40572-017-0168-6.
9. Lee, H.; Jung, J.; Myung, W.; Baek, J.H.; Kang, J.M.; Kim,
D.K.; Kim, H. Association between dust storm occurrence and
risk of suicide: Case-crossover analysis of the Korean national
death database. Environment International 2019, 133, 105146.
https://doi.org/10.1016/j.envint.2019.105146.
10. Dris, R.; Gasperi, J.; Mirande, C.; Mandin, C.; Guerrouache,
M.; Langlois, V.; Tassin, B. A first overview of textile fibers,
including microplastics, in indoor and outdoor environments.
Environmental Pollution 2017, 221, 453-458.
https://doi.org/10.1016/j.envpol.2016.12.013.
11. Brysson, R.J.; Trask, B.J.; Upham, J.B.; Booras, S.G. The
Effects of Air Pollution on Exposed Cotton Fabrics. Journal of
the Air Pollution Control Association 1967, 17, 294-298,
https://doi.org/10.1080/00022470.1967.10468981.
12. Mohamed, A.L.; Hassabo, A.G. Flame Retardant of
Cellulosic Materials and Their Composites. In: Flame
Retardants. Visakh, P.M., Arao, Y. (Eds.) Springer International
Publishing 2015; pp. 247-314, https://doi.org/10.1007/978-3-
319-03467-6_10.
13. Morris, M.A.; Mitchell, B.W.; Aas-Wang, T. The Effect of
an Airborne Soil on the Photochemical Degradation of Wool.
Text. Res. J. 1962, 52, 723-727.
14. Liu, F.; Li, M.; Shao, W.; Yue, W.; Hu, B.; Weng, K.; Chen,
Y.; Liao, X.; He, J. Preparation of a polyurethane electret
nanofiber membrane and its air-filtration performance. J Colloid
Interface Sci 2019, 557, 318-327.
https://doi.org/10.1016/j.jcis.2019.08.099.
15. El-Taieb, N.M.; Shakour, A.A.; Saleh, I.A. Study of the
effects of air pollution on textiles exposed to Cairo's ambient
atmosphere. Int J Environ Pollut 2003, 19, 545-556,
https://doi.org/10.1504/IJEP.2003.004350.
16. Vallero, D. Fundamentals of Air Pollution. 5th Edition ed.,
Academic Press 2014.
17. Jentina, E.L. Artificial ageing of yarns in presence as well as
in absence of light and under different atmospheric conditions.
Delft University of Technology. Laboratory for Textile
Technology, Committee of I.C.O.M. for Conservation,
Amsterdam, 1969.
18. Shakour, A.A.; Hassanien, M.A.; El-Taieb, N.M.
Atmospheric heavy metals in the industrial area North Cairo,
Egypt. Central European Journal of Occupational and
Environmental Medicine Hungary 2001, 73, 245-252.
19. Ibrahim, Y.H.; Shakour, A.A.; Abdel-Latif, N.M.; El-Taieb,
N.M. Assessment of heavy metal levels in the environment,
Egypt. The Journal of American Science 2011, 7, 148-153.
20. Marr, I.L.; Cresser, M.S. Environmental chemical analysis.
International Textbook Co.1983.
21. Kubelka, P.; Munk, F. Ein Beitrag zur Optik der
Farbanstriche. Z. Tech. Phys. 1931, 12, 593.
22. Mehta, K.T.; Bhavsar, M.C.; Vora, P.M.; Shah, H.S.
Estimation of the Kubelka--Munk scattering coefficient from
single particle scattering parameters. Dyes Pigments 1984, 5,
329-340, https://doi.org/10.1016/0143-7208(84)80027-3.
23. Waly, A.; Marie, M.M.; Abou-Zeid, N.Y.; El-Sheikh, M.A.;
Mohamed, A.L. Flame Retarding, Easy Care Finishing and
Dyeing of Cellulosic Textiles in One Bath. Egyptian Journal of
Textile Polymer Science and Technology 2008, 12, 101-131.
24. Waly, A.; Marie, M.M.; Abou-Zeid, N.Y.; El-Sheikh, M.A.;
Mohamed, A.L. Process of Single – Bath Dyeing, Finishing and
Flam – Retarding of Cellulosic Textiles in Presence of Reactive
Tertiary Amines. In: 3rd International Conference of Textile
Research Division, NRC; Textile Processing: State of the Art &
Future DevelopmentsCairo, Egypt, 2006; pp. 529 – 543.
25. Hassabo, A.G. Preparation, Characterisation and utilization
of some textile auxiliaries. El-Azhar University, Cairo, Egypt,
2005.
26. ASTM Standard Test Method C33 (ASTM D–1682–2011),
Standard Test Methods for Determination of Tensile Strength,
ASTM International, West Conshohocken, PA, 2011.
27. Hassabo, A.G. Synthesis and Deposition of Functional Nano-
Materials on Natural Fibres RWTH Aachen University.
Germany 2011, pp. 154.
28. Hassabo, A.G.; Mendrek, A.; Popescu, C.; Keul, H.; Möller,
M. Deposition of Functionalized Polyethylenimine-Dye onto
Cotton and Wool Fibres. RJTA 2014, 18, 36-49,
https://doi.org/10.1108/RJTA-18-01-2014-B006.
29. Wang, S.; Boyjoo, Y.; Choueib, A.; Zhu, Z.H. Removal of
dyes from aqueous solution using fly ash and red mud. Water

Effect of different fabrics types on the adsorption of air pollution in residential and industrial atmosphere in Cairo-Egypt
Page | 691
Res. 2005, 39, 129-138,
https://doi.org/10.1016/j.watres.2004.09.011
30. Ardejani, F.D.; Badii, K.; Limaee, N.Y.; Shafaei, S.Z.;
Mirhabibi, A.R. Adsorption of Direct Red 80 dye from aqueous
solution onto almond shells: Effect of pH, initial concentration
and shell type. Journal of Hazurdous Materials 2008, 151, 730 –
737, https://doi.org/10.1016/j.jhazmat.2007.06.048.
31. Sahmoune, M.N.; Louhab, K. Kinetic Analysis Of Trivalent
Chromium Biosorption By Dead Streptomyces Rimosus
Biomass. The Arabian Journal for Science and Engineering
2010, 35, 69-80.
32. Sahmoune, M.N.; Louhab, K.; Boukhiar, A. Biosorption of
Cr (III) from Aqueous Solutions Using Bacterium Biomass
Streptomyces rimosus. International Journal of Environmental
Research 2009, 3, 229-238.
33. Wasewar, K.L.; Atif, M.; Prasad, B.; Mishra, I.M.
Adsorption of Zinc using Tea Factory Waste: Kinetics,
Equilibrium and Thermodynamics. CLEAN – Soil, Air, Water
2008, 36, 320-329, https://doi.org/10.1002/clen.200700139.
34. El-Zawahry, M.M.; Abdelghaffar, F.; Abdelghaffar, R.A.;
Hassabo, A.G. Equilibrium and kinetic models on the adsorption
of Reactive Black 5 from aqueous solution using Eichhornia
crassipes/chitosan composite. Carbohydr. Polym. 2016, 136,
507-515.
35. Brook, R.D.; Rajagopalan, S.; Pope, C.A.; Brook, J.R.;
Bhatnagar, A.; Diez-Roux, A.V.; Holguin, F.; Hong, Y.;
Luepker, R.V.; Mittleman, M.A.; Peters, A.; Siscovick, D.;
Smith, S.C.; Whitsel, L.; Kaufman, J.D. Particulate matter air
pollution and cardiovascular disease: An update to the scientific
statement from the American Heart Association. Circulation
2010, 121, 2331-2378,
https://doi.org/10.1161/CIR.0b013e3181dbece1.
36. Smith, K.R.; Jerrett, M.; Anderson, H.R.; Burnett, R.T.;
Stone, V.; Derwent, R.; Atkinson, R.W.; Cohen, A.; Shonkoff,
S.B.; Krewski, D.; Pope, C.A. 3rd; Thun, M.J.; Thurston, G.
Public health benefits of strategies to reduce greenhouse-gas
emissions: health implications of short-lived greenhouse
pollutants. Lancet 2009, 374, 2091-2103,
https://doi.org/10.1016/S0140-6736(09)61716-5.
37. Poschl, U.; Shiraiwa, M. Multiphase chemistry at the
atmosphere-biosphere interface influencing climate and public
health in the Anthropocene. Chem. Rev. 2015, 115, 4440-4475,
https://doi.org/10.1021/cr500487s.
38. Patz, J.A.; Campbell-Lendrum, D.; Holloway, T.; Foley, J.A.
Impact of regional climate change on human health. Nature
2005, 438, 310-317.
39. Sierra-Vargas, M.P.; Teran, L.M. Air pollution: impact and
prevention. Respirology (Carlton, Vic.) 2012, 17, 1031-1038,
https://dx.doi.org/10.1111%2Fj.1440-1843.2012.02213.x.
40. Forbes, S.; Perrault, K.; Stefanuto, P.H.; Nizio, K.; Focant, J.
Comparison of the Decomposition VOC Profile during Winter
and Summer in a Moist. Mid-Latitude (Cfb) Climate 2014,
https://doi.org/10.1371/journal.pone.0113681.
41. Bhanarkar, A.; Goyal, S.K.; Sivacoumar, R.; Chalapati,
C.V.R. Assessment of contribution of SO2 and NO2 from
different sources in Jamshedpur region, India. Atmospheric
Environment 2005, 39, 7745-7760.
42. Grosjean, D.; Sensharma, D.K.; Cass, G.R. Fading of
colorants by atmospheric pollutants: mass spectrometry studies.
Sci Total Environ 1994, 152, 125-134,
https://doi.org/10.1016/0048-9697(94)90492-8.
43. Cass, G.R. The fading of artists' colorants by exposure to
atmospheric nitrogen dioxide. AU - Whitmore, Paul M, Studies
in Conservation 1989, 34, 85-97,
https://doi.org/10.1179/sic.1989.34.2.85.
44. Bayley, C.H.; Weatherburn, M.W. The Effect of Weathering
on Cotton Fabric Containing Certain Copper Rotproofers. Can J
Res 1946, 24f, 193-202, http://dx.doi.org/10.1139/cjr46f-023.
45. Lee, D.S.; Holland, M.R.; Falla, N. The potential impact of
ozone on materials in the U.K. Atmos Environ 1996, 30, 1053-
1065, https://doi.org/10.1016/1352-2310(95)00407-6.
46. Hameed, B.H.; Mahmoud, D.K.; Ahmad, A.L. Equilibrium
modeling and kinetic studies on the adsorption of basic dye by a
low-cost adsorbent: Coconut (Cocos nucifera) bunch waste.
Journal of Hazardous Materials 2008, 158, 65-72,
https://doi.org/10.1016/j.jhazmat.2008.01.034.
6. ACKNOWLEDGEMENTS
The authors also gratefully grateful acknowledge to National Research Centre (NRC) for facilities provided.
© 2019 by the authors. This article is an open access article distributed under the terms and conditions of the
Creative Commons Attribution (CC BY) license (http://creativecommons.org/licenses/by/4.0/).