Embed Size (px)
Citation preview

Volume 5, Issue 3 (IV)July - September 2017

International Journal of Research in Management & Social Science
Volume 5, Issue 3 ( IV ) : July - September 2017
Chief Patron Mr. Zahirul Alam Ahmed Director, Empyreal Institute of Higher Education. President , Bhramaputra Welfare Organization
Editor- In-Chief Dr. Tazyn Rahman
Members of Editorial Advisory Board
Mr. Nakibur Rahman Ex. General Manager ( Project ) Bongaigoan Refinery, IOC Ltd, Assam
Dr. Mukesh Saxena Pro Vice Chancellor, University of Technology and Management, Shillong
Dr. Alka Agarwal Director, Mewar Institute of Management, Ghaziabad
Dr. Archana A. Ghatule Director, SKN Sinhgad Business School, Pandharpur
Prof. (Dr.) Sudhansu Ranjan Mohapatra Dean, Faculty of Law, Sambalpur University, Sambalpur
Prof.(Dr.) Sharad Kumar Goel Director, Indirapuram Institute of Higher Studies, Ghaziabad
Dr. P. Malyadri Principal, Government Degree College, Hyderabad
Prof. (Dr.) Monoj Kumar Chowdhury Professor, Department of Business Administration, Guahati University, Guwahati
Prof.(Dr.) Shareef Hoque Professor, North South University, Bangladesh
Prof. (Dr.) Baljeet Singh Hothi Professor, Gitarattan International Business School, Delhi
Prof.(Dr.) Michael J. Riordan Professor, Sanda University, Jiashan, China
Prof. (Dr.) Badiuddin Ahmed Professor & Head, Department of Commerce, Maulana Azad Nationl Urdu University, Hyderabad
Prof.(Dr.) James Steve Professor, Fresno Pacific University, California, USA
Dr. Anindita Sharma Dean & Associate Professor, Jaipuria School of Business, Indirapuram, Ghaziabad
Prof.(Dr.) Chris Wilson Professor, Curtin University, Singapore
Prof. (Dr.) Jose Vargas Hernandez Research Professor, University of Guadalajara,Jalisco, México
Prof. (Dr.) Amer A. Taqa Professor, DBS Department, University of Mosul, Iraq
Prof. (Dr.) Himanshu Pandey Professor, Department of Mathematics and Statistics Gorakhpur University, Gorakhpur
Dr. Nurul Fadly Habidin Faculty of Management and Economics, Universiti Pendidikan Sultan Idris, Malaysia
Prof. (Dr.) Agbo Johnson Madaki Faculty, Faculty of Law, Catholic University of Eastern Africa, Nairobi, Kenya
Dr. Neetu Singh HOD, Department of Biotechnology, Mewar Institute, Vasundhara, Ghaziabad
Prof. (Dr.) D. Durga Bhavani Professor, CVR College of Engineering, Hyderabad, Telangana

Prof. (Dr.) Shashi Singhal Professor, Amity University, Jaipur
Prof. (Dr.) Aradhna Yadav Professor, New Horizon College of Engineering, Bengaluru
Prof. (Dr.) Alireza Heidari Professor, Faculty of Chemistry, California South University, California, USA
Prof.(Dr.) Robert Allen Professor Carnegie Mellon University, Australia
Prof. (Dr.) Badar Alam Iqbal Adjunct Professor, Monarch University, Switzerland
Prof. (Dr.) S. Nallusamy Professor & Dean, Dr. M.G.R. Educational & Research Institute, Chennai
Dr. Dhananjay Prabhakar Awasarikar Associate Professor, Suryadutta Institute, Pune
Dr. Sarmistha Sarma Associate Professor, Institute of Innovation in Technology and Management
Dr. Mohammad Younis Associate Professor, King Abdullah University, Saudi Arabia
Dr. Pranjal Sharma Associate Professor, Department of Management Mile Stone Institute of Higher Management, Ghaziabad
Dr. Kavita Gidwani Associate Professor, Chanakya Technical Campus, Jaipur
Dr. Lalata K Pani Reader, Bhadrak Autonomous College, Bhadrak, Odisha
Dr. Vijit Chaturvedi Associate Professor, Amity University, Noida
Dr. Sunita Dwivedi Associate Professor, Symbosis Center for Management Studies, Noida
Dr. Marwan Mustafa Shammot Associate Professor, King Saud University, Saudi Arabia
Dr. R. Navaneeth Krishnan Associate Professor, Bharathiyan College of Engg & Tech, Puducherry
Dr. Juhab Hussain Assistant Professor, King Abdulaziz University, Saudi Arabia
Dr. Namita Dixit Assistant Professor, ITS Institute of Management, Ghaziabad
Dr. V. Tulasi Das Assistant Professor, Acharya Nagarjuna University, Guntur, A.P.
Mr. Sukhvinder Singh Assistant Professor, Institute of Innovation in Technology & Management
Dr. Urmila Yadav Assistant Professor, Sharda University, Greater Noida
Dr. Nidhi Agrawal Assistant Professor, Institute of Technology & Science, Ghaziabad
Copyright @ 2017 Empyreal Institute of Higher Education, Guwahati All rights reserved. No part of this publication may be reproduced or transmitted in any form or by any means, or stored in any retrieval system of any nature without prior written permission. Application for permission for other use of copyright material including permission to reproduce extracts in other published works shall be made to the publishers. Full acknowledgment of author, publishers and source must be given. The views expressed in the articles are those of the contributors and not necessarily of the Editorial Board or the Institute. Although every care has been taken to avoid errors or omissions, this publication is being published on the condition and understanding that information given in this journal is merely for reference and must not be taken as having authority of or binding in any way on the authors, editors and publishers, who do not owe any responsibility for any damage or loss to any person, for the result of any action taken on the basis of this work. All disputes are subject to Guwahati jurisdiction only.


International Journal of Research in Management & Social Science
Volume 5, Issue 3 ( IV ) : July - September 2017
CONTENTS
Research Papers
JOB ROTATION PRACTICES: PERCEPTIONS AND CHALLENGES ASSOCIATED WITH UNIVERSITY OF DODOMA, TANZANIA
Rehema Salim and Dr. N. Viswanadham
1 – 7
PROCESS RE-ENGINEERING AND CHANGE MANAGEMENT IN E-GOVERNANCE IN ASSAM
Uttam Kr. Pegu
8 – 14
A STUDY ON “BRAND IMAGE OF HONDA TWO-WHEELERS WITH REFERENCE TO HYDERABAD CITY
Dr. Osman Bin Salam
15 – 22
A PRAGMATIC ANALYSIS ON THE ASSORTED DIMENSIONS OF CUSTOMER RETENTION
C. S. Jayanthi Prasad and Dr. Suresh Reddy Jakka
23 – 29
SELF GOVERNANCE AND RESPONSIBILITY IN GLOBAL TIMES
Dr. Ayesha Gautam
30 – 35
YOU ARE MORE POWERFUL THAN YOU THINK: IPHONE
Jyoti
36 – 41
IMPACT OF RECENCY BIAS ON STOCK SELECTION: A DEMOGRAPHIC STUDY ON INVESTORS OF JAIPUR CITY
Prof. C. K. Shah and Dr. Ity Patni
42 – 47
UNIT LINKED INSURANCE PLANS – AN APT ASSET VEHICLE FOR GROWTH
Shilpa R. Kankonkar
48 – 53
IMPACT OF PRIVATISATION AND IRDAI ON LIFE INSURANCE CORPORATION OF INDIA
Shridevi Naganath Chandane
54 – 58
DOMESTIC POLITICS IN INDIA’S FOREIGN POLICY
Swastika Pradhan
59 – 63
NATIONAL FOOD SECURITY ACT 2013: A VEHICLE TO FOOD SECURITY IN INDIA
Pratima and Dr. Kavita Chakravarty
64 – 69
IMPACT OF CLIMATE CHANGE ON AGRICULTURAL PRODUCTIVITY: A CASE STUDY OF NALGONDA DISTRICT TELANGANA
Dr. T. Anuradha, M. Kamraju, M. Vani and P. Manisha
70 – 76
DESIGN AND SYNTHESIS OF VEDIC FLOATING POINT MULTIPLIER
Soumya Gulannanavar and Dr. S. S. Kerur
77 – 83

CORPORATE GOVERNANCE AND ITS ROLE IN FIRM’S PERFORMANCE
Dr. Sampada Kapse
84 – 90
EFFECT OF HEARTFULNESS SPIRITUAL PRACTICE BASED PROGRAM ON MENTAL AND PHYSICAL HEALTH INDICATORS
Narendra Kumar Arya, Kamlesh Singh and Anushree Malik
91 – 103
GREEN RETAILING: AN INNOVATIVE BUSINESS PERSPECTIVE
Sayani Mandal and Sumanta Dutta
104 – 109

1
International Journal of Research in Management & Social Science Volume 5, Issue 3 (IV): July - September, 2017
ISSN 2322 - 0899
JOB ROTATION PRACTICES: PERCEPTIONS AND CHALLENGES ASSOCIATED WITH UNIVERSITY OF DODOMA, TANZANIA
Rehema Salim1 and Dr. N. Viswanadham2 Staff1 & Lecturer2, The University of Dodoma, Dodoma, Tanzania
ABSTRACT Job rotation may encourage generalization; it prevents job specialization so that the optimal level of performance is reached. Job rotation has been common to the public organizations including training institutions in Tanzania. This study considers the case of University of Dodoma as a test site for this theory of job rotation with justification that, UDOM is mostly practicing job rotation. A stratified sampling technique and a case study were employed. A sample size of one hundred (100) respondents was selected to contribute in the study;fifty six (56) of respondents were female and forty four (44) of respondents were male. The study made use of both primary and secondary sources of data collection. The study also revealed that workers’ performance does not depend on rotation, instead they were demanding for provision of training, workshop/seminars, incentive such as allowances, working facilities and timely promotion. They also demanded for well planned and documented job rotation policy at UDOM, all of these would improve their performance which would mark the institution as a center of excellence.
Key words: Job rotation: motivation: performance: skill management.
1. INTRODUCTION Job rotation is a job design method which is able to enhance motivation to develop views and double productivity in civilized resources which is said to be able to improve organization performance at organizational and individual levels by multi-skilled workers, well applied available capacities and providing new spheres for attitude, deliberation, capabilities and skills of workers. If an employee is in an unsuccessful situation and the performance data support this lack of success, one of the first precautions which can be taken to avoid losing the employee, is to transfer him/her to a different job and thus prevent the drop in performance. In this way the employee can be placed in the productive job or position. Working in a comfortable job with an overlapping of knowledge and skill levels has a positive effect on motivation which is definitely improve the performance (Adomi, 2006).
Job rotations are implemented in line with business goals and human resource strategies of an organization (Plowman, 2010). In public service, job rotation can mean the exchange of persons from one office to another office, especially during the end of term of one’s incumbency or legislative period. In private business organizations, the purpose of job rotation depends on the level of an employee’s job assignment. For lower level management, job rotation is implemented for skills enhancement and promotability. For middle management, job rotation is conducted for the purpose of succession planning. The other reason for job rotations is said to be able to solve the problem of complacency and boredom. Job rotation benefits employees who participate by reducing job burn-out apathy and fatigue which ultimately increases the level of employee and motivation.Higher performerscompared to under performers are likely to like job rotation because it is perceived to add to greater improvements in skills (Khan, 2010).
Different views from different stakeholders based on the fact that government offices have been chaotic in term of service delivery to the public/citizens. There are a lot of delaying, and annoying answers to some few staff and sometimes corruption in the public organization. They believe that it is because of commonness of those staff being in the same office. Some few staff have taken for granted the government office as their own office; they can decide on what to do and when to do. The University of Dodoma (UDOM) is one of the training institution which commonly practices job rotation in terms of reshuffling of its administrative staff. The institution believes that reshuffling of its administrative staff is one of the strategies which can improve the performance of its administrative staff on service delivery to the students, other customers and the organization itself. Some other staff say that there is poor performance by some administrative staff who have been serving the same office for a long period of time.
The staff complains that rotation does not motivate them since they do not have enough time to plan for their work, executing effectively and controlling its results. They always believe that they may plan for their work and while executing it, they are transferred to other offices without observing its results whether it is successful or not to make corrections. This phenomenon mostly lowers the morale and performance of the employee since

2
International Journal of Research in Management & Social Science Volume 5, Issue 3 (IV): July - September, 2017
ISSN 2322 - 0899
they believe that whatever they will not be recognized because they will not be able to accomplish and as they may somewhere else doing something else.
However, some other staff said that, job rotation benefits them since they learn a lot of things; they gain experience, knowledge and skills. They are also motivated to experience new environments, social interactions and skills varieties since some of them can be assigned different tasks apart from their normal duties. Other staff are motivated when they are transferred from one office to another once they realize that the office they are going to serve is not huge, has little responsibilities; therefore they are going to rest.
2. LITERATURE REVIEW 2.1.EMPLOYEE LEARNING THEORY The employee learning argument is that job rotation is an effective way to develop employees’ abilities. According to Champion, Cheraskin and Stevens, (1994), job rotation produces two beneficial effects. First, an employee who rotates accumulates experience more quickly than an employee who does not rotate. Hence job rotation is mentioned as an effective tool for career development. Second, an employee who rotates accumulates experience in more areas than an employee who does not rotate. Hence, if an employee rotates more frequently, it is easier to train him to become a generalist.
2.2.EMPLOYER LEARNING THEORY The employer learning argument is that job rotation provides information that the firm can use to improve the allocation of jobs among employees. If an employee can be observed performing different activities, it may be easier for the firm to find out the most appropriate job for that employee (Ortega, 2001).
2.3.THE FORMAL THEORY OF INCENTIVE The formal theory of incentive on job rotation can motivate employees otherwise they would be suited bored and tired of repeating always the same task. Employees can work hard so as to improve performance and productivity in the organization if the job itself motivates them. In order for a job to motivate employee should have characteristics like skills varieties, task identity, task significance and autonomy. Job rotation is one way which can equip the employee with these attributes and hence the employee becomes more motivated to work hard. Job design theory on the aspect of job characteristic model stipulates these elements.
2.4. THE TWO FACTOR THEORY According to Frederick Hertzberg (1968) with the two factor theory suggests that, job rotation increases job satisfaction to the employee which facilitates the improvement of performance. Herzberg believes that job satisfaction has two dimensions. One dimension is factors and conditions, the lack of which leads to dissatisfaction, including staff attitudes and perceptions, administrative practices, organizational policies, the nature and extent of supervision, job security, working conditions, job position, payment level, and establishment of mutual interaction between managers, peers, subordinates, and personal life of employees. Herzberg calls them hygiene or influencing factors on maintaining the status quo or survival factors.
2.5. JOB DESIGN THEORY The theory proposes that, the way the job is designed determines the level of effort the job will receive from its doer.Studies show that the way the elements in the job are organized can act increase or reduce individual’s effort.
2.6. LITERATURE A study conducted by Weichel et. al., (2010) in an automotive industry observed the relationship between job rotation and aging workforce and impaired employees. The result shows that older employees and impaired workers rotated less. Workers who rotated most showed their job performance was higher than the aging and impaired employees who rotated less.
a study conducted in larger Research and Development industry in Japanese and the finance department in American pharmaceutical business shows that employees who rotated much have improved their knowledge and skills which lead them to be promoted (Kaymaz, 2010).
Weichel et. al., (2010) conducted a study in an automotive industry and observed the relationship between job rotation and aging workforce and impaired employees. The result shows that older employees and impaired workers rotated less. Workers who rotated most showed their job performance was higher than the aging and impaired employees who rotated less. The more an employee participates in job rotation the less his absenteeism. Higher absenteeism lowers job performance and lower health scores are observed among the aging workforce and impaired employees who rotated less.

3
International Journal of Research in Management & Social Science Volume 5, Issue 3 (IV): July - September, 2017
ISSN 2322 - 0899
Adomi, (2006) said that, moving from one position to another for set periods results in mobility, new skills, a new working environment, new social dialogue, new experiences, new professional fields, removes the employee from going through the same motions for long periods of time, and increases morale and motivation. Also Gannon et al., (1972) contends that, job rotation has found wide acceptance as a means of reducing monotony. Going away from psychologically negative effected job/position provide relief and decrease stress. In simple, shaped with certain boundaries jobs giving low or no autonomy, employees are more exposed to stress and monotony arising from the structure or the content of the work, and this is known to be a cause of job dissatisfaction.
Olorunsola, (2000) explains the importance of job rotation as one of the strategy to achieve skill diversity by objective organizational learning. Implementing job rotation, diversifying job skills, minimizing monotony and thus increasing motivation result in employees’ personal achievement, higher output, decreased absence rate and higher level of acceptance.
Allwood and Lee, (2004) says that rotation technique increases an employee’s problem-solving capability from a management angle. Understanding and dealing with a new job, a new department, new staff and new work processes brings many problems.
Jaturanonda et al., (2006) argues that, a firm can observe the performance of each worker within job rotation and then assign the worker to the most appropriate job as determined by that worker’s skillsand characteristics.
3. RESEARCHMETHODOLOGY Research design: This study adopted a case study approach and the University of Dodoma employees who are practicing job rotation were taken as a case. It was decided to employ case study design because it provides a detailed analysis of the study to be conducted. The rationale of choosing UDOM as the case is based on the fact that UDOM is practicing the job rotation to its administrative staff almost every year.
The Population and Sample size: The population for this study included all UDOM staff (female and male, young and adults) that play a major role on job rotation, basically administrative staff. The population of UDOM staff is approximately to 1500 both academic and administrative, a sample of 100 rotated staff was selected for the study. It was decided to use a sample of 100 staff because sampling in qualitative research usually relies on small numbers with the aim of studying in depth and detailed.
The actual sample size obtained by using the formula by Khan and Krishna as follows: n= N/ [1+ N (E) 2] where; n=sample size N=Total population E=Precision This study used the sample size derived from 708 UDOM employees who enjoy the job rotation practices. It did not consider other UDOM employees who do not play any role in job rotation practices, basically academic staff who are almost 792 It followed that, N = 708, E = 0.1 and therefore n = 708/ [1 + 708(0.1)2] = 87.6 = 88 respondents. Basing on the fact that the topic was very interested for respondents, more questionnaires were collected at time with less cost and therefore this study decided to use 100 respondents as a sample size.
3.1. DATA ANALYSIS TECHNIQUES
Data analysis is a process that entails editing, coding, classification and tabulation of collected data (Kothari, 2004). The analysis was done through Statistical Package for Social Science SPSS version 17.0 was used to generate summaries of descriptive statistics (frequency tables, means, standard deviations, charts and graphs) of the variables that were studied and to test the correlation between job rotation and performance improvement.
4. ANALYSIS AND FINDINGS The awareness of the respondents on the factors that influence job rotation at the University of Dodoma were tested by the open ended questions. The mentioned factors were to increase familiarization/social interaction, to increase performance, conflict resolution, to avoid gossiping, to avoid bureaucracy, to minimize absenteeism, to avoid repetition of some works. to get confidence and to learn other working environments. However from the survey results, the only factor which work positively is social interaction in which 58% of the respondents responded that job rotation at UDOM increase social interaction that later may affect positively the performance. Nevertheless the open ended questions which were tested to respondents on the factors for job rotation practice at UDOM that relate s from the literature resulted to the following results.

4
International Journal of Research in Management & Social Science Volume 5, Issue 3 (IV): July - September, 2017
ISSN 2322 - 0899
4.1. TO INCREASE SOCIAL INTERACTION The results show that a big number of respondents agreed that the rotation is done due to the reason of increasing social interaction among staff. The University is huge to the fact that it is difficult for the staff to familiarize each other and helping each other especially in social and economic matters. From the findings it implies that 58(58%) of the respondents strongly agreed that job rotation increased social interaction among themselves, 24(24%) of respondents agreed that job rotation had increases social interaction, 3(3%) of respondents were neutral, 8(8%) disagreed and 7(7%) of respondents strongly disagreed that rotation had increased social interaction among themselves.
Figure 1: Increased Social Interaction of Job Rotation
Source: Fieldwork survey, 2014
4.2. TO MINIMIZE ABSENTEEISM The other reason/factor for job rotation is to minimize absenteeism, from the finding it shows that 73(73%) of respondents strongly disagreed that job rotation minimize absenteeism, 14(14%) disagreed, while 3(3%) of respondents were neutral, 6(6%) agreed and 4(4%) of respondents strongly agreed that job rotation minimize absenteeism (figure 6). This implies that the big number of respondents did not agreed that job rotation practice at UDOM is conducted to minimize absenteeism, maybe it is conducted for other reasons
Figure 2: Minimize Absenteeism
Source: Fieldwork survey, 2014
4.3. TO DECREASE JOB MONOTONY/REPETITIVENESS Job rotation can be a tool to minimize repetitiveness of the same job to an employee. This is due to the fact that going throughout the same job each and every time can minimize morale of work for employees. The finding from figure 7 revealed that 63(63%) of the respondents strongly disagreed, 20(20%) of respondents disagreed while 10(10%) of respondents were neutral, 2(2%)agreed and 5(5%) of respondents strongly agreed that job rotation decreased job monotony.

5
International Journal of Research in Management & Social Science Volume 5, Issue 3 (IV): July - September, 2017
ISSN 2322 - 0899
Figure 3: Job rotation and decrease of job monotony
Source: Fieldwork survey, 2014
4.4. TO MINIMIZE CONFLICT/MISUNDERSTANDING Some of employees said that rotation is being practiced so as to minimize conflict among staff themselves or between staff and their supervisors. When conflict/misunderstanding arise in a particular office, the immediate measure which is being taken by the management to harmonize the situation is through rotation. The results from figure 8 revealed that 73(73%) of respondents strongly disagreed, 17(17%) of respondents disagreed while 2(2%) of respondents were neutral, 5(5%) agreed and 3(3%) of respondents strongly agreed that rotation minimize conflict/misunderstanding among staff or between staff and their supervisors.
Figure 4: Minimize conflict/misunderstanding
Source: Fieldwork survey, 2014
4.5. A TOOL FOR MOTIVATION It is argued that rotation can be a tool for motivating staff. Employees are self motivated when working with different departments/Colleges meeting with different challenges and learning new things that can be more productive to their professionals. This study revealed that 81(81%) of respondents strongly disagreed, 10(10%) of respondents disagreed while 2(2%) of respondents were neutral, 4(2%) of respondents agreed and 3(3%) of respondents strongly agreed that job rotation is a tool for motivation to the staff (figure 9).

6
International Journal of Research in Management & Social Science Volume 5, Issue 3 (IV): July - September, 2017
ISSN 2322 - 0899
Figure 5: Tool for Motivation
Source: Fieldwork survey, 2014
5. CONCLUSION Most respondents claimed that they have been rotated from one office to another without adequate prior information so that they can be able to prepare themselves well especially in handing over the offices. They claimed that once they report to the new offices they meet a lot of pending issues and some data have been misplaced or even got lost. Apart from that, most of the administrative staff was not serious at their work due to lack of concentration, commitment of tenure and accountability for the jobs they do because they continuously expect to be transferred to another job at any time. This is because they have no enough time to prepare for their work, execute and control its results through feedback whether they did it well or not so that they can make corrections. They are not settled at their work stations, instead they were working while waiting for their rotation and as a result they were working haphazardly. They also claimed that they have been rotated without being informed the basis and impacts of rotation. This situation gives them a negative impression, that’s why it resulted into negative impacts on this survey.
Nevertheless, they claimed that rotation had demoralized their morale of working effectively and efficiently because sometimes they were assigned jobs that could irritatingly be for the junior since those jobs were below their working capacities. They are also assigned jobs which are not of their professions and thus, they were not trained or coached and hence failed to perform to the maximum satisfaction of that particular job. They also claimed that some staff was not involved in the rotation which results into the thought that, those who are involved in the rotation feel like they have been punished instead of learning and improving their performance, also this demoralized their working morale. They equally claimed that some staff was doing some sort of lobbing at the management so that they can be placed in the offices which is either economically better off or rather which had no many tasks, as such, they wanted this practice to be conducted fairly.
6. RECOMMENDATIONS Most of works were pending and delaying to be delivered because of lack of adequate working facilities like computers and internet services, some staff used to share a computer which leads to the late accomplishment of tasks. There is no training, seminars or workshops for administrative staff at the University of Dodoma, most of respondents claimed that they need to be trained so that they can improve their performance.
Since UDOM is the center of excellence due to the fact that most of the people in Tanzania and the world in general are watching this growing institution which is considered to be the largest University in Eastern and Central Africa. Therefore, the institution needs to have competent and well trained personnel to ensure the highest and excellent services delivery to its stake-holders. The institution seems to be focused much on training of academic staff since the major activity of the institution is academic, but it fails to understand that the engine of the university is based on the management which includes all administrative staff. It is now high time for the management to look on the importance of the engine and train them so that both administrative and academic staff can be well equipped with enough knowledge and skills for the execution of their duties that can meet its excellence.

7
International Journal of Research in Management & Social Science Volume 5, Issue 3 (IV): July - September, 2017
ISSN 2322 - 0899
REFERENCES Abdel-H., A. A. (1981). ‘Effects of role stress-job design technology interaction on employee work
satisfaction”, The Academy of Management Journal, Vol. 24. No.2, 260-273.
Adomi, E. E. (2006). “Job rotation in Nigerian university libraries”, Library Review, Vol.55, No.1, 66-74.
Allwood, J.M. & Lee, W.L. (2004).The impact of job rotation on problem solving skills. International Journal of Production Research, 42(5), 865-881.
Campion, M. A.; Mumford, T. V.; Morgeson, F. P. and Nahrgang, J. D. (2005). “Work Redesign Eight Obstacles and Opportunities”, Human Resources Management Review, Vol. 44, No. 4, 367-390.
Ghauri, P. and Gronhaug, K. (2005).Research Methods in Business Studies,A practical Guide (Third Edition), Pearson education limited, England.
Gomez, P. J.; Lorent, J. J. C.; Cabrera, R. V. (2004).Training Practices and Organizational Learning Capability Relationships and Implications. // Journal of European Industrial Training, 28pp. 234-256.
Jaturanonda, C.; Nanthavanij, S. &Chongphaisal, P. (2006). A survey study on weights of decision criteria for job rotation in Thailand: Comparision between public and private sectors. The International Journal of Human Resource Management, 17(10), 1834-1851.
Johsson, B. (1988). "Electromyographic Studies of Job Rotation."Scandinavian Journal of Work Environment Health.Supplement 1. 14 108-109.
Kaymaz, K. (2010), “The Effects of Job Rotation Practices on Motivation: A Research on Managers in the Automotive Organizations”, Business and Economics Research, Vol. 1 No. 3, 69-85.
Khan, F. (2010).Study Clarifies Job Rotation Benefits. [online] Available at<http://www.peoplehrforum.com/index.php?view=tpl_topics_detail&topic_id=1057&forum_id=196> [Accessed 30/11/ 2013].
Kothari, C.R. (2004). Research Methodology, Methods and Techniques: WishwaPrackakashan, New Delh
Origo, F.; Pagani, L. (2008). “Workplace Flexibility and Job Satisfaction: Some Evidence From Europe”, International Journal of Manpower, Vol.29, No. 1, 42-48.
Ortega, J. (2001). "Job Rotation as a Learning Mechanism."Management Science, Vol. 47, No. 10, pp. 1361-1370.
Plowman, N. (2010), Advantages of Job Rotation: Reduce Turnover by Influencing Employee Burnout, Satisfaction, and Motivation. [Online] Availablehttp://www.brighthub.com/office/entrepreneurs/articles/55274.aspx> [Accessed 4 December 2013].
Umstot, D. D.; Mitchell, T. R. & Bell, C. H. (1978). Goal setting and job enrichment: An integrated approach to job design. The Academy of Management Review, 3(4), 867-879.Valentine, S. &Gotkin, L,. (2000).
Whittington, J. L.; Goodwin, V. L. & Murray, B. (2004). Transformational leadership, goal difficulty, and job design: Independent and interactive effects on employee outcomes. The Leadership Quarterly, 15, 593-606.

8
International Journal of Research in Management & Social Science Volume 5, Issue 3 (IV): July - September, 2017
ISSN 2322 - 0899
PROCESS RE-ENGINEERING AND CHANGE MANAGEMENT IN E-GOVERNANCE IN ASSAM
Uttam Kr. Pegu Associate Professor, Department of Mass Communication & Journalism, Tezpur University, Sonitpur, Assam
ABSTRACT The focus of this study is on process re-engineering and change management in e-governance in Assam. Due to the increasing social importance of Information and Communication Technologies (ICT), several IT projects have been taken up in the state of Assam. Hence, assessing the far-reaching consequences of the nature and role of technologically-mediated information and communication processes becomes very necessary. E-governance efforts are primarily based on computerizing age-old processes hence, it is essential that we first redesign the government processes. The existing land records system has been re-engineered to bring efficiency to the web-technology-based Dharitree system. The study analyses the underlying assumptions of these kinds of inventories, as well as their limitations. Given the fact that the state of Assam is afflicted with mass illiteracy, regional and economic diversification, it remains to be seen how the tantalizing promise of e-governance will burgeon and influence the average citizen's life. The study concludes that despite innumerable bottlenecks in e-governance applications, it has tremendous potential to facilitate governance as it can deliver timely and accessible government-to-citizen services in a more effective manner.
Keywords: ICT, e-governance, process-reengineering
1. INTRODUCTION The application of Information Technology (IT) to reform governmental structures and public administration is widely viewed as a ‘savior’ that can reinvigorate democracy and improve the quality of citizens’ service. In the rapidly evolving ICT environment, a comprehensive framework for understanding determinants or conditions for technology acceptance is more than ever needed. This is crucial in order to obtain the necessary insights to face the challenges of ICT managers, policymakers as well as researchers (Burgelman, 2000).
The deployment of IT by governments emerged in the nineties with the advent of the World Wide Web. The ICT revolution especially the advent of internet has dramatically changed how citizens interact with their government creating an important development in their expectations (Dodd, 2000). It has brought about changes in governance, characterized by enhanced efficiency, transparency and accountability. The irrelevance of distance and time ushered in by IT has opened up unprecedented opportunities leading to shifts in political and economic power structures.
Governments all over the world are fully cognizant of this and are seeking to harness its potentiality in development, economic and social change. To ensure unlimited economic and social frontiers, global information infrastructure has been put into place. Information and Communication Technologies have not only redefined but has also re-conceptualized administrative systems and improved relationships between and within government, citizens, business and government ministries. Governments are at the stage of drawing up policies for the newly emerging field of e-governance. As French postmodern theorist Jean Baudrillard mentions in his ‘Simulation’, the online world is not only a complement of the offline world but it is also developing in parallel to the offline world in symbiosis (Baudrillard, 1994). The online world in addition has a great impact on the offline world in which we live today. It offers myriad of exciting opportunities to enrich the lives of mankind.
India has taken up necessary steps in generating awareness of the advantages of IT and electronic service delivery (Agnihotri & Ramani, 2001). Furthermore, it has introduced citizens’ charters under which the ministries and departments at both national and state levels are required to adopt charters specifying their respective service provisions, time-frames, service standards and channels for redressing grievances. In order to implement this, the government has introduced a National Task Force on IT and Software Development, a Committee for improving efficiency, Ministry of Information Technology (MIT) and a Centre for Electronic Governance in order to promote e-governance in the country (Wadia, 2000; Budhiraja, 2001; MIT, 2001).The MIT plays a crucial role in facilitating e-governance by reinforcing knowledge-based enterprises, encouraging coordination among users, adopting procedures based on international standards, promoting the internet and introducing it education (Upadhyaya, 2000).
2. E-GOVERNANCE IN ASSAM E-governance in Assam was initiated by the National Informatics Centre (NIC) Assam State Centre. It was set up in 1986 and has indigenously designed and developed, PRAGATI- an umbrella of 13 e-governance applications for implementation in various districts of Assam. However, the final impetus for e-governance was

9
International Journal of Research in Management & Social Science Volume 5, Issue 3 (IV): July - September, 2017
ISSN 2322 - 0899
provided by the Community Information Centre (CIC) project which was conceived in 2000 for the Northeast. This Rs 242-crore Project aimed at providing the benefits ICT to the people of the region. The mandate was to set up a Community Information Centre in each of the 487 blocks of the eight states of the Northeast, including Sikkim. Besides CIC, Project E-Setu and Drishtee, Dharitree and E-District etc. has been instrumental in creating an e-governance environment in Assam.
The State of Assam has already initiated the process of ICT-enabled centers in rural areas with the objective of delivering government and other value added services to the common citizens. A brief description of various existing projects/initiatives has been provided in the following table
Table 1: E-governance Projects in Assam Sr. No. Name of Initiative Description Status/Reach/Other details
Information Technology & Communications Department
1
CIC
Aimed at delivering information and services to citizens.
219 centers have been set up covering all blocks spreading across the State since 2002.
2
Assam Portal
www.assamgov.org
Portal of Assam for providing government information.
Information of various Departments, colleges, announcements is hosted online.
3
e-suvidha
Aimed at providing services to citizens through CIC. The status of application can also be viewed from the internet through the CICs at any point of time.
Implemented in some of the CICs. However, perceived benefits have not been seen due to lack of computer literate people
4
Pragati
13 e-governance applications for implementation in Assam. These frontline web-based applications will synergize with the other existing software applications
Yet to be fully implemented.
5
e-setu
G2C services like land records and certificates of birth, death, permanent resident etc. are being provided to citizen of Jorhat district.
Implemented as a pilot project in Jorhat District with successful track record
6 e-sanwad www.sanwad.nic.in
Web enabled downloading of various G2C applications etc.
Implemented as a pilot project in Sivasagar district.
Department of Revenue (Land Records)
7
Computerized Land Records (CLR)
Scheme
Presently, Jamabandis (Records of Rights) are being issued to land owners.
Currently implemented in 6 Districts. Jamabandi data of three Districts (Kamrup, Tinsukia and Dibrugarh) have been web enabled for public viewing.
8
Dharitree
An award winning web based interface land records Management system. It uses Assamese script and a map based interface to capture, render, display and query land records.
Computerized system implemented in the District of Sonitpur as a pilot project.
9 E-District Implemented in Sonitpur & Goalpara district

10
International Journal of Research in Management & Social Science Volume 5, Issue 3 (IV): July - September, 2017
ISSN 2322 - 0899
District Magistrates
10
Vidhan
Has been developed to automate the process of taking-up magistracy cases by the Magistracy Branch of District Magistrate’s Office and facilitate online query of case-status and generation of various reports
Yet to be fully implemented
11
Shapath
Automates the process of maintaining the affidavits records by the Magistracy Branch of the Deputy Commissioner’s Office.
Implemented at Head Office
12
Nathi-Awasthiti
A G2C application developed to facilitate officials to monitor the movement of files in the DC’s Office and to review the status of each and every file
Yet to be fully implemented
13
Abhiyog
Enables citizens to lodge their grievances from any internet cafe, CIC etc. and also to see the status at any point of time.
Yet to be fully implemented.
Department of Agriculture
14
AGMARKNET
Provides information on prices of agricultural products.
3 State level offices & 13 Agriculture committees of the State connected with nationwide agriculture information network.
15 DACNET Department of Agriculture and Cooperation Network
3 State level offices & 13 Agriculture committees of the State connected with nationwide agriculture information network.
Department of Health & Family Welfare
16
AROGYA
It is a web-enabled Management Information System (MIS) for the Hospital, which incorporates Patient Registration, Accounts and Stores Management.
Implemented in B. Baruah Cancer Hospital.
17 ASWAN
(Assam State Wide Area Network)
ASWAN is an initiative to ensure minimum 2 mbps bandwidth to the block offices of the State of Assam.
Request for Proposal (RFP) has been issued (December’06) for selection of Network operator.
18
SDC
(State Data Centre)
A State Data Centre would be established at the State level housing all government applications.
SDC is planned to be established along with the ASWAN.

11
International Journal of Research in Management & Social Science Volume 5, Issue 3 (IV): July - September, 2017
ISSN 2322 - 0899
19
NIC State Data Centre
NIC owns a data center of 1 tetra bytes capacity having the latest SAN technology with FB-FB connectivity. The SAN is having a capacity of taking 30 tape (100/200GB) media online backup.
Already commissioned, work is on to connect the all district HQ with 2 mbps link. Local users like Regional Passport Office, Directorate of Census etc. in Guwahati are being connected through 128/256 kbps MLLN, 14 other States Government Department are going to put on NICNET.
(Source: http://www.nic.in/state/Assam)
3. PROCESS RE-ENGINEERING AND CHANGE MANAGEMENT E-governance is used as an enabling tool to increase efficiency, enhance transparency, collect more revenue and facilitate public sector reform. It can improve the performance of the public sector, it is a powerful enabling tool that has aided governments achieve some of their development and administrative reform goals (Bhatnagar, 2004). E-governance efforts are primarily based on computerizing age-old manual processes of delivering services to the citizens. There has been substantial efforts to re-engineer and modernize government processes to enhance service delivery to the common man. This redesigning of government processes has drastically reduced the numbers and duration of successive steps required to obtain services. Moreover it has provided accountability, efficiency, productivity as well as transparency of policies and processes.
While such re-engineering of departments provided faster governance, it focuses on streamlining changes within and across various departments. Any e‐governance project will bring in tremendous change, in terms of processes and departmental structures. In such a scenario, these changes will directly impact the entire system of operation. Achieving successful change management during implementation of any e‐governance requires one to use both individual and departmental change management approaches to manage the change associated with other new processes, systems, technologies or job roles.
The Revenue Department, Government of Assam undertook the land records computerization project through Dharitree. The existing land records system has been re-engineered to bring efficiency to the technology-based Dharitree system. This has ensured up-to-date and consistent maintenance of records both at the circle office and the ‘sadar’ office and thereby it has eliminated the problem of inconsistent records that was prevalent in the earlier system. The following table highlights the various types of citizen-centric services offered by it and the comparative scenario of performance before and after implementation of Dharitree.
Table No. 2 Citizen-centric services offered by Dharitree Sr. No.
Service type Time taken in manual system
Time taken in computerized system
1 G2C services like issue of Jamabandi, Land holding certificate, Land valuation certificate, Agricultural income certificate
7 days 1 day
2 Field Mutation 10-20 days 2 days 3 Office mutation 90 days 35 days 4 Field partition 10-20 days 2 days 5 Office partition 90 days 35 days
(Source: Saikia, 2009)
Dharitree has now provided round the clock availability of data, thus making data access easier. A dynamically defined job-specific menu system has made the use of Dharitree friendlier and comfortable. Automatic generation of notices, proceedings, mutation orders and citizen-centric services have reduced the data entry to a great extent. Moreover, the use of the local language has brought about a tremendous change in service delivery to the public.
4. ISSUES AND CHALLENGES IN E-GOVERNANCE The introduction of Information and Communication Technologies and the changing political requirements have redefined the role of governments and public sector organizations. It has contributed to improvements of life conditions in developing countries through enabling market mechanisms which could be seen in the ICT centers in poor communities as sustainable businesses in their own right (Best & Maclay, 2002). The rapid

12
International Journal of Research in Management & Social Science Volume 5, Issue 3 (IV): July - September, 2017
ISSN 2322 - 0899
changes in technology have created an increasingly information-centric society. Across the world e-governance has been used extensively and has established an online presence in the hope that they too will experience increases in efficiency, effectiveness, and organizational performance (Melitski, 2001). The hope that Information and Communication technology could surmount some of these issues is a big challenge for many governments across the globe.
The increasing dependency of technology in everyday spheres has made the study of technology adoption and usage a major challenge in scholarly research. In addition, from a policy point of view profound insights into the barriers for adoption and use of ICT are necessary in order to set up inclusive information society policies (Chaudhuri, Flamm, & Horrigan, 2005).The conditions for technology acceptance has always been an important issue in all kinds research in ICT innovations and new media technologies ranging from diffusion theory focusing on perceived technology characteristics since the early 1960s. It was later extended with insights originating from social psychology models over its use and appropriation-oriented theoretical approaches since the 1980s to more industry-oriented studies focusing on image and network-related determinants in the last decade (Lievrouw, 2006; Venkatesh, 2006).
Some of the issues and challenges are: Accessibility and affordability affect the deployment of technology and therefore, utmost importance should
be given to the socially and economically backward communities. The service delivery mechanisms should be located in the areas convenient to them. The kiosk operators must communicate well with the citizens and cordially deliver the services
There should be involvement of private agencies and public-private-partnership for commercial viability and sustainability of e-governance projects. While there are benefits of private participations in ICT endeavors, it is important to safeguard the social objective behind these applications. Pure commercial benefit should not determine which services should be offered to the citizens
All functionaries of the government departments should be given training on behavioral issues involving citizens and private agencies. It is important that they are trained to accept the changed transparent environment facilitated through such innovations which minimizes paper transactions
Government should play a proactive role especially in the rural areas to make the citizens aware of e-governance system, its facilities and benefits with a comprehensive citizens’ charter. Government should hold frequent workshops, trainings and awareness campaign for the citizens
Government should re-engineer the existing manual processes, and eliminate those that does not add any value to the system or delays the process. Some of the successful e-governance projects implemented in other states could be emulated
5. CONCLUSION The advent of Information Technology has no doubt unleashed a new life in the realm of governance but we are far from the IT revolution that has brought about tremendous change in governance in most parts of the country. Technology mediated governance presents challenges both in terms of its implementation and sustainability as there is a prevalent digital divide which quantifies the gaps in accessibility and use of Internet and other ICT’s across various districts in Assam. The gap exists because IT is hinged on specific skills and hence, the need for a knowledge-intensive society. The realization and implementation of e-governance presents a myriad of cultural, political, social, economic and technological challenges. We have not still, reached the desired levels of ICT adoption owing largely to unresolved issues surrounding its applicability in most parts of the state. We are still far from achieving the desired levels of ICT adoption in everyday life, owing largely to unresolved issues surrounding its applicability in most parts of the state. Nonetheless, ICT has tremendous potential to facilitate governance in administration as it can deliver timely and accessible government-to-citizen services in a more effective manner.
REFERENCE Agnihotri, V.K. & Ramani, K.V. (2001) Change Management and Process Re-engineering. Presentation at
the Roundtable on IT in Governance, 12 January, New Delhi.[http://www.ima-india.com/papers/itindex.htm] Burgelman, J.C. (2000). Innovation of communication technologies: Some general lessons for the future
from the pas. In: Cammaerts, B. & Burgelman, J.C. (ed.) Beyond competition: Broadening the scope of telecommunications policy (229-238). Brussels: VUB Press.
Baudrillard, J. (1994). Simulacra and simulation (S. F. Glaser, Trans.). Ann Arbor: University of Michigan Press.

13
International Journal of Research in Management & Social Science Volume 5, Issue 3 (IV): July - September, 2017
ISSN 2322 - 0899
Best, M. L. & C. M. Maclay (2002) "Community Internet Access in Rural Areas: Solving the Economic Sustainability Puzzle" in The Global Information Technology Report: Readiness for the Networked World, (Kirkman, G. S., P. K. Cornelius, J. D. Sachs and K. Schwab eds) Oxford University Press, Oxford, pp.76-89.
Budhiraja, Renu (2001). Electronic Governance-A Key Issue in the 21st Century, Ministry of Information Technology, India. [http://egov.mit.gov.in]
Bhatnagar, S. (1990). Computers in Developing Countries In Bhatnagar, S and N. Bjorn Anderson. Eds. Information Technology in Developing Countries, Amsterdam: North-Holland.
Bagga, R K, Kenniston & Mathur, Rohit Raj (eds.). (2005). The State, IT and Development, Sage Publications.
Bhatnagar, S. (2004). E-Government: From Vision to Implementation A Practical Guide with Case Studies, New Delhi, Sage Publications.
Chaudhuri, A., Flamm, K.S. & Horrigan, J. (2005). An analysis of the determinants of internet access. Telecommunications Policy, 29(9-10), 731-755.
Dodd, J., (2000). Delivering on the E-government promise. A Government Technology Industry, Retrieved February 24, 2007 from http://bilisimsurai.org.tc/egitim/kutuphane/NIC.qx.pdf
Government of Andhra Pradesh, IT Policy. (2000.) Hyderabad: G O Ms No 114 dated 25-05-1999: Orders on Incentives for Promotion of IT Industry and IT-Enabled Services in the State, Hyderabad.
Heeks, Richard. (2006), Implementing and Managing E-government, An International Text, Vistaar Publications, New Delhi
Jhunjhunwala, Ashok. (2002).Challenges in Rural Connectivity for India, ASCI Journal of Management, 31(1 and 2), 40-47.
Kenniston, Kenneth & Kumar, Deepak. (2004). IT Experience in India: Bridging the Digital Divide, New Delhi, Sage Publications.
Lievrouw, L.A. (2006). New media design and development: Diffusion of innovations versus social shaping of technology. In L.A. Lievrouw & S. Livingstone (Eds.) The handbook of new media (updated student version) (pp. 246-265). London & New York: Sage Publications
Mathur, Raj Rohit, Baggapa, R K & Kenniston, Kenneth (2005). The State, IT and Development, Sage Publication
Melitski, J. (2001). The World of E-government and E-governance, 2001. http://www.aspanet.org/solutions/TheWorld of E-government and Egovernance.htm.
MIT (2001). About Electronic-governance’, Ministry of Information Technology, India, Retrieved from http://egov.mit.gov.in
Nicole Chris, ICT Policy-A beginners Handbook. Published by Association for Progressive Communications
Norris, Pippa. (2001). Digital Divide: Civic Engagement, Information Poverty and the Internet Worldwide, Cambridge University Press.
Prabhu, C. S. R. (2009).E-governance: Concepts and Case Studies, Vikas Publication House Pvt. Ltd
Panneervel, P. (2005). E-Governance: A Change Management Tool, Jaipur, Prem Rawat Publications.
Preston, Pascal, Reshaping Communications Technology, Information and Social Change. New Delhi, SAGE Publications London, Thousand Oaks.
Pegu, Uttam (2013). Information and Communication Technology in Inclusive Development: Assessment on Citizens’ Perception and Usage Pattern of E-Governance in Assam in the Journal of Northeast Indian Cultures, International Journal of Assam Don Bosco University, P: 100-112.Print.
Pegu, Uttam (2017), E-Governance: Concept, Initiatives and Challenges, Lambert Publishing House, Germany.

14
International Journal of Research in Management & Social Science Volume 5, Issue 3 (IV): July - September, 2017
ISSN 2322 - 0899
Saikia, Hemanta Kr. (2009), Dharitree: The Web-Technology-Based Total Land Records Management System of the Government of Assam.
Sathyanarayana, J. (2004). E-Government: The science of the possible, Prentice-Hall of India, New Delhi
Sinha, R P. (2006). E-Governance in India: Initiatives and Issues, in collaboration with Center for Public Policy and Governance, Institute of Applied Manpower Research, New Delhi, Concept Publishing House.
Sreekumar, T T. (2002). Civil Society and ICT-Based Models of Rural Change: History, Rhetoric and Practice, Paper presented at the International Seminar on "ICTS for Indian Development: Processes, Prognosis and Policies" jointly organized by Institute of Social Studies, The Netherlands and Institute of Human Development, New Delhi, Bangalore 9-11 December
Sood, A. D. (2001). A Social Investor’s Guide to ICTs for Development, Bangalore: Centre for Knowledge societies and Charities Aid Foundation India.
Saith, Ashwani, Vijayabaskar, M & Gayatri, V. (Eds.)(2008). ICT’s and Indian Social Change: Diffusion, Poverty, Governance. New Delhi, Sage Publications.
Upadhyaya, R. (2000). E-governance and Computer Applications, Position Paper. Ottawa: International Development Research Center.
United Nations. (2008). United Nations e-government survey 2008: From e-government to connected governance. NY: United Nations.
Venkatesh, V., & Davis, F. D. (1996). A model of the antecedents of perceived ease of use: Development and test. Decision Sciences, 27, 451–481.
Venkatesh, V. (2000). Determinants of perceived ease of use: integrating control, intrinsic motivation, and emotion into the technology acceptance model. Information Systems Research, 11, 342-365.
Wadia, Jamshed. (2000). Welcome to Digital Democracy, Times Computing, Retrieved November 26 2008 from http://www.timescomputing.com/20001122/nws1.html

15
International Journal of Research in Management & Social Science Volume 5, Issue 3 (IV): July - September, 2017
ISSN 2322 - 0899
A STUDY ON “BRAND IMAGE OF HONDA TWO-WHEELERS WITH REFERENCE TO HYDERABAD CITY
Dr. Osman Bin Salam
Professor, Anwar ul Uloom College of Business Management, Hyderabad
ABSTRACT The thought "BRAND IMAGE" has drawn fundamental thought from scholastics and masters since it was progressed, in light of the way that it expected a focal part in pushing works out. Despite the way that brand picture was seen as the fundamental part of brand asset and brand execution, couple of examinations have illustrated on the connection between stamp picture and brand respect. In setting of the brand picture theories, this examination investigated surviving examinations about the impact of brand picture on customer from perspective of customer respect. It in addition presented the inadequacies of stream look into and pointed out the cases for future examination.
Keywords: Brand image, Brand assets, Customer respect
INTRODUCTION Brand image is a shocking strategy of relationship inside the brains of targets clients, which address what the brand as of now remains for, and proposes the present affirmation to clients; (Note that brand image is what is at show up in the psyches of clients, however check character is motivational). It is the aggregate of all unmistakable and not very much described qualities the contemplations, sentiments, values slants, interests, segments and family that make it create.
A brand image obviously and general watches out for all inward and outside properties the name, image, bundling, molding, signs, vehicle, and culture. It is everything paying little regard to what that impacts how its objective electorates or even a particular client sees stamp or an affiliation. Brand image is the best single connecting with attempt a cooperation can make. Making or reestablishing a positive brand image is a present some bit of ever business and sets up a structure on which affiliations can build up their future.When you make your thing or connection unmistakable, shape your new image through a mix of words symbolism and particular contraptions that eagerness to human begin and feeling.
Pick or make an immense name for your photo. Make a clearly levelheaded logo. Edge a trademark or saying for the brand that quickly and gets and passes on the substance of your ascent offering proposal. A brand must offer what it unmistakably remains for utilizing a couple of words and in addition images so it is particular and sensibly clear to your market.
NEED AND IMPORTANCE OF THE STUDY Checking has wound up being key obsession zone for affiliations. Each brand has a photograph related with it in the brains of its fluctuating decorations. These circuit the clients, exchange accessories, cash related managers, experts, media and extended gathering where it works, affiliations are understanding the significance of saying positive target reality at each touch point with each correct hand. No, huge stunningness the giganticness related with corporate correspondence is making.
A rose by some other name would smell as sweet, however will a shoe without Addidas logo show up an in vogue, or an auto without the BMW logo pass on a tantamount premium? The fitting response is, it "won't ". The consider that makes an Addidas shoe or BMW auto more spellbinding than a common thing is what is called as checking. Stamping as a pushing framework has seen a huge improvement in eagerness for late years in setting of a game-plan.
The year 1980 construed a fundamental event in the begin of brands. Association came to understand that control resource of an association was if all else fails its photo name. For a dumbfounding time cross the estimation of the association was quantifiable to the degree its building and arrive and in this way its unmistakable resources. It is beginning late that we have understood that its legitimate goading power outside in the brains of potential clients.
Today, every association together needs a brand. Past the trademark check, universe of makers and merchants of insightful moving clients things whose brands are doing combating authentic. Enlisting has changed with a fundamental issue in all parts bleeding edge, low tech , utilities ,sections , affiliations business to business, pharmaceutical research workplaces, non good 'ol fashioned affiliations and non advantage union all watch an utilization for stamping.

16
International Journal of Research in Management & Social Science Volume 5, Issue 3 (IV): July - September, 2017
ISSN 2322 - 0899
Since, the business regions are twisting up unmistakably quickly it has pushed toward influencing the opportunity to be business in the present world, to see with wide range. Thusly, the broad social affair take a gander at the earth of the bicycles and they have pile of decisions concerning the bicycles in especially about the properties. Legend hide away connected hands with HONDA engines relationship of Japan in 1984 and brought unmistakable models of bicycles into the market, so the need of the breeze is to take a gander at image of HONDA Engines especially twin urban degrees of Hyderabad and Secunderabad and to know the pieces which affect the system or clients to purchase the bicycles from the supervised player in the market.
As a promoting star it is principal for me to perceive any inspiration driving why and how people settle on their utilization choices with the target that we can settle on better essential lifting choices to refresh the brand image. I advancing expert understand buyer and condition signs to shape pushing structures.
OBJECTIVES OF THE STUDY To know about the Brand image of Honda. To know about the valuable attributes of two wheelers. To identify the customer choice of Brand. SCOPE OF THE STUDY The extend take a gander at "Brand image of HONDA Engines" gives a data into the specific parameters of inferring that makes individuals to buy, there by giving an unmistakable image to the creators and merchants of HONDA Engines, the most ideal approach to manage direct draw in and hold the clients for the survival and advance.
• The consider will without a doubt "Brand image of HONDA Engines" clients with exceptional reference to the twin urban zones of Hyderabad and Secunderabad, Telangana.
RESEARCH METHODOLOGY RESEARCH DESIGN A research design provides the framework to be used as a guide in collecting and analyzing the data. But it is not necessary that a particular research design is always the best. Experiences with different research design will generally provide the research with the capability to match a research problem with an appropriate design.
DESIGN OF THE STUDY EXPLORATORY AS WELL AS CAUSAL IN NATURE. Since HONDA Engines have shown the unmistakable models of two wheelers into the market, the breeze consider manages the effect of brand in the twin urban regions of Hyderabad and Secunderabad and to know the components influencing the clients to continue running for directed player or brand.
EXPLORATORY RESEARCH This is all around used to clear up contemplations and estimations about the examination issue of respondent's masses or to give learning on the best way to deal with oversee complete more conclusive research. The delayed consequence of this exploratory examination could give commitments for second utilizing factor examination framework. It might be utilized to fling bits of information concerning new thing or bolster changes to existing thing through once freewheeling talked.
CAUSAL RESEARCH In research, we can never be completely sure that a particular variable say ‘x’ influences another say ‘y’. But a causal design seeks to establish causation as far as possible, by employing controls and conditions under which we can state with confidence whether or not ‘y’ is affected by ‘x’. In addition to ‘x’ and ‘y’ of course, there may be other variable, which could affect relationship between ‘x’ and ‘y’. How to treat the other variable during analysis of the effect of ‘x’ and ‘y’ also forms part of the causal designs.
DATA COLLECTION METHOD PRIMARY DATA The primary source of data collection is by means of structured questionnaire and observation of the
prospectus or customers. The questionnaire is being administered to customers of HONDA MOTORS in twin cities of Hyderabad and
Secunderabad. SECONDARY DATA Secondary source of data collection supports and provides some useful insights to the primary data and these data is being collected from the various books and also from internet.

17
International Journal of Research in Management & Social Science Volume 5, Issue 3 (IV): July - September, 2017
ISSN 2322 - 0899
SAMPLE SIZE It is defined as number of respondents selected for research study and the sample size is 100 respondents using random sampling technique.
TOOLS OF ANALYSIS: Percentile method, average, ANNOVA, t-Test
LIMITATIONS The size of the sample is small.
The study is confined to the twin cities of Hyderabad and Secunderabad.
The period of study is limited.
The study is restricted only to a sample size of 100 customers in order to know the image of HONDA MOTORS and satisfaction of customers.
The customers may not follow what they have stated in their responses. The degree of reliability cannot be taken to be always accurate.
DATA ANALYSIS HYPOTHESIS H0: There is no level of significance difference between Income and Exchange value of the product.
H1: There is a level of significance difference between Income and Exchange value of the product
Income Yes want to exchanged
Not want to exchange
Total
<10,000 14 24 38 10,000-20,000 14 20 34 20,000-30,000 2 10 12 >30,000 2 14 16 Total 32 68 100
t-Test: Two-Sample Assuming Unequal Variances
yes-exchanged not exchange Mean 8 17 Variance 48 38.66666667 Observations 4 4 Hypothesized Mean Difference 0 df 6 t Stat -1.93351016 P(T<=t) one-tail 0.050674876 t Critical one-tail 1.943180274 P(T<=t) two-tail 0.101349753 t Critical two-tail 2.446911846
INTERPRETATION As the p value is more than alpha that is 0.05 so null hypothesis is rejected and alternative hypothesis is accepted, it shows that income will have a good impact on selling the product and customers does not want their product sold as it may effect their income levels.
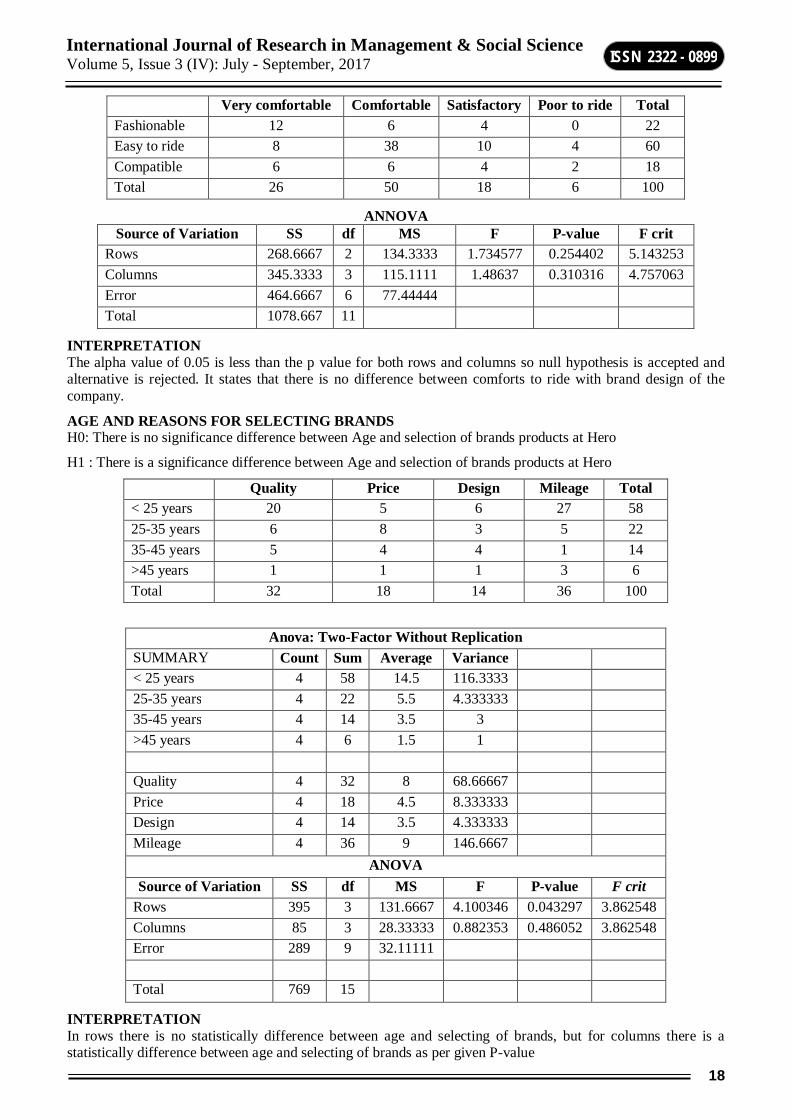
BRAND MODEL DESIGN OF THE BRAND PREFERRED AND RIDING EXPERIENCE OF HONDA ANNOVA WAS APPLIED. H0:There is no significance difference between brand model design of the brand preferred and riding experience of Honda.
H1: There is a significance difference between brand model design of the brand preferred and riding experience of Honda
18
International Journal of Research in Management & Social Science Volume 5, Issue 3 (IV): July - September, 2017
ISSN 2322 - 0899
Very comfortable Comfortable Satisfactory Poor to ride Total Fashionable 12 6 4 0 22 Easy to ride 8 38 10 4 60 Compatible 6 6 4 2 18 Total 26 50 18 6 100
ANNOVA Source of Variation SS df MS F P-value F crit
Rows 268.6667 2 134.3333 1.734577 0.254402 5.143253 Columns 345.3333 3 115.1111 1.48637 0.310316 4.757063 Error 464.6667 6 77.44444 Total 1078.667 11
INTERPRETATION The alpha value of 0.05 is less than the p value for both rows and columns so null hypothesis is accepted and alternative is rejected. It states that there is no difference between comforts to ride with brand design of the company.
AGE AND REASONS FOR SELECTING BRANDS H0: There is no significance difference between Age and selection of brands products at Hero
H1 : There is a significance difference between Age and selection of brands products at Hero
Quality Price Design Mileage Total < 25 years 20 5 6 27 58 25-35 years 6 8 3 5 22 35-45 years 5 4 4 1 14 >45 years 1 1 1 3 6 Total 32 18 14 36 100
Anova: Two-Factor Without Replication SUMMARY Count Sum Average Variance < 25 years 4 58 14.5 116.3333 25-35 years 4 22 5.5 4.333333 35-45 years 4 14 3.5 3 >45 years 4 6 1.5 1 Quality 4 32 8 68.66667 Price 4 18 4.5 8.333333 Design 4 14 3.5 4.333333 Mileage 4 36 9 146.6667
ANOVA Source of Variation SS df MS F P-value F crit
Rows 395 3 131.6667 4.100346 0.043297 3.862548 Columns 85 3 28.33333 0.882353 0.486052 3.862548 Error 289 9 32.11111 Total 769 15
INTERPRETATION In rows there is no statistically difference between age and selecting of brands, but for columns there is a statistically difference between age and selecting of brands as per given P-value

19
International Journal of Research in Management & Social Science Volume 5, Issue 3 (IV): July - September, 2017
ISSN 2322 - 0899
SINCE HOW LONG ARE THE CUSTOMERS DRIVING THE TWO WHEELERS OF HONDA MOTORS AND WHAT IS THEIR IMPACT ON COMPLAINT LAUNCH H0: There is no significance difference between how long are the customers driving the two wheelers of Honda motors and what is their impact on complaint launch
H1: There is no significance difference between how long are the customers driving the two wheelers of Honda motors and what is their impact on complaint launch
Very good Good Average Poor Total <2 years 5 11 7 5 28 2-5 years 6 16 9 9 40 5-10 years 7 10 5 0 22 >10 years 4 3 3 0 10 Total 22 40 24 14 100
Anova: Two-Factor Without Replication SUMMARY Count Sum Average Variance
<2 years 4 28 7 8 2-5 years 4 40 10 18 5-10 years 4 22 5.5 17.66667 >10 years 4 10 2.5 3 Vgood 4 22 5.5 1.666667 Good 4 40 10 28.66667 Avg 4 24 6 6.666667 Poor 4 14 3.5 19
ANOVA Source of Variation SS Df MS F P-value F crit Rows 117 3 39 6.882353 0.01049 3.862548 Columns 89 3 29.66667 5.235294 0.02302 3.862548 Error 51 9 5.666667 Total 257 15
INTERPRETATION The alpha value of 0.05 is more than P value so null hypothesis is rejected and Alternative is accepted, that is There is a significance difference between number of years the customers using the vehicle and complaint launch as we can see that the time pass on the problem in vehicle can be seen and the customers need to launch the complaints for it.
FACTORS YOU CONSIDER TO ASSIGN POSITIVE BRAND IMAGE TO HONDA MOTORS
Particulars No. of Respondents Percentage Mileage 52 52 Out look 28 28 Services and their availability 20 20 Total 100 100

20
International Journal of Research in Management & Social Science Volume 5, Issue 3 (IV): July - September, 2017
ISSN 2322 - 0899
Table: Age of The Respondents
Table: Occupation of the Respondents
Particulars Responses Student 42 Self employed 14 Govt employee 16 Pvt employed 28 Total 100
Table: Income For Respondents
Particulars Responses <10,000 38 10,000-20,000 34 20,000-30,000 12 >30,000 16 Total 100
Table: Customer Response for Knowledge about Brand Particulars Responses
Advertisement 44 Friends 36 Dealers 12 Others 8 Total 100
Table: Customer Response for Duration of Using Vehicle Particulars Responses
<2 years 28 2-5 years 40 5-10 years 22 >10 years 10 Total 100
Table: Customer Response for Reasons For Selecting Brand Model Particulars Responses
Quality 32 Price 18 Design 14 Mileage 36 Total 100

21
International Journal of Research in Management & Social Science Volume 5, Issue 3 (IV): July - September, 2017
ISSN 2322 - 0899
Table: Customer Response for brand model design of the brand preferred Particulars Responses
Fashionable 22 Comfortable 60 Not Satisfied 18 Total 100
Table: Customer Response for Riding Experiences Particulars Responses
Very comfortable 26 Comfortable 50 Satisfactory 18 Poor to ride 6 Total 100
Table: Customer Response for Resale Value Particulars Responses
Satisfactory 63 In par with the market value 37 Poor 0 Total 100
Table: Customer Response for Replace or exchange Particulars Percentage
Yes 32 No 68 Total 100
Table: Customer Response Complaint launch Particulars No. of Respondents
Very Good 22 Good 40 Average 24 Poor 14 Total 100
CONCLUSION AND SUGGESTION HONDA is the second most unmistakable bicycle Relationship in India. The examination reveals that the alliance has finished this position by virtue of its skilled market operation and, the affiliation and quality got by it. Reviewing a conclusive objective to overhaul its movement and to broaden its bit of the pie in future the connection should concentrate more on see, headway up degree, and furthermore improve the profit of its workforce.. From the examination it was found that an association can upgrade its photograph just if it has momentous bit of the general business, progress, and viable work constrain. So it is one of the districts where the firm should be more organized with a specific genuine goal to update what's more keep up its Photograph.
SUGGESTIONS Advertising is the most essential factor which enhances the brand picture. Therefore it is endorsed to
enhance the adequacy of limited time exercises to redesign impact on deals
Most of the general open are procuring bicycles on account of the viewpoint and mileage, so HONDA Engines should focus much on these perspectives.
As half of the clients are underneath 25years, mileage and out look ought to be made strides.
6% of the majority are confronting issue in finding the association focuses of HONDA Engines, so HONDA Engines should pack in setting up asserted association focuses.

22
International Journal of Research in Management & Social Science Volume 5, Issue 3 (IV): July - September, 2017
ISSN 2322 - 0899
Only not a ton of the clients are picking brand show up as a result of the cost. The cost of the bicycle ought to be lessened with the target that more number of the clients and new clients can stay to the bicycles.
Half of the clients are accomplishing more than Rs 300 as month to month use on HONDA Engines bicycles despite fuel charges which ought to be reduced.
6% of the majority post associations rendered by HONDA Engines as poor which ought to be compelled.
REFRENCES [1] Park, C.W., Jaworski, B.J. and Maclnnis, D.J. (1986) Strategic Brand Concept-Image Management.
Journal of Marketing, 50, 135-145. http://dx.doi.org/10.2307/1251291
[2] Dobni, D. and Zinkhan, G.M. (1990) In Search of Brand Image: A Foundation Analysis. Advances in Consumer Research, 17, 110-119.
[3] Herzog, H. (1963) Behavioral Science Concepts for Analyzing the Consumer. In: Bliss, P., Ed., Marketing and the Behavioral Sciences, Allyn and Bacon, Inc., Boston, 76-86.
[4] Newman, S.L. (1985) Facies Interpretations and Lateral Relationships of the Blackhawk Formation and Mancos Shale, East-Central Utah. Rocky Mountain Section SEPM, 10, 60-69.
[5] Dichter, E. (1985) What’s in an Image. Journal of Consumer Marketing, 2, 75-81. http://dx.doi.org/10.1108/eb038824
[6] Noth, W. (1988) The Language of Commodities Groundwork for a Semiotics of Consumer Goods. International Journal of Research in Marketing, 4, 173-186. http://dx.doi.org/10.1016/S0167-8116(88)80003-X
[7] Sommers, M.S. (1964) Product Symbolism and the Perception of Social Strata. Proceedings of the American Marketing Association, Chicago.

23
International Journal of Research in Management & Social Science Volume 5, Issue 3 (IV): July - September, 2017
ISSN 2322 - 0899
A PRAGMATIC ANALYSIS ON THE ASSORTED DIMENSIONS OF CUSTOMER RETENTION
C. S. Jayanthi Prasad1 and Dr. Suresh Reddy Jakka2 Research Scholar1, Shri Jagdishprasad Jhabrmal Tibrewala University, Rajasthan
Assistant Professor2, Mahatma Gandhi University, Nalgonda, T.S
ABSTRACT Customer retention hints the point of confinement of a company or thing to hold its customers over some predefined period. High customer retention induces customers of the thing or business tend to come back to, keep obtaining or in some other way not betray to something else or business, or to non-utilize totally. Offering relationship in light of current circumstances endeavor to decline customer uprisings. Customer retention begins with the fundamental contact an alliance has with a customer and proceeds with all through the whole lifetime of a relationship and beneficial retention endeavors consider this whole lifecycle. A company's capacity to draw in and hold new customers is related with its thing or associations, and furthermore to the way it formal its present customers, the respect the customers really convey moreover of using the courses of action, and the notoriety it makes inside and over the business center. Convincing customer retention consolidates more than giving the customer what they think. Conveying persistent supporters of the brand may mean beating customer wishes.
Keywords: Customer Retention, Dimensions of Customer Retention, Customer Retention Strategies
INTRODUCTION Some time beginning late, remarkable analysts outlined loyalty in behavioral terms. In the event that a man made most buys in a given thing class from one provider, paying little respect to the reason, the individual was depicted as steadfast. As Kumar and Shah from the University of Connecticut's School of Business (2004) raise, "a more conspicuous bit of existing loyalty programs take after these measures to remunerate behavioral loyalty. That is, the more you continue with the company, the more rewards you get".
Figure 1: Customer Types in Apostle Model
A moment bit of loyalty is attitudinal loyalty. Like behavioral loyalty, attitudinal definitions have existed for quite a while. This second some piece of loyalty spotlights on how solid the mental duty or union is to the brand. With no other individual, it too has impediments. For instance, how steadfast are individuals who rave around a thing and derrick it to their assistants, yet then for reasons unknown remissness to get it routinely themselves?
In the aggregate of different reviewers, as a base, a classy centrality of customer loyalty joins the chronicled setting of activities paying little respect to examinations and focuses toward the brand or business relationship. Loyalty progression and talk (i.e., improvement to others) are both beneficial to affiliations, yet in various ways.
Figure 2: Customer Types in Apostle Model

24
International Journal of Research in Management & Social Science Volume 5, Issue 3 (IV): July - September, 2017
ISSN 2322 - 0899
Antecedents and drivers Customer retention is an outcome that is the result of several different antecedents as described below. 1. Customer satisfaction 2. Customer delight 3. Customer switching costs 4. Customer relationship management To propose and defend the research work, a number of research papers are analyzed. Following are the excerpts from the different research work performed by number of academicians and researchers. Chuah, S. H. W. et. al. (2017) examined the attitudes and beliefs of the Gen Y members towards mobile Internet service providers (MISPs). Proposed a research model to elucidate the relationship between perceived value, satisfaction, switching costs (SC), alternative attractiveness (AA) and loyalty. The work tested it using empirical data collected from 417 Gen Y mobile Internet subscribers. Kitrungpaiboon, K. et. al. (2017) investigate the factors affecting brand loyalty Four independent variables were selected in this research word-of-mouth perceived value convenience satisfaction on product. Morgan, S. et. al. (2017) conducted th online survey with assorted perspectives including loyalty, customer satisfaction, brand image, perceived quality and perceived value, was conducted among customers Adebiyi, S. O et. al. (2017). explore the combination of two operations research models (analytic hierarchy process and Markov chain) for solving subscribers’ churn and retention problem Baral, S. K et. al. (2017) analyse the perception of customers on different aspects of customer relationship management practices in SBI based on primary data collected from 199 customers across six selected branches Rahman, M. R. 2017 presented the Roadmap to Understand a Customer. Rubio, N et. al. (2017). identifies three determining aspects of retail loyalty and trust: satisfaction with price levels, the perceived image of the assortment and loyalty to the store brands (SB). Secondly, this study proposes a theoretical relational model among the aforementioned aspects. Finally, this study analyzes the moderating role that the strategy of choosing SB name (umbrella brand label vs. brands different from the label brand) plays in the relationship between loyalty to SB and loyalty to and trust in the retailer. Confraria, J et. al. (2017). Identify consumer preferences for the following characteristics of mobile plans: the importance of using the same provider as friends and family (calling club network effects), the market share of the provider (pure network effects), the length of the commitment period, monthly fee/recharge obligations and per minute call charges for calls made within and outside the provider network. A discrete choice experiment was used as a preference elicitation method and implemented in face-to-face interviews. Patil, A. A. et. al. (2017). Proposed a Complaint Management System that could add more value to E-CRM in businesses. The work showed that there is a need to re-direct attention in the area of complaint management Hajiyan, H et. al. (2017). prepares a questionnaire in Likert scale and distributes it among some regular customers of this bank. Ansari, A et. al. (2016) investigate the customer–service provider relationship in the insurance industry using artificial neural networks and linear regression. K. K. F et. al. (2016) investigates the linkages of customer engagement with traditional antecedents of brand loyalty. Hassouna, M et. al. (2016) empirically comparing two techniques: Customer churn-decision tree and logistic regression models. The paper proves the superiority of decision tree technique and stresses the needs for more advanced methods to churn modelling. Alshurideh, M. T. (2016). Analysis of relationship strength, longevity, continuity, relational cost and benefits Jalali, M. S et. al. (2016). proposes and tests an integrated application of cognitive mapping and multiple criteria decision analysis (MCDA) combining metacognitive and psychometric decision-making approaches create a framework for the assessment of bank customer loyalty and identifies determinants and allows the trade-offs among them to be calculated.

25
International Journal of Research in Management & Social Science Volume 5, Issue 3 (IV): July - September, 2017
ISSN 2322 - 0899
Nuseir, M. T. (2016). explore the depth of internet and figure out the possible outcomes and benefits of using internet and digital media as a marketing tool. The work Opted a primary quantitative method and conducted a survey of 200 consumers and results affirmed that internet is useful marketing tool Jin, N., et. al. (2016). perceived risk having negative impact on trust, customer satisfaction, and customer loyalty. Martin, C. L et. al. (2016). The retrospective analysis contributes to the field’s understanding of the historical development of services marketing and provides fodder for future research. Gu, R., et. al. (2016). adopts a user-centric relational perspective to propose and empirically examine a theoretical model comprising user-to-user social influence, operator-to-user relational bonds, and satisfaction as antecedents of SNS user loyalty. Ghazali, E et. al. (2016). examines the influence of switching barriers on customer retention (i.e., e-store loyalty) and further investigates the moderating effects of switching costs and alternative attractiveness. Pereira, H. G et. al. (2016) investigate the impact of four online purchase determinants (website image, routine, website knowledge and innovativeness) on customer loyalty and the mediating effect of customer satisfaction within the context of e-commerce. Cao, L. et. al. (2015) propose a conceptual framework to explain whether and under what firm-level conditions cross-channel integration impacts firm sales growth. Kumar, A. et. al.. (2015). specifically focuses on exploring the difference of electronic service quality dimensions across age and gender groups (n = 412) and also analysed its effectiveness. ANOVA and multivariate regression techniques are used for compliance on the objective of study. Melis, K. et. al.. (2015) identify the underlying drivers of online store choice and explore if and how these drivers change when multi-channel shoppers gain online grocery shopping experience. Al-Jader, R. (2015) suggests two new constructs, accumulative trust and digital commitment as customer determinants appropriate for the online context. Das, G. (2014). The present study was an effort to explore the direct and indirect impacts (mediated through retailer loyalty) of retailer awareness, retailer association and retailer perceived quality on purchase intention. Chinomona, R. et. al.. (2014). results indicate that the relationship between customer satisfaction and their trust, customer satisfaction and their loyalty, customer trust and their loyalty, customer loyalty and their repurchase intention and customer trust and their repurchase intention are positive in a significant way. Du, Y., & Tang, Y. (2014) discuss the deep literature review and implications for research and practice on the evolving retailing landscape, emphasizing on the transformation of multichannel to omnichannel retailing. Tahal, R. (2014) concentrates on e-shop loyalty programs with regard to the young generation of customers. A Ahmad Al-Hawari et. al. (2014) demonstrates how the customer sociability level might affect the relationship between customers and online banking services. Srivastava, R. (2014). analyze the mediating role of customer satisfaction on customer loyalty. Kharouf, H., et. al. (2014). The research highlights the importance for retailers to signal their trustworthiness to build customer trust and loyalty. Measure the trustworthiness perceptions when examining customer relationships and managers should plan strategically to develop both trust and trustworthiness with their customers. Salehnia, M. et. al. (2014). This work extract the factors on positive word of mouth and loyalty based on trust enhancement and its relationship with customer loyalty
Using SERVQUAL Model

26
International Journal of Research in Management & Social Science Volume 5, Issue 3 (IV): July - September, 2017
ISSN 2322 - 0899
STRUCTURE OF THE QUESTIONNAIRE Questions Related to the Basic Information
Feedback and Queries on Loan
SERVQUAL Based Queries o Tangibility o Reliability o Empathy o Assurance o Responsiveness
Professional Aspects Based Questions
Behavioral Aspects Based Questions
Customer Satisfaction is to degree at which the product or services rich the standard of the buyer in his or her expectations. It deals with what people called as surprise quotient. This is to extend at which firms give out unexpected technical characteristics or personal service to a customer.
TESTING THE RESEARCH HYPOTHESIS USING PRIMARY DATA ANALYSIS
IMPACT OF 360 DEGREE FEEDBACKS H0 (Null Hypothesis): The feedback, observation and overall response of the customers are not positive towards the customer retention
H0 (Alternate Hypothesis): The feedback, observation and overall response of the customers are positive towards the customer retention To analyze the results of the null as well as alternate hypothesis, the following statistical analysis using SPSS software has been performed.
ONEWAY Feedback360Degree BY Company Type /STATISTICS DESCRIPTIVES EFFECTS HOMOGENEITY BROWNFORSYTHE WELCH
/MISSING ANALYSIS. Test of Homogeneity of Variances Feedback360Degree Levene Statistic Sig.
216.000 .000
ANOVA Feedback360Degree F Sig. Between Groups 6.000 .025 Within Groups Total
EFFECTUAL CUSTOMER RETENTION PLANS Key customer retention strategies include: CRM Systems Blogs Social Media Magic Moments Loyalty Programs Overcome Buyers Remorse Welcome Book Personal Touches

27
International Journal of Research in Management & Social Science Volume 5, Issue 3 (IV): July - September, 2017
ISSN 2322 - 0899
Premiums and Gifts Positive Social Proofs Positive Multidimensional Product’s Momentum Questionnaires and Surveys Regular Reviews Feedbacks and Reviews
Attracting the customer with retention plans 1. Provide guest checkout 2. Offer loyalty programs 3. Try cross sales 4. Send emails 5. Use content marketing and social media 6. Track customer’s behavior 7. Provide outstanding customer support 8. Consider a subscription business model 9. Show you care Benefits of Reselling to Current Customers 1. Utilize Customer Accounts 2. Implement a Customer Loyalty Program 3. Send Regular Customer Newsletter Emails 4. Surprise & Delight Your Customers 5. Reach out and Connect on Social Media and Post Often 6. Offer a Discount or Credit to Return 7. Implement Right Place, Right Product, Right Time Emails
CONCLUSION Customer retention hints the point of confinement of a company or thing to hold its customers over some predefined period. High customer retention induces customers of the thing or business tend to come back to, keep obtaining or in some other way not betray to something else or business, or to non-utilize totally. Offering relationship in light of current circumstances endeavor to decline customer uprisings. Customer retention begins with the fundamental contact an alliance has with a customer and proceeds with all through the whole lifetime of a relationship and beneficial retention endeavors consider this whole lifecycle. A company's capacity to draw in and hold new customers is related with its thing or associations, and furthermore to the way it formal its present customers, the respect the customers really convey moreover of using the courses of action, and the notoriety it makes inside and over the business center. Convincing customer retention consolidates more than giving the customer what they think. Conveying persistent supporters of the brand may mean beating customer wishes. Making customer duty puts 'customer see rather than developing focal points and shareholder respect at the purpose of joining of business strategy'. The key segment in a commanding space is reliably the vehicle of a constantly specific essential of customer association. Also, in the making universe of Customer Success Retention is a basic objective. Customer retention particularly impacts advantage. Get some information about by John Fleming and Jim Asplund demonstrates that related with customers convey 1.7 conditions more pay than standard customers, while having pulled in operators and moved in customers give back a wage get of 3.4 conditions the standard. The estimation of customer retention ought to see behavioral targets and veritable customer sharpens. The utilization of behavioral focuses as a marker of customer retention depends on upon the start that goals are a solid pointer of future practices, with a definitive target that customers who express a more grounded repurchase indicate a brand or firm will in like way show more grounded relating sharpens. Customer repurchase and retention practices can be measured in an assortment of various ways which are resolved in a couple regard winning articles appropriated in the propelling control. The relationship between various retention estimations is not all things considered clear. It can be (a) non-facilitate indicating developing or unavoidable hardships, (b) unmistakable for various customer parts), and in addition differ by kind of industry. Customer retention is a solid marker of a company's budgetary achievement, both utilizing bookkeeping and

28
International Journal of Research in Management & Social Science Volume 5, Issue 3 (IV): July - September, 2017
ISSN 2322 - 0899
securities exchange estimations. An examination of a Brazilian bank displayed that bank work environments that were more skilled at feasibly fulfilling and holding customers were more significant than their accessories that did either yet not both. In this research work, the empirical and pragmatic analysis on the customer retention in e-retail segment is done with effective statistical analysis.
REFERENCES A Ahmad Al-Hawari, M. (2014). Does customer sociability matter? Differences in e-quality, e-satisfaction,
and e-loyalty between introvert and extravert online banking users. Journal of Services Marketing, 28(7), 538-546.
Adebiyi, S. O., Oyatoye, E. O., & Amole, B. B. (2017). Improved Customer Churn and Retention Decision Management Using Operations Research Approach. EMAJ: Emerging Markets Journal, 6(2), 12-21.
Al-Jader, R. (2015). Structural Equation Modeling of E-Service Recovery Satisfaction and Customer Retention in the Airline Industry in Malaysia. International Journal of Marketing Studies, 7(4), 105.
Alshurideh, M. T. (2016). Is Customer Retention Beneficial for Customers: A Conceptual Background. Journal of Research in Marketing, 5(3), 382-389.
Amin, M., Rezaei, S., & Tavana, F. S. (2015). Gender differences and consumer’s repurchase intention: the impact of trust propensity, usefulness and ease of use for implication of innovative online retail. International Journal of Innovation and Learning, 17(2), 217-233.
Baral, S. K., & Mohanty, B. D. (2017). Customer Relationship Management Practices in SBI: Perceptions of the Customers. Asian Journal of Research in Business Economics and Management, 7(2), 45-58.
Cao, L., & Li, L. (2015). The impact of cross-channel integration on retailers’ sales growth. Journal of Retailing, 91(2), 198-216.
Chinomona, R., & Dubihlela, D. (2014). Does customer satisfaction lead to customer trust, loyalty and repurchase intention of local store brands? The case of Gauteng Province of South Africa. Mediterranean Journal of Social Sciences, 5(9), 23.
Chinomona, R., Masinge, G., & Sandada, M. (2014). The influence of e-service quality on customer perceived value, customer satisfaction and loyalty in south africa. Mediterranean Journal of Social Sciences, 5(9), 331.
Chuah, S. H. W., Marimuthu, M., Kandampully, J., & Bilgihan, A. (2017). What drives Gen Y loyalty? Understanding the mediated moderating roles of switching costs and alternative attractiveness in the value-satisfaction-loyalty chain. Journal of Retailing and Consumer Services, 36, 124-136.
Confraria, J., Ribeiro, T., & Vasconcelos, H. (2017). Analysis of consumer preferences for mobile telecom plans using a discrete choice experiment. Telecommunications Policy.
Das, G. (2014). Linkages of retailer awareness, retailer association, retailer perceived quality and retailer loyalty with purchase intention: a study of Indian food retail brands. Journal of Retailing and Consumer services, 21(3), 284-292.
Du, Y., & Tang, Y. (2014). Study on the Development of O2O E-commerce Platform of China from the Perspective of Offline Service Quality. International Journal of Business and Social Science, 5(4).
Ghazali, E., Nguyen, B., Mutum, D. S., & Mohd-Any, A. A. (2016). Constructing online switching barriers: examining the effects of switching costs and alternative attractiveness on e-store loyalty in online pure-play retailers. Electronic Markets, 26(2), 157-171.
Gu, R., Oh, L. B., & Wang, K. (2016). Developing user loyalty for social networking sites: a relational perspective. Journal of Electronic Commerce Research, 17(1), 1.
Hajiyan, H., Aminbeidokhti, A., & Hemmatian, H. (2017). A model of customer loyalty in the retail banking market. Accounting, 3(2), 95-100.
Hassouna, M., Tarhini, A., Elyas, T., & AbouTrab, M. S. (2016). Customer Churn in Mobile Markets A Comparison of Techniques. arXiv preprint arXiv:1607.07792.

29
International Journal of Research in Management & Social Science Volume 5, Issue 3 (IV): July - September, 2017
ISSN 2322 - 0899
Homsud, S., & Chaveesuk, S. (2014). Understanding a Proposed Model of Customer Loyalty Formation in B2C e-Commerce. International Journal of Future Computer and Communication, 3(3), 191.
Jalali, M. S., Ferreira, F. A., Ferreira, J. J., & Meidute-Kavaliauskiene, I. (2016). Integrating Metacognitive and Psychometric Decision-Making Approaches for Bank Customer Loyalty Measurement. International Journal of Information Technology & Decision Making, 15(04), 815-837.
Jin, N., Line, N. D., & Merkebu, J. (2016). The impact of brand prestige on trust, perceived risk, satisfaction, and loyalty in upscale restaurants. Journal of Hospitality Marketing & Management, 25(5), 523-546.
Kitrungpaiboon, K., & Kim, S. (2017). Factors affecting brand loyalty to cosmetics product: a case study of Thai consumers in Bangkok. AU-GSB e-JOURNAL, 9(2), 53.
Kumar, A., & Dash, M. K. (2015). Effectiveness of electronic service dimensions on consumers’ electronic buying behaviour and exploration of different groups. International Journal of Business Innovation and Research, 9(1), 81-99.
Lim, J. S., Al-Aali, A., & Heinrichs, J. H. (2015). Impact of satisfaction with e-retailers’ touch points on purchase behavior: the moderating effect of search and experience product type. Marketing Letters, 26(2), 225-235.
Martin, C. L., & Martin, C. L. (2016). Retrospective: compatibility management: customer-to-customer relationships in service environments. Journal of Services Marketing, 30(1), 11-15.
Melis, K., Campo, K., Breugelmans, E., & Lamey, L. (2015). The impact of the multi-channel retail mix on online store choice: Does online experience matter?. Journal of Retailing, 91(2), 272-288.
Morgan, S., & Govender, K. (2017). Exploring customer loyalty in the South African mobile telecommunications sector.
Nuseir, M. T. (2016). Exploring the Use of Online Marketing Strategies and Digital Media to Improve the Brand Loyalty and Customer Retention. International Journal of Business and Management, 11(4), 228.
Patil, A. A., & Nikam, A. V. (2017). E-CRM: A Study of Grievances in Online Shopping. PARIPEX-Indian Journal of Research, 5(9).
Pereira, H. G., de Fátima Salgueiro, M., & Rita, P. (2016). Online purchase determinants of loyalty: the mediating effect of satisfaction in tourism. Journal of Retailing and Consumer Services, 30, 279-291.
Rahman, M. R. (2017). Roadmap to Understand a Customer.
Renjith, S. (2015). An Integrated Framework to Recommend Personalized Retention Actions to Control B2C E-Commerce Customer Churn. arXiv preprint arXiv:1511.06975.
Rubio, N., Villaseñor, N., & Yagüe, M. J. (2017). Creation of consumer loyalty and trust in the retailer through store brands: The moderating effect of choice of store brand name. Journal of Retailing and Consumer Services, 34, 358-368.
Salehnia, M., Saki, M., Eshaghi, A., & Salehnia, N. (2014, April). A Model of E-Loyalty and Word-Of-Mouth based on e-trust in E-banking services (Case Study: Mellat Bank). In e-Commerce in Developing Countries: With Focus on e-Trust (ECDC), 2014 8th International Conference on (pp. 1-7). IEEE.

30
International Journal of Research in Management & Social Science Volume 5, Issue 3 (IV): July - September, 2017
ISSN 2322 - 0899
SELF GOVERNANCE AND RESPONSIBILITY IN GLOBAL TIMES
Dr. Ayesha Gautam Assistant Professor, Department of Philosophy, Delhi University, Delhi
ABSTRACT According to the founding fathers of modern representative institutions, one of the ideals which justifies and is to be realized by any representative institutions or democracy is the ideal of self governance. Self governance is the fundamental tenet of democracy and republican government and is the best way to advance liberty or autonomy. When we are governed collectively, then the value of autonomy can be realized only if we are bound by the laws which we choose. Self governance can also be conceived as a culture of responsibility (self as well as social). Grounding this culture of responsibility is the norm that citizens can and should participate in the public decision making. The governing idea behind the notion of self governance is that each and every individual has the same preference about the legal and moral order under whose jurisdiction one would want to lead one’s life. In the practical realm however one never witnesses a form of homogeneity but one very often confronts conflict over interests, values or norms. It is these recurring conflicts that pose a challenge for democratic institutions. It is only by wedding the notion of self governance with a notion of responsibility that one can envisage an effective self government. It is pertinent to note that the conception of free will, selfhood, desireless action etc as enshrined in our ancient Indian philosophical tradition like Bhagvad Gita, Tattvarthsutra of Jainism, Nyaya Sutra and certain Buddhist text can give an insight into the ways in which one can attain effective self governance. An attempt will be made in this paper to explore the ancient wisdom. This paper is thus an endeavor to reflect and explore ideas relevant to the notion of self governance and responsibility in global times.
Key Words: Self, Social, Responsibility, Governance, Democracy, Representative
During the last few decades, the global era which we have ventured into has witnessed a development of a new governance imagery that embodies a novel understanding of what it is to govern in an effective and democratic manner. From being perceived as an act carried out by sovereign ruler over the masses consisting of individual as well as collective agents, governance is increasingly being regarded as a complex process of co-governance involving a plurality of private stakeholders and public authorities. Governance in this framework is supposed to be carried out through different forms of self-governance. Self governance in common parlance can be understood either as exercising of control or rule over oneself and or signifies autonomy or right of the power of self government.
In their paper, “The Politics of Self Governance: An Introduction”, Eva Sorensen and Peter Triantafillou have argued that by the notion of ‘self’ – used in the context of self-governance, one can understand a variety of individual and collective selves of which some are public and some are private. According to Eva Sorensen and Peter Triantafillou, self can refer to a diverse body of agents ranging from citizens, private entrepreneur, public administrators, politicians, to public institutions, private companies and NGOs. Self governance however in no way entails a form of governance by the self taking place in isolation from other social and political forces. Self-governance is not to be regarded as something taking place in a social or political vacuum. The term ‘self’, indicates that the agents share a certain capacity to act not merely due to some innate quality, but due to the social and political processes in which the self is embedded. (Sorensen Eva and Triantafillou Peter, 2009)
In the sovereign model of governance, the entire burden of governance is on the governing agency; society is perceived merely as an object of governance. In the self governance model, however society gets redefined as a potential resource that has to be activated for efficient and democratic public governance. The state or the sovereign is regarded not as an exemplification of hierarchical rule but as a facilitator for articulation and management of self-governing capacities of public and private agencies. Further it is to be noted that political thinkers like Eva Sorensen and Peter Triantafillou has opined that all the agents/agencies that are regarded as self governing are also regarded as competent, resourceful, knowledgeable and responsible agents and self governance is to be characterized by a form of governing that works by nurturing and shaping the problem solving and self steering capacities of both public and private, and both individual and collective selves (Sorensen Eva and Triantafillou Peter, 2009)
Self governance is the fundamental tenet of democracy and is considered to be the best way to advance liberty or autonomy. When we are governed collectively, then the value of autonomy can be realized only if we are bound by the laws which we choose. French philosopher Jean Jacques Rousseau can be considered to be one of the most prominent thinkers to have talked about self governance in his work on political liberalism. In the

31
International Journal of Research in Management & Social Science Volume 5, Issue 3 (IV): July - September, 2017
ISSN 2322 - 0899
opening line of his political treatise “The Social Contract”, Rousseau said that man "is born free and everywhere he is in chains". He was of the opinion that though the individuals are born free, it is society which corrupts the nobleness of man. According to Rousseau, people are capable of self government; they should become the source of political power. Every individual according to Rousseau is the owner of sovereignty which cannot be divided or transferred to someone else. Rousseau thus was in favor of right of the people to rule. He opined that no ruler has the right to subjugate the will of the populace and people can be considered accountable only to the people themselves. The sovereignty of people however can be exercised only collectively through general will which according to Rousseau is superior to individual wills. According to Rousseau, everyone should have a vote in political affairs and that the majority vote should decide the general will and direction of any country. It was Rousseau’s faith in the wisdom of people to decide their own state of affair which directly influenced the words "We the people..." at the beginning of the Declaration of Independence. The problem to be solved, as posed and outlined by Rousseau (1964 [1762]: 182), was to “ find a form of association which defends and protects with all the shared force the person and the goods of each associate, and through which each, uniting with all, still obeys but himself, remaining as free as before.”
Yet another prominent thinker who can be said to have contributed immensely in the discourse of autonomy or self governance is the philosopher Immanuel Kant. In most of his works, Immanuel Kant has argued for autonomy of will. In fact in his work, Groundwork for the metaphysics of morals while advancing the third formulation of categorical imperative (which for him is the universal moral law), he went on to talk about autonomy of will. According to the third formulation of categorical imperative (Kingdom of ends), human agents are to be conceived as both the legislator as well as the subject of the universal law. In Kantian framework, human agent is never subjected to public universal laws; one is subjected rather to those laws which because of their inherent rationality can be conceived as agent’s own creations. There is thus a notion of non-domination or private independence which clearly gets reflected in Kant’s work. According to Kant, right to freedom can be considered to be the only innate and inalienable right of man. In his key work on justice, the Doctrine of Right, Kant defines right as a person’s right to “independence from being constrained by another’s choice… insofar as it [one’s exercise of freedom] can coexist with the freedom of every other in accordance with a universal law.” (Kant, Metaphysics of Morals 6: 237, cf. 317) Time and time again, and throughout this work, Kant emphasizes that freedom is “the principle and indeed the condition for any exercise of coercion” (Kant, Metaphysics of Morals, 6: 340)—making rightful coercion the “hindering of a hindrance to freedom in accordance with a universal law” (Kant, Metaphysics of Morals 6: 313) One thing pertinent to note with regards to Immanuel Kant is that while voicing his views on autonomy, he seemed to have argued for social self governance.
According to Helga Varden, Kant’s idea of self-governance in the liberal republic can be specified and understood via three complementary ideas: “ (i) The public authority as a tripartite, representative authority, whose reasoning can understood as legal-political reasoning within the parameters set by the citizens’ basic private and public rights and duties; (ii) free public debate (among all citizens as participants in public debates, including scholarly debates) within the parameters of free speech (including freedom of assembly and association and freedom of press); and, finally, (iii) reform of the public institutions over time so as to make it possible for any citizen (regardless of socio-economic starting point) to become an active member of the republic (active citizenship) and to work her or his way into any public position, including by ridding the offices of the public authority of appointments tracking inheritance and replacing them with merit-based evaluations.” The problem with Kantian framework is that it is too idealistic; there is no clarity as to how particular societies can realize this idea of public representation and participation as advanced by Kant. Time and time again in the Doctrine of Right, Kant emphasizes that his principles of right (justice) are a priori principles and that the core ideas of right, such as those of the state and of a citizen, are pure ideas of reason (Kant, Metaphysics of Morals 6: 313). Similarly, Kant makes it clear at the beginning of his discussion of public right that however well disposed and… [right-loving] men might be, it still lies a priori in the rational idea of such a condition (one that is not rightful) that before a public lawful condition is established individual human beings, peoples, and states can never be secure against violence from one another, since each has its own right to do what seems right and good to it and not to be dependent upon another’s opinion about this. (Kant, Metaphysics of Morals, 6: 312)
Another western thinker who is said to have influenced the self governance discourse is the postmodernist thinker Michael Foucault. As a historian and philosopher, Foucault’s concern was to understand the interrelationship between power, knowledge and right. He undertook a genealogical analysis of the concept of power which led him to critique the models of governance which are based on centrality of power. According to Foucault, the contract oppression schema and war repression schema of power are grounded in the binary

32
International Journal of Research in Management & Social Science Volume 5, Issue 3 (IV): July - September, 2017
ISSN 2322 - 0899
opposition between the ruler and ruled and can never give an insight into the actual mechanism of power. Foucault was of the opinion that power comes from everywhere and an agent can be considered to be a ruler as well as ruled. Governance, according to Foucault, should be understood as a mode of surveillance and discipline rather than as a relationship between sovereign and subjugated subjects. In one of his lectures given by Foucault in 1976, he said, “power is not to be taken to be a phenomenon of one individual’s consolidated and homogeneous domination over others, or that of one group or class over others…….Power must be analysed as something which circulates, or rather as something which only functions in the form of a chain. It is never localized here or there, never in anybody’s hand, never appropriated as a commodity or piece of wealth. Power is employed and exercised through a net-like organization. And not only do individuals circulate between its threads; they are always in the position of simultaneously undergoing and exercising this power….individuals are the vehicle of power , not its point of application.” (Colin Gordon (Ed), pg 98) Through his capillary or disciplinary conception of power, Foucault seems to have argued for an egalitarian form of self governance. It is pertinent to note that, though Foucault advanced a capillary or disciplinary conception of power, he did acknowledge that both sovereignty as well as disciplinary mechanism is integral constituent of mechanism of power. The problem with Foucault’s theory is that though, he talked about the mechanism of governance which is operational in society; he didn’t give us an idea of how effective self governance can be achieved in the presence of both sovereign and disciplinary power.
The governing idea behind the notion of self governance is that each and every individual has the same preference about the legal and moral order under whose jurisdiction one would want to lead one’s life. In the practical realm however one never witnesses a form of homogeneity but one very often confronts conflict over interests, values or norms. It is these recurring conflicts that pose a challenge for democratic institutions. It is only by wedding the notion of self governance with a notion of responsibility that one can envisage an effective self government. Self governance can also be conceived as a culture of responsibility (self as well as social). Grounding this culture of responsibility is the norm that citizens can and should participate in the public decision making. It is pertinent to note that the concepts of free will, selfhood, self governance etc as enshrined in our ancient Indian philosophical tradition like Bhagvad Gita, Tattvarthsutra of Jainism, Nyaya Sutra and certain Buddhist text can give an insight into the ways in which one can attain effective self governance.
Before delving into how our ancient traditions can give us an insight into effective self governance, it would be pertinent to discuss Mahatma Gandhi’s work especially on swaraj or self rule. Mahatma Gandhi was himself influenced by some of our ancient wisdoms. Through his notion of Swaraj or self rule, Mahatma Gandhi can be said to have paved the way for discussions on Self governance as an effective model of governance. In Hind Swaraj, Mahatma Gandhi said “It is swaraj when we learn to rule ourselves. It is, therefore, in the palm of our hands.” According to Mahatma Gandhi, the word swaraj can be used in different contexts to give an insight into freedom at both individual and national levels. By Swaraj, he meant freedom and self-rule which should be practiced at three levels, In case of individual, Swaraj is to be understood as self-control or Swaraj of the self. In case of the country, swaraj is to be understood as freedom of India from external domination or the British clutch, and at the community level, swaraj can be understood as autonomy of village or gram swaraj. In general, Swaraj means “self-rule” or self-governance, not a hierarchical rule, but one of self-governance through individuals and community building. Swaraj or self rule, according to Mahatma Gandhi, can be achieved only by following one’s dharma or duty. At the individual level, Swaraj is vitally connected with the capacity for dispassionate self-assessment, ceaseless self-purification and growing self reliance. If each individual while governing of one’s self performs his/her duty, he/she would indeed be responsible and in turn there will be no conflict of interest or value. Dharma which is one of the conditions to be fulfilled for the realization of swaraj can lead to stability of society, the maintenance of social order and the general well-being and progress of humankind.
Bhagvad- Gita which is one of the most ancient scripture of India has many pearls of wisdom which can have important ramifications for effective governance. In the Bhagavad-Gita, Sri Krishna is shown as instructing Arjuna on the art of good governance but many of the verses by Sri Krishna relates to governance from self, corporate to global. The significance of verses from the Bhagavad-Gita lies in the fact that they are universal in nature and can be interpreted effectively to gain knowledge on good governance. Further Bhagavad-Gita’s intrinsic beauty lies in the fact that its knowledge can be applied to all people and it does not confine any sectarian ideology.
According to United Nations Economic and Social Commission for Asia and the Pacific or UNESCAP, good governance has eight major characteristics: it is participatory, consensus-oriented, accountable, transparent, responsive, effective and efficient, equitable and inclusive and follows the rule of law. It assures that corruption
33
International Journal of Research in Management & Social Science Volume 5, Issue 3 (IV): July - September, 2017
ISSN 2322 - 0899
is minimized, the views of minorities are taken into account and that the voices of the most vulnerable in society are heard in decision-making. It is also responsive to the present and future needs of society. (Satpathy, Muniapan and Das, 2013,199) The Bhagvad Gita can be considered to be propounding all the aforementioned characteristic of good governance by presenting the core values and principles of Dharma, Loka Sangraha, Kausalam, Vividhta and Jigyasa (Satpathy, Muniapan and Das, 2013,199) which are required for effective self governance as well as effective governance at global level.
In Chapter 2:47 and 2:50; Ch 3:25; 3:37, Chapter 9 of Bhagvad Gita gives an insight into the concept of Dharma or righteousness which consists of accountability of self, family, organization and society for order and progress. It is the right path, which ultimately upholds the family, organizational and the social fabric. It helps in the long term upliftment of all living beings and ensures welfare of society (Satpathy, Muniapan and Das ,2013,199). The concept of Dharma enshrined can indeed be said to bring self governance and responsibility together while maintaining harmony in society.
Further in Chapter 5 and Chapter 17: 20–22 of Bhagvad Gita, there is a discourse on Loka Sangraha or public benefit. Loka sangraha refers to transparency of work for public benefit and societal welfare. Loka Sangraha or public benefit implies that actions should be performed keeping in view the welfare of the society as a whole. (Satpathy, Muniapan and Das , 2013,199) Thus, actions should be guided by enlightened collective interest and not by selfish interest or self-interest alone. In the context of corporate organizations, it implies that corporate behaviour should be guided by larger social interest.
Chapter 2, Chapter 2:34 of Bhagvad Gita refers to the concept of Kausalam (optimization and sustainability). Kausalam refers to the optimum utilization of resources efficiently and productively and the judicious use of resources and preserving the resources for future generations (Satpathy, Muniapan and Das, 2013, 199).
Chapter 4; Chapter 6; Chapter 7 of Bhagvad Gita mentions the notion of Vividhta or creativity and innovation. When the different agents of a society are constant creative and control resources for societal welfare then it would indeed lead to harmony in society as well as to effective governance. Beyond survival, business has to be the ‘engine’ of innovation constantly seeking more effective solutions to meet their economic and social expectations. Such innovations are required in processes, products, materials, machines, organizations, strategies, systems and people (Satpathy, Muniapan and Das, 2013, 199).
Chapter 3, Chapter 4; Ch 12; Ch 14; Ch 16 of Bhagvad Gita gives an insight into the concept of Jigvasa which means continuous learning to improve or continuous improvement. Change and continuity will co-exist. So, there is a need to have to keep learning from the feedback loop from society and through internal processes of question, challenges, debates and training (Satpathy, Muniapan and Das,2013, pp199).
If these pearls of wisdom contained in Bhagvad Gita are applied in contemporary scenarios, then many of the challenges faced with regards to governance can be resolved and notion of self governance would indeed get wedded with individual as well as social responsibility.
Further an attempt to understand the concept of free will and autonomy in some Buddhist text shows that Buddhist notion of autonomy can give us an insight into how self governance and responsibility can be brought together. It may appear that in Buddhism, there is no idea of free will or autonomy because of the notion of non-self or anatman which one can come across in Buddhist text. Doctrine on non-self explicitly denies that action originate from an agent or karta. An analysis of early Buddhist text and Abhidharma shows that in Buddhist texts, there is a distinction maintained between the conventional truth ( saṃvṛti-satya ) reflected in discourse about persons, and the ultimate truth ( paramārtha-satya ) reflected in discourse about dharmas, the impersonal, ephemeral mental and physical events that constitute the basic elements of existence or experience According to the conventional truth, persons are the agents or causes of their actions; according to the ultimate truth however, there are no agents, and actions issue from a combination of dharmas . The search for an analogue in Buddhist thought for free will has lead some scholars to infer that free will is implied in the Buddha’s statement that karma (i.e., action) is cetanā which can be understood as volition or exercising one’s will. Further is to be noted that the central concern in Buddhism is not moral or metaphysical, but soteriological: how to attain a specific kind of freedom, namely, liberation from suffering. That said, the fact that our actions are-in some significant sense- up to us , that we have some capacity to choose or control what we do and can even achieve an optimal level of self-control, that is, control over our own mental states. Buddhists do not have a term equivalent to “free will” or any concept of a discrete faculty of the will, but they clearly recognize the empirical freedoms persons enjoy in choosing and controlling their actions as well as the essential roles these freedoms play in the project of liberation from suffering. Indeed, the Buddha’s message is predicated on the fact that human beings can choose one course of action over another. We can choose to

34
International Journal of Research in Management & Social Science Volume 5, Issue 3 (IV): July - September, 2017
ISSN 2322 - 0899
nurture wholesome qualities and abandon unwholesome ones. Cultivating this self-control involves both critical reflection and conscious choice , and a training of habit, affection, and moral sentiment, such that the supremely self-controlled individual is no longer capable of engaging in unwholesome action In so doing, we can change our personalities, achieve greater well-being, and even eliminate suffering altogether. Here it can be argued that when self governance gets extended to governance of one’s self by training one’s mind then probably many of the challenges faced with respect to governance can be resolved. Effective self governance can indeed be realized efficiently in societies in which people are conscientious and make conscious choice by critically reflecting on it.
Further if one takes cognizance of Jaina philosophy then it can be seen that self governance in Jainism is achieved by self by exercising control over the four passions of the mind: Anger, pride (ego), deceitfulness, greed. Jainism recommends conquering anger by forgiveness, pride by humility, deceitfulness by straight-forwardness and greed by contentment. In Jainism, both ascetics and layman are advised to follow five major vows or vratas. Jainism encourages self-control through these five main vows. The first major vow taken by Jains is ahimsa or the pledge of causing no harm to living beings. It involves reducing intentional as well as unintentional harm to other living creatures by speech, actions or thoughts. The vow of non-violence is given priority over others in Jainism. The second vow is that of satya or utterance of truth. According to Jainism, in a situation where speaking truth could lead to violence, silence may be observed. The third vow is that of Asteya which means not stealing. Jains believe that one should not take anything which doesn’t belong to them and which that is not willingly offered to one. While purchasing good and services one should give fair value to the seller. Exploitation of weak or exhortation of somebody’s wealth is prohibited by the vow of Asteya. Attempting to extort material wealth from others or to exploit the weak is considered theft. Fair value should be given for all goods and services purchased. The fourth vow is that of Brahmacharya. It recommends chastity for laymen and celibacy for Jain monks and nuns. This vow is about exercising control over one’s senses. The fifth and last vow recommended by Jainism is Aparigraha or non-possessiveness. This may signify non-attachment to objects, places and people. It is to be noted that monks and nuns are obligated to practice the five cardinal principles very strictly, while laymen are encouraged to observe them within their current practical limitations. Reflecting on the five vows of self governance, it can be argued that the vows recommended by Jainism can be said to not only lead to spiritual growth of the individual but can also enable to maintain harmony in society and can pave way for effective governance.
Further if one tries to undertake a study of yet another ancient tradition i.e., Nyaya Philosophy, then it can be seen that for Nyaya, human agency is seen as an expression of different capacities and potentialities of the self. According to Naiyaikas, prayatna or volition is a unique property of the self which accounts for the capacity of selves to initiate change or activity. A wholly passive member of a causal nexus cannot be a genuine agent, according to Naiyaikas. Human agency in Nyaya philosophy is seen as a capacity to initiate action with some degree of independence, in the sense that an action flows from the objectives, decisions, and efforts of an individual. An individual self apart from being responsible for his/her acts is also considered a bearer of both moral responsibility and concretization of the action in the form of karmic merit.
To conclude, it can be argued that, if one were to sketch a framework of self governance which is effective as well as efficient then probably one can take inspiration from some of our ancient traditions. One of the challenges faced by western political thinkers who have been arguing in favor of self governance is to come up with a model of governance which is self governance in true sense given the various conflicts of interests and values which one witness across cultures. Taking cue from ancient traditions like Bhagvad Gita and others, one can assert that, if nations can unanimously take a policy decision regarding nurturing and training of the selves from the very beginning to enable them to become free, responsible agents then there is a possibility of mimimalising the conflicts and paving the way for effective governance.
REFERENCES Dalton, Mahatma Gandhi: Non Violent Power in Action, Columbia University Press, New York, 2012
Dasti Matthew R. and Bryant Edwin F. (Ed.), Free Will, Agency, and Selfhood in Indian Philosophy, Oxford University Press, New York, 2014
Gordon Colin (Ed.), Power/ Knowledge: Selected Interviews and Other Writings 1972-1977 by Michael Foucault, Pantheon Press, New York, 1980
Kant, Immanuel. Metaphysics of Morals, Doctrine of Rights, Section 43-section 62. In Toward Perpetual Peace and Other Writings on Politics, Peace, and History. Edited by Pauline Kleingeld. Translated by David L. Colclasure. New Haven: Yale University Press, 2006

35
International Journal of Research in Management & Social Science Volume 5, Issue 3 (IV): July - September, 2017
ISSN 2322 - 0899
Koppedrayer Kay, Gandhi’s Autobiography as the commentary on Bhagvad Gita, International Journal of Hindu Studies 6, 1 (April 2002): 47-73
Przeworski Adam, Democracy and the Limits of Self-Government, Cambridge University Press Cambridge, 2010
Rousseau Jean Jacques, The Social Contract and The First and The Second Discourses, edited and with an Introduction by Susan Dunn, Yale University Press, New Haven/London, 2002
Rout Dhananjaya Kumar, “Concept of Swaraj and Mahatma Gandhi: A Critical Analysis”, Odisha Review, October 2015
Satpathy, B., Muniapan, B. and Dass, M. ‘UNESCAP’s characteristics of good governance from the philosophy of Bhagavad-Gita and its contemporary relevance in the Indian context’, International. Journal of Indian Culture and Business Management, Vol. 7, No. 2, 2013 pp.192–212
Sorensen Eva and Triantafillou Peter (Ed.), The Politics of Self-Governance, Ashgate Publishing Limited, U.S.A, 2009

36
International Journal of Research in Management & Social Science Volume 5, Issue 3 (IV): July - September, 2017
ISSN 2322 - 0899
YOU ARE MORE POWERFUL THAN YOU THINK: IPHONE
Jyoti
Assistant Professor, DIPS Institute of Management & Technology, Jalandhar
ABSTRACT The purpose of this study is to know the uniqueness of iPhone. In this paper we will study the various features of iPhone which make it unique. Everyone has a dream to have an iPhone but they don’t know why they want. Through this study I want to know that why people are crazy for iPhone even without having an experience with it and how it has maintain their market share in this tough competition? In this paper we will analyse the behavior of people towards iPhone in the market.
IPhone is a line of smartphones designed and marketed by Apple Inc. They run Apple’s iOS mobile operating system. The first generation iPhone was released on June 29, 2007 and there have been multiple new hardware iterations since.
The user interface is built around the device's multi-touch screen, including a virtual keyboard. The iPhone has Wi-Fi and can connect to cellular networks. An iPhone can shoot video, take photos, play music, send and receive email, browse the web, send and receive text messages, follow GPS navigation, record notes, perform mathematical calculations, and receive visual voicemail. Other functionality, such as video games, reference works, and social networking, can be enabled by downloading mobile apps. As of January 2017, Apple's App Store contained more than 2.2 million applications available for the iPhone.
Apple has released ten generations of iPhone models each accompanied by one of the major releases of the iOS operating system. The original first generation iPhone was GSM phone and established design precedents, such as a button placement that has persisted throughout all releases and a screen size maintained for the next four iterations. The iPhone 3G added 3G network support and was followed by the 3GS with improved hardware, the 4 with a higher display resolution and front-facing camera and 4S with improved hardware and the voice assistant Siri. The iPhone 5 featured a taller, 4 inch display and Apple’s newly introduced Lightning connector. In 2013 the 5S with improved hardware and a fingerprint reader and the lower cost 5C a version of the 5 with colored plastic casing instead of metal. They were followed by the larger iPhone6, with models featuring 4.7 and 5.5 inch displays. The iPhone 6S was introduced the following year which featured hardware upgrades and support for pressure sensitive touch inputs.in 2016, Apple unveiled the iPhone 7 and 7 Plus which add water resistance, improved system and graphics performance, a new rear dual camera setup on the Plus model and new color options, while removing the 3.5 headphone jack found on previous models.
Keywords: GPS, Siri, iOS, wifi, virtual keyboard, rear camera
INTRODUCTION Apple Incorporation is an American multinational company. Its headquarter is in Cupertino, California, United States. Apple was founded by Steve Jobs, Steve Wozniak, and Ronald Wayne in April 1976. It was incorporated as Apple Computer, Incorporation in January 1977.
Steve Jobs famously said, “People don’t know what they want until we show it to them”.
Apple design, develop and sell consumer electronics, computer software, and online services. The company's hardware products include the iPhone smartphone, the iPad tablet computer, the Mac personal computer, the iPod portable media player, the Apple Watch smart watch, and the Apple TV digital media players, computer software, and online services.

37
International Journal of Research in Management & Social Science Volume 5, Issue 3 (IV): July - September, 2017
ISSN 2322 - 0899
Apple's consumer software includes the macOS and iOS operating systems, the iTunes media player, the Safari web browser, and the iLife and iWork creativity and productivity suites. Its online services include the iTunes Store, the iOS App Store and Mac App Store, Apple Music, and iCloud.
In January 2007, Steve Jobs announced that Apple Computer Inc. would be renamed Apple Inc. to reflect its shifted focus toward consumer electronics, and announced the iPhone, which saw critical acclaim and significant financial success.
BACKGROUND OF APPLE In 1976 Steve Jobs, Steve Wozniak, and Ronald Wayne found Apple computer Incorporation.
In 1980 Apple converts to public ownership.
In 1982 it becomes the first personal computer company to reach $1 billion annual sales. Apple is a market leader in consumer electronics and media sales industry.
Apple was predominantly a manufacturer of personal computers, including the Apple II, Macintosh, and Power Mac lines, but it faced rocky sales and low market share during the 1990s
Its products include iPhone, Mac, iPod, watch etc.
Apple released first generation iPhone on 29June, 2007.
VISION STATEMENT OF APPLE “Man is the creator of change in this world. As such he should be systems and structures and not subordinate to them”
MISSION STATEMENT OF APPLE “Apple is committed to bringing the best personal computing experience to students, educators, creative professionals and consumers globally through innovative hardware, software and internet offerings”
OBJECTIVES OF THE STUDY To study the unique features of iPhone. To know the target market of iPhone. To know why people are crazy for iPhone. To analyze the behavior of people towards iPhone. To know how it is useful for different generations of the society.

38
International Journal of Research in Management & Social Science Volume 5, Issue 3 (IV): July - September, 2017
ISSN 2322 - 0899
RESEARCH METHODOLOGY Research is an important pre-requisite for a dynamic study of any type. Precise research is a more systematic activity directed towards the discovery and development of organized body of knowledge.
SECONDARY DATA The methodology followed in conducting the study is to collect data regarding unique features of iPhone of Apple Company and also to study the behavior of people towards iPhone. The data & facts were taken from many journals, periodicals, published materials, and internet also.
COMPANY OVERALL STRATEGY Apple strategy is to develop and sell brand new innovative products inclusion of high technology in order to provide a simple and streamlined user experience.
WHY PEOPLE ARE CRAZY FOR IPHONE? OR UNIQUE FEATURES OF IPHONE Not affected by virus
iPhones are hardly affected by virus. It's App Store is also 50% more secure than Google's Play Store. Each year they clear thousands of unwanted apps from App Store. There is no risk of malware or viruses that you can download or transfer from other phone except apple itself. Apple phones have maintained their own standard for a long time and have successfully maintained their brand value, which other famous companies like Nokia, Motorola has failed to maintain.
Hardware and software combination Apple combines its own hardware and software. It’s like the “made for each other” thing makes the experience of using it so amazing. “Apple makes the small things just unforgettable”, you might not notice them in regular use but would definitely miss them while using any other device.
Fabulous touch screen sensor The touch screen sensor in iPhones also has much greater response than any Android Phone. If anyone has habit of using it then they cannot easily get rid of it because what Apple has done any other company cannot do it.
Different accessories As comparative to other mobile phones iPhone has different accessories which make it unique. Like its earphone’s design. You can easily set into your ears without any pain for a long period of time because at the time of its creation the top most priority is customer’s comfort level. Moreover, no wires are attached with earphone in iPhone 7 & 7S which shows too much comfort level of customers are considered.
Design The design of iPhone is pretty good. The iPhone still has the most singular look of any smartphone out there, after a multitude of upgrades and changes. You cannot open your iPhone from the back just like other mobile phones and cannot see the iPhone’s battery which makes it unique and different. The speaker is on the edge of the phone but other phones speaker is on the back or front of the phone where at some point of time there is level of discomfort while using it.
Status symbol iPhone is a status symbol. Having the latest iPhone is like having this month’s hottest accessory. To hardcore iPhone devotees, their phone isn’t just a phone, like any precious object, it’s an extension of themselves. And since they paid good money for that extension, they want you to see it.
Usability Another reason why most people prefer an iPhone - it works! The usability of an iPhone is on point. You don’t have to do tens of things for it to work, nor fiddle with the settings. It works right out of the box, and same goes for every time it gets a software update. An iPhone is very simple to use.
None or only few Android phone can match iPhones' fingerprint sensor Some Android phone makers like Samsung, HTC, Xiaomi have tried adding fingerprint sensors to their phones, but none of them are as useful and accurate as the Touch ID sensor on the iPhone. A few years ago, Apple bought a company called Authentic that makes the best fingerprint sensors for mobile devices. No one else has been able to beat Touch ID since.

39
International Journal of Research in Management & Social Science Volume 5, Issue 3 (IV): July - September, 2017
ISSN 2322 - 0899
EXAMPLE My friend purchased new mobile phone and I have iphone 6. His new phone has 2Gb RAM, and I have 1 Gb RAM but still my phone has never hanged and my friend is worried about hanging of his android phone. He got it for Rs.10,000/- but I got it for Rs.30,000/-
His android phone is powered by a 3000mAh removable battery. The Apple iPhone 6 runs iOS 8.0 and is powered by 1810mAh non removable battery. Even this I don’t have to charge my phone again and again but my friend is worried for charging it again and again.
He got 13 MP camera and I have8MPcamera but still when we have to take picture of a page (notes), iphone is much clearer and his clarity is low as comparative to iPhone.
Certainly there are many things of iphone/iDevices may be big and small that people don’t know. Most popular is mega pixel stuff. It does not matter if you have 8 MP or 13 MP its micron pixels that matter, that brings more clarity.
People do not know that it would not be of expected quality and ditch great phones over cheap. Other companies provided the same smart phone with minimum cost but at the cost of quality which general people can’t think until they use it.
WHY PEOPLE ARE INTERESTED TO BUY IPHONE INSTEAD OF HIGH PRICE?
OR
SEGMENTATION OF IPHONE
1. MARKET SEGMENTATION THE FIRST GROUP: CUSTOMERS WITH HIGH LOYALTY TO APPLE The first target group is people who are highly loyal to Apple. First, there is a group of people who has strong loyalty to this brand, acting as the role of primary customer. Primary group consumers are mainly people who are the big fans of the products of Apple Company, not only iPhone but also products in other series such as iPod, iPad and iTouch. People in this group may have more than one product from the firm. They know well about the features and the benefits of the products and they are willing to pay for the extra money to get these features. They are the people from the middle to high class in the society and have the ability to pay for the new products in the company. They are the main consumer group of the company. This is also the main reason why Apple can have a higher price than most of its competitors.
THE SECOND GROUP: TECHNOLOGY ORIENTED The second group is people who are attracted by the novel design and functions of the product. These people are adults in the middle class, who are curious about new high tech products. They use smart phone quiet frequent. A superior product could simplify one's daily life.
THE THIRD GROUP: QUALITY ORIENTED The third group of people is quality oriented. These people are businessmen. They can’t change their phones just because of hanging problem or any virus affected to it. Quality wise they can’t suffer and that’s why they are ready to pay more if they get excellent quality. In iPhone you have to create icloud id in which all your data (photos, videos, documents) is saved and with the change of your iphone model you can recover all your data by sign in your icloud id.
THE FOURTH GROUP: SOCIAL ACCEPTANCE ORIENTED The third group is people who chase after social status. Social acceptance and fashion are the main reason of their purchase. They are capable to pay for iPhone, they still need to use external material to differentiate with others and make them feel confident. Among these four groups, the first group is the primary customer. They are the reason why Apple can enjoy premium in the market.
2. DEMOGRAPHIC SEGMENTATION Based on variables such as gender, age, family size, income, education, occupation, religion, race and nationality, customers can be divided into different groups. Income, age and gender have some impacts when consumers are making the purchasing decision. For example at the time of launching iPhone 4s the price is low as compared with other generations in this series. According to the features of the product, the target consumers are more middle class people who are able to pay for this luxury and willing to accept new changes and try these new improvements. At the same time, they are able to pay for it. The target age group of iPhone is 25-55 years old people.

40
International Journal of Research in Management & Social Science Volume 5, Issue 3 (IV): July - September, 2017
ISSN 2322 - 0899
3. BENEFIT SEGMENTATION On the basis of benefits given by iPhone, customers are segmented. Different customers get different benefits from the same product. Some customers are attracted by the convenience of iPhone because of the simplified system and applications while some other choose to use iPhone due to the very high social acceptance of the product. IPhone is the leader in smart phone market and customers choose to buy iPhone on the basis of benefits provided by it.
4. PSYCHOGRAPHIC SEGMENTATION The market is segmented based on the different thinking, interests, opinions, self-image, values, personalities, attitudes and activities of the consumers. Different people may have different interests. People who are interested in iPhone will at least have some interests in high tech product. The fast system, special voice recognition "Siri" and enormous applications must have some attractions to them. Moreover, people in different lifestyle with different personality will also impact their choice.
SWOT ANALYSIS OF IPHONE STRENGTHS WEAKNESSES
Apple is international successful company. Price of apple products are normally high than their competitors and consumers who are price sensitive tend to opt for lower price products.
Early innovators of technology and non-technology products such as iPhone, iPod, Mac computers etc.
Cannot transfer data to any other device. It is possible through Apple product to Apple product only.
High level of brand loyalty among customers. Apple is a Big name in the technology world. It brings so much responsibility and kind of obligation for company and its product. New iPhone map application problem and customer frustration would be a good example.
iTunes are a big part of Apple’s revenue. People buy music and applications conveniently.
To download even a single song you have to pay for it. In apple’s products nothing is free.
Easy integration with Apple devices like ipod, Mac computers, iPhones etc.
You have to live with the memory you got while purchasing the phone and there is no way to increase your iPhone memory.
There are various unique features in iPhone which make its strength like Face time, privacy measures, warranty, after sale service etc.
iPhone is use for status purpose only. Those who are not status conscious, for them it is just wastage of money.
Downloaded files can't be accessed easily unless you go to the source page. Any document received via WhatsApp/ mail is available only on WhatsApp/ mail, there is no downloads/ file manager for quick access.
OPPORTUNITIES THREATS
Apple could think about possibly expanding iTunes store into China which counts for major part of its revenue.
Competitors such as Samsung, oppo etc. offer products at low price as comparative to apple.
Apple can think about committing to be a company that uses 100% renewable energy.
Samsung release Galaxy Note 2 which is direct competitor of iPhone 5.
Apple can Increase their advertising for boosting their sales.
REASONS OF SUCCESS OF APPLE 1) APPLE IS THE WORLD'S MOST VALUABLE BRAND Several organizations rank global brands on various metrics, and all the major ones rank Apple's as the world's most valuable brand. For example, the Forbes list ranks Apple's brand as twice as valuable as Microsoft, the world's second most valuable brand, and far more valuable than Google, the third.

41
International Journal of Research in Management & Social Science Volume 5, Issue 3 (IV): July - September, 2017
ISSN 2322 - 0899
2) CONSIDERING THE DEMAND OF THEIR CUSTOMERS The other reason that Apple is so successful is because when they invent or update their product they make it while considering the demand of their customers. Proper survey is done by the company before launching any product in the market.
3) ANY OTHER COMPANY CAN’T BEAT ITS QUALITY What Apple has done any other company even can’t dream of it. So that is the main reason of its success. It provides best quality to their customers at the cost of charging high price but can’t bear low quality products.
4) BEST RESEARCH AND DEVELOPMENT Because of high research and development in technology sector it became the tough competitor for other companies also.
5) CONTINUOUS UPDATION Another reason of its success is its continuous updation in applications, software and hardware also. It not only makes a product and leaves it.
6) GREAT CUSTOMER SERVICE Where do you go if you have a problem with your Android phone? The service center? iPhone maker provides at the Apple Store. If something goes wrong with your iPhone or you just want to learn how to use it, Apple provides services better than any Android phone maker.
7) SIMPLE YET POWERFUL PERFORMANCE iOS has power is in its technology, today Apple's chipsets contain two cores, which power is arguably on par with modern quad cores and even octa cores. iOS does not need three or four gigabytes of RAM. Again the system is much better optimized from the beginning.
RECOMMENDATIONS No doubt Apple customers are highly loyal but at some point of time it comes into our mind that Apple
products are too much costly. If it reduces their price then it has a big opportunity to increase their turnover, market share and profit also.
It is highly recommended that there should be no operating cost. iTunes services, application services etc. are not free of cost. Even after purchase iPhone you cannot listen music without internet connection. So at every step, you have to pay.
There should be expandable memory in iPhone because after having investment on iPhone there should not be any lackage of anything.
CONCLUSION In Nutshell, we can say that iPhone is both a luxury item as well as necessary item. No doubt iPhone is expensive as comparative to other phones but what it has done any other company can’t do it. It thinks out of the box and that’s the reason of its success. Now a day, it becomes necessity to have iPhone because it covers all generations of the society and becomes the need of the students, professionals, businessmen etc. Moreover, if we were talking about a lifestyle or a political philosophy then Android would be hard to beat. But this is about a phone. And if you just want a smartphone that's safe, easy and enjoyable to use, and connected to the best-quality app store around - not to mention sumptuously designed and reliable - then iPhone is the only answer.
BIBLIOGRAPHY https://www.apple.com http://www.computerworld.com http://techland.time.com http://smallbusiness.chron.com/advantages https://www.quora.com/What-are-the-advantages-and-disadvantages-of-iPhone https://www.slideshare.net https://simple.wikipedia.org/ https://en.wikipedia.org/wiki/IPhone http://www.gadgetsnow.com

42
International Journal of Research in Management & Social Science Volume 5, Issue 3 (IV): July - September, 2017
ISSN 2322 - 0899
IMPACT OF RECENCY BIAS ON STOCK SELECTION: A DEMOGRAPHIC STUDY ON INVESTORS OF JAIPUR CITY
Prof. C. K. Shah1 and Dr. Ity Patni2 Professor1, Department of ABST, University of Rajasthan, Jaipur
Assistant Professor2, Manipal University, Jaipur
ABSTRACT Although the tenets of traditional finance assume an investor to be a homoeconomicus or a rational being, numerous research works in the past have proven that cognitive biases constantly affect financial decisions. One such cognitive error is the mental process which leads to one remembering either the information received in the beginning or the one received in the most recent past. This bias is commonly termed as “Recency Effect” in the domain of psychology.
An investor who does not provide sufficient weight to information available for different segments of time is most likely to make faulty stock selection. The investor suffering with recency bias is likely to be swayed by short term trends, rumors, news articles and herdactivity. These investors tend to get distracted from the trend supported by long term fundamentals and consequently suffer from losses.
This study is an attempt to explore the existence of recency effect amongst investors/ traders in Jaipur city, and whether such bias is dependent upon demographic factors such as age, gender, financial literacy and years of experience in market. The study will entail conducting experiments on the subjects to investigate the presence of recency effect.
Keywords: Homoeconomicus, Cognitive Bias, Recency Effect,
INTRODUCTION The straightforward belief of behavioral finance and economics is linked with the irrational mind of investors. In the real world, the investor does not act as the rational one but rather in an irrational or quasi-rational manner. Thus, this evolutionary field of behavioral finance explains that behavior and psychology sway the decision making process. This distortion in investment decision making process is because of behavioral biases which are cognitive and emotional one.
Recency bias is a cognitive bias which persuades to use the recent experience in the line of work for the future. This predisposition inclines investor to give more weightage to recent outlooks rather than the events of distant one. The quantum of recent experiences has direct relationship with the processing of information (Smith, 2012).
Recency effect paves the way for inefficiency of the markets as the type and content of the information plays an important role. The theories of psychology evolved the examination of human memory recall test which gave the birth to serial position curve. This actually postulates that out of the varied items in the list, human memory recalls easily the initial and end one item better than the items which lies in the middle. Recall of the beginning items is taken as primacy and end items are termed as recency effect. The process of easy recalling smoothens the process of serial position curve, which is a U shaped curve. The left hand side of the curve depicts the primacy effect whereas the right hand side of the curve emphasis on recency effect. This easy recalling is done directly from the short term memory of human brain which stores information for a shorter while in a memory.
Figure 1: U Shaped Curve

43
International Journal of Research in Management & Social Science Volume 5, Issue 3 (IV): July - September, 2017
ISSN 2322 - 0899
This drolly U-shaped curve was named the serial position curve because the serial position of the word on the list influences, if it will be remembered.
Likewise, investor being human weighs the recent events on a higher note and for decision making the last information makes the whole framework complex. When markets are heading investor make it a consensus that the Bull Run will go for a longer while and they keep on buying which might result in bubbles. In contrast, when the declining markets convince investors that it will not jump back, the fear of loss results in the cash out positions (Carl Richards, 2012) In general, investors ignore the long term track record and in an expectation of the drift forever.
The spike in price tends investor to buy when markets are rising and sell when markets are going down. (Vivek Kaul, 2011), explored that the psychological tendency of continuing rise and fall, led investors to suffer the losses in 2008 global financial crisis and subsequently they could not gain in the rally of 2009.
The working memory of human being is of short term and limited in nature which influence them to suppress the recent events simultaneously distorting the decision making process. The study is an attempt to explore the impact of recency bias while selecting the stocks. This is in the line of demographic factors such as age, gender, financial literacy and years of experience in market as aspects of the investors of Jaipur City.
REVIEW OF RELATED LITERATURE Recency bias is a cognitive phenomenon which is being studied by varied researchers. The later part of serial position U shaped curve, describes the recency effect. This is a domain of ‘psychology’.
(Liza Alvia and Dedhy Sulistiawan, 2010), concluded that the nature and sequence of information affects the recency bias. Furthermore, it is also advised that the knowledge provides booth which facilitiates effective error free decision making. The experimental study remarked that the investor, evenafter having the prior information, at the time of investing the hard earned penny they bet on recent happenings.
(Michael M. Pompian, 2011), states that recency bias makes pattern in a mind of an investor and the historical value becomes inaccurate and small for them. Tending to that matter the forecasting of returns becomes weak which results in a huge loss. While chasing the promising profits, the investors end up with the overvalued assets with an experience of losses.
(Jorg Rieskamp, 2006), observed through 2 experiments that the composition of funds and allocation keeps on changing, based on the recent happenings in the market. Investors change their strategy depending upon the occurrence of the events. This model is named as ‘local adaption model’. The second model is termed as reinforcement model which assumes that decision making is being tied up with the totality of experiences.
(Kroll, Y., Levy, H., & Rapoport, A., 1988) carried out an experiment considering the investor’s allocation with reference to the repetitive investment decisions. The partakers were asked to select two risky and one risk free option for their portfolio with the available fixed amount of investment. Although the decision criterion travelled around the mean-variance of the portfolio, still 30% of their decisions were changing by observing the past trends and accordingly changing the allocation for investments. It was also observed that the because of herd behavior it resulted in selection of counter cycle effect which is being taken as negative recency effect. Whereas, if from previous patterns returns are higher the investors switched for the same.
(Greg Barron and Ido Erev, 2003) suggests that investors are inclined with the recent outcomes and due to this behavioral tendency they play on the outcomes of previous rounds winners and losers. It is also observed that investors are not bent for portfolio. If they are in the boundary of the recency they choose individual security not the diversified portfolio.
(D. Sulistiawan & Supriyadi 2013), examined the pattern of disclosure and sequence of information on investment decision making. It was experimented that group discussion does not lead to effective decision making and it cannot mitigate the effects of recency bias. Through the means of information, an investor receives sequential information rather than simultaneous one, which increases the magnitute of orderly information. In this series, the recent information makes a difference for decision making.
(Ralph Hertwig, 2004), observed that small samples tend to underestimate the likelihood of rare events. The decisions from experience needs updated information so that decisions might be taken on recent past event as per the pool of knowlede, because of Recency effect even if the sample size is large it results in underweighing of rare events. (Hogarth, 1992) also evidenced that recently sampled events is being given more weight than the earlier ones.

44
International Journal of Research in Management & Social Science Volume 5, Issue 3 (IV): July - September, 2017
ISSN 2322 - 0899
(Leider, 2010), experimented that recency bias contributes in gambler’s fallacy. The sequence of recent events give inputs for framing the niche for gambler’s fallacy. The recency effect is visible is subject keeps intervening each sequence of information at every step. This results in extended sensitivity to the last outcomes.
The research objective and methodology which are the center theme of the paper, discussed in the next section.
RESEARCH OBJECTIVE & METHODOLOGY The study was conducted in Jaipur City on active stock market investors. The idea is to explore whether age, gender, financial literacy and experience in the market are participating in stock selection with a notion of recency effect. Recency bias is the name for the heavy influence that recent experience can have on our decision making. It is a particular problem for investors in financial markets where momentum effects can be strong and persuasive. The population under study includes 523 investors of Jaipur city who are the investors of stock market, as this research paper is a substance of doctoral thesis. The study was administered through structured questionnaire which was validated from experts. In a string of measuring reliability of questionnaire chronbach alpha was used which was measured as 0.778. In order to test research hypotheses, ANOVA was employed.
STATEMENT OF HYPOTHESES H01 There is no significant impact of investor’s age on recency effect.
H02 There is no significant impact of investor’s gender on recency effect.
H03 There is no significant impact of investor’s financial literacy on recency effect.
H04 There is no significant impact of investor’s experience in market on recency effect.
Underneath is the sample profile: Demographics Frequency Percentage
Age 21-30 291 55.6 30-38 189 36.1 38-48 32 6.1 48-58 8 1.5
58 & above 3 0.6 Total 523 100 Gender Male 327 62.5
Female 196 37.5 Total 523 100 Financial Literacy Financially Illiterate 195 37.3
Financially Literate 328 62.7
Total 523 100
Years of Experience in Market
1 to 5 Years 260 49.7
5 to 10 Years 234 44.7
> 10 Years 29 5.5
Total 523 100 Table 1: Sample Profile
ANALYSIS & INTERPRETATION The recency effect was observed significant in different age groups. It was prominent in the age group of 48-
58 years of investor’s age followed by the age group of 30-38 years of age group. On the other hand, a firm recently proposed measurement, the restricted probability for recollect given recognition, yielded significant age differences in all situations. Above and beyond, the restricted likelihood shows the aging changes usually found in the serial position curve i.e., decline of the primacy effect whereas, upholding of the recency effect. Investors were remembering the more recent information relating to stocks and making decisions on the basis of the recently floated news in the market.

45
International Journal of Research in Management & Social Science Volume 5, Issue 3 (IV): July - September, 2017
ISSN 2322 - 0899
The recency effect was not observed significant among males and females and on different group of novice and experienced investors as p-value is not significant at 95% level of confidence. Males and females score was almost same thus; recency effect was indifferent among them. Similarly, the investors who were financially literate and illiterate observed unresponsive for recency effect statistically but theoretically the mean value of the financially literate investors was high as compare to financially illiterate ones. Those who were having sound knowledge of markets were theoretically noted as more inclined for recency effect.
The recency effect was prominent in different group of investors in connection with years of experience in the market. This is interesting to observe that people who were having more experience in the market were more inclined for recency effect.
CONCLUSION AND FURTHER SCOPE OF STUDY The demographic study on investors of Jaipur City in relation with recency bias accepted the similar null hypotheses (H2 and H3) for gender and financial literacy. The null hypotheses were rejected for (H1 and H4) and alternative hypotheses were accepted. It can be concluded that there is recency effect was observed in different age group people and on those who were having experience of trading in stock market. The trouble free way of overcoming the recency effect is to have a check on long term performance whether it is a matter of selection of stock or a mutual fund. It helps investor to gain the correct outlook based on facts rather than dominated by recent happenings. Further, experimental live study can be done using different statistical tools on stock market investors whether they are biased for recent information floated or use their cognitive mind for making the decisions.
WORK CITED Carl Richards. (2012, February 13). Tomorrow’s Market Probably Won’t Look Anything Like Today.
Retrieved from http://bucks.blogs.nytimes.com/: http://bucks.blogs.nytimes.com/2012/02/13/tomorrows-market-probably-wont-look-anything-like-today/?_php=true&_type=blogs&_r=0
Greg Barron and Ido Erev. (2003). Small Feedback-based Decisions and Their Limited Correspondence to Description-based Decisions. Journal of Behavioral Decision Making, (16), 215-233.
Hogarth, R. &. (1992). . Order effects in belief updating: The belief-adjustment model. Cognitive Psychology , 24, pp. 1-55.
Jorg Rieskamp. (2006). Positive and Negative Recency Effects in Retirement Savings Decisions. Journal of Experimental Psychology: Applied , 12 (4), 233-250.
Kroll, Y., Levy, H., & Rapoport, A. (1988). Experiment tests of the separation theorem and the capital asset pricing model. American Economic Review (78), 500-519.
Leider, G. B. (2010). The role of experience in the Gambler's Fallacy. Behavioral Decision Making , 23 (1), 117-129.
Liza Alvia and Dedhy Sulistiawan. (n.d.). The Impact of Cognitive Style to Recency Effect in Stock Investment: An Experimental Study. 1-11.
Michael M. Pompian. (2011). Recency Bias. In M. M. Pompian, Behavioral Finance and Wealth Management : how to build optimal portfolios that account for investor biases (Vol. 667, pp. 216-226). John Wiley & Sons.
Ralph Hertwig, G. B. (2004). Decisions From Experience and the Effect of Rare Events in Risky Choice. American Psychological Society , 15 (8), pp. 534-539.
Smith. (2012, March 6). Is the stock market undervalued? History says “Yes”. 1-6.
Supriyadi, D. S. (2013, January 30). Can group discussion mitigate recency bias on stock investment decision making? Soccial Science Research Network .
Vivek Kaul. (2011, June 6). How to overcome recency effects of a short-term bias. Retrieved from economictimes.indiatimes.com: http://articles.economictimes.indiatimes.com/2011-06-06/news/29625892_1_bias-silver-prices-effect

46
International Journal of Research in Management & Social Science Volume 5, Issue 3 (IV): July - September, 2017
ISSN 2322 - 0899
Appendix Recency Effect & Age
Descriptive Recency Effect
& Age
N Mean Std.
Deviation Std. Error
95% Confidence Interval for Mean
Minimum Maximum Lower Bound Upper Bound 1 291 4.94 1.640 .096 4.75 5.13 0 10 2 189 5.30 1.656 .120 5.06 5.54 1 10 3 32 4.86 2.050 .362 4.12 5.60 0 8 4 8 5.53 1.411 .499 4.35 6.71 4 8 6 3 2.50 .000 .000 2.50 2.50 2 2
Total 523 5.06 1.682 .074 4.91 5.20 0 10 Output Table 1.1
ANOVA
Recency Effect & Age
Sum of Squares df Mean Square F Sig. Between Groups 37.597 4 9.399 3.382 .010 Within Groups 1439.816 518 2.780
Total 1477.413 522 Output Table 1.2
Recency Effect & Gender Descriptive
Recency Effect & Gender
N Mean Std. Deviation Std. Error
95% Confidence Interval for Mean
Minimum Maximum Lower Bound Upper Bound 1 327 5.00 1.731 .096 4.81 5.19 0 10 2 196 5.15 1.599 .114 4.93 5.38 1 9
Total 523 5.06 1.682 .074 4.91 5.20 0 10 Output Table 1.3
ANOVA
Recency Effect & Gender
Sum of Squares df Mean Square F Sig.
Between Groups 2.833 1 2.833 1.001 .318 Within Groups 1474.580 521 2.830
Total 1477.413 522 Output Table 1.4

47
International Journal of Research in Management & Social Science Volume 5, Issue 3 (IV): July - September, 2017
ISSN 2322 - 0899
Recency Effect & Financial Literacy Descriptive
Recency Effect & Financial Literacy
N Mean Std. Deviation Std. Error
95% Confidence Interval for Mean
Minimum Maximum Lower Bound Upper Bound 0 195 5.13 1.598 .114 4.91 5.36 1 9
1 328 5.02 1.731 .096 4.83 5.20 0 10
Total 523 5.06 1.682 .074 4.91 5.20 0 10 Output Table 1.5
ANOVA
Recency Effect & Financial Literacy
Sum of Squares df Mean Square F Sig. Between Groups 1.589 1 1.589 .561 .454 Within Groups 1475.823 521 2.833
Total 1477.413 522 Output Table 1.6
Recency Effect & Years of Experience in Market Descriptive
Recency Effect & Years of
Experience in Market
N Mean Std. Deviation Std. Error
95% Confidence Interval for Mean
Minimum Maximum Lower Bound Upper Bound 1 260 4.73 1.680 .104 4.53 4.94 0 10 2 234 5.39 1.581 .103 5.19 5.60 0 9 3 29 5.29 1.975 .367 4.54 6.04 2 8
Total 523 5.06 1.682 .074 4.91 5.20 0 10 Output Table 1.7
ANOVA Recency Effect &
Years of Experience in
Market
Sum of Squares df Mean Square F Sig. Between Groups 55.073 2 27.537 10.067 .000 Within Groups 1422.340 520 2.735
Total 1477.413 522 Output Table 1.8

48
International Journal of Research in Management & Social Science Volume 5, Issue 3 (IV): July - September, 2017
ISSN 2322 - 0899
UNIT LINKED INSURANCE PLANS – AN APT ASSET VEHICLE FOR GROWTH
Shilpa R. Kankonkar Research Scholar, Tilak Maharastra University, Pune
ABSTRACT The present study is to highlight that unit linked insurance plans is the most suitable investment avenue for common person. The study is an attempt to investigate about the popularity of unit linked insurance plans investments in the present scenario. The paper consisted of 281 usable samples of unit linked insurance plan investors through online questionnaire. The variables were measured on five point Likert-type scales which starts from 1 = strongly disagree to 5 = strongly agree. The selected method of data analysis included descriptive analysis, reliability and validity analysis, percentage, and regression analysis to test the validity, reliability and research hypotheses with the help of Statistical Package for the Social Science (SPSS version 17.0). The study found that popularity of unit linked insurance plans has been increasing in today’s market. This paper suggested that unit linked insurance plans are the most suitable investment avenue for common person due to high returns with low risks, portfolio diversification investment scheme, tax benefits, rating of funds by renowned agencies, and some other factors. This study would help to the life insurance companies and their managers to design innovative products and services according to the needs of the investors. This will also help in developing and expanding knowledge in the field of unit linked insurance plans investment and planning.
Keywords: Unit linked insurance plans, investor, investment.
INTRODUCTION Creation of wealth is the primary objective of investors. There are a number of investment opportunities all around the investor to achieve his objective such as bank deposits, company deposits, equities bonds, life insurance policies, small savings schemes and unit linked insurance plans products etc. which create wealth and which in a way compete among themselves for the choice of the investor. Different investment instruments have different qualities-return, risk, safety, convenience etc. The investor is faced with the problem of asset allocation, that is, how to build his portfolio of financial assets. Investment game, though fascinating, is a highly complex and complicated one. The investor has to match the product qualities with his financial needs and personal circumstances. He has to invest not in one or two but in a basket of financial products. The product qualities and personal circumstances of the investor change quite often, and uncertainty add a new dimension to the investment puzzle.
Financial Market investment has become a trend with the households in India. But the growing volatility in the stock market has made the investors to ponder deeply while investing in the stock market. No doubt stock market investment is a profitable option but choosing a right stock for investment is a very difficult task. Not all the investors in the market may have the required skill sets of picking up right stocks at right time. Due to which an investor can face losses from the investment but if they will put their money into unit linked insurance plans then the losses can be mitigated. Life insurance can be described as an investment vehicle pools the savings and invests those savings into selected stocks. It helps the investors in minimizing the risk and maximizing the return of their investment. The study has formulated following objectives: 1. To analyze about the popularity of unit linked insurance plans investments at present scenario.
2. To study that unit linked insurance plans is the most suitable investment avenue for any person.
LITERATURE REVIEW AND HYPOTHESIS DEVELOPMENT As the life insurance industry has developed rapidly over the past 20 years, a large number of studies have been conducted and covered different aspects of Unit linked insurance plans. Singh (2012) conducted an empirical study of Indian investors and observed that most of the respondents do not have much awareness about the various function of unit linked insurance plans and they are bit confused regarding investment in unit linked insurance plans. The study found that some demographic factors like gender, income and level of education have their significant impact over the attitude towards unit linked insurance plans. On the contrary age and occupation have not been found influencing the investor’s attitude. The study noticed that return potential and liquidity have been perceived to be most lucrative benefits of investment in unit linked insurance plans and the same are followed by flexibility, transparency and affordability. Saini et., al. (2011) analyzed investor’s behavior, investors’ opinion and perception relating to various issues like type of unit linked insurance plans scheme, its objective, role of financial advisors / brokers, sources of information, deficiencies in the provision

49
International Journal of Research in Management & Social Science Volume 5, Issue 3 (IV): July - September, 2017
ISSN 2322 - 0899
of services, investors’ opinion relating to factors that attract them to invest in mutual and challenges before the Indian life insurance industry etc. The study found that investors seek for liquidity, simplicity in offer documents, online trading, regular updates through SMS and stringent follow up of provisions laid by AMFI. Samal (2009) did a study entitled “The Factors Affecting investors preference for unit linked insurance plans in India”, stressed the various factors that influenced the fund/scheme selection behaviour of Retail Investors who invest in unit linked insurance plans. The investors look for safety first in MF products, followed by good returns, tax Benefits, liquidity and capital appreciation. The survey further reveals that the scheme selection decision is made by respondents on their own, and the other sources influencing their selection decision are News papers and Magazines, Brokers and Agents, Television, Friends suggestions and direct mail. It also provides a comparative analysis between different types of unit linked insurance plans in India and between unit linked insurance plans and other investment products. Rajeswari and Ramamurthy (2005) did “An Empirical Study on factors influencing the Mutual Fund/Scheme selection by retail investors”. It reveals that MF is a retail product designed to target small investors, salaried people and others who are intimidated by the mysteries of stock market but, nevertheless, like to reap the benefits of stock market investing. The survey reveals that the most preferred investment vehicle is Bank Deposits, with MFs ranking fourth in the order among 8 choices. Growth schemes are ranked first, followed by Income Schemes and Balanced Schemes. Based on the duration of operation of schemes, the first preference is for open-ended schemes (84.57%) and only 15.43% of the respondents favor close-ended schemes. The investors look for safety first in MF products, followed by good returns, Tax Benefits, liquidity and capital appreciation. The survey further reveals that the scheme selection decision is made by respondents on their own, and the other sources influencing their selection decision are News papers and Magazines, Brokers and Agents, Television, Friends suggestions and Direct Mail in that order. The survey was conducted among 350 Life insurance Investors in 10 urban and Semi-urban centers to study the factors influencing the fund/scheme selection behaviour of Retail Investors. Thus, we purpose the following hypothesis:
H1: Popularity of the unit linked insurance plans product unit linked policies has been increased in today’s market.
H01: Popularity of the unit linked insurance plans industry has not been increased in today’s market.
H2: unit linked insurance plans is the most suitable investment for the common persons who invest their savings at regular interval.
H02: unit linked insurance plans is not the most suitable investment for the common persons who invest their savings at regular interval.
METHODOLOGY MEASUREMENT INSTRUMENT A preliminary version of the questionnaire was developed in English on the basis of insights from in-depth qualitative interviews with experts and life insurance investors. A pilot survey was conducted in Bhopal with 40 respondents for customers’ questionnaire. After pilot survey some minor adjustment were made to the questionnaires based on feedback. The final questionnaires for both consisted of three sections. In the first section, questions were related to unit linked insurance plans and about their unit linked insurance plans companies. The second section contained questions regarding demographic characteristics of the respondents such as gender, age, education, profession, marital status, monthly income and savings, number of dependents in your family, and name of preferred unit linked insurance plans investment scheme and its company name. In the last, respondents were asked about their invested unit linked insurance plans scheme(s), company name, time horizon and source of information about that fund. The final set of 25 items of customers’ survey instrument was developed based on an extensive review of literature and studied definitions. All items in section one for both survey instruments were put on a five-point Likert scale from strongly disagree (1) to strongly agree (5). Participants were asked to indicate their level of agreement with each statement.
SAMPLING DESIGN AND DATA COLLECTION The present study applies descriptive as well as an empirical research design based on the survey method. The unit linked insurance plans investors’ data were accomplished through online convenience sample survey of four cities from Maharastra (table I). The primary data have been collected from customers of the different life insurance companies through a well-structured questionnaire separately consisting of multiple option questions related to the objectives of the study (as shown in table II). The final set of 25 items of customers’ survey instrument was developed based on an extensive review of literature and studied definitions. 296 respondents filled up the questionnaire online within the months of January – July, 2014. Total of 296 questionnaires were

50
International Journal of Research in Management & Social Science Volume 5, Issue 3 (IV): July - September, 2017
ISSN 2322 - 0899
received out of which 281 were found to be completely and accurately filled, the rest 15 were discarded due to incomplete information.
Table I: The details of sample size
Table II: Preferred Life insurance Companies
Company Name Frequency (N = 281)
Percentage
Life Insurance Company of India 104 37.01 SBI Life insurance Co Ltd. 73 25.9 ICICI Prudential life insurance company 54 19.2 HDFC Life insurance Co Ltd 32 11.3 Reliance life insurance Co Ltd 18 6.4
DATA ANALYSIS AND PRESENTATION DEMOGRAPHIC INFORMATION The detailed respondent characteristics are presented in table III.
Table III: Profile of Life insurance Investors
VALIDITY AND RELIABILITY The content validity of survey instrument was evaluated by using a panel of experts. In order to ensure the reliability of the construct of scales, Cronbach’s alpha was employed. The calculated value of Cronbach’s alpha (overall) for the investors’ data was 0.742 which was higher than 0.7 indicates strong internal consistency; it means that the data are more reliable (Brown, 2002).
Demographic Characteristics
Data Frequency (N = 281) Percentage
Gender Male 185 65.8 Female 96 34.1 Age Below 20 47 16.7 21 – 30 68 24.1 31 – 40 89 31.6 41 – 50 54 19.2 51 & Above 23 8.1 Marital Status Married 158 56.2 Unmarried 123 43.7 Education Undergraduate 68 24.1 Graduate 95 33.8 Postgraduate 80 28.4 Doctorate 38 13.5 Occupation Govt. Employee 27 9.6 Private Employee 98 34.8 Self-employed 62 22.06 Professional 51 18.1 Businessman 43 15.3 Monthly Income Below Rs. 20,000 56 19.9 21,000 – 30,000 102 36.2 31,000 – 40,000 78 27.7 41,000 & Above 45 16.01 Monthly Savings Below Rs. 5,000 41 14.5 6,000 – 15,000 78 27.7 16,000 – 25,000 86 30.6 26,000 & Above 76 27.04

51
International Journal of Research in Management & Social Science Volume 5, Issue 3 (IV): July - September, 2017
ISSN 2322 - 0899
DESCRIPTIVE ANALYSIS The study applied descriptive statistics to analyze the samples’ characteristics. The study identified 16 variables as an attributes of unit linked insurance plans products and services which have taken in investors’ survey instrument from the evidence of the earlier research studies and discussions with experts in the life insurance industry. The table IV depicts the detailed descriptive analysis of study constructs.
Table IV: Descriptive Analysis of Investors’ Survey Instrument Variables Mean Standard Deviation Rank
Reputation or goodwill of the life insurance company 3.9 1.14 5 Past performance of the company’s ULIP funds 3.8 1.27 6 ULIP Fund liquidity 3.0 1.09 13 High returns with low risks 4.3 0.78 1 The company’s portfolio diversification investment scheme 4.2 0.87 2 Low fund management charges 2.9 1.51 14 Easy transferability 3.1 1.36 12 Convenience of reinvestment 2.8 1.40 15 Tax benefits on surrender value of policy 4.0 1.27 3 The company’s funds loan facility 3.2 1.20 11 Rated by renowned research agencies like CRISIL. 4.1 1.10 4 Time horizon of Life Insurance investment suits you 3.3 1.29 10 Enables online services attached with ULIP funds 2.7 1.64 16 Effectively promoted 3.6 1.20 7 Informed by the firm’s employee efficiently 3.5 1.36 8 Investment in regular interval 3.4 1.11 9
The fund preferences of unit linked insurance plans consumers mostly depend on the fund’s yielding of high returns with low risks. The company’s portfolio diversification investment scheme of the funds is in second rank in study. Consumers of unit linked insurance plans considered the tax benefits of funds which are in third rank. The preference of the fund schemes was also depend on the rating of funds by a renowned research agency. It is followed by the reputation or goodwill of the life insurance company and their past performance of the fund schemes. If the fund schemes are effectively promoted by the firms and efficiently informed by the firm’s employees to customers, it impacts the consumer purchasing decision making process of unit linked insurance plans as shown in the study. Then the consumer preferences of funds depend on the investment in its regular interval schemes and time horizon of investment. The company’s funds loan facility, easy transferability, fund liquidity, and low entry load policy of the fund schemes were preferred in the study analysis. The convenience of reinvestment in the fund schemes was the next factor that considered by the consumers and ranked fifteen in the study. The online services attached with life insurance investment was also the concerning factor by life insurance investors.
TESTING OF HYPOTHESES The regression analysis was conducted through SPSS version 16.0 and the significance of the coefficients and t-values were examined in order to accept or reject the hypotheses. Table V represents the regression estimation for popularity of the life insurance industry has been increased in today’s market. The study considered fund liquidity (7), high returns with low risks (8), the company’s portfolio diversification investment scheme (9), low entry load (10), easy transferability (11), tax benefits (13), and free exit load (15) as independent variables and preference of unit linked insurance plans investment (1) as a dependent variable from the survey questionnaire. The numbers in brackets denote the question’s coding in investor’s survey instrument. Among the seven considered components of popularity of unit linked insurance plans scheme as independent variables, easy transferability (Beta = .515) and low entry load (Beta = .301) has the larger impact on popularity of unit linked insurance plans investment and then followed by the company’s portfolio diversification investment scheme and fund liquidity with the beta values of .131 and .090 respectively.
Table V: Regression Estimation for Popularity of the Life insurance Industry Independent Variables Standardized Coefficients (Beta) t-value Sig.
Constant 15.576 .000 Fund liquidity (7) .070 High returns with low risks (8) -.109 The company’s portfolio diversification .121

52
International Journal of Research in Management & Social Science Volume 5, Issue 3 (IV): July - September, 2017
ISSN 2322 - 0899
investment scheme (9) Low entry load (10) .201 Easy transferability (11) .545 Tax benefits (13) -.257 Free exit load (15) -.263
Note: *Dependent variable: Preference of unit linked insurance plans investment (1)
The statement is statistically significant (t-value = 15.576, p < 0.01). Therefore, we reject the alternative hypothesis.
The second null hypothesis of the study states that unit linked insurance plans is the most suitable investment for the common persons who invest their savings at regular interval. Here, the study considered convenience of reinvestment (12) and time horizon of investment suits you (20) as independent variables and investment in regular interval (25) as a dependent variable.
Table VI: Regression Estimation for Suitability of unit linked insurance plans Investment for the Common Persons
Independent Variables Standardized Coefficients (Beta) t-value Sig.
Constant 14.954 .000 Convenience of reinvestment (12) .321 Time horizon of investment suits you (20) -.285
Note: *Dependent variable: Investment in regular interval (25)
As shown in table VI based on regression estimation, the t-value (14.954) is significant for p < 0.01. Therefore, we reject the alternative hypothesis.
CONCLUSION The present study applied descriptive as well as an empirical research design based on the survey method. The study primarily depended on the 281 usable data from investors through a structured questionnaire. The study also revealed some important factors which are important to understand the investor preference factors about unit linked insurance plans investment schemes. The preferred life insurance companies by the respondents were also analyzed and found that the majority of respondents were the investors of unit linked insurance plans of life insurance company of India and followed by SBI Life Insurance Company and then HDFC life insurance co ltd.The results of testing of hypotheses of the study indicated that popularity of the life insurance industry has been increased in today’s market as well as unit linked insurance plans is the most suitable investment for the common person who invests their savings at regular interval. The study will help investment firms to advise their investors regarding investments in various unit linked insurance plans. The study would also be helpful to the financial organisations to understand the need of life insurance investors so that more options for them can be designed accordingly.
REFERENCES Brown, J.D. (2002). The Cronbach alpha reliability estimate. JALT Testing & Evaluation SIG Newsletter.
Panda, B., and Moharana, S. (2014). Equity mid-cap unit linked insurance plans: risk and return analysis. Anvesha The Journal of Management, 7(3), 45-52
Rajeswari, T.R., and Ramamoorthy, V.E. (2005). An empirical study on factors influencing the mutual fund/scheme selection by retail investors. Proceedings from LIFE INSURANCE COMPANY OF INDIA national seminar.
Saini, S., Anjum, B., and Saini, R. (2011). Investors’ awareness and perception about mutual funds. Zenith International Journal of Multidisciplinary Research, 1(1), 14-29.
Samal, N. (2009). The Factors affecting investors preference for mutual funds in India, retrieved from http://www.ripublication.com /gjfm.htm
Singh, B.K. (2012). A study on investors’ attitude towards mutual funds as an investment option. International Journal of Research in Management, 2(2), 61-70.
Avadhani, V.A., ‘Marketing of Financial Services’, Himalaya Publishing House, Mumbai, 2008.
Balachandran, S., ‘Customer Driven Services Management’, Response Books (A Division of Sage Publications), New Delhi, 2001.

53
International Journal of Research in Management & Social Science Volume 5, Issue 3 (IV): July - September, 2017
ISSN 2322 - 0899
Balsubramaniam, T.S and Gupta, S.P., ‘Insurance Business Environment’, IC-12, Insurance Institute of India, Mumbai, 2000.
Bhole, L.M. and Jitendra Mahakud, ‘Financial Institutions and Markets –Structure, Growth and Innovations’, Tata McGraw Hill Education Private Limited, New Delhi, 2010.
Charles P.Jones, ‘Investments Analysis and Management’, John Wiley & Sons (Asia) Private Limited, Singapore, 2002.
Government of India, ‘Handbook of Industrial Policy and Statistics’, New Delhi, 2001.
Greene Mark R. and Serbein Oscar N., ‘Risk Management: Text and Cases’Reston Publishing Company, Reston, Virginia, 1978.
Gupta P.K., ‘Insurance and Risk Management’, Himalya Publishing House,Mumbai, 2008.
Harrington and Niehans, ‘Risk Management and Insurance’, Tata McGraw Hill Publishing House Limited, New Delhi, 2004.
Inderjit Singh, Rakesh Kalyal, Surjit Kaur and Sanjay Arora, ‘Insurance and Risk Management’, Kalyani Publishers, Ludhiana, 2009.
Indian Institute of Banking and Finance, ‘Risk Management’, Macmillan India Limited, New Delhi, 2008.
Jha, S.M., ‘Services Marketing’, Himalaya Publishing House, Mumbai, 2005.
John C.Hull, ‘Risk Management and Financial Institutions’, Pearson Educaiton Inc., Delhi, 2007.
Justin Paul and Padmatha Suresh, ‘Management of Banking and Financial Services’, Pearson Education, New Delhi, 2007.
Jyotsna Sethi and Nishwan Bhatia, ‘Elements of Banking and Insurance’, Prentice-Hall of India Private Limited, New Delhi, 2007.
Kotreshwar, G., ‘Risk Management (Insurance and Derivates)’, Himalaya Publishing House, Mumbai, 2009.
Krishna Swami G., ‘Principles and Practice of Life Insurance’, Excel Books, New Delhi, 2009
54
International Journal of Research in Management & Social Science Volume 5, Issue 3 (IV): July - September, 2017
ISSN 2322 - 0899
IMPACT OF PRIVATISATION AND IRDAI ON LIFE INSURANCE CORPORATION OF INDIA
Shridevi Naganath Chandane Research Scholar, Solapur University, Solapur
ABSTRACT In 1956, Nationalization of insurance business was a major milestone in the development of insurance business in India by taking 245 private insurers business. The Indian insurance market was thrown open to private Life Insurance Companies in the year 1999 and the Insurance Regulatory and Development Authority (IRDAI) was establish to regulate the insurance market. After its opening, the insurance sector has the entry of a number of private life insurance companies who captured a significant market shares in the life insurance market. The public sector company Life Insurance Corporation of India have to leverage upon their strengths to give a tough flight to the private companies. The Insurance industries in India now have been shape in a big way especially after privatization and introduction of Insurance Regulatory & Development Authority (IRDAI). Life Insurance Corporation of India is the most significant public sector, which sells its product in significant way. However, since last few years it is facing tremendous competition as many private life Insurance Companies have entered. Before 1999, it remained a monopoly; Government of India decided to adopt structural change in the insurance sector and took steps to allow this sector for private comings. This study is an attempt to throw light on Impact of Privatisation and IRDAI on Life Insurance Corporation of India.
Keywords: Nationalization, privatization, Market share, Premium, Policies, Monopoly.)
INTRODUCTION Life Insurance concerns with the people lives. Life insurance is basing on different experiences and realities of Human life. Life insurance is an arrangement through which a man can plan for the continuation of an income if, death disability or old age destroys his ability to earn a living. Life Insurance in its generic meaning used to include all forms of Insurance designed to protect against loss of income arising from inability to work, whether this is cause by death, accidental injury, sickness or old age. In its narrow or specific meaning life, insurance implies protection in the event of death only .there is no doubt that almost everybody needs insurance. Insurance is a contract whereby the insurer under takes to pay a fixed amount on the happing of a certain event in return for price known as premium. Thus in this sale transaction the customer –the insured have to pay a price fixed by the seller the insurer-for an intangible commodity called protection. Life Insurance Means payment of a certain sum on the happening of an event say death, which is uncertain in consideration of a small amount of premium.
DEFINITIONS OF LIFE INSURANCE “A Life Insurance Policy Promises that the insurer will pay to the policyholder a certain sum of money if the
person insured dies or any other specified contingency happens.”
J.H. Magee “The life insurance contract embodies an agreement in which broadly stated, the insurer undertakes to pay a stipulated sum upon the death of the insured, or at some designated time to a designated beneficiary.”
OBJECTIVES OF THE STUDY To study impact of privatisation on life insurance corporation of India.
To Study role of life insurance Corporation of India after Privatisation.
To Study the Role of IRDAI.
RESEARCH METHODOLOGY The paper is completely a conceptual one whose foundation comes from various secondary sources like research articles in Journal, published and unpublished scholarly papers, and books, various international and local journals, speeches, newspapers and websites. The analysis part of the paper is on the statistical data provided by life Insurance Corporation of India and IRDAI.
SIGNIFICANCE OF THE STUDY The study has been conduct to review the Formation process and Organisational Structure of Life Insurance Corporation of India. Insurance sector has shown a phenomenal growth after its Privatisation and it has increased after the private sectors entry. Insurance sector in India is the most trusted sector and insured Indians lives to protect them from the uncertainties and sudden disasters. Insurance sector is working in all the facets of human life.

55
International Journal of Research in Management & Social Science Volume 5, Issue 3 (IV): July - September, 2017
ISSN 2322 - 0899
Life Insurance Corporation of India is the most significant public sector, which sells its product in significant way. However, since last few years it is facing tremendous competition as many private life Insurance Companies have entered.
FORMATION OF LIFE INSURANCE CORPORATION OF INDIA The nationalisation of life insurance was one of the most important socio-economic measure taken in the first decade of our freedom. The life Insurance Corporation of India is establish in 1956 when the parliament of India passed the life insurance of India passed the life insurance of India Act that nationalised the private insurance industry in India. Over 245 companies and provident societies were merge to create the state owned life insurance company. Thus, the Life insurance industry was nationalised in the year 1956 and the “Life insurance corporation of India” come in to existence on the 1 sept 1956.To remember this historic event Insurance week is celebrated from 1 to 7 September every year. The objectives of Nationalisation were define as conducting the business with utmost economy in true sense trusteeship to charge premium no higher than narrated by strict actuarial consideration and to invest the fund for obtaining maximum yield consistent with safely of capital render prompt and efficient services to the policyholders etc. The mission given to life Insurance corporation of India at that time can be summarised. 1. Providing Protection of insurance to people in every nook and corner of the county.
2. Mobilizing savings for the development of country.
3. Responding to customer sensitivity.
PRIVATISATION OF LIFE INSURANCE SECTOR Privatisation is business, industry or service from public to private ownership and control. LIC was monopoly in Life insurance sector until 2000.the decision by IRDA to grant licence to private players in life insurance is expect to increase the insurance business in India. The insurance sector in India now have shaped in a big way after privatisation and introduction of IRDAI.
Table No.1: Registered Insurance In India (As on March 2015) Types of Business Public Sector Private Sector Total
Life Insurance 1 23 24
At the end of March 2015, there are 53 insurance companies operating in India; of which 24 are in the life insurance business and 28 are in non-life insurance business. In Life Insurance Sector LIC Is Public Sector and Other 23 are in Private Sector.
MARKET SHARE OF LIFE INSURANCE BASED ON TOTAL PREMIUM Following Table Shows the Market share of life Insurance Based on Total premium. Total Premium of the LIC Increased Every Year after Privatisation.
Table No.2: Market share based on Total premium 2008-9 To 2013-14 (In percentage) Name of Insurer 2009-10 2010-11 2011-2012 2012-2013 2013-2014
LIC 70.10 69.78 70.68 72.70 75.39 Private Companies 29.90 30.22 29.32 27.30 24.61 Total 100 100 100 100 100
Source : IRDA Annual Report 2009-10 to 2013-14
Graph No.1

56
International Journal of Research in Management & Social Science Volume 5, Issue 3 (IV): July - September, 2017
ISSN 2322 - 0899
On the basis of total premium income, the market share of LIC declined marginally from 70.10%in2009-10 to 69.78% in 2010-11.Accordingly the market share of private insurers has gone up marginally from 29.90%in 2009-10to 30.22%in 2010-11.
In 2011-12 market share increased 70.68% and in 2012-13 market share, increased 72.70% accordingly the market share of private insurers has declined marginally from 29.32%in 2011-12 to 27.30%in 2012-13.
Market share of LIC increased from 72.70% in 2012-13 to 75.39 % in 2013-14. Accordingly, the market share of private insurers has declined from 27.30 %in 2012-13 to 24.61 per cent in 2013-14
9.0 IRDAI (INSURANCE REGULATORY DEVELOPMENT AUTHORITY OF INDIA) The Insurance Regulatory and development Authority of India is an autonomous statutory agency tasked with regulating and promoting the insurance and reinsurance industries in India. The Insurance Regulatory and development Act 1999, an act of parliament passed by the government of India, constituted it. The agencies headquarter are in Hyderabad. The IRDA attempted to raise the foreign direct investment limit in the insurance sector to 49%from its current 26%.
MISSION OF IRDAI To Protect the Interest of the policyholders to regulate, promote and ensure orderly growth of the insurance industry and matters connected there with or incidental thereto.”
The IRDAI can frame rules and laws pertaining to numerous matters like fees with special reference to registration of insurers, methods of suspension or cancellation of registration, methods and procedure of disinvesting excess share capital, time associated manner of investment of assets control by a no depository financial institution etc.
IMPACT PRIVATISATION ON LIFE INSURANCE CORPORATION OF INDIA 1. Life Insurance Corporation of India is growing rapidly ever since the sector opened up for the private
sector.
2. The total Life Insurance Market can be judged in term of 2 parameters-premium collected and number of new policies underwritten.it can be seen that LICs market share in premium collected and number of policies is more than 70%of total life insurance sector.

57
International Journal of Research in Management & Social Science Volume 5, Issue 3 (IV): July - September, 2017
ISSN 2322 - 0899
3. LIC as a dominant player has gained an increase of 88% in new business premium income despite of uncertain environment.
4. LIC has huge investment and financial strength. Owing its bigger size.it has the best advantage of pricing as well as getting better investment returns, which can subsidies its original life insurance product.
5. The private companies have been in the market for last 16 years but could not bring a big change in the market share of life insurance. LIC is still big player in the Life insurance sector.
6. LIC enjoys the dominance because benefits sovereign guarantee but this definitely helps them to grow their market size. Because of the faith of the people on LIC being a state owned enterprise.
7. LIC introduced many phenomenal business strategies by way of offering colourful schemes and products the reason for these kinds of extra ordinary effect was only competition.
8. LIC of India has the powerful network, human resource and it is launching attractive advertisement in the regular interval to create great awareness among the public. The private insurance companies are also taking efforts to cover up the major populations under their boundry.this healthy competition motivates the public to go in favour of more investment in insurance.
9. At the initial stage of privatisation, the public appreciated the professional approach of private life insurance companies but private companies have more profit in the insurance business without much consideration for the genuine interest of policyholders, which trigger negative feelings about towards the policyholders.
10. LIC is transform itself to meet the demands of the changing times by making creative use of its Manpower and infrastructure.
11. LIC of India has the powerful network, human resource and it is launching attractive advertisements in the regular interval to create great awareness among the public. The private life insurance companies are also taking much pain to cover-up the major populations under their boundary. This healthy competition motivates the public to go in favour of more investments in insurance.
12. LIC has started Alternate channels to facilitate the customer to pay the premium anywhere in the country. The Alternate channels Include Standing Instructions to bank, debit/credit cards, Net Banking facility through car or cheque by walking in to a collection Centre of bank.
13. The study found that there is no monopoly after the privatisation of insurance sector. However, LIC continue to remain the largest player in the Indian life insurance sector with 70%of market share.
14. LICs life fund valuation, surplus and share of central government are growing consistently every year after privatisation.
15. Good Corporate governance is an integral part of the philosophy of LICs business conduct. After privatisation, LIC led to committed organisational focus on the customer service, which in turn has contributed to good growth in business.
CONCLUSION Changing scenario for the insurance sector there is going to be good opportunity for life insurance sector to expand its market base. With the increased level of advertising budgets. Insurance now a days have grater reach to almost every nook and corner of the country. The Indian insurance market is maturing but in its own unique way .the, challenges and opportunities for life insurance companies would be devise innovative products that satisfy the need of a young and aspirational population for protection that comes at not too high a price and assured a regular income in times. Privatisation of Life insurance sector eliminated the monopolistic business of life insurance Corporation of India. LIC is sole concern prior to implementation of privatisation after privatisation LICs market share reduced but still the LIC is big player in the life insurance sector.
REFERENCES 1. Summinder K.Bawa “Life Insurance Corporation of India Impact of Privatization and performance” Regal
Publication New Delhi (2007)
2. Sajid Ali, Riyaz Mohhamad, Mansharique Ahmed (2007), “Insurance in India”, Regal Publications, New Delhi.
3. Karam Pal, B.S.Bodla, M.C.Garg (2007) “Insurance Management – Principles and Practices”. Deep & Deep Publications Pvt. Ltd., New Delhi.

58
International Journal of Research in Management & Social Science Volume 5, Issue 3 (IV): July - September, 2017
ISSN 2322 - 0899
4. Santosh K.Choudhary and Kishor G Kulkarni(1991)”Role of the Life Insurance Corporation In Economic Development of India” Himalaya Publishing House New Delhi
5. K. Ravichandran (2007) “Recent Trends in Insurance Sector in India”, Abijeet Publications, Delhi
6. Kothari C.R”Research Methodology, Methods and Techniques” Wishwa Prakashan New Delhi (2004).
7. Gupta S.P. (1982). “Statistical Methods”, Sultan Chand & Sons, Delhi
8. Chandarana, Harish M. (2008) “Performance Evaluation of Life Insurance Corporation of India”, thesis PhD, Saurashtra University
9. “Yogakshema” Published by Life Insurance Corporation of India
10. 50th Chairman’s “Review Working Result” (2006-7)
11. Annual Reports of Life Insurance Corporation of India(2009-10 to 2013-14)
12. Annual Reports of Insurance Regulatory and Development Authority(2009-10 to 2013-14)
13. Insurance Regulatory and Development Authority (IRDA) Journals
14. LIC Diaries(2009-10 to 2013-14)
15. www.licindia.com
16. www.irda.org
17. www.insuranceinstituteofindia.com
18. www.bimaonline.com

59
International Journal of Research in Management & Social Science Volume 5, Issue 3 (IV): July - September, 2017
ISSN 2322 - 0899
DOMESTIC POLITICS IN INDIA’S FOREIGN POLICY
Swastika Pradhan Assistant Professor, Sikkim University, Gangtok
ABSTRACT India’s foreign policy has undergone changes from being an idealist to a realist to being a pragmatic. Along with these changes there has also been a change in the attitude of the government towards the state where states have been viewed as a party to the foreign policy initiatives of the nation. India’s federal structure acts as an important factor that conditions the foreign policy of the country. However it is not the only factor as along with the federal structures there is also the factor of domestic politics which tends to shape and influence the policy. The emergence of Coalition politics have brought to fore the significance of the regional politics and thereby the factor of domestic politics. The sharing of the international border makes the role of the states even more vital in determining the policy of a nation where internal factors comes into being. The factor of domestic politics in foreign policy consideration can be highlighted in the case of India and Bangladesh with regard to the Teesta issue where the internal factor has halted the developments between the two countries. The inability of both the nations to conclude a water sharing treaty on the Teesta has brought to fore the ineffectiveness of the Indian government to make the State government comply. Infact if we look at the case of Teesta the factor of domestic politics particularly the politics of the State government in India has brought in the complexities thereby halting the concluding of the Agreement which shows that even the States can have a direct impact on the foreign policies. The paper therefore is an attempt to bring to fore as to why and how domestic politics conditions foreign policy and how it affects the bilateral relations by highlighting the case of the Teesta.
Keywords: Bilateral, Domestic Politics, Foreign Policy, India and Bangladesh, Teesta.
INTRODUCTION Foreign Policy refers to the sum total of principles, interests and objectives which a country promotes while interacting with the other countries. It becomes essential in the wake of globalisation due to the growing interdependence among the states. Any nation through its foreign policy seeks to further its national interest and India is no exception to it. If we look at India’s foreign policy then it has undergone changes since its inception by Prime Minister Nehru. The history, geography, culture as well as economy have played a vital role in shaping the foreign policy imperatives of the nation. The principle of Non-alignment, fall of Soviet Union, introduction of economic liberal policies, emergence of US centric unipolar world have all brought about substantial changes and reshaped its foreign policy considerations accordingly. As a result of which India’s foreign policy has undergone changes from being an idealist to a realist to pragmatic. Along with these changes there has also been a change in the attitude of the government towards the state where states have been viewed as a party to the foreign policy initiatives of the nation. India’s federal structure acts as an important factor that conditions the foreign policy of the country. However it is not the only factor as along with the federal structures there is also the factor of domestic politics which tends to shape and influence the policy. The emergence of Coalition politics have brought to fore the significance of the regional politics and thereby the factor of domestic politics. The sharing of the international border makes the role of the states even more vital in determining the policy of a nation where internal factors comes into being.
If we talk about domestic politics as a factor then mention may be made of India and Bangladesh with regard to the sharing of the waters of the Teesta where the very inclusion of the State government domestically has actually affected the decisions internationally. This Article therefore is an attempt to bring to fore as to why and how domestic politics conditions foreign policy and how it affects the bilateral relations by highlighting the case of the Teesta and why there is a need for a co-operation between the Federal and the State government.
DOMESTIC POLITICS AS A FACTOR Foreign policy are designed by the head of the government with an aim of achieving complex domestic and international agendas involving a series of steps where domestic politics plays an important role. (Hussain, 2011). Domestic politics is regarded a vital while formulating a foreign policy as it represents the various interactions that have taken place internally and how those interactions have actually influenced and shaped the decisions internationally.
In India, the rise of regional parties have over the years drastically changed the foreign policy making of the country where the regional parties and their demands have affected and shaped the policies. Given the federal nature of the country the central government always tends to take into consideration the opinions of the

60
International Journal of Research in Management & Social Science Volume 5, Issue 3 (IV): July - September, 2017
ISSN 2322 - 0899
provincial leaders while conducting any policies with her neighbours (Chowdhary, 2012). An instance can be seen in 2013 when India had to boycott the Commonwealth Summit in Sri Lanka owing to the strong internal opposition coming from the various parties in Tamil Nadu which showcases how domestic politics affects the decisions internationally. (Barber and Mallet, 2013) Now these parties were able to pressurise and influence the decision as they were viewed as an important ally to the Congress in the 2014 elections and going against their demands meant the Congress losing out on its important ally and thereby having its implications in the General elections. This is one of the many instances which have actually brought to the fore that India’s role and decisions at the global level was being affected due to domestic politics. Taking these things into consideration it would not be wrong to state that even the issue of the Teesta has been a victim of such political manoeuvre.
As already stated there is an interaction that takes place not just at the federal level but also at the state level where the views and opinions of the State governments are also taken into considerations. Therefore any Country if it wants to resolve a matter then it has to take into account the interest and the confidence of both the Central as well as the State government and this is one of the reasons as to why there has been a delay in taking decisions and resolving the matters. Further this complication is much profound in the case of Water sharing. If we look at the case of India then it is generally noted that it is possible to resolve the issues over water internationally rather than the internal issues. Thus in India domestic disputes are said to have attracted more attention than the international and global ones. (Hanaz, 2015)
The factor of domestic politics is most profound in the case of India-Bangladesh. India Bangladesh are two nations who have witnessed a change in their bilateral relations from being cordial to hostile and these changes have been affected due to the changes in the regimes in Bangladesh under the Awami League and the Bangladesh National Party. Both the countries share the geographical boundaries, culture, history etc. which makes it even more vital to establish greater ties between the two. Even though the two nations have shared history yet there are various unresolved issues which have at times created rift between the two. Such issues ranges from illegal migration, border issues, water issues etc. Looking at the importance of Bangladesh as a rising regional power in South Asia, India has been trying hard to improve its relations further by aiming at resolving the issues that exists between them. Recent example has been the Modi government initiative in concluding the long awaited historic land boundary agreement which saw its light in the year 2015. The year marked a new beginning in India Bangladesh relations which also renewed new hopes amongst the other side of the border regarding the solving of one more unresolved issue i.e. the issue of the Teesta water sharing.
With regard to transboundary water sharing the States are the major shareholders and therefore in each and every discussions on sharing and managing of the waters they should be made a part of it. Interms of Transboundary rivers then the governance of it depends to a large extent on the part and role played by the upstream nation as majority of the waters flows from it to the downstream. Thus in the case of the Teesta the role of India is of utmost importance as it has its implications for the downstream Bangladesh. It is also seen that states can also influence the Central government as its support is essential for the latter if it wants to formulate any policies or agreements or any decisions.
The issue of Teesta has assumed importance over the years where as early as 1980’s there was an initiative to share the waters of the Teesta and since then there has been various efforts from both the sides to come to an agreement. The recent development being in the year 2011 when both the sides nearly signed the agreement if at the last moment the West Bengal government had not backed out. The new agreement called for an equitable allocation of the waters of the Teesta thereby providing Bangladesh with 35,000 cuses of water annually instead of the earlier 25,000 cuses which was objected by the State government of West Bengal.
The State government resented that they were not informed about the deliberations that took place between the Central government of India and the Bangladesh government in 2011. The decision on the part of the State government has literally halted the signing of the Teesta agreement putting the Central government in an embarrassing position internationally. In this case the interest of the State has taken precedence over the Nations interest. The State government’s argument regarding the backing off at the last minute owes considerably to the interest of the State and its people. The present agreement calls for an equitable sharing of the Teesta rivers between India and Bangladesh and if it takes shape then the State governments argues that there will be less amount of waters for the northern region who are dependent upon the waters of the Teesta for its livelihood. Therefore West Bengal government is not in favour of giving more waters of the Teesta to Bangladesh. This decision has vehemently put all efforts at arriving at a possible solution to a standstill where there seems to be no hope on the part of the State government to mend its terms. The then Manmohan Singh’s UPA government in 2011 was not able to make the State government comply as a result of which the Agreement on the Teesta met with a failure. Even though there were renewed hopes amongst the Bangladeshi counterparts with the

61
International Journal of Research in Management & Social Science Volume 5, Issue 3 (IV): July - September, 2017
ISSN 2322 - 0899
coming up of the Modi led government at the Centre in 2014 and further with the signing of the historic Land Boundary Agreement in 2015 yet till date the present government has also failed to make the State government to come to a negotiation.
Now why is there such complications? First there exist a problem in the sharing of the Teesta waters and that has to do with the lean season (Futehally, 2013). During the lean season the volume of the waters of the Teesta considerably drops which affects the flow downstream. Time and again Dhaka has raised its concerns regarding the drop in the flow of the water during the lean season whereby it stated that the volume considerably dropped down to 315 cuses in 2015 as compared to 550 cuses in 2014. Therefore Bangladesh wants an equitable allocation of the waters of the Teesta. And the issue is complicated due to the resistance from the West Bengal government.
India has a federal polity and the kind of relationship that exist between the Central and the State government also has to do with the complexity. As stated earlier since there is decentralisation therefore the State government also enjoys some leverage particularly in terms of Water issues which at times acts as a hindrance in the path of formulating or concluding agreements. Not only that if we look at the governance of the rivers in India then it is seen that it is more decentralised than a centralised one thereby giving more jurisdiction to the State governments. The water issue has been included in the State list in the Indian Constitution as a result of which the States have an upper hand over the water governance making it imperative for the Central government to take into consideration the State government while formulating any policies and agreements as such. This has given an edge to the respective State governments and that has exactly what has happened in the case of the Teesta too. And even though there is the provision in the form of Art 253 in the Constitution which though gives the Central government the power to conclude transboundary agreements yet it cannot do so arbitrarily. The Central government has to take into consideration the State government opinion as the Treaty will have a social, political and economic impacts in the area before it concludes anything and that has delayed the entire process. The Central government in the national interest can take decisions yet till date there has not been any steps undertaken which therefore indicates that the central government is equally willing to give more responsibility to the State government and this brings in complexities as the State government must be consulted in transboundary water policies. It thus highlights the fact that any international country if it wants to negotiate on any matters relating to Transboundary rivers then it not only has to deal with the Central government but also with the State government. At times the interest of the nation collides and conflicts with the interests of the concerned states thus leading to differences between the Federal and the State government and thereby impeding any developments internationally putting the federal government in a dilemma whether to opt for the national interest or to take into consideration the regional and vested interest of the States.
To add to these issues the factor of Politics plays a significant role here. Politics is regarded as the struggle for power among and within the nations. So there is also a power game involved in the case of Teesta. If on one hand the State government is taking its time and not changing its stand it has to do with the power politics. First, the State wants to use the issue of Teesta as a bargaining chip against the Centre and Secondly, since the elections are near the corner the Mamta Banrejee government would not want to downplay the emotions of the people. The issue of Teesta holds grave significance emotionally as well as sensitive as it affects the livelihood of the people and complying with the centre means antagonising the people and losing out a large amount of support which the government cannot afford. That is the reason why it is playing its card.
The same applies with the Centre also. Earlier the Manmohan Singh government was not able to make Mamta Banerjee comply as she was an important ally in the then UPA government and going against her wishes meant losing out its support. Now also the Modi government is also playing its political card. It is not pressuring the State government as it also has its own interest in the State. It is looking towards the next 2018 Rural Polls in the State and the 2019 general elections. The BJP already does not hold much strength in West Bengal and if it goes further with the Treaty antagonising Mamta Banerjee means further losing out its hope on increasing and maintaining its strength in the State.
This is the same dilemma that the Central government is facing with regard to the issue over the sharing of the waters of the Teesta. The Federal government wants to conclude a water sharing treaty on the Teesta with Bangladesh and further its national interest interms of better bilateral relations with the immediate neighbour. Whereas the State government is not inclined towards the idea as it is vehement that such a decision is risking the interest of the State and its people and it does not want to keep it at stake at any cost. This differences of opinion between the two levels of government has been a major impediment towards the possibilities of a water sharing Agreement between India and Bangladesh over the Teesta.

62
International Journal of Research in Management & Social Science Volume 5, Issue 3 (IV): July - September, 2017
ISSN 2322 - 0899
IMPLICATIONS ON INDIA BANGLADESH RELATIONS It surely has its implications on the ongoing bilateral relationship between India and Bangladesh where the factors of Domestic politics is not new. Domestic Politics has always played a dominant factor in formulating India Bangladesh relations whether its from the Indian side or the Bangladesh side. If we take the case of Bangladesh then its policies and decisions particularly with regard to India have always been influenced by its domestic politics. Same is the case with India where time and again the domestic considerations always seemed to have influenced and impacted its decisions externally. India Bangladesh relations has considerably improved under the Awami League government who have always viewed India as an ally and have thereby always aimed at establishing a cordial relationship with India. The same goes for India who has rather been more comfortable at the negotiating table with the AL. But the ongoing never-ending Teesta issue has affected both India and Bangladesh. Due to the continuous stalling of the agreement there has been enormous pressure upon the AL government who have been vehemently criticised back home due to its lack of ability to initiate and conclude the Teesta Agreement. These criticisms comes from the opposition party BNP as well as the Islamic fundamentalist who do not hesitate to raise fingers upon the Awami League government of its inability, ineffectiveness to make the Indian government comply. Not only that the government also had to face the wrath and allegations of selling their country’s interest to India. This comes at a time when there was a disagreement regarding the sharing of waters of the Teesta, with Bangladesh claiming more waters from the Teesta. To add to these problems there was the halting of the Agreement in 2011 at the last minute by the Chief Minister of West Bengal backing out. The Agreement which was supposed to be concluded in 2011 at the then P.M of India, Manmohan Singh’s visit to Dhaka came to a standstill due to the opposition from the State government thereby bringing to the fore the factor of domestic politics. The major claim made by the State government which is one of the stakeholders was that the Agreement would give more waters of the Teesta to Bangladesh which further means that the State is losing out its major share of waters downstream. As the river Teesta flows from Sikkim to West Bengal to Bangladesh therefore the State Government feared that it will affect the northern parts of Bengal and thereby the farmers. The northern parts of Bengal and the northwestern parts of Bangladesh are the ones who are highly dependent upon the river Teesta as these regions are agricultural. Therefore the government did not wanted to lose any water from its earlier share and thereby the opposition. Now the continuous stalling of the Agreement is going to have its repercussions on the bilateral relations. The otherwise calm and patient Awami League government who had for long waited for a positive response from India when came under the radar of the domestic politics within its country had to give up to the internal pressure and condemned the action of India by denying India the transit deal (DNA, February 20, 2015) even though later on with the signing of the Land Boundary Agreement India was given the Transit deal. This transit deal was regarded as vital for India's northeast. But the decision of 2011 compelled the AL government to declare that it would not go forward with the deal unless India reciprocates with the Teesta agreement. India cannot ignore the fact that the AL has always been its ally and has been its counterpart in fighting against Insurgencies in the India’s Northeast particularly the ULFA. Therefore India cannot offend its neighbour for long. India has been blamed of adopting a big brotherly attitude in the neighbourhood which has offended and also established mistrust amongst the neighbours against India. Time and again India has been charged of taking unilateral actions. If there is no consensus on the Teesta then this negative perception might persist and it might not be fruitful for India in the long run. Even the China factor also plays its part in India Bangladesh relations. China through its One Belt One Road policy is trying to reach out to the Asian economy and further it has been investing a huge sum of money on Bangladesh around $24 bn while India invested only $2 bn. China’s closeness to Bangladesh would be a matter of worry for India given the rivalry that both the nations have on becoming the powerhouse in Asia. So, India needs to conclude the agreement so as to get a political leverage to put a check upon China. (Ranjan, 2017) India has been taking into consideration its national interest which in the case of Teesta has been undermined by the regional interest. But being an upper riparian state it cannot ignore the interest of the lower riparian state Bangladesh who has the same concerns over the sharing of the waters of the Teesta like West Bengal. Further with the coming of the 2018 Rural polls in Bengal, 2019 Lok Sabha elections in India and 2019 elections in Bangladesh the Teesta agreement hold grave significance. (The Hindustan Times, 2017). As stated earlier with the coming of the polls in India there is also a kind of a political struggle between Centre and State. Similarly, if we look at Bangladesh there too the treaty has its implications as the said Hasina government has been constantly accused of being a pawn in the hands of the Indian government and if it wants to come to power again in 2019 then it needs to change its image and win the support of the masses and conclusion of the Teesta agreement holds great significance in this regard.

63
International Journal of Research in Management & Social Science Volume 5, Issue 3 (IV): July - September, 2017
ISSN 2322 - 0899
CONCLUSION Minister of State for External Affairs General V.K Singh asserted that ‘The foreign policy must keep domestic imperatives in mind so that it can promote domestic interest through it and thus we can seek more business and investment and ensure these contribute to the nation’ growth.’ (ANI, 2017). It highlights the importance of cooperative federalism in India. It is true that in todays time the Centre cannot act in an arbitrary manner and take decisions which directly or indirectly affects the concerned States. Having said that it is also a fact that it is also leading to continuous delays in arriving at a conclusion no matter how small or big the issue maybe. There is a lack of agreement and consensus between the two levels of Government where often the decisions taken by the central government is viewed with suspicion by the States who tends to develop a feeling and attitude that the Centre always tend to neglect the interest of the States. This actually leads to complexities.
If we take the case of Teesta the same complexities exists between the Central and the State government whereby the State government feels that the Centre for its national interest is neglecting the interest of the State and its people. The State government asserts that the Centre cannot surpass the vested interest of the State and take decisions. Cooperative federalism talks about equal cooperation between the two levels of government. Therefore it becomes imperative for not just the Centre but also for the State government to actually come forward and negotiate. One cannot deny the importance of States in formulating decisions and policies and the implications thereon if ignored. But it is also a fact that there cannot be any agreement if both the sides take a firm stand and do not comply. There has been a delay in the Teesta agreement because the State government of West Bengal does not wish to comply and negotiate. It has been firmly asserting that it do not wish to negotiate on giving any more waters to Bangladesh. Since it has taken a firm stand therefor the Central government is also not able to make it comply. Not only that the halting of the Agreement in 2011 brought to fore that there is a disagreement between the Central and the State government. Therefore, if India wants to take a decision internationally then first and foremost it needs to resolve its matter domestically as domestic factor is affecting the decisions internationally.
REFERENCES • ANI. (February 14, 2017). Policy must consider domestic imperatives to seek investments: V.K.Singh.
Retrieved from http://www.aninews.in/newsdetail-MTA/Mlk5ODY0/foreign-policy-must-consider-domestic-imperatives-to-seek-investments-v-k-singh.html
• Barber, Lionel and Victor Mallet. (2013). Domestic politics weigh on Indian foreign policy. Financial Times. Retrieved from https://www.ft.com/content/e723dbf6-4b4c-11e3-ac3d-00144feabdc0
• Chowdhary, S.J. (2012). Indian domestic politics and Bangladesh. The Daily Star. Retrieved from http://www.thedailystar.net/news-detail-250713
• DNA. (February 20, 2015). Will take up Teesta water sharing issue with Bangladesh PM: Mamta Banerjee. Retrieved from http://www.dnaindia.com/india/report-will-take-up-teesta-water-sharing-issue-with-bangladesh-pm-mamata-banerjee-2062672
• James. D. (1998). Domestic Politics, Foreign Policy, And Theories of International Relations. Annual Review of Political Science. Vol. 1.
• Futehally, Iimas. (2013). Strategic Foresight Group. Retrieved from http://www.strategicforesight.com/inner-articles.php?id=307 (accessed on September 12, 2013).
• Ghosal, Avijit. (2017). Teesta water deal: One issue where Mamta loses nothing by sitting tight. The Hindustan Times.
• Hanasz, Paula. (2015). The Politics of Water Governance in the Ganges-Brahmaputra-Meghna Basin. ORF Issue Brief, Issue no. 112.
• Hussain, Zaara Zain. (2011). The effect of domestic politics on foreign policy decision making. E-International Relations. Retrieved from http://www.e-ir.info/2011/02/07/the-effect-of-domestic-politics-on-foreign-policy-decision-making/
• Ranjan, Amit. (2017). Why India and Bangladesh needs a resolution on Teesta Water Sharing. The Wire. Retrieved from http://www.thewire.in/119228/teesta-water-india-bangladesh/

64
International Journal of Research in Management & Social Science Volume 5, Issue 3 (IV): July - September, 2017
ISSN 2322 - 0899
NATIONAL FOOD SECURITY ACT 2013: A VEHICLE TO FOOD SECURITY IN INDIA
Pratima1 and Dr. Kavita Chakravarty2 Research Scholar1 & Professor2, Department of Economics, Maharshi Dayanand University, Rohtak
ABSTRACT Food is the basic necessity of life. Every individual has the right to live and survive. So everyone’s food security must be ensured. This issue needs to be addressed seriously by the policymakers. In India the pressure of assuring food security is more significant due to the increasing pressure of population explosion and changing pattern of people’s demand with marginal increase in their incomes. Enactment of National Food Security Act 2013 is being seen as one of milestones to combat the problem of food insecurity in India. After a process of nearly 2 years the bill finally reached the status of an act on September 12, 2013 with the aim to feed nearly 70% of Indian population by providing them food grains at highly subsidized prices. This is probably the world’s largest programme of its own kind. It marks as a paradigm shift from a simple welfare approach to a strict right based approach. It has made binding upon the government to ensure food security of its people either through kind or cash transfer. With this background present paper seeks to critically analyse the main provisions of the act in the light of its economic implications. The paper concludes that though the act has offered several opportunities yet it has to go a long way in the form of reforms to actually reap the fruit of food and nutritional security. The implementation of the act poses the biggest challenge in this direction.
Key Words: Food Security, National Food Security Act (NFSA), Targeted Public Distribution System (TPDS) and Mid Day Meal Scheme (MDM)
INTRODUCTION India’s biggest and most serious developmental challenge has been ensuring food security and eliminating mass malnutrition. The ‘human right to food’ has been recognized in several instruments under international law. In the past decade, India saw a strong movement led by left political parties, academia and non-governmental organizations for establishing a universal right to food. This movement was culminated in the drafting of National Food Security Bill 2011.
A basic framework of National Food Security Bill was forwarded by National advisory Council to the then Prime Minister Dr. Manmohan Singh on October 27, 2010. The bill envisaged the coverage of 75% of population comprising of 90% in the rural areas and 50% in the urban areas. In response, the Prime Minister constituted an expert panel under the chairmanship of C Rangrajan to study the proposal. The committee rolled out the estimations of grain requirement for the National Advisory Council’s proposal of covering 72% population. The estimates of 68.76 million tonnes of food grain required for 72% of population in first phase and 73.98 million tonnes of food grains required for 75% of population in the final phase. The panel stuck down the coverage of national food security bill from proposed 75% to 67% and suggested the formation of public distribution system. The government finally promulgated the National Food Security Ordinance in July 2013 thereby making it into a bill.
India has come a long way forward since importing the food grains from United States of America in 1960s under PL480 scheme, to the green revolution and all the way up to enacting a multilayered and multi dimensional National Food Security Act 2013. This makes India the first nation in the world giving people the right to food and perhaps the largest food security programme in the world. The bipartisan legislation, National Food Security Bill (NSFB) was passed unanimously by both houses of Parliament and was given a nod by the President on September 12, 2013 retroactive to July 05, 2013. This is a big leap from India’s Achilles heel of Food Insecurity where India was often touted in global arena as capital of ‘extreme Hunger and Severe malnutrition’. With NFSA, India marked a significant departure from existing welfare approach towards the rights –based approach. The act claims to provide citizens to access to adequate quantity of quality food at affordable prices to live a life with dignity and provide for food and nutritional security in human life-cycle approach.
REVIEW OF RELATED LITERATURE Krishnamurty et al. 2014 in his study found a significant impact of PDS reforms on the diet pattern and nutrition status of eligible household of Chhatisgarh. The results are in contrast with some other studies suggesting that food subsidies have little effect on nutrition. Mishra (2013) in an attempt to study the fiscal implications of the National Food Security Act (FSA) concluded that the act will significantly affect the exchequer of the country. The food subsidy cost for the year 2013-14 was estimated to be Rs. 1245.02 billion

65
International Journal of Research in Management & Social Science Volume 5, Issue 3 (IV): July - September, 2017
ISSN 2322 - 0899
and Rs. 1577.010 billion for 2015–16. The incremental cost of the budget because of implementation of the act over Targeted Public Distribution System (TPDS) was estimated at Rs. 239.510 billion. This amounted to 0.2 % of GDP. He further pointed out that one needs to take into account not only the cost of the food subsidy but also the costs of setting up or running new institutions and bureaucracies, and the costs that are likely to arise if there are political pressures to protect the existing beneficiaries. Further, the study explained that there are still more imponderables, and the final cost could add up to much more than what is now estimated. Shirur and Shivalinge (2014) while studying the implications of NFSA on Indian agriculture concluded that the Act has potential to bring rich dividends especially in rural areas. Access to food for poor would not only improve their productivity and efficiency but also reduce expenditure on health. They suggested that the success of the Act would depend on efficient grievance redressal, strict laws to deal with corruption along with stakeholders’ active involvement. Bhushan (2013) in his article concluded that National Food Security Act 2013 which was earlier envisioned as an effective tool to fight against India’s hunger and malnutrition was found to be suspicious in giving desirable results. There are many others (Rammohan 2013, Kotwal et al. 2013, Swaminathan 2013, Parikh 2013) who attempted different studies to find the implications of National Food Security Act 2013 and found to be apprehensive about its results.
OBJECTIVES OF THE STUDY 1. To analyse the main provisions of National Food Security Act 2013 2. To critically analyse the economic implications of the Act. 3. To identify the main challenges posed by the Act. 4. To suggest some remedies for the better implementation of the Act. RESEARCH METHODOLOGY The study is descriptive in nature which is essentially based on the facts presented in, ‘National Food Security Ordinance’, July 5, 2013 of Government of India.
NATIONAL FOOD SECURITY ACT 2013 AT A GLANCE The National Food Security Act has been passed with the objective of addressing the formidable challenge of assuring food security. It is also expected to work as a strong foundation for the realization of food security. As per the provisions of the Act homeless, destitute, emergency and starvation affected persons will receive either free meal or at highly subsidized prices. The National Food Security Act extends to the whole of India and has been organized in to 13 chapters, 45 sections and 4 schedules. The main provisions of National Food Security Act are summarized as follows: Entitlement The National Food Security Act proposes to cover 75% of the rural population and 50% of the urban population with an entitlement of 5 kilogram per person per month of food grains at issue prices of Rs. 2 and 3 per kilogram for wheat and rice respectively. This proposal has only two categories: covered and uncovered, rather than three; priority, general and uncovered in the previous version of the National Food Security Bill. The AAY (Antyodya Anna Yojana) households will receive an additional 35 kg grains per household to protect their existing allocations. The state-wise inclusionary shows are determined by the planning commission based on a national level cut-off for per capita production to cover 75% and 67% of rural and urban populations respectively.
An additional allocation of food grains for other welfare schemes (OWS) is also included in the final act. This includes the provision of additional 5 kg of grain per month to pregnant women and new mothers, and free mid-day meal in schools for children in the age group of 2-16 years thereby targeting the nutrition angle of the development axis. In a pattern of wishful thinking, this was touted as an investment in human capital as well. The vehicle for distribution of food grains will be TPDS (targeted Public distribution system) and the bill entitles about 80 million of India’s 1.2 billion populations to the subsidized food grains.
Identification of Eligible Households States are accorded with the responsibility to define eligibility criteria with Social, Economy and Caste Census (SECC, 2011) data serving as basis.

66
International Journal of Research in Management & Social Science Volume 5, Issue 3 (IV): July - September, 2017
ISSN 2322 - 0899
Nutritional Support to Children and Women Pregnant women and lactating mothers are entitled to a maternity benefit of at least Rs 6000. Children aged six months to 14 years will get take-home rations or hot cooked food under the mid-day meal scheme and ICDS. The act also provides for the identification of malnourished children below 6 years of age. The Act has prescribed higher nutritional norms have been prescribed for such children.
Cost of intra-State transportation and FPS Dealers' margin The central government will provide for the assistance towards the cost of intra-state transportation, Fair Price Shop Dealers’ margin and handling of food grains as well as finances towards states and union territories, in case of the shortages of food grains. Women Empowerment: For the ration cards, the eldest adult women in every household will be considered the head, in a bid to empower women. If no female member is above 18 years of age then the eldest male member will be the head till her attainment of adulthood.
Transparency and Grievance Redressal: A two tier grievance redressal mechanism will be put in place with call centers, help lines and designated nodal officers. At state level, State Food Commission (SFC) and at district level, District Grievance Redressal Officer (DGRO) is held responsible to deal with the problems of beneficiaries and to resolve them. State Food Commission is held responsible to overlook the implementation and execution of the act and also to suggest the state level governing body in the context of the act from time to time. District Grievance Redressal Officer will recommend the penalty of the authorities found guilty of failing to comply with the provisions of the act. In order to ensure transparency and accountability in the system the act also provides for the following provisions: All the records concerned with the act will be placed in the public domain and will be kept open to
have access of public; Social audits of the PDS and other welfare schemes will be conducted periodically; At all levels, all the transactions of PDS will be recorded using information and communication
technology; To keep a check on misappropriations and supervise various schemes under the act, different
Vigilance Committees at state, district, block and fair price shop levels will be set up. Food Security Allowance National Food Security act also allows government to pay cash when it is unable to provide food. This permits the government to shift to cash transfers and to replace a food scheme with cash handout scheme. ECONOMIC IMPLICATIONS OF NATIONAL FOOD SECURITY ACT According to the critics of the Act, National Food Security Act is only a political stunt of UPA government to influence the election of 2014. It can shaken the Indian Economy. The following are some of the economic implications of the Act.
Though India has recorded a height in production of food grains and maintaining sufficient buffer stocks, yet food grain prices are experiencing a consistent rise in past few years. The food price inflation has more specifically been observed in protein rich items like milk, pulses and meat etc. The implementation of National Food Security Act 2013, will increase the demand of food grains without a balanced increase in the supply of food grains thereby causing an increase in food grain prices. The individual average consumption of cereals in India is 10.7 kg per month whereas Food Security Act provides for only 5 kg of cereals. The remaining burden of 5.7 kg of cereals on an individual, with such high prices, can alter consumption basket through value differential. This price rise will percolate its effect to other sectors due to consumption of food by all. Fiscal deficit will also increase due to higher subsidy thereby giving rise to macro level inflationary pressures. The government will also be under a pressure to raise Minimum Support Price of the food grains so as to incentivize the farmers for food production thus again leading to macroeconomic imbalance. Due to increased prices the population working in small and medium scale industries will raise voices for increased salary in order to

67
International Journal of Research in Management & Social Science Volume 5, Issue 3 (IV): July - September, 2017
ISSN 2322 - 0899
maintain their minimum standard of living and inflationary pressure will be fuelled up further. (Chhibber 2013) holds the view that with an increase in food grain prices, the employees ask for high dearness allowances and consequently raising the unit cost of production. This results in a rise in the price of machineries and equipments produced by these industries. Decline in the prices of rice and wheat will change consumption patterns in favour of consumption of wheat and rice as against the consumption other unsubsidized staple food. It suggests that food price subsidies are likely to affect agriculture markets without impacting nutrition. (Kaushal and Muchomba, 2013).
The food subsidy cost of implementing the NFSA is estimated at 1,24,502 crores for the fiscal year 2013-14, which is estimated to see north in subsequent years at an amount of 1,40,192 and 1,57,701 crores for the year 2014-15 and 2015-16 respectively. The food subsidy cost is calculated as the multiplication of economic cost - issue price and food grain requirement. The economic cost as computed by Corporation of India includes minimum support price, handling, storage and distribution costs(National food Security Ordinance, 2013). This amount excludes the subsidy of existing Targeted Public Distribution System and hence an additional cost to the exchequer is estimated at 23,951 crores or equivalent to 0.2% of GDP. This does not paint the complete picture because additional expenses of setting up and running new institutions, infrastructure and bureaucracy are not taken into account, and hence NFSA may entail significant burdens. Still, there remains considerable ambiguity regarding the quantum of resources required for implementation of National Food Security act, as underlined by the memorandum of NFSB 2011. Sinha (2013) explored a number of independent estimates which have been made to calculate the cost of implementation of the National Food Security Act. He holds the view that these estimates are either based on wrong assumptions or work with numbers that are not in the public domain, but, it is clear that the costs will be unaffordable
The background of the supply side of NFSA cannot be ignored where the government procures the food grains through the open-ended procurement policy, whereby government commits to buying unlimited quantities of wheat and rice at minimum supported price (MSP). The initial procurement price is not determined by the forces of demand and supply but by the policy of minimum support price, which in turn is determined by negotiations between Centre and grains producing states. The most grains in India comes from selected few states. The inertia of large numbers dictates that Minimum Support Price be higher than otherwise would have been, as can be vetted empirically. The successive governments are often sensitive to under-supply of grains to Food Corporation of India but nobody is held accountable for excess procurement and since 1990, procurements have successfully exceeded the PDS sales, thereby bringing the crisis of storage space and spacing out the private trade. Historically, such phenomenon has been checked either through draught or through dumping in open market sales or exports. National Food Security Act is likely to boost such problems of procurement and public stock. Procurement has typically been higher than the required quantity of food grains. For duration of 10 years between 2002-03 and 2011-12 procurement was 40% higher than the off take from Public Distribution System. Such cost of additional procurement will squeeze the fiscal path of economy. The operational deficit of FCI went to scale of 1% of GDP in the year 2011-12. Two dimensions of National Food Security Act are worthwhile to consider, the procurement side undertaken by Food Corporation of India (FCI) and the distribution side through Targeted Public Distribution System (TPDS). Both systems are flawed so much that the impact of revitalized food security system on Indian economy and especially on grains market is too vague to understand.
The Agreement on Agriculture allowed for market distorted subsidies up to a level of 10% of the total production. But, the implementation of the Food and Security Act, 2013 would force India to breach the 10 percent mark. Therefore, India is under a pressure to demand amendments in the AoA so as to provide higher level of subsidies to the poor. Beyond that the rising buffer stock is a matter of concern for other countries as they are under a threat that global market may be used as a dumping place for such surplus.
The question still lingers on whether food security is important given the poor track record of Indian endeavors in this direction or the investment in health and education. Some estimates like that of Dr Raghuram Rajan dictates that the cost of National Food Security act be 0.5% of GDP. The pertinent concern is the opportunity cost of this act, what equivalent amount is implemented on health or education and Will this do more good or less as compared to the leaky bucket of National Food Security Act. Can the distribution of wheat and rice remove the malnutrition by inducing beneficiaries to consume more calories? Historically, studies suggest that more nutrition stems from many things apart from calorie intake like micronutrient deficiency, sanitation and lack of information.

68
International Journal of Research in Management & Social Science Volume 5, Issue 3 (IV): July - September, 2017
ISSN 2322 - 0899
KEY CHALLENGES The worldwide established notion of ‘increasing the economic growth will subsequently lead to the fall in under nutrition’ has not been observed in case of India. For a healthy person Indian Council of Medical Research has recommended the requirement of 14kgs of food grains per month per adult and children 7kgs per month per child; the Act provides for 5kgs of food grains per person per month, which is far below the nutritional standard. There are also no entitlements to pulses, (a rich source of proteins) and oil under the act. So it leaves some unanswered questions and provides for the apprehensions that will National Food Security Act work? Will it be able to address the problem of malnutrition? Or will it be a mere waste of public money?
This bill is silent on how the beneficiaries will be selected and there has been no clear defined criterion. The social, geographical and political contexts prevent one to develop a universal criterion. Hence the only way out can be state-based criteria for identification of beneficiaries under National Food Security Act. The Indian experience of inclusion and identification of poor has been marginal and marred by inclusion and exclusion errors. The problem of the identification of Antyodaya households still looms large.
Clause 52 of the Act, which states that, “the Central Government or the State Governments, shall not be liable for any claim by persons belonging to the priority household or general households or other groups entitled under this Act for loss/damage/compensation, arising out of failure of supply of food grains or meals when such failure is due to the condition such as war, flood, drought, fire, cyclone, earthquake or any act of God”. This provides for an exemption to central as well as state government against any claim by beneficiary entitled under this Act for loss, damage or compensation arising out of failure of supply of food grains. This is the time when in the light of failure of market forces and volatility of prices, the poor and vulnerable section would more depend upon the government to ensure their food security.
The model specified by National Food Security Act is highly centralized leaving little room for the state government to act according to the situation of their respective states.
NFSA mandates Central Government to procure for the central pool and held the respective State Governments’ responsible for distribution. Decentralized Procurement System(DCP) was introduced in 1997-98 in view of the practical difficulties faced by the Food Corporation of India, the central body, to procure on its own.
Any transfer scheme it is based on twin pillars of distribution system and authenticating system. The problem of defining the criteria which makes one eligible for benefits of National Food Security act has been touched scarcely in the draft. The problem of identification and authentication has been looming large since the days of Public distribution system, eventually morphing into targeted Public distribution system.
An experience of India and world shows that more universal is the coverage of food security programme, lesser other targeting adults and better is the administration, ensuring the needy ones are not excluded from the system. The definition of priority or target population needs to be Flexible to allow state and local governments to identify food insecure population and give them access to subsidised food.
CONCLUDING REMARKS NFSA 2013 guarantees subsidized foodgrains to two-thirds of 1.25 plus billion population. It is bound to be vitiated by operational and fiscal challenges. The successful National Food Security act demands the reforms in the system on procurement and distribution side, otherwise the additional burden is capable to send the economy in tailspin. The transfers should be a mixed bag of in cash and in kind where the pros and cons of each are balanced through a careful mix. In-kind transfers are plagued by the waste and leakages, the partial in-cash transfers can obviate such concerns.
The AADHAR can serve as ground for identification with minimum loopholes. The approach must be to identify the rich and excluding them rather than identifying the poor and including them. The latter approach has seen limited success in the past. Social economy and caste census 2011 (SECC) was carried out by Ministry of rural development and Ministry of Urban development. This provides the coarse around to exclude 30% of rural and 50% of our population and India can take it from here. This way, some undeserving rich may be included but no poor will be excluded. The aid of Information technology looks promisingly potent to break the impasse of identification. It does not just eliminate any intermediaries between government and at the user without any decay or loss but put in efficient use of the biometric identification in our country, already in place in the name of Aadhar.
REFERENCES Bhushan, H. (2013). National Food Security Act: Work in Progress. Yojana 57(Special Issue):4–7

69
International Journal of Research in Management & Social Science Volume 5, Issue 3 (IV): July - September, 2017
ISSN 2322 - 0899
Chhibber, A. (2013). Why India’s rampant inflation remains a puzzle? The Economic Times, October 04
Gulati, A., Gujra, J., Nandakumar, T., Jain, S., Anand, S., Rath, S., & Joshi, P. (2012). National Food Security Bill: Challenges and Options, Discussion Paper No. 2, Commission for Agricultural Costs and Prices, Department of Agriculture & Cooperation, Ministry of Agriculture, Government of India New Delhi.
Krishnamurthy, P., Pathania, V., Tandon, S. (2014). Food Price Subsidies and Nutrition: Evidence from State Reforms to India’s Public Distribution System, Selected Paper prepared for presentation at the Agricultural & Applied Economics Association’s 2014 AAEA Annual Meeting, Minneapolis, MN, July 27-29, 2014
Mishra, P. (2013). The Food Security Act (FSA) Fiscal Implications: 2013-14 to 2015-16. Yojana 57:8-12
Parikh, K.S. (2013). Food Security Bill-Would it wipe out Hunger and Malnutrition? Yojana 57:18–21
Swaminathan, M. (2013). Implementing the Food Security Act. Yojana 57:22-24
Government of India, ‘National Food Security Ordinance’, July 5, 2013.
Economic advisory Council, ‘Report of the Expert Committee on National Food Security Bill’, (2011).
Jha, S., & Ramasamy, B.(2010). ‘How can Food Subsidies Work Better? Answers from India and Philippines’, Working Paper 122, Asian development bank, Manila.
Kotwal, A., Milind, M., Ramaswamy, B.(2012) ‘The political economy of food subsidy in India’. The Copenhagen Journal of Asian studies 30(2), 100-121
Malhotra, N.(2012). Child Malnutrition: Why Wealth isn't the only problem, ideas for India. Retrieved from http://www.ideasforindia.in/article.aspx?article_id=61.
Malhotra, N. (2012). ‘Inadequate Feeding of infant and young children in India: Lack of Nutritional Information or Food Affordability?’, Public Health Nutrition Supplement. Retrieved from https://pdfs.semanticscholar.org/3cb8/7c3aa7eb8850adfdac7d18061b5256948d14.pdf
Mishra, P. (2013). ‘Financial and Distributional Implication of the Food Security Law’, Economy and Political Weekly, XLVIII.39.
Ramaswamy, B., Millind, M. (2013). ‘Food policy reforms: a rapid tour of possibilities’, South Asia Working Paper Series, Asian Development Bank. Retrieved from https://www.adb.org/sites/default/files/publication/30240/food-policy-reforms-rapid-tour-possibilities.pdf
Sinha D, ‘Cost of Implementing the National Food Security Act’, Economy and Political Weekly, XLVIII.39 (2013).
Shirur M, Gowda NSS (2014) India’s National Food Security Act: Implications on Indian Agriculture. International Journal of Research in Applied, Natural and Social Science 2(5):247–260.
Gulati A, ‘Food Security Bill: Can we afford Rs 6 lakh cr food subsidy in three years?’ Economic Times, December 17, 2011
Bhalla S, ‘Manmonia’s FSB: 3% of GDP’. Indian express, July 8, 2013.
Mahindra, D., Sharma, A. N.(2013). ‘Food Security in India: Performance, Challenges and Policies’, Institute of Human Development, Oxfam Working Paper, New Delhi, (2013).
Sen, A. & Sen, H.(2013). ‘In-kind Food Transfers, Impact on Poverty Reduction and Nutrition,’ A Discussion Paper (2013).
70
International Journal of Research in Management & Social Science Volume 5, Issue 3 (IV): July - September, 2017
ISSN 2322 - 0899
IMPACT OF CLIMATE CHANGE ON AGRICULTURAL PRODUCTIVITY: A CASE STUDY OF NALGONDA DISTRICT TELANGANA
Dr. T. Anuradha1, M. Kamraju2, M. Vani3 and P. Manisha4 Assistant Professor1 & P. G. Student, Department of Geography, Osmania University, Hyderabad
ABSTRACT The largest known economic impact of climate change is upon agriculture because of the size and sensitivity of the sector. Warming causes the greatest harm to agriculture in developing countries primarily because many farms in the low latitudes already endure climates that are too hot. This paper reviews several studies that measure the size of the impact of warming on farms in Nalgonga District in Telangana State. Even though adaptation will blunt some of the worst predicted outcomes, warming is expected to cause large damages to agriculture in developing countries over the next century. It is a well known fact that the most vulnerable sector to climate change is agriculture and agricultural productivity would be greatly affected by even a slight change in climatic condition. Agriculture is most susceptible to climatic change when compared to other sectors like water resources, forests and other the impact ecosystems. The present study has been undertaken Nalgonda district to analyze the impact of changes in rainfall and temperature on the agricultural productivity at the mandal / district level in this district of Telangana. The analysis included statistical evaluation of rainfall, temperature and other meteorological parameters for a period of ten years.
Keywords: Agro climatic zones, Agricultural GDP, susceptible, ecosystems, domestic product, meteorological parameters, agricultural productivity.
INTRODUCTION The changing climatic scenario and its impact on various sectors of the economy have emerged as one of the greatest challenges before the scientists and policy makers all over the world in twenty-first century. The impact of climate change is expected to be different in different parts of the globe (Stern 2007). Some regions and economic systems may explore positive impacts, whereas others may experience losses due to climate change (Antle 2008; Ninan and Satyasiba 2012). Researchers are of the view that the impact of climate change would be modest on the developed countries and many of them are going to gain from climate change in future (Mendelsohn et al. 1994; Mendelsohn and Dinar 2003). However, there is a general consensus among the researchers on the fact that there would be significant reduction in agricultural productivity in developing countries as a result of climate change (Bruinsma 2003; Cline 2007). Ciscar et al. (2012) found that the impacts of climate change would vary largely among the regions, with the developing regions like Africa, Asia, Latin America and India in particular experiencing the most negative effect of such change.
The vulnerability due to the negative impact of climate change depends upon exposure, sensitivity and the adaptive capacity of the region to climate change (Schneider and Sarukhan 2001). Researchers in this field believe that the regions which are situated in tropical and sub-tropical climates are more exposed to the adverse impact of climate change (UNFCC 2007; Parry et al. 2007). Further, the adverse effect of climate change will fall heavily on climate sensitive agriculture sector (Nordhaus 1991; Cline 2007). Climatic variables act as direct inputs in agricultural production along with other inputs such as land, water, fertiliser, pesticides, etc. However, the effects of climatic variables become more pronounced on agriculture in regions where, agriculture is backward or primitive with less scope for technological adoption and transmission. The developing regions where poverty is a major concern and agriculture is the major livelihood option for the people, measuring the impact of climate change on agriculture in these regions is very important in view of attaining food security and reducing poverty.
The green house gas which increases atmospheric temperature has concentrated in excess in the environment because of unrestrained exploitation of fossil fuels. It is already quite evident that human activities at various levels have been affected adversely because of excessive concentration of atmospheric carbon dioxide. Environmentalist, Social activists, Scientist are deeply concerned over the damages that are occurring on agriculture, forestry and other ecosystems from drastic climatic changes which in turn would affect trading policies both at the national and international levels as also resource use and food security. Similarly if there is heavy rainfall the growing period of certain crops get unduly delayed, while considering the effect of climate change on agricultural productivity all these conflicting factors must also be taken in to consideration. Ninety percent of Indian agricultural productivity is dependent on weather. Most of the Indian states depend on rainfall for irrigating the crops and this is applicable to the Nalgonda region as well. As mentioned earlier, the region’s economy will be greatly affected if there is a fall in agricultural productivity due to negative climatic changes. A

71
International Journal of Research in Management & Social Science Volume 5, Issue 3 (IV): July - September, 2017
ISSN 2322 - 0899
shift in the timings of rainfall also affects the cropping pattern of the region. These are the reasons why this study was undertaken so that the various meteorological parameters impact on agricultural productivity could be analyzed in depth and possible suggestions to changes in crop pattern could be made to increase agricultural productivity based on changes in weather conditions.
OBJECTIVE To Study the impact of climate on agricultural productivity.
To Study the impact of climate on GDP of Region
LITERATURE REVIEW Unfortunately, literature relating to the effects of climate change on agriculture in Bangladesh is sparse and decidedly qualitative. A number of papers on Bangladesh’s risk, vulnerability and adaptations to climate change (Ali, 1999; Agrawala et al, 2003; Huq et al, 2004; Brouwer et al, 2007) have been policy focused and have lacked quantitative techniques to isolate the impact of climate change on agricultural productivity from other confounding factors. Agrawala et al (2003) used a subjective ranking system to identify key vulnerabilities Bangladesh faces from climate change based on circulation models and previous studies1 of the country. The authors assessed agriculture as having a medium “certainty of impact” risk, lowmedium “timing of impact” risk, low-medium “severity of impact” risk and high “importance of resource” risk based on the studies identified on Bangladeshi agriculture and their relative assessment of the other risk areas (Huq et al, 1995; Islam et al, 1999). Interestingly, agriculture ranked last behind water resources, coastal resources and human health. Agrawala et al discounted the impact of climate change on agriculture because some of the possible beneficial and adverse effects of climate change on crop yield may offset each other: A higher frequency of extreme, potentially crop damaging weather events could be offset by higher crop yields with modestly warmer temperatures. The effects of climate change are inherently region specific, inciting the need for region-based research on climate change. Ruttan (2002) noted this, saying rainfall and sunlight could potentially alter agricultural productivity but the gross effect was largely region-specific. Specifically discussing Bangladesh, Rashid and Islam (2007) identified droughts, floods, salinity and cyclones as the major extreme climatic events to which Bangladeshi agriculture is most vulnerable. Additionally, they identified a series of structural adaptations necessary to mitigate potential impacts of climate change on agriculture, including: crop diversification away from those most vulnerable to climatic changes; improving water efficiency; improving crop production strategies; investing in measures to mitigate the impact of cyclones and other natural disasters; reclaiming soil salinity by investing in cultivating Boro rice and sweet water shrimp; and investing in machinery to expedite farming operations. Previous studies based on scientific models in Bangladesh have employed the CERES2 -Rice and DSSAT3 models (Karim et al, 1996; Mahmood, 1998; Mahmood et al, 2004; Basak et al, 2010) to assess climate change influence on agriculture. These models simulated the effects of rising temperature and CO2 concentration on rice. Karim et al (1996) conducted a series of simulations using the CERES-Rice and -Wheat models for Aus, Aman and Boro rice, and wheat. They tested the sensitivity of the crops to three different levels of atmospheric carbon dioxide concentration (330, 580, and 660 parts per million) and two levels of temperature increases (2 and 4 degrees Celsius). They found that while higher concentrations of CO2 increased yields with temperature unchanged, higher temperatures adversely affected yields even with higher CO2 concentrations. Basak et al (2010) concluded that climate change was likely to have predominately adverse impacts on the yield of Boro rice. They found that if climate change was to result in increased temperatures, that this would cause grain sterility during the growing season and hence a reduced yield. They also found that while changes to the level of atmospheric carbon dioxide and solar radiation might offset the impact of increased temperatures to some degree, that it would not be sufficient to mitigate it altogether. Mahmood et al (2004) observed that since rain-fed rice constitutes over 50% of total rice production in Bangladesh, production of this crop is extremely vulnerable to volatility in the supply of water. Early monsoon arrival can cause flood damage to rice seedlings in early growth stages, whilst late monsoon arrival can lead to water stress. Their application of the CERES-Rice model found that high water stress could lead to yield losses as high as 70% to rice plants in both flowering and maturing stages, suggesting potentially disastrous impacts for rice production from changes to seasonal monsoon occurrence caused by climate change. Sarker et al (2012) performed time series analysis to assess this question for three major rice crops (Aus, Aman and Boro) in Bangladesh at the aggregate level using both Ordinary Least Squares and median quantile regression. However, this study did not account for regional variations and unobserved heterogeneity. The authors use maximum and minimum temperature and rainfall as climate variables and found a significant relationship between climate change and agricultural productivity. They found that minimum temperature was significant only for the Aman and Boro varieties, with a negative impact on output in the former case and a positive impact in the latter. Maximum temperature was found to be significant

72
International Journal of Research in Management & Social Science Volume 5, Issue 3 (IV): July - September, 2017
ISSN 2322 - 0899
for all varieties, with a positive impact on output of Aus and Aman and a negative impact on Boro output. Finally rainfall was found to be significant only for Aus and Aman, with a positive impact on output for both varieties.
STUDY AREA Nalgonda district is a district in the Telangana state of India. It has a population of 3,483,648 of which 13.32% is urban as of 2011.The district is spread over an area of 2,449.79 square kilometres (945.87 sq mi). As of 2011 Census of India, the district has a population of 1,631,399 Nalgonda district is the fourth largest district of Telangana. It is located between 160 25’ & 170 50’ N of latitude, 780 40’ & 800 05’E of longitude. The district covers an area of 14’240 sq.kms. The primary crops that are grown in this district are paddy, jowar, ground nut and chillies. The two agro – climatic zones included in Nalgonda district are the southern Telangana zone and the Northern Telangana Zone.
The Krishna River, Musi River, Aleru, Peddavagu, Dindi River, Halia River and Paleru flow through the Nalgonda district. The district is much affected by high fluorine content in water.
The district is divided into three revenue divisions of Nalgonda, Miryalaguda, and Devarakonda. These are sub-divided into 31 mandals and have 565 villages.
METHODOLOGY The Secondary method data was used in this study is to analyze the various meteorological parameters and its effect on agricultural productivity at the mandal and district level of Nalgonda district. The study is conducted for 10 years an analysis of the agricultural, socio-economic and meteorological data is carried out. Computation of statistical related to the average monthly, seasonal and annual rainfall is done using the SPSS & Microsoft Excel 2007 software for each mandal of the district. In order to detect any persistence in the rainfall series a linear regression test was done.
CLIMATE CHANGE AND AGRICULTURE Climate change and agriculture are interrelated processes, both of which take place on a global scale. Climate change affects agriculture in a number of ways, including through changes in average temperatures, rainfall, and climate extremes (e.g., heat waves); changes in pests and diseases; changes in atmospheric carbon dioxide and ground-level ozone concentrations; changes in the nutritional quality of some foods; and changes in sea level. Climate change is already affecting agriculture, with effects unevenly distributed across the world. Future climate change will likely negatively affect crop production in low latitude countries, while effects in northern latitudes may be positive or negative. Climate change will probably increase the risk of food insecurity for some vulnerable groups, such as the poor. Agriculture contributes to climate change by:
1) Anthropogenic emissions of greenhouse gases (GHGs), and
2) by the conversion of non-agricultural land (e.g., forests) into agricultural land. Agriculture, forestry and land-use change contributed around 20 to 25% to global annual emissions in 2010.
There are a range of policies that can reduce the risk of negative climate change impacts on agriculture, and to reduce GHG emissions from the agriculture sector.

73
International Journal of Research in Management & Social Science Volume 5, Issue 3 (IV): July - September, 2017
ISSN 2322 - 0899
RESULTS AND DISCUSSIONS There are two district zones into which the Nalgonda district can be divided. The northern Telangana zone comprises of the selected four mandals. This region has an annual rainfall between 900 to 1000 mm. The other zone is the Southern Telangana zone which has the annual rainfall between 600 to 800 mm. The two meteorological parameters of rainfall and temperature are used for analysis of all the 59 mandals of the district. As far as temperature and rainfall is concerned data was collected for a period beginning 2006 to 2016. No significant change in temperature was observed in the region and the maximum and minimum temperatures remained constant. Studies carried out earlier in the region have shown a district relationship between temperature and agricultural productivity. By just 20c increase in temperature, the rice yield in various parts of India reduces by about 0.75 ton/hectare in the yielding zones (Agricultural Census Profile 2011). While the Rabi cropping is underway in many parts of North India the temperature increases by about 10 c. And some specific regions show a larger climatic variation with a larger impact on Rabi crop production. In Kerala for a one degree rise in temperature the rice yield falls by about 6%. All these facts clearly indicate that studies related to temperature variation is crucial to get to know about agricultural productivity of crops in a given region (Agricultural Journal of India 2014). In this study an analysis was carried out on the district level rainfall data gathered between the periods 2006 to 2016. The percentage difference between the annual and normal rainfall in the Nalgonda district ranges from -43.7 to 22.2%.
Graph : 1
Graph : 2
Graph: 3

74
International Journal of Research in Management & Social Science Volume 5, Issue 3 (IV): July - September, 2017
ISSN 2322 - 0899
Graph: 4
Graph: 5
As the graph:1 shows there is a lot of deviation in the quantity of rainfall in the year 2009-10 where the rainfall exceeds the normal rainfall of 762 mm to 929 mm showing 22.2% deviation. In the year 2008-09 the rainfall recorded was 433.6 mm which was lower than the normal rainfall showing a -43.7% deviation. There is a decrease in the percentage deviation as is depicted by the linear trend. The above finding highlights the fact that there is a change in the rainfall pattern in the present study four major crops grown in the district i.e. paddy, groundnut, jowar and chilles were selected to analyze the correlation between agricultural productivity and rainfall patterns. Data was collected based on variation in yields for the period of 2006 -07 to 2016 graph (1) to (5) shows the relation between the annual rainfall and the crop yield data. From graph (3) it becomes clear that for paddy there is no direct correlation between the quantum of rainfall and the crop yield. So as far as paddy is concerned other factors like average area of crop sown, fertilizers, pesticides, other sources of water affect productivity and not rainfall alone. In this study for crops like Chillies and jowar a distinct positive correlation was observed between yield and rainfall. This correlation was established based on an analysis of rainfall data for seasonal period and yield prediction models using rainfall and productivity for the period 2006-2016. The figures show that the predictability of productivity of crops using seasonal rainfall is low at the centre for all crops except groundnut. From graph (4) it becomes clear that a direct relation exists between agricultural productivity and annual rainfall. A decrease in rainfall results in a decline in crop yield. Graph 4 & 5 shows that as paddy there is no correlation between the rainfall patterns and the crop yield for chillies and jowar.
Whatever be the annual rainfall the yield has remained within the range of 123 to 364kg/ha. As mentioned earlier crops like paddy has a mixed response to rainfall and so other parameters must be considered to establish correlation like fertilizers, pesticides, micronutrients etc. In this study a cluster analysis was carried out for the four crops paddy, chillies, jowar and Groundnut depending on the results of the crop yields and rainfall patterns. To identify the distinct cluster of rainfall and crop yields the average linkage method of clustering was adopted. In this method classification of the objects. (I.e. the N years of rainfall – crop yield data in the present case) into district clusters is carried on, on the basis of the relative distance between the objects, which measure the degree of closeness between them. In the study, dendogram and hierarchical clustering between south west monsoon data, annual rainfall and yield of the four crops – Paddy, jowar, Chillies and Groundnut were done; the cluster analysis was undertaken because it gives significant information about the yield response corresponding to the different types of rainfall patterns that occur at the time of the crop growth season. The cluster analysis confirms the fact that there is a one to one correlation between rainfall and crop yield as far as the Groundnut crop is concerned. And as observed earlier there is no correlation between rainfall and crop yield as for as the Paddy

75
International Journal of Research in Management & Social Science Volume 5, Issue 3 (IV): July - September, 2017
ISSN 2322 - 0899
Jowar and Chillies and concerned. And from this it can be concluded that for Paddy, Jowar and Chillies crops other sources of water, insecticides/ pesticides and the area of crop being sown every year need to be considered to calibrate agricultural productivity. From the cluster analysis and direct impact of rainfall on agricultural productivity it becomess clear that there is clear cut relation between productivity and climate condition of a region. And there it can be concluded that vagaries of temperature and rainfall definitely influence agricultural productivity. An attempt was also made, in the study, to correlate the agricultural GDP and the prices. An analysis was done using the Ordinary least Square Model (OLS) to ascertain the impact of weather variables on the agricultural GDP. The data required was gathered for the period starting from 2006 to 2016 and the relation between the prices of commodities for the years studied was carried out. The R2 values were estimated using the OLS model and its importance was analyzed for 2 data sets (1) Prices, Rainfall and Agricultural productivity and (2) GDP, Prices and Rainfall and Productivity. Table ii presents the R- square, Multiple – R values. A similar study was made on the effect of weather on commodity prices and calibrated the effect of weather disturbances on commodity prices and its resultant effect on inflation, exchange rates and GDP. The findings were that production and prices were also affected by differences in rainfall.
Table I – Results of Ordinary least square method (Nalgonda) Commodities Prices, Rainfall, Production GDP,Prices,Rainfall, Production
Observations Multiple R R Square Multiple R R Square Rice 15 0.67 0.47 0.75 0.63 Groundnut 15 0.47 0.22 0.77 0.65 Chilies 15 0.27 0.4 0.70 0.54 Jowar 15 0.56 0.33 0.74 0.61
CONCLUSION This study was conducted in Nalgonda district of Telangana, to understand the impact of climate change on agricultural productivity and GDP. The district has 59 mandals. At the mandal and district level, rainfall, temperature and its effect on productivity was analyzed by taking climatic data for a period of 10 years. It is found that there was not much deviation in the maximum and minimum temperatures in all the mandals of the district during this period. There was a lot of transgression of rainfall from that of the normal rainfall in the year 2009-10 where it has exceeded the normal rainfall by 22%. And in the year 2006-07 the rainfall recorded was less than the normal rainfall and the deviation was -43.7%. For all the 59 mandals of the district the coefficients of variance (COV) were calculated. As predicted the study shows significant changes in the pattern of rainfall in the mandals selected for the study. The R2 values differed from 0.02 to 0.09. And this has had its impact on the productivity of Paddy, Chillies, Jowar and groundnut in the region. To ascertain the effect of climate change on agricultural productivity of Paddy, Chillies, Jowar and Groundnut crops, cluster analysis and the OLS model were used and the analysis showed a direct impact of rainfall on the productivity of Groundnut and jowar, and it is a mixed response for Paddy. Therefore it is concluded that both agricultural productivity and in turn agricultural GDP are affected to a great extent by climatic variations.
REFERENCES 1. Allison PD (2012) Logistic regression using SAS. Theory and application, 2nd edn. SAS Institute Inc.,
Cary, pp 60–63 2. Antle JM (2008) Climate change and agriculture: economic impacts. Choices. The magazine of food,
farm, and resource issues, American Agricultural Economic Association 23:9–11 3. Bruinsma J (ed) (2003) World agriculture: towards 2015–2030: an FAO perspective. Earthscan, London,
pp 357–371 4. Christiaensen L, Deme L, Kühl J (2006) The role of agriculture in poverty reduction an empirical
perspective. World Bank Policy Research Working Paper 4013 5. Ciscar JC, Iglesias A, Perry M, Regemorter DV (2012) Agriculture, climate change and the global
economy. Working Paper Version 15. Institute for Prospective Technological Studies (IPTS), Edificio Expo, Spain
6. Cline WR (2007) Global warming and agriculture: impact estimates by country. Center for Global Development and Peterson Institute for International Economics, Washington, DC
7. Cruz RV, Harasawa ML, Wu S, Anokhin Y, Punsalmaa B, Honda Y, Jafari M, Li C, Ninh NH (2007) Asia. In: Parry ML, Canziani OF, Palutikof JP, Van der Linden PJ, Hanson CE (eds) Climate change

76
International Journal of Research in Management & Social Science Volume 5, Issue 3 (IV): July - September, 2017
ISSN 2322 - 0899
2007: impacts, adaptation and vulnerability, contribution of Working Group II to the fourth assessment report of the Intergovernmental Panel on Climate Change. Cambridge University Press, Cambridge, pp 469–506
8. Darwin R, Tsigas M, Lewabdrowski J, Raneses A (1995) World agriculture and climate change. Agricultural economic report no. 703. US Department of Agriculture, Economic Research Service, Washington, DC
9. Deressa TT (2007) Measuring the economic impact of climate change on ethiopian agriculture. Policy Research Working Paper 4342. The World Bank Development Research Group
10. Dinar A, Mendelsohn R, Evenson RE, Parikh J, Sanghi A, Kumar K, McKinsey J, Lonergan S, eds (1998) Measuring the impact of climate change on Indian agriculture. World Bank Technical Paper 402. Washington, DC
11. Economic Survey, Odisha (2009–2010, 2012–2013). Planning and Coordination Department, Directorate of Economics and Statistics, Government of Odisha
12. Fischer G, Shah M, Tubiello FN, Velthuizen HV (2005) Socio-economic and climate change impacts on agriculture: an integrated assessment, 1990–2080. Philos Trans R Soc B 360:2067–2083. doi:10.1098/rstb.2005.1744
13. Gbetibouo GA, Hassan RM (2005) Measuring the economic impact of climate change on major South African field crops: a Ricardian approach. Glob Planet Change 47:143–152. doi:10.1016/j.gloplacha.2004.10.009
14. Gillig D, McCarl BA (2002) Introduction to computable general equilibrium models (CGE). Department of Agricultural Economics, Texas A and M University
15. Green WH (2003) Models for panel data. Econometric analysis, vol 5. Pearson Education, South Asia, pp 283–334
16. Guiteras R (2007) The impact of climate change on Indian agriculture. Job Market paper-Draft, Department of Economics, MIT
17. Kumar KSK, Parikh J (2001) Indian agriculture and climate sensitivity. Glob Environ Change 11:47–154. doi:10.1016/S0959-3780(01)00004-8
18. Kurukulasuriya P, Mendelsohn R (2008) A Ricardian analysis of the impact of climate change on African cropland. Afr J Agric Resour Econ 2:1–23
19. Mahapatra R (2006) Disaster dossier: the impact of climate change on Orissa. InfoChange news & features. http://infochangeindia.org/environment/features/disaster-dossier-the-impact-of-climate-cha. Accessed 21 May 2013
20. Mendelsohn R, Dinar A (2003) Climate, water, and agriculture. Land Econ 79:328–341. doi:10.3368/le.79.3.328
21. Ninan KN, Satyasiba B (2012) Climate change, agriculture, poverty and livelihoods: a status report. Working Paper 277, Institute for Social and Economic Change, Bangalore
22. Nordhaus WD (1991) Economic approaches to greenhouse warming. In: Dornbush RD, Poterba JM (eds) Global warming: economic policy approaches. MIT Press, Cambridge, pp 33–68
23. Odisha Agricultural Statistics (2008–2009) Directorate of Agriculture and Food Production, Government of Odisha
24. Orissa Climate Change Action Plan 2010–2015, Government of Orissa 25. Parry ML, Canziani OF, Palutikof JP, Van der Linden PJ, Hanson CE (eds) (2007) Climate change 2007:
impacts, adaptation and vulnerability, contribution of Working Group II to the fourth assessment report of the Intergovernmental Panel on Climate Change, chapter 2. Cambridge University Press, Cambridge
26. UNFCC (2007) Climate change: impacts, vulnerabilities and adaptation in developing countries. www.unfccc.int/resource/docs/publications/impacts.pdf. Accessed 15 Feb 2014
27. WMO/UNEP Intergovernmental Panel on Climate Change (1989) Report of the second session of WMO/UNEP IPCC. World Climate Programme Publication Series
28. Zhai F, Lin T, Byambardorj E (2009) A general equilibrium analysis of the impact of climate change on agriculture in the People’s Republic of China. Asian Dev Rev 26:206–225

77
International Journal of Research in Management & Social Science Volume 5, Issue 3 (IV): July - September, 2017
ISSN 2322 - 0899
DESIGN AND SYNTHESIS OF VEDIC FLOATING POINT MULTIPLIER
Soumya Gulannanavar1 and Dr. S. S. Kerur2 M. Tech. Student1 & Assistant Professor2, SDM College of Engineering and Technology, Dharwad, Karnataka
ABSTRACT Vedic multiplier is one of the fast multiplier it required less power, time and area but the performance is in high speed then it gives more effectiveness and less difficulty. Application of DSP performances are depending on the slowest constituent of the system. There are 16 algorithm or sutras in the Vedic in this Urdhva tiryakbhyam has explain in this paper. By considering the single and double precision in vedic floating point multiplier in the standard for single and double precision in IEEE-754 format it divides into sign, exponent, and mantissa for operation of mantissa use this sutra, then exponent used the adders, for sign bit use XOR operation. Some different multiplier also perform same operation such multipliers are Karatsuba algorithm, Booth multiplier, Braun multiplier. Xilinx tool with FPGA is used for design and synthesis.
Keywords: Vedic multiplier, Booth, Braun, Karatsuba, Urdhva triyakbhyam, FPGA, Floating point.
INTRODUCTION The demonstration of floating point and fixed point is used for designing the data processors, digital signal processors (DSP) and digital filters for several functions which give necessary performances and accuracy speed [1] the representation Fixed point and floating point number. The floating point is comparatively slower and represents the large range of number. The representation of all real number in binary format is called floating point number representation. Binary and decimal inter changing the format. In this crucial part is mantissa so that representation of floating point used the Vedic mathematics. Several algorithms or sutras are involved in Vedic mathematics in that Urdhva tiryakbhyam is used because it gives high efficiency in area, time, and power and also give the efficient result. Representation of single and double precision as shown below.
Fig 1: single and double precision format for floating point representation
LITERATURE SURVEY As indicated by Honey Durga Tiwari [2] a Vedic multiplier and square engineering is proposed in view of calculation of old Indian Vedic Mathematics, for low power and fast applications. This Paper demonstrates how the computational many-sided quality is diminished on account of Vedic multipliers as contrasted with the regular multipliers.
As per Mohamed Al-Ashrafy[3] for planning of floating point multiplier is productive utilizing the carry save multiplier. He introduces the execution of a gliding side of the floating point multiplier that wires those IEEE 754-2008 parallel profession organize those multiplier doesn't complete changing also recently exhibits those principal extension consequence Concerning illustration appears to be will be (48 bits) this provides for better precision whether the aggregate 48 odds need aid utilized within an additional unit i.e. A floating point purpose twist will shape and MAC unit. Those frameworks need three pipelining phases furthermore, then afterward utilization once a Xilinx Virtex5 FPGA.
Pavan Kumar et al. [4], this paper advises those utilization of a 8-bit vedic multiplier enhanced as far as engendering postpone. The point when contrasted to general multiplier like exhibit multiplier, Braun multiplier, corner multiplier Also Wallace tree multiplier. Done over framework we need utilized 8-bit barrel shifter which obliges exactly a single clock cycle for “n” amount of developments. The arrange will be executed what’s more declared using FPGA what’s more ISE test system. The focus might have been executed with respect to Xilinx Spartan-6 crew xc6s1x75T-3-fgg676 FPGA. The handlings allow correspondence might have been evacuated from the mix report card furthermore static arranging report card likewise. Those setup Might fulfill spread delay from claiming 6. 781ns using barrel shifter before, base decision module what’s more multiplier.

78
International Journal of Research in Management & Social Science Volume 5, Issue 3 (IV): July - September, 2017
ISSN 2322 - 0899
As for every Aniruddha Kanhe [5] proposed the work on Vedic multiplier method may be used should complete IEEE 754 nomadic side of the floating point multiplier. The Urdhva-triyakbhyam sutra is used to that duplication about mantissa spot. Those commitments of the multiplier are provided for previously, IEEE standard 754, 32 bit. That coasting purpose multiplier will be completed in VHDL furthermore Virtex-5 FPGA will be used. Build for two skim perspective numbers spoke to previously, IEEE 754 setup is done for configuration to increasing standardized 24 touch mantissa, including those 8 bit sorts and resultant is transformed. In for excess 127 ends arrange, to those sign estimation those data sign odds are XORed. In this paper, recommend count is the Vedic multiplication is the computation for duplication for 24 bit. The execution of mantissa bit unit general all execution of the gliding side of the floating point multiplier. Those type figuring unit is completed in this paper using 8 bit swell convey snake use more deferral.
After surveying one thing is observed that by using Vedic multiplication technique for floating point multiplier in IEEE 754 gives the very well-organized result than other and also by using the Urdhva tiryakbhyam sutra in Vedic multiplier it necessary less power, area, delay then minimum clock rate in the ripple carry adder with smaller gain. Thus proposed work consists of designing of Vedic multiplication, Booth multiplication, Braun multiplication and also adders and implemented in Xilinx 14.5 Spartan-6 FPGA.
DESIGN METHODOLOGY The floating point number is represent in single and double precision in IEEE-754 standard is divides into three dissimilar units are:
Sign calculation unit. Exponent calculation unit. Mantissa calculation unit.
Fig 2: Floating point multiplier for single precision in IEEE 754 format
Floating point number can be done single What's more double precision way of action for estimate of sign bit, exponent part, and mantissa touch of the item is normalizing and in addition come about may be alter off. In the sign bit the two operands require aid planned through those XOR work done in sign spot. Operands of the both exponents are included to get the result of the type. Over single precision subtracted starting with 127 in the whole of currency of the resultant. In double precision predisposition type from 1023. At that point 8 bit and also 11 bit adders would utilize within single What's more double precision may be utilized for secondary speed exhibitions. At whatever duplication algorithm will be utilized within mantissa multiplier.
VEDIC MULTIPLICATION Vedic mathematics the idea is dependent upon antiquated mathematics it provides for the dependable furthermore quick performs in the operation for math it comprise about sixteen sutras What's more thirteen Upsutras. Vedic is concentrated from the expressions Veda it will be those spot the place know information gathers together it may be rediscovered by Sri Bharati Krishna Tirthaji in the quite a while of 1911 and 1918 the

79
International Journal of Research in Management & Social Science Volume 5, Issue 3 (IV): July - September, 2017
ISSN 2322 - 0899
worth of effort done by demonstration about scientific outflow also separate requisitions then talk about the Vedic will be the metal method, particular case line, super quick for fast cross checking framework.
URDHVA TIRYAKBHYAM AND KARATSUBA ALGORITHM Urdhva tiryakbhyam will be the Indian ancient mathematics over Vedic it will be clinched beside Sanskrit writing and novel particular idea [6]. Urdhva implies “vertically” also Tiryakbhyam intends “crosswise”. On vertical and crosswise are easily realizable. Urdhva Tiryagbhyam this reduced the delay and also gives greater extent.
Fig 3: 232x323=74936 multiplication by using Urdhva Tiryagbhyam sutra with line diagram
Fig 4: Proposed Vedic multiplication algorithm

80
International Journal of Research in Management & Social Science Volume 5, Issue 3 (IV): July - September, 2017
ISSN 2322 - 0899
The proposed Vedic algorithm include about two 6 bit number will be included. With respect to 7 bit multiplier will make arranged over single precision coasting viewpoint using vedic multiplier algorithm also a 7 bit multiplier might a chance to be used similarly input a feature subsequently 24 bit multiplier will a chance to be needed. In that side of the point an 8 bit multiplier might make illustrated for double precision coasting end goal likewise 53 spot multiplier may be used similarly as crucial part.
3.2 ADDER UNIT Operation of the exponent is done by using the adders the proposed work consist of ripple carry adder and carry look ahead adder. For single precision 8 bit then double precision 11 bit are utilized.
Fig 5: 8 bit ripple carry adder
One of the logic circuit is ripple carry adder. Full adder for every carry out is following the next full adder for the majority significant. In this for next phase rippled the each carry bit.
Fig 6: 8 bit carry look ahead adder
In digital logic Carry look ahead adder is used. It improves the rate and determining the carry it also reduce the delay and also doesn’t wait for carry generator. It is faster compare to other adders.
4. RESULT ANALYSIS
Fig 7: 32 bit Vedic multiplier block module

81
International Journal of Research in Management & Social Science Volume 5, Issue 3 (IV): July - September, 2017
ISSN 2322 - 0899
Fig 8: 32 bit Vedic multiplier RTL schematic
Fig 9: 32 bit Vedic multiplier simulation result
. Fig 10: 64 bit Vedic multiplier block module using ripple carry adder
Fig 11: RTL schematic 64 bit Vedic multiplier using ripple carry adder
Fig 12: Simulation result for 64 bit Vedic multiplier using ripple carry adder

82
International Journal of Research in Management & Social Science Volume 5, Issue 3 (IV): July - September, 2017
ISSN 2322 - 0899
4.1 COMPARISON OF DEVICE UTILIZATION AND TIMING REPORT
Table 1: Single precision for device utilization and timing summary
Table 2: Double precision for device utilization and timing summary
Fig 13: Bar graph comparison for single precision

83
International Journal of Research in Management & Social Science Volume 5, Issue 3 (IV): July - September, 2017
ISSN 2322 - 0899
Fig 14: Bar graph comparison for double precision
6. CONCLUSIONS We conclude by seeing the device utilization and timing summary for single and double precision the Vedic multiplier requires a smaller amount LUT slices, lesser number of bounded IOBs and a smaller amount of IOs evaluate to other methods. Vedic multiplier is well-organized gorgeous method in terms of rate, area, cost then performance. In this paper the design and synthesize by using the Xilinx 14.5.
REFERENCES [1] Ravi Kishore Kodali, Lakshmi Boppana and Sai Sourabh Yenamachintala
www.researchgate.net/publication/283661712 Article. April 2015 “Implementation of vedic floating point Multiplier”.
[2] Honey Durga Tiwari, Ganzorig Gankhuyag, Chan Mo Kim, Yong Beom Cho, "Multiplier design based on ancient Indian Vedic Mathematics”, 2008 International SoC Design Conference, PP 65-68.
[3] Mohamed Al-Ashrafy, Ashraf Salem, Wagdy Anis. “An Implementation of Floating Point Multiplier”.
[4] Pavan Kumar, Saiprasad Goud A, and A Radhika had published their research with the title “FPGA Implementation of high speed 8-bit Vedic multiplier using barrel shifter”, 978-1-4673-6150 7/13 IEEE 2013.
[5] Aniruddha Kanhe, Shishir Kumar Das, Ankit Kumar Singh,” Design and Implementation of Floating Point Multiplier based on Vedic Multiplication Technique” 2012 International Conference on Communication, Information & Computing Technology (ICCICT), Oct. 19-20, Mumbai, India
[6] S. S. Kerur, Prakash Narchi, Jayashree C N, Harish M Kittur and Girish V A Implementation of Vedic Multiplier for Digital Signal Processing International Conference on VLSI, Communication & Instrumentation (ICVCI) 2011 Proceedings published by International Journal of Computer Applications® (IJCA).

84
International Journal of Research in Management & Social Science Volume 5, Issue 3 (IV): July - September, 2017
ISSN 2322 - 0899
CORPORATE GOVERNANCE AND ITS ROLE IN FIRM’S PERFORMANCE
Dr. Sampada Kapse Director, Tolani Institute of Management Studies, Adipur
ABSTRACT Good Corporate Governance increases confidence of shareholders in the company. This leads to better stock prices. Research has shown that the good Corporate Governance brings down the cost of capital for the company. Good disclosure practices lead to a more liquid market for the company. This lowers cost of debt for the company. Thus the CEOs of today, there is a clear business case for complying with principle of good Corporate Governance.
In this paper the correlation of the corporate governance with the firm’s performance is measured. Corporate governance is measured on the basis of the rules laid down in clause 49.
The corporate governance is measured for 7 different companies according to the norms they follow and mentioned in their corporate governance report. Company’s performance was measured through ROE, Net Profit Margin, Sales growth, dividend yield and Tobin’s Q.
INTRODUCTION Corporate Governance was probably thought of after the Watergate scandal in the United States. This scandal led to the development of the Foreign and Corrupt Practices Act of 1977 in USA .In May 1991, the London Stock Exchange set up a Committee called The Cadbury Committee, under the chairmanship of Sir Arian Cadbury in an attempt to prevent the recurrence of such business failures.
The Confederation of Indian Industry (CII) published India’s first comprehensive code on corporate governance (Desirable Corporate Governance: A Code) in 1998. This was followed by the recommendations of the Kumar Mangalam Birla Committee on Corporate Governance and followed by a committee under Mr. N. R. Narayana Murthy appointed by the Securities and Exchange Board of India (SEBI). The recommendations were accepted by SEBI in December 1999, and are now enshrined in Clause 49 of the Listing Agreement of every Indian stock exchange. The revised Clause 49 has been made effective from January 1, 2006.
Corporate governance is a system by which business corporations are directed and controlled. It also spells out the rules and procedures for corporate decision-making. It is a system of structuring, operating and controlling a company with a view to achieve long-term strategic goals to satisfy shareholders, creditors, employees, customers and suppliers, and complying with the legal and regulatory requirements, apart from meeting environmental and local community needs.
The following bodies playing major role in corporate governance: a. The CEO, i.e., the management
b. The board of directors
c. The shareholders
Well governed companies regularly disclose full data on their Ownership pattern, management structure, latest operating &financial data, Disclosure of Transactions with affiliates, subsidiaries and related parties, executive compensation and no business ties with the auditors.
Investment, divestment; and also any other policy matter like compensation, salary, remuneration, sitting fee, etc., of directors.
LITERATURE REVIEW In the paper Institutional Investors and Corporate governance of India, Pitabas Mohanty using nineteen measures of corporate governance, a corporate governance index is developed which is positively associated with financial performance. Through this paper we can know that institutional investors lent money to the organizations to have better corporate governance measures. It also revealed that companies with good financial performance have actually performed better compared to companies with poor governance records and that development financial institutions have extended loans to companies with good governance records. The research paper, The Corporate Governance of Banks: A Concise Discussion of Concepts and Evidence by Ross Levine (2003) examines the corporate governance of banks. When banks efficiently mobilize and allocate funds, this lowers the cost of capital to firms, boosts capital formation, and stimulates productivity growth. After reviewing the major governance concepts for corporations in general, this paper discusses two

85
International Journal of Research in Management & Social Science Volume 5, Issue 3 (IV): July - September, 2017
ISSN 2322 - 0899
special attributes of banks that make them special in practice: greater opaqueness than other industries and greater government regulation. These attributes weaken many traditional governance mechanisms. Next, the paper reviews emerging evidence on which government policies enhance the governance of banks and draws tentative policy lessons. In sum, existing work suggests that it is important to strengthen the ability and incentives of private investors to exert governance over banks rather than relying excessively on government regulators.
Corporate governance in Insurance Industry in India by Anabil Bhattacharya explains the corporate governance and various issues addressed by it. It also shows the requirement of corporate governance and the fundamentals of its existence. Speaking of the insurance sector, since they are not listed in Indian stock exchange, both private and public sector insurance companies have adopted corporate governance norms in general but not as elaborate as required by clause-49. In Insurance Sector IRDA is to introduce Corporate Governance norms
Corporate governance and firms’ performance by Sanjai Bhagat and Brian Bolton sheds light on how corporate governance is measured and the relationship between corporate governance and performance, while taking into account the endogenity of the relationships among corporate governance, corporate performance, corporate capital structure, and corporate ownership structure. It also reveals that none of the governance measures are correlated with future stock market performance. In several instances inferences regarding the (stock market) performance and governance relationship do depend on whether or not one takes into account the endogenous nature of the relationship between governance and (stock market) performance. Also, given poor firm performance, the probability of disciplinary management turnover is positively correlated with stock ownership of board members, and board independence.
In the paper, Corporate governance, enforcement, and firm value: Evidence from India by Dhammika Dharmapala & Vikramaditya Khanna examines the causal impact of corporate governance on firm value, using a sequence of corporate governance reforms in India. These reforms had several unusual features that facilitate identification of this causal effect. In particular, a large group of firms was exempted from the reforms, and the complex rules for the application of the reforms created considerable overlap in the characteristics of affected and unaffected firms. The primary contribution of the paper is thus to add to the very limited body of causal evidence for the proposition that corporate governance affects firm value. Moreover, the paper also highlights the role of enforcement – the substantive legal rules are shown to have little effect until the enactment of severe sanctions.
The paper Earnings Management, Corporate Governance, and True Financial Performance by Marcia Millon Cornett, Alan J. Marcus, Anthony Saunders, Hassan Tehranian (May 2005) addresses two questions. First, do corporate governance mechanisms that have been shown to affect firm behavior in other contexts also affect the degree to which firms manage their reported financial performance? Second, does past research investigating the impact of governance structure and option-based compensation on firm performance stand up when measured performance is adjusted for the impact of earnings management? It demonstrates that corporate governance mechanisms effectively constrain discretion in earnings management and that the estimated impact of governance variables on corporate performance is far stronger when discretionary accruals are removed from reported earnings. Institutional ownership of shares, institutional investor representation on the board of directors, and the presence of independent outside directors on the board all reduce the use of discretionary accruals in earnings management. These factors largely offset the impact of options compensation, which we find strongly encourages earnings management. Earnings management strongly affects patterns of reported corporate performance. While conventional profitability measures suggest a strong relationship between option compensation and firm performance, profitability measures that are adjusted for the impact of discretionary accruals show no relationship with option compensation. In contrast, the estimated impact of corporate governance variables on firm performance more than doubles when discretionary accruals are eliminated from measured profitability.
Corporate Governance in the 2007-2008 Financial Crisis: Evidence from Financial Institutions Worldwide by David Erkens, Mingyi Hung, and Pedro Matos, (August 2009) investigates the role of corporate governance in the 2007-2008 credit crisis, using a unique dataset of 306 financial firms from 31 countries that were at the center of the crisis. It is seen here that the CEOs were more likely to be replaced following large losses if firms had more independent boards, higher institutional ownership, and lower insider ownership Firms with more independent boards and institutional ownership experienced larger losses during the crisis, and that firms with more institutional ownership took more risk before the crisis. They found that the firms that used CEO compensation contracts with a heavier emphasis on annual bonuses (as opposed to equity-based

86
International Journal of Research in Management & Social Science Volume 5, Issue 3 (IV): July - September, 2017
ISSN 2322 - 0899
compensation) experienced larger losses during the crisis and took more risk before the crisis. Overall, findings suggest that while governance is positively associated with the disciplining of executives for losses incurred during the crisis period, it did not prevent these losses, but instead exacerbated them by encouraging executives to focus on short-term performance.
Corporate Governance: Effect on firm’s performance and economic growth by Maria Maher and Thomas Andersson addresses corporate governance and its effect on corporate performance and economic performance. It gives more exposure to the shareholder and stakeholder models of corporate governance. It then goes on to address some of the underlying factors that promote efficient corporate governance, and examines some of the strengths, weaknesses, and economic implications associated with various corporate governance systems. The document also provides a survey of empirical evidence on the link between corporate governance, firm performance and economic growth. However, there is no single model of corporate governance and each country has through time developed a wide variety of mechanisms to overcome the agency problems arising from the separation of ownership and control. The document looks at the various mechanisms employed in different systems (e.g. concentrated ownership, executive remuneration schemes, the market for takeovers, cross-shareholdings amongst firms, etc.) and examines the evidence on whether or not they are achieving what they were intended to do.
Corporate Governance and Firm’s Performance by Lawrence D. Brown & Marcus L. Caylor (2004) has created a broad measure, Gov-Score. It is a composite measure of 51 factors encompassing eight corporate governance categories: audit, board of directors, charter/bylaws, director education, executive and director compensation, ownership, progressive practices, and state of incorporation. It relates Gov-Score to operating performance, valuation, and shareholder payout for 2,327 firms, and found that better-governed firms are relatively more profitable, more valuable, and pay out more cash to their shareholders. It examines which of the eight categories underlying Gov-Score are most highly associated with firm performance. It also shows that good governance, as measured using executive and director compensation, is most highly associated with good performance where as in contrast good governance as measured using charter/bylaws is most highly associated with bad performance. Here it is examined that which of the 51 factors underlying Gov-Score are most highly associated with firm performance.
Can Corporate Governance reforms increase firm’s market value: Evidence from India by Bernard S. Black and Vikramaditya S. Khanna (2007) employed regression methodology, event study methodology and prices of the stock prices to correlate the reforms made and its effect on firm’s market value. Here they studied the impact of India’s adoption of major governance reforms (Clause 49). Clause 49 requires, among other things, audit committees, a minimum number of independent directors, and CEO/CFO certification of financial statements and internal controls. They measured the difference in effective dates and the reaction of the market toward the firms. They selected a sample of 3000 firms (small and large). The large firm gained and the small firms remained as it is. Intermediary firms gained in an average ratio. They had a two weeks window to study these reactions.
OBJECTIVE To analyze the effect of corporate governance on the companies ‘performance
METHODOLOGY Researcher compared the various corporate governance factors and cross analyze with the factors for each of the 7 firms’ performance. Factors have been selected following the clause 49. Various corporate governance factors taken into account for calculating the G-Score are,
1. BOARD OF DIRECTORS a. 50% board of directors are independent directors
b. All directors attend at least 75% of board meeting
c. The board must lay down a code of conduct for all board members and senior management, and must record an annual affirmation.
d. Compensation committee is comprised solely of independent outside directors.
e. Shareholder vote on directors selected to fill vacancies
f. Board members are elected annually
g. Governance committee meets at least once during the year

87
International Journal of Research in Management & Social Science Volume 5, Issue 3 (IV): July - September, 2017
ISSN 2322 - 0899
2. AUDIT COMMITTEE a. Two-third of the members of audit committee shall be independent directors
b. The audit committee meeting conducted at least four times in a year.
3. SUBSIDIARY COMPANIES a. The significant transactions and arrangements of subsidiary companies are notified regularly to the
board of directors of the listed holding company.
4. BOARD DISCLOSURES a. Risk assessment and minimization procedures are periodically reviewed by executive management.
b. The company publishes its criteria of making payments to non-executive directors in its annual report.
c. Remunerations given to the directors.
5. EXECUTIVE AND DIRECTOR COMPENSATION a. Stock incentive plans were adopted with shareholder approval.
b. Directors receive all or a portion of their fees in stock
c. Company expenses stock options
d. Non-employees do not participate in company pension plans.
6. PROGRESSIVE PRACTICES
a. Mandatory retirement age for directors exist
b. Performance of the board is reviewed regularly
c. A board-approved CEO succession plan is in place
d. Board has outside advisors.
e. Acceptance of responsibility for establishing and maintaining internal controls which has been evaluated and disclosed in front of the auditors by the CEO and CFO
7. REPORT ON CORPORATE GOVERNANCE a. Companies annual report should have a detailed separate section for corporate governance FIRM’S PERFORMANCE WAS MEASURED ON THE FOLLOWING PARAMETERS: 1. Return on Equity: Return on Equity (ROE, Return on average common equity, return on net worth, Return on ordinary shareholders' funds) (equity) measures the rate of return on the shareholders' equity. It measures a firm's efficiency at generating profits from every unit of shareholders' equity (also known as net assets or assets minus liabilities). ROE shows how well a company uses investment funds to generate earnings growth.
2. Net Profit Margin: Profit margin, net margin, net profit margin or net profit ratio all refer to a measure of profitability. It is calculated by finding the net profit as a percentage of the revenue.
The profit margin is mostly used for internal comparison. Low Net profit ratio indicates low profit margins and decrease in sales would have negative impact on company’s performance. It is difficult to accurately compare the net profit ratio for different entities because the scale of investment may differ. The life of the company may be different. Profit margin is an indicator of a company's pricing policies and its ability to control costs. Differences in competitive strategy and product mix cause the profit margin to vary among different companies
3. Sales Growth: The increase in sales over a specific period of time.

88
International Journal of Research in Management & Social Science Volume 5, Issue 3 (IV): July - September, 2017
ISSN 2322 - 0899
4. Tobin’s Q: Tobin's q is a ratio comparing the market value of a company's stock with the value of a company's equity book value. The ratio was developed by James Tobin (Tobin 1969), who called it "'q', the ratio between two valuations of the same physical asset."One, the numerator, is the market valuation: the going price in the market for exchanging existing assets. It is calculated by dividing the market value of a company by the replacement value of the book equity:
5. DIVIDEND YIELD: The dividend yield or the dividend-price ratio on a company stock is the dividend per share divided by the market price per share. It is often expressed as a percentage. Its reciprocal is the Price/Dividend ratio.
CORPORATE GOVERNANCE -SCORES FOR FIRMS The annual reports of the firms were studied to understand their corporate governance policies and which of the rules and regulation were followed according to clause 49. Accordingly those factors that the companies follow are coded 1 and those that they do not follow have been given the code 0.
FINDING AND ANALYSIS The G-Score of Infosys, Bharti Airtel, Cipla, Jet Airways, ITC India Ltd, Pantaloon and Tata Motors has been calculated below.
Table 1: Governance-Score of sample companies COMPANY NAME GOV-SCORE
INFOSYS 20 BHARTI AIRTEL 18 CIPLA 17 JET AIRWAYS 16 ITC INDIA LTD. 18 PANTALOONS 18 TATA MOTORS 19
FIRMS’ PERFORMANCE MEASURES
Table 2: Firm Performance measures of sample companies
Table 3: Pearson’s Correlation between Firm performance measures and G-Score
Firm Performance measures Pearson’s Correlation with G-Score
Return on Equity 0.413
Net Profit Margin 0.651
Sales Growth -0.254
Tobin’s Q 0.366
Dividend Yield 0.497

89
International Journal of Research in Management & Social Science Volume 5, Issue 3 (IV): July - September, 2017
ISSN 2322 - 0899
The Pearson’s correlation with respect to the firm performance and the Gov-Score reflected as shown in the above table. It showed that there is a positive correlation between Gov-Score and the four firm performance measures, return on equity, net profit margin, Tobin’s Q, dividend yield and a negative correlation with sales growth. Further the significance of correlation is more in the net profit margin, which says that good corporate governance will lead to better net profit margins. Good corporate governance will also have a direct significance with the dividend yield.
There is no direct significance of corporate governance on sales growth which depends of the product, marketing and various other factors. Tobin’s Q is the most important measure that shows that how the market perceives about the company. If the companies corporate governance is good, giving a good perception and trust in its investors, they are bound to invest more in the company, and thereby increasing its market value. Similarly return on equity also shows the significance of good corporate governance. The financial performance of Infosys is higher than the other companies and subsequently its corporate governance score.
Looking into the 22 factors taken into the account to calculate the Gov-Score, one can say that it covers all the underlying aspects that a firm with good governance should carry out. But when we notice closely it can be seen that comparatively those firms with good corporate governance score do not have that good performance in respect to Return on Equity, dividend yield and Tobin’s Q.
The firm performance of Pantaloon is lower compared to that of the other companies even though its corporate governance score is more. Looking closely one can see that the section of Board of Directors have the lowest score in Pantaloons. The board members were not present in at least 75% of meeting. Compensation committee does not solely comprise of the independent members, which is a factor for lack of firm performance. The board members are not annually selected.
The success of any organization is on its foundation. The foundation mainly comprises of efficient leaders in the organization. The corporate governance is meant for this purpose of keeping the right people on the track and leading the organization towards its development. The transparency will be maintained only if the independent directors are aware of each and every fact in an organization. The more the transparency, the more will the investors trust the organization with their investments, thereby leading the organization to perform well financially.
Therefore the market value of the firm will increase.
Infosys has a Tobin’s Q ratio of 7.14. This is due the trust of investors in its corporate governance. Board of directors a selected with the votes casted by the shareholders. It is then the directors who appoint the others. Further it is necessary for the board to be comprised of at least 50% of independent directors to ensure the fairness of the board. The board of directors forms the top level managerial body of a company and the major development of the company is in their decisions. The firm will scale accordingly in its market value as per the performance. Further the performance of a firm is estimated and depends of the core value and efficiency of the directors. Infosys scores highest score in the category of board of directors and correspondingly its Gov-Score is highest.
Audit committee ensures that the financial data and other related corporate issues presented to the share holders are correct and substantial. Audit committee is another empowered body of the company.
Executive and Director Compensation: Agency problem can be solved in the structure of compensation management. This is often undertaken through the design of executive remuneration packages. In practice this usually involves tying managerial compensation to the performance of the firm, in the form of salaries, bonuses, and stock options. In this way, managerial wealth is subjected to at least some of the same risks to which shareholders and the firm are exposed. Therefore, linking managerial compensation to firm performance has been adopted in many countries as a way of aligning the interests of managers with those of shareholders. Jet airways scores less in corporate governance as well as the firm performance are also low. Only 2 factors out of 4 are satisfied in the category of executive and director compensation.
CONCLUSION Gov-Score of 7 companies is calculated with accordance of the 22 factors. These factors were selected in regard of clause 49. Their Gov-score was then correlated with 6 firm performance measures. It can be seen that the firm performance is related to the governance-score. Infosys having the highest score is yielding very good firm performance. There is a significant relation between each category of Gov-score and the performance of the firm. Some factors are not directly related to the firm performance.

90
International Journal of Research in Management & Social Science Volume 5, Issue 3 (IV): July - September, 2017
ISSN 2322 - 0899
REFERENCES World Bank Policy Research Working Paper 3404, (2004). The Corporate Governance of Banks: A Concise
Discussion of Concepts and Evidence Ross Levine,
N. K. Chidambaran, Darius Palia, Yudan Zheng, (2008). Corporate Governance and Firm Performance: Evidence from Large Governance Changes
N. Balasubramanian, ( 2009) Firm-level corporate governance in emerging markets: a case study of India
Marcia Millon Cornett, Alan J. Marcus, Anthony Saunders, Hassan Tehranian, (2006) Earnings Management, Corporate Governance, and True Financial Performance
David H. Erkensa , Mingyi Hunga, Pedro Matos, (2012) Corporate Governance in the 2007-2008 Financial Crisis: Evidence from Financial Institutions Worldwide
Maria Maher and Thomas Andersson, February (2000) Corporate Governance: Effects on Firm Performance and Economic Growth
Lawrence D. Brown ∗ J. Mack Robinson ,L. Caylor (, 2004) Corporate Governance and Firm Performance
Bernard S Black, Vikramaditya S Khanna (2007) Can Corporate Governance Reforms Increase Firm Market Values? Event Study Evidence from India 4 Journal of Empirical Legal Studies, pp. 749-796
A Guide to Corporate Governance by N. Gopalswamy Pg. 1
Institutional Investors and Corporate Governance in India , Pitabas Mohanty
Corporate Governance Global Concepts and Practices, Dr. S Singh, 1st edition 2005 Excel Books Publications
APPENDIX
Pearson’s Correlations govscore roe npm sg tobinsq divyield govscore Pearson Correlation 1 .413 .651 -.254 .366 .497
Sig. (2-tailed) .357 .113 .582 .420 .257 N 7 7 7 7 7 7
roe Pearson Correlation .413 1 .812(*) .530 .865(*) .718 Sig. (2-tailed) .357 .026 .221 .012 .069 N 7 7 7 7 7 7
npm Pearson Correlation .651 .812(*) 1 .284 .772(*) .620 Sig. (2-tailed) .113 .026 .537 .042 .138 N 7 7 7 7 7 7
sg Pearson Correlation -.254 .530 .284 1 .567 -.089 Sig. (2-tailed) .582 .221 .537 .185 .850 N 7 7 7 7 7 7
tobinsq Pearson Correlation .366 .865(*) .772(*) .567 1 .701 Sig. (2-tailed) .420 .012 .042 .185 .079 N 7 7 7 7 7 7
divyield Pearson Correlation .497 .718 .620 -.089 .701 1 Sig. (2-tailed) .257 .069 .138 .850 .079 N 7 7 7 7 7 7
1. * Correlation is significant at the 0.05 level (2-tailed).

91
International Journal of Research in Management & Social Science Volume 5, Issue 3 (IV): July - September, 2017
ISSN 2322 - 0899
EFFECT OF HEARTFULNESS SPIRITUAL PRACTICE BASED PROGRAM ON MENTAL AND PHYSICAL HEALTH INDICATORS
Narendra Kumar Arya, Kamlesh Singh and Anushree Malik
National Resource Centre for Value Education in Engineering (NRCVEE), Indian Institute of Technology Delhi, New Delhi, India
ABSTRACT Several studies have supported the role of spiritual practices to improve mental and physical health. The present study focused on the effect of Heartfulness (also known as Sahaj Marg) spiritual practice comprising meditation and related processes (like Cleaning and Prayer) on health indicators. Thirty one participants (19 males, 12 females) with age range 21-70 years (M=49.7 years and SD=15.2 years) participated in the study. Various measures (MHC-SF, SPANE, FS, Sat-Chit-Ananda, MASS and DASS) were used to acquire mental health indicators. Along with selected mental health measures, the study further explored results from semi-structured interviews and physiological measures to see the effectiveness of the program.
Keywords: Heartfulness, Meditation, Mental Health, Spiritual Practice, Well-being.
INTRODUCTION A growing body of research indicates that individual differences in religiousness and spirituality (R/S) predict emotional adjustment and physical health (Chida, Steptoe, & Powell, 2009; Masters & Hooker, 2012; Smith, McCullough, & Poll, 2003; Weaver, Pargament, Flannelly & Oppenheimer, 2006). Gallup (1992) conducted a poll survey of 1,000 American men and women in which 66% of respondents revealed that they would prefer to receive counseling from a person who shares their spiritual values. Spiritual practices topped in the list of complementary alternative medicine (CAM) by patients undergoing treatment for cancer (Richardson, Sanders, Palmer, Greisinger & Singletary, 2000). Therefore, spiritual and religious practices are important aspects to understand human behavior.
Meditation is one of the most important part of eastern spiritual practices. Meditation in general can be categorized in two groups: focused attention and open monitoring. Focused attention meditation involves continuous attention on a specified object, whereas in open monitoring meditation, content of experience is monitored without reacting to it (Lutz, Slagter, Dunne, & Davidson, 2008). Travis and Shear (2010) suggested a third category of meditation called automatic self-transcending. In this category the techniques are designed to transcend their own activity. Automatic self-transcending meditation has been found to be different from open monitoring and focused attention types of meditation.
1.1. HAPPINESS AND WELL-BEING INDICATORS Well-being has been related to mainly psychological and social aspects of human nature as given in well-being models of hedonic and eudemonia (Ryan & Deci, 2001). Subjective well-being includes life satisfaction and positive emotions and not just absence of negative factors. The measures typically include a global assessment of happiness of a person’s life (Diener, 1984). A multi-dimensional model proposed six dimensions of well-being: self-acceptance, a sense of continued growth and development, belief that life is purposeful and meaningful, positive relations with others, autonomy and environmental mastery (Ryff & Keyes, 1995). Another model, Keyes (1998) proposed five key elements of social well-being, namely, social integration, social contribution, social coherence, social actualization, and social acceptance. In the mental health continuum, along with social well-being, subjective well-being/ emotional well-being (Diener, 1984) and concept of psychological well-being were combined (Ryff, 1989; Keyes, 2002). Another recent PERMA model proposed five measurable elements of well-being; positive emotion, engagement, relationships, meaning and accomplishment (Seligman, 2011). Simultaneously, Diener, Wirtz, Tov, Kim-Prieto, Choi, et al., (2010) developed the Flourishing scale which encompasses items regarding human flourishing in relevant areas such as purpose in life, relationships, self-esteem, feelings of competence and optimism. They also developed scale of Positive and Negative Experience to capture affective component which has six items related to positive experiences and the other six related to negative experiences.
As per the Indian concepts, to achieve highest level of happiness, humans need to seek for inner source of happiness referred to as Sat-Chit-Ananda where Sat means being truthful, Chit refers to being aware, and Ananda implies the bliss. Ancient Indian text, Taittiriya Upanishad explains happiness and well-being as times when unobstructed manifestation of ananda or bliss is felt (Srivastava and Misra, 2011). Recently, a Sat-Chit-Ananda scale has been developed with adequate psychometric properties. The study presented a multi-

92
International Journal of Research in Management & Social Science Volume 5, Issue 3 (IV): July - September, 2017
ISSN 2322 - 0899
dimensional construct with four dimensions; Chit-consciousness, Antah Shakti- Inner strength, Sat- truthfulness and Ananda- Blissfulness (Singh, Khari, Amonkar, Arya & Kesav, 2013).
Other selected variables in the present study like Mindfulness has been referred to the state of being attentive to and aware of what is taking place in the present (Brown and Ryan, 2003) and for measuring ill-being, depression, anxiety and stress, where depression is characterized by low positive effect, loss of self-esteem and incentive, and a sense of hopelessness, anxiety is characterized by autonomic arousal and fearfulness; and stress is characterized by persistent tension, irritability and a low threshold for becoming upset or frustrated (Lovibond & Lovibond, 1995).
Different yogic psychophysiological techniques are bound to have different effects on each and every cell of the human body and this in turn would depend on the various body systems, organs and tissues involved in the performance of such practices (Swami, 1981). Bhavanani, Ramanathan, Balaji and Pushpa (2014) reported significant changes in heart rate (HR) and blood pressure (BP) both immediately after the Asanas (Yoga exercise) as well as during the recovery period. In another study, Bhavanani, Ramanathan and Madanmohan (2015) reported that there is a healthy reduction in HR, BP and derived cardiovascular indices following a single yoga session in geriatric subjects. These changes may be attributed to enhanced harmony of cardiac autonomic function as a result of coordinated breath-body work and mind-body relaxation due to an integrated “Silver Yoga” program. Similarly, breathing awareness meditation and life skills training program has been found to decrease blood pressure systolic, blood pressure diastolic and heart rate (Mathew, Vernon, Martha, Gregory, & Frank 2011). Another study observed that spirituality may have a positive effect on blood pressure (Manshaee & Amini). Mindfulness based intervention program resulted in reduced systolic and diastolic blood pressure in low income African-American older adults (Palta, Page, Piferi, Gill, Hayat, et al., 2012).
1.2. SPIRITUAL/ RELIGIOUS (S/R) PROGRAMS AND WELL-BEING Since the time immemorial man has been in search of well-being. People from different cultures have made different efforts to have a happier and better life. Different strategies like music, Positive Art Therapy (PAT), Yoga based life style, Pranayama (breathing exercises), Satsang (group spiritual activities), Pravachan (preaching) etc. have been used to facilitate happier life, (Chiang, 2008; Perry, 2008; Yadav, Magan, Mehta, Mehta, & Mahapatra 2012). Slowly the search for well-being expanded and acquired multiple dimensions. Various concepts of well-being, deep rooted in the Indian philosophy, became an important subject of exploration through modern science (Krygier, Heathers, Shahrestani, Abbott, Gross, & Kemp, 2013). In a recent study on satsang carried out in rural India, it was found that satsang (singing S/R songs in a group) is an influential practice promoting well-being in rural Indian women. It was observed that satsang has a spiritual essence which paves the way for connectivity with oneself and with their own higher self, whether it was represented as guru or idolized as God (Singh, Jain & Singh, 2014). In another study on effects of transcendental meditation practice on brain functioning and stress reactivity in college students, it was observed that there was a significant reduction in sleepiness in college students as a result of transcendental meditation practice (Travis, David, Hagelin, Tanner, Nidich, et al., 2009).
Burke (2012) reported individual preferences for four meditation techniques: Zen, Vipassana (mindfulness), Qigong and Mantra and observed that participants chose Vipassana or Mantra meditation as their preferred techniques significantly more compared to Qigong and Zen. It was observed that regular practice of pranayama had a positive effect on lowering the test anxiety (Nemati, 2013). In a review paper, it has been found that for treatment of stress, anxiety, post-traumatic stress disorder, stress related medical illness, substance abuse and rehabilitation of criminal offenders, Sudarshan Kriya Yoga (SKY) can be a low-cost, low-risk and beneficial adjunct to the treatment (Zope & Zope, 2013).
Vipassana Meditation has the potential to reduce stress in nurses (Riet, 2011). Mindfulness meditation was particularly effective in stress reduction by reducing repetitive and persistent thinking (Kang, Choi & Ryu, 2009). In another study on mindfulness meditation, significant improvement on all positive measures of psychological health such as positive affect, satisfaction with life and mindfulness were reported whereas, measures related to ill-being significantly decreased, such as depression, stress and negative affect after practicing meditation (Krygier et al., 2013).
1.3. S/R BASED PROGRAMS Meditation has been found to improve mental and physical health and has been used to cultivate mindfulness skills (Kabat-Zinn, 1994). Role of meditation in bringing beneficial psychological and physiological states has been validated by empirical studies (Davidson, Kabat-Zinn, Schumacher, Rosenkranz et al., 2003). In a transnational comparison, effect of Soka Gakkai (Soka Gakkai International), a Buddhist practice on selected

93
International Journal of Research in Management & Social Science Volume 5, Issue 3 (IV): July - September, 2017
ISSN 2322 - 0899
factors of positive psychology have been studied. The results indicated that the practice was effective across the nations (Sachar, 2013). A systematic review of various studies reported that meditation has a positive effect on work performance, state of mind and health (Arya, Singh & Malik, 2013).
Heartfulness or Sahaj Marg is a spiritual practice that includes a morning meditation, evening cleaning and prayer meditation at bed time. These three basic elements combine to create a complete and effective system for inner transformation. Pranahuti, an ancient yogic technique, also called transmission is the backbone of Heartfulness practice (Sahaj Marg system of Rajyoga meditation, practice, 2015; Heartfulness Institute, 2017). Heartfulness Institute engages in activities that further the practice of heartfulness inner journey as practiced by adherents to the principles and teachings of the Sahaj Marg system of Rajyoga inner journey (Heartfulness Institute, 2017). Abhyasi (Practitioner) training program at CREST (Centre for Research Education Sadhna and Training) Bengaluru (“CREST Bangalore – Training Programs”, 2015), stay in retreat centers, annual Bhandaras (Spiritual gatherings) and stay in Himalayan Ashram are some of the supporting elements of the practice.
1.4. THE PRESENT STUDY There have been many studies on effect of meditation and other spiritual practices on mental and physical health, however, most of these studies have mainly focused on short duration meditation practice and there is no study on Heartfulness spiritual practice based program. In this study, effect of Heartfulness spiritual practice based program run at CREST, Bengaluru, India has been studied. Various parameters related to mental health and a few parameters related to physical health have been taken for the study. Additionally, interview schedule was used to capture participants’ attitude towards the practice.
2. RESEARCH METHODOLOGY 2.1. PARTICIPANTS Total of 31 persons (19 males, 12 females; age range 21-70 years, mean age = 49.7 years & SD = 15.2 years) participated in the study. The participants were practitioners of Heartfulness and registered voluntarily for full time 5 days program (practice) at the center.
2.2. PROCEDURE The Data was collected at the beginning and end of the five day program. Participants arrived on first day of the program and stayed for the full duration in the center. They departed on last day, without going out even once. Daily schedule comprised of various activities like morning meditation, evening cleaning, night prayer, lectures, group discussions, voluntary work etc. Detailed schedule is given in Table – 1. The data collection booklet was bilingual, in English and Hindi both. Bilingual experts translated the original English version of all the scales used in the study to Hindi language. The tests were later back-translated into English by bilingual experts to verify the content similarity to the original scales and to ensure that translated tests were true copy of the original tests. The discrepancies were resolved and the booklet was once again verified by the authors and bilingual experts.
Table 1. Daily Routine during the CREST Program Schedule/ Activity Details
04:30 am- Wake-up A morning bell used to be rung
04:45 am (for about 40 mins.)- Individual meditation
Every Participant was supposed to do heartfulness meditation himself in his/her room after silently doing prayer once. The instructions for meditation were, “Sit in comfortable position. Give a gentle suggestion to yourself -Divine light is in my heart. Ignore the thoughts like clouds going in the sky. Give the suggestion again if the thoughts persist”.
05:45 am- Tea break
06:00 am (for about 60 mins.)- Exercise/ walking
Combination of light aerobic exercises and stretching, followed by two rounds of walking in the campus.
07:30 am (for about 50 mins.)- Satsang-Group
Meditation
In the meditation hall. Conducted by meditation trainer/ preceptor. All participants attended. When trainer says “Please start meditation” Participants give a gentle suggestion of divine light. In the end trainer says “That’s all”. Trainer uses his thought process to give yogic transmission as per procedure.
08:30 am- Breakfast Simple vegetarian (Satvik food) breakfast

94
International Journal of Research in Management & Social Science Volume 5, Issue 3 (IV): July - September, 2017
ISSN 2322 - 0899
09:00 am (for 2 hrs)- Lecture session on topics like time management
First Day Plenary session: Guru Vandana, Introduction by director, familiarization by officials. Introduction of study by investigator.
2nd 3rd and 4th day: Lecture on different topics of Time Management like Eternal time concept, Cyclic time. Managing our time during a day. Concept of time as per ancient texts, Gap between what I am supposed to do and what I am doing, Space and time, beyond time, Big Bang etc.
Fifth Day Concluding Session: Closing remarks by director, Feedback, Group photo, certificate distribution, Views sharing by participants.
11:00 am- Tea break
11:15 am (for 75 mins.) Morning lecture continued---
12:30 pm- Lunch Simple vegetarian lunch (Satvik food) with lot of green vegetables.
01:30 pm- Library/ rest Library has more than 5000 books covering various religions, spiritual thoughts, modern science etc. Participants also had the option to rest in their dorms.
02:30 pm (for 75 mins.)- Group discussion in small groups
Participants were divided in 5 groups. They discussed the topics of lectures in different ways. In one round they explained what they understood. In another they discussed three salient points. In another round they discussed similar things from other authentic sources.
03:45 pm – Tea break
04:00 pm (for 60 mins.)-Voluntary work
Voluntary work was levelling a road, taking care of plants. Cleaning the plant produce. It was done in teams and as per individual capacity.
05:15 pm (for 30 mins.)- Individual cleaning (part of meditation practice)
Individual cleaning is an active process in which “will power” is used. Participant gives strong thought that all the impressions and impurities are going out from behind the back. After sometime he imagines that divine light is being filled from front. At the end he gives a thought that he is clean.
06:00 pm (For 90 mins.)- Circle Time (general discussion in a group)
All participants and lecturers would sit in a circle in Master’s cottage and generally discuss any topic related to spirituality. Participants were free to give their opinion. Session was coordinated by lecturer of the day.
07:30 pm- Dinner Simple vegetarian food (Satvik food) having rice, pulses, vegetables etc.
08:00 pm (For 60 mins.)-Listening to spiritual DVD/ divine messages
Different DVDs on different days. One day it was of Swami Vivekananda another day discussion of Lord Krishna and Narada Muni on Maya a documentary based on ancient Indian texts produced by Chinmaya mission. Other two days divine messages called “Whispers from the brighter world” were read and their special reading technique was taught.
09:00 pm (For 15 mins.)- Universal prayer followed by library time
In Universal prayer participants silently meditate for fifteen minutes, thinking that all brothers and sisters are being filled up with love and devotion and that real faith is growing stronger in them
10:00 pm- Lights off Lights are switched off and participants are advised to sleep. Participants sleep after doing prayer meditation for 10 min as the last thing in the day. They are to meditate on the meaning of following prayer :
O Master! Thou art the real goal of human life. We are yet but slaves of wishes Putting bar to our advancement. Thou art the only God and Power To bring us up to that stage. The first line of the prayer affirms our goal. The word Master refers to God and God alone, the ultimate Master who resides in each and every heart. Sahaj Marg

95
International Journal of Research in Management & Social Science Volume 5, Issue 3 (IV): July - September, 2017
ISSN 2322 - 0899
believes that the human spiritual guide, or Master, is one who helps aspirants establish contact with their inner divinity. The second line of the prayer refers to our present state, acknowledging that we are the creators of our own problems and that our wishes and attachments are obstacles to our progress. The third statement points to the source of our liberation, recognizing that it is God alone who can help us rise to the higher state of existence.
2.3. TESTS USED A booklet for data collection was prepared containing consent form, demographical information, semi-structured interview, psychological tests and record of physiological measures. First of all, the study was introduced and informed consent of participants were taken. Following psychological tests were included in the data collection booklet.
2.3.1. MENTAL HEALTH CONTINUUM SHORT FORM Mental Health Continuum Short Form (MHC – SF; Keyes, 2005): MHC – SF is a 14 items scale in which three items represent emotional well-being, six items represent psychological well-being, and five represent social well-being. Items are rated on a 6-point Likert scale (never to every day). The internal reliability for total MHC (α=0.89) and for its dimensions like emotional well-being (α=0.83), for psychological well-being (α=0.83) and for social well-being (α=0.74) were reported satisfactory (Lamers, Westerhof, Bohlmeijer, Klooster & Keyes, 2011). In Indian setting an overall test consistency of α=0.88, ranging from α=0.75 to 0.84 for the three aspects of well-being has been reported (Khanna, Singh, Singla & Verma, 2013). In another study on Indian population, acceptable reliability for EWB (α=0.82), SWB (α=0.79) and PWB (α=0.83) have been reported (Singh, 2014).
2.3.2. SCALE OF POSITIVE AND NEGATIVE EXPERIENCE Scale of Positive and Negative Experience (SPANE, Diener et al., 2010): This scale has 12 items which are rated on 5 point Likert type scale. Feelings like good, pleasant, happy, joyful, contented, bad, unpleasant, sad, afraid and angry are measured on a scale of 1-5 [from Very Rarely or Never (1) to Very Often or Always (5)]. The scale derived positive feelings score (SPANE-P, α=0.87) and negative feelings score (SPANE-N, α=0.81) and an overall affect balance score (SPANE-B, α=0.89) which is subtracting the negative score from the positive score. In a study on Indian population, Cronbach’s coefficient for SPANE-P (α = 0.81) and for SPANE-N (α = 0.77) were found to be acceptable (Singh, 2014).
2.3.3. FLOURISHING SCALE Flourishing Scale (FS; Diener et al., 2010): FS is a Likert type rating scale, 1 denoting strongly agree and 7 indicating strongly disagree. The responses are added, varying from 1 to 7, for all eight items. The possible range of scores is from 8 (lowest possible) to 56 (highest possible). A very good Cronbach’s alpha (α=0.87) was reported by Diener et al., (2010). In a study on Indian population, Confirmatory Factor Analysis (CFA) results were found to be acceptable, having an excellent value of Cronbach coefficient (α = 0.93) (Singh, 2014).
2.3.4. SAT-CHIT-ANANDA SCALE Sat-Chit-Ananda scale (Sat-Chit-Ananda; Singh et.al, 2013) – The scale has seventeen items, having four factors with acceptable psychometric properties, namely: 1. Chit- Consciousness (α= 0.76), 2. Antah Shakti– Inner Strength (α=0.76), Sat- Truthfulness (α=0.69) and Ananda– Blissfulness (α=0. 64) and overall Sat-Chit-Ananda scale (α=0.82). Recently, the scale has been revalidated by using both exploratory and confirmatory factor analyses. Sat-Chit-Ananda and its factors were found to be significantly positively correlated with Flourishing and Positive Experiences and were negatively correlated with Negative Experiences which strengthen its validation (Singh, Khanna, Khosla, Rapelly & Soni, 2016). Total Sat-Chit-Ananda score has been used in this study.
2.3.5. MINDFUL ATTENTION AWARENESS SCALE Mindful Attention Awareness Scale (MAAS; Brown and Ryan, 2003) – The MAAS is a 15-item scale designed to assess a core characteristic of mindfulness, namely a receptive state of mind in which attention, informed by a sensitive awareness of what is occurring in the present, simply observes what is taking place. Internal consistency is good with alpha ranging from 0.80 to 0.90 (Brown & Ryan, 2003).
2.3.6. DEPRESSION, ANXIETY AND STRESS SCALE Depression, Anxiety and Stress Scale (DASS 21; Lovibond & Lovibond, 1995): The DASS is a set of three self-report scales designed to measure the negative emotional states of depression, anxiety and stress. The DASS was constructed not merely as another set of scale to measure conventionally defined emotional states, but to further the process of defining, understanding and measuring the ubiquitous and clinically significant emotional

96
International Journal of Research in Management & Social Science Volume 5, Issue 3 (IV): July - September, 2017
ISSN 2322 - 0899
states usually described as depression, anxiety and stress. Each of the three DASS 21 scales contains 7 items. Total score for Depression, Anxiety and Stress are calculated by summing the factor`s respective items. Internal consistency was reported good ranging α = 0.96, 0.89 and 0.93 for Depression, Anxiety and Stress respectively (Brown, Chorpita, Korotitsch & Barlow1997). The Cronbach alpha for Stress (α =0.71), Depression (α =0.76); and Anxiety (α =0.73) were also found acceptable on Indian sample (Singh, Junnarkar & Sharma (2015).
2.4 PHYSICAL HEALTH PARAMETERS FOR STUDY Physical Health parameters, blood Pressure and heart rate were measured in the beginning and end of the program.
Blood Pressure and heart rate were determined using commercially available automatic blood pressure monitor of brand–Omron model SEM-1(HEM-7051-C12). Each person was asked to take rest for 5 minutes and then the measurement was taken.
Weight of participants was also measured before and after the program as a physical parameter, just to see if there is any significant change. The machine used was a digital weighing machine of brand Equinox model EB9021.
Height of participants was also recorded for the purpose of calculation of BMI in case there was any significant change in weight.
2.5 SEMI STRUCTURED INTERVIEW The semi-structured interview schedule was provided at the end of the program to all the participants. The interview schedule consisted of seven open ended questions like why have you come for this program, how long have you been practicing Sahaj Marg, how regular you are in your practice, how much improvement you feel in your spiritual condition during this program, which activities you liked most in this program, which activities you did not like in this program and anything else you want to include additionally.
2.6 DATA ANALYSIS Statistical analysis was carried out using SPSS version 16. Paired t-test was used to study the effect of spiritual practice based program comparing scores after the program with baseline at the start of the program.
3. RESULTS Results section has been divided in the following three sub-sections: Mental health indicators, physical health indicators and participants’ perception about program through Semi Structured Interview.
3.1 MENTAL HEALTH INDICATORS The results from Table 2 indicate that pre and post test scores from the program differed significantly on MHC-SF (t (29) = -5.30, p <0.01) and its factors like Emotional well-being (t (29) = -4.18, p < 0.01), social well-being (t (29) = -5.22, p < 0.01) and Psychological well (t (29) = -2.34, p < 0.05). The mean scores of the MHC-SF pre-test (M = 48.97; SD = 10.62) were significantly improved as compared to post-test (M= 56.80; SD= 8.54) and its all three dimensions had significantly higher (EWB = pre M = 11.63, SD = 2.06 & post M = 12.90, SD = 1.99; SWB= pre M = 14.87, SD = 5.85 & post M = 19.27, SD = 4.80 and PWB = pre (M = 22.47, SD = 5.14 & post M = 24.63, SD = 4.37) post sessions scores.
Table 2. Pre and Post testing results for mental health related parameters
Factor PRE- Testing POST-Testing N t- values Mean SD Mean SD MHC-SF (Emotional) 11.63 2.06 12.90 1.99 30 -4.18** MHC-SF (Social) 14.87 5.85 19.27 4.80 30 -5.22** MHC-SF (Psychological) 22.47 5.14 24.63 4.37 30 -2.34* MHC-SF (Total) 48.97 10.62 56.80 8.54 30 -5.30** SPANE-Positive 24.20 4.97 26.53 3.03 30 -2.74** SPANE-Negative 14.00 4.07 11.80 4.62 30 3.13** SPANE-Balance 10.20 7.48 14.73 6.85 30 -4.07** Flourishing Scale 47.45 5.43 49.84 4.66 31 -2.98** Sat-Chit-Ananda 71.77 8.27 76.32 6.67 31 -4.10** MAAS 59.77 14.01 63.65 15.49 31 -1.95 DASS(Depression) 3.46 2.95 2.36 3.01 28 2.46* DASS(Anxiety) 4.57 3.66 4.11 3.27 28 0.77 DASS (Stress) 5.89 4.25 4.75 3.20 28 1.97

97
International Journal of Research in Management & Social Science Volume 5, Issue 3 (IV): July - September, 2017
ISSN 2322 - 0899
DASS (Total) 13.93 9.59 11.21 8.23 28 1.98 Note: MHC-SF = Mental Health Continuum Short Form, SPANE= Scale of Positive and Negative Experiences, MAAS= Mindful Attention Awareness Scale, DASS= Depression, Anxiety and Stress Scale.
* Significant p<0.05 ** significant p<0.01
There was a significant improvement in the scores for the flourishing, {pre sessions = M = 47.45, SD = 5.43 and post sessions M = 49.84, SD = 4.66); t (30) = -2.98, p < 0.01} ; positive experience {pre sessions M = 24.20, SD = 4.97 and post sessions M = 26.53, SD = 3.03); t (29) = -2.74, p < 0.01}; SPANE-B {pre sessions M = 10.20, SD = 7.48 and post sessions M = 14.73, SD = 6.85); t (29) = -4.07, p < 0.01} and Sat-Chit-Ananda { pre sessions M = 71.77, SD = 8.27 and post sessions = M = 76.32, SD = 6.67); t (30) = - 4.10, p < 0.01}. Simultaneously, SPANE-N {pre sessions M = 14.00, SD = 4.07 and post sessions M = 11.80, SD = 4.62); t (29) = 3.13, p < 0.05} and Depression {pre sessions M = 3.46, SD = 2.95 and post sessions M = 2.36, SD = 3.01); t (27) = 2.46, p < 0.05} were reduced significantly in this study. However, there was no significant change in Mindfulness, Anxiety and Stress, (refer to Table 2).
3.2 SELECTED PHYSICAL HEALTH INDICATORS Physiological measures (Blood Pressure and Heart Rate) and weight were also taken as dependent variables in the study to observe any change in them. There was no significant change in weight and blood pressure values. Mean of Heart Rate decreased significantly from 80.48 to 76.48 (Table 3) with all participants remaining in normal range (60-100) except one who had abnormally high heart rate of 115 in pre session which normalized to 100 in post session.
Table 3. Pre and post testing results for physical health related parameters
Factor PRE- Testing POST-Testing
N t- values Mean SD Mean SD
Weight 71.20 11.28 71.04 11.40 31 1.43
Blood Pressure(systolic) 126.39 17.03 125.42 17.91 31 0.64
Blood Pressure(diastolic) 77.45 9.83 75.94 10.01 31 1.52
Heart Rate 80.48 11.74 76.48 9.92 31 3.40** * Significant p<0.05 ** significant p<0.01
However, critical analysis of the blood pressure data as per the American Heart Association Standards shows that the number of participants in normal range (BP Systolic < 120 and BP Diastolic < 80) increased from 12 to 15 (Fig 1). Also, the participants in Pre-hypertension stage (BP Systolic 120-139 or BP diastolic 80-89) decreased from 10 to 7. Moreover, the participants in High blood Pressure Stage 1 (BP Systolic 140-159 or BP diastolic 90-99) decreased from 8 to 7. However, participants in High Blood Pressure Stage 2 (BP Systolic > 160 or BP diastolic > 100) increased from 1 to 2.
Figure 1: Number of participants in various stages of hypertension
N-Normal; P-Pre-hypertension; HBP1-High Blood Pressure Stage 1; HBP2-High Blood Pressure Stage 2

98
International Journal of Research in Management & Social Science Volume 5, Issue 3 (IV): July - September, 2017
ISSN 2322 - 0899
3.3 SEMI STRUCTURED INTERVIEW At the end of the program semi structured interview was conducted to assess the impact of the program with open ended questions. Content analysis was done to analyze the responses.
Q1 WHY HAVE YOU COME FOR THIS PROGRAM? Thirteen participants replied that they have come to improve their spiritual practice, achieve spiritual progress, understand how to be a better Abhyasi (practitioner) and also to understand Sahaj Marg better. One participant replied that he has come to utilize the excellent atmosphere of CREST whereas two of them wanted to increase their dedication towards Master and Sahaj Marg. One participant replied that he wants to attain life objectives while six participants wanted to learn time management. One participant had very good experience at CREST earlier and wanted to adjust his meditation practice again while another participant came for Sadhna (meditation Practice) and self-introspection. A young participant came for character transformation and to change himself.
Q2 HOW LONG HAVE YOU BEEN PRACTICING SAHAJ MARG? Experiences of participants spanned over a very wide range with eight participants having experience up to five years and another eight having experience of more than 20 years (Fig. 2). Six participants were in the range of five to ten years whereas seven were in the range of ten to twenty years. When asked to elaborate, one reported missing some elements of practice like bed time prayer and one not being regular in practice. One had read most of the Sahaj Marg literature. Seven participants described about how they joined Sahaj Marg and doing their practice.
Figure 2: Duration of meditation practice
Q3 HOW REGULAR YOU ARE IN YOUR PRACTICE? (RATE BETWEEN 1- SELDOM TO 5- REGULAR) When asked about the regularity of meditation practice on a scale of 1-5 (1- seldom, 5- regular), twelve of them reported the highest number 5 (Fig. 3). Eight of them reported 4 while ten of them reported 3. None of them reported 1 or 2 whereas for one participant data was not available. When asked to elaborate, six participants reported that they were regular in the morning meditation but irregular in cleaning or bed time prayer. Five participants were regular at one time and irregular at other. Fourteen participants reported that they continued the practice regularly.
Figure 3: Regularity of meditation practice

99
International Journal of Research in Management & Social Science Volume 5, Issue 3 (IV): July - September, 2017
ISSN 2322 - 0899
Q4 HOW MUCH IMPROVEMENT YOU FEEL IN YOUR SPIRITUAL CONDITION DURING THIS PROGRAM? When asked about the improvement in spiritual condition during the program on a scale of 1-5 (1- Negligible, 5- Tremendous), seventeen of them reported the highest number 5 (Fig. 4). Ten of them reported 4 while one of them reported 3. None of them reported 1 or 2 whereas for three participants data was not available. When asked to elaborate, one participant reported feeling deep, calm and fully absorbed in meditation and remembrance of Master, one could notice spiritual progress whereas doubts were cleared for one participant. One participant reported improved understanding of Master, Mission and Method whereas one participant found the stay in CREST to be conducive for deepening the practice. One participant reported that he is rising early which helps the practice, another reported feeling great because of practice, while one participant felt that meditation practice will improve after the stay in CREST.
Figure 4. Improvement in spiritual condition during the program
Q5 WHICH ACTIVITIES YOU LIKED MOST IN THE PROGRAM? Nine participants reported that they liked all the activities whereas thirteen participants replied that they liked lectures, ten participants liked circle time – all participants sitting in a circle and talking, whereas seven participants liked Shramdan- Volunteer Work. One participant reported meditation, whereas four enjoyed physical exercise as their most liked activities. Two participants also enjoyed getting up early and doing meditation.
Q6 WHICH ACTIVITIES YOU DID NOT LIKE IN THE PROGRAM? Twenty four out of thirty one participants reported that there is no activity which they did not like. One participant reported group discussion, one felt that video on Swami Vivekananda was not made properly, while one did not like scientific information being given. One participant reported that he did not like the chairs. Three participants did not answer the question.
Q7 ANYTHING YOU WANT TO SAY ON YOUR OWN? Twenty seven participants answered the question giving very wide ranging answers such as wanting to become sensitive, too good progress, suggestion for scheduling of lectures, recommendation to others for joining the program, good opportunity, appreciation of CREST, well designed program, very educative program, desire to come back again etc.
4. DISCUSSION There were significant improvement after the sessions in measures of well-being such as Mental Health and its dimensions, Flourishing, Positive experiences, Sat-Chit-Ananda. Significant declination of Negative experiences and Depression leads to reduced ill-being in post sessions testing. However, mindfulness, anxiety and stress had insignificant changes. There is a lack of studies on Sahaj Marg programs but abundance of research is available on other such kind of programs. For instance, consistent to these findings, Singh, Jain and Singh (2014) observed that rural women participating in Satsang felt more empowered and free from stressors in India. Studies of practices associated with other religions in India such as Buddhism too have revealed evidence for benefits from religious and spiritual practices. A study of Soka Gakkai International’s (SGI) Buddhist practice found that practitioners had significant higher scores on psychological well-being (PWB) and related factors (like well-being index, general psychological health, gratitude and wisdom) than the non-practitioners (Sachar, Singh & Khurana, 2011). In another study, Yoga based life style intervention programs

100
International Journal of Research in Management & Social Science Volume 5, Issue 3 (IV): July - September, 2017
ISSN 2322 - 0899
are documented to cause a significant reduction in state and trait anxiety levels and had a favorable effect on subjective well-being even in short time period (Yadav, et al., 2012).
Krygeir et al., (2013) have also observed significant change in Depression while the changes in Anxiety were insignificant after practicing Mindfulness Meditation. It might happen because of low level of depression, anxiety and stress at the beginning of the program. This could be attributed to the fact that majority of the participants were regular practitioners. Hence, the changes and significance value has to be seen in that light. However, contrary to present findings, Zeidan, Johnson, Diamond, David & Goolkasian (2010) found that anxiety scores dropped significantly after practicing Mindfulness Meditation.
Some improvement is noticed in selected physical health indicators, although the change in Blood Pressure-Systolic and Blood Pressure-Diastolic values is insignificant. Nevertheless, Heart Rate values showed significant improvement. Contrary to present findings, several studies have shown effect of yoga and meditation sessions on physiological changes. For instance, breathing awareness meditation and life skills training program has been found to decrease Blood pressure systolic, Blood pressure diastolic and heart rate (Mathew, et al., 2011). Another study indicated that spirituality may have a positive effect on Blood pressure (Manshaee & Amini). Systolic and diastolic blood pressure in low income African-American older adults reduced by mindfulness based intervention program (Palta, et al., 2012). A six week yoga based program for employee population, induced notable improvements in diastolic blood pressure but change in systolic blood pressure was not statistically significant (Barbara, Siddiqi, Stephen, & Brent, 2011) in spite of the significant improvements in linear analog self-assessment (LASA) score. The above discussion indicates that improvement in some of the physiological parameters is in line with results reported in documented research.
The results obtained for mental health indicators and selected physical health indicators correlate very well with the results of semi-structured interview. Seventeen participants reported very high improvement (5/5) and ten reported high improvement (4/5) in their spiritual condition after the program. This indicates that an overwhelming majority found a lot of improvement in spiritual condition, correlating well with the quantitative data of positive mental and physical health indicators. Another indication of participants feeling much better comes from the fact that they liked almost all the activities in the program. Only a very small number of participants did not like a few activities. When asked to say anything on their own, there was an overwhelming positive response which also indicates improvement in mental health parameters as seen in quantitative analysis. Aligning with present findings, positive attitude towards Spiritual practices is supported by other studies as well (Richardson, et.al., 2000).
5. LIMITATIONS & FUTURE DIRECTIONS Overall, the effects of Heartfulness spiritual practice based program were consistent with expectations and found significant changes in various health indicators and observed positive attitude towards the program. It is supported by the participant’s voluntary choice for this residential program.
There could be various confounding factors, such as natural surroundings as part of the program; social bonding developed among people practicing same process, being away from daily chores, stressors etc., which need to be explored further. Another limitation is comparison with control group is missing in this study. Lack of follow up assessment of participants is another limitation due to which it cannot be ascertained whether the effect is long lasting or not.
Similar studies of Heartfulness spiritual practice based programs in different places preferably with strong physical supporting parameters like HRV will be of great importance in drawing and reinforcing the present conclusions. Hence it is suggested that more studies may be carried out on other programs of Heartfulness in Himalayan Ashram, retreat centers and Heartfulness programs for non-practitioners also.
COMPLIANCE WITH ETHICAL STANDARDS This study complied with all ethical requirements. Informed consent was obtained from all individual participants included in the study. Consent from Heartfulness authorities was also taken prior to the research. Further, participation was voluntary and participants were free to withdraw from the research at any stage.
REFERENCES Arya, N. K., Singh, K., & Malik A. (2013). Effect of Meditation on work performance, state of mind and
health. Jigyasa Visheshank, 1, 48-52.
Barbara, S.T., Siddiqi, H.R., Stephen, S.C., & Brent A.B. (2011). Effects of a brief, comprehensive, yoga-based program on quality of life and biometric measures in an employee population: a pilot study. The Journal of Science and Healing, 7, 27-29.

101
International Journal of Research in Management & Social Science Volume 5, Issue 3 (IV): July - September, 2017
ISSN 2322 - 0899
Bhavanani, A.B., Ramanathan, M. & Madanmohan (2015). Single session of integrated “silver yoga” program improves cardiovascular parameters in senior citizens. Journal of Intercultural Ethnopharmacology, 4 (2), 134-137.
Bhavanani, A.B., Ramanathan, M., Balaji, R. & Pushpa, D. (2014). Comparative immediate effect of different yoga asanas on heart rate and blood pressure in healthy young volunteers. International Journal of Yoga, 7, 89-95.
Brown, K.W. & Ryan, R.M. (2003). The benefits of being present: Mindfulness and its role in psychological well-being. Journal of Personality and Social Psychology, 84, 822-848.
Brown, T.A., Chorpita, B.F., Korotitsch, W., & Barlow, D.H. (1997). Psychometric Properties of the Depression Anxiety Stress Scales (DASS) in clinical samples. Behav. Res. Ther., 35 (1), 79-89.
Burke, A. (2012). Comparing individual preferences for four meditation techniques: zen, vipassana (mindfulness), qigong, and mantra. Explore, 8, 237-242.
Chiang, M.M. (2008). Research on music and healing in ethnomusicology and music therapy. Unpublished Master’s thesis.
Chida, Y., Steptoe, A., & Powell, L. H. (2009). Religiosity/spirituality and mortality. Psychotherapy and Psychosomatics, 78(2), 81–90.
CREST Bangalore – Training Program (2015). Retrieved from www.sahajmarg.org/web/guest /smww/crest-banglore-training dated August, 01, 2015.
Davidson, R.J., Kabat-Zinn, J., Schumacher, J., Rosenkranz, M., Muller, D., Santorelli, S.F., Urbanowski, F., Harrington, A., Bonus, K., & Sheridan, A.F. (2003). Alterations in brain and immune function produced by mindfulness meditation. Psychosomatic Medicine, 65, 564-570.
Diener, E. (1984). Subjective well-being. Psychological Bulletin, 95, 542-575.
Diener, E., Wirtz, D., Tov, W., Kim-Prieto, C., Choi, D. W., Oishi, S., & Biswas-Diener, R. (2010). New well-being measures: Short scales to assess flourishing and positive and negative feelings. Social Indicator Research, 97, 143-156.
Manshaee, G. , & Amini, K., (2013). The relationship between spirituality with emphasis on religious orientation and psychosomatic disorders (asthma, migraine and blood pressure). Procedia - Social and Behavioral Sciences, 84, 1260 – 1264.
Heartfulness Institute (2017, April, 11). Retrieved from www.heartfulnessinstitute.org/about/ dated 31st May 2016.
Kabat-Zinn, J. (1994). Wherever you go, there you are: Mindfulness meditation in everyday life. New York: Hyperion.
Kang, Y.S., Choi, S.Y., & Ryu, E. (2009). The effectiveness of a stress coping program based on mindfulness meditation on the stress, anxiety, and depression experienced by nursing students in Korea. Nurse Education Today, 29, 538–543.
Keyes, C. L. (2005). Mental illness and/or mental health? Investigating axioms of the complete state model of health. Journal of Consulting and Clinical Psychology, 73(3), 539–548.
Keyes, C.L.M. (1998). Social well-being. Social Psychology Quarterly, 61, 121-140.
Keyes, C.L.M. (2002). The mental health continuum: From languishing to flourishing in life. Journal of Health and Social Behaviour, 43, 207-222.
Khanna, P., Singh, K., Singla, S., & Verma, V. (2013). Relationship between Triguna theory and well-being indicators. International Journal of Yoga – Philosophy, Psychology and Parapsychology, 1, 69-74.
Krygier, J.R., Heathers, J.A.J., Shahrestani, S., Abbott, M., Gross, J.J., & Kemp, A.H. (2013). Mindfulness meditation, well-being, and heart rate variability: A preliminary investigation into the impact of intensive Vipassana meditation. International Journal of Psychophysiology, 89, 305-313.
Lamers, S. M., Westerhof, G. J., Bohlmeijer, E. T., Ten Klooster, P. M., & Keyes, C. L. (2011). Evaluating the psychometric properties of the Mental Health Continuum-Short Form (MHC-SF). Journal of Clinical Psychology, 67, 99-110.

102
International Journal of Research in Management & Social Science Volume 5, Issue 3 (IV): July - September, 2017
ISSN 2322 - 0899
Lovibond, P.F. & Lovibond, S.H. (1995). The structure of negative emotional states: comparison of the Depression Anxiety Stress Scales (DASS) with the beck depression and anxiety inventories. Behav Res Ther, 33 (3), 335-342.
Lutz, A., Slagter, H.A., Dunne, J.D., & Davidson, R.J. (2008). Attention regulation and monitoring in meditation. Trends in Cognitive Sciences, 12(4), 163-169.
Masters, K. S., & Hooker, S. A. (2012). Religiousness/spirituality, cardiovascular disease, and cancer: Cultural integration for health research and intervention. Journal of Consulting and Clinical Psychology, 81, 206-216.
Mathew, J. G., Vernon, A.B., Martha, S.T., Gregory, A. H., Frank A. T. (2011). Breathing awareness meditation and life skills training programs influence upon ambulatory blood pressure and sodium excretion among African American adolescents. Journal of Adolescent Health, 48, 59-64.
Nemati, A. (2013). The effect of pranayama on test anxiety and test performance. International Journal of Yoga, 6, 55-60.
Palta, P., Page, G., Piferi, R. L., Gill, J.M., Hayat, M. J., Connolly, A.B., & Szanton, S. L. (2012). Evaluation of a mindfulness-based intervention program to decrease blood pressure in low-income African-American older adults. Journal of Urban Health: Bulletin of the New York Academy of Medicine, 89(2):308-16.
Perry, B. (2008). Lecture, Paper presented at the The American Art Therapy, Cleveland.
Richardson, M.A., Sanders, T., Palmer, J.L., Greisinger, A., & Singletary, S.E. (2000). Complimentary/ Alternative medicine use in a comprehensive cancer center and the implications for oncology. Journal of Clinical Oncology, 18, 2505-2514.
Riet, P.V.D. (2011).Vipassana meditation: One woman’s narrative. Collegian, 18, 36-42.
Ryan, R.M., & Deci, E.L. (2001). On happiness and human potentials: A review of research on hedonic and eudaimonic well-being. Annual Review of Psychology, 52, 141-166.
Ryff, C.D. (1989). Happiness is everything, or is it? Explorations on the meaning of psychological well-being. Journal of Personality and Social Psychology, 57, 1069-1081.
Ryff, C.D., & Keyes, C.L.M. (1995). The structure of psychological well-being revisited. Journal of Personality and Social Psychology, 69, 719-727.
Sachar, R. (2013). Impact of a Buddhist practice on psychological well-being and related factors of positive psychology: a transnational comparison (Unpublished Doctoral thesis, Indian Institute of Technology Delhi, India).
Sachar, R., Singh, K., & Khurana, A. (2011, July). Impact of Buddhist Practice on Psychological Well-Being and Related Factors: A Comparison of Practitioners and Non-Practitioners. Poster presented at the Second World Congress on Positive Psychology, Philadelphia, USA.
Sahaj Marg system of Rajyoga meditation, practice (2015). Retrieved from www.sahajmarg.org/abhyasi dated August, 1, 2015.
Seligman, M.E.P. (2011). Flourish: A visionary new understanding of happiness and well-being. New York: Free press.
Singh, K., Junnarkar, M. & Sharma, S. (2015) Anxiety, stress, depression, and psychosocial functioning of Indian adolescents. Indian Journal of Psychiatry, 57 (4), 41-48
Singh, K., Khanna, P., Khosla, M., Rapelly, M., & Soni, A. (2016). Revalidation of the Sat-Chit-Ananda Scale. Journal of Religion and Health, 55 (6), 1-10.
Singh, K. (2014). Relationship of demographic variables, socio-cultural issues and selected psychological constructs with the positive mental health of North Indian adolescents. ICMR Project Report (RP02586).
Singh, K., Jain. A, & Singh, D. (2014). Satsang: A culture specific effective practice for well-being. In H. Agueda Marujo and L. M. Neto (eds.) Positive Nations and Communities, Cross-Cultural Advancements in Positive Psychology, 79 – 100, ©Springer Science+Business Media Dordrecht.
103
International Journal of Research in Management & Social Science Volume 5, Issue 3 (IV): July - September, 2017
ISSN 2322 - 0899
Singh, K., Khari, C., Amonkar, R., Arya, N.K., & Kesav, S.K. (2013). Development and validation of a new scale: sat-chit-ananda scale. International Journal on Vedic Foundations of Management, 1, 54-74.
Smith, T. B., McCullough, M. E., & Poll, J. (2003). Religiousness and depression: Evidence for a main effect and the moderating influence of stressful life events. Psychological Bulletin, 129, 614-636.
Srivastava, A.K., & Misra, G. (2011). New directions in health psychology. In A. K. Dalal & G. Misra (Eds.) (pp. 109–131). New Delhi: Sage.
Swami, G.G. (1981). Yoga: Step-by-Step. Pondicherry: Satya Press.
Travis F., David, A.F.H., Hagelin, J., Tanner, M., Nidich, S., Gaylord-King, C., Grosswald, S., Rainforth, M., & Robert H.S. (2009). Effects of transcendental meditation practice on brain functioning and stress reactivity in college students. International Journal of Psychophysiology, 71, 170-176.
Travis, F., & Shear, J. (2010). Focused attention, open monitoring and automatic self-transcending: Categories to organize meditations from vedic, Buddhist and Chinese traditions. Consciousness and Cognition, 19, 1110-1118.
Weaver, A.J., Pargament, K.I., Flannelly, K.J. & Oppenheimer, J.E. (2006). Trends in the Scientific Study of Religion, Spirituality, and Health: 1965-2000. Journal of Religion and Health, 45 (2), 208-214.
Yadav, R. K., Magan, D., Mehta, M., Mehta, N., & Mahapatra, S.C. (2012). A short-term, comprehensive, yoga-based lifestyle intervention is efficacious in reducing anxiety, improving subjective well-being and personality. International Journal of Yoga, 5, 134-139.
Zeidan, F., Johnson, S.K., Diamond, B.J., David, Z., & Goolkasian, P. (2010). Mindfulness meditation improves cognition: Evidence of brief mental training. Consciousness and Cognition, 19, 597-605.
Zope, S.A., & Zope, R.A. (2013). Sudarshan kriya yoga: breathing for health. International Journal of Yoga, 6, 4-10.

104
International Journal of Research in Management & Social Science Volume 5, Issue 3 (IV): July - September, 2017
ISSN 2322 - 0899
GREEN RETAILING: AN INNOVATIVE BUSINESS PERSPECTIVE
Sayani Mandal1 and Sumanta Dutta2 Research Officer1, International Management Institute, Kolkata
Assistant Professor2, St. Xavier’s College (Autonomous), Kolkata
ABSTRACT Retailers were regarded as distributors of merchandise traditionally, adding little value for consumers or suppliers. But as years passed by, change in the scenario was witnessed with retailers playing a pivotal role in forming a link between business and consumers. They not only act as mediators, they are the change agents now. They take upon the responsibility to contribute to changes pertaining to the betterment of the society. In alignment to the current economic situation and having awakened to the ramifications of the affluent environmentalism, they comprehended the need to embrace ‘Green Retailing’ (GR) as the new business mantra in order to attain corporate sustainability. They opted for ‘green’ practices and began selling eco-friendly products, putting forth an answer to the ramifications of affluent environmentalism. The philosophy of environmental management practices in retail business operations—which help firms reduce waste, increase efficiency, reduce costs, and protect against environmental liabilities, has been known to business for years. Therefore, following such practices add to the green image of the retailers, which consumers are seen seeking in products these days. Alongside, it gives the retailers an added advantage of charging relatively high for the eco-friendly products and it also help them having a competitive advantage over other retailers by the virtue of product differentiation.
This paper provides a general overview about the need of Green Retailing in recent times and also throws some light on the perspectives about Green Retailing opted by different business
Keywords: Green Retailing (GR), Eco-Friendly, Retailers, Affluent environmentalism, Green Practices.
RETAILING IN INDIA: BACKGROUND SNIPPET Retailing in India is one of the pillars of its economy. Indian Retail Sector accounts for about 20% of the country’s GDP and contributes 8% to total employment.1 The Indian retail market stands as one of the top five retail markets in the world by its economic value.2 With the introduction of investment and trade regime in 1991, India witnessed extensive growth in economy. Twenty-five years down the line, India embarked on a journey of economic liberalization, opening its doors to globalization and market forces. Since then, India has come a long way with International Monetary fund (IMF) projecting India’s GDP growth by 7.4% for the year 2016-2017 making it the world’s fastest-growing large economy3. The country also compares favorably with other emerging markets like China, Mexico and Brazil in growth potential. India is expected to be the third-largest incremental GDP growth engine for the planet by 2030. The cumulative Foreign Direct Investment (FDI) inflows in single-brand retail trading, during April 2000 to June 2011, stood at 69.26 million USD4 owing to 51% ownership in single brand retail according to then foreign investment laws. However, the other side of the story states denial of multi-brand retail by central government of India until 2011, forbidding foreign groups from any ownership in supermarkets, convenience stores or any retail outlets. Indian Retail Sector witnessed alteration and improvement in the later part of the year 2011 as during the month of November, the central government of the country announced retail reforms for both multi-brand stores and single-brand stores. It changed foreign investment laws by allowing 51% ownership in multi-brand retail and 100% ownership in single-brand5. These market reforms paved the way for retail innovation and competition with multi-brand retailers such as Walmart, Carrefour and Tesco, as well single brand majors such as IKEA, Nike and Apple.
1 http://www.pwc.in/assets/pdfs/industries/retail-and-consumer/retail-report-300812.pdf Last accessed on October 31, 2016. 2 Accha, M. (2013, January 11). FE@CAMPUS MASTERMIND: Response by Mahavir Accha to question for Jan 7-13. The Indian Express 3 http://www.mckinsey.com/global-themes/employment-and-growth/indias-ascent-five-opportunities-for-growth-and-transformation. Last accessed on November 02, 2016. 4 http://www.pwc.in/assets/pdfs/industries/retail-and-consumer/retail-report-300812.pdf Last accessed on November 01, 2016. 5 http://rasci.in/downloads/2014/Global_Practices_Promoting.pdf Last accessed on November 01, 2016.

105
International Journal of Research in Management & Social Science Volume 5, Issue 3 (IV): July - September, 2017
ISSN 2322 - 0899
INTRODUCTION According to The Indian Kaleidoscope-Emerging Trends in Retail,6 a report generated by PWC in the year 2012, the current estimated value of the Indian retail sector is about 500 billion USD and is pegged to reach 1.3 trillion USD by 2020. Indian retail is mainly dominated by unorganised sector with around 13 million retail outlets all over the country. An average size of one such store is 50-100 square feet and it accounts for around 95-96% of the total Indian retail industry. This is the reason, India is known as ‘Nation of Shopkeepers’ where per capita retail space is among the lowest in the world. Alongside unorganised retail, Indian retail market has been experimenting with modern retailing in the past few years, where many domestic and international players have entered the Indian retail arena. Companies like Reliance, Raheja, Tata, Bharti Walmart, Metro, Carrefour and Tesco have ambitious plans to expand in the future years across various verticals, formats, and cities of the country. They capitalize on the sharp rise in disposable income, nuclear families and high consumer spending by the young population. Even small towns and cities are having a footfall that is high on aspirations and are termed as ‘weekend browsers’. They are showcasing a shift in consumer lifestyle and preferences, thus making it attractive markets for retailers to expand their presence. The penetration level of modern retail (currently holding 5% market share in India) is expected to increase six-fold from the current 27 billion USD to 220 billion USD in 2020.
GREEN RETAILING: WHY MORE THAN ‘JUST AN OPTION’ TO RETAILERS? Having put forward the giant size of retail businesses, every constructive change that takes place in it, ensures extensive impact in the economy of the respective country as well as the world. Even a small change in the retail sector confirms an impact of unlimited degree, as it happens to be one of the pillars of the economy. We know that retailers are those organizations, which play a pivotal role in forming a link between the business and the consumers. They are the intermediaries. They take upon the responsibility to contribute to changes pertaining to the betterment of the society at large. They address to issues like climate change, global warming, waste management, plastic pollution. To ensure paperless environment, retailers look forward to practice Go Green Initiative (GGI).7 The initiative refers adhering to the five letters of the word G.R.E.E.N. as proposed by Jill Buck i.e. Generate Less Waste, Recycle everything that cannot be reused, Educate the community on eco-friendly options, Evaluate the environmental impact of actions and Nourish discussions and activities that integrate environmental education into existing curriculum. Comprehending the pivotal role of retailers, Durieu referred to retailers as the ones who “can greatly influence changes in production processes and consumption patterns and are well positioned to exert pressure on producers in favor of more sustainable consumer choice”8. In regard to that context, retailers hold the responsibility to address to the drastic changes taking place in the climate along with efficiency issues of energy consumption in the environment. Businesses across the world are developing green strategies and are working towards developing a low carbon landscape and undertaking efforts to optimize the carbon efficiency of existing products and infrastructure. Apart from retail sector, other sectors of the nations worldwide have also awakened to the ramifications of affluent environmentalism. In response to such ramifications, Green Movement has become a buzzword of today’s business world9. In recent times, retailers across the world are seen adopting Green Retailing strategies to improve their environmental performance and retail value chain10. Green Retailing refers to the managing of retail business that care for the environment and takes advantage of environmentally friendly processes. It is an approach by the retailers embracing environmental protection to improve the retail value chain by means of eliminating waste, increasing efficiency and reducing costs. Green Retailing embraces different multi-dimensional practices adopted and practiced by the retailers to instigate purchase of eco-friendly products and also highlighting of retail communication about the energy saving drive at retail stores. Adoption of green practices by retailers can actually have a multiplier effect of environmental pressure on consumers and suppliers. Owing to the changes in the structure of modern retail in both organised and unorganised sector, with
6 http://www.pwc.in/assets/pdfs/industries/retail-and-consumer/retail-report-300812.pdf Last accessed on November 05, 2016 7 Go Green Initiative (GGI), an environmental education and stewardship program, was founded in 2002 in Pleasanton, California by Jill Buck. 8 http://bimtech.ac.in/wp-content/uploads/2013/09/Green-Retailing.pdf Last accessed on October 30, 2016. 9 http://repo.uum.edu.my/15802/1/6_IPBJ_vol_6_3_2014_ms_111-131.pdf Last accessed on November 01, 2016 10 Lai, K.H., Cheng, T.C.E., & Tang, A.K.Y. (2010). Green Retailing: Factors for success. California Management Review 52(2), 6-31.

106
International Journal of Research in Management & Social Science Volume 5, Issue 3 (IV): July - September, 2017
ISSN 2322 - 0899
non-store and e-commerce retailers posing a threat to them by stealing their customers, the retailers have to come up with a surviving strategy to stand out of the competition and look for creative ways to trim down their operating expenses and ways to reduce their inventory exposure. Opting for Green Retailing can be one such significantly creative way. Many traditional retailers and specialty stores have started offering green product ranges starting from Walmart to P&G emphasizing on the retail trend of ‘going green’. Green products come with a promise of social change where they promote the idea of solving the environmental problems through sustainable consumption.
ROLE OF GREEN RETAILING Green Retailing plays a substantial role in making consumer’s consumption and lifestyles greener. It also contribute towards achieving a sustainable economy.11 Green Retailing not only expect retailers to own the responsibility of offering green products but also offer consumers the opportunity to paint the world green while they shop. Ensuing the change in the retail picture, modern retailers are not left with any option but to adopt ‘go-green’ mode. They are compelled to adhere to eco-friendly practices for retaining their existence in the market. Two prominent reasons steering this immense need for following ‘Green Retailing’ can be illustrated as: (a) Increase in the awareness of consumers with respect to eco-friendly goods and practices. (b) Retailers have realised that in order to stand out in the retail clutter, they need to differentiate their offerings from that of their competitors by building a ‘green image’. According to Chen (2008)12, companies which invest in efforts on environmental issue, can improve their corporate image in the minds of their potential customers, can develop new markets for themselves and also create options for themselves to enjoy a competitive advantage. Companies which embrace the concept of ‘going-green’ and sells environment-friendly products, can actually charge a relative high price for their products capitalizing on the principle of being ‘eco-friendly’ which refers to the products which will not cause pollution to the earth or deplore natural resources, and which can be recycled or conserved as well.
RULES FOR SUCCESSFUL IMPLEMENTATION To encourage buying of green products making them a part of everyday purchase, green retailers need to find and categorize green consumers, develop offerings that will fit this segment and disseminate the benefits of the green products effectively. For effective implementation of such practice, retailers can make use of green integrated marketing communication to motivate the customers for the adaption of green products. The motivation of the customers depends upon the social, cultural and material complexity involved in both the marketing and consumption of green products. In other words, green consumption is about much more than individual choice and decision-making. It is highly dependent on the social and cultural aspect of the customers. Retailers acting as mediators of green commodities should undertake retail marketing and in-store promotions to bring about more sustainable consumption of green products. In an article, Ottman (2008) described the five thumb rules of green marketing which the marketers if consider can expect successful implementation of their green products: 1. Knowing the Customer: To sell green products to the consumers, the consumers must be made aware about
the issues which the marketers are attempting to address (For e.g., consumers would not pay premium prices for the CFC-free refrigerators until they do not know what CFC actually is and its impact on the environment). Hence, if the consumers are not aware about the issue, proper implementation of the initiative fails.
2. Empowering Consumers: Consumers must feel that their buying behavior is making a difference; this is one of the main reasons why consumers buy green products. So empowering them with this thought deserves utmost importance.
3. Being Genuine and Transparent: Marketers need to be genuine and transparent about the specific environment friendly/green claims they make about their products and services. False claims about products and services can ruin the business perspective and brand image of the company.
4. Assurance to Buyer: Consumers need to believe that products which are being claimed as green products by the marketers must be able to meet the needs of customers along with environmental benefits. Products
11 Sadowski, M. and Buckingham, F. (2007). 'Retail Corporate Responsibility - Retailers as Choice Editors.' European Retail Digest, pp.7- 11. 12 Chen, S. (2008). "The impact of online store environment cues on purchase intention: Trust and perceived risk as a mediator", Online Information Review, Vol. 32, Issue: 6, pp.818 - 84

107
International Journal of Research in Management & Social Science Volume 5, Issue 3 (IV): July - September, 2017
ISSN 2322 - 0899
and services claiming environmental benefits without meeting the customers' expectations may lead to failure.
5. Consider your Pricing: While charging premium prices for green products and services, the marketers need to make sure that consumers can afford the premium prices charged by them. The consumers need to feel that paying that much of a premium is worthy, as consumers are typically price-sensitive.
GREEN INITIATIVES TAKEN BY RENOWNED BUSINESSES Sustainability is a major focus and taking that into consideration, many companies have adopted sustainability as an integral part of their business strategy. Few initiatives taken up by retailers to for better environmental practices: 1. Wal-Mart came up with an innovative refrigeration system known as secondary loop realizing the
importance of energy conservation and efficient energy usage. 2. IKEA, world’s largest furniture retailer eliminated 24 out of 33 components from its famous lamp
TEXTUR and reduced the weight of the lamp by almost 50% making it cost effective and sustainable. 3. HCL launched its range of eco-friendly notebooks, HCL ME 40. The company claims it to be an eco-
friendly product completely free from polyvinyl chloride (PVC) and other harmful chemicals alongside being 100% recyclable. Further, this product range was given a five-star rating by the Bureau of Energy Efficiency and they also meet REACH (REACH is the European Community Regulation on chemicals and their safe use) standards.
4. Voltas (Tata Group) launched the 'Green' range of air-conditioners in 2007. In later years, it was made mandatory by the government to have energy star ratings for electronic home appliances.
5. Wipro launched eco-friendly desktops during Wipro Green Ware initiative, with an aim to cut down e-waste. The systems launched are toxin free and can operate under a total recycling policy. Wipro has 17 e-waste collection centers in India where products are collected and recycled, and 12 Wipro campuses in the country have been certified as ‘Green Buildings’.
6. LG Electronics introduced LG LED E60 and E90 series monitors packed with eco-friendly features (such as 40 per cent less energy consumption than the traditional LCD monitors) specifically for Indian market. However, LG launched a range of eco-friendly products 'Eco-Chic' such as the platinum coated two-door refrigerator and washing machine with steam technology for the global market.
7. Haier India launches the green initiative with its 'Eco-Life' series, as a part of its global rebranding exercise. The eco-friendly offerings include refrigerators, semi and fully automatic washing machines, split and windows air conditioners, a wide range of LED & LCD TVs and the Spa range of water heaters.
8. P&G India introduced compact detergents in India for Ariel and Tide using fewer raw materials and packaging materials alongside ensuring superior consumer value. The company also re-designed the packaging of Whisper and Pampers to reduce thickness, thus reducing raw material usage and saving paper. It also re-designed the pump package of their beauty product Olay which reduces plastic consumption and is 25% lighter.
9. Samsung Electronics claims to offer products having eco-friendly LED backlight, containing few or no environmentally hazardous substances, such as mercury or lead.
10. Panasonic has an Econavi range of air conditioners and LCD screens based on energy conservation. Globally, Panasonic is aiming to become top green innovation company in the electronics industry by 2018 and is laying a lot of emphasis on eco-friendly products.
11. MRF launched eco-friendly tubeless tyres MRF ZSLK, which are made from unique silica-based rubber compounds and promises to offer fuel efficiency for vehicle owners.
12. ACC launched its eco-friendly brand, ‘Concrete+’. This brand uses fly ash (a hazardous industrial waste) to help conserve natural resources, thus making it an eco-friendly product.
13. Fevicol, a leading brand of adhesive in India, introduced environment friendly synthetic resin adhesive. Claiming to be India's first eco-friendly adhesive, Fevicol AC Duct King Eco Fresh, boasts of being an all-in-one adhesive.
14. Anita Dongre, renowned fashion designer joined the line of eco-fashion (Eco-fashion is a process of creating garments with environment friendly techniques and processes which are non-hazardous to the

108
International Journal of Research in Management & Social Science Volume 5, Issue 3 (IV): July - September, 2017
ISSN 2322 - 0899
environment) with her brand, Grassroot. She claims to use certified eco-friendly & organic fabrics for Grassroot.
15. Earth friendliness is the hallmark of the Vivanta line, just as it is for all Taj hotels. The parent company follows guidelines established at a United Nations Earth Summit and their green benchmarks are monitored by a leading worldwide certifier, Green Globe.
GREEN INITIATIVES TAKEN BY OTHER NOT-SO-RENOWNED BUSINESSES Name Description
Smallsteps
‘A smart bag for a smart planet’ project by Smallsteps was launched by Upasana Design studio in Auroville on Earth Day 2007. They make re-usable shopping bags which they claim to effectively prevent the dumping of 200 throw-away plastic bags every day.
Khoobsare
It’s an ecommerce platform to promote sustainable ethnic women’s wear as this brand positions on making new clothes from the outfits a woman throws out of her closet while decluttering it and making space for something new. These clothes gives another women the opportunity to wear something new and different without increasing their carbon footprint.
TreeWear
It’s an eco-clothing company that aspires toward a greener planet by making clothes by eco-manufacturing processes. The brand takes up zero-waste initiative by using methods of recycling (in the packaging) and upcycling (through the creative use of scrap and waste materials from the manufacturing process) to ensure sustainability at every level.
Net Paradigm India Pvt. Ltd
The company produces apparel made from ‘Bamboo Blended Fabrics’- A naturally hardy plant, which does not require any chemicals insecticides, pesticides during the growing process. The company provide wide range of products made from the so-called fabric ranging from Baby Apparel, Adult Apparel, Bedding, Bath Towels, Made-ups and Bags.
Cheviot Company Limited
Professionally managed company having export turnover of more than USD 40 million, famous for manufacturing Jute Fabrics and Bags, the company is looking forward to also move into the production of high quality Jute Fabric for the Industrial & Decorative Applications for a better environment.
Green Path Foundation
Green Path Foundation established ‘Organic State–Hasiru Thota’, India’s largest organic food retail store in Bengaluru. There offers a diverse range of products which is displayed at the retail store ranging from sustainably grown spices, herbs, condiments, organic certified pulses, cereals, honey, jaggery, papads, multi-grain flour, a plethora of millets, amla candies, pickles to anything and everything under the food items for which they have an organic version present in the store. Apart from food, the store displayed a range of eco-friendly fashion accessories, organic cotton clothes, bags, etc.
Eco Essentials
The company has pledged to take the initiative to save the environment from unwanted use of plastics and other hazardous substances used in our everyday life. It produces Areca palm leaf plates by collecting dried and fallen Areca Palm leaves and make them into bio-degradable, compostable tableware aiming to substitute hazardous substances with greener, natural substances, which are bio-degradable and self-sustaining..
Greenvision Exports
Manufacturer of coir based garden articles, produces products which are Eco-friendly, Bio-Degradable and possesses water holding capacity. The product offerings range from coco liner, coco basket, coco pots, coco poles, coco weed control mats, coco peat, organic manure and so on.
CONCLUSION Green Retailing and adoption of green practices by businesses has gained quantum in India in recent times, however it still resides in the nascent stage. The Government has announced and implemented various policies for environmental protection, whereas many organisations are willingly adopting environment friendly

109
International Journal of Research in Management & Social Science Volume 5, Issue 3 (IV): July - September, 2017
ISSN 2322 - 0899
practices. Converting a conventional store to eco-friendly store requires large amount of upfront investment. It requires installing renewable options and opting for green constructive processes for stores, which happens to be a constraint for small business firms. These initiatives provide long-term profits which become hard for small business firms to bear because they mainly concentrate on short-term profits. Walking the green journey provides the business firms with ample benefits ranging from reduced operational costs, competitive advantage and high profit margins besides providing a distinguished positing in the mind of the customers about the company. However, building an eco-friendly brand also does not happen overnight. Successful implementation of green practices requires a holistic approach and collaboration of all the stakeholders along the supply chain. Therefore, Green Retailing is no more ‘just an option’ to retailers because there is more than just encompassing the differentiation and profitability notions in their ventures. They encompass social and environmental dimensions which calls for more concern and importance from both customers and business firms. The prominent role retailers play in disseminating this social importance and environmental concern to the customers’ refers to the prime responsibility they carry on their shoulders. Customers need to be convinced to buy the products offered, making them realise the environmental vulnerabilities and its respective ramifications. Green Retailers therefore play a pivotal role in helping customers choose from the green offerings and assist them in walking the Green Journey, riding the Green Wave and joining the Green Revolution. .

International Journal of Research in Management & Social Science is a quarterly double blind reviewed research journal of Empyreal Institute of Higher Education, Guwahati, India. It seeks to provide a platform to research scholars, practicing managers, and academicians in business management, commerce and allied fields, to present their research findings and share their views and experiences. Its aim is to promote research education worldwide and to establish acquaintances between management and Information Technology. The journal focuses on issues related to the development and implementation of new methodologies and technologies, which improve the operational objectives of an organization. These include, Project management, logistics, production management, e-commerce, quality management, financial planning, risk management, General Management, Banking, Insurance, International Business, Health Care Administration, Human Resource Management , Non-Profit Organizations, Operations Research/Statistics, Operations Management, Organizational Behavior and Theory, Organizational Development, Organizational Management, Production/Operations, Public Administration, Purchasing/Materials Management, Entrepreneurship, Strategic Management Policy, Technology/Innovation, Tourism and Hospitality, Supply Chain Management, Rural Management, Public Management, Knowledge Management, Business Ethics, Corporate Social Responsibility , Negotiations and Competitive Decision Making, Data Analysis, Hotel Management and emerging trends in allied subjects. The journal provides a forum for researchers and practitioners for the publication of innovative scholarly research, which contributes to the adoption of a new holistic managerial approach that ensures a technologically, economically, socially and ecologically acceptable deployment of new technologies in today’s business practices.
ABOUT THE JOURNAL

Guidelines for Contributors
1. Manuscripts should be submitted preferably through email and the research article / paper should
preferably not exceed 8 – 10 pages in all.
2. Book review must contain the name of the author and the book reviewed, the place of publication and publisher, date of publication, number of pages and price.
3. Manuscripts should be typed in 12 font-size, Times New Roman, single spaced with 1” margin on a standard A4 size paper. Manuscripts should be organized in the following order: title, name(s) of author(s) and his/her (their) complete affiliation(s) including zip code(s), Abstract (not exceeding 350 words), Introduction, Main body of paper, Conclusion and References.
4. The title of the paper should be in capital letters, bold, size 16” and centered at the top of the first page. The author(s) and affiliations(s) should be centered, bold, size 14” and single-spaced, beginning from the second line below the title.
First Author Name1, Second Author Name2, Third Author Name3 1Author Designation, Department, Organization, City, email id 2Author Designation, Department, Organization, City, email id
3Author Designation, Department, Organization, City, email id 5. The abstract should summarize the context, content and conclusions of the paper in less than 350
words in 12 points italic Times New Roman. The abstract should have about five key words in alphabetical order separated by comma of 12 points italic Times New Roman.
Examples of References
All references must be arranged first alphabetically and then it may be further sorted chronologically also. Abrams, F. W., (1951), ‘Managements Responsibilities in a Complex World’, Harvard Business
Review, 29(3): 29 – 34.
Bateson, C. D.,(2006), ‘Doing Business after the Fall: The Virtue of Moral Hypocrisy’, Journal of Business Ethics, 66: 321 – 335
French, P. A. (1984), “Collective and Corporate Responsibility”, Colombia University Press, New York.
Morris, C. (1999) Quantitative Approaches to Business Studies (5th edn), London, Financial Times Pitman Publishing.
Khushalani, Lakhan and Kulkarni, Prasad (2007), “Network Security”, Presented at the National Conference on Emerging Technologies in Control and Instrumentation, October 19-20 2007, Mumbai: TSEC, 53 – 55.
Dees, J.G. (2001), “The Meaning of Social Entrepreneurship”, Retrieved from: http://www.caseatduke.org/documents/dees_sedef.pdf (accessed 10th December 2010).
K. Mae Heussner (2008). Jeff Ooi - from digital to political clout? Accessed 15 May 2008 from http://www.Malaysiakini.com.news/78757.