Embed Size (px)
Citation preview
A
FooDSFOOD DEMAND SURVEY
Volume 5, Issue 10: February 20, 2018
Food Demand Survey | Oklahoma State University | [email protected] Norwood | Professor | 405-744-9820
Susan Murray | Research Specialist | 405-744-4857This project is supported by a Willard Sparks Endowment, the Oklahoma Agricultural Experiment Station, and the
Agricultural and Food Research Initiative Competitive Program of the USDA National Institute of Food and Agriculture.
FooDS tracks consumer preferences and sentiments on the safety, quality, and price of food at home and away from home with particular focus on meat demand. FooDS is a monthly on-line survey with a sample size of at least 1,000 individuals, weighted to match the US population in terms of age, gender, education and region of residence. See the online technical document for more details.
About the Survey
Compared to one month ago, willingness-to-pay (WTP) increased for chicken breast and hamburger, but decreased for steak, pork chops, deli ham, and chicken wings. WTP for deli ham saw the largest percent decrease among meat products compared to one month ago. WTP for all food products is lower than one year ago.
MEAT DEMAND
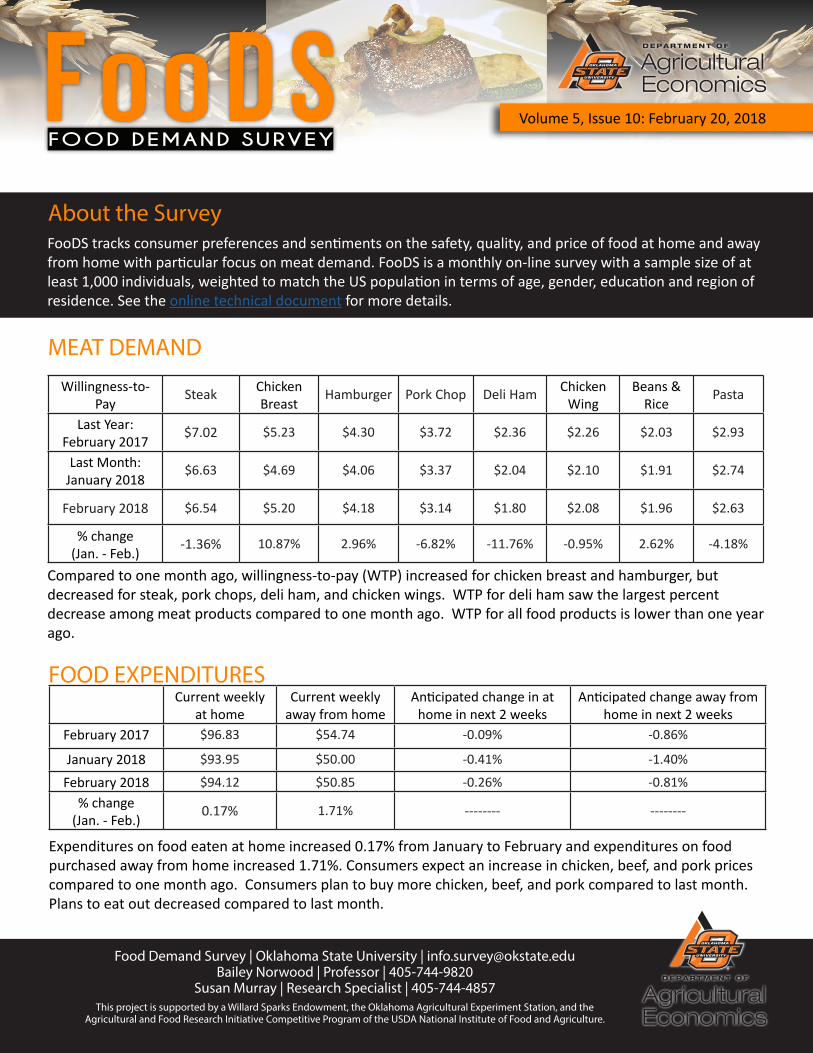
Expenditures on food eaten at home increased 0.17% from January to February and expenditures on food purchased away from home increased 1.71%. Consumers expect an increase in chicken, beef, and pork prices compared to one month ago. Consumers plan to buy more chicken, beef, and pork compared to last month. Plans to eat out decreased compared to last month.
FOOD EXPENDITURES
Willingness-to-Pay
Steak Chicken Breast
Hamburger Pork Chop Deli Ham Chicken Wing
Beans & Rice
Pasta
Last Year:February 2017
$7.02 $5.23 $4.30 $3.72 $2.36 $2.26 $2.03 $2.93
Last Month:January 2018
$6.63 $4.69 $4.06 $3.37 $2.04 $2.10 $1.91 $2.74
February 2018 $6.54 $5.20 $4.18 $3.14 $1.80 $2.08 $1.96 $2.63
% change(Jan. - Feb.)
-1.36% 10.87% 2.96% -6.82% -11.76% -0.95% 2.62% -4.18%
Current weekly at home
Current weekly away from home
Anticipated change in at home in next 2 weeks
Anticipated change away from home in next 2 weeks
February 2017 $96.83 $54.74 -0.09% -0.86%
January 2018 $93.95 $50.00 -0.41% -1.40%
February 2018 $94.12 $50.85 -0.26% -0.81%% change
(Jan. - Feb.)0.17% 1.71% -------- --------
Food Demand Survey | Oklahoma State University | [email protected] Norwood | Professor | 405-744-9820
Susan Murray | Research Specialist | 405-744-4857This project is supported by a Willard Sparks Endowment, the Oklahoma Agricultural Experiment Station, and the
Agricultural and Food Research Initiative Competitive Program of the USDA National Institute of Food and Agriculture.
Consumer Expectations FooDS Page 2
0.39
0.03 -0.03
-0.28
0.27
0.140.17
0.32
-0.06 -0.12
-0.43
0.16
0.05 0.05
0.36
0.00-0.06
-0.30
0.20
0.07 0.08
-0.5
-0.4
-0.3
-0.2
-0.1
0
0.1
0.2
0.3
0.4
0.5
I plan to buy morechicken
I plan to buy morebeef
I plan to buy morepork
I plan to eat out more I expect higher beefprices
I expect higher chickenprices
I expect higher porkpricesMe
an (%)
(Diffe
renec
in Agre
e and
Disag
ree)
Feb-17 Jan-18 Feb-18
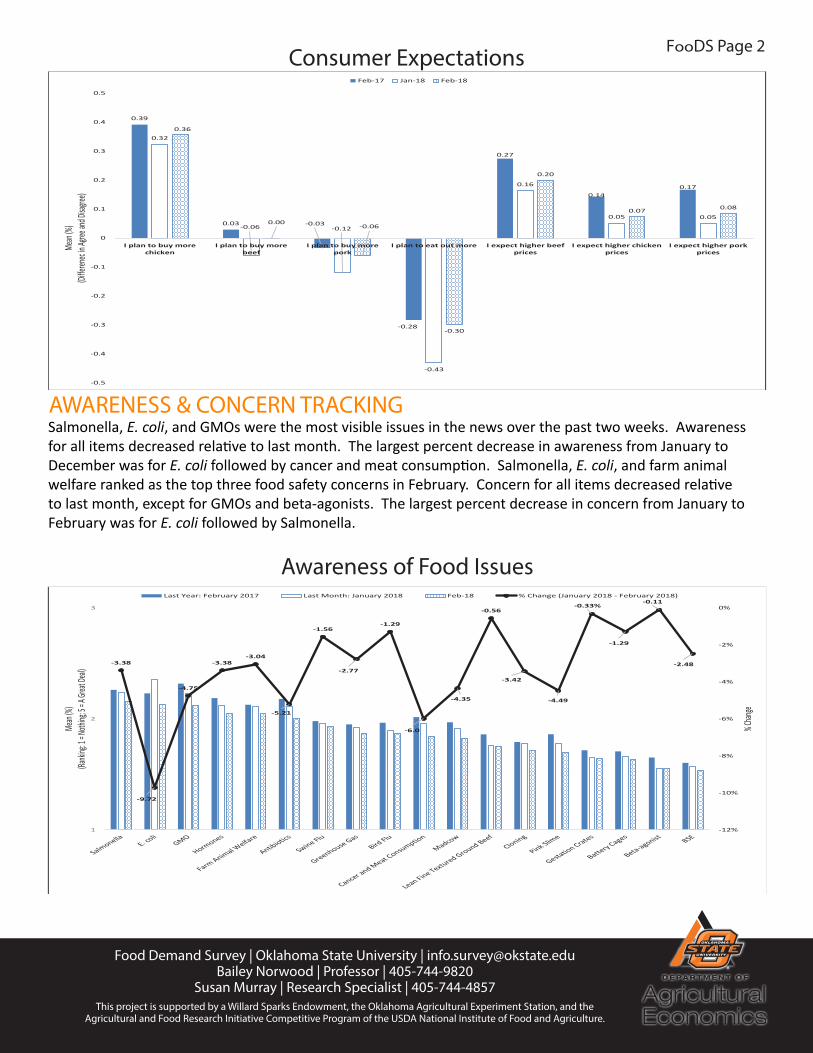
Salmonella, E. coli, and GMOs were the most visible issues in the news over the past two weeks. Awareness for all items decreased relative to last month. The largest percent decrease in awareness from January to December was for E. coli followed by cancer and meat consumption. Salmonella, E. coli, and farm animal welfare ranked as the top three food safety concerns in February. Concern for all items decreased relative to last month, except for GMOs and beta-agonists. The largest percent decrease in concern from January to February was for E. coli followed by Salmonella.
AWARENESS & CONCERN TRACKING
Awareness of Food Issues
-3.38
-9.72
-4.75
-3.38-3.04
-5.21
-1.56
-2.77
-1.29
-6.0
-4.35
-0.56
-3.42
-4.49
-0.33%
-1.29
-0.11
-2.48
-12%
-10%
-8%
-6%
-4%
-2%
0%
1
2
3
% Chan
ge
Mean
(%)(Ra
nking:
1 = No
thing;
5 = A G
reat D
eal)
Last Year: February 2017 Last Month: January 2018 Feb-18 % Change (January 2018 - February 2018)

Food Demand Survey | Oklahoma State University | [email protected] Norwood | Professor | 405-744-9820
Susan Murray | Research Specialist | 405-744-4857This project is supported by a Willard Sparks Endowment, the Oklahoma Agricultural Experiment Station, and the
Agricultural and Food Research Initiative Competitive Program of the USDA National Institute of Food and Agriculture.
Concern for Food Issues FooDS Page 3
-3.54
-5.34
-1.43 -1.40%
-2.95
0.14
-3.26
-2.04-2.29
-3.10
-1.66
-2.77
-1.75%
-0.49
-3.18
-2.05
0.05
-2.16
-6%
-5%
-4%
-3%
-2%
-1%
0%
1%
1
2
3
4
% Chan
ge
Mean
(%)(Ra
nking:
1 = Ve
ry Unco
ncerne
d; 5 = V
ery Co
ncerne
d)Last Year: February 2017 Last Month: January 2018 Feb-18 % Change (January 2018 - February 2018)
Taste, safety, and price remained consumers’ most important values when purchasing food this month. Consumers’ food values remained similar to those in past months. Similar to last month, consumers reported that their main challenge was finding affordable foods that fit within their budget. Finding affordable foods that fit with-in my budget was the challenge experiencing the largest percent increase, while losing weight was the challenge experiencing the largest percent decrease. In February, about 7% of participants reported having food poisoning, a 23.6% increase from last month. About 6.7% of respondents reported being vegetarian or vegan.
GENERAL FOOD VALUES
Consumer Challenges
5.22
1.07
-0.13
4.09
-7.22
-2.06 -1.93
-8%
-6%
-4%
-2%
0%
2%
4%
6%
0
1
2
3
4
5
6
Finding affordablefoods that fit with-in
my budget
Avoiding certainnutrients oringredients
Finding convenientalternatives
Avoiding pesticides,added hormones and
antibiotics
Losing weight Finding time to cookat home
Finding foods mychildren will eat
% C
han
ge
Mea
n (
%)
(Ran
kin
g: 1
= L
east
; 7 =
Mo
st)
January February % Change
Consumer Values
-0.8
-0.6
-0.4
-0.2
0
0.2
0.4
0.6
0.8
Mea
n (
%)
January February

Food Demand Survey | Oklahoma State University | [email protected] Norwood | Professor | 405-744-9820
Susan Murray | Research Specialist | 405-744-4857This project is supported by a Willard Sparks Endowment, the Oklahoma Agricultural Experiment Station, and the
Agricultural and Food Research Initiative Competitive Program of the USDA National Institute of Food and Agriculture.
FooDS Page 4
Several new ad hoc questions were added to the survey this month relating to gardening and people’s participation in growing their own food. First we asked: “Do you or anyone in your household currently maintain a garden where you grow vegetables, herbs, or fruit?” About 40% of participants stated ‘yes’ they do maintain a garden.
Those who responded yes were asked several questions relating to their gardens. Participants were asked: “How large is your garden?” About 51% of participants stated their garden was less than 150 square feet (less than the area of a standard parking space for a car). About 5% of participants stated their garden was more than 1,000 square feet (more than seven parking spaces).
AD HOC QUESTIONS
51.4%
32.9%
10.3%
5.5%
0%
10%
20%
30%
40%
50%
60%
Less than 150 square feet (less than thearea of a standard parking space for a car)
Between 150 and 500 square feet (one tothree parking spaces)
Between 500 and 1,000 square feet (threeto seven parking spaces)
More than 1,000 square feet (more thanseven parking spaces)
Perce
nt of
Respo
nden
ts
How large is your garden?Response from 40% of participants who maintain a garden where they
grow vegetables, herbs, or fruit
Food Demand Survey | Oklahoma State University | [email protected] Norwood | Professor | 405-744-9820
Susan Murray | Research Specialist | 405-744-4857This project is supported by a Willard Sparks Endowment, the Oklahoma Agricultural Experiment Station, and the
Agricultural and Food Research Initiative Competitive Program of the USDA National Institute of Food and Agriculture.
FooDS Page 5
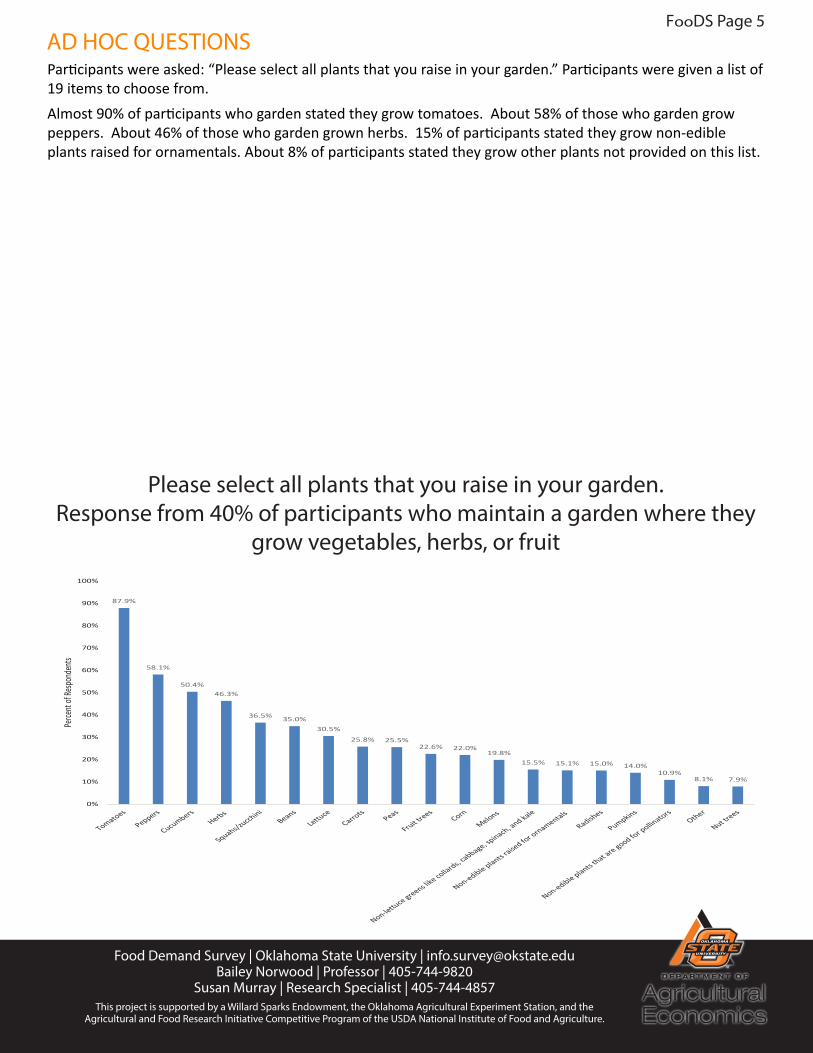
Participants were asked: “Please select all plants that you raise in your garden.” Participants were given a list of 19 items to choose from.Almost 90% of participants who garden stated they grow tomatoes. About 58% of those who garden grow peppers. About 46% of those who garden grown herbs. 15% of participants stated they grow non-edible plants raised for ornamentals. About 8% of participants stated they grow other plants not provided on this list.
AD HOC QUESTIONS
87.9%
58.1%
50.4%46.3%
36.5% 35.0%30.5%
25.8% 25.5%22.6% 22.0%
19.8%15.5% 15.1% 15.0% 14.0%
10.9%8.1% 7.9%
0%
10%
20%
30%
40%
50%
60%
70%
80%
90%
100%
Perce
nt of
Respo
nden
ts
Please select all plants that you raise in your garden. Response from 40% of participants who maintain a garden where they
grow vegetables, herbs, or fruit

Food Demand Survey | Oklahoma State University | [email protected] Norwood | Professor | 405-744-9820
Susan Murray | Research Specialist | 405-744-4857This project is supported by a Willard Sparks Endowment, the Oklahoma Agricultural Experiment Station, and the
Agricultural and Food Research Initiative Competitive Program of the USDA National Institute of Food and Agriculture.
FooDS Page 6
Participants were asked: “Which of the following best describes your attitudes toward using pesticides?”Approximately 56% of participants who garden stated “I never use any pesticides”. About 37% of participants of garden stated “I will occasionally use pesticides sold in gardening stores”. About 4% of those who garden stated “I use pesticides sold in gardening stores on a frequent basis”.
AD HOC QUESTIONS
55.9%
36.6%
3.8% 3.7%
0%
10%
20%
30%
40%
50%
60%
I never use any pesticides I will occasionally use pesticides sold ingardening stores
I use pesticides sold in gardening storeson a frequent basis
I have a pesticide application license anduse a variety of pesticides, some not sold
in gardening stores
Perce
nt of
Respo
nden
ts
Which of the following best describes your attitudes toward using pesticides?
Response from 40% of participants who maintain a garden where they grow vegetables, herbs, or fruit

Food Demand Survey | Oklahoma State University | [email protected] Norwood | Professor | 405-744-9820
Susan Murray | Research Specialist | 405-744-4857This project is supported by a Willard Sparks Endowment, the Oklahoma Agricultural Experiment Station, and the
Agricultural and Food Research Initiative Competitive Program of the USDA National Institute of Food and Agriculture.
FooDS Page 7
Lastly, all participants were asked: “Which do you prefer?” Over half of all participants stated they would prefer a “produce that looks perfect but was grown using traditional agricultural practices”. About 47% of participants stated they would prefer “produce with some slight, cosmetic blemishes but was grown using organic practices”.
AD HOC QUESTIONS
53.2%
46.8%
42%
44%
46%
48%
50%
52%
54%
Produce that looks perfect but was grown using traditional agricultural practices Produce with some slight, cosmetic blemishes but was grown using organic practices
Perce
nt of
Respo
nden
ts
Which do you prefer?