Embed Size (px)
Citation preview

November 2017
DESIGN MANUAL FOR ROADS AND BRIDGES
VOLUME 4 GEOTECHNICS AND DRAINAGE
SECTION 2 DRAINAGE
PART 4
HA 41/17
A PERMEAMETER FOR ROAD DRAINAGE LAYERS
SUMMARY
This Advice Note describes the apparatus and test method for determining the horizontal permeability of road drainage layers.
INSTRUCTIONS FOR USE
This is a new Advice Note to be incorporated into the Manual.
1. Remove existing Contents pages for Volume 4.
2. Insert new Contents pages for Volume 4, dated November 2017.
3. Insert HA 41/17 into Volume 4, Section 2, Part 4.
4. Please archive this sheet as appropriate.
Note: A quarterly index with a full set of Volume Contents Pages is available separately from The Stationery Office Ltd.

DESIGN MANUAL FOR ROADS AND BRIDGES
Summary: This Advice Note describes the apparatus and test method for determining the horizontal permeability of road drainage layers.
A Permeameter for Road Drainage Layers
HA 41/17 Volume 4, Section 2, Part 4
HIGHWAYS ENGLAND
TRANSPORT SCOTLAND
LLYWODRAETH CYMRUWELSH GOVERNMENT
DEPARTMENT FOR INFRASTRUCTURE NORTHERN IRELAND

November 2017
Registration of AmendmentsVolume 4 Section 2Part 4 HA 41/17
Amend No Page No Signature & Date of incorporation of amendments
Amend No Page No Signature & Date of incorporation of amendments
REGISTRATION OF AMENDMENTS

November 2017
Registration of AmendmentsVolume 4 Section 2
Part 4 HA 41/17
Amend No Page No Signature & Date of incorporation of amendments
Amend No Page No Signature & Date of incorporation of amendments
REGISTRATION OF AMENDMENTS

November 2017
DESIGN MANUAL FOR ROADS AND BRIDGES
VOLUME 4 GEOTECHNICS AND DRAINAGE
SECTION 2 DRAINAGE
PART 4
HA 41/17
A PERMEAMETER FOR ROAD DRAINAGE LAYERS
Contents
Chapter
1. Introduction
2. Scope
3. Background
4. Description of Apparatus
5. Test Procedure
6. Calculation of Results
7. Notes on Testing Periods
8. References
9. Approval
Annex A Method of Test for Horizontal Permeability of Drainage Layers
Annex B Test Box Typical Details
Annex C Permeabilty Test Results
Annex D Sample Results and Calculation
Annex E List of Amendments from Previous Version

November 2017 1/1
Chapter 1Introduction
Volume 4 Section 2Part 4 HA 41/17
1. INTRODUCTION1.1 A box-type permeameter for testing road drainage layers has been developed by Roads Engineering
Division in collaboration with Hydraulics Research Limited (HRL), Wallingford.
1.2 This Advice Note describes the apparatus and sets out a test procedure that may be used for determining horizontal permeability.
Chapter 1Introduction

1/2 November 2017
Chapter 1Introduction
Volume 4 Section 2Part 4 HA 41/17

November 2017 2/1
Chapter 2Scope
Volume 4 Section 2Part 4 HA 41/17
2. SCOPE2.1 The test described can be used to determine the horizontal permeability of embankment drainage layers,
capping materials and sub-bases and may be used to supplement the information required by Clause 640 of the Specification for Highway Works (SHW). Whilst the apparatus and test methods are currently the best available it should be recognised that, as with any test procedure, there are limitations on reproducibility and repeatability. Also it should be noted that the test applied to only laminar flow conditions and not to situations where high hydraulic gradients and turbulent flow could occur in practice.

2/2 November 2017
Chapter 2Scope
Volume 4 Section 2Part 4 HA 41/17

November 2017 3/1
Chapter 3Background
Volume 4 Section 2Part 4 HA 41/17
3. BACKGROUND3.1 Granular layers may be used to effect drainage of pavement layers beneath roads and for the relief of pore
pressures within embankments. The granular material must possess the dual role of providing adequate drainage and also load bearing properties. These roles conflict in that a well graded material is required for load bearing but is detrimental to the drainage properties.
3.2 The selection of material for use as a drainage layer is currently achieved by the specification of a grading envelope. Large variations in permeability within such an envelope have been noted (1). In order to ensure adequate drainage properties, it is desirable to be able to specify the permeability of such a material but there is no standard test by which the permeability at working conditions may be ascertained.
3.3 In order to provide a means of testing coarse drainage materials sub-base and capping materials in their compacted states, the Department of Transport devised a large-scale robust permeameter within which the material under test could be compacted to its working state. This permeameter was later modified on the advice of Hydraulics Research Limited (2) (3).
3.4 The University of Nottingham have also contributed to developing the test procedure and method of calculation to ensure that the true Darcy coefficient of permeability is obtained (4 and 5).

3/2 November 2017
Chapter 3Background
Volume 4 Section 2Part 4 HA 41/17

November 2017 4/1
Chapter 4Description of the Apparatus
Volume 4 Section 2Part 4 HA 41/17
4. DESCRIPTION OF THE APPARATUS4.1 An engineering drawing of the apparatus is provided at Annex B. The permeameter consists of a steel
box capable of accepting a sample of size approximately 1.0m x 0.3m x 0.3m (Figure 4.1). The sample is retained by a grid at either end of the box. The aperture size of the grids will depend on the grading of the material, so that the particles are supported without impeding the flow. Experience has shown that an aperture size of 1-2mm is satisfactory for the materials likely to be tested.
4.2 During testing, a differential head of water is maintained across the sample by an upstream and downstream weir. This may be achieved by varying the pipe heights or by lifting the permeameter at one end. The coefficient of permeability is obtained according to Darcy’s Law by measuring the steady-state flow through the sample.
4.3 In order to ensure complete saturation of the sample, a vacuum is applied to the box and maintained whilst slowly filling with water.
Figure 4.1 Schematic diagram of apparatus

4/2 November 2017
Chapter 4Description of the Apparatus
Volume 4 Section 2Part 4 HA 41/17

November 2017 5/1
Chapter 5Test Procedure
Volume 4 Section 2Part 4 HA 41/17
5. TEST PROCEDUREThe procedure for carrying out the test is described in Annex A. It is recommended that at least two test runs (each on a different sample) are carried out, each sample being tested at a range of head differences (minimum of 3).

5/2 November 2017
Chapter 5Test Procedure
Volume 4 Section 2Part 4 HA 41/17

November 2017 6/1
Chapter 6Calculation of Results
Volume 4 Section 2Part 4 HA 41/17
6. CALCULATION OF RESULTS6.1 The coefficient of permeability, k, at any temperature T is given by:
𝑘𝑘𝑘𝑘 =𝑞𝑞𝑞𝑞𝐴𝐴𝐴𝐴𝐴𝐴𝐴𝐴
10−6
60𝑚𝑚𝑚𝑚/𝑠𝑠𝑠𝑠
𝐴𝐴𝐴𝐴 =∆𝐻𝐻𝐻𝐻𝐿𝐿𝐿𝐿
𝑞𝑞𝑞𝑞20𝐴𝐴𝐴𝐴
=𝑞𝑞𝑞𝑞. 𝑐𝑐𝑐𝑐𝑊𝑊𝑊𝑊.𝐷𝐷𝐷𝐷
10−6
60𝑚𝑚𝑚𝑚/𝑠𝑠𝑠𝑠
𝑛𝑛𝑛𝑛 = 1 −𝑀𝑀𝑀𝑀
𝐿𝐿𝐿𝐿.𝑊𝑊𝑊𝑊.𝐷𝐷𝐷𝐷
1
1000 𝐺𝐺𝐺𝐺𝑠𝑠𝑠𝑠𝑠𝑠𝑠𝑠 �1 + 𝑤𝑤𝑤𝑤100�
where q is the steady state flow rate (ml/min)
A is the cross sectional area of the permeameter (m2)
i is the hydraulic gradient
6.2 For each head difference, ΔH, the hydraulic gradient, i, and the flow rate per unit area, q20/A, corrected to the standard laboratory temperature of 20°C are calculated using the equations:
𝑘𝑘𝑘𝑘 =𝑞𝑞𝑞𝑞𝐴𝐴𝐴𝐴𝐴𝐴𝐴𝐴
10−6
60𝑚𝑚𝑚𝑚/𝑠𝑠𝑠𝑠
𝐴𝐴𝐴𝐴 =∆𝐻𝐻𝐻𝐻𝐿𝐿𝐿𝐿
𝑞𝑞𝑞𝑞20𝐴𝐴𝐴𝐴
=𝑞𝑞𝑞𝑞. 𝑐𝑐𝑐𝑐𝑊𝑊𝑊𝑊.𝐷𝐷𝐷𝐷
10−6
60𝑚𝑚𝑚𝑚/𝑠𝑠𝑠𝑠
𝑛𝑛𝑛𝑛 = 1 −𝑀𝑀𝑀𝑀
𝐿𝐿𝐿𝐿.𝑊𝑊𝑊𝑊.𝐷𝐷𝐷𝐷
1
1000 𝐺𝐺𝐺𝐺𝑠𝑠𝑠𝑠𝑠𝑠𝑠𝑠 �1 + 𝑤𝑤𝑤𝑤100�
where ΔH is the vertical head difference across specimen (m)
L, W, D are the length, width and depth of the specimen (m)
c is the temperature correction factor μT/μ20, obtained from a standard chart. (Figure 6.1)
μ is dynamic viscosity of water
6.3 q20/A is plotted against i and the best straight line drawn from the origin through those points exhibiting a linear relationship. The gradient of this line gives k20, the coefficient of permeability at standard laboratory temperature.
6.4 Total porosity, n, can be calculated if required.
𝑘𝑘𝑘𝑘 =𝑞𝑞𝑞𝑞𝐴𝐴𝐴𝐴𝐴𝐴𝐴𝐴
10−6
60𝑚𝑚𝑚𝑚/𝑠𝑠𝑠𝑠
𝐴𝐴𝐴𝐴 =∆𝐻𝐻𝐻𝐻𝐿𝐿𝐿𝐿
𝑞𝑞𝑞𝑞20𝐴𝐴𝐴𝐴
=𝑞𝑞𝑞𝑞. 𝑐𝑐𝑐𝑐𝑊𝑊𝑊𝑊.𝐷𝐷𝐷𝐷
10−6
60𝑚𝑚𝑚𝑚/𝑠𝑠𝑠𝑠
𝑛𝑛𝑛𝑛 = 1 −𝑀𝑀𝑀𝑀
𝐿𝐿𝐿𝐿.𝑊𝑊𝑊𝑊.𝐷𝐷𝐷𝐷
1
1000 𝐺𝐺𝐺𝐺𝑠𝑠𝑠𝑠𝑠𝑠𝑠𝑠 �1 + 𝑤𝑤𝑤𝑤100�
where M is the total mass of aggregate in permeameter (kg)
Gsa is the apparent relative particle density
w is the water content (%).

6/2 November 2017
Chapter 6Calculation of Results
Volume 4 Section 2Part 4 HA 41/17
6.5 Annex C shows a suitable test result sheet for the permeability, bulk density, water content, relative density, porosity and saturation results. Sample results and calculations are given in Annex D. For the coarse granular materials falling within the scope of the test, the values of k20 will normally be in the range 10-4m/s to 10-2m/s.
0.5
1.0
1.5
2.0
0 5 10 15 20 25 30 35 40
Ratio
µT/µ 2
0
Temperature °C
Dynamic Viscosity
Figure 6.1 Relationship between dynamic viscosity of water and temperature (based on data from Kaye and Laby. 1986)

November 2017 7/1
Chapter 7Notes on Testing Errors
Volume 4 Section 2Part 4 HA 41/17
7. NOTES ON TESTING ERRORS7.1 The following are the major factors which could adversely affect the measurement of k. The influence of
each one is assessed below:–
(a) Sampling errors
(b) Aerated water
(c) Non-saturation
(d) Flow around sample – ‘piping’
(e) Wall effects
(f) Washing out of fines
(g) Transitional/turbulent (non-Darcy) flow
(h) Temperature effects
7.1.1 Sampling errors: These can be overcome by rigid adherence to BS EN 932-6:1999, ( ref 10).
7.1.2 Aerated water: This can be avoided by providing a header tank in which mains water is allowed to settle before being used in the test. The de-airing achieved in this way is by no means complete, but it is felt that usually this is a method appropriate to the volume of water required and the scale of the experiment.
7.1.3 Non-saturation: This is potentially the greatest source of error. The saturation procedures described in Annex A (A3 Procedure) should minimise the problem and the degree of saturation (Sr) can be calculated if required (Annex C: Test Result Sheet).
7.1.4 Flow around sample: Care is needed to ensure that flow does not occur over the sample. The sealed cell impermeable foam sheet will provide an effective seal across the top of the specimen because the reinforcing bars on the permeameter lid press firmly into the sheet.
7.1.5 Wall effects: Dudgeon (9) quotes a widely accepted value for the permeameter diameter: median (d50) grain size ratio of 10:1. This should be sufficient to ensure that the zones of higher porosity next to the walls of the test box do not allow an unacceptably high flow and thus produce an ‘average’ flow which is too large. This would allow materials with d50 up to 30mm to be tested.
7.1.6 Washing out of fines: A small amount of fine material may be discharged at the beginning of the test. If this is of concern, sampling the dirty water outflow will give an estimate of the percentage loss of fines. Erosion of the sample and subsequent piping may occur if high flow rates are used. The can be avoided by conducting the test using lower head differences and correspondingly low flow rates.
7.1.7 Transitional/turbulent flow: The method of test described at Annex A, with small head differences, ensures that non-Darcy flow is unlikely and that laminar flow obtains. The calculation procedure given in para 6 (above) rejects data not obeying Darcy’s law.
7.1.8 Temperature effects: The dynamic viscosity of water is temperature dependent. Figure 6.1 gives the ratio of dynamic viscosity of water at temperature T°C to that at 20°C, μT/μ20, i.e. the temperature correction factor, c, used in the calculations.

7/2 November 2017
Chapter 7Notes on Testing Errors
Volume 4 Section 2Part 4 HA 41/17
7.2 Reproducibility: Experience indicates that the results can differ between samples tested by as much as a factor of 10, but it is believed that this reflects sample and compaction variation rather than inaccuracies in the test method. Thus the results indicate a characteristic range rather than a single absolute value of horizontal permeability.

November 2017 8/1
Chapter 8References
Volume 4 Section 2Part 4 HA 41/17
8. REFERENCESInformative
1. Biczysko, S J. Permeability of sub-base materials. UNBAR 2. Nottingham University, 1985.
2. Hydraulics Research Limited. A permeameter for road drainage layers. EX 1313, 1985.
3. Hydraulics Research Limited. Performance tests on a permeameter for road drainage layer. EX 1518 December 1986.
4. University of Nottingham, Department of Civil Engineering. Permeability of sandy gravels and crushed rock aggregates. Progress Report 1. HA Jones. September 1987. (unpublished).
5. University of Nottingham, Department of Civil Engineering. Method of test for horizontal permeability of compacted aggregates (revised extract of Progress Report 1). R H Jones and H A Jones, July 1988.
6. British Standards Institution. Tests for general properties of aggregates. Part 1. Methods for sampling, BS EN 932-1:1997.
7. British Standards Institution. Tests for mechanical and physical properties of aggregates. Part 3. Determination of loose bulk density and voids, BS EN 1097-3:1998.
8. British Standards Institution. Methods of test for soils for civil engineering purposes. Part 4. Compaction-related tests. BS 1377-4:1990.
9. Dudgeon, C R. Wall effects in permeameters. Journal of the Hydraulics Division, ASCE. Vol 93, No HY4, Proc Paper 5433, September 1967, pp 137-148.
10. British Standards Institution. Tests for general properties of aggregates. Part 6. Definitions of repeatability and reproducibility. BS EN 932-6:1999.
11. Kaye, GWC and Laby, TH. Tables of physical and chemical constants and some mathematical functions. Longman, 15th Edition 1986.
12. British Standards Institution. Recommendations for testing of aggregates. Part 1. Compactibility test for graded aggregates. BS 5835-1:1980
13. British Standards Institution. Tests for mechanical and physical properties of aggregates. Part 5. Determination of the water content by drying in a ventilated oven, BS EN 1097-5:2008.
14. British Standards Institution. Laboratory glassware. Volumetric instruments. Methods for testing of capacity and for use. BS EN ISO 4787:2011

8/2 November 2017
Chapter 8References
Volume 4 Section 2Part 4 HA 41/17

November 2017 9/1
Chapter 9Approval
Volume 4 Section 2Part 4 HA 41/17
9. APPROVALApproval of this document for publication is given by:
Department for InfrastructureClarence Court10-18 Adelaide StreetBelfast P B DOHERTY BT2 8GB Director of Engineering
Welsh GovernmentTransport S HAGUECardiff Deputy DirectorCF10 3NQ Network Management Division
Transport Scotland8th Floor, Buchanan House58 Port Dundas RoadGlasgow R BRANNENG4 0HF Chief Executive
Highways EnglandTemple Quay HouseThe SquareTemple QuayBristol M WILSONBS1 6HA Chief Highway Engineer
All technical enquiries or comments on this Document should be sent to [email protected]

9/2 November 2017
Chapter 9Approval
Volume 4 Section 2Part 4 HA 41/17

November 2017 A/1
Volume 4 Section 2Part 4 HA 41/17
Annex AMethod of Test for Horizontal Permeability of Drainage Layers
ANNEX A METHOD OF TEST FOR HORIZONTAL PERMEABILITY OF DRAINAGE LAYERS
A.1 GENERAL
This method is suitable for testing materials having median (d50) particle size up to 30 mm. When compacting in layers the layer thickness needs to be chosen in relation to the maximum particle size (d100).
A.2 APPARATUS The following is required:
(a) A test box as described in this Advice Note and shown in the drawing, at Annex B.1, with associated extension pipes and weirs. All dimensions are suggested dimensions, hence no manufacturing tolerances are indicated.
(b) A jack and suitable stepped wedges (Annex B.2) to incline the permeameter and thus achieve small differences in head.
(c) About 250 kg of the material to be tested, which has been sampled in an approved manner according to BS EN 932-1:1997 (ref 6, above).
(d) An electric vibrating hammer as called for in BS 1377-4:1990, Clause 3.7 (ref 8, above), but fitted with a square tamping foot of approx. 125mm side.
(e) A layer of sealed cell (impermeable) foam, such as a 12mm non-intercellular neoprene foam sheet (NINS).
(f) A simple, laboratory type filter pump, to fit a 12 mm hose from the mains water supply and an (approx.) 7 mm, see-through suction hose connected to the vacuum tap in the lid of the box via a vacuum gauge. The vacuum gauge shall be calibrated and readable to 20mm of mercury or the equivalent, or better.
(g) Two rubber bungs to fit the holes in the base of each weir. One should be intact, the other should have a piece of rigid pipe (at least 7mm i.d.) pushed through it such that the bung forms a seal on the outside of the pipe. With the bung plugging the weir, the water supply hose should be sealed on to the exposed end of the pipe.
(h) A supply of settled water (Note 1) consisting of mains water being supplied via a ballcock to a header tank of at least 150 litre capacity. The water should be supplied to the pipe/bung assembly by a hose, with valves at both the tank outlet and the bottom of the hose. The lower valve will be referred to as the water supply tap.
(i) Some pipe jointing compound, and pipe wrenches.
(j) 2 Manometers and scale. The manometers should be mounted on a board behind the apparatus to measure the water levels in the two weirs by means of flexible PVC tubing submerged in each weir away from the circular hole in the base of the weir. (An inclined manometer board is useful for measuring small differences in head).
(k) A spirit level.
(l) A metre rule with scale divisions every 0.5mm.

A/2 November 2017
Volume 4 Section 2Part 4 HA 41/17
Annex AMethod of Test for Horizontal Permeability of Drainage Layers
(m) A stopwatch, calibrated to within 1s in 5 min.
(n) A one litre measuring cylinder, graduated every 10 ml, calibrated by weighing the amount of distilled water that it contains at a measured temperature using a calibrated balance and applying the tables in BS EN ISO 4787:2011 (ref 14, above).
(o) A thermometer, readable to 0.1 °C, calibrated against a reference standard before using.
(p) Facilities for determination of water content to BS EN 1097-5:2008 (ref 13, above) and relative density according to BS EN 1097-3:1998 (ref 7, above).
A.3 PROCEDURE
A3.1 Preparation
(a) The box should be placed on a firm, horizontal surface allowing water to be collected or run to waste at either end.
(b) The material should be weighed before it is compacted into the box to find its mass.
(c) Compact the material in 3, 4 or 5 layers (depending on maximum particle size) into the central part of the box between the two end grids. Each layer should be compacted to the density expected on site at the optimum water content determined from BS 1377-4:1990 Clause 3.7 (ref 8, above) or from BS 5835-1:1980 (ref 12, above).
(d) Take a sample of the remaining material for water content (w) determinations to BS EN 1097-5:2008 (ref 13, above) and relative density GSA determination according to BS EN 1097- 3:1998 (ref 7, above).
(e) Measure the dimensions of the sample, i.e. length (L), width (W) and depth (D) to an accuracy of ± 0.5mm.
(f) Fit appropriate extension pipes and weirs at either end to give a suitable head difference of say 30 to 40mm across the sample. Ensure that all joints are well tightened as they must be capable of holding a vacuum (use pipe jointing compound and PTFE tape where appropriate).
(g) Place a piece of sealed cell foam of appropriate size on top of the sample.
(h) Fit the gasket and then the lid on to the box (the vacuum tap can be at either end of the box) and tighten all nuts and bolts, forcing the bars on the lid down into the foam sheet and ensuring a good seal across the top of the sample and also between the lid and the flange.
(i) Connect the water supply from the storage tank to the bung fitted to the weir furthest from the suction tapping. Fit the plain bung in the other weir. Leave the water supply tap closed.
(j) Open the vacuum tap and lift that end of the box slightly. Apply a vacuum using the filter pump. Tighten the bolts on the lid while the box is under vacuum.
(k) When a vacuum of at least 7m water (20 inches Hg) and preferably around 9.5 m water (27.5 inches Hg) below atmospheric has been achieved, open the water supply tap slightly, allowing water to flow in slowly and saturate the sample.

November 2017 A/3
Volume 4 Section 2Part 4 HA 41/17
Annex AMethod of Test for Horizontal Permeability of Drainage Layers
(l) Water should flow in so as to fill the box in about 15 minutes. When water is seen in the clear hose attached to the vacuum tap, let it flow briefly before shutting the vacuum tap.
(m) Leave the water supply tap open for a few minutes to allow the water pressure to build up. Briefly open the vacuum tap to bleed off any more air which has collected.
(n) Remove the bungs. Fill the box until there is some water in the lower weir. Turn off the water supply tap.
(o) The degree of saturation can be calculated from the total mass of water added (MW1), the mass of water required to fill the box ends and fittings only (MW2) and the density and porosity of the sample. (Annex C).
A3.2 Testing
(a) Supply the water to the higher (upstream) weir and adjust the flow throughout the test so that this weir just overflows.
(b) Measure the flow rate (q) at the discharge end at 15 minute intervals.
(c) Measure the head difference (ΔH) between the upstream and downstream weirs, by means of the manometers.
(d) Measure the water temperature (T) at both ends of the permeameter throughout the duration of the test and calculate the average.
(e) Continue the test until a steady flow rate is achieved i.e. subsequent measurements within 5% of each other (this may take several hours). Occasionally remove accumulated air by briefly opening the vacuum tap.
(f) Note when the discharge water appears to be clear. If it continues to be very dirty, take some samples, noting the time of sampling.
(g) Results should be reported on a record sheet similar to that in Annex C.
(h) Test the material over a range of head differences. The head difference can be altered either by changing the extension pipes or, for small changes, by lifting the permeameter at one end. During test maintain a plot of flow rate q, against head difference, ΔH. The plot will indicate the linear region for which Darcy’s law is applicable.
(i) After testing take a representative sample of material from the permeameter for a particle size distribution analysis (wet sieving test).
(j) When removing the sample from the box, take note of anything which may adversely have affected the results (e.g. evidence of piping, flow across top of sample, non-saturation of sample).
Note 1: For tests at low hydraulic gradients, requiring smaller volumes of water, the use of de-aired water, instead of settled water, should be considered.

A/4 November 2017
Volume 4 Section 2Part 4 HA 41/17
Annex AMethod of Test for Horizontal Permeability of Drainage Layers

November 2017 B/1
Volume 4 Section 2Part 4 HA 41/17
Annex BTest Box Typical Details
ANNEX B TEST BOX TYPICAL DETAILS
25°
--

B/2 November 2017
Volume 4 Section 2Part 4 HA 41/17
Annex BTest Box Typical Details

November 2017 C/1
Volume 4 Section 2Part 4 HA 41/17
Annex CPermeabilty Test Results
ANNEX C PERMEABILTY TEST RESULTS
Job Date of test
Sample Ref Sample Description
Operator
Compaction method:
No of layers Mass per layer (kg)
Compactive effort
Specimen:
Length, L (m) Mass of compacted material (kg)
Width, W (m) Bulk Density (kg/m3)
Depth, D (m) Water content, w (%)
Area, WD (m2) Dry Density, d (kg/m3)
Volume, V (m3) Apparent relative density, Gsa
Porosity, n
Saturation:
Mass of water added, Mw1 (kg)
Mass of water to fill box ends and fittings, Mw2 (kg)
Saturation, Sr (%)
𝑆𝑆𝑆𝑆𝑆𝑆𝑆𝑆 =(𝑀𝑀𝑀𝑀𝑤𝑤𝑤𝑤1 −𝑀𝑀𝑀𝑀𝑤𝑤𝑤𝑤2)
𝑉𝑉𝑉𝑉 + 𝑑𝑑𝑑𝑑1000𝑛𝑛𝑛𝑛
𝑞𝑞𝑞𝑞20𝐴𝐴𝐴𝐴
=𝑞𝑞𝑞𝑞. 𝑐𝑐𝑐𝑐60
10−6
𝐴𝐴𝐴𝐴𝑚𝑚𝑚𝑚/𝑠𝑠𝑠𝑠
k20 = q20/Ai = ................m/s

C/2 November 2017
Volume 4 Section 2Part 4 HA 41/17
Annex CPermeabilty Test Results
Test Number
Head at inlet, H1 (m)
Head at outlet, H2 (m)
Head Difference ΔH = H1 – H2 (m)
Hydraulic Gradient i= ΔH/L
Time from start (min)
Flow rate, q (ml/min)
Time from start (min)
Flow rate, q (ml/min)
Time from start (min)
Flow rate, q (ml/min)
Steady state flow rate, q (ml/min)
Temperature (°C)
Temperature correction factor, c
𝑆𝑆𝑆𝑆𝑆𝑆𝑆𝑆 =(𝑀𝑀𝑀𝑀𝑤𝑤𝑤𝑤1 −𝑀𝑀𝑀𝑀𝑤𝑤𝑤𝑤2)
𝑉𝑉𝑉𝑉 + 𝑑𝑑𝑑𝑑1000𝑛𝑛𝑛𝑛
𝑞𝑞𝑞𝑞20𝐴𝐴𝐴𝐴
=𝑞𝑞𝑞𝑞. 𝑐𝑐𝑐𝑐60
10−6
𝐴𝐴𝐴𝐴𝑚𝑚𝑚𝑚/𝑠𝑠𝑠𝑠
k20 = q20/Ai = ................m/s
Coefficient of permeability (20°C) obtained from a plot of q20/A versus i:
𝑆𝑆𝑆𝑆𝑆𝑆𝑆𝑆 =(𝑀𝑀𝑀𝑀𝑤𝑤𝑤𝑤1 −𝑀𝑀𝑀𝑀𝑤𝑤𝑤𝑤2)
𝑉𝑉𝑉𝑉 + 𝑑𝑑𝑑𝑑1000𝑛𝑛𝑛𝑛
𝑞𝑞𝑞𝑞20𝐴𝐴𝐴𝐴
=𝑞𝑞𝑞𝑞. 𝑐𝑐𝑐𝑐60
10−6
𝐴𝐴𝐴𝐴𝑚𝑚𝑚𝑚/𝑠𝑠𝑠𝑠
k20 = q20/Ai = ................m/s

November 2017 D/1
Volume 4 Section 2Part 4 HA 41/17
Annex DSample Results and Calculation
ANNEX D SAMPLE RESULTS AND CALCULATIONSample Description:
Specimen preparation: 190kg compacted in 5 layers at 0% water content. Dry Density 2290 kg/m3 Dimensions: Length L 0.934m; W 0.300m; Depth, D 0.296m; Area, A = WD 0.089m2
Apparent relative density, Gsa: 2.82 (meas); Water absorption, wA: 2.9%; Total porosity, n 18.9%; Saturation S:...........%
Notes:
Test Number 1 2 3 4 5 6
Head Difference, Δ H(mm) 24.5 8.3 17 32 10.5 3.3
Hydraulic Gradient, i = Δ H/L 0.026 0.0089 0.018 0.034 0.0112 0.0035
Steady state flow rate, q (ml/min) 899 429 706 1091 476 158
Temperature (°C) 12.75 13.5 13.25 13.25 13.25 13.5
Temperature correction factor, c 1.21 1.18 1.18 1.19 1.19 1.18
Flow rate per unit area q20 /A = qc x 10m/s/60A 2.03x10⁻⁴ 0.95x10⁻⁴ 1.56x10⁻⁴ 2.43x10⁻⁴ 1.06x10⁻⁴ 0.35x10⁻⁴

D/2 November 2017
Volume 4 Section 2Part 4 HA 41/17
Annex DSample Results and Calculation
November 2017 E/1
Volume 4 Section 2Part 4 HA 41/17
Annex EList of Amendments from Previous Version
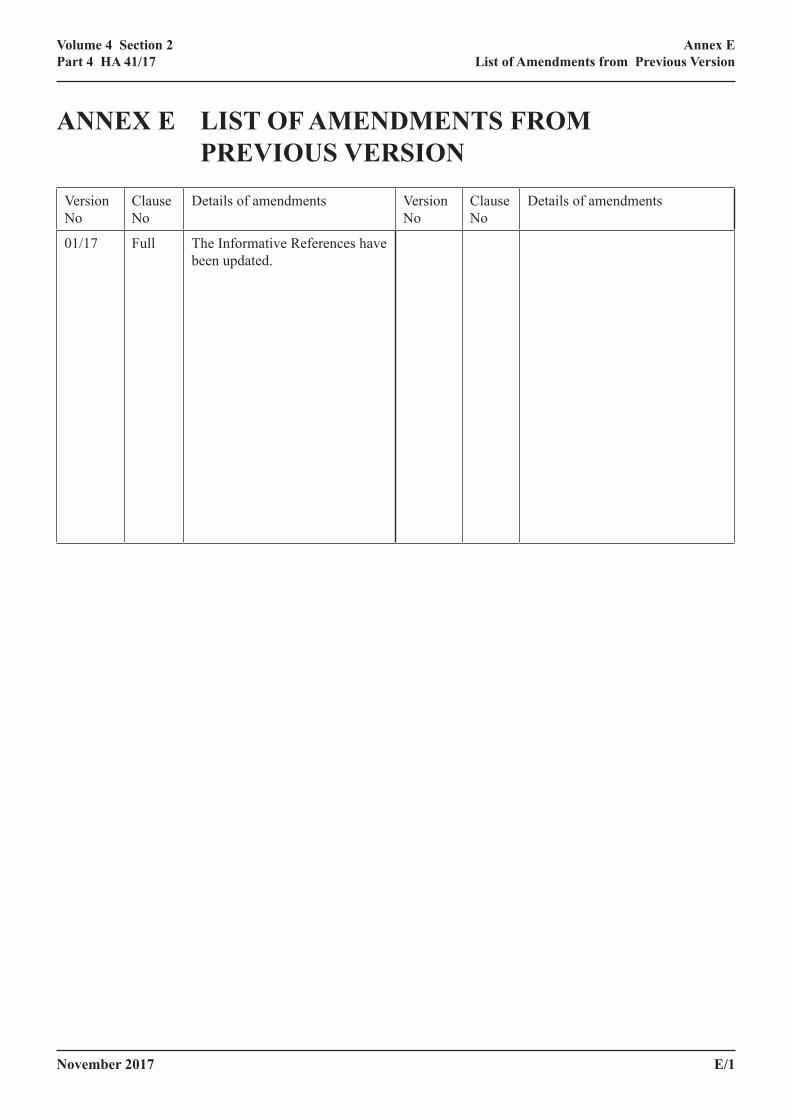
ANNEX E LIST OF AMENDMENTS FROM PREVIOUS VERSION
Version No
Clause No
Details of amendments Version No
Clause No
Details of amendments
01/17 Full The Informative References have been updated.

E/2 November 2017
Volume 4 Section 2Part 4 HA 41/17
Annex EList of Amendments from Previous Version