Embed Size (px)
Citation preview

Journal of Science and Technology Mahasarakham Universitywere listed Thai-Journal Citation Index Centre. (Group 1)
Journal of SCIENCE and TECHNOLO
GY MAHASARAKHAM
UNIVERSITYVolum
e 35 Number 6 Novem
ber - December 2016
Volume 35 Number 6 November - December 2016
ISSN : 1686-9664

The articles and opinions expressed in the Journal of Science and Technology are those of the authors. Readers are invited to make argumentative comments to any article appearing in the journal. All articles in the Journal of Science and Technology are protected by the copyright laws of Thailand, and publishing or dissemination of any article requires written permission of approval from the editorial board.
Journal of Science and Technology Mahasarakham University http://www.journal.msu.ac.th, Published 15th December 2016
Aim and Scope:The MSU Journal of Science and Technology is published quarterly and dedicated to the promotion and dissemination of scientific knowledge in the disciplines of Bioscience, Physical Science and Engineering Articles and research papers to be published in the Journal of Science and Technology Mahasarakham University will be subject to verification of academic luminaries both from within and outside the University to assure journal quality standards.
Ownership Mahasarakham University Editorial Office Division of Research Support and Development, Khamriang Sub-distict, Kantharawichai District, Maha Sarakham Province 44150 Tel & Fax: 0 4375 4238 ext. 1754
Advisors President of Mahasarakham University
Professor Dr. Reon SomanaProfessor Dr. Visut BaimaiProfessor Dr. Vichai Boonsaeng
Editor-in-Chief Professor Dr.Preecha Prathepha Mahasarakham University
Assistant Editors Associate Professor Dr.Worapol Aengwanich Mahasarakham University
Editorial BoardProfessor Dr. Thaweesakdi BoonkerdChulalongkorn UniversityProfessor Dr.La-orsri SanoamuangKhon Kaen UniversityProfessor Dr.Supannee PromthetKhon Kaen UniversityProfessor Dr. Pranee AnprungChulalongkorn UniversityProfessor Dr.Sampan RitthidechMahasarakham UniversityProfessor Dr.Niwat SonoamuangKhon Kaen UniversityAssociate Professor Dr.Natchaporn PichainanongMahasarakham UniversityAssociate Professor Dr.Sunan SaikrasunMahasarakham UniversityAssociate Professor Dr.Pairot PramualMahasarakham UniversityAssociate Professor Dr.Sirithon SiriamornpunMahasarakham UniversityAssociate Professor Dr. Ampon DhamacharoenBurapha UniversityAssociate Professor Dr.Suwanna Boonyaleepun Khon Kaen UniversityAssociate Professor Dr.Kwanjai KanokmedhakulKhon Kaen University
Associate Professor Dr.Chantana AromdeeKhon Kaen UniversityAssociate Professor Dr.Boonchong ChawsithiwongNational Institute of Development AdministrationAssociate Professor Dr.Porntep TanonkeoKhon Kaen UniversityAssociate Professor Dr.Narumon SangpradubKhon Kaen UniversityAssociate Professor Dr.Terdsak KhammengKhon Kaen UniversityAssociate Professor Dr.Yuen PoovarawanKasetsart UniversityAssociate Professor Dr.Vallaya SutthikhumMahasarakham UniversityAssistant Professor Dr.Chawalit BoonpokMahasarakham UniversityAssistant Professor Dr.Buavaroon SrichaikulMahasarakham UniversityAssistant Professor Dr.Bungon KumphonMahasarakham UniversityAssistant Professor Dr.Sirikasem SirilakNaresuan UniversityAssistant Professor Dr.Supattra PorasuphatanaKhon Kaen UniversityAssistant Professor Dr.Napparat BuddhakalaRajamangala University of Technology ThanyaburiAssistant Professor Dr.Anucha PranchanaUbon Ratchathsni Rajabhat UniversityDr.Seckson SukhasenaNaresuan UniversityDr.Rakjinda WattanalaiSiam UniversityDr.Somnuk PuangpronpitagMahasarakham UniversityPaul DulferMahasarakham UniversityChaweewan AkkasesthangMahasarakham University
Secretary Dr.Pichaya Chowtivannakul
Assistant secretary Jirarat Puseerit
Phakwilai Rungwisai
Six issues per yearNumber 1 January - FebruaryNumber 2 March - AprilNumber 3 May - JuneNumber 4 July - AugustNumber 5 September - OctoberNumber 6 November - December
Mahasarakham University Journal of Science and Technology

Editor-in-Chief's message
The Mahasarakham University Journal of Science and Technology volume 35 issue 6 is the English language
version of this series. It is composed of all original articles covering biological, physical and health sciences. Each
article constitutes interesting and in-depth research, and I trust each reader will receive new knowledge and benefi t from the information presented. Our journal is classifi ed in group 1 of the Thai-Journal Citation Index (TCI) and as such,
the editorial board and I would like to extend an invitation to all researchers to submit your manuscript for consideration
and publication.
Assoc, Prof Dr. Worapol Aengwanich
Associate Editor

Cover photo explanation : Process Optimization for Microbial Reduction in Durian Juice by Using Pulsed Electric
Field
Cover photo : Chaiwut Bourneow et al., 2559, 619-625.

CONTENTS
Original Articles
Process Optimization for Microbial Reduction in Durian Juice by Using Pulsed Electric Field 619
Chaiwut Bourneow and Somyod Santimalai
NIR Enhancement of a LSU Dryer for Maize 626
Chanat Vipattnaporn, Suphan Yangyuen and Juckamas Laohavanich
More Effi cient Rooftop Ventilation Wind Generators with Topping Vertical Blades 630
Chonlatee Photong, Prompong Munmee and Adirek Wanthong
Causal Relationship Model of EQ and MQ and Environmental Education 635
Direk Borvornsakulcharoencharoen and Nongnapas Thiengkamol
Development of a Model on Health Care for the Hepatitis B Virus Patients through Thai 643
Traditional Medicine
Kanda Chamchumrus
Causal Relationship Model of IQ, AQ and Four Noble Truths 650
Nongnapas Thiengkamol
Drying Characteristics of Paddy Dried by Thermosyphon Heat Pipe Heat Exchanger 658
Numpon Panyoyai,Paramet Pathike, Thanasit Wongsiriamnuey,
Tipapon Khamdeang and Yardfon Tanongkankit
Imaging Red Light Runners 665
Piriya Polhan and John Morris
Causal Relationship Model of Ecological Footprint Integrated with Environmental Education 671
Puripat Mukpradab, Nongnapas Thiengkamol and Tanarat Khoowaranyoo Thiengkamol
Acute and Sub-Acute Toxicity Studies of Hawm Nil Brown Rice Kefi r Powder 678
Supaporn Chunchom, Chusri Talubmook and Sirirat Deeseenthum
Development of a Bike Trail as a Tourist Attraction in the Area
of the Community Forest of Ban Nonhinphueng 687
Supisa Phumdej and Uthumporn Rueangrit

CONTENTS
Effect of Calcination Time on Physical and Chemical Properties of CaO- catalyst Derived
from Industrial-eggshell Wastes 693
Teepakorn Pornchai, Ajchara Imkum Putkham and Apipong Putkham
Heat Transmission of Double-Pane Windows with Horizontal Slats for Thailand 698
Vichuda Mettanant and Pipat Chaiwiwatworakul

Original
1 Faculty of Public Health, Mahasarakham University, Maha Sarakham, Thailand 441502 Department of Electrical Technology, Faculty of Agro-industrial Technology, Rajamangala University of Technology Tawan-Ok,
Chanthaburi campus, Chanthaburi, Thailand 22210 E-mail: [email protected]
Process Optimization for Microbial Reduction in Durian Juice by Using Pulsed Electric
Field
Chaiwut Bourneow1, Somyod Santimalai2
Received: 16 December 2015; Accepted: 30 March 2016
AbstractPulsed electric fi eld (PEF) is an interesting non-thermal process for microbial reduction in liquid foods/materials. In this
study, a PEF system was set up and characterized for some limitations in its use. The PEF system could generate a
supply voltage in a range of 10-40 kV/cm with a frequency range of 10-30 kHz. The fl ow rate of the liquid food was
in the range of 500-1000 mL/min with a continuous fl ow. The PEF was used for microbial reduction in durian juice.
The process optimization was conducted by response surface methodology (RSM) for three parameters: voltage
level, frequency of the PEF system and the fl ow rate of durian juice through a PEF chamber. It was found that the
PEF system possessed the most effective functioning on microbial reduction at the voltage of 40 kV/cm at the
frequency of 10 kHz. The optimum fl ow rate of durian juice was at 500 mL/min. The microbial content in the durian
juice was reduced for 4.13 log CFU by the optimum condition. The results suggested that the set up PEF system and
the obtained condition could be effectively used to reduce the microorganisms contaminating the tested foods.
Keywords: durian juice, microbial contamination, non-thermal processing, pulsed electric fi eld (PEF), response surface
methodology (RSM)
IntroductionDurian, the king of fruits in South East Asia, is an
important tropical fruit in Thai agriculture with a unique
characteristic of having a thorn-covered husk and strong
odor1. Since 1999, more than 900,000 tons of durian have
been produced by over 100,000 hectares of planted lands.
Around 98% of total annual output of durian is domestically
consumed while the rest is mainly exported to Hong Kong,
Singapore, Taiwan and China2. Durian fl esh is easily
microbial deteriorated which leads to lose marketable
value. Therefore, the processing of durian fl esh is required
to produce other products obtained from durian such as
durian paste, durian ice-cream, freeze dried durian, and
durian chips3.
A microbial reaction process is necessary to
improve the microbiological safety in food products. In
several, instances the thermal processes such as
pasteurization or sterilization have been done mainly to
meet safety purposes. An adverse effect on sensory and
nutritional qualities of the food products by those thermal
processes is possible4. Therefore, many researchers
have extended an effort to develop novel non-thermal
processes, such as pulsed electric fi elds (PEF), ohmic
heating, high pressure, membrane fi ltration, etc.4,5,6
PEF is an emerging processing technology
that has demonstrated the potential to inactivate some
vegetative cells of pathogenic bacteria and spoilage
bacteria by using short bursts of electricity. PEF
processing provides fl esh-like safe foods with minimal
loss in sensory qualities and nutritional quality4,7. In past
decades, PEF has gained increasing interest in the mass
transfer operation of food technology and biotechnology8,9,10

Chaiwut Bourneow et al. J Sci Technol MSU620
especially in extraction of bioactive compounds11,12, food
shelf-life extension by sterilization and enzyme inactivation13,
maintaining physicochemical and nutritional quality of
foods12, and degradation of some pesticides contaminated
in foods14. PEF has been used to reduce the microbial
contamination in apple juice, coconut water, carrot-orange
mixed juice, liquid eggs, mangosteen puree, milk, orange
juice, and strawberry juice7,11,13,15,17.
PEF processing is an application of external
electric fields to induce the electroporation of cell
membranes or membrane permeabilisation. The phenomenon
enhances the diffusion of solutes inside the food systems.
The electrical break down of a cell membrane is undergone
by the exposure to a suffi ciently intense electric fi eld
(above a critical value) in a short duration (milliseconds
to microseconds). The PEF may also cause a sub-lethal
injury in some microbial population, thus some of them
can recover when they are in the optimal condition16,17.
The membrane permeabilisation can be achieved at
moderate electric fi elds (<10 kV/cm) and low specifi c energies (<10 kJ/kg)18. The lethality and the cell disruption
are dependent to the microorganism and the environmental
conditions17. Therefore, the effectiveness of the microbial
inactivation also depends on the processing parameters
applied that may cause either transiently or permanently
permeability on the cytoplasmic membrane disintegration.4
reported that the PEF treatment of 35 kV/cm and 300
msec could inactivate 5 log10
cycles of Salmonella Typhi
murium STCC878 and Escherichia coli O517:H7 was
reduced 2 log10 cycles and 4 log
10 cycles at pH 3.5 and
5.5, respectively4. It is essential to know the infl uence of
those factors individually and their concurrent effect in
order to evaluate the potential of PEF technology in
microbial elimination in food systems.
Therefore, this research aimed to optimize the
PEF operation in microbial reduction in durian juice with
emphases on three parameters: the pulse frequency, the
supplied voltage and the fl ow rate of the durian juice. The
response surface methodology (RSM) was used to design
the treatment matrix for the process optimization.
Experimental 1. Raw Material
Frozen durian fl esh was prepared from Mon
Thong cultivar (Durio zibetbinus Murr.) obtained from the
local market in Chanthaburi Province, Thailand. The
sample (450-500 g) was separately frozen and kept in a
polypropylene freeze bag at -20°C, until use.
2. Sample Preparation
Two-hundred grams of the frozen durian
fl esh was mixed with sterile water 250 mL. The sample
was blended using a sterile wire blender (at a speed
level 1) for 1 min. The sample was then fi ltered through
a triple layer of sterile cloth-sheet and then kept in a
sterile bottle embedded in ice to maintain the temperature
of 0-4°C.
3. PEF system
The PEF equipment used in this investigation
was designed and setup15 The PEF system comprised a
stainless steel chamber, a pulse generator and a pivotal
system. The set up PEF has a capacity in the range of
10-30 kHz. The voltage is applied to the PEF chamber
in the range of 10-40 kV. The voltage supply could also
be determined by the space of the electrodes in the
treatment chamber, the fl ow rate of fl uid through the pipe
was in the range of 500-100 L/min15.
4. Experimental Design
The response surface methodology was used
to evaluate the effect of the three treatment parameters
at two levels (low-high) including pulse frequency (10-30
kHz), pulse intensity (10-40 kV) and fl ow rate of the fl uid
foods (500-1000 mL/min) on the responses of the
survival of the microbial content and the rate of microbial
reduction. The obtained data, after the sample treated
with different conditions, were modeled with the following
second order polynomial equation (1)18:
(1)
Where,
Y = the response variable to be modeled
Xi and X
j = the independent factors

Vol 35. No 6, November-December 2016 Process Optimization for Microbial Reduction in Durian Juice by Using
Pulsed Electric Field
621
β0 = the intercept
βi = the linear coeffi cient
k = the total number of independent factors
5. PEF-treatment on microbial reduction in
durian juice
The sample was mixed with 3 L of the sterile
water and then subjected to the PEF chamber as the
condition assigned in the (Table 1). In a previous report
on this PEF system, the PEF treatment should be run as
a two-cycle run to provide the most effective result for
microbial reduction. Therefore, all runs were performed
as two-cycle runs. In addition, the PEF chamber and
pivotal line were washed twice with 5 min circulation of
4 L hot water before running the next cycle.
6. Determination of microbial survival content
The samples were decimal diluted in sterile
0.85% NaCl before spreading on a plate to count agar
(PCA) medium and then cultivated at 37°C for 12-24 h19.
After that, the survival rate (equation 2) and the micro-
bial reduction rate (equation 3) were calculated based on
the model linearity.
The survival rate (2)
The microbial reduction rate
(3)
Where = Survival microbial content (CFU/mL)
= Rate of microbial reduction (min-1)
= Total viable count (log CFU/mL)
= Total viable count of PEF-untreated
sample (log CFU/mL)
= Total viable count of PEF-treated sample
(log CFU/mL)
= treatment time (min)
7. Statistical analysis
The experiments were done in triplicate and
the central composite design (CCD) and the corresponding
analysis of the data were carried out by using the software
package Design-Expert (Trial Version). The parameters
of the models were tested in the regression and interaction
at the statistical signifi cance at P<0.05.
Results and DiscussionsAccording to the results, there were two responses:
the function inverse of the survival rate (h-1/2) and the rate
of microbial reduction (mred
). These were obtained from
the total viable count (TVC) but had a different account
of the treatment time (t). (Table 1) shows 16 runs by the
treatment matrix of central composite design (CDD). By
the statistical analysis, the survival rate was suggested
to take a power of -0.5 to be fi tted as linearity behavior
(F-value = 8.50, P = 0.0027). The rate of reduction was
calculated based on the treatment time, thus fi nding fi tted
linearity (F-value = 6.54, P <0.0001). By the fi tted linear
modeling, two models of the microbial survival (equation
4) and the microbial reduction rate (equation 5) were
suggested.
The fi tted equation of microbial survival:
The fi tted equation of microbial reduction rate:

Chaiwut Bourneow et al. J Sci Technol MSU622
Where
= Survival microbial content (CFU/mL)
= Rate of microbial reduction (min-1)
= Pulse frequency (kHz)
= Supplied voltage (kV/cm)
= Flow rate of the sample (mL/min)
The model of microbial survival (equation 4) had
lower reliability to use for the prediction of the PEF
effi ciency indicated by the statistical analysis (Model,
F-value = 10.93, P = 0.0044; LOF, F = 27.38, P = 0.0111).
The model of microbial reduction rate was fi tted (Model,
F-value = 33.67, P = 0.0002; LOF, F-value =3.65, P =
0.1579).
Table 1 Central composite design (CCD) matrix and responses for the microbial reduction in PEF-durian juice
(predicted and experimental values).
Run(kHz) (kV/cm) (ml/min)
Predicted value Experimental value
Survival
rate-0.5
Reduction rate
(min-1)
Survival
rate-0.5
Reduction rate
(min-1)
1 10 (10)* 28 (30)* 800 (800)* 0.0310 6.09 0.0449 6.50
2 30 (30)* 40 (40)* 680 (700)* 0.1000 7.25 0.0737 7.05
3 10 (10)* 40 (40)* 500 (500)* 0.1700 10.87 0.1769 10.84
4 17 (20)* 40 (40)* 1000 (1000)* 0.1410 5.21 0.1160 5.04
5 10 (10)* 40 (40)* 500 (500)* 0.1700 10.87 0.1769 10.84
6 15 (15)* 18 (20)* 660 (700)* 0.0125 6.22 0.0037 5.44
7 30 (30)* 20 (20)* 1000 (1000)* 0.0600 3.71 0.0447 3.52
8 22 (25)* 29 (30)* 800 (800)* 0.0270 4.75 0.0289 4.84
9 30 (30)* 10 (10)* 500 (500)* 0.0100 5.85 0.0167 5.99
10 10 (10)* 10 (10)* 1000 (1000)* 0.0110 3.05 0.0258 3.39
11 22 (25)* 10 (10)* 800 (800)* 0.0125 3.89 0.0318 4.26
12 10 (10)* 10 (10)* 1000 (1000)* 0.0260 3.76 0.0258 3.39
13 30 (30)* 10 (10)* 500 (500)* 0.0125 6.21 0.0167 5.99
14 30 (30)* 40 (40)* 1000 (1000)* 0.0600 4.48 0.0883 4.71
15 10 (10)* 10 (10)* 500 (500)* 0.0156 6.59 0.0057 6.66
16 22 (25)* 28 (30)* 500 (500)* 0.0310 5.82 0.0225 6.17
Remark: (*) asterisks represented to the measured values in the experiments

Vol 35. No 6, November-December 2016 Process Optimization for Microbial Reduction in Durian Juice by Using
Pulsed Electric Field
623
Figure 1 Contour plots (A-C) and response surfaces of the tested parameters (D-F) on microbial survival
From the microbial reduction rate model, it could
be implied that the voltage frequency was a domoinant
parameter on microbial reduction in the durian juice. The
interaction of frequency and voltage supply had a concurrent
enhancing on the PEF to reduce microbial content in the
liquid foods. The results are similar to the fi ndings of
Elez-Martinez et al. (2005) that the increasing of pulse
frequency caused decreasing in the PEF effect on micro-
bial reduction20.
Conclusion The voltage frequency was a major parameter
on the microbial reduction in durian juice. In addition, the
voltage supply and the frequency use are concurrent in
microbial reduction. In this study, the optimal condition
for microbial reduction in durian juice was at 40 kV/cm
with 10 kHz and the fl ow rate of 500 mL/min with the
microbial reduction rate of 10.84 min-1.
Acknowledgement This research was fi nancially supported by The
Thailand Research Fund (TRG5880103) and Mahsara-
kham University.

Chaiwut Bourneow et al. J Sci Technol MSU624
Figure 2 Contour plots (A-C) and response surfaces of the tested parameters (D-F) on the microbial reduction rate
References[1] Ministry of Agricultural and Cooperatives, Agricul-
tural Statistics of Thailand Crop Year 1998/99,
2001/02, 2002/03, Centre for Agricultural Statistics,
Bangkok, 2008.
[2] Krasachat, W., Organic Production Practices and
Technical Ineffi ciency of Durian Farms in Thailand,
Procedia Econ. Finance, Vol.3, pp.445-450, 2012.
[3] Paengkanya, S., Soponronnarit, S. and Natha-
karanakule, A., Application of microwaves for drying
of durian chips, Food Bioprod. Process., Impress,
2015. http://dx.doi.org/10.1016 /j. fbp. 2015 .06.001
[4] Saldana, G., Monfort, S., Condon, S., Raso, J. and
Alvarez, I. Effect of Temperature, pH and Presence
of Nisin on Inactivation of Salmonella typhimurium
and Escherichia coli O157:H7 by pulsed electric
fi elds, Food Res. Int., Vol. 45, pp. 1080-1086, 2012.
[5] Rajkovic, A., Smigic, N., and Devileghere, F., Con-
temporary Strategies in Combating Microbial Con-
tamination in Food Chain, Int. Food Microbiol., Vol.
141, pp.S29-S42, 2010.
[6] Zweitering, M.H., Quantifi cation of Microbial Quality
and Safety in Minimally Processed Foods, Int. Dairy
J., Vol. 12, pp. 263-271, 2002.
Vol 35. No 6, November-December 2016 Process Optimization for Microbial Reduction in Durian Juice by Using
Pulsed Electric Field
625
[7] Aguilo-Aguayo, I., Oms-Oliu, G., Soliva-Fortuny, R.
and Martin-Belloso, O. Changes in Quality Attributes
Throughout Storage of Strawberry Juice Processed
by High-Intensity Pulsed Electric Fields or Heat Treat-
ments, LWT-Food Sci. Technol., Vol.161, pp. 361-
366. 2014.
[8] Donsi, F., Ferrari, G. and Pataro, G., Application of
Pulsed Electric Fields Treatments for the Enhance-
ment of Mass Transfer from Vegetable Tissue, Food
Eng. Rev., Vol.2, pp. 109-130, 2010.
[9] Knorr, D., Froehling, A., Jaeger, H., Reineke, K.,
Shlueter, O. and Schoessler, K., Emerging Tech-
nologies in Food Processing, Ann. Rev. Food Sci.
Technol., Vol.2, pp. 203-235, 2011.
[10] Puertolas, E., Saldana, G., Alvarez, I. and Rasa, J.,
Experimental Design Approach for the Evaluation of
Anthocyanin Content of Rose Wines Obtained by
Pulsed Electric Fields. Infl uence of Temperature and
Time of Maceration. Food Chem., Vol.126, pp. 1482-
1487. 2011.
[11] Lin, S.Y., Guo, Y., You, Q., Yin, Y.G. and Liu, J.B.,
Preparation of Antioxidant Peptide from Egg White
Protein and Improvement of Its Activities Assisted by
High-Intensity Pulsed Electric Field, J. Sci. Food
Agric.,Vol. 92, pp. 11648-11657, 2012.
[12] Zhao, W.Z., Yu, Z.P., Liu, J.B., Yu, Y.D.,Yin, Y.G. et
al., Optimized Extraction of Polysaccharides from
Corn Silk by Pulsed Electric Field and Response
Surface Quadratic Design, J. Sci. Food Agric., Vol.91,
pp. 2201-2209. 2011
[13] Salvia-Trujilo, L., Morales-dela Pena, M. Roja-Guru,
M.A. and Martin-Belloso, O., Microbial and Enzyme
Stability of Fruit Juice-Milk Beverages Treated by
High Intensity Pulsed Electric Fields or Heat During
Refrigerated Storage, Food Control, Vol. 22, pp.
1639-1646, 2011.
[14] Chen, F., Zeng, L.Q., Zhang, Y.Y., Liao, X.J., Ge,
Y.Q., Hu, X.S., et al., Degradation Behaviour of
Methamidophos and Chloropyrifos in Apple Juice
Treated with Pulsed Electric Fields, Food Chem.,
Vol.112, pp. 956-961, 2009.
[15] Bourneow, C. and Santimalai, S., Setup of A Con-
tinuous Pulsed Electric Field System for Microbial
Reduction in Some Liquid Foods, Asian J. Appl. Sci.
(ISSN:2321-0893), Vol. 3, pp. 103-109. 2015.
[16] De Vito, F., Ferrari, G., Lebovka, N.I., Shynkaryk,
N.V. and Vorobiev, E., Pulse Duration and Effi cacy
of Soft Cellular Tissue Disintegration by Pulsed Elec-
tric Fields, Food Bioprod. Technol., Vol.1, pp. 307-
313, 2008.
[17] Garcia, D., Somolinos, M., Hassani, M., Alvarez, I.,
and Pegan, R., Modeling the Inactivation Kinetics of
Escherichia coli O157:H7 During Storage Under
Refrigeration of Apple Juice Treated by Pulsed Elec-
tric Fields, J. Food Safety, Vol. 29, No.4, pp. 546-563,
2009.
[18] Puertolas, E., Cregenzan, O., Luengo, E., Alvarez,
I. and Raso, J., Pulsed-Electric-Field-Assisted Extrac-
tion of Anthocyanins from Purple-Fleshed Potato,
Food Chem., Vol. 136, pp. 1330-1336, 2013.
[19] The FDA Bacterial Analytical Manual (BAM), Food
and Drugs Administration, 2000.
[20] Ellez-Martinez, P., Escola-Hernandez, J., Soliva-
Fortuny, R.C., Martin-Belloso, O. Inactivation of
Lactobacillus brevis in orange juice by high intensity
pulsed electric fi elds. Food Microbiol.,Vol. 22. No.4.,
pp. 311-319.

Original
1 Faculty of Engineering, Mahasarakham University, Kham Riang, Kantharawichai, Maha Sarakham 44150, Thailand
* Corresponding Author’s E-mail: [email protected], 0801700072
NIR Enhancement of a LSU Dryer for Maize
Chanat Vipattnaporn1, Suphan Yangyuen1, Juckamas Laohavanich1
Received: 22 December 2015; Accepted: 30 March 2016
AbstractIn the drying process of maize grains with mixed fl ow of plant drying, enterprises have faced problems at the outset
of the drying process due to a long time required for drying high moisture grains. This research aims to develop the
use of near-infrared radiation added to the mixed fl ow drying system, which will help increase the rate of heat exchange
to reduce the grain’s moisture faster. The experiment was divided into two parts 1) the principle of heating by
near-infrared radiation and grains transporter and 2) the installation of the device and the testing of actual work in the
factory. The zigzag pattern of the device was a developed track for the grains to turn and run through 3000 watts of
near-infrared radiation power from 4 infrared lamps installed above the transport rail for longer operation time. And
the installation of vibration motors could enhance a better fl ow in the case of high moisture maize. The zigzag tray
could be installed parallel to the exit part that was connected to the bottom of bucket conveyor. The results of
conducting experiments in two harvesting seasons on drying maize grains at initial moisture content of 30% wb, showed
that the drying time was reduced to about 18 percent. The cost reduction in the drying cycle was about 934.54 baht
per round and a breakeven point was 42 days
Keywords: maize, hot air, near infrared radiation, LSU dryer
IntroductionMaize is one of the crops important to both domestic
production and export. Maize varieties are grown in
countries with hot climates and are suitable for the climate
in Thailand. Maize can be grown 2 times a year and can
be harvested at 110 to 120 days of age1. In the rainy
season from September to October high humidity
endangers the quality of the seed corn. Rapid deterioration
caused by a fungus produces afl atoxin. As a result, the
quality does not meet the standard of corn production.
Therefore, the post-harvest drying prior to storage is an
important step in preventing the growth of fungus and
microorganisms that destroy the grain quality. The
proper moisture before storage is estimated at no more
than 14.5 percent wet basis. In general, farmers get used
to dry corn spread on the ground because it is convenient
and economical but often problems are encountered
during the rainy season. Drying by this method has been
used instead of corn grain dryers to dry the seeds spread
on the ground. The entrepreneur uses dried corn for
animal feed. The mixed-flow dryers, or LSU dryer,
experienced a time problem when drying corn grain with
high moisture content in the fi rst drying period. It was
taking longer to dry. The cost of wasted energy increased.
The researcher became interested in studying near
infrared radiation with unique properties such as the
ability to transfer heat directly to the material, inexpensive
and could be applied with other drying techniques. This
is a preliminary study.
Experimental set upNear infrared radiation equipment was designed and built
for installation with the LSU dryer. The main components
include a conveyor zigzag tray to enhance the vibration

Vol 35. No 6, November-December 2016 NIR Enhancement of a LSU Dryer for Maize 627
motors ability to increase the heating period from the near
infrared radiation. The near infrared radiation heating
power of 3 kW from 4 lamps above the zigzag tray were
set at a distance of 150 mm, which is suitable for the
drying maize1,2. The equipment was installed between a
dryer tank and bucket conveyor (Figure 1) to test the
performance of the unit. This method was compared with
the LSU drying system which was the original hot air
drying system. The results of the study included measur-
ing the moisture content, temperature and color value of
maize grain temperature. The test was three replications
of two harvesting seasons.
Figure 1 The installation of the near infrared radiation device with LSU dryer system
Results and Discussions The results of near-infrared radiation equipped
with LSU dryers were reported. This was a test com-
parison between the normal drying processes and drying
with the enhancement of heat exchanging with near-in-
frared radiation. The results also indicated the moisture
content, temperature and color values of the maize grains.
The initial moisture content of corn was 30 percent wet
basis. The changing moisture content of the corn grain
drying system was enhanced by near-infrared radiation,
and the drying period is likely to decline more than in the
early part of the drying process (Figure 2). This is due to
the heat exchange characteristic of infrared radiation
which directly affects the maize grain.
Figure 2 Moisture and temperature changing of the maize grain by near-infrared radiation all the drying time

Chanat Vipattnaporn et al. J Sci Technol MSU628
Figure 3 Moisture and temperature changing of the maize grain by near-infrared radiation for 3 hours
The study found that a heat exchanger with near-
infrared radiation could shorten the drying time. The long
decline could be compared with the cost of energy from
the burning of corn. The comparison shows the cost of
system operation and the enhancement of the heat
exchanging with near-infrared radiation (Table 1).
Table 1 Cost of operation compared to enhancement of heat exchanging with near-infrared
Drying System Cost(Baht/Cycle) Sum(Baht)Electric charge Cob cost
Regular System 1,326.36 5,000 6,326.36
Enhanced NIR System 1,391.82 4,000 5,391.82
Variation -65.46 +1,000 +934.54
The color values of maize grain after drying was compared by different drying methods. There was no
signifi cantly difference at 95% (Table 2).
Table 2 The average color values of maize grain of three drying conditions
Experimental conditions Color Values L* a* b*
After drying with
HA + NIR (all time)58.85±2.00a 17.90±1.80b 35.28±3.10c
After drying with
HA+NIR (at 3 hrs)59.57±2.52a 18.2±1.38b 37.28±0.17c
After drying with
regular system HA58.32±0.83a 18.13±0.90b 36.24±0.92c
Note - HA : Hot Air, NIR : Near Infrared Radiation

Vol 35. No 6, November-December 2016 NIR Enhancement of a LSU Dryer for Maize 629
ConclusionApplication of near-infrared radiation for pre-heating maize
was developed. The prototype set was installed with the
LSU dryer at Tah Yong Limited Partnership. Then, The
results of conducting experiments in two harvesting sea-
sons on drying maize grains at initial moisture content of
30%wb, showed that the drying time was reduced to about
18 percent. The cost reduction in the drying cycle was
about 934.54 baht per round and a breakeven point was
42 days
Acknowledgement Thanks to the Faculty of Engineering All Rights
Reserved Providing support for research.
This research was funded by Research and
Researchers for Industries-RRI. Master degree year 2013
and Tah Yong Limited Partnership
References[1] Laohavanich J., Yangyuen S., Comparison of Moisture
and Temperature of Corn Kernel between Infrared
and Hot Air Dryings, Agricultural Sci. J, 41(3/1), pp.
185-188, 2010.
[2] Laohavanich, J., Wongpichet, S., Drying Character-
istics and Milling Quality Aspects of Paddy Dried with
Gas-Fired infrared, Journal of Food Process
Engineering, 32(3), pp. 442-461, 2007.
[3] Bülent CoŞkun, M. Ibrahim Yalçin, Cengin Özarslan
Physical properties of sweet corn seed (Zea mays
saccharata Sturt.), Journal of food Engineering, 74,
pp. 523-28, 2005.
[4] Das, I., Das, S.K., Bal, S. Drying kinetics of high
moisture paddy undergoing vibration-assisted infrared
(IR) drying, Journal of food Engineering, 1995, pp.
166-171, 2009.

Original
1 Solar Energy and Energy Resources Research Unit, Faculty of Engineering, Mahasarakham University, Kham Riang, Kantarawichai,
Maha Sarakham, 44150, Thailand [email protected]
More Effi cient Rooftop Ventilation Wind Generators with Topping Vertical Blades
Chonlatee Photong1, Prompong Munmee1, Adirek Wanthong1
Received: 30 December 2015; Accepted: 24 April 2016
Abstract
This paper presents a technique for improving the effi ciency of an electrical generation system. Specifi cally, a
rooftop ventilation wind generator using topping vertical blades is presented. A conventional 22-inch rooftop
ventilator with 12 copper coils and 15 Neodymium magnetic sheets was investigated. The proposed ventilation wind
generator had 4 vertical blades on its top and was tested with wind speeds of 2.4, 2.8 and 3.4 m/s. The experimental
results show that the proposed generator can generate higher output rms phase voltages of 0.96, 1.48 and 1.90 V at
rotational speeds of 37, 52 and 62 rpm compared to conventional generators of 0.70, 1.06 and 1.39 V at the rotation
speeds of 26, 38 and 45 rpm, which is a 37-40% improvement in output voltage and a 36-42% improvement in
rotational speed.
Keywords: ventilator wind generators, vertical blades, wind energy
Introduction
Using rooftop ventilators is one of the least expensive
ways to dispose of heat from buildings to the outside air1.
Most conventional rooftop ventilators utilize the concept
of temperature difference between inside and outside
buildings in coordination with the natural wind fl ow to
cause their rotation and thus dispose of the indoor heat.
Rotation of parts of rooftop ventilators therefore leads to
the possibility of electricity generation based on Faraday’s
law of induction. Permanent magnetic sheets could be
mounted on the rotating parts of the ventilators to provide
a constant magnetic fi eld and when these magnetic fi elds
are managed to move across closed-loop inductive coils,
electricity can be generated2. These kinds of ventilators
are known as rooftop ventilation wind generators
(RVWGs). There are few alternative technologies
available for RVWGs3-5.
This paper proposes an alternative method to
increase the electricity generation effi ciency of RVWG,
which is by installing vertical turbine blades on the top of
the ventilators. The experimental results obtained from
the proposed RVWG show that the proposed RVWG can
increase amount of electricity by approximately 37-40%
compared to conventional RVWGs, as well as provide
greater capability of heat exhausting with a higher rotating
speed of approximately 36-42% compared to conven-
tional RVWGs. Structure and operation principle of the
proposed wind generator are detailed in Section 2 and
Section 3. The experimental results obtained from the
proposed wind generator are presented and discussed in
Section 4; following by the conclusions in Section 5.
Structure of the Proposed Rooftop Ventilation
Wind Generator
(Figure 1a) shows the overall structure of the
proposed rooftop ventilation wind generator (RVWG). The
proposed RVWG consists of 4 components: a ventilator,
copper coils, permanent magnetic sheets and vertical
blades. A conventional aluminum ventilator with the most
popular diameter of 22 inches was used (Figure 1b).
Twelve sets of copper coils with 170 turns per coil, 24
degrees apart from each other (Figure 1c) were installed
around the circular base of the ventilator. Fifteen sets of
Neodymium permanent magnetic sheets were installed

Vol 35. No 6, November-December 2016 More Effi cient Rooftop Ventilation Wind Generators with Topping Vertical Blades 631
on the moving part of the ventilator, which were designed
to rotate across all the copper coils angularly with the air
gap between the magnetic sheets and coils of 1 cm
(Figure. 1d). The magnetic sheets with the width, length
and thickness of 2, 5 and 1 cm were used. Four vertical
blades with dimensions shown in (Figure 1e) were
additionally installed on the top of the ventilator.
(a)
(b) (c)
(d) (e)
Figure 1 Structure of the proposed rooftop ventilation wind generator: (a) overall structure; (b) a ventilator;
(c) copper coils; (d) permanent magnetic sheets; (e) vertical blades
Operation Principle of the Proposed Rooftop
Ventilation Wind Generator
Operation principle of the proposed rooftop
ventilation wind generator can be described by referring
to (Figure 1a-e). A conventional, low cost aluminum
ventilator was used, which had functionality to dispose of
the hot air inside the building to the outside as well as
provide rotational movement for the magnetic sheets that
Chonlatee Photong et al. J Sci Technol MSU632
were mounted on the edge of the moving part of the
ventilator. The moving magnetic sheets generated mag-
netic fi elds and conducted electrons inside the closed-loop
copper coils to move and fi nally generated electricity
based on Faraday’s low of induction. The additional ver-
tical blades were installed on the top of the ventilator,
which helped to increase rotation speed of the ventilator
by increasing the attacking surface area for both wind
from hot air and natural wind. Four vertical blades were
used to allow all directions of wind (i.e. North, East, South
and West) to rotate the blades easily even with very low
wind speed.
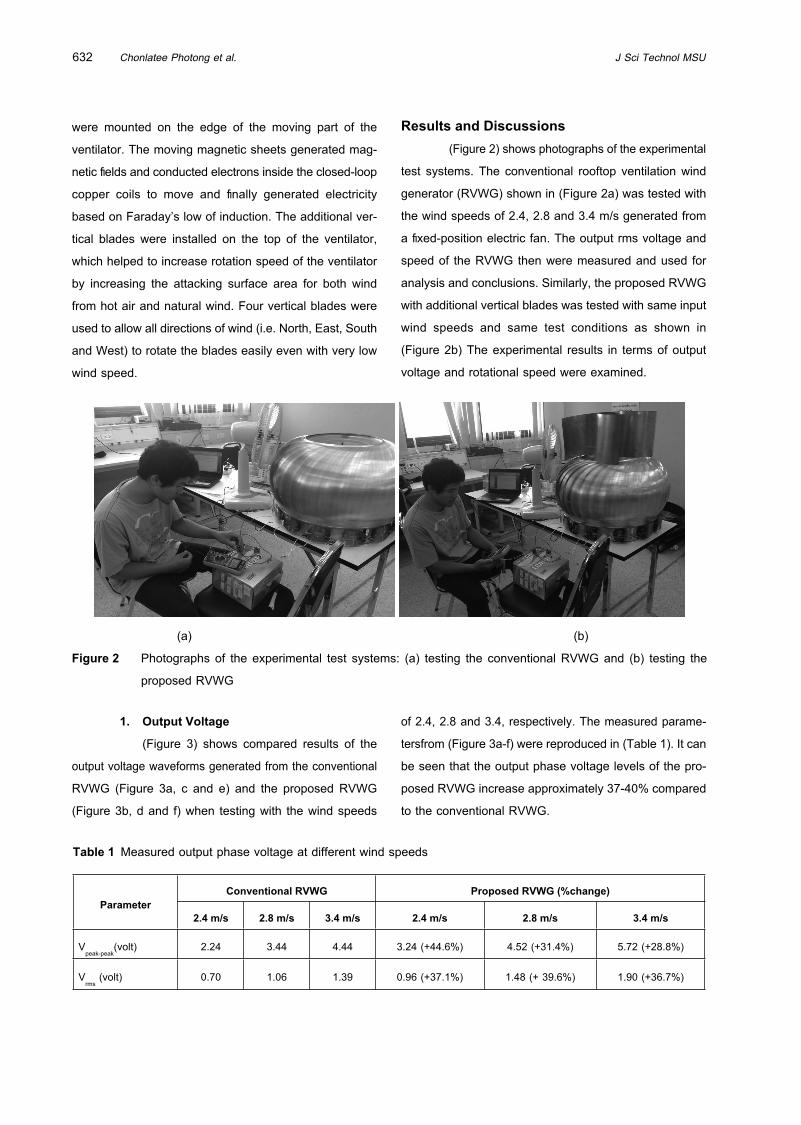
Results and Discussions
(Figure 2) shows photographs of the experimental
test systems. The conventional rooftop ventilation wind
generator (RVWG) shown in (Figure 2a) was tested with
the wind speeds of 2.4, 2.8 and 3.4 m/s generated from
a fi xed-position electric fan. The output rms voltage and
speed of the RVWG then were measured and used for
analysis and conclusions. Similarly, the proposed RVWG
with additional vertical blades was tested with same input
wind speeds and same test conditions as shown in
(Figure 2b) The experimental results in terms of output
voltage and rotational speed were examined.
(a) (b)
Figure 2 Photographs of the experimental test systems: (a) testing the conventional RVWG and (b) testing the
proposed RVWG
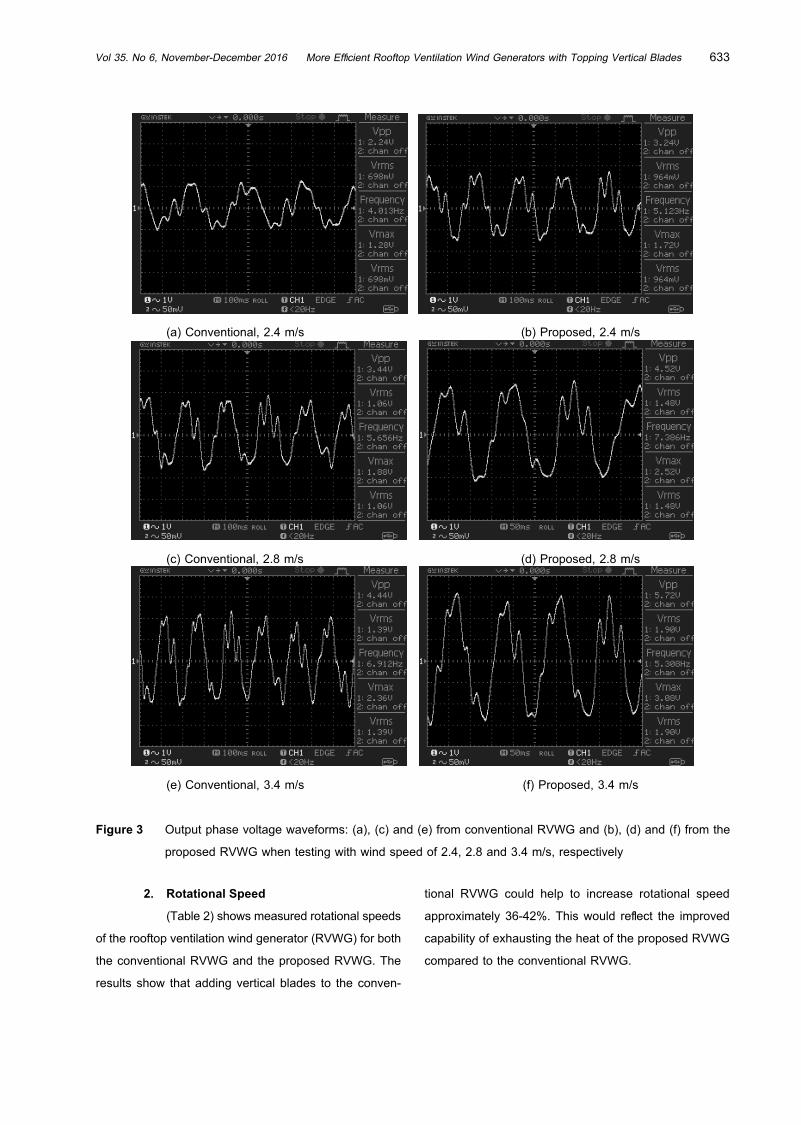
1. Output Voltage
(Figure 3) shows compared results of the
output voltage waveforms generated from the conventional
RVWG (Figure 3a, c and e) and the proposed RVWG
(Figure 3b, d and f) when testing with the wind speeds
of 2.4, 2.8 and 3.4, respectively. The measured parame-
tersfrom (Figure 3a-f) were reproduced in (Table 1). It can
be seen that the output phase voltage levels of the pro-
posed RVWG increase approximately 37-40% compared
to the conventional RVWG.
Table 1 Measured output phase voltage at different wind speeds
Parameter
Conventional RVWG Proposed RVWG (%change)
2.4 m/s 2.8 m/s 3.4 m/s 2.4 m/s 2.8 m/s 3.4 m/s
Vpeak-peak
(volt) 2.24 3.44 4.44 3.24 (+44.6%) 4.52 (+31.4%) 5.72 (+28.8%)
Vrms
(volt) 0.70 1.06 1.39 0.96 (+37.1%) 1.48 (+ 39.6%) 1.90 (+36.7%)
Vol 35. No 6, November-December 2016 More Effi cient Rooftop Ventilation Wind Generators with Topping Vertical Blades 633
(a) Conventional, 2.4 m/s (b) Proposed, 2.4 m/s
(c) Conventional, 2.8 m/s (d) Proposed, 2.8 m/s
(e) Conventional, 3.4 m/s (f) Proposed, 3.4 m/s
Figure 3 Output phase voltage waveforms: (a), (c) and (e) from conventional RVWG and (b), (d) and (f) from the
proposed RVWG when testing with wind speed of 2.4, 2.8 and 3.4 m/s, respectively
2. Rotational Speed
(Table 2) shows measured rotational speeds
of the rooftop ventilation wind generator (RVWG) for both
the conventional RVWG and the proposed RVWG. The
results show that adding vertical blades to the conven-
tional RVWG could help to increase rotational speed
approximately 36-42%. This would refl ect the improved
capability of exhausting the heat of the proposed RVWG
compared to the conventional RVWG.

Chonlatee Photong et al. J Sci Technol MSU634
Table 2: Measured rotational speed of the conventional and proposed RVWG at different wind speeds
Parameter
Conventional RVWG Proposed RVWG (%change)
2.4 m/s 2.8 m/s 3.4 m/s 2.4 m/s 2.8 m/s 3.4 m/s
Rotational Speed (m/s) 26 38 45 37 (+42.3%) 52 (+36.8%) 62 (+37.8%)
Conclusions
A more effi cient rooftop ventilation wind generator using
topping vertical blades has been proposed. Details of
structure and operation principle of the proposed generator
have been described. The experimental results in terms
of generated output phase voltage and rotational speed
obtained from both conventional and proposed generators
have been presented and compared. The results show
that output voltage and rotational speed of the proposed
generators, when applied wind speeds of 2.4, 2.8 and 3.4
m/s, has been improved by approximately 37-40% and
36-42% compared to the conventional rooftop ventilation
wind generator.
Acknowledgement
The authors would like to thank the Faculty of Engineering,
Mahasarakham University, Thailand for the research grant
(2015) and to Solar Energy and Energy Resources
Research Unit, Faculty of Engineering, Mahasarakham
University for test equipment and technical support.
References
[1] T. H. Sawyer and J. T. Reese, “Sports Facility Liability,”
Journal of Physical Education, Recreation & Dance,
vol. 73, no. 9, pp. 10–11, 2002.
[2] R. A. Serway and L. D. Kirkpatrick, “Physics for
Scientists and Engineers with Modern Physics,” Phys.
Teach., vol. 26, no. 4, p. 254, 1988.
[3] Shun S. and Ahmed N.A, “Utilizing Wind and Solar
Energy as Power Sources for hybrid Building Ventilation
Device,” J. Renewable Energy, Vol. 33, pp. 1392-
1397, 2008.
[4] M. C. Hsieh, D. K. Jair, and H. M. Chou, “The
Development of a New Type Rooftop Ventilator
Turbine,” Engineering, vol. 05, no. 10, pp. 16–20,
2013.
[5] M. Ismail and A. M. Abdul Rahman, “Rooftop Turbine
Ventilator: A Review and Update,” Journal of Sustain-
able Development, vol. 5, no. 5, Apr. 2012.

Original
1 Department of Environmental Education Faculty of Environment and Resource Studies Mahasarakham University, Mahasarakham
44150, Thailand Tel: 6-689-437-3952 Email: [email protected] Department of Environmental Education Faculty of Environment and Resource Studies Mahasarakham University, Mahasarakham
44150, Thailand Email:[email protected]
Causal Relationship Model of EQ and MQ and Environmental Education
Direk Borvornsakulcharoencharoen1, Nongnapas Thiengkamol2
Received: 25 December 2015; Accepted: 25 April 2016
Abstract
The objective was to propose a structural model Emotional Quotient (EQ), Moral Quotient (MQ) and Environmental
Education (EE) affecting environmental behavior for global warming alleviation through inspiration of public consciousness.
The population was 37,101 undergraduate students of Mahasarakham University in the second semester of academic
year 2013. The Multi-stage simple random sampling technique was employed to collect the sample for 400
undergraduate students. The research instrument was a questionnaire, and it was used for data collecting. LISREL
was used for model verifi cation. Results illustrated that the structural model confi rmatory factors of Emotional Quotient
(EQ), Moral Quotient (MQ) and Environmental Education (EE) were able to explain the variation of endogenous factors
of Inspiration of Public Consciousness for Environmental Conservation (IPC) to cause Environmental Behaviors for
Global Warming Alleviation (BEH) with 96.00 percent. IPC had the most effect to BEH with 0.69. Consequently,
confi rmatory factors of Environmental Education (EE), Emotional Quotient (EQ), and Moral Quotient (MQ), were able
to explain the variation of confi rmatory factors of Inspiration of Public Consciousness for Environmental Conservation
(IPC) with 88.00 percent. EE was the effect to IPC with 0.49.
Keywords: model EQ, MQ, environmental education affecting, environmental behavior
Introduction
The rapid growth of global population is a critical
environmental problem because people need natural
resources for daily living. Moreover, numerous scientists
have indicated that human activity is the foremost factor
of environmental deprivation and natural resources devastation.
It results in degradation of environmental quality and
waste accumulation. However, human activities, primarily
clearing of forests and the burning of fossil fuels have
intensifi ed the natural greenhouse effect to cause global
warming7,32,11,18
Emotional quotient (EQ) or emotional intelligence
quotient is a measurement of a person’s ability to observe
his or her emotions, to cope with pressures and diffi culty.
EQ is the capability to assess the concern conditions and
connections with other peoples. There various style of
EQ test varies according to different interest, but it is
hypothesized as questionable or self-reported data.
However, the EQ test highlights intensely on problem
solving design to determine the ability of the responder
to comprehend, and control emotions within themselves
and others. High scores indicate high awareness of
general social norms. Measurements of people’s EQs are
used in many situations. Generally, this idea is very well
established in the business world, where many busi-
nesses use EQ tests to help their employees determine
and measure their emotional responses to different
situations. Therefore, EQ tests are often used in business
to identify strengths and weaknesses in employees so
that these employees can learn skills to improve certain
aspects of their EQ. EQ is also inherent ability and
learned behavior.5,9,2,1

Direk Borvornsakulcharoencharoen et al. J Sci Technol MSU636
Moral Quotient (MQ) is comparable to environmental
ethics. Morality distinguishes from intentions, decisions,
and performances between those that are good or right
and those that are bad or wrong. A system of morality is
relative with a particular philosophy, religion, and culture.
Therefore, morality may also be entirely the same with
“goodness” or “rightness.”.3,8,14,34 A moral code is the
Golden Rule which insists that, “One should treat others
as one would like others to treat oneself.” MQ is an
ability to effectively react to diffi culties by noticing from
his or her response with a wide range of diffi cult events.
In contrast, groups in the most fi rm occupations frequently
score below the comprehensive mean. However, it is
revealed that people are likely to choose occupations
based on their MQ.13
Environmental Education (EE) is an essential
concept for supporting sustainable development via
developing the people competence to concentrate on
environment and development issues. It should particularly
be conducted by means of the education system whether
formal, informal, non-formal or lifelong education in order
to raise awareness, to change attitude, to cultivate the
consciousness, to take responsibility and to practice skill
for achieving better environmental behavior based on
inspiration of public mind or public consciousness. The
principles of EE are congruent to Sustainable Development
(SD) in terms of increasing environmental knowledge and
understanding, changing people’s attitudes and awareness,
to have appropriate value and skill to take responsibilty
for environmental conservation behavior through inspiration
of public mind and for effective public participation.
Additionally, to reach the success of EE and SD, it should
manage with attention on the dynamics of both the
physical/biological and socio-economic environment and
human development, should be integrated in all disciplines
with effective means of communication.35,18,19,20,21,22,23,24,25,26
Thiengkamol discovered, from various researches
on inspiration of public consciousness or public mind, and
she concluded that it might occur from one’ insight with or
without any action or it might occur from one’s impression
on role model, event, environment and media perception.
It is different from motivation because inspiration needs
no rewards. Inspiration of public consciousness or public
mind, especially, for natural resources and environment
conservation, one doesn’t receive any incentive, respect
or gratefulness for one’s act for natural resources and
environment conservation.15,16,18,19,21,22,25,26,27,28,29,30
It is not obviously seen that the research about
EQ, MQ, EE affects environmental behavior for global
warming alleviation through inspiration of public
consciousness including person as role model, impressive
event, impressive environment, and media perception 22,23,12,6 when it compared with other aspects of relating
factors affecting environmental behavior for global
warming alleviation.
Therefore, this research was designed to study
all factors relating to the above/ It alone would be able to
develop a model of environmental behaviors for global
warming alleviation that is affected by EQ, MQ and EE
through inspiration of public consciousness.
Objective
The objective was to propose a structural model
of EQ, MQ and EE affecting environmental behavior
for global warming alleviation through inspiration of
public consciousness.
Methodology
The research design was implemented in steps
as follows:
1. The population was 37,101 undergraduate
students of the second semester in academic year 2013
at Mahasarakham University. Multi-stage random
sampling was employed to collect 400 students from
different faculties of Mahasarakham University.
2. The research instrument was a questionnaire,
and it was used for data collection. The content and
structural validity were determined by Item Objective
Congruent (IOC) with 5 experts in the aspects of
environmental education, psychology, social science and
social research methodology. The reliability was done by
collecting the sample group from 50 undergraduate
students of Rajabhat Mahasarakham University which is
nearby Mahasarakham University. The reliability was

Vol 35. No 6, November-December 2016 Causal Relationship Model of EQ and MQ and Environmental Education 637
determined by Cronbach’s Alpha. The reliabilities of
Moral Quotient (MQ), Emotional Quotient (EQ), Moral
Quotient (MQ), Environmental Education (EE) Inspiration
of Public Consciousness (IPC), Behaviors for Global
Warming Alleviation (BEH), and the whole questionnaire
were 0.919, 0.877, 0.972, 0.977, 0.964 and 0.967 respec-
tively.
3. The descriptive statistics used were
frequency, percentage, mean and standard deviation. The
inferential statistics used was LISREL by considering on
Chi-Square value differs from zero with no statistical
signifi cant at 0.05 level or Chi-Square/df value with
lesser or equal to 5, P-value with no statistical signifi cant
at 0.05 level and RMSEA (Root Mean Square Error
Approximation) value with lesser than 0.05 including index
level of model congruent value, GFI (Goodness of Fit
Index) and index level of model congruent value, AGFI
(Adjust Goodness of Fit Index) between 0.90-1.00.
Conceptual Framework
The exogenous latent variables of Intelligence
quotient (IQ), Adversity Quotient (AQ) and Environmental
Education (EE) had direct and indirect effects to Inspiration
of Public Consciousness for Environmental Conservation
(IPC) and Environmental Behaviors for Global Warming
Alleviation (BEH). IQ was measured by Conceptual
Creation (X1), Talent Expression (X2), Relationship
Perception (X3), AQ was measured by Personal
Challenge (X4), Family Challenge (X5), and Social
Challenge (X6). EE was measured by Knowledge and
Understanding (X7), Environmental Awareness (X8),
Environmental Participation (X11), and Environmental
Evaluation (X12). The endogenous latent variable of BEH
was measured by Consumption Behavior (Y1), Energy
Conservation Behavior (Y2), Recycling Behavior (Y3),
Waste Management Behavior (Y4), Traveling Behavior
(Y5), Knowledge Transferring Behavior (Y6) and IPC was
measured by Person as Role Model (Y7), Impressive
Event (Y8), Impressive Environment (Y9), and Media
Receiving (Y10).
Results
1. Results of Effect among Variables in the
Model in Terms of Direct Effect
1) Confirmatory factors of Emotional
Quotient (EQ), had a direct effect on the Inspiration of
Public Consciousness for Environmental Conservation
(IPC) and Environmental Behaviors for Global Warm 0.32
and 0.28. Moreover, model Emotional Quotient (EQ), had
a indirect effect to Environmental Behaviors for Global
Warming Alleviation (BEH) with statistically signifi cant
level of 0.01 with effect of 0.22.
2) Confi rmatory factors of Moral Quotient
(MQ) had a direct effect on Inspiration of Public
Consciousness for Environmental Conservation (IPC) and
Environmental Behaviors for Global Warming Alleviation
(BEH) with statistically signifi cant at level of 0.01 with
effect of 0.33 and 0.29. Moreover, confi rmatory factors
in aspect of Moral Quotient (MQ) had indirect effect to
Environmental Behaviors for Global Warming Alleviation
(BEH) with statistically signifi cant at level of 0.01 with
effect of 0.23.
3) Confi rmatory factors of Environmental
Education (EE) had a direct effect on Inspiration of
Public Consciousness for Environmental Conservation
(IPC) and Environmental Behaviors for Global Warming
Alleviation (BEH) with a statistically signifi cant level of
0.01 with effect of 0.49 and 0.42. Moreover, confi rmatory
factors in aspect of Environmental Education (EE) had
indirect effect to Behaviors for Global Warming Alleviation

Direk Borvornsakulcharoencharoen et al. J Sci Technol MSU638
(BEH) with no statistically signifi cant at level of 0.01 with
effect of 0.34.
4) Confi rmatory factors of Inspiration of
Public Consciousness for Environmental Conservation
(IPC) had direct effect Environmental Behaviors for
Global Warming Alleviation (BEH) with statistically
signifi cant at level of 0.01 with effect of 0.69.
5) Considering the structural model con-
fi rmatory factors of Moral Quotient (MQ) Emotional Quotient
(EQ), and Environmental Education (EE) they were able
to explain the variation of endogenous factors of Inspira-
tion of Public Consciousness for Environmental Conserva-
tion (IPC) to cause Environmental Behaviors for Global
Warming Alleviation (BEH) with 96.00 percent as follows
in Equation (1).
BEH = 0.29*MQ+0.28*EQ +0.42*EE+ 0.69 *IPC.….. (1)
(R2 =0.96)
Equation (1) factors that had the most
effect to Environmental Behaviors for Global Warming
Alleviation (BEH) were Inspiration of Public Conscious-
ness (IPC) with an effect of 0.69, and subsequences were
Environmental Education (EE), Moral Quotient (MQ) and
Emotional Quotient (EQ) with effect of 0.42, 0.29, and
0.28 respectively. These were able to explain the variation
of Environmental Behaviors for Global Warming Allevia-
tion (BEH) with 96.00 percent.
Consequently, confi rmatory factors of
Environmental Education (EE), Emotional Quotient (EQ),
and Moral Quotient (MQ), were able to explain the vari-
ation of confi rmatory factors of Inspiration of Public Con-
sciousness for Environmental Conservation (IPC) with
88.00 percent. Therefore, the equation can be written as
follows Equation (2).
IPC = 0.49*EE+0.33*MQ + 0.32*EQ .............………. (2)
(R2 = 0.88)
Equation (2) factors that had the most effect to
Inspiration of Public Consciousness for Environmental
Conservation (IPC) was Environmental Education (EE)
with an effect of 0.49, subsequences were Moral Quotient
(MQ) and Emotional Quotient (EQ), with an effect of 0.33
and 0.32. These were able to explain the variation of
Inspiration of Public Consciousness for Environmental
Conservation (IPC) with 88.00 percent.
Table 1 Direct and Indirect Effect of EQ, MQ and EE Affecting BEH through IPC
Causal variable Result variables
IPC BEH
TE IE DE TE IE DE
EQ 0.32**
(0.065)
- 0.32**
(0.065)
0.50**
(0.035)
0.22**
(0.031)
0.28**
(0.034)
MQ 0.33*
(0.061)
- 0.33**
(0.061
0.52**
(0.040)
0.23**
(0.029)
0.29**
(0.042)
EE 0.49**
(0.044)
- 0.49**
(0.044)
0.76**
(0.064)
0.34**
(0.032)
0.42**
(0.061)
IPC - - - 0.69**
(0.055)
- 0.69**
(0.055)
χ2 = 286.76; df = 181 CN = 245.81 χ2/df = 1.590
GFI = 0.94; AGFI = 0.91 RMSEA = 0.003 RMR = 0.0048
TE: Total Effect, IE: Indirect Effect, DE: Direct Effect
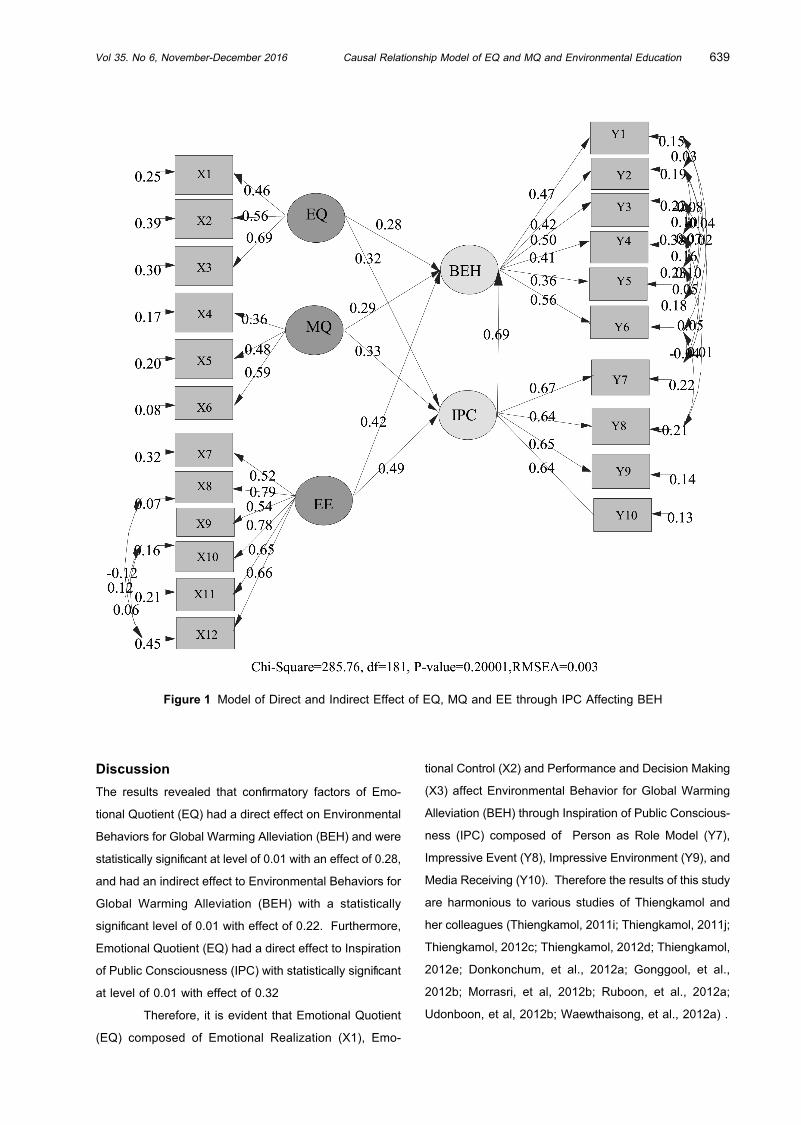
Vol 35. No 6, November-December 2016 Causal Relationship Model of EQ and MQ and Environmental Education 639
Figure 1 Model of Direct and Indirect Effect of EQ, MQ and EE through IPC Affecting BEH
Discussion
The results revealed that confi rmatory factors of Emo-
tional Quotient (EQ) had a direct effect on Environmental
Behaviors for Global Warming Alleviation (BEH) and were
statistically signifi cant at level of 0.01 with an effect of 0.28,
and had an indirect effect to Environmental Behaviors for
Global Warming Alleviation (BEH) with a statistically
signifi cant level of 0.01 with effect of 0.22. Furthermore,
Emotional Quotient (EQ) had a direct effect to Inspiration
of Public Consciousness (IPC) with statistically signifi cant
at level of 0.01 with effect of 0.32
Therefore, it is evident that Emotional Quotient
(EQ) composed of Emotional Realization (X1), Emo-
tional Control (X2) and Performance and Decision Making
(X3) affect Environmental Behavior for Global Warming
Alleviation (BEH) through Inspiration of Public Conscious-
ness (IPC) composed of Person as Role Model (Y7),
Impressive Event (Y8), Impressive Environment (Y9), and
Media Receiving (Y10). Therefore the results of this study
are harmonious to various studies of Thiengkamol and
her colleagues (Thiengkamol, 2011i; Thiengkamol, 2011j;
Thiengkamol, 2012c; Thiengkamol, 2012d; Thiengkamol,
2012e; Donkonchum, et al., 2012a; Gonggool, et al.,
2012b; Morrasri, et al, 2012b; Ruboon, et al., 2012a;
Udonboon, et al, 2012b; Waewthaisong, et al., 2012a) .

Direk Borvornsakulcharoencharoen et al. J Sci Technol MSU640
Simultaneously, the results revealed that
confi rmatory factors of Moral Quotient (MQ) had a direct
effect on Environmental Behaviors for Global Warming
Alleviation (BEH) with statistically signifi cant at level of
0.01 with effect of 0.29, and had indirect effect to
Environmental Behaviors for Global Warming Alleviation
(BEH) with statistical signifi cance at level of 0.01 with
effect of 0.23. In addition, Moral Quotient (MQ) had a
direct effect to Inspiration of Public Consciousness (IPC)
with statistically signifi cant at level of 0.01 with effect of
0.33.
Therefore, it is clearly seen that Moral Quotient
(MQ) composing of Personal Ethics (X4), Personal Ethics
(X5) and Social Norm (X6) affecting Environmental
Behavior for Global Warming Alleviation (BEH) through
Inspiration of Public Consciousness (IPC) composing of
Person as Role Model (Y7), Impressive Event (Y8),
Impressive Environment (Y9), and Media Receiving (Y10),
therefore the results of this study are harmonious
to various studies of Thiengkamol and her colleagu
es22,23,25,26,27,4,6,10,12,31
The exogenous factors of Emotional Quotient
(EQ), Moral Quotient (MQ) and Environmental Education
(EE) were able to explain the variation of endogenous
factors of Inspiration of Public Consciousness (IPC) to
caused Environmental Behaviors for Global Warming
Alleviation (BEH) with 96.00 percent.
Moreover, Environmental Education (EE) had a
direct effect to Environmental Behaviors for Global Warming
Alleviation (BEH) with a statistically signifi cant level of
0.01 with effect of 0.42, and had an indirect effect to
Environmental Behaviors for Global Warming Alleviation
(BEH) with statistically signifi cant at level of 0.01 with
effect of 0.34. Furthermore, Environmental Education (EE)
had direct effect to Inspiration of Public Consciousness
(IPC) with statistically signifi cant at level of 0.01 with effect
of 0.49.
Therefore, it is clearly seen that Environmental
Education (EE) composing of Knowledge and Understanding
(X7), Environmental Awareness (X8), Environmental
Attitude (X9), Environmental Skill (X10), Environmental
Participation (X11), and Environmental Evaluation (X12)
affecting Environmental Behavior for Global Warming
Alleviation (BEH) through Inspiration of Public Conscious-
ness (IPC) composing of Person as Role Model (Y7),
Impressive Event (Y8), Impressive Environment (Y9), and
Media Receiving (Y10). Therefore the results of this study
are harmonious to various studies of Thiengkamol and
her colleagues22,23,25,26,27,4,6,10,12,31
The model of EQ, MQ and EE affecting BEH
through IPC was verifi ed. The proposed model was fi tted
with all observed variables according to criteria of
Chi-Square value differs from zero with no statistical
signifi cant at 0.05 level or Chi-Square/df value with
lesser or equal to 5, P-value with no statistical signifi cant
at 0.05 level and RMSEA (Root Mean Square Error
Approximation) value with lesser than 0.05 including index
level of model congruent value, GFI (Goodness of Fit
Index) and index level of model congruent value, AGFI
(Adjust Goodness of Fit Index) between 0.90-1.00.
Therefore, it might be concluded that EQ, MQ
and EE play a very important role to create the environ-
mental behavior of consumption, energy conservation,
waste management, travelling behavior, recycling behav-
ior, and knowledge transferring and supporting for envi-
ronmental conservation. Therefore the Four Nobel Truths
should be reintroduced again in school. However, EQ and
MQ are signifi cant factors for undergraduate students to
adopting environmental conservation behavior for global
warming alleviation through public consciousness to meet
sustainable development. These results were congruent
to concepts proposed by Thiengkamol15,16,18,19
References
[1] Bar-On, R. (2010). Emotional intelligence: An integral
part of positive psychology. South African Journal of
Psychology, 40(1), 54-62.
[2] Bar-On, R. (2007). The Bar-On model of emotional
intelligence: A valid, robust and applicable EI model.
Organisations and People, 14, 27-34.
[3] Dictionary.com. (2010).Amorality.Retrieved 2010-06-
18. “having no moral standards, restraints, or princi-
ples; unaware of or indifferent to questions of right
or wrong”.

Vol 35. No 6, November-December 2016 Causal Relationship Model of EQ and MQ and Environmental Education 641
[4] Donkonchum, S. Thiengkamol, N., &Thiengkamol, C.
(2012a). Causal Relationship Model of Environmen-
tal Conservation Behavior Integrated with LCA
Knowledge. European Journal of Social Sciences,
33 (1):5-13.
[5] Goleman, D. (1995). Emotional Intelligence. New
York: Bantam Books.
[6] Gonggool, D., Thiengkamol, N., &Thiengkamol, C.
(2012b). Development of Environmental Education
Volunteer Model through Inspiration of Public Con-
sciousness for Sustainable Development. European
Journal of Social Sciences, 32 (1):150-160.
[7] IPCC. (2011). IPCC Introduces New ‘Climate Change’
Defi nition. Retrieved from:http://www.thegwpf.org/
ipcc-introduces-new-climate-change-defi nition/
[8] Johnstone, M. J. (2008). Bioethics: A Nursing Per-
spective. Elsevier Health Sciences.pp. 102–103.
[9] Mayer, J. D., Salovey, P., & Caruso, D. R. (2000). In
Sternberg, R.J. (Ed.). Handbook of Human Intelli-
gence (2nd ed). New York: Cambridge.
[10] Morrasri, P., Thiengkamol, N., &Thiengkamol, T.
(2012b). Causal Relationship Model of Little Green
Child with Environmental Behavior. European Journal
of Social Sciences, 34 (2):177-189.
[11] National Research Council of USA. (2010). Advanc-
ing the Science of Climate Change. Washington,
D.C.: The National Academies Press.
[12] Pimdee, P., Thiengkamol, N., &Thiengkamol, T.
(2012a). Causal Relationship Model of Electrical
Energy Conservation. European Journal of Social
Sciences, 32 (3):306-315.
[12] Ruboon, O., Thiengkamol, N., Thiengkamol, T.,
&Kurokodt, J. (2012a). Model of Environmental Edu-
cation Teacher with Inspiration of Environmental
Conservation for Global Warming Alleviation. Euro-
pean Journal of Social Sciences, 31 (1):92-102.
[13] Stoltz, P.G. (1997). Adversity Quotient: Turning Ob-
stacles into Opportunities. USA John Wiley & Son, Inc.
[14] Superson, A. (2009). The Moral Skeptic. London:
Oxford University Press.
[15] Thiengkamol, N. (2009a). The Great Philosopher: the
Scientist only know but Intuitioner is Lord Buddha.
Bangkok: Prachya Publication.
[16] Thiengkamol, N. (2009b). The Happiness and the
Genius can be Created before Born. Bangkok:
Prachya Publication.
[17] Thiengkamol, N. (2010b). Urban Community Develop-
ment with Food Security Management: A Case of
Bang Sue District in Bangkok. Journal of the Asso-
ciation of Researcher, 15 (2), 109-117.
[18] Thiengkamol, N. (2011e). Environment and Develop-
ment Book 1. (4th ed.). Bangkok: Chulalongkorn
University Press.
[19] Thiengkamol, N. (2011f). Nurture Children to be Doc-
tors. Bangkok: INTELLUALS.
[20] Thiengkamol, N. (2011g). Development of Energy
Security Management for Rural Community. Cana-
dian Social Science, 7 (5), October 31, 2011.
[21] Thiengkamol, N. (2011h). Development of a Food
Security Management Model forAgricultural Com-
munity. Canadian Social Science, 7 (5), October 31,
2011.
[22] Thiengkamol, N. (2011i). Development of Model of
Environmental Education and Inspiration of Public
Consciousness Infl uencing to Global Warming Alle-
viation. European Journal of Social Sciences, 25
(4):506-514.
[23] Thiengkamol, N. (2011j). Model of Psychological
State Affecting Global Warming Alleviation. Cana-
dian Social Science, 7 (6):89-95, December 31, 2011.
[24] Thiengkamol, N. (2012a). Development of A Proto-
type of Environmental Education Volunteer. Journal
of the Social Sciences, 7 (1):77-81.
[25] Thiengkamol, N. (2012c). Model of Psychological
Trait Affecting Global Warming Alleviation European
Journal of Social Sciences, 30 (3), 484-492.
[26] Thiengkamol, N. (2012d). Model of Psychological
Factors Affecting Global Warming Alleviation. Inter-
national Proceedings of Economic Development and
Research, 44, 6-12.
[27] Thiengkamol, N. (2012e). Causal Relationship
Model of Environmental Education.Mediterranean
Journal of Social Sciences, 3 (11), 11-18.

Direk Borvornsakulcharoencharoen et al. J Sci Technol MSU642
[28] Thiengkamol, N. (2012f). Causal Relationship Model
of Environmental Educationand Psychological Trait.
Mediterranean Journal of Social Sciences, 3 (11),
263-272.
[29] Thiengkamol, N. (2012g). Causal Relationship
Model of Four Noble Truths. Mediterranean Journal
of Social Sciences, 3 (11), 319-326.
[30] Thiengkamol, N. (2012h). Model of Environmental
Education and Psychological Factors Affecting Global
Warming Alleviation. Mediterranean Journal of Soci al
Sciences, 3 (11), 427-436.
[31] Udonboon, C. Thiengkamol, N., &Thiengkamol, C.
(2012b). Causal Relationship Model of Water Con-
servation Behavior. Mediterranean Journal of Social
Sciences, 3 (11):591-604.
[32] United States National Academy of Sciences. (2008).
Understanding and Responding to Climate Change.
Retrieved from http://americasclimatechoices.org/
climate_change_2008_fi nal.pdf
[33] Waewthaisong, S. Thiengkamol, N., &Thiengkamol,
C. (2012a). Causal Relation Model of Environmental
Traveling Behavior . European Journal of Social
Sciences, 33 (1):184-195.
[34] Wiktionary. (2010). “Aamoral”.Retrieved 2010-09-09.
“(of people) not believing in or caring for morality and
immorality”
[35] World Commission on Environment and Development
(WCED. (1987). Our Common Future. Oxford: Ox-
ford University Press. The Brundtland Report.United
Nations World Commission on Environment and
Development. Retrieve from http://en.wikisource.org/
wiki/Brundtland_Report.

Original
1 The Faculty of Cultural Science, Mahasarakham University, Khamriang Sub-Sistrict, Kantarawichai District ,MahaSarakham Porvince
44150, Thailand E-mail: [email protected]
Development of a Model on Health Care for the Hepatitis B Virus Patients through Thai
Traditional Medicine
Kanda Chamchumrus1
Received: 25 December 2015; Accepted: 18 April 2016
Abstract
Thai Traditional Medicines arise from an outstanding effort of educational research and development on drugs and
medical improvements. Knowledge of Thai Traditional Medicine is to know the old cultural practices which remain
today to essentially benefi t the modern world of health care. Development of the health care process through Thai
traditional medicine is seen as an essential alternative medicine for curing people of many symptoms. Such an illness
being identifi ed as an ordinary liver disease in the former time has now become more meaningful since alternative
Thai traditional medicines has been able to help analyze whether the symptom is the ordinary liver disease or being
of other virus symptom, or whether it is the Hepatitis B Virus. This developmental process in curing the Hepatitis B
Virus patient through Thai traditional medicines is done through a research study aimed at fi nding the appropriate way
or process for curing the patients who are suffering and being infected by the Hepatitis B Virus. This qualitative
research is implemented with an aim to discover the best practices in administering the appropriate plans for the
performances of 3 particular types of health care centers in relation to their different potentialities and identities. These
3 selected types of health care centers comprise (1) Thai traditional medicines in the hospital, (2) Thai traditional
medicines in the private health clinic, (3) Thai traditional medicines conducted by the personnel of local wisdom.
According to the research fi ndings, the caring process of Thai traditional medicines in every selected health care
center is found to have some particular things in common. For example, the conduct of symptom diagnosis is done
through the records inquiries on the patients’ sickness from the past to the actual time. Besides, the observations of
patients’ mental and emotional states as well as body contact are also conducted in order to examine and diagnose
the symptom. Following the diagnosis of the symptom, the herbal medicines are advised for curing the symptom. In
terms of the general hospitals, the integration of Thai traditional medicines and the modern medicines are used for
curing, while the general traditional medicines clinic will concentrate on Thai traditional medicines as the main role but
still broadly open for any new sciences and technological knowledge as the alternative development process for
caring. In terms of personnel or teachers who represent local wisdom, their health caring will be concentrated
essentially on the local way of practices or ancient scriptures medicine. Besides, other signifi cant factors in Thai
traditional medicines caring are seen depending on 4 administering and management processes comprising personnel
management, venue management, material equipment, and fi nancial management.
Keywords: Thai traditional medicines, patients’ health caring process, curing through Thai traditional medicines,
caring Process for the Hepatitis B Virus Patients through Thai Traditional Medicine
Kanda Chamchumrus J Sci Technol MSU644
Introduction
In Thai society, folk medicines in former times existed
through the efforts of educational development in terms
of medicine management for healing and health care. It
could be described as cultural heritage, but indeed the
use of folk medicine remains even today in a signifi cant
part of the civilized world.1 Thai traditional medicine is
another form of the health care process being classifi ed
as intellectual knowledge management and skills of Thai
local wisdom. This knowledge will be used to benefi t problem solving in terms of treatment and prevention of
the sickness of oneself and his/her own community
through self-help or self-reliance. This is appropriately
seen as a balance of people’s life style development and
their environment from generation to generation. The
local wisdom of Thai traditional medicines is also seen
as the holistic valuable culture that concentrates on
building up the integration of one’s health physically,
mentally, socially and environmentally. In other words,
Thai traditional medicine is seen as an integration of the
health caring processes.2
As foreseen by the Ministry of Public Health, 1-2
million people have the Hepatitis B Virus infection and it
is certain that in future time approximately 2.5 - 3 million
people may die of liver cancer. From this statistic, the
Hepatitis B Virus is seen to be the vital cause of cirrhosis
and liver cancer. At present, modern medicine has not
yet found the appropriate treatment to cure all symptoms
of cirrhosis, but only treat them according to their symptom
since most of cirrhosis patients come to the hospital with
a swollen belly. To cure this symptom, most modern
medicine hospitals tend to dehydrate the water by drilling
the abdomen of the patient. This method may cause
relapsing into a symptoms slump and the patient may
possibly die of bacterial infection.3
Thai traditional medicines and Thai herbs are
the alternative curing process for the people who have
fi nancial problem or those who have been impacted by
the liver disease as well as those who are suffering from
the Hepatitis B Virus symptom and are hopeless in
healing by any types of medicines or modern medicine.
According to several scriptures that describe the process
of healing the liver disease, most those scriptures
mentioned only how to cure or discard the symptoms
having occurred in and caused by the liver. For example,
the symptoms of a bruised liver, liver abscess and liver
infection. That way of curing liver disease was regarded
as the old fashioned cultural practice of health caring in
the former time in which the conduct of recording and
following up of the symptom were unseen and were not
relevant to the today living that several appropriate
technologies can be equipped for recording and diagnosing
the symptom.4 Therefore, when the physician in the former
time mentioned only that the liver contracted some
disease; however, without any diagnosis what type of
disease the liver has got due to the lack of equipment for
examination. Sciences and technological equipment in
the present day can help identify what particular kind of
liver disease and how much the patient is suffering.
Therefore, it should be recommended that the curing
process through the conduct of Thai traditional medicines
can be done more effectively if there is possible integrations
among the processes of checking-up or examination,
process of caring and healing, process of follow-up and
communication between physicians and patients, a
process of well-administering and management of health
care centers.
To make the curing process of Hepatitis B Virus
patients more meaningful, Thai traditional medicine should
be the best alternative in which the appropriate plan on
the conventional processes of curing should be considered.
In so doing, the administration and management should
be appropriately done so as to be in compliance with the
capacity and identity of the particular health centers since
each of which has performed different ways of Thai
traditional medicine curing. In support of the present
lifestyle of the people in terms of their health caring, the
alternative way of doing this should be considered in
terms of integrating the outstanding strengths of every
health care center and developing it into a new model of
conceptual knowledge. This may be done by means of
conserving the Thai wisdom and extending development
of knowledge through the application of sciences and
technology into the symptom diagnosis, curing and caring

Vol 35. No 6, November-December 2016 Development of a Model on Health Care for the Hepatitis B Virus Patients through
Thai Traditional Medicine
645
as well as following up of the results. In so doing, it may
help in terms of preventing the Hepatitis B Virus symptoms
from developing or turning to be the cirrhosis symptom
and, fi nally, the liver cancer. This new conceptual knowledge
may help release the risk of all types of loss, such as the
loss of quality of life, loss of expenses for curing each
particular symptom which might be increased depending
on the state of seriousness. This may also help decrease
the expenses of health care of the whole country as well
as becoming an alternative way of curing the patients and
improving their quality of lives. Above all, this should be
the most effective way in developing the reliability and
credibility of Thai traditional medicine as a whole.
This study was taken in the form of Qualitative
Research with 2 particular aims: (1) To study the present
condition and problems as well as recommendations
regarding health caring processes for the Hepatitis B
Virus Patients through the use of Thai traditional
medicines; (2); To develop the model on health caring
process for curing the Hepatitis B Virus Patients through
the use of Thai traditional medicine.
Experimental
1. Raw Material
The research activities comprise the collection
of all needed information from both printed matters and
fi eld survey. The research instruments and raw materials
being used are;
1. Participatory observation and non-
participatory observation
2. Unstructured interview and structure
interview
3. Focuses group discussion
4. Workshop
2. Sample Preparation
The research sampling is done through the
selection of 3 target groups in which comprises 6
selected venues; two hospitals, two Thai traditional health
caring clinics, and two local wisdom personnel of Thai
traditional medicine. The accuracy of collected information
is verifi ed by using Triangulation Technique, while the
data analysis is done according to the objectives being
set forth. The result outcomes of the study will be
presented in the form of descriptive analysis.
Results and Discussions
1. The outcomes of the study found that Thai
traditional medicine at the aforementioned 6 selected
venues have shown similarly a remarkable feature in
terms of symptom diagnosis of the patients, in which
historical background questionings are done in more
details from their past to the present stages. Observations
have been made on mental and emotional aspects of the
patients and also touching of their bodies may be done
in order to examine their symptoms so that curing by
concentrating on traditional medicines can be done. In
terms of the results from the targeted hospital, it is found
that some hospitals intend to integrate the use of Thai
traditional medicine together with the modern medicine,
while in health care centers of Thai traditional medicine
have rather concentrated mainly on Thai traditional
medicine but at the same time provided the opportunity
for scientifi c knowledge and new technological know-how
to take the role in developing health caring processes.
However, in terms of health caring performed by the
local-wisdom personnel it is found that they concentrate
mainly and signifi cantly on curing through the old custom
or traditional practices by using old-fashioned scriptures
and local way of doing. Apart from the above-mentioned
information, the studies also fi nd that other signifi cant
factors in health care practices through Thai traditional
medicine depends on 4 signifi cant processes and types
of administering: personnel management, place or venue
management, equipment or material management, and
fi nancial management. In regards to the present condition,
problems and suggestions on the health care process for
Hepatitis B virus patients through Thai traditional
medicine, it is found that the program lacks several
signifi cant factors in terms of states of readiness. For
example; lack of efficient personnel experienced in
herbal medicines, lack of knowledge in terms of integration
of herbal medicine with the modern medicine, lack of
strong support from the government sector and lack of
adequate budget or fi nancial support. Therefore, it is

Kanda Chamchumrus J Sci Technol MSU646
recommended that concrete or substantial development
should be done in terms of best-practices on health
caring processes so as to be in compliance with the
present life style of the people. Besides, this will help the
budget by reducing import of high cost medicines from
overseas.
Research found that Thai traditional medicine
was fi rst developed through cooperative efforts among 3
concerned sectors, of which included some government
organizations, private business sectors and support of
local wisdom services. The cooperation was found being
incompliance with a theory on Cultural Diffusion in which
Dr. Songkoon Chantachon.5 had referred a statement of
France Boas’ opinion that “Cultural Diffusion is the
signifi cant process in which one cultural practice is
recognized or disseminated into another culture and this
application has been adapted to conform to the new
culture”. In his opinion, the signifi cant factors of success
in terms of attending health caring of the patients were
the management process such as knowledge and skills
management of health personnel, health venue,
equipment and fi nancial support, all of which had to be
adequate and the service should be of good quality. His
said opinion was seen being coincide with the idea of
Siriporn Pongsriviroj.6 who cited that the administrative
management was the most signifi cant need that made all
working performances more successful according
to the target goal. Management needed to involve both
states of art and science in locating various resources to
supplement the task of administration so as to be in
accordance with the objectives and goal that set forth
effectively. These notifications were coincidently
conformed to the statement made by medical doctor
Chatchai Sawasdichai. who once gave his statement
“… The management or administration is seen as the most
important factor in working performances of both Thai
traditional medicines clinic and modern medicine hospital.
The staff personnel should have the ability in coordinating
with all groups of personnel who are commander,
subordinator, colleagues and every concerned sector...”.
The research fi ndings showed that the identities of Thai
traditional medicine was the holistic health caring process
in which it put most signifi cance to health caring of the
patients both physically and mentally as well as socially.
According to the results from of 6 target venues, it was
found that different ways of health caring might have
caused by different educational backgrounds been,
thereby causing different identities of healing and health
caring in the target places. It was found that all target
places had adapted their process of symptom diagnosis,
process of the treatment and the follow-up process, in
which lots of developments had occurred appropriately in
terms of health caring process performed by each target
venue. Every Thai traditional medicine had the same point
of view in which the most signifi cance was placed onto
the patients not only healing their symptom, but their
mental as well. For example; Rawewan, the outstanding
Thai traditional medicines doctor who always stickled to
4 principles of health treatment and caring which were
(1) knowing well about causes and symptom of sickness,
(2) the patients had ability to heal themselves by nature,
(3) when the symptom had gone or recovered, the
sickness or symptom would not return any more, (4) The
recovered patients should have the abilities to help others
who had got the same symptom. These 4 principles of
treatments seemed to be in accordance with the
opinion of Pender.7 who gave the meaning of Health
Protective Behavior in terms of individual action in which
it happened repeatedly and regularly which contributed
to having good health. This action was found to help
healing the symptom of the patient himself and protect
him from any sickness. This was proved to be incompliance
with the opinions of Malee Arnakul and Bussakorn
Metakul.8 who stressed that the sickness could not be
separated from the body, and holistic health caring was
seen as the people’s life style.
2. In development of health caring process for
Hepatitis B virus patients through Thai traditional
medicines, the researcher had found that the processes
in healing and caring the patients through Thai
traditional medicines might need 2 principal processes,
one of which was the need of treatment process and the
other one was the management process. In terms of
treatment and caring process the researcher recom-

Vol 35. No 6, November-December 2016 Development of a Model on Health Care for the Hepatitis B Virus Patients through
Thai Traditional Medicine
647
mended 3 implementing steps which included the follow-
ing: Step 1 - doing diagnosis of the Hepatitis B virus. Step
2 – attending health caring of the patients. Step 3 – un-
dertaking follow-up and evaluation.
Every step of the treatment and caring
processes should be done in terms of holistic care taking
through physical, mental and social dimensions as well
as keeping the balance of the four substantial elements
of the nature that include the earth, water, wind and fi re,
and this should be done in parallel with the provision of
herbs and food, and should seriously follow the advice
regarding prohibited food. Diagnosis of blood test was
also important as same as the suggestion on self caring
and amount of drug to be taken. All of this advice was to
support the patients in order to stimulate their feelings so
that they would be impressed on being attended by Thai
traditional medicines. In addition, more support should be
done in terms of sharing the space or room for social
network on line in order to share the benefi ts of knowledge
and information on Thai traditional medicines. The
relevant chart which identifi ed the whole management
system is seen as signifi cant and effective to the treatment
process of Thai traditional medicines.
This research fi nding found that the focus
point of health caring processes of 6 target health caring
centers should be divided into 3 different channels: (1)
Integration of Thai traditional medicines into modern
medicines as presented by medical doctor Chatchai
Sawasdichai9 that health caring through the integration of
Thai traditional medicines with modern medicines should
be recognized since it would make better recovering of
the sickness successfully because it was the holistic
caring of physical, mental, family and society, (2) The
integration of Thai traditional medicines with sciences and
nutrition knowledge, (3) Thai traditional medicines and
modern medicines had brought about knowledge and
methods of sciences and technology into the health
caring process which was found to be very useful for the
patients. In addition, other fi ndings of the research show
that it should be very appropriate to undertake the
selection of strengths or strong points from different
systems into the application of health caring in which it
might refer as “Multiple Appearance Medicines”. This was
incompliance with Komart Chung Satiensub and Yongsak
Tuntipidok10. Besides, this study had as well intended to
fi nd an appropriate way to develop the outstanding
process on health caring for the Hapatitis B Virus patients
through Thai traditional medicines, and this intention was
found to be in accordance with Steiner11 and Keeve12 who
stated that “Forming is the way to identify the concepts
that are systematically concerned and are inter-related in
order to point out what is presented, how is the presentation,
what is obtained, what should be explained about the
existing condition, and what has brought about the
discovery of new things”.
Conclusion
This research study is regarded as the model for the
health caring processes through the application of Thai
traditional medicine which has presently been integrated
into modern medicines and has developed into an
appropriate model for health caring processes by undertaking
the progressive method of sciences and technology into
use of health caring system. This effective model of health
caring is seen as the alternative channel for patients as
well as for promoting development of Thai public health.
This appropriate model is regarded as the best practices
which continues to develop the local wisdom of Thai
traditional medicine, above all, can pave the way to
economize the fi nancial costs on public health of the
country. This research is academic information that can
be used as the issue for development of patients caring
process in Thai traditional medicine, public health personnel,
modern medicine, alternative medicines and other
concerned personnel who take care of Hepatitis B Virus
patients. This research can be the guidelines for treatment
and caring of the Hepatitis B Virus patients through Thai
traditional medicines. It can as well be used for creating
more benefi t in terms of raising economic value of the
country through the use of herbal medicines and Thai
traditional medicines for health caring and diseases
prevention. This can help decrease the costs of importing
medicines from overseas as well. According to the
benefi t of this research study, it can fi nally be concluded

Kanda Chamchumrus J Sci Technol MSU648
as follows:
This research study is related to the Thai
traditional medicine integrating with modern sciences and
technological knowledge in which it can be applied to the
use of development process for health caring of other
un-severe patients.
The research study is related to development of
herbal medicine in terms of its quality, production,
packaging, and source of medicines as well as locations
of planting the herbs that may respond to the desirable
needs of today’s society.
The research study describes the benefi t of
forest conservation and develops herbs growing for
promoting the attention of having good quality of raw
materials and decreasing the import of herbs as well as
increasing the forestry areas in order to build the balance
of the nature.
The research study introduces an appropriate
process of administering the integrated working development
among the local wisdom personnel, the Thai traditional
medicine and the modern medicine in order to benefi t more experiences and skills of best practices of the
concerned health caring sectors including state hospitals.
This model is aimed to develop future effective perform-
ances of Thai traditional medicine.
Acknowledgement
This research study has received generous
support from many concerned that kindly helped make
the study complete and successful. Great appreciation
should be drawn to the author’s research supervisors, Dr.
Kla Somtrakool, Dr. Anchalee Jantapo and Medical
Doctor Chatchai Sawasdichai. In addition to this generous
support, more appreciations is expressed to those who
have provided unlimited support during data collection.
Of them are those staff members of Phra Pok Klao Thai
Traditional Medicine Hospital, Wang Nam Yen Thai
Traditional Medicine Hospital at Sakao Province, Dr. Boon
Clinic of Thai Traditional Medicine at Rayong Province
and Dr. Nopporn Clinic of Thai Traditional Medicine at
Nonthaburi Province. More appreciation may be drawn
to those teachers who work for Thai traditional medicine
which include Mr. Prasart Tesyam in Lopburi Province,
Ms. Pinkaew Nuanchan in Chiang Mai and all of those
who put most support on making this research most
successful and such supports have provided valuable
benefi t to this research in terms of sustainable development
that help alleviate a sustainable health caring through
Thai traditional medicine.
References
[1] Satiensub KC. Medical Multiple Appearance and
Health in Social Culture Dimension. Bangkok : Sir-
indhornAntropology Center (Public Organization);
2549.
[2] Kranjanakul K. Scribes Hygienist : Thai Lifestyle and
Thai Traditional Medicine Local Wisdom. Nonthabu-
ri: Sukhothaithammathirat Publishing; 2547.
[3] Sinwatt S. The Approaches in promoting Chronical
Liver failure Disease by Integrating Thai Traditional
Medicine and Modern Medicine at Pra Pok Klao
Hospital, Chanthaburi. Mahasarakham : Faculty of
Cultural Science, Mahasarakham University, 2557.
[4] Triratanathawal S. Liver Disease in Terms of Theo-
retical Aspect of Thai Traditional Medicine. The
Faculty of Eastern Medicine : Dissertation of Rangsit
University; 2553.
[5] Chantachon S. Theories of Culture and Society.
Thailand Southeastern Institute of Art and Culture,
Mahasarakham University, 2553.
[6] Pongsriroj S. Organization and Management. 2nd
Edition. Bangkok: Technic 19; 2554. P. 277-67.
Prasarn Premasakul. Blood Check for Hepatitis B
Virus. Bangkok : Aroon Printing, 2553.
[7] Pender N, Murdaugh C, Parsons MA, Health promo-
tion in nursing practice. 6th Edition. New York : Ap-
pleton & Lange; 1987.
[8] Anakul M, Methangkul B. Scribes Hygienist Principle
and Thai Local Wisdom Traditional Medicine. Tonchai
M, Editor. Nonthaburi : Sukhothai thammathirat Uni-
versity Publishing; 2547.
[9] Sawasdichai C. Psoriasis disease : Healing with Thai
Herbs Recipes. Mahasarakharm : The Faculty of
Cultural Science, Mahasarakham University; 2555.

Vol 35. No 6, November-December 2016 Development of a Model on Health Care for the Hepatitis B Virus Patients through
Thai Traditional Medicine
649
[10] Satiensub KC, Tuntipidok Y. Thai health, Thai Cul-
ture. 2nd Edition. Bangkok : Department of Social and
Health Research; 2550.
[11] Steiner E. Methodology of Theory Building, Educo
logy Research Associates, Sydney; NSW. 1988.
[12] Keeves JP. Education Research, Methodalogy, and
Measurement : An International Handbook. Oxford:
Pergamen, Press; 1988.

Original
1 Department of Environmental Education Faculty of Environment and Resource Studies Mahasarakham University, Mahasarakham 44150, Thailand
Email: [email protected]
Causal Relationship Model of IQ, AQ and Four Noble Truths
Nongnapas Thiengkamol1
Received: 30 December 2015; Accepted: 25 April 2016
Abstract
The population was 37,101 undergraduate student of Mahasarakham University in the second semester of academic
year of 2012. The Multi-stage simple random sampling technique was employed to collect the sample for 400
undergraduate students. The research instrument was a questionnaire and it was used of data collecting. Structural
Equation model (SEM) was used for model verifi cation. The objective was to propose the structural model of
Intelligence Quotient (IQ), Adversity Quotient (AQ) and Four Noble Truths (FNT) affecting environmental behavior via
inspiration of public consciousness. The results revealed that when considering structural model confi rmatory factors
Intelligence Quotient (IQ), Adversity Quotient (AQ) and Four Noble Truths (FNT) were able to explain the variation of
endogenous factors of Inspiration of Public Consciousness for Environmental Conservation (IPC) to cause
Environmental Behaviors (BEH) with 86.00 percent and IPC was the highest effect to BEH with 0.54. Furthermore,
confi rmatory factors of Four Noble Truths (FNT), Intelligence Quotient (IQ), and Adversity Quotient (AQ), were able to
explain the variation of confi rmatory factors of Inspiration of Public Consciousness for Environmental Conservation
(IPC) with 70.00 percent and FNT was the highest effect to IPC with 0.38.
Keywords: model, IQ, AQ, four noble truths, environmental behavior
Introduction
The intelligence quotient (IQ) questioned that people’s
intelligence originates from parents genetic heredity or
condition of family nurturing. Some believe it is directly
connected to biological parental intelligence quotient (IQ).
However, the heritability of IQ has been investigated for
more than a century, but it couldn’t conclude which one
is more infl uential. The diversity of ideas proposes that it
depends on heritability and the mechanisms of inherit-
ance15,14,3,2,30,6. Afterward, Dickens and Flynn established
a model for numerous doubtful conclusions regarding IQ.
In their model, an environmental motivation can have
numerous effects on IQ including adults, but this effect
also decays over time except the stimulus persistence.
The model could be modifi ed to embrace possible factors,
like nutrition during early childhood that may cause stable
effects. Consequently, IQ adjustment can be elucidated
by a generally motivating environment for all people. The
study involved that IQ scores do have high predictive
strength for individual differences in school completion.
They confirm the predictive validity of IQ for adult
professional status, while variables such as education
and family conditions have been statistically controlled.
They recommended that individual variations in intelligence
are remarkably infl uenced by both genetics and environment
but it is still not known that which one has the foremost
power.4
Adversity Quotient (AQ) is the capability to
resolve problems and diffi cult tasks with intention to
discover a method to alter the catastrophe. Pone who
has good AQ will be a courageous person, has patience
and good intentions lack easy failure, therefore in
general, the person with this characteristic frequently
accomplishes victory.
People who devote themselves to accomplishment
will be inspirited and have self-esteem because their

Vol 35. No 6, November-December 2016 Causal Relationship Model of IQ, AQ and Four Noble Truths 651
insight has the power of problem solving and they believe
that they can overcome the problem via continuous
resolution and comprehension. A robust infl uence is a
good struggle to lead them to success in their lives. AQ
is the mainly reasonable and generally utilized technique.
Furthermore, people with superior AQ will be
optimistic and they will change diffi culties into opportunities.
The elementary constituent of human competency is to
manage how people must face life difficulties, or
adversity. People with strong authentication are able to
respond to life troubles: for instance, frustrations,
irritations, and obstructions, even the most unacceptable
trouble. That is the major role for all human efforts.18,20,21,22,5
The teachings of Buddhism, Four Noble Truths
are regarded as important to get over life’s problems.
These embrace 1) life means suffering, 2) the source of
suffering is attachment, 3) the termination of suffering is
attainable and 4) the path to the cessation of suffering
(Middle Path or Eightfold Path). Taking into account on
the fi rst principle of life means suffering, refers to living
with suffering for the reason that the people are not
perfect and neither is the world stable. At some stage in
people lifetime, they inevitably have to tolerate physical
suffering such as tiredness, old age, pain, sickness,
injury, and ultimately death; and they have to tolerate
psychological distress like as sadness, fear, disappointment,
dissatisfaction, and misery. Even though, there is also
positive experiences in life that people recognize as
pleasure such as ease, comfort and happiness but it is
just for a while, not permanent or forever because life
entirety is inadequate and incomplete, since the world is
impermanent subject. Therefore humans are never able
to maintain everlastingly what they try for, and just as
happy minutes pass by, they themselves and their loved
ones will pass away one day, too.17
The trail to the suffering eradication is the fourth
noble truth through the middle path to fi nish the suffering.
It is a regular mean of self-development that is explained
in more detail with the Eightfold Path. The middle way is
between the two extremes of excessive self-petty and
extreme self-dignity; fi nally it directs to the end of the
cycle of rebirth. The fi nal quality separates it from other
paths that are only “wandering on the wheel of appropriate”,
because these do not have a fi nal object. The mean to
fi nish suffering can expand over many lifetimes. Wishing,
unawareness, illusions, and its effects will progressively
fade away, however the progress is made on the path.
Noble Eightfold Path regards to right view, right intention,
right speech, right action or behavior, right livelihood, right
effort, right mindfulness and right concentration or
meditation.7
Thiengkamol declared that if one is really under-
stands Four Noble Truths, one would live with adequacy
way of life by practicing their daily activities with cautious
methods for pro-environmental behavior and natural
resources maximization utilization containing of food
consumption, energy conservation, waste management,
recycling behavior, traveling behaviors and environmental
knowledge transferring for others. Consequently, they
also have concern for every step of living with right view,
right thought, right speech, right behavior, right livelihood,
right effort, right mindfulness, and right meditation.
However, Thai people are generally Buddhists since the
economic development together with consumerism
pattern has caused them to be in the trap of an
economic crisis since 1992 because of the 7th National
Development Plan that the government accentuated for
economic growth while environmental quality has been
degraded unavoidably. Afterward, they realized the
importance of suffi ciency based on Middle Path of Four
Noble Truths which has been their root of way of life for
one thousand years. They refl ect on their origin of
Buddhist Principle of Four Noble Truths to use it to meet
sustainable development.12,11,12,23
Moreover, Suffi ciency Economy Philosophy has
been remarked by His Majesty King Bhumibol Adulyadej
during his 58 years on the throne. This philosophy is a
guideline of human living behavior of all classes starting
from the family to the community to the Thai nation. It is
able to be applied for local and nation development and
administration. This philosophy is also indistinguishable
from “Middle Path” of Four Noble Truths to fi nish live
suffering for Buddhist people. Suffi ciency refers moderation
and rationality, accompanied by creating a practical

Nongnapas Thiengkamol J Sci Technol MSU652
immune system against shocks from the outside or from
the inside. All plans and every step of their action must
be conducted based intelligence, thoughtfulness, extreme
care and body of knowledge. The spiritual underpinning
of all people in the nation, predominantly state offi cials,
scholars, and business people must be constructed for
all levels, therefore the moral integrity and honesty must
be cultivated, and consequently they must effort for the
appropriate wisdom to live with broadmindedness, carefulness,
intelligence, and refl ection. Finally, it should maintain the
balance of physical, social, economic, environmental, and
cultural changes of inside and from the outside world.
Environmental issues were generally unaware
as inessential subject by people. Afterward, the beginning
of the year 2011, Thai peoples have affected by the
phenomenon in summer, they met with terrible cold
weather. This made them aware on disaster of climate
change or global warming.13
The inspiration to have public consciousness or
public mind is a signifi cant factor that has been proved
by different studies of Thiengkamol and her colleagues.
It was proposed by Thiengkamol that public mind inspiration
arises from insight; therefore it is dissimilar from motivation
because inspiration needs no rewards, admirations, and
complements. Particularly, for pro-environmental behavior,
it needs inspiration of public consciousness or public mind
for environmental conservation and natural resources
conservation because people who are devoted to
conserve the environment will not require any admiration,
rewards, money or incentives to do it, but they may be
inspired by role model or idle, or impressive events,
environment, and media receiving such as movies, book,
magazine, and internet.7,16,9,1
Currently, it is very seldom and there is no
research that is holistically integrative conducted on
intelligence quotient, adversity quotient, and Four Noble
Truths affecting environmental behavior via inspiration of
public consciousness. This research was designed to
study by regarding all factors as mentioned above to
attain a new body of knowledge to inspire the the young
generation of undergraduate student to be a pro-environ-
mentalist to practice as good idle for their generation and
future generation.
Objective
The objective was to propose a structural model
of Intelligence Quotient (IQ), Adversity Quotient (AQ), and
Four Noble Truths (FNT) affecting environmental behavior
via inspiration of public consciousness.
Methodology
The research design was implemented in steps
as follows:
1. The population was 37,101 undergraduate
students of the second semester inacademic year 2012
of Mahasarakham University. The Multi-stage random
sampling was employed to collect 400 students from
different faculties of Mahasarakham University.
2. The research instrument was a questionnaire,
and it was used for data collecting. The content and
structural validity were determined by Item Objective
Congruent (IOC) with 5 experts in the aspects of
environmental education, psychology, social science and
social research methodology. The reliability was done by
collecting the sample group from 50 undergraduate
students of Rajabhat Mahasarakham University which is
nearby Mahasarakham University. The reliability was
determined by Cronbach’s Alpha. The reliability of
Intelligence Quotient (IQ), Adversity Quotient (AQ), FNT
(Four Noble Truths) Inspiration of Public Consciousness
(IPC), Behaviors for Global Warming Alleviation (BEH),
and the whole questionnaire were 0.785, 0.919, 0.972,
0.977, 0.928 and 0.952 respectively.
3. The descriptive statistics used were
frequency, percentage, mean and standard deviation. The
inferential statistics used was LISREL by considering on
Chi-Square value differs from zero with no statistical
signifi cant at 0.05 level or Chi-Square/df value with
lesser or equal to 5, P-value with no statistical signifi cant
at 0.05 level and RMSEA (Root Mean Square Error
Approximation) value with lesser than 0.05 including index
level of model congruent value, GFI (Goodness of Fit
Index) and index level of model congruent value, AGFI
(Adjust Goodness of Fit Index) between 0.90-1.00.
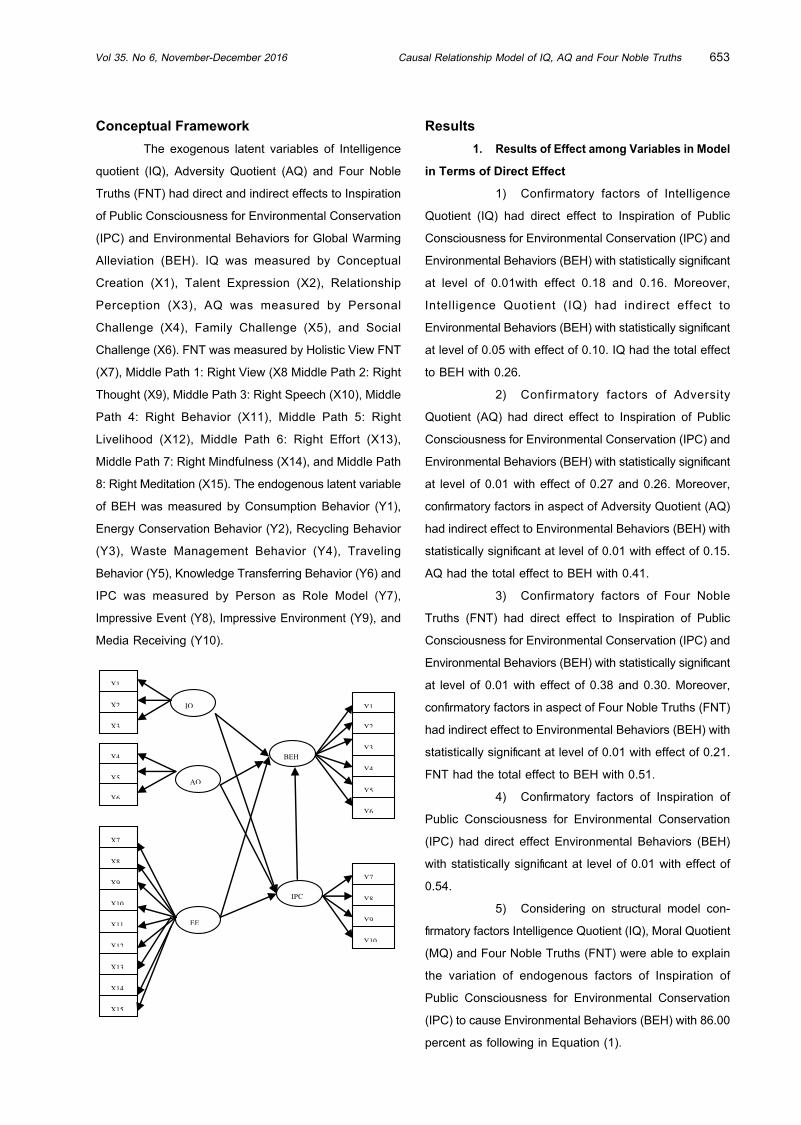
Vol 35. No 6, November-December 2016 Causal Relationship Model of IQ, AQ and Four Noble Truths 653
Conceptual Framework
The exogenous latent variables of Intelligence
quotient (IQ), Adversity Quotient (AQ) and Four Noble
Truths (FNT) had direct and indirect effects to Inspiration
of Public Consciousness for Environmental Conservation
(IPC) and Environmental Behaviors for Global Warming
Alleviation (BEH). IQ was measured by Conceptual
Creation (X1), Talent Expression (X2), Relationship
Perception (X3), AQ was measured by Personal
Challenge (X4), Family Challenge (X5), and Social
Challenge (X6). FNT was measured by Holistic View FNT
(X7), Middle Path 1: Right View (X8 Middle Path 2: Right
Thought (X9), Middle Path 3: Right Speech (X10), Middle
Path 4: Right Behavior (X11), Middle Path 5: Right
Livelihood (X12), Middle Path 6: Right Effort (X13),
Middle Path 7: Right Mindfulness (X14), and Middle Path
8: Right Meditation (X15). The endogenous latent variable
of BEH was measured by Consumption Behavior (Y1),
Energy Conservation Behavior (Y2), Recycling Behavior
(Y3), Waste Management Behavior (Y4), Traveling
Behavior (Y5), Knowledge Transferring Behavior (Y6) and
IPC was measured by Person as Role Model (Y7),
Impressive Event (Y8), Impressive Environment (Y9), and
Media Receiving (Y10).
EE
BEH
X3
X4
X5
X6Y6
Y1
Y2
Y3
Y4
Y5
Y10
Y7
Y8
X2
X1
X7
IQ
IPC
Y9
X8
X9
X10
X11
X12
AQ
X13
X14
X15
Results
1. Results of Effect among Variables in Model
in Terms of Direct Effect
1) Confirmatory factors of Intelligence
Quotient (IQ) had direct effect to Inspiration of Public
Consciousness for Environmental Conservation (IPC) and
Environmental Behaviors (BEH) with statistically signifi cant
at level of 0.01with effect 0.18 and 0.16. Moreover,
Intelligence Quotient (IQ) had indirect effect to
Environmental Behaviors (BEH) with statistically signifi cant
at level of 0.05 with effect of 0.10. IQ had the total effect
to BEH with 0.26.
2) Confirmatory factors of Adversity
Quotient (AQ) had direct effect to Inspiration of Public
Consciousness for Environmental Conservation (IPC) and
Environmental Behaviors (BEH) with statistically signifi cant
at level of 0.01 with effect of 0.27 and 0.26. Moreover,
confi rmatory factors in aspect of Adversity Quotient (AQ)
had indirect effect to Environmental Behaviors (BEH) with
statistically signifi cant at level of 0.01 with effect of 0.15.
AQ had the total effect to BEH with 0.41.
3) Confirmatory factors of Four Noble
Truths (FNT) had direct effect to Inspiration of Public
Consciousness for Environmental Conservation (IPC) and
Environmental Behaviors (BEH) with statistically signifi cant
at level of 0.01 with effect of 0.38 and 0.30. Moreover,
confi rmatory factors in aspect of Four Noble Truths (FNT)
had indirect effect to Environmental Behaviors (BEH) with
statistically signifi cant at level of 0.01 with effect of 0.21.
FNT had the total effect to BEH with 0.51.
4) Confi rmatory factors of Inspiration of
Public Consciousness for Environmental Conservation
(IPC) had direct effect Environmental Behaviors (BEH)
with statistically signifi cant at level of 0.01 with effect of
0.54.
5) Considering on structural model con-
fi rmatory factors Intelligence Quotient (IQ), Moral Quotient
(MQ) and Four Noble Truths (FNT) were able to explain
the variation of endogenous factors of Inspiration of
Public Consciousness for Environmental Conservation
(IPC) to cause Environmental Behaviors (BEH) with 86.00
percent as following in Equation (1).
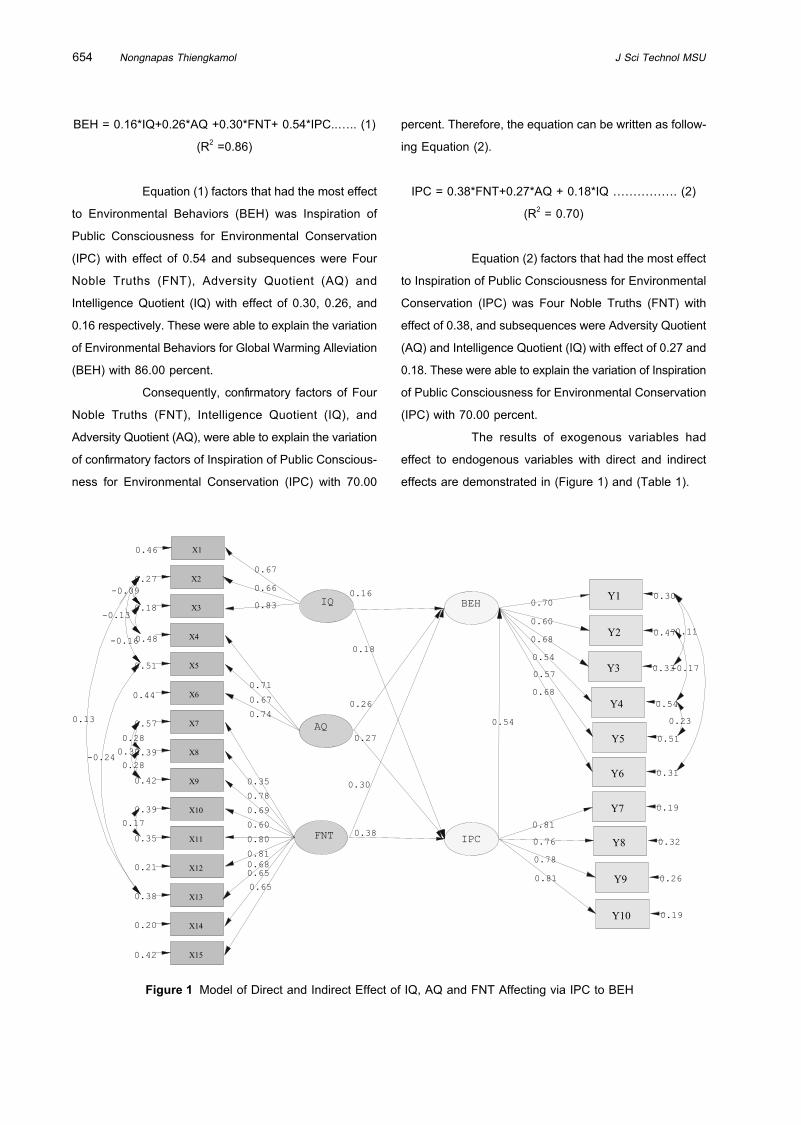
Nongnapas Thiengkamol J Sci Technol MSU654
BEH = 0.16*IQ+0.26*AQ +0.30*FNT+ 0.54*IPC..….. (1)
(R2 =0.86)
Equation (1) factors that had the most effect
to Environmental Behaviors (BEH) was Inspiration of
Public Consciousness for Environmental Conservation
(IPC) with effect of 0.54 and subsequences were Four
Noble Truths (FNT), Adversity Quotient (AQ) and
Intelligence Quotient (IQ) with effect of 0.30, 0.26, and
0.16 respectively. These were able to explain the variation
of Environmental Behaviors for Global Warming Alleviation
(BEH) with 86.00 percent.
Consequently, confi rmatory factors of Four
Noble Truths (FNT), Intelligence Quotient (IQ), and
Adversity Quotient (AQ), were able to explain the variation
of confi rmatory factors of Inspiration of Public Conscious-
ness for Environmental Conservation (IPC) with 70.00
percent. Therefore, the equation can be written as follow-
ing Equation (2).
IPC = 0.38*FNT+0.27*AQ + 0.18*IQ ……………. (2)
(R2 = 0.70)
Equation (2) factors that had the most effect
to Inspiration of Public Consciousness for Environmental
Conservation (IPC) was Four Noble Truths (FNT) with
effect of 0.38, and subsequences were Adversity Quotient
(AQ) and Intelligence Quotient (IQ) with effect of 0.27 and
0.18. These were able to explain the variation of Inspiration
of Public Consciousness for Environmental Conservation
(IPC) with 70.00 percent.
The results of exogenous variables had
effect to endogenous variables with direct and indirect
effects are demonstrated in (Figure 1) and (Table 1).
0.51
0.32
0.26
0.19
-0.11
-0.17
0.23
X1 0.46
X2 0.27
X3 0.18
X4 0.48 X5 0.51
X6 0.44
X7 0.57
X8 0.39
X9 0.42
X10 0.39
X11 0.35
X12 0.21
X13 0.38
X14 0.20
X15 0.42
IQ
AQ
FNT
BEH
IPC
Y1 0.30
Y2 0.47
Y3 0.33
Y4 0.54
Y5
Y6 0.31
Y7 0.19
Y8
Y9
Y10
0.70 0.60 0.68 0.54 0.57 0.68
0.81 0.76 0.78 0.81
0.67 0.66 0.83
0.71 0.67 0.74
0.35 0.78 0.69 0.60 0.80 0.81 0.68 0.65 0.65
0.54
0.18
0.27
0.16
0.26
0.30
0.38
-0.09 -0.13 -0.16
0.28 0.32 0.28
0.17
0.13
-0.24
Figure 1 Model of Direct and Indirect Effect of IQ, AQ and FNT Affecting via IPC to BEH

Vol 35. No 6, November-December 2016 Causal Relationship Model of IQ, AQ and Four Noble Truths 655
Table 1 Direct and Indirect Effect of IQ, AQ and FNT Affecting BEH through IPC
Causal
variable
Result variables
IPC BEH
TE IE DE TE IE DE
IQ 0.18*
(0.055)
- 0.18*
(0.055)
0.26*
(0.037)
0.10*
(0.032)
0.16*
(0.044)
AQ 0.27*
(0.042)
- 0.27*
(0.042)
0.41**
(0.045)
0.15**
(0.030)
0.26*
(0.034)
FNT 0.38**
(0.065)
- 0.38**
(0.065)
0.51**
(0.065)
0.21**
(0.033)
0.30**
(0.054)
IPC - - - 0.54**
(0.042)
- 0.54**
(0.042)
χ2= 253.76; df = 156 CN = 239.23 χ2/df= 1.627
GFI = 0.94; AGFI = 0.91 RMSEA = 0.007 RMR = 0.0049TE: Total Effect, IE: Indirect Effect, DE: Direct Effect
Discussion
The fi ndings indicated that Intelligence Quotient
(IQ), Adversity Quotient (AQ), and Four Noble Truths
(FNT) had direct effect to Environmental Behaviors (BEH)
at a statistically signifi cant level of 0.01 with effect of 0.16,
0.26 and 0.30.
Considering, the observed variable of Talent
Expression (X2) was the highest correlation for
Intelligence Quotient (IQ) with 0.60, Family Challenge (X5)
was the highest correlation for Adversity Quotient (AQ)
with 0.76 and Middle Path 5: Right Livelihood (X12) was
the highest correlation for Four Noble Truths (FNT) with
0.86.
Regarding Intelligence Quotient (IQ) contained
Conceptual Creation (X1), Talent Expression (X2) and
Relationship Perception (X3) were able to predict
Intelligence Quotient (IQ) with effect of 0.27, 0.60 and
0.34 and had direct affecting Inspiration of Public
Consciousness for Environmental Conservation (IPC) and
Environmental Behaviors (BEH) with highly with statistically
signifi cant at level of 0.01 with effect of 0.18 and 0.16.
However, Adversity Quotient (AQ) comprised of
Personal Challenge (X4), Family Challenge (X5), and
Social Challenge (X6) were able to predict Adversity
Quotient (AQ) with effect of 0.44, 0.76 and 0.65 and had
direct affecting Inspiration of Public Consciousness for
Environmental Conservation (IPC) and Environmental
Behaviors (BEH) at a statistically signifi cant level of 0.01
with effect of 0.27 and 0.26. Moreover, Inspiration of
Consciousness for Environmental Conservation (IPC) also
had direct infl uencing to Environmental Behaviors (BEH)
with highly statistically signifi cant at level of 0.01 with
effect of 0.54. Simultaneously, when considering
prediction of correlation of observed variables of Impressive
Environment (Y9), Impressive Event (Y8), Media Receiving
(Y10), and Person as Role Model (Y7) rather high level
with 0.92, 0.76, 0.76, and 0.70 respectively.
Concurrently, the result also indicated that Four
Noble Truths (FNT) composed of the Holistic View FNT
(X7), Middle Path 1: Right View (X8), Middle Path 2: Right
Thought (X9), Middle Path 3: Right Speech (X10), Middle
Path 4: Right Behavior (X11), Middle Path 5: Right
Livelihood (X12), Middle Path 6: Right Effort (X13),
Middle Path 7: Right Mindfulness (X14) and Middle Path
8: Right Meditation (X15) had direct affecting Inspiration
of Public Consciousness (IPC) and Environmental
Behaviors (BEH) with highly with statistically signifi cant
at level of 0.01 with effect of 0.38 and 0.30 respectively.

Nongnapas Thiengkamol J Sci Technol MSU656
It might be concluded that the Adversity Quotient
(AQ) and Four Noble Truths (FNT) composed are the
signifi cant exogenous latent variable that affect Environ-
mental Behaviors (BEH) via Inspiration of Public
Consciousness for Environmental Conservation (IPC) and
Inspiration of Public Consciousness for Environmental
Conservation (IPC) is the most essential variable to cause
the Environmental Behaviors (BEH). Therefore whatever
environmental behavior happens, it needs to inspire the
people to realize their responsibilities to have pro-envi-
ronmental behavior with their perception for person as
role model, impressive event, impressive environment
and various media receiving. These were congruent to
Thiengkamol concept her different studies of Thiengkamol
and her colleagues7,8,16,9,1,19 that the results illustrated that
Intelligence Quotient (IQ), Adversity Quotient (AQ), and
Four Noble truths (FTN) affecting via inspiration of public
mind or public consciousness to perform better environ-
mental behaviors whether consumption behavior, energy
conservation, recycling behavior, waste management,
traveling behavior and knowledge transferring and
supporting for environmental conservation when they had
real practice through environmental conservation with
inspiration of public mind or public consciousness.
Particularly, Four Noble Truths Principle is the
fundamental belief of Thai people as the national religion
for more than thousand years. Furthermore its concept
is relevant to the concept of sustainable development
based on the reason of living with suffi ciency way. Even
though in recent decades, the Ministry of Education has
withdrawn it from the curriculum of all levels of education,
as such, the Four Noble Truths have faded from the young
generations. It is urgent that the Ministry of Education
should introduce the Four Noble Truths into curriculum
again since the middle path concept or the eight folds in
this principle is practical for everyone in the world to
perform their daily life activities with concepts of pro-en-
vironmental behavior.
Conclusion
However, it might be concluded whether IQ, AQ,
and FNT, and IPC latent variables are play important roles
to cause environmental behaviors of consumption behavior,
energy conservation, recycling behavior, waste management,
traveling behavior and knowledge transferring and
supporting for environmental conservation through PM.
Therefore, the model of IQ, AQ, and FNT affecting via
IPC to BEH was verifi ed the proposed model was fi tted
with all observed variables according to criteria of
Chi-Square value differs from zero with no statistical
signifi cance at .001 level or Chi-Square/df value with
lesser or equal to 5, RMSEA (Root Mean Square Error
Approximation) value with lesser than 0.05 including index
level of model congruent value, GFI (Goodness of Fit
Index) and index level of model congruent value, AGFI
(Adjust Goodness of Fit Index) between 0.90-1.00.
References
[1] Chomputawat, S. and Thiengkamol, N. and Thieng-
kamol, K.T., Causal Relationship Model of Environ-
mental Conservation for Agriculturist, European
Journal of Scientifi c Research, Vol.104, No.3, pp.504-
518, 2013.
[2] Deary I.J. and Batty, G. D., Cognitive epidemiology,
Journal Epidemiology Community Health Vol.61,
No.5, pp.378–384, 2007.
[3] Devlin, B. and Daniels, M. and Roeder, K., The her-
itability of IQ, Nature, Vol.388, No.6641, pp.468–71,
1997.
[4] Dickens, W.T. and Flynn. J.R. Heritability estimates
versus large environmental effects: The IQ paradox
resolved, Psychological Review, Vol.108, No.2,
pp.346–369, 2001.
[5] Duckworth, A.L. and Seligman, M.E.P., Self-discipline
outdoes IQ in predicting academic performance of
adolescents, Psychological Science, Vol.6, No.12,
pp.939-944, 2006.
[6] Johnson, W. and Turkheimer, E. and Gottesman, I.I.
and Bouchard, T.J., Beyond Heritability: Twin Studies
in Behavioral Research, Current Directions in Psy-
chological Science, Vol.18, No.4, pp.217–220, 2009.
[7] Koonboonchan, A. and Thiengkamol, N. and Thieng-
kamol, K.T., Causal Relationship Model of Global
Warming Alleviation Integrated with Four Noble

Vol 35. No 6, November-December 2016 Causal Relationship Model of IQ, AQ and Four Noble Truths 657
Truths and Psychological State, European Journal of
Scientifi c Research, Vol.104, No.3, pp.418-433, 2013.
[8] Koonboonchan, A. and Thiengkamol, N. and Thieng-
kamol, K.T., Causal Relationship Model of Four
Noble Truths Integrated with Psychological Factors,
European Journal of Scientifi c Research, Vol.115,
No.1, pp.183-198, 2013.
[9] Kotchachote, Y. and Thiengkamol, N. and
Thiengkamol,K.T., CausalRelationship Model of For-
est Fire Prevention, European Journal of Scientifi c Research, Vol.104, No.3, pp.519-532, 2013.
[10] National Economic and Social Development Board
(NESDB)., What is Suffi ciency Economy, NESDB,
Bangkok, 2004.
[11] National Economic and Social Development Board
(NESDB)., Q & A About Suffi ciency Economy Phi-
losophy, NESDB, Bangkok, 2004.
[12] National Economic and Social Development Board
(NESDB)., The Tenth Economic and Social Develop-
ment Plan (2007-2011), NESDB, Bangkok, 2007.
[13] National Research Council of USA., Advancing the
Science of Climate Change, The National Academies
Press, Washington D.C, 2010.
[14] Neisser, U., Rising Scores on Intelligence Tests,
American Scientist, Vol.85, pp.440–7, 1997.
[15] Neisser, U. and Boodoo, G. and Bouchard, T.J. and
Boykin, A. W. and Brody, N. and Ceci, Stephen J.
and Halpern, D.F. and Loehlin, J.C., Intelligence:
Knowns and unknowns, American Psychologist,
Vol.51, No.2, pp.77–101, 1996.
[16] Petchang, R. and Thiengkamol, N. and Thiengkamol,
C., Causal Relationship Model of Holistic Tourism,
European Journal of Scientifi c Research, Vol.104,
No.3, pp.434-446, 2013.
[17] Pramochcho, P., Four Noble truths, Bangkok, 2008.
[18] Peterson, C. and Seligman, M.E.P., Character
Strengths and Virtues A Handbook and Classifi cation,
APA Press and Oxford University Press, Washington
D.C, 2004.
[19] Saisunantharom, S. and Thiengkamol, N. and Thieng-
kamol, C., Casual Relationship Model of Biodiversity
Conservation, European Journal of Scientific
Research, Vol.104, No.3, pp.460-474, 2013.
[20] Seligman, M.E.P., Authentic Happiness: Using the
New Positive Psychology to Realize Your Potential
for Lasting Fulfi llment, New York: Free Press, 2002.
[21] Seligman, M.E.P., Character Strengths and Virtues:
A Handbook and Classifi cation, APA Press and
Oxford University Press, Washington, D.C, 2004.
[22] Stoltz, P.G., Adversity Quotient: Turning Obstacles
into Opportunities, USA John Wiley & Son Inc, 1997.
[23] Thiengkamol, N., Globalization Administration. Bang-
kok, 2007.
[24] Thiengkamol, N., The Great Philosopher: the Scien-
tist only know but Intuitioner is Lord Buddha, Bang-
kok, 2009.
[25] Thiengkamol, N., Environment and Development
Book, Chulalongkorn University Press, Bangkok,
2011.
[26] Thiengkamol, N., Causal Relationship Model of
Causal Relationship Model of IQ and AQ Affecting
Environmental Behavior, European Journal of Scien-
tifi c Research, Vol.115, No.2, pp.237-247, 2013.
[27] Thiengkamol, N., Causal Relationship Model of IQ,
EQ, MQ, AQ and Environmental Education Affecting
Environmental Behavior, European Journal of Scien-
tifi c Research, Vol.115, No.2, pp.367-383, 2013.
[28] Thiengkamol, N., Causal Relationship Model of IQ,
EQ, AQ and Environmental Education Affecting
Environmental Behavior, European Journal of
Scientifi c Research, Vol.115, No.3, pp.384-398, 2013.
[29] Thiengkamol, N., Causal Relationship Model of Four
Noble Truths and Environmental Education, Interna-
tional Journal of Multidisciplinary Thought, Vol.3,
No.2, pp.125-137, 2013.
[30] Turkheimer, E., A Better Way to Use Twins for De-
velopmental Research, LIFE Newsletter (Max Planck
Institute for Human Development), 2008.

Original
1 Faculty of Engineering and Agro-Industry, Maejo University, Chiang Mai 50290, Thailand2 School of Engineering, University of Phayao, Phayao 56000, Thailand
* Corresponding Author: [email protected], Tel. +66 817 840249, Fax. +6653498902
Drying Characteristics of Paddy Dried by Thermosyphon Heat Pipe Heat Exchanger
Numpon Panyoyai 1*,Paramet Pathike2, Thanasit Wongsiriamnuey1, Tipapon Khamdeang1
Yardfon Tanongkankit1
Received: 30 December 2015; Accepted: 25 March 2016
AbstractIt is well known that drying is an important method for avoiding the chemical and biochemical deterioration of paddy.
Moisture reduction using solar drying is the most widely used method due to a low cost operation. However, it takes
a very long time for the operation and an unstable climate may cause operation limitations, resulting in the quality of
paddy. The Thermosyphon heat pipe heat exchanger is an alternative device applied in this study. The objective was
to study the paddy drying characteristics of San-Pah-Tong 1 with average initial moisture content of 34.57% (wet
basis) dried to fi nal moisture content of 14% (wet basis). The layer thickness of paddy was 5, 10 and 15 centimeters.
The results showed that the paddy drying using a Thermosyphon heat exchanger provided 3.5 times higher in average
drying rate than that using open sun. The layer thickness of 5 centimeters was found to be shorter in drying time than
10 and 15 centimeters. Different mathematical models namely Henderson and Pabis, Midilli et al., Page, Modifi ed
Page and Logarithmic models were used for the modeling of the drying kinetics. The best mathematical model was
determined using R2 coeffi cient, root mean square error (RMSE) and chi-square (χ2) as criteria. It was found that the
Logarithmic equation was the best model for describing the drying behavior in all cases. The effective moisture
diffusivity evaluated by using Fick’s diffusion equation was in the rage of 2.11×10⁻⁸ - 1.37×10⁻⁷ m2/s.
Keywords: Drying characteristics, Thermosyphon, Heat exchanger, Paddy dried
IntroductionPaddy is one of the most important crops in the world.
According to FAO report1, global paddy production
yielded about 745 million tons in 2013. After harvesting,
paddy still contains high moisture content (19-26% wet
basis)2,3 that can cause nutritional losses and microbial
growth during storage. To prevent quality deterioration
paddy needs to be dried until a safe moisture level of
14% wet basis or below4.The reduction of moisture is one
of the oldest techniques for food preservation.
Mechanical and thermal methods are two basic methods
to remove moisture in a solid material5. Open sun
drying is usually used to reduce moisture content of
paddy. This method is a low-cost method and easy to
operate. Nevertheless, it depends on the weather condi-
tion and consumes time. To overcome these problems
hot air drying using Thermosyphon heat pipe heat
exchanger was proposed in this study. This method has
been reported to require shorter drying time than open
sun drying leading to better product quality6. Thermosyphon
heat pipe is one type of heat exchange device that has
no external power requirements. Heat exchangers with
heat pipe units possess many advantages such as high
heat recovery effectiveness, high compactness, no moving
parts, light weight, relative economy, pressure tightness,
complete separation of hot and cold fl uids, and high
reliability7. Heat pipe heat exchanger has been
extensively applied in many industries8. Thermosyphon
heat pipes operate by using the heat transfer principle of
latent heat of working fl uid contained inside heat pipe.

Vol 35. No 6, November-December 2016Drying Characteristics of Paddy Dried by Thermosyphon Heat Pipe Heat Exchanger 659
High temperature heat source caused working fl uid
evaporation. The working fl uid of gas was condensed to
be condensate by transferring heat to an area that had
low temperature, which was the heat sink. Typical operation
of heat pipe could be explained as follows. After the heat
pipe receives heat at the evaporator section, the inside
saturated working fl uid evaporates to become vapor gas
and then fl ows upward to the condenser section where
there is a lower temperature. The working fl uid transfers
heat out by condensation and then the condensate
returns downward to the evaporator section by gravity
force to receive heat at evaporator section again. The
operation, thus, acted as a cycle. Because of the high
latent heat inside working the fl uid, the heat pipe could
be operated by transferring heat from one end to the
other end although it had small difference temperature of
the evaporator section and condenser section. He heat
transfer capability of Thermosyphon heat pipe depends
on several factors such as aspect ratio, length of heat
pipe, type or material used to make the heat pipe, conditions
of heat pipe setting, type of working fl uid, temperature of
heat source and temperature of heat sink9.
In order to the clarify knowledge from the past
study of Thermosyphon heat pipe heat exchanger and to
apply on paddy drying, it is important to study the applied
Thermosyphon heat pipe heat exchanger to reduce mois-
ture content of paddy. This work therefore was aimed at
investigating drying characteristics of paddy San-Pah-
Tong 1 dried by hot air drying using Thermosyphon heat
pipe heat exchanger drying method.
Experimental 1. Sample preparation
After harvesting of paddy (San-Pah-Tong 1)
with average initial moisture content of 34.57%, (wet
basis) paddy were then packed in zip bag and kept at
4°C until the time of experiment.
2. Heat Exchanger drying method
In this research a Thermosyphon heat pipe
heat exchanger with seamless steel was designed and
constructed as shown in (Figure 2) Thermosyphon heat
pipe heat exchanger consists of a number of individual
Thermosyphons or gravity-assisted wick less heat pipes.
Distilled water was used as the working fl uid with a fi lling
ratio of 50% of the evaporator section length and
consisted of 53 tubes that were 1.1 m long, had a 25 mm
inside diameter and a 30 mm outside diameter. The tubes
were arranged in 7 rows. The evaporator and condenser
sections of the Thermosyphon heat exchanger had a
length of 500 mm and its central adiabatic section had a
length of 100 mm. The parameters are shown in
(Table 1).
Figure 1 A schematic of the Thermosyphon10

Numpon Panyoyai et al. J Sci Technol MSU660
Figure 2 Hot air dryer using Thermosyphon heat pipe
heat exchanger
Hot air dryer using a Thermosyphon heat pipe
heat exchanger was used for drying paddy. The dryer
consists of hot air tube blower set and drying chamber
(Figure 2). The drying chamber is constructed of polycar-
bonate sheets with dimensions of 0.5 m wide × 0.5 m
long × 0.5 m high. The dryer was combined with a set of
Thermosyphon heat pipe heat exchanger. The paddy
(San-Pah-Tong 1) was spread in a thin layer on screen
trays with the dimension of 0.5 m wide × 0.5 m long ×
0.2 high. The thickness of paddy was varied at 5, 10 and
15 cm. The drying temperature was controlled at 45±5°C
for the whole drying period. During each experiment the
sample was taken out every hour to determine its moisture
content. The temperature of samples was also measured
continuously using type-K thermocouples, which were
inserted in the bed of the paddy.
Table 1 Parameters.
Parameters Description
Dimensions of tube
Thermosyphon arrangement
Number of rows
Total of tube
Material
Working fl uid
Paddy variety
Rice thickness
Temperature of Drying chamber
Initial moisture content of paddy
Final moisture content of paddy
Do=30 mm, D
i= 25 mm and L
tubes=1100
Staggered, SL=55 mm and ST=55 mm
nL=7, nT= 8
N=53
Seamless steel tube
Water
San-Pah-Tong 1
5 , 10 and 15 cm
45±5°C
34.57% wet basis
14% wet basis
3. Open sun drying method
The paddy was placed in a tray with the
varied thickness of paddy at 5, 10 and 15 cm. The
sample was exposed to the sun for 12 h. During each
experiment the sample was taken out every 5 h to determine
its moisture content. The temperature of samples was
also measured continuously using type-K thermocouples,
which were inserted in the bed of the paddy.
4. Mathematical modeling
The moisture ratio (MR) of the paddy was
defi ned as follows: MR=M
t-M
e
Mi-M
e
(1)
Where Mt, M
i and M
e are the moisture
content at any time of drying (kg water/kg dry mass),
initial moisture content (kg water/ kg dry mass) and
equilibrium moisture content, respectively. The experimental
data at different thicknesses of paddy were fi tted into 5
thin-layer drying models that commonly used in most food
and biological materials as shown in (Table 2).
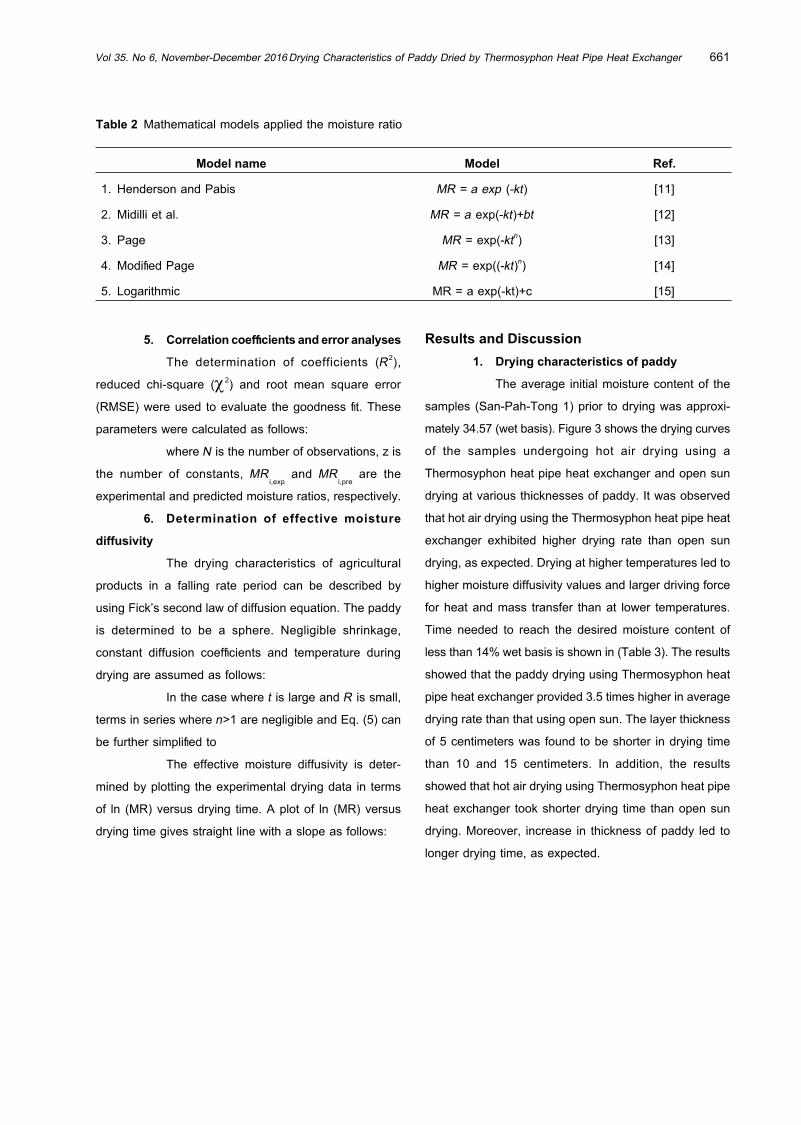
Vol 35. No 6, November-December 2016Drying Characteristics of Paddy Dried by Thermosyphon Heat Pipe Heat Exchanger 661
Table 2 Mathematical models applied the moisture ratio
Model name Model Ref.
1. Henderson and Pabis MR = a exp (-kt) [11]
2. Midilli et al. MR = a exp(-kt)+bt [12]
3. Page MR = exp(-ktn) [13]
4. Modifi ed Page MR = exp((-kt)n) [14]
5. Logarithmic MR = a exp(-kt)+c [15]
5. Correlation coeffi cients and error analyses
The determination of coefficients (R2),
reduced chi-square (χ2) and root mean square error
(RMSE) were used to evaluate the goodness fi t. These
parameters were calculated as follows:
where N is the number of observations, z is
the number of constants, MRi,exp
and MRi,pre
are the
experimental and predicted moisture ratios, respectively.
6. Determination of effective moisture
diffusivity
The drying characteristics of agricultural
products in a falling rate period can be described by
using Fick’s second law of diffusion equation. The paddy
is determined to be a sphere. Negligible shrinkage,
constant diffusion coeffi cients and temperature during
drying are assumed as follows:
In the case where t is large and R is small,
terms in series where n>1 are negligible and Eq. (5) can
be further simplifi ed to
The effective moisture diffusivity is deter-
mined by plotting the experimental drying data in terms
of ln (MR) versus drying time. A plot of ln (MR) versus
drying time gives straight line with a slope as follows:
Results and Discussion 1. Drying characteristics of paddy
The average initial moisture content of the
samples (San-Pah-Tong 1) prior to drying was approxi-
mately 34.57 (wet basis). Figure 3 shows the drying curves
of the samples undergoing hot air drying using a
Thermosyphon heat pipe heat exchanger and open sun
drying at various thicknesses of paddy. It was observed
that hot air drying using the Thermosyphon heat pipe heat
exchanger exhibited higher drying rate than open sun
drying, as expected. Drying at higher temperatures led to
higher moisture diffusivity values and larger driving force
for heat and mass transfer than at lower temperatures.
Time needed to reach the desired moisture content of
less than 14% wet basis is shown in (Table 3). The results
showed that the paddy drying using Thermosyphon heat
pipe heat exchanger provided 3.5 times higher in average
drying rate than that using open sun. The layer thickness
of 5 centimeters was found to be shorter in drying time
than 10 and 15 centimeters. In addition, the results
showed that hot air drying using Thermosyphon heat pipe
heat exchanger took shorter drying time than open sun
drying. Moreover, increase in thickness of paddy led to
longer drying time, as expected.

Numpon Panyoyai et al. J Sci Technol MSU662
Table 3 Time to dry samples to the fi nal moisture content of less than 14% wet basis
Drying method Layer thickness (cm) Drying rates (g/hr)
Thermosyphon heat pipe heat exchanger
5
10
15
0.26
0.24
0.17
Open sun
5
10
15
0.09
0.07
0.04
Figure 3 Drying curves of paddy dried by (a) hot air drying using Thermosyphon heat pipe heat exchanger and (b)
open sun drying
2. Mathematical modeling of drying curves
Drying curves of the paddy under hot air
using heat pipe heat exchanger was fi tted with fi ve different
moisture ratio models shown in (Table 2). The statistical
results of the different models, including the drying
model coeffi cients and the comparison criteria used to
evaluate goodness of fi t, namely, R2, χ2 and RSME, are
summarized in (Table 4). It can be seen that, the R2
values for the models were in the range of 0.993-0.999,
χ2 values were varied between 0.0002 and 0.004 and,
and RMSE values between 0.014 and 0.044. By compar-
ing the criteria values among fi ve drying models, it can
be seen that Logarithmic was the best descriptive model
for drying methods, since it exhibited the highest average
value of R2, the lowest average values of χ2 and RMSE.
Thus, it was selected to represent the drying charac
teristics of paddy.
3. Determination of effective moisture
diffusivities
The values of the effective moisture diffusivity
values are calculated using Eq.6 and 7 and were found
to range between 2.11×10⁻⁸ m2/s and 1.37×10⁻⁷ m2/s
(shown in Table 5). The effective moisture diffusivity was
affected by drying method and thickness of paddy. It was
observed that the increase in Deff in paddy affected the
thickness of paddy increased. Similar results have
previously been reported. Rasouli et al.16 and Yardfon et
al.17, for example, found that higher thickness of samples
resulted in larger effective moisture diffusivity.

Vol 35. No 6, November-December 2016Drying Characteristics of Paddy Dried by Thermosyphon Heat Pipe Heat Exchanger 663
Table 4 Statistical results obtained from different drying models
Model name Drying method Thickness Drying Constants R2 χ2 RSME
1.Henderson and
Pabis
Thermosyphon
5 cm
10 cm
15 cm
k=0.220, a=1.059
k=0.195, a=1.027
k=0.145, a=1.058
0.994
0.997
0.994
0.0016
0.0007
0.0014
0.037
0.025
0.035
2.Midilli et al.Thermosyphon
5 cm
10 cm
15 cm
k = 0.228, n=0.894, a=1.126, b= -0.011
k = 0.169, n=1.017, a=1.004, b= -0.003
k = 0.130, n=0.972, a=1.051, b= -0.005
0.996
0.998
0.998
0.0021
0.0003
0.004
0.037
0.014
0.019
3. Page Thermosyphon
5 cm
10 cm
15 cm
k=0.132, n=1.271
k=0.151, n=1.121
k=0.085, n=1.219
0.998
0.998
0.997
0.0003
0.0004
0.0006
0.017
0.019
0.023
4. Modifi ed
Page
Thermosyphon 5 cm
10 cm
15 cm
k=0.183, n=1.129
k=0.152, n=1.245
k=0.138, n=0.987
0.993
0.996
0.993
0.0021
0.0008
0.0018
0.044
0.026
0.041
5.LogarithmicThermosyphon
5 cm
10 cm
15 cm
k=0.146, a=1.242
c=-0.220
k=0.161, a=1.079
c=-0.077
k=0.104, a=1.167
c=-0.150
0.999
0.998
0.998
0.0003
0.0002
0.0003
0.015
0.014
0.017
Table 5 Effective moisture diffusivity values of paddy
Drying method Layer thickness (cm) Deff
(m2/s)
Hot air using Thermosyphon heat pipe
heat exchanger
5
10
15
2.11×10⁻⁸
7.09×10⁻⁸
1.37×10⁻⁷
ConclusionThe experiments were performed to determine drying
characteristics of paddy cv. San-Pah-Tong 1 dried by hot
air drying using a Thermosyphon heat pipe heat ex-
changer and open sun drying method. According to the
statistical analysis applied to all models, it can be con-
cluded that among these models, Logarithmic gave the
best results. In addition the drying method, thickness of
paddy had a signifi cant infl uence on the drying rate. Hot
air drying using Thermosyphon heat pipe heat exchanger
required shorter drying time than open sun drying since
drying rate of hot air drying was higher than that of open
sun drying. Increase in thickness of paddy resulted in
decreased drying rate and needed longer drying time to
reach the final moisture content. Moreover, drying
method and thickness of paddy affected the effective
moisture diffusivity values of paddy. Studies on physical
and nutritional properties of the paddy after drying are
suggested as a future work.
Acknowledgement The authors express their sincere appreciation
to Faculty of Engineering and Agro-Industry, Maejo
University for their fi nancial support of the study.

Numpon Panyoyai et al. J Sci Technol MSU664
References[1] Food and Agriculture Organization of the United
Nations Rice Market Monitor, URL:http://www.fao.
org/economic/est/publications/rice-publications/
rice-market-monitor-rmm/en/, access on 28/05/2014,
(2014).
[2] Cheenkachorn, K., Drying of rice paddy using a
microwave-vacuum dryer paper presented in European
Congress of Chemical Engineering, Copenhagen,
Denmark, (2007).
[3] Igathinathane, C., Chattopadhyay, P.K. and Pord-
esimo, L.O., Moisture diffusion modeling of parboiled
paddy accelerated tempering process with extended
application to multi-pass drying simulation, Journal
of Food Engineering 88, 239-253, (2008).
[4] Unmole, HSolar., Drying fi sh and paddy, FAO Envi-
ronment and energy paper, Food and Agriculture
Organization of the United Nations, Rome, Italy,
(1989).
[5] Karimi, F., Application of superheated steam for the
drying of food products, Int. Agro physics, 24, 195-
204, (2010).
[6] Maskan, A., Kaya, S. and Maskan, M., Hot air and
sun drying of grape leather (pestil), Journal of Food
Engineering, 54, 81-88, (2002).
[7] P.D. Dunn and D.A. Reay., Heat Pipes, third edition,
Pergamon Press, (1994).
[8] A. Faghri., Heat Pipe science and technology, Taylor
and Francis, USA, (1995).
[9] Terdtoon, P., Heat Pipe, Department of Mechanical
Engineering, Chaing Mai University, Chaing Mai,
Thailand, (1993).
[10] Numpon, P., Paramet, P., Thanasit, W. and Tipapon,
K., Experimental study on the thermal performance
of thermosyphon heat exchanger for rough rice dry-
ing, RMUTI Journal Special Issue, 1, 122-127, (2015).
[11] Aghbashlo, M., Kianmehr M.H., Khani, S. and
Ghasemi, M., Mathematical modeling of thin layer
drying of carrot, Int. Agrophysics 23: 313-317, (2009).
[12] Midilli, A., Kucuk, H. and Yapar, Z., A new model for
single layer drying, Dry Technol l20 (7):1503-1513,
(2002).
[13] Basunia, M.A. and Abe, T., Thin-layer solar drying
characteristics of rough rice under natural convection,
Journal of Food Engineering, 47, 295–301, (2001).
[14] Ceylan, I., Aktas, M. and Dogan, H., Mathematical
modeling of drying characteristics of tropical fruits,
Applied Thermal Engineering, 27, 1931–1936, (2007).
[15] Karathanos, VT., Determination of water content of
dried fruits by drying kinetics, Journal of Food Eng
39: 337–344, (1999).
[16] Rasouli, M., Seiiedlou, S., Ghasemzadeh, H.R. and
Nalbandi, H., Infl uence of drying conditions on the
effective moisture diffusivity and energy of activation
during the hot air drying of garlic. Australian Journal
of Agricultural Engineering, 2, 96-101, (2011).
[17] Yardfon, T., Numpon, P. and Thanasit, W., Drying
characteristics of paddy dried by hot air using bio-
mass gas as fuel and open sun drying method.
RMUTI Journal Special Issue, 1, 192-197, (2015).

Original
1,2 Faculty of Engineering, University of Mahasarakham E-mail: [email protected]
Imaging Red Light Runners
Piriya Polhan1, John Morris2
Received: 25 December 2015; Accepted: 25 March 2016
Abstract
Traffi c lights are routinely ignored by Thai drivers, so we designed a system that allows a single camera attached to
a simple PC to monitor a controlled intersection and sends images of vehicles violating traffi c lights to a police post
further down the road. This allows police to instantly stop motorists, fi ne them if appropriate but, more importantly,
educate them on the importance of following road rules - for the benefi t of all drivers. We demonstrated that our
system performs with two types of cheap, consumer cameras: it is simple to setup, does not rely upon accurate
intersection delineation and can be deployed on intersections that are not well marked. It can view red light runners
from the side or rear view thus the only constraint on the camera position is the ability to view the whole intersection
and at least one controlling traffi c light.
Keywords: visual object tracking, traffi c safety
Introduction
Thailand has a very high rate of road accidents: it has
been ranked as high as third in the world on a per head
of population basic by statistics from the World Health
Organization1. Road traffi c accident have many causes:
statistics from the Thai Traffi c Police rank the causes of
the accident as
1. Highway speeding,
2. Tailgating,
3. Unsafe overtaking and
4. Running a red light2.
Although running red lights only causes _ 10%
of accidents in Thailand, this represents _ 2000 deaths
(and many more accidents) annually2. However, this
problem is international: Retting et al. reports that in the
US, 260,000 crashes and 750 fatalities annually were
attributed to red light running3. Crashes involving red light
runners have greater impact than other crashes causing
occupant injuries in 45% of crashes, compared to 30% in
other crashes4. Internationally, the economic and social
cost of road accidents remains high, even in countries
with much lower per capita accident rates than Thailand.
For example, in Victoria, Australia, with only 5.4 fatalities
per 100,000 head of population, the economic cost is
estimated at $ A4 billion perannum5 in a total population
of 5.8 million (2014 census), thus the cost in Thailand
with 17 fatalities per 100,0001 the economic cost must be
signifi cantly greater. This makes no account of the social
cost of deaths and injuries. Despite some campaigns from
several sources in Thailand, the accident rate is not
decreasing. Thus any system which increases awareness
of road hazards will have enormous benefi t for the
country.
Previous work
Many systems have been developed to monitor
traffi c violations. Early systems were usually attached to
the traffi c light control systems, e.g. Abbas and Li used
a combination of a PC104 which takes data from the
traffic cabinet and cameras storing images with a
commercial video capture loop6. Other systems, mostly
involving cameras linked to traffi c cabinets and inductive
loop detectors, have been surveyed by Yung and Lai7.
Washburn and Courage used a commercial video
Piriya Polhan et al. J Sci Technol MSU666
recorder with some sensors on the light power cables.
Signals from these sensors were encoded on the audio
channel of the recorder for later outline Analysis: the acquired data was used for traffi c analysis and was not used for enforcement or education of drivers themselves8. Many of these use camera and image processing techniques to assist law enforcement and improve safety as well as improve traffic flow. Klubsuwan et al. used image processing alone to detect traffi c light violations without the help of other systems9. They correctly detected 80% violations. Several commercial systems are also now available, but they are mainly suited to the well-controlled intersections in western countries10. One full system developed in Thailand has been reported, but does not appear to have been widely adopted: cost may be a factor as it includes license plate detection11. 1. Extent of the problem
To confi rm the extent of the problem of running red lights locally, we made a simple count of the rate of red traffi c light violations. On one major highway T-junction in Mahasarakham (a small city in NE Thailand, pop 250,000), we counted the number of vehicles going through traffi c lights in light traffi c conditions (12 noon on a Sunday): in a one hour period, with 26 light changes (one for each of 3 directions), we noted 79 cars and trucks and 28 motorcycles that did not stop for a traffi c light over the three intersections in the T-junction, ie on average one car or truck for every light change and one motorcycle every three changes. This showed that traffi c lights are routinely ignored locally and that an automated system that assisted police to detect and educate drivers could make a signifi cant impact on accidents and their cost. We also hypothesized that educating drivers to obey one road rule might encourage them to follow other rules also and reduce accidents from other causes too.
Our system
Our system consists of a single camera attached to a PC which was positioned to monitor a controlled intersection. It monitors the traffi c lights themselves and does not require assistance from the traffi c controlling hardware and associated road loops. When it detects a red light violation - a vehicle moving through the intersection when the light is red - it captures images of the offending vehicle and transmits a set of images to a police post which can be several hundred meters down the road. This component of the system was designed to follow the very common current Thai police practice of establishing partial road blocks to check vehicles, thus it will require minimal changes to current practices. Our design is also easily adapted to a variety of situations: it can be set up in a few minutes at a new intersection. It just requires a suitable position for a camera mount and a casing for the PC and battery1. The wireless connection needs a line-of-sight link to the monitor post, say 500m away2. 1. Operation
1.1 Setup
Traffi c Light Detection initially, the operator needs to place the camera in a stable location so that it can view the intersection and at least one light controlling it. The software detects traffi c light candidates which can be anywhere in the fi eld of view and asks the operator to indicate when the correct light has been detected3. Steps in the light detection algorithm are: 1. Identify `red’ areas by comparing high intensities in the red channel of the image with intensities in the other two channels. Typical traffi c scenes contain large white areas which show high red intensities, so these are eliminated. Unfortunately, scenes often contain several red patches (red cars seem to be very popular!), so we did not attempt to fully automatically identify lights: previous efforts, e.g. Sooksatra and Kondo12, found less than 90% correct detections in fairly ideal conditions, as might be expected due to the likeli-hood of round and red objects appearing in a typical
scene4. traffi c light, false color optical fl ow map (green
indicates highest speed), fl ow map contour

Vol 35. No 6, November-December 2016 Imaging Red Light Runners 667
Figure 1 Screen shot after detecting a red light runner using 1280 720 pixel small consumer camera (Canon IXUS 155)
Top row: marked up intersection image, vehicle passing red light, difference image; Bottom row:
2. Select red light candidates by shape
and size.
3. Present candidates to the operator,
one-by-one
4. Terminate when the operator
accepts a candidate or repeat on another image.
Traffi c Light Detection The operator
then identifi es the ̀ forbidden region’ - the area which must
not be entered after the light has turned red. Observation
showed that many intersections were poorly marked - with
markings absent or badly worn - and therefore likely to
defeat an automated system. However, an operator can
quickly (two mouse clicks) identify the forbidden region
- see blue outline in the top left of (Figure 1).
Link to monitor post Then the operator
aligns the link between the intersection camera and the
monitoring post computer. A reasonable height above
ground for the antennae at both ends will ensure trouble-free
transmission. Even in quite crowded city areas, transmitters
and receivers about 2-3m or more above ground will suf-
fi ce. Software will verify that signifi cant bandwidth to
transmit images of the red light runners is available5.
1.2 Automatic Monitoring In monitor mode,
the program uses optical fl ow to detect moving objects in
the exclusion zone when the traffi c light is red. Candidate
algorithms for this are frame differences and optical fl ow.
1.3 Frame differences This is very fast and
meets any real-time constraints, but is susceptible to
interference from moving objects (trees are a particular
concern, but even traffi c lights are affected by the wind.
Some examples may be seen in the top panel of
(Figure 2) which shows trees and power wires clearly
showing up - `speckle’ in the Top row: marked up
intersection image, vehicle passing red light, difference
image; Bottom row: traffi c light, false color optical fl ow
map (green indicates highest speed), fl ow map contour
background. Even the ̀ pick up’ appearing
as a large white area in the difference map is a complex
shape with several black `holes’. So the difference
images need considerable intelligent processing to
remove noise and non-vehicle movements and we
rejected it in favor of optical fl ow techniques. Although it
is not used for primary vehicle movement detection,
occasional system artefacts (probably mainly vibrations
in the camera base) cause poor frame-to-frame registration,
affecting optical fl ow, which detects anything moving in
the scene, and leads to poor discrimination between
moving and background objects. So we simply reject
frames which are poorly registered: typically more than
30 frames are captured for a red light runner, so this has
negligible effect on overall detection.

Piriya Polhan et al. J Sci Technol MSU668
1.4 Optical fl ow
Optical fl ow is unfortunately computa-
tionally complex on the high resolution images that are
now available. Selection of the forbidden region assists
by reducing the area that must be processed. Optical fl ow
images also allow the speed and direction of the moving
vehicle to be determined, allowing rejection of vehicles
stopped unintentionally in the forbidden region, e.g.
blocked by other traffi c. We used the Farneback optical
fl ow routine from the Open CV library13. In separate trials,
we have used the total linear variation algorithm (from
Open CV14) which produces slightly better results but is
approximately three time slower. On the bottom middle
panel of (Figure 1), a false color map showing which
pixels are moving from frame to frame.
Greenish colours encode faster moving
pixels. A contour is drawn around the fast moving pixels:
small areas are rejected (wind or vibration generated
noise) and regions large to represent a vehicle (or
motorcycle - the commonest offenders are some intersec-
tions) and an image of the offending vehicle extracted
from the current scene image for transmission to a
monitoring post. For the higher resolution images of
(Figure 2), the optical fl ow algorithm fails to cleanly assign
every pixel of the vehicle to a uniform velocity (as seen
in the lower middle false colour image of Figure 2), but
the moving vehicle is suffi ciently correctly identifi ed to
allow a complete and clear image of the red light runner
(upper middle panel of Figure 2).
Results
Preliminary results for our system have been
tested with several video cameras - including one in a
cell-phone - have shown that the system reliably detects
red light runners. A screen shot from the running program
is shown in (Figure 1). Using a Canon IXUS 155 camera
(1280_720 pixel resolution), clear images of the red light
runner were obtained in typically 300 _ 230 pixel colour
images which can easily identify a vehicle. These _ 24
Kbyte images are rapidly transmitted to a monitor post
which can capture a short video of the runner.
False detections from low moving and small
objects and noise were readily eliminated. Currently the
system is being tested using IP links over the cell-phone
network, which may prove satisfactory (and considerably
cheaper!) in the long run: we note that a red light runner
travelling at 60 km/hour needs 30 s to reach a monitoring
station 500m down the road and a communications
latency of much less than that is readily achieved. A frame
rate as low as 10 fps requires a bandwidth of _ 0:25 MB/s
to capture 30 frames of a red light runner at 60 km/hour:
so a clear picture can still be obtained if many frames are
dropped. There is also considerable potential to use
higher resolution images but seemingly no need to
increase frame rates.
We observed that automatic number plate
recognition (as provided in the Smart Vision Technology
Figure 2 Screen shot after detecting a red light runner using hand held 1900 _ 1080 pixel cell phone camera
(Samsung Galaxy Grand Prime)
Vol 35. No 6, November-December 2016 Imaging Red Light Runners 669
system11) would require higher resolution and also restrict
position of the camera to be almost directly behind the
moving vehicle, but there are only weak constraints of
the current system: it can be rapidly set up and only needs
a clear view of the intersection and a controlling traffi c light. We have tested it successfully from several view-
points in different intersections.
Conclusions
This work was designed to develop a simple and
robust system that was suited to Thai conditions and
procedures. It is characterized by a fl exible f ast setup and
thus can be readily redeployed to a new location. Rapid
movement may be a key factor in the electiveness of this
system: fi xed red light camera locations are widely
publicized in several countries, mitigating their elective-
ness, but the wide availability of rapidly deployed systems
may substantially enhance electiveness. Tests at several
intersections with different camera capabilities have sug-
gested that the system has signifi cant potential to detect
traffi c light violations in less than ideal conditions with
simple set-up procedures and contribute to the serious
problems referred to in the introduction that currently ex-
ist on all Thai roads. We thus see strong justifi cation for
further work to improve its robustness and reliability.
Future work
Robust estimation of the object shape and size from
optical fl ow data needs further study. Further tests in a
variety of weakly controlled environments, e.g. partially
visible traffi c lights, and situations where several competing
traffi c fl ows can be observed. Although the system is
designed to provide traffi c light violations to a human
operator and therefore occasional failures are tolerable,
confi dence and effectiveness of the systems will be
improved if its correct behavior is known - and approaches
100%. Statistical analysis of detection accuracy is also
required: we have not yet investigated situations where
several vehicles run the red light at the same time.
References
[1] World Health Organization, Global status report on
road safety. World Health Organization, 2013.
[2] Royal Thai Police, \Thai road accident statistics,”
www.tra_cpolice.go.th/accident.php, 2015.
[3] R. Retting, A. Williams, and M. Greene, \Red-light
running and sensible countermeasures: Summary of
research fi ndings,” Transportation Research Record:
Journal of the Transportation Research Board,
vol.1640, pp. 23{26, 1998. [Online]. Available: http://
trrjournalonline.trb.org/doi/abs/10.3141/1640-04
[4] R. A. Retting, A. F. Williams, D. F. Preusser, and H.
B. Weinstein, \Classifying urban crashes forcounter-
measure development,” Accident Analysis and Pre-
vention, vol. 27, no. 3, pp. 283 { 294, 1995.[Online].
Available: http://www.sciencedirect.com/science/arti-
cle/pii/000145759400068W
[5] Government of Victoria, \Road toll statistics,” www.
camerassavelives.vic.gov.au/home/road+trauma,
2011, this site has Aus Vic stats for 2011.
[6] M. Abbas and P. Li, \Advanced real-time intersection
data collection system for safety evaluation,” in Intel-
ligent Transportation Systems, 2009. ITSC ‘09. 12th
International IEEE Conference on, Oct 2009, pp. 1{6.
[7] N. H. C. Yung and A. H. S. Lai, \An effective video
analysis method for detecting red light runners,”
Vehicular Technology, IEEE Transactions on, vol. 50,
no. 4, pp. 1074{1084, Jul 2001.
[8] S. S. Washburn and K. G. Courage, \New technol-
ogy for conducting red light running studies,” in
IECON 02 [Industrial Electronics Society, IEEE 2002
28th Annual Conference of the], vol. 4, Nov 2002,pp.
3097{3102 vol.4.
[9] K. Klubsuwan, W. Koodtalang, and S. Mungsing, \
Tra_c violation detection using multiple trajectories
evaluation of vehicles,” in Fourth International Conference
on Intelligent Systems, Modelling and Simulation
(ISMS 2013), January 2013, pp. 220{224.
[10] American Traffic Solutions, Inc., \ATS red-light
safety camera solution,” www.atsol.com/solution/
Red-light-safety, 2015, [Online; accessed 23 May
2015].

Piriya Polhan et al. J Sci Technol MSU670
[11] Smart Vision Technology, \Red light camera,” http://
www.smartvisoncompany.com/redlightcamera. Html,
2015, [Online; accessed 24 May 2015].
[12] S. Sooksatra and T. Kondo, \Red traffi c light detection
using fast radial symmetry transform,” in Electrical
Engineering/Electronics, Computer, Telecommunica-
tions and Information Technology (ECTI-CON), 2014
11th International Conference on, May 2014, pp. 1{6.
[13] G. Farneback, \Two-frame motion estimation based
on polynomial expansion,” in Proceedings of the13th
Scandinavian Conference on Image Analysis, ser.
SCIA’03. Berlin, Heidelberg: Springer-Verlag, 2003,
pp. 363{370. [Online]. Available: http://dl.acm.org/
citation.cfm?id=1763974.1764031
[14] C. Zach, T. Pock, and H. Bischof, \A duality based
approach for realtimetv-l 1 optical ow,” in Pattern-
Recognition. Springer Berlin Heidelberg, 2007, pp.
214{223.

Original
1 Department of Environmental Education Faculty of Environment and Resource Studies Mahasarakham University, Mahasarakham,
44150, Thailand. Tel: 6-681-878-3497 Email: [email protected]. 2 Department of Environmental Education Faculty of Environment and Resource Studies Mahasarakham University, Mahasarakham
44150, Thailand Email:[email protected] Co-Advisor, School of Management, Assumption University, HuaMak Campus, 592/3 Ramkhamhaeng 24, HuaMak, Bangkok 10240,
Thailand
Causal Relationship Model of Ecological Footprint Integrated with Environmental
Education
Puripat Mukpradab1, Nongnapas Thiengkamol2, Tanarat Khoowaranyoo Thiengkamol3
Received: 30 December 2015; Accepted: 17 March 2016
Abstract
This research was quantitative research with a survey approach. A questionnaire was used as an instrument for
gathering data from a population of 36,009 upper secondary school students under Secondary Service Area Offi ce 28
(Sisaket-Yasothon) in academic year 2014. Cluster Random Sampling technique was implemented to collect 400
upper secondary school students as the sample group. Structural Equation model (SEM) was used for model
confi rmation. Research results demonstrated that Ecological Footprint (EF), Environmental Education (EE), and
Environmental Conservation Inspiration (INS) were able to explicate the variation of cause Environmental Conservation
Behavior for Global Warming Alleviation (EnB) with 92.00 percent. EF had the most effect to EnB with 0.69,
Subsequences were EE, and INS with 0.48 and 0.40. Additionally, EF and EE were able to explicate the variation of
INS with 78.00 percent, and EF had the most effect to INS with 0.36. Subsequence was EE with 0.30. The causal
relationship model of EF and EE infl uencing EnB through INS was confi rmed the proposed model and it was fi tted with
all observed variables in line with criteria of Chi-Square/df value with less or equal to 1.647 and it was less than or
equaled to 5.00 (χ2/df≤500). RMSEA (Root Mean Square Error Approximation) equaled to 0.045 (RMSEA <0.05)
and RMR (Root Mean Square Residual) equaled to 0.047 (RMR <0.05) including index level of model congruent
value of Goodness of Fit Index (GFI) equaled to 0.94, and Adjust Goodness of Fit Index (AGFI) equaled to 0.91 which
are between 0.90-1.00.
Keywords: model, ecological footprint, environmental education
Introduction
Ecological Footprint (EF) is a measurement of humanities
reliance on natural resources. Moreover, EF measures
the amount of productive land and water necessary for
the production of goods including waste accumulation
from the population’s activity. EF is a distinctive group of
uniqueness, actions, etc., that leave a trace and serve as
methods of classifi cation, such as the quantity of productive
land suited for average of each person (in the world, a
country, etc) for food, water, transport, housing, waste
management, and other purposes. The simplest way to
defi ne ecological footprint would be classify it as the
impact of human activities measured in terms of the area
of biologically productive land and water requisite to
produce the goods consumed and to absorb the wastes
produced. Basically, it is the quantity of the environment
required to produce the goods and services needed to
maintain a particular lifestyle.8,22
The EF is rooted in the fact that all renewable
resources come from the earth. It accounts for the fl ows
of energy and matter to and from any defi ned economy
and converts these into the corresponding land/water area

Puripat Mukpradab et al. J Sci Technol MSU672
required for nature to support these fl ows. The Ecological
Footprint is defi ned as “the area of productive land and
water ecosystems required producing the resources that
the population consumes and assimilate the wastes that
the population produces, wherever on Earth the land and
water is located.”1 It compares actual throughput of
renewable resources relative to what is annually renewed.
Non-renewable resources are not assessed, as by
defi nition their use is not sustainable.
Environmental Education of The Intergovernmental
Conference highlighted the Environmental Education
functions on preservation and improvement the global
environment and required to supply the agenda and
directions for environmental education. Environmental
education is a learning process that makes human gain
more awareness and knowledge on the environment,
developing the essential skills and expertise, and cultivating
attitudes, and promise for decision making and taking
responsibility. Environmental education covers the
fundamental component of environmental, knowledge and
understanding, awareness for environmental problems,
having proper attitude for performing appropriate
behavior through repeated practice for environmental
conservation with skill and correct decision making with
responsibility and participation in environment projects
and activities.25
Thiengkamol affi rmed that the inspiration of
public consciousness or public mind requires no admiration
or complement or incentive. Particularly in natural
resources and environment conservation, it happens from
insight of someone, whilst its occurrence might come from
the pleasure in a person as role model or idle, events,
situation, environment, media perceiving such movie
watching, book and magazine reading, and internet using.
In addition, several researches were carried out by her
and her colleagues, these have also proved that inspira-
tion of public consciousness or public mind are a critical
factor for environmental conservation in diverse environ-
mental management with the integration of the environ-
mental education concept.2,3
The goal of this study was to apply the EF
knowledge and EE for the students to conserve the
natural resources and environment via inspiration of
public consciousness or public mind. Knowledge and
understanding of EF and EE would lead them to be
concerned that the ecological capacity has limitations
whilst the population growth has increased rapidly
because various factors support this growth. A factor such
as better medical technology is progress, thus the people
have better health. However, there is the problem of a
new disease arising from the environmental problems of
pollutions. Therefore, understanding the EF would help
younger generations to realize the importance of
ecological balance and to challenge them to change their
environmental behavior of consumption, energy conservation,
waste management, recycling, traveling and environmental
knowledge transferring. The new generations would
be our hope to cure and maintain the ecological system
with their public consciousness to meet sustainable
development.
Objective
The objective of this research was to develop a
causal relationship model of an ecological footprint and
environmental education of upper secondary school
students under Secondary Service Area Office 28
(Sisaket-Yasothon) in the Northeastern region, Thailand.
Methodology
The research method was conducted following
these steps:
1. Population and Sample
Population was 36,009 upper secondary
school students under Secondary Service Area Offi ce 28
(Sisaket-Yasothon) of Northeastern region of Thailand in
second semester of academic year 2014.
Sample was 400 upper secondary school
students that gathered with Cluster Random Sampling
technique.
2. Research tool
The content and structural validity of a
questionnaire were proved by Item Objective Congruent
(IOC) from 5 experts in the fi elds of ecology, environmental
education, social science and social research methodology.
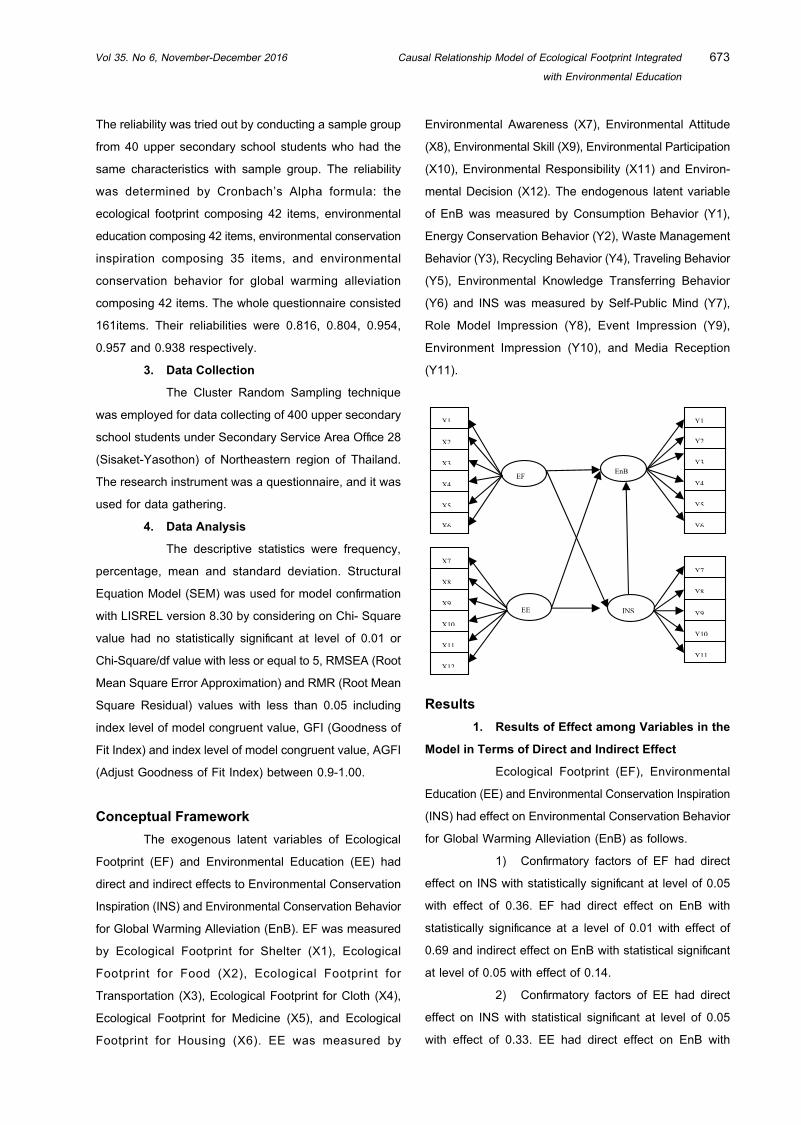
Vol 35. No 6, November-December 2016 Causal Relationship Model of Ecological Footprint Integrated
with Environmental Education
673
The reliability was tried out by conducting a sample group
from 40 upper secondary school students who had the
same characteristics with sample group. The reliability
was determined by Cronbach’s Alpha formula: the
ecological footprint composing 42 items, environmental
education composing 42 items, environmental conservation
inspiration composing 35 items, and environmental
conservation behavior for global warming alleviation
composing 42 items. The whole questionnaire consisted
161items. Their reliabilities were 0.816, 0.804, 0.954,
0.957 and 0.938 respectively.
3. Data Collection
The Cluster Random Sampling technique
was employed for data collecting of 400 upper secondary
school students under Secondary Service Area Offi ce 28
(Sisaket-Yasothon) of Northeastern region of Thailand.
The research instrument was a questionnaire, and it was
used for data gathering.
4. Data Analysis
The descriptive statistics were frequency,
percentage, mean and standard deviation. Structural
Equation Model (SEM) was used for model confi rmation
with LISREL version 8.30 by considering on Chi- Square
value had no statistically signifi cant at level of 0.01 or
Chi-Square/df value with less or equal to 5, RMSEA (Root
Mean Square Error Approximation) and RMR (Root Mean
Square Residual) values with less than 0.05 including
index level of model congruent value, GFI (Goodness of
Fit Index) and index level of model congruent value, AGFI
(Adjust Goodness of Fit Index) between 0.9-1.00.
Conceptual Framework
The exogenous latent variables of Ecological
Footprint (EF) and Environmental Education (EE) had
direct and indirect effects to Environmental Conservation
Inspiration (INS) and Environmental Conservation Behavior
for Global Warming Alleviation (EnB). EF was measured
by Ecological Footprint for Shelter (X1), Ecological
Footprint for Food (X2), Ecological Footprint for
Transportation (X3), Ecological Footprint for Cloth (X4),
Ecological Footprint for Medicine (X5), and Ecological
Footprint for Housing (X6). EE was measured by
Environmental Awareness (X7), Environmental Attitude
(X8), Environmental Skill (X9), Environmental Participation
(X10), Environmental Responsibility (X11) and Environ-
mental Decision (X12). The endogenous latent variable
of EnB was measured by Consumption Behavior (Y1),
Energy Conservation Behavior (Y2), Waste Management
Behavior (Y3), Recycling Behavior (Y4), Traveling Behavior
(Y5), Environmental Knowledge Transferring Behavior
(Y6) and INS was measured by Self-Public Mind (Y7),
Role Model Impression (Y8), Event Impression (Y9),
Environment Impression (Y10), and Media Reception
(Y11).
EE
EnBX3
X4
X5
X6 Y6
Y1
Y2
Y3
Y4
Y5
Y11
Y7
Y8
Y9
X2
X1
X7
EF
INS
Y10
X8
X9
X10
X11
X12
Results
1. Results of Effect among Variables in the
Model in Terms of Direct and Indirect Effect
Ecological Footprint (EF), Environmental
Education (EE) and Environmental Conservation Inspiration
(INS) had effect on Environmental Conservation Behavior
for Global Warming Alleviation (EnB) as follows.
1) Confi rmatory factors of EF had direct
effect on INS with statistically signifi cant at level of 0.05
with effect of 0.36. EF had direct effect on EnB with
statistically signifi cance at a level of 0.01 with effect of
0.69 and indirect effect on EnB with statistical signifi cant
at level of 0.05 with effect of 0.14.
2) Confi rmatory factors of EE had direct
effect on INS with statistical signifi cant at level of 0.05
with effect of 0.33. EE had direct effect on EnB with

Puripat Mukpradab et al. J Sci Technol MSU674
statistical signifi cant at level of 0.01 with an effect of 0.48
and indirect effect to EnB with statistical signifi cant at
level of 0.05 with effect of 0.13.
3) Confi rmatory factors of INS had direct
effect on EnB with statistical signifi cant at level of 0.01
with effect of 0.40.
Considering on structural model confi rmatory
factors of component analysis of EF, EE and INS had
effect to EnB with effect of 92.00 %. The structural equation
can be written as the following in equation (1).
EnB = 0.40*INS + 0.69*EF + 0.48*EE...…………….. (1)
(R2 =0.92)
Equation (1) factors that had the most effect
to EnB was EF with 0.69, subsequences were EE, and
INS with effect of 0.48 and 0.40, these were able to
explicate the variation of EnB with 92.00 percent.
Considering on confi rmatory factors INS of
upper secondary school students, it demonstrated that
EF had the most effect on INS with 0.36. Subsequence
was EE with 0.33, these were able to explicate the
variation of INS with 78.00%. The structural equation can
be written as follows.
INS=0.36*EF + 0.33*EE ………………………………. (2)
(R2 = 0.78)
Equation (2) factors that had the most effect
to INS were EF, and subsequence was EE, these were
able to explain the variation of Environmental Conservation
Inspiration (INS) with 78.00 percent.
The results of exogenous variables had
effect to endogenous variables with direct and indirect
effects were demonstrated in (Figure 1) and (Table 1).
Discussion
The results indicated that understanding the concept of
Ecological Footprint (EF) was predicted by 6 observed
variables of Ecological Footprint for Cloth (X4), Ecological
Footprint for Transportation (X3), Ecological Footprint for
Shelter (X1), Ecological Footprint for Medicine (X5),
Ecological Footprint for Housing (X6) and Ecological
Footprint for Food (X2) with predicting power of 0.83,
0.74, 0.65, 0.64, 0.60, and 0.28 respectively. Moreover,
it also had direct effect to Environmental Conservation
Behavior for Global Warming Alleviation (EnB) with effect
of 0.69, which is a rather high effect, thus it is obviously
seen that EF plays an important role to change the
environmental conservation behaviors for global warming
alleviation that was predicted by Environmental Knowledge
Transferring Behavior (Y6), Energy Conservation Behavior
(Y2), Waste Management Behavior (Y3), Traveling
Behavior (Y5), Recycling Behavior (Y4), and Consumption
Behavior (Y1) with prediction power of 0.71, 0.62, 0.62,
0.61, 0.56, and 0.51 respectively. Another essential
exogenous variable was Environmental Education (EE)
which had direct and indirect effects on EnB with 0.48
and 0.13 and it also was predicted by observed variables
of Environmental Skill (X9), Environmental Decision (X12),
Environmental Awareness (X7), Environmental Respon-
sibility (X11), Environmental Attitude (X8) and Environ-
mental Participation (X10) with prediction power of 0.89,
0.60, 0.48, 0.47, 0.37 and 0.32 respectively. The fi ndings
verifi ed that EF and EE are vital factors that are able to
be applied for challenging pro-environmental behaviors
of upper secondary school students to act as critical
change agents to transfer their environmental knowledge
to their friends, family members, and others in society as
well including explicit their Energy Conservation Behavior,
Waste Management Behavior, Traveling Behavior,
Recycling Behavior, and Consumption Behavior as good
role model for others too. The results were in the line with
Thiengkamol and her colleagues that EE had direct and
indirect effect to environmental conservation behaviors
for global warming alleviation.
Additionally, Environmental Conservation Inspiration
(INS) had direct effect to EnB with effect of 0.40 whereas
considering on prediction of correlation of observed
variables of Event Impression (Y9), Media Reception
(Y11), Environment Impression (Y10), Role Model Impression
(Y8), and Self-Public Mind (Y7). These were congruent
to different studies of Thiengkamol and her colleagues
that the results illustrated that Inspiration of Public Con-
sciousness or public mind infl uencing pro-environmental

Vol 35. No 6, November-December 2016 Causal Relationship Model of Ecological Footprint Integrated
with Environmental Education
675
behaviors whether consumption behavior, energy conser-
vation, waste management behavior, recycling behavior,
traveling behavior and knowledge transferring and
supporting for environmental conservation and so on.
Thus, this research results should be established
to inspire upper secondary school students to take action
in playing a role as environmental educators to transfer
their environmental knowledge and understanding with
public mind to devote for environmental conservation
behavior as new generations who take care for ecological
balance and maintain environmental quality to meet life
quality for achieving sustainable development based on
EF and EE concept considerations.
Chi-Square=263.50, df=160, P-value=0.00000, RMSEA=0.045
0.69
0.48
0.36
0.33
0.03
-0.05
0.200.18
-0.04
0.14
0.03
0.04
0.10
0.07 -0.08-0.05
0.10
-0.05
0.03
X1 0.37
X2 0.53
X3 0.21
X4 0.12
X5 0.23
X6 0.23
X7 0.15
X8 0.24
X9 0.15
X100.11
X110.09
X120.10
EF
EE
EnB
INS
Y1 0.19
Y2 0.16
Y3 0.18
Y4 0.23
Y5 0.26
Y6 0.55
Y7 0.28
Y8 0.18
Y9 0.26
Y10 0.13
Y11 0.18
0.43 0.57 0.54 0.48 0.43 0.60
0.44 0.51 0.63 0.53 0.54
0.44 0.28 0.73 0.81 0.60 0.58
0.44 0.35 0.85 0.29 0.44 0.53
0.40
-0.09 -0.02
Figure 1 Model of Direct and Indirect Effect of EF and EE Affecting EnB through INS
Table 1 Direct and Indirect Effect of EF and EE Affecting EnB through INS
Causal
variable
Result variables
INS EnB
TE IE DE TE IE DE
EF 0.36*
(0.059)
- 0.36*
(0.059)
0.83**
(0.075)
0.14*
(0.033)
0.69**
(0.074)
EE 0.33*
(0.059)
- 0.33*
(0.16)
0.61**
(0.065)
0.13*
(0.013)
0.48**
(0.069)
INS - - - 0.40**
(0.043)
- 0.40**
(0.043)
χ2= 263.50; df = 160 CN = 234.28 χ2/df= 1.647
GFI = 0.94; AGFI = 0.91 RMSEA = 0.045 RMR = 0.047
TE: Total Effect, IE: Indirect Effect, DE: Direct Effect

Puripat Mukpradab et al. J Sci Technol MSU676
Conclusion
Nevertheless, it might be summarized that latent variables
that can be observed from observed variables are
infl uenced through Environmental Conservation Inspiration
(INS) composed of Self-Public Mind (Y7), Role Model
Impression (Y8), Event Impression (Y9), Environment
Impression (Y10), Media Reception (Y11) to Environmental
Conservation Behavior for Global Warming Alleviation
(EnB) that included behavior of appropriate consumption,
energy conservation, waste management, recycling,
travelling and knowledge transferring. Thus, the model of
EF and EE infl uencing via INS to cause EnB was verifi ed
the proposed model was fi tted with all observed variables
according to criteria of Chi-Square/df value with less or
equal to 5 ( ). RMSEA (Root Mean Square Error
Approximation) equaled to 0.049 (RMSEA < 0.05) and
RMR (Root Mean Square Residual) equaled to 0.017
(RMR < 0.05) including index level of model congruent
value of Goodness of Fit Index (GFI) equaled to 0.95,
and Adjust Goodness of Fit Index (AGFI) equaled to 0.92
which are between 0.90-1.00.
References
[1] Artwanichakul, K. and Thiengkamol, N. and Thiengkamol,
T., Structural Model of Dengue Fever Prevention and
Control Behavior, European Journal of Social
Sciences, Vol.32, No.4, pp.485-497, 1992.
[2] Chomputawat, S. and Thiengkamol, N. and Thieng-
kamol, K .T., Causal Relationship Model of Environ-
mental Conservation for Agriculturist, European
Journal of Scientifi c Research, Vol.104, No.3, pp.
504-518, 2013.
[3] Donkonchum, S. and Thiengkamol, N. and Thieng-
kamol, C., Causal Relationship Model of Environmen-
tal Conservation Behavior Integrated with LCA
Knowledge, European Journal of Social Sciences,
Vol.33, No.1, pp.5-16, 2012.
[4] Gonggool, D. and Thiengkamol, N. and Thiengkamol,
C., Development of Environmental Education Volunteer
Model through Inspiration of Public Consciousness
for Sustainable Development, European Journal of
Social Sciences, Vol.32, No.1, pp.303-310, 2012.
[5] Jongwutiwet, N. and Thiengkamol, N. and Thieng-
kamol, T., Causal Relationship Model of Hospital
Environmental Management, Mediterranean Journal
of Social Sciences, Vol.3, No.11, pp.303-310, 2012.
[6] Koonboonchan, A. and Thiengkamol, N. and Thieng-
kamol, K.T., Causal Relationship Model of Global
Warming Alleviation Integrated with Four Noble
Truths and Psychological State, European Journal of
Scientifi c Research, Vol.104, No.3, pp.418-433, 2013.
[7] Kotchachote, Y. and Thiengkamol, N. and Thieng-
kamol, K.T., Casual Relationship Model of Forest Fire
Prevention, European Journal of Scientifi c Research,
Vol.104, No.3, pp.519-532, 2013.
[8] Monfreda, C. and Wackernagel, M. and Deumling,
D., Establishing national natural capital accounts
based on detailed ecological footprint and biological
capacity assessments, Land Use Policy, Vol.21, No.3,
pp.231–246, 2004.
[9] Morrasri, P. and Thiengkamol, N. and Thiengkamol,
K.T., Causal Relationship Model of Little Green Child
with Environmental Behavior, European Journal of
Social Sciences, Vol.34, No.2, pp.177-189, 2012.
[10] Phinnarach, K. and Thiengkamol, N. and Thieng-
kamol, C., Causal Relationship Model of Community
Strength, European Journal of Social Sciences,
Vol.34, No.3, pp.379-392. 2012.
[11] Pimdee, P. and Thiengkamol, N. and Thiengkamol,
K.T., Causal Relationship Model of Electrical Energy
Conservation, European Journal of Social Sciences,
Vol.32, No.3, pp.306-315, 2012.
[12] Ruboon, O. and Thiengkamol, N. and Thiengkamol,
K.T. and Kurokodt, J., Model of Environmental Edu-
cation Teacher with Inspiration of Environmental
Conservation for Global Warming Alleviation, Euro-
pean Journal of Social Sciences, Vol.31, No.1, pp.92-
102, 2012.
[13] Saisunantharom, S. and Thiengkamol, N. and Thieng-
kamol, C., Casual Relationship Model of Biodiversity
Conservation, European Journal of Scientifi c Re-
search, Vol.104, No.3, pp.460-474, 2013.
[14] Suebsing, S. and Thiengkamol, N. and Thiengkamol,
C., Causal Relationship Model of Forest Conserva-

Vol 35. No 6, November-December 2016 Causal Relationship Model of Ecological Footprint Integrated
with Environmental Education
677
tion, European Journal of Scientific Research,
Vol.115, No.2, pp.292-304, 2013.
[15] Thiengkamol, N., Nurture Children to be Doctors,
Intelluals, Bangkok, 2011.
[16] Thiengkamol, N., Development of Model of Environ-
mental Education and Inspiration of Public Con-
sciousness Infl uencing to Global Warming Alleviation,
European Journal of Social Sciences, Vol.25, No.4,
pp.506-514, 2011.
[17] Thiengkamol, N., Causal Relationship Model of
Environmental Education and Psychological Trait,
Mediterranean Journal of Social Sciences, Vol.3,
No.11, pp.263-272, 2012.
[18] Thiengkamol, N., Model of Environmental Education
and Psychological Factors Based on Inspiration of
Public Consciousness Affecting to Global Warming
Alleviation, Mediterranean Journal of Social
Sciences, Vol.3, No.11, pp.435-444, 2012.
[19] Thiengkamol, N., Model of Environmental Education
and Psychological Factors Affecting to Global Warm-
ing Alleviation, Mediterranean Journal of Social
Sciences, Vol.3, No.11, pp.427-434, 2012.
[20] Tumpracha, K. and Thiengkamol, N. and Thieng-
kamol, C., Causal Relationship Model of Food Secu-
rity Management, Mediterranean Journal of Social
Sciences, Vol.3, No.11, pp.639-650, 2012.
[21] Udonboon, C. and Thiengkamol, N. and Thiengkamol,
C., Causal Relationship Model of Water Conservation
Behavior, Mediterranean Journal of Social Sciences,
Vol.3, No.11, pp.599-611, 2012.
[22] Wackernagel, M. and Rees, W. E., Our Ecological
Footprint: Reducing Human Impact on the Earth, New
Society Publisher: Gabriola Island, British Columbia,
1996.
[23] Wackernagel, M. and Monfreda, C. and Moran, D.
and Wermer, P. and Goldfi nger, S. and Deumling, D.
and Murray, M., National Footprint and Biocapacity
Accounts 2005: the Underlying Calculation Method,
Global Footprint Network, Oakland, 2005.
[24] Waewthaisong, S. and Thiengkamol, N. and Thieng-
kamol, C., Causal Relation Model of Environmental
Traveling Behavior, European Journal of Social Sci-
ences, Vol.33, No.2, pp.184-195, 2012.
[25] Wong, K. K., The Environmental Awareness of
University Students in Beijing, China.Journal of
Contemporary China, Vol.12, No.36, pp.519-536,
2003.
[26] World Wide Fund for Nature (WWF)., Europe 2005
The Ecological Footprint. World Wide Fund for Nature
(WWF) European Policy Offi ce, Brussels, 2005.
Original
1,2 Department of Biology, Faculty of Science, Mahasarakham University, Maha sarakham 44150, Thailand
* Tel +668 3361 9932 *Corresponding Author’s E-mail: [email protected] Department of Biotechnology, Faculty of Technology, Mahasarakham University, Maha sarakham 44150, Thailand
Acute and Sub-Acute Toxicity Studies of Hawm Nil Brown Rice Kefi r Powder
Supaporn Chunchom1 , Chusri Talubmook2 ,Sirirat Deeseenthum
Received: 30 December 2015; Accepted: 28 March 2016
Abstract
The present study was designed to determine acute and sub-acute toxicities of Hawm Nil brown rice kefi r powder
(HNKP) in male Wistar rats. In this acute toxicity study, HNKP at doses of 1,000, 2,000 and 4,000 mg/kg were once
administered to the rats orally. Symptoms of toxicity and mortality were observed within 24 h and over a further
period for 14 days. The results showed that all the doses of HNKP did not produce mortality or symptoms of toxicity.
HNKP at a dose of 1,000 mg/kg produced the best body weight gain, food intake and FCR. Moreover, blood biochemistry
including TP, Alb, Glob, BS, BUN, CREA, UA, TB, AST, ALT, and ALP, cholesterol, hematological values including
WBC, RBC, Hb, Hct, MCH, MCHC, MCV, and Plt, and relative organ weight (ROW) of the rats received all the doses
of HNKP did not differ from those in controls. In a sub-acute toxicity study, HNKP at the doses of 500, 1,000 and 2,000
mg/kg were given orally to the rats every 2 days for 14 days. Again, the result showed that all the doses did not
produce mortality or symptom of toxicity. HNKP at a dose of 500 mg/kg produced the best body weight gain, food
intake and FCR. Furthermore, the rats that received HNKP at this dose had blood biochemistry, cholesterol,
hematological values, and ROW close to those in controls. However, the rats received high doses of HNKP (1,000
and 2,000 mg/kg) and long term application altered Alb, Glob, BS, BUN, UA, AST, and ALP levels. These results
indicate that long term and high dose application of HNKP can affect renal and hepatic functions (p<0.05). In addition,
TG and HDL of the rats that received HNKP were signifi cantly (p<0.05) less than those in controls. Interestingly, the
rats that received HNKP had fewer neutrophils while lymphocytes were signifi cantly higher than that in controls (p<0.05).
These fi ndings indicate that Hawm Nil brown rice kefi r powder had no acute and sub-acute toxicities. However, long
term application at high doses (1,000 and 2,000 mg/kg) of HNKP may cause hepatic and renal dysfunctions. Its
activity on decreasing neutrophils and increasing lymphocytes resulted in increased globulin leads to improve
immunomodulatory activity.
Keywords: Hawm Nil rice, rice kefi r, acute toxicity, sub-acute toxicity, kefi r powder
Introduction
Kefi r is a fermented milk product. It contains lactic acid
bacteria, yeasts and acetic acid bacteria that produce
jelly-like grain. Kefi r grain is white or lightly yellow,
gelatinous irregular masses and sized between 0.3-3.5 cm.
diameter1-2. Both bacteria and yeasts are surrounded by
a water-soluble branched glucogalactan called kefi ran1.
Kefir has been reported to possess antibacterial3-7,
antifungal7, antitumor8, antioxidant5, 9-11, anti-allergic12,
antineoplastic and pro-digestive13-14, antidiabetic15-16, and
immunomodulatory activities17-18. Moreover, it is important
to anti-infl ammatory activity on the liver 19, lung12, 16, 20 and
colon21. Kefi r can modulate the intestinal mucosa immune
response. It induced the helper T cell type 2 response by
increasing the number of immunoglobulin A, interleukins
type 4, 6 and 10 cells, and induced simultaneously the
production of pro-infl ammatory cytokines (IFN γ and
TNFα) but without tissue damage17-18. It can also improve
lactose digestion and tolerance22. Fermented milk from
kefi r has high antioxidant activity and reduces the accu-

Vol 35. No 6, November-December 2016 Acute and Sub-Acute Toxicity Studies of Hawm Nil Brown Rice Kefi r Powder 679
mulation of reactive oxygen species (ROS) including
superoxide (O2.-), hydrogen peroxide (H2O
2) and nitric
oxide (NO·)23. In addition, kefi r has high nutritional value
as a source of proteins and calcium. It has a long tradition
of being regarded as good for health in many countries24.
Kefi r can be considered as a probiotic resource, as it
produces good activities for health.
Recently, the γ-aminobutyric acid (GABA),
α-tocopherol, γ-tocopherol and total phenolics compounds
(TPC) it is reported, has been found in Hawm Nil rice 25-26. Moreover, total phenolic content and total anthocyanin
content are found in Hawm Nil rice (Black) more than in
white and red colored rice27-28. In addition, it exerts high
levels of antioxidant activity28. Kefi r from rice milk has
higher antioxidant activity than cow’s milk5. The antioxidants
were higher in Kefi r produced from plants as a result of
the phenolic compounds presence in the plants29.
A toxicity study of medicines or plant products
should be carried out to see whether they are safe for
human application. The present study was therefore
designed to determine acute and sub-acute toxicity of
Hawm Nil brown rice kefi r powder in the rats.
Materials and methods
1. Hawm Nil brown rice, fermentation and
kefi r powder preparation
1.1 Hawm Nil brown rice: Hawm Nil brown
rice harvested during the year 2013-2014 from Selaphum,
Roi Et province, Thailand was used in this study. The rice
was dried, weighed, soaked in distilled water (1:5, W:V)
at 25°C for 2 h and thoroughly ground by using a
blender and fi ltrated to obtain rice milk. The rice milk was
pasteurized at 70°C for 15 min and then directly cooled
at 4°C.
1.2 Hawm Nil brown rice fermentation: A
0.2 g freeze-dried Kefi r grain was inoculated into 250 mL
fl ask with 200 mL of Lactobacilli de Man, Rogosa, and
Sharpe (MRS) broth and incubated under anaerobic
conditions; the fl ask was put into a 5L anaerobic jar. After
that the sample jars were kept at 30°C for 24 h, and then
centrifugation (1000×g, 15 min at 4°C) to obtain the cells.
The cells were washed and re-suspended in sterile saline
solution (0.85% NaCl) and then diluted with sterile 0.85%
NaCl (1:10; V:V). Subculture, kefi r starter was inoculated
into fresh milk (20:200; V:V) and incubated under aerobic
conditions at 30°C for 48 h to obtain activated kefi r grain.
Then activate kefi r grain were cultured and fermented by
inoculating into Hawm Nil brown rice milk adding with
2.5% sucrose (100:1,000, V:V) and incubated under
anaerobic conditions at 30°C for 24 h to get the fi nal pH
of about 4.8-4.9.
1.3 Hawm Nil brown rice kefir powder
(HNKP) preparation: the Hawm Nil brown rice milk kefi r was freeze-dried and powdered. The kefi r powder was
kept at -20°C until used.
2. Animals
Forty-eight male Wistar rats weighing 280-
300 g were purchased from the National Laboratory
Animal Center, Mahidol University, Thailand. The rats
were kept in an animal laboratory and acclimated for 7
days in environmental conditions (22-25°C, 50%-55%
humidity and under a 12-hour light/dark cycle). The rats
were fed with a standard diet (Perfect Companion Group
Co., Ltd.) and water ad libitum. All experimental protocols
were maintained in accordance with the Guidelines of
Committee Care and Use of Laboratory Animal Research,
National Research Council of Thailand and advice of the
Institutional Animal Care and Use Committee, Mahasara-
kham University, Thailand.
3. Acute toxicity study
Rats were weighed and divided randomly
into four groups with 6 rats in each; group 1; rats received
phosphate buffered saline (PBS) (control group), group
2, 3 and 4; rats received HNKP 1,000, 2,000 and 4,000
mg/kg respectively30. The doses of HNKP were once
administered to the rats orally. Symptom of Toxicity (sei-
zures, vomiting, diarrhea, and nausea) and rat mortality
were observed within 24 h and over a further period for
14 days. Body weight and food intake were recorded
daily. On day 14, the rats were fasted overnight, weighed
and sacrifi ced by overdoses of chloroform. Blood sample
was collected from the rat heart to determine blood bio-
chemistry and hematological values. Visceral organs in-
cluding liver, lung, heart, kidney and spleen were removed
and weighed.
Supaporn Chunchom et al. J Sci Technol MSU680
4. Sub-acute toxicity study
The rats were randomly divided into four
groups with 6 rats in each; group 1; rats received PBS
(control group), group 2, 3 and 4; rats received HNKP
500, 1,000 and 2,000 mg/kg respectively31. HNKP was
given orally to the rats every 2 days for 14 days. Symptoms
of toxicity were observed within 14 days. Body weight
and food intake were recorded daily. At the end of
experiments, the rats were fasted, weighed and then
euthanasia by overdose of chloroform. Blood samples
were collected from the rat hearts to determine blood
biochemistry values and hematological values. Visceral
organs including liver, lung, heart, kidney and spleen were
removed and weighed.
5. Relative organ weight and feed conversion
ratio
The relative organ weight (ROW) of each
animal was calculated using the following equation;
(1)
The feed conversion ratio (FCR) of each animal
was calculated as follow;
(2)
6. Determination of blood biochemistry and
hematological values
Blood samples were put into heparinized
and non-heparinized tubes. Blood was centrifuged at 1500
g for 10 min to separate serum. The serum from the
non-heparinized blood was assayed for biochemistry
including total protein (TP), blood sugar (BS), blood urea
nitrogen (BUN), creatinine (Crea), uric acid (UA), cholesterol
(CHO), triglycerides (TG), high density lipoprotein (HDL),
low density lipoprotein (LDL), albumin (Alb), globulin
(Glob), total bilirubin (TB), aspartate aminotransferase
(AST), alanine aminotransferase (ALT), and alkaline
phosphatase (ALP).
Heparinized blood was used for hematological
analysis. Hematological analysis included red blood cell
(RBC) count, white blood cell (WBC) count, hematocrit
(Hct), hemoglobin (Hb), mean corpuscular volume (MCV),
mean corpuscular hemoglobin (MCH), mean corpuscular
hemoglobin concentration (MCHC), platelets (Plt),
neutrophils (Neu), and lymphocytes (Lym).
7. Statistical analysis
The results were presented as mean±SEM
and analyzed using one-way ANOVA. The differences
among means were detected by using the Duncan’s
Multiple Range Test and values of p£0.05 were consi
dered statistically signifi cant.
Results and Discussion
1. Acute toxicity
1.1 Symptoms of toxicity, body weight gain,
food intake and FCR
All the doses of HNKP did not produce
any symptom of toxicity and mortality of the rats during
14 days. HNKP at a dose of 1,000 mg/kg produced the
best body weight gain, food intake and FCR (Fig.1A–1C).
Moreover, the rats received HNKP at a dose of 1,000 mg/
kg had hepatic and renal functions (Table 1), lipid profi le
(CHO, TG, HDL and LDL) (Table 2), hematological values
(Table 3), and ROW (data not shown) close to those in
controls. However, the rats received all the doses of
HNKP had neutrophils less than while lymphocytes were
higher than that in controls (p<0.05) (Table 3).
These fi ndings indicate that HNKP has
no acute toxicity on rats. Its activity on decreasing neu-
trophils and increasing lymphocytes resulting in increased
globulin leads to improve immunomodulatory activity17-18.
1.2 Blood biochemistry and ROW
Since, AST, ALT and ALP enzymes are
involved in hepatic function and TB, TP, Alb, Glob, BS,
BUN, CREA, and UA are involved in renal function32.
The results from acute toxicity study revealed that TB,
TP, Alb, Glob, BS; BUN, CREA, UA, AST, ALT, and ALP
enzymes in the rats received all the doses of HNKP did
not differ from those in controls (Table 1), suggesting that
HNKP had no effect on hepatic and renal functions.
Hyperlipidemia is well known as one of
the major risk factors for atherosclerosis which leads to
coronary artery disease (CAD)33. The total cholesterol

Vol 35. No 6, November-December 2016 Acute and Sub-Acute Toxicity Studies of Hawm Nil Brown Rice Kefi r Powder 681
was increased in the rats received HNKP at the doses of
2,000 and 4,000 mg/kg. However, TG, HDL and LDL were
not altered in the rats treated with all the doses of HNKP
compared to those in controls. These data indicate that
HNKP has an effect on total cholesterol but not on TG,
HDL and LDL (Table 2). The ROW in the rats treated with
HNKP did not differ from that in controls.
1.3 Hematological values
(Table 3), WBC, RBC, Hb, Hct, MCV,
MCH, MCHC, and Plt in the rats received HNKP did not
differ from those in controls. Interestingly, the rats that
received all the doses of HNKP had signifi cantly less
neutrophils while lymphocytes were signifi cantly higher
than that in controls (p<0.05), consistent with globulin
increased. Since the total WBC count did not change,
this result suggests that HNKP acts in opposite way in
the differentiation of hematopoietic cells by suppressing
neutrophils and stimulating lymphocytes. According to
previous reports, kefi r induced the helper T-lymphocytes
type 2 proliferations by increasing the number of immu-
noglobulin A (IgA), interleukins type 4, 6 and 10 cells17-18,
in agreement with the increase of lymphocyte and globu-
lin in this study.
Table 1 Blood biochemistry in rats treated with HNKP and PBS from acute toxicity study (mean±SEM).
Blood biochemistry PBS
HNKP (mg/kg)
1,000 2,000 4,000
BS (mg/dl) 182.33±23.55 176.67±38.09 214.83±21.09 235.33±25.04
BUN (mg/dl) 20.17±0.48 19.75±0.37 19.63±0.33 20.62±0.51
CREA (mg/dl) 0.91±0.03 0.88±0.02 0.85±0.02 0.87±0.02
UA (mg/dl) 3.91±0.55 3.72±0.31 3.65±0.31 4.12±0.07
TP (g/dl) 5.65±0.11 5.47±0.17 5.47±0.12 5.63±0.02
Alb (g/dl) 3.47±0.04 3.45±0.08 3.48±0.07 3.47±0.03
Glob (g/dl) 2.20± 0.06 2.25±0.06 2.18±0.05 2.17±0.04
TB (mg/dl) 0.11±0.01 0.09±0.01 0.09±0.00 0.09±0.00
AST (U/L) 147.67±3.95 143.83±4.80 152.83±1.08 143.50±2.79
ALT (U/L) 39.33±1.17 38.17±2.21 35.00±0.68 37.50±0.96
ALP (U/L) 124.33±3.06 118.67±3.01 123.00±2.31 126.00±5.39
TP = total serum protein; Alb = albumin; Glob = globulin; BS= blood sugar; BUN = blood urea nitrogen; CREA = creatinine; UA= uric acid;
TB= total bilirubin; AST = serum aspartate aminotransferase; ALT = serum alanine aminotransferase; ALP = alkaline phosphatase.
Figure 1 Body weight gain (A), food intake (B) and FCR (C) in rats treated with HNKP and PBS from acute toxicity
study at the end experiment (mean±SEM). Mean values with different letters are signifi cantly different,
Duncan’s test at p< 0.05.

Supaporn Chunchom et al. J Sci Technol MSU682
Table 2 Cholesterol (CHO), triglycerides (TG), high density lipoprotein (HDL) and low density lipoprotein (LDL) in rats
treated with HNKP and PBS from acute toxicity study (mean±SEM).
Lipid profi les PBS
HNKP (mg/kg)
1,000 2,000 4,000
CHO (mg/dl) 53.67±1.28a 56.50±1.91ab 58.67±0.88b 58.67±1.63b
TG (mg/dl) 130.00±2.62 127.33±4.14 123.50±3.64 123.17±4.73
HDL (mg/dl) 16.48±0.27 16.57±0.55 17.10±0.57 16.62±0.29
LDL (mg/dl) 32.50±2.11 32.00±0.68 32.17±0.98 35.33±0.88
Mean values within each row with different superscripts are signifi cantly different, Duncan’s test at p<0.05.
Table 3 Hematological values in rats treated with HNKP and PBS from acute toxicity study (mean±SEM).
Hematological values PBS
HNKP (mg/kg)
1,000 2,000 4,000
WBC (103 cell/mm3) 5.93±0.16 5.55±0.23 5.93±0.22 5.40±0.27
RBC (106 cell/mm3) 8.87±0.13 8.76±0.21 9.00±0.12 8.99±0.05
Hb (g/dl) 17.07±0.40 16.30±0.21 16.35±0.32 16.28±0.28
Hct (%) 53.83±0.87 52.67±1.31 51.83±1.14 51.50±0.22
MCV (fl ) 58.33±0.88 59.33±0.21 57.67±1.56 59.67±0.42
MCH (pg) 19.60±0.08 19.53±0.10 19.65±0.26 19.95±0.08
MCHC (g/dl) 32.33±0.34 32.55±0.21 33.07±0.46 33.13±0.18
Plt (103 cell/mm3) 943.17±27.15 904.50±13.18 883.00±23.23 924.83±17.63
Neu (%) 8.50±0.22c 6.17±0.17b 2.50±0.43a 2.33±0.33a
Lym (%) 91.00±1.21a 94.00±0.26b 97.00±1.21c 97.83±0.31c
Mean values within each row with different superscripts are signifi cantly different, Duncan’s test at p< 0.05. WBC = white blood cells; RBC
= red blood cells; Hb = hemoglobin; Hct = hematocrit; MCV = mean corpuscular volume; MCH = mean corpuscular hemoglobin; MCHC
= mean corpuscular hemoglobin concentration; Plt = platelets; Neu = neutrophils; Lym = lymphocytes.
Table 4 Blood biochemistry in rat treated with HNKP and PBS from sub-acute toxicity (mean±SEM).
Blood biochemistry PBS
HNKP (mg/kg)
500 1,000 2,000
BS (mg/dl) 207.67±11.25c 156.50±19.70b 128.67±9.30b 85.50±7.64a
BUN (mg/dl) 20.45±1.12c 19.27±0.71bc 17.53±0.55ab 16.47±0.27a
CREA (mg/dl) 0.82±0.03 0.90±0.07 0.78±0.03 0.83±0.03
UA (mg/dl) 2.65±0.34b 2.62±0.28b 1.65±0.25a 1.48±0.19a
TP (g/dl) 5.72±0.13 5.63±0.15 5.43±0.08 5.73±0.18
Alb (g/dl) 3.28±0.06b 2.72±0.05a 2.67±0.03a 2.67±0.05a
Glob (g/dl) 2.48±0.09a 2.73±0.05b 2.73±0.08b 3.02±0.06c
TB (mg/dl) 0.07±0.02ab 0.05±0.01a 0.05±0.01a 0.13±0.02b
AST (U/L) 104.00±1.53a 140.00±3.18b 151.67±5.16c 157.33±4.58c
ALT (U/L) 49.17±1.66 47.33±1.41 50.33±1.33 53.83±3.70
ALP (U/L) 132.83±4.66b 119.83±6.82ab 116.67±3.37a 112.67±3.25a
Mean values within each row with different superscripts are signifi cantly different, Duncan’s test at p< 0.05 (N=6). TP = total serum protein;
Alb = albumin; Glob = globulin; BS= blood sugar; BUN = blood urea nitrogen; CREA = creatinine; UA= uric acid; TB= total bilirubin; AST
= serum aspartate aminotransferase; ALT = serum alanine aminotransferase; ALP = alkaline phosphatase.

Vol 35. No 6, November-December 2016 Acute and Sub-Acute Toxicity Studies of Hawm Nil Brown Rice Kefi r Powder 683
Table 5 CHO, TG, HDL and LDL in rats treated with HNKP and PBS from sub-acute toxicity study (mean±SEM).
Lipid profi les PBS
HNKP (mg/kg)
500 1,000 2,000
CHO (mg/dl) 54.50±5.42 46.50±1.43 48.17±3.38 49.33±3.02
TG (mg/dl) 152.00±4.20b 109.00±4.56a 100.67±7.05a 94.33±4.62a
HDL (mg/dl) 22.55±1.04b 18.42±0.42a 16.93±0.84a 17.48±1.44a
LDL (mg/dl) 29.17±1.01 31.83±1.90 33.67±2.93 31.33±2.17
Mean values within each row with different superscripts are signifi cantly different, Duncan’s test at p< 0.05.
Figure 2 Body weight gain (A), food intake (B) and FCR (C) in rats treated with HNKP and PBS from sub-acute
toxicity study at the end experiment (mean±SEM). Mean values with different letters are signifi cantly
different, Duncan’s test at p< 0.05.
Table 6 Hematological values in rats treated with HNKP and PBS from sub-acute toxicity study (mean±SEM).
Hematological values PBS
HNKP (mg/kg)
500 1,000 2,000
WBC (103 cell/mm3) 6.42±0.28 5.77±0.43 6.50±0.26 5.60±0.40
RBC (106 cell/mm3) 8.76±0.13 8.38±0.14 8.63±0.41 8.13±0.18
Hb (g/dl) 17.52±0.23 16.70±0.35 16.88±0.44 16.32±0.47
Hct (%) 53.33±0.76 51.00±0.68 50.67±1.38 50.67±1.36
MCV (fl ) 59.33±0.49 59.50±0.43 59.33±0.42 59.33±0.33
MCH (pg) 19.98±0.28 19.90±0.17 19.80±0.27 20.05±0.26
MCHC (g/dl) 33.72±0.35 33.43±0.28 33.37±0.47 33.75±0.36
Plt (103 cell/mm3) 923.17±24.11 887.33±24.78 893.67±42.25 905.67±46.40
Neu (%) 8.83±1.01b 7.33±1.54ab 5.83±0.94ab 4.83±1.05a
Lym (%) 90.83±1.25a 91.83±1.87ab 95.17±0.87bc 96.33±0.71c
Mean values within each row with different superscripts are signifi cantly different, Duncan’s test at p< 0.05. WBC = white blood cells; RBC = red blood cells; Hb = hemoglobin; Hct = hematocrit; MCV = mean corpuscular volume; MCH = mean corpuscular hemoglobin; MCHC = mean corpuscular hemoglobin concentration; Plt = platelets; Neu = neutrophils; Lym = lymphocytes.

Supaporn Chunchom et al. J Sci Technol MSU684
2. Sub-acute toxicity
2.1 Symptoms of toxicity, body weight gain,
food intake and FCR
Again, the results showed that all the
doses of HNKP did not produce any symptom of toxicity
and mortality of the rats. HNKP at a dose of 500 mg/kg
produced the best body weight gain, food intake and FCR
(Figure 2A-2C). However, all the doses of HNKP had FCR
better than that in controls (p<0.05). Kefi r has been
widely used in clinical practice to promote growth13-14,24,
and may be a source of nutritional compounds. Hawm
Nil rice exerts high levels of antioxidant and phytochemical
activities than white and red rice25-28. Thus, HNKP is
suitable for further development as therapeutic agents for
growth promotion.
2.2 Blood biochemistry and ROW
The results of this study showed the
rats received HNKP at a dose of 500 mg/kg had hepatic
and renal functions close to those in controls. Furthermore,
the rats received high doses of HNKP (1,000 and 2,000
mg/kg) and long term were altered of Alb, Glob, BS, BUN,
UA, AST, and ALP levels. These results indicate that long
term and high doses application of HNKP can effect on
renal and hepatic functions (p<0.05) (Table 4). The serum
AST and ALP activities are widely used as sensitive
markers of possible tissue damage, particularly liver
toxicity34. Moreover, the triglycerides and HLD of the rats
received kefi r powder were signifi cant less than that in
controls (p<0.05). The decreasing of TG and HLD on rats
received HNKP may be cause from hepatic function
changing. However, the ROW in the rats treated with
HNKP did not differ from that in controls (data not shown).
2.3 Hematological values
In line with the acute toxicity study,
WBC, RBC, Hb, Hct, MCV, MCH, MCHC, and Plt in the
rats that received HNKP did not differ from those in
controls (Table 6). Nevertheless, the rats received all the
doses of HNKP had neutrophils signifi cant less than while
lymphocytes were signifi cant higher than that in controls
(p<0.05). These results confi rmed the non-toxicity of the
application of Hawm Nil brown rice kefi r powder at the
doses less than 4,000 mg/kg.
Conclusions
HNKP has no acute and sub-acute toxicities when a dose
less than 4,000 mg/kg is administered orally once, or a
dose less than 500 mg/kg is administrated every 2 days
for 14 days. In long term application, the powder at
doses higher than 1,000 mg/kg may cause hepatic and
renal functions as it produces Alb, BS, BUN, UA, and
ALP levels decreasing while Glob and AST levels increase
compared to those in controls. Furthermore, its activity
on decreasing neutrophils and increasing lymphocytes
resulting in increased globulin leads to improve immu-
nomodulatory activity.
Acknowledgement
The authors would like to acknowledge The
Department of Biotechnology, Faculty of Technology,
Mahasarakham University, Thailand for providing the
kefi r starter used in this study.
References
[1] Micheli, L., Uccelletti, D., Palleschi, C. and Crescenzi,
V., Isolation and characterization of a ropy Lactobacillus
strain producing the exopolysaccharide quefi ran.
Appl. Microbiol. Biotechnol., Vol.53, pp.69-74, 1999.
[2] Witthuhn, R.C., Schoeman, T. and Britz, T.J., Char-
acterisation of the microbial population at different
stages of kefi r production and kefi r grain mass cultiva-
tion. Int. Dairy J., Vol.15, pp.383-389, 2005.
[3] Bakken, J.S., Resolution of recurrent Clostridium
diffi cile-associated diarrhea using staggered anti
biotic withdrawal and kefi r. Minnesota Med., Vol.92,
No.7, pp.38-40, 2009.
[4] Carasi, P., Trejo, F.M., Pérez, P.F., Antoni, G.L. and
Serradell, M.A., Surface proteins from Lactobacillus
kefi r antagonize in vitro cytotoxic effect of Clostridium
diffi cile toxins. Anaerobe, Vol.18, pp.135-142, 2012.
[5] Deeseenthum, S. and Pejovic, J., Bacterial inhibition
and antioxidant activity of kefi r produced from Thai
Jasmine rice milk. Biotechnol., Vol.9, No.3, pp.332-
337, 2010.
[6] Kolakowski, P. and Ozimkiewicz, M., Kefi r grain toler-
ance to Escherichia coli: contamination-industrial

Vol 35. No 6, November-December 2016 Acute and Sub-Acute Toxicity Studies of Hawm Nil Brown Rice Kefi r Powder 685
advantages. Dairy Sci. Technol., Vol.92, pp.709-718,
2012.
[7] Rodrigues, K.L., Caputo, L.R.G., Carvalho, J.C.T.,
Evangelista, J. and Schneedor, J.M., Antimicrobial
and healing activity of kefi r and kefi ran extract. Int. J.
Antimicrobial Agents, Vol.25, No.5, pp.404-408, 2005.
[8] Moreno de LeBlanc, A., Matar, C., Farnworth, E. and
Perdigo´n, G., Study of immune cells involved in the
antitumor effect of kefi r in a murine breast cancer
model. J. Dairy Sci., Vol.90, pp.1920-1928, 2007.
[9] Kesenkaş, H., Dinkçi, N., Seçkin, K., Kinik, O. and
Gönç, S., Antioxidant properties of kefi r produced
from different cow and soy milk mixtures. J. Agri. Sci.,
Vol.17, pp.253-259, 2011.
[10] Liu, J.R., Chen, M.J. and Lin, C.W., Antimutagenic
and antioxidant properties of milk−kefi r and soymilk−kefi r. J. Agri. Food Chem., Vol.53, No.7, pp.2467-
2474, 2005a.
[11] Liu, J.R., Lin, Y.Y., Chen, M.J., Chen, L.J. and Lin,
C.W., Antioxidative activities of Kefi r. Asian Aust. J.
Ani. Sci., Vol.18, No.4, pp.567-573, 2005b.
[12] Lee, M.Y., Ahna, K.S., Kwon, O.K., Kim, M.J., Kim,
M.K., Lee, I.Y., Oh, S.R. and Lee, H.K., Anti-infl am-
matory and anti-allergic effects of kefi r in a mouse
asthma model. Immunobiol., Vol.212, pp.647–654,
2007.
[13] Saloff-Coaste, C., Kefi r. Danonne Newsletter, Vol.11,
pp.1-11, 1996.
[14] Urdaneta, E., Barrenetxe, J., Aranguren, P., Irigoyen,
A., Marzo, F. and Ibáñez, F.C., Intestinal benefi cial
effects of kefi r-supplemented diet in rats. Nutri. Res.,
Vol.27, pp.653-658, 2007.
[15] Hadisaputro, S., Djokomoeljanto, R.R.J., Judiono,
and Soesatyo M.E., The effects of oral plain kefi r supplementation on pro-infl ammatory cytokine prop-
erties of the hyperglycemia Wistar rats induced by
streptozotocin. Indonesian J. Int. Med., Vol.44, No.2,
pp. 100-104, 2012.
[16] Punaro, G.R., Maciel, F.R., Rodrigues, A.M., Rogero,
M.M., Bogsan, C.S.B., Oliveira, M.N., Ihara, S.S.M.,
Araujo, S.R.R., Sanches, T.R.C., Andrade, L.C. and
Higa, E.M.S., Kefi r administration reduced progres-
sion of renal injury in STZ-diabetic rats by lowering
oxidative stress. Nitric Oxide, Vol.37, pp.53–60, 2014.
[17] Vinderola, C.G., Duarte, J., Thangavel, D., Perdigon,
G., Farnworth, E. and Matar, C., Immunomodulating
capacity of kefi r. J. Dairy Res., Vol.72, pp.195–202,
2005.
[18] Vinderola, C.G., Duarte, J., Thangavel, D., Perdigon,
G., Farnworth, E. and Matar, C., Effects of kefi r frac-
tions on innate immunity. Immunobiol., Vol.211,
pp.149-156, 2006.
[19] Meydani, S.N. and Ha, W.K., Immunologic effects of
yogurt. Am. J. Clinic. Nutri., Vol.71, pp.861-872, 2000.
[20] Kwon, O.K., Ahn, K.S., Lee, M.Y., Kim, S.Y., Park,
B.Y., Kim, M.K., Lee, I.Y., Oh, S.R. and Lee, H.K.,
Inhibitory effect of kefi ran on ovalbumin-induced lung
infl ammation in a murine model of asthma. Arch.
Pharm. Res., Vol.31, No.12, pp.1590-1596, 2008.
[21] Bolla, P.A., Carasi, P., Bolla, M.A., Antoni, G.L. and
Serradell, M.A., Protective effect of a mixture of kefi r isolated lactic acid bacteria and yeasts in a hamster
model of Clostridium diffi cile infection. Anaerobe,
Vol.21, pp.28-33, 2013.
[22] Hertzler, S.R. and Clancy, S.M., Kefi r improves lac-
tose digestion and tolerance in adults with lactose
maldigestion. J. Am. Diet. Assoc., Vol.103, pp.582-
587, 2003.
[23] Kaizu, H., Sasaki, M., Nakajima, H. and Suzuki, Y.,
Effect of antioxidative lactic acid bacteria on rats fed
a diet defi cient in vitamin E. J. Dairy Sci., Vol.76,
pp.2493-2499, 1993.
[24] Farnworth, E. R., Kefi r: from folklore to regulatory
approval. J. Nutraceut., Funct. & Med. Foods, Vol.1,
pp.57-68, 1999.
[25] Moongngarm, A., Daomukda, N. and Khumpik, S.,
Chemical compositions, phytochemicals, and antioxi-
dant capacity of rice bran, rice bran layer, and rice
germ. APCBEE Procedia, Vol.2, pp.73-79, 2012.
[26] Moongngarm, A. and Saetung, N., Comparison of
chemical compositions and bioactive compounds of
germinated rough rice and brown rice. Food Chem.,
Vol. 122, pp.782-788, 2010.

Supaporn Chunchom et al. J Sci Technol MSU686
[27] Maisuthisakul, P. and Changchub, L., Effect of cook-
ing on total phenolic and anthocyanin contents of 9
genotypes from Thai rice grains. Agri. Sci. J., Vol.43,
No.2(Suppl.), pp.669-672, 2012.
[28] Suwannalert, P. and Rattanachitthawat, S., High
levels of phytophenolics and antioxidant activities in
Oryza sativa–unpolished Thai rice strain of Leum
Phua. Trop. J. Pharm. Res. August, Vol.10, No.4,
pp.431-436, 2011.
[29] McCue, P.P. and Shetty, K., Phenolic antioxidant
mobilization during yogurt production from soymilk
using kefir cultures. Process Biochem., Vol.40,
pp.1791-1797, 2005.
[30] Organisation of Economic Co-operation and Develop-
ment (OECD), The OECD Guideline for Testing of
Chemical: 420 Acute Oral Toxicity, OECD, Paris,
France, 2001.
[31] Organisation of Economic Co-operation and Develop-
ment (OECD), The OECD Guideline for Testing of
Chemical: 407 Repeated Dose Oral Toxicity-Rodent:
28-Day or 14-Day Study, OECD, Paris, France, 2001.
[32] Liju, V.B., Jeena, K. and Kuttan, R., Acute and
subchronic toxicity as well as mutagenic evaluation
of essential oil from turmeric (Curcuma longa L.).
Food. Chem. Toxicol., Vol.53, pp.52–61, 2013.
[33] Fuster, V., Eric, J., Nabel, E.G., Pathno-biology of
asymptomatic arthrosclerosis leading to sympto-
matic artherothrombosis. J. Am. Cardiol., Vol.46,
pp.937–941, 2005.
[34] Ramaiah, S.K., A toxicologist guide to the diagnostic
interpretation of hepatic biochemical parameters.
Food Chem. Toxicol., Vol.45, pp.1551–1557, 2007.

Original
1 Tourism Business Administration and Hotel, Faculty of Business and Industrial Service Administration, King Mongkut’s University of
Technology North Bangkok 129 M.21 T.Noenhom A.Muang Prachinburi 25230 Thailand
* Corresponding Author’s E-mail: Supisa.p@fi tm.kmutnb.ac.th, Uthumporn.r@fi tm.kmutnb.ac.th
Development of a Bike Trail as a Tourist Attraction in the Area of the Community Forest
of Ban Nonhinphueng
Supisa Phumdej1, Uthumporn Rueangrit1
Received: 30 December 2015; Accepted: 28 March 2016
Abstract
A study of ways to develop a of bike trail as a tourist attraction in the area of the community forest of Ban Nonhingphueng,
Tambon Dongbang, Amphoe Prachantakam, Prachinburi province was conducted. The study was to investigate
tourists’ opinions about a bike trail as a tourist attraction in the community. It was found that the tourists having no
experience participating in this kind of activity tend to be more satisfi ed than the experienced ones. With the
recommendation provided, ways of development based on a service marketing strategy, such as product varieties,
uniqueness, pattern and need conformation, clear signs of tourist attraction and activity trail, increasing garbage dump
spot and public relation channel, sale promotion inducing more buying, notifying activity sequence throughout the
activity based on the tourists participating in life styles and learning experience with the community in more
environmental friendly way, were proposed.
Keywords: development, prototype tourist, service market, creative tourism
Introduction
Based on an evaluation of, Tumbon Dongbang, Amphoe
Prachantakam, Prachinburi province conducted by
Faculty of Technology and Industrial Management joint
with Raks Thai Foundation, a bike trail is proposed as an
attraction in the area of the community forest in order to
support an ecosystem tourist attraction which benefi cially
consumes the community’s natural resources, develops
sustainable careers and provides income for the com-
munity. In order to realize whether the trail is appropriate,
the prototype activity should be held. Therefore, the
researcher joined with Raks Thai Foundation and pro-
vided the prototype activity “Ride to the forest, Pick
vegetables, and Visit community enterprise” to be aware
of the tourists’ opinions toward the bike trail in the area
of community tourist attraction and to further improve and
develop ways of sustainability.
Experimental
1. Tools and population
Questionnaires with a check list form based
on Likert’s scale and content analysis were mainly used
to collect data whereas an interview was used to store
data. The population was from the 50 prototype tourists
participating in activity provided on 28th February 2015
2. Statistics used in this research
2.1 Signifi cance level at 0.05
2.2 Descriptive statistics such as demo-
graphic data in check list form, frequency, percentage,
rating scale with data exposing the satisfaction level of
prototype activity participation, means, standard deviation,
content analysis related to opinions and recommendation
showing from highest to lowest.
2.3 Analytical statistics based on t-test (t) is
to fi nd the relation between variables of participating in
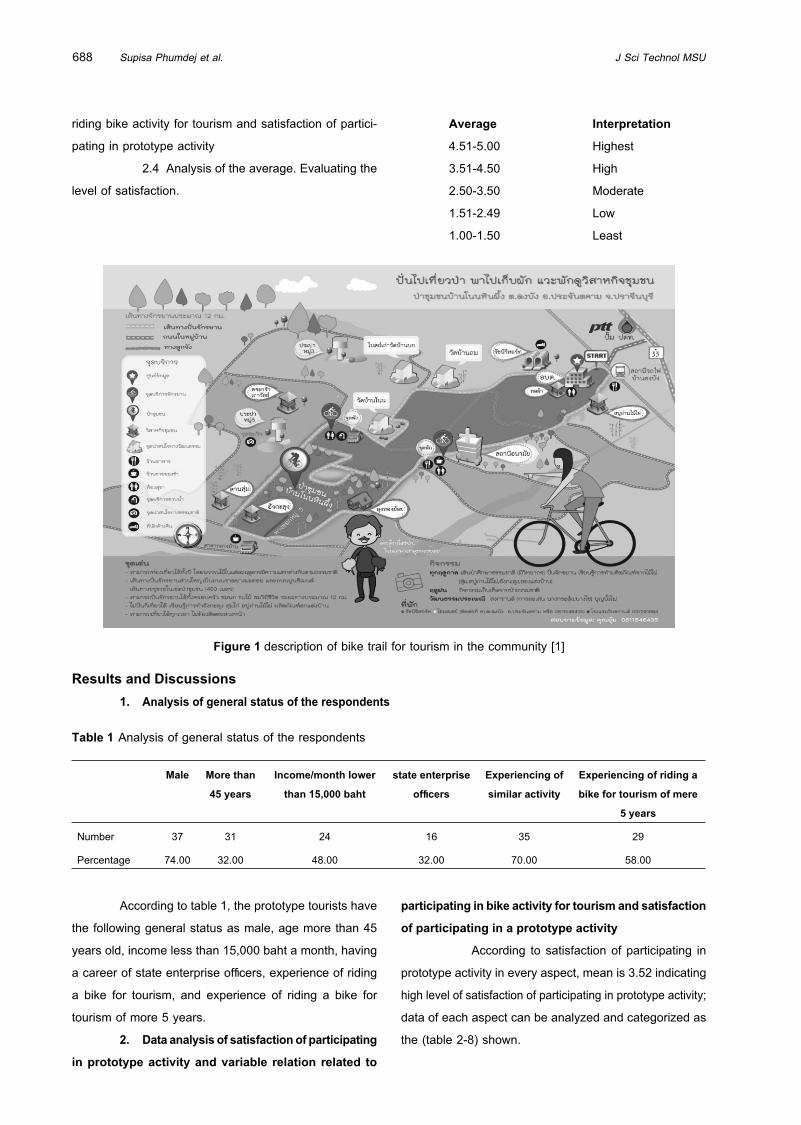
Supisa Phumdej et al. J Sci Technol MSU688
riding bike activity for tourism and satisfaction of partici-
pating in prototype activity
2.4 Analysis of the average. Evaluating the
level of satisfaction.
Average Interpretation
4.51-5.00 Highest
3.51-4.50 High
2.50-3.50 Moderate
1.51-2.49 Low
1.00-1.50 Least
Figure 1 description of bike trail for tourism in the community [1]
Results and Discussions
1. Analysis of general status of the respondents
Table 1 Analysis of general status of the respondents
Male More than
45 years
Income/month lower
than 15,000 baht
state enterprise
offi cers
Experiencing of
similar activity
Experiencing of riding a
bike for tourism of mere
5 years
Number 37 31 24 16 35 29
Percentage 74.00 32.00 48.00 32.00 70.00 58.00
According to table 1, the prototype tourists have
the following general status as male, age more than 45
years old, income less than 15,000 baht a month, having
a career of state enterprise offi cers, experience of riding
a bike for tourism, and experience of riding a bike for
tourism of more 5 years.
2. Data analysis of satisfaction of participating
in prototype activity and variable relation related to
participating in bike activity for tourism and satisfaction
of participating in a prototype activity
According to satisfaction of participating in
prototype activity in every aspect, mean is 3.52 indicating
high level of satisfaction of participating in prototype activity;
data of each aspect can be analyzed and categorized as
the (table 2-8) shown.

Vol 35. No 6, November-December 2016 Development of a Bike Trail as a
Tourist Attraction in the Area of the Community Forest of Ban Nonhinphueng
689
Table 2 Data analysis showing satisfaction level and relation between product variables
Prototype activities Data related to satisfaction level Relation of riding a bike experience and satisfaction
Mean S.D. Satisfaction t Mean Exp. Mean Inexp. Sig
Appropriateness of activity 3.76 0.72 High -1.483 3.53 3.86 0.15
Difference of activity type 3.64 0.75 High 0.573 3.73 3.60 0.57
Various kinds of activity 3.72 0.73 High 0.054 3.80 3.69 0.62
Total aspects of product 3.71 0.61 High -0.134 3.69 3.71 0.89
According to (Table 2), the prototype tourists
have high level of satisfaction to products of prototype
activity in every aspect; however, if it is categorized by
experience of participating in riding a bike activity for
tourism, the satisfaction level is signifi cantly indifferent at
0.05.
Table 3 Data analysis of satisfaction and relation between price variables
Prototype activities Data related to satisfaction level Relation of riding a bike experience and satisfaction
Mean S.D. Satisfaction t Mean Exp. Mean Inexp. Sig
Appropriateness of activity fee 3.26 1.45 Moderate 0.654 3.47 3.17 0.52
Appropriateness of distributed product 3.48 0.95 Moderate -1.271 3.13 3.63 0.22
Value acquired by activity participation 4.08 0.72 High -0.508 4.00 4.11 0.61
Total aspects of price 3.61 0.79 High -0.428 3.53 3.64 0.67
According to (Table 3), the prototype tourists
have high level of satisfaction to the cost of prototype
activity; however, the appropriateness of activity fee and
price of product distributed has a moderate level of
satisfaction. Nevertheless, if it is categorized by the
experience of participating in riding a bike activity for
tourism, the satisfaction level is signifi cantly indifferent at
0.05.
Table 4 Data analysis of satisfaction and relation between place variables
Prototype activities Data related to satisfaction level Relation of riding a bike experience and satisfaction
Mean S.D. Satisfaction t Mean Exp. Mean Inexp. Sig
Convenient access to activity 3.86 1.03 High 0.030 3.87 3.86 0.98
Safety of trail and activity participation 3.96 0.73 High -0.513 3.87 4.00 0.61
Clarity of directional signs and tourist
attraction spots
3.48 1.11 Moderate -1.248 3.13 3.63 0.23
Total aspects of place 3.77 0.77 High -0.871 3.62 3.83 0.39
According to (Table 4), the prototype tourists
have overall high level of satisfaction to place of prototype
activity; however, the clear signs and tourist attraction
spots have moderate satisfaction. Nevertheless, if it is
categorized by the experience of participating in riding a
bike activity for tourism, the satisfaction level is signifi -cantly indifferent at 0.05.

Supisa Phumdej et al. J Sci Technol MSU690
Table 5 Data analysis of satisfaction and relation between promotion variables
Prototype activities Data related to satisfaction level Relation of riding a bike experience and satisfaction
Mean S.D. Satisfaction t Mean Exp. Mean Inexp. Sig
Appropriateness of advertising and
public relation
3.24 1.33 Moderate -2.877 2.47 3.57 0.01*
Frequency of activity notifi cation 2.86 1.36 Moderate -3.203 2.00 3.23 0.00*
Appropriateness of sale promotion such
as discount, exchange, give-out, and
give in addition
3.14 1.36 Moderate -1.165 2.80 3.29 0.25
Total aspects of promotion 3.08 1.25 Moderate -2.576 2.42 3.36 0.01*
According to (Table 5), the prototype tourists
have an overall high level of satisfaction to promotion of
prototype activity; however, if it is categorized by the
experience of participating in riding a bike activity for
tourism, the satisfaction level of only one aspect of
appropriateness of a sale promotion such as a discount,
exchange, give-out, and give in addition, is signifi cantly
indifferent. Nevertheless, there is signifi cant difference
between the inexperienced tourists in riding a bike
activity for tourism having tendency to have more
satisfaction than the experienced tourists in riding a bike
activity for tourism at 0.05.
Table 6 Data analysis of satisfaction and relation between personnel variable
Prototype activities Data related to satisfaction level Relation of riding a bike experience and satisfaction
Mean S.D. Satisfaction t Mean Exp. Mean Inexp. Sig
Appropriateness of manners and
courtesy by the service provider.
3.70 1.49 High -1.450 3.13 3.94 0.16
Full of Knowledge, skill and experi-
ence throughout the activity.
3.60 1.38 High -1.142 3.20 3.77 0.27
Assistance in fi xing all kinds of prob-
lem throughout the activity session.
3.54 1.47 High -1.805 2.87 3.83 0.09
Total aspects of personnel 3.61 1.39 High -1.548 3.07 3.85 0.14
According to (Table 6), the prototype tourists
have a overall high level of satisfaction of personnel to-
ward prototype activity; however, if it is categorized by
the experience of participating in riding a bike activity for
tourism, the satisfaction level of prototype activity
participation is signifi cantly indifferent at 0.05 level.
Table 7 Data analysis of satisfaction and relation between creation and presentation of physical evidence variable
Prototype activities
Data related to satisfaction level Relation of riding a bike experience and satisfaction
Mean S.D. Satisfaction t Mean Exp. Mean Inexp. Sig
Appropriateness of activity duration 3.40 1.41 Moderate -1.688 2.80 3.66 0.11
Quickness of service provided through-
out activity
3.36 1.45 Moderate -1.596 2.87 3.57 0.12
Appropriateness of tourist attraction
and activity pattern
3.50 1.46 High -1.901 2.80 3.80 0.07
Creation and physical evidence
presentation
3.42 1.36 Moderate -1.769 2.82 3.68 0.09

Vol 35. No 6, November-December 2016 Development of a Bike Trail as a
Tourist Attraction in the Area of the Community Forest of Ban Nonhinphueng
691
According to (Table 7), the prototype tourists
have a overall moderate level of satisfaction of creation and
presentation of physical evidence to the prototype activity;
however, the appropriateness of tourist attraction and
activity pattern has high level of satisfaction. Nevertheless,
if it is categorized by the experience of participating in
riding a bike activity for tourism, the satisfaction level of
prototype activity is signifi cantly indifferent at 0.05
Table 8 Data analysis of satisfaction and relation between process variable
Prototype activities
Data related to satisfaction level Relation of riding a bike experience and satisfaction
Mean S.D. Satisfaction t Mean Exp. Mean Inexp. Sig
Appropriateness of step of activity
participation
3.42 1.30 Moderate -2.041 2.87 3.66 0.05*
Appropriateness of practical proce-
dure throughout activity
3.32 1.41 Moderate -1.646 2.73 3.57 0.12
Appropriateness of link between com-
munity tourism and nature
3.60 1.40 High -1.804 3.07 3.83 0.08
Total aspects of process 3.45 1.30 Moderate -1.755 2.89 3.69 0.10
According to (Table 8), the prototype tourists have
overall a moderate level of satisfaction of process toward
prototype activity; however, the appropriateness causing
the link between community tourist attraction and nature
have high level of satisfaction. Nevertheless, if it is
categorized by the experience of participating in riding a
bike activity for tourism, the satisfaction level of prototype
activity of all three aspects is signifi cantly indifferent.
However, the signifi cantly different aspect found that the
inexperienced tourists riding a bike activity for tourism
have more satisfaction level than the experienced ones
at 0.05.
Table 9 Data analysis related to opinions and recommendations
Recommendations Amount
Product
Distributed clothes should be more colorful or occasional. 6
Various products should be more; samples are not enough. 4
Price
It is proper. 8
Place
Directional signs should be added throughout the bike trail. 10
There are not enough garbage bins. 8
Shady construction should be added in every spot and construction maintenance should be regularly done for the
tourists’ convenience and pleasure.
4
Community forests should be conserved and expanded to the surrounding community. 3
Promotion
Public relation should be more. 6
Personnel
They are friendly, helpful, and impressive. 3
Creation and presentation of physical evidence
There is continuous presentation of public relation of activity through social network and TOT webpage or provincial
webpage and activity provision.
4
Process
Suitable. 3

Supisa Phumdej et al. J Sci Technol MSU692
4. Discussion
The marketing principle of the service
market was applied to cover all aspects: product, price,
place, promotion, personnel, creation and presentation of
physical evidence. The process and creative tourism
principle, a tourism pattern, enables the tourists or visitors
to develop or use their own potential or others creative
skills by participating in with determination and purpose-
fulness of ways and learning experience which the people
in the community always do; the tourists only volunteer
or take part in.
Except for the study of the provision of
prototype trail activity there are other studies with similar
results. Panya and his colleges4 conducted a research
revealing adventurous tourism management by using
mountain bikes within the community, and it was found
that not only more kinds of activities at the tourist attraction
induced more tourists to take community tours but also
the community is entitled to participate in their own career
promotion and arrange their own community story. These
similar results also appeared in the research conducted
by the Offi ce of Economic and Social Development Board
of North-East5 A way of ecosystem tourism promotion by
bike at Buddism Forest of Khoa Eto Waterfall Park,
Prachinburi6 shows that the environment is not infl uenced
by the pattern of activity provision.
5. Recommendation
The community should develop products with
more variety and unique design. However, the activity fee
of 300 baht with one free t-shirt would be more appro
priate if the pattern and need conformation is met. Moreover,
clear directional signs and activity trails, garbage dumping
spots, more public relation channels and sale promotion
to induce more product buying, and sequence notifi cation
of activity process to enhance clear understanding
throughout the program should be added.
Conclusion
The community should develop an activity
pattern, product, and tourists’ needs and community
conformation to enhance the tourists’ impression and
specify the niche of new tourists who have never
experienced this kind of activity since the description
shows that the inexperienced tourists tend to have
greater satisfaction than others.
Acknowledgement
Our appreciation and thanks to the Raks Thai
Foundation for their cooperation in terms of budget
support of prototype activity provision.
References
[1] Yanadhorn Teanthaworn, Supisa Phumdejand and
Preeyanut Yamjinda. (2015). Tourism potential
evaluation of, Tumbon Dongbang, Amphoe Prac
hantakam, Prachinburi province, Faculty of Technology
and Industrial Management, King Mongkut’s University
of Technology North Bangkok.
[2] Yupawan Wanwanich. (2011). Service market 4th
edition. Bangkok: Kasetsat University Publishing.
[3] Administration organization of special area, Creative
tourism tourists’ perception, readiness of activity
providers, and possibility of creative tourism in
Thailand. (2012).
[4] Mr. Panya Tiennawa and colleagues. (2011). Adven-
turous tourism management by using mountain bike
within community, Department of Industrial Manage-
ment, Faculty of Agricultural Technology, Phetchabun
Rajabhat University.
[5] Offi ce of Economic and Social Development Board
of North-East, Sustainable ecosystem tourism on the
green road a case study: North-East area, Offi ce of
National Economic and Social Development Board.
(2013).
[6] Taweepon Chaipong. (2014). A way of ecosystem
tourism support by using bike at Buddhist Forest,
Khoa Eto Waterfall Park, Prachin Buri province,
Department of Science Program in Exercise and
Sport Sciences, Faculty of Sport Sciences, Burapa
University.

Original
1 Division of Environmental technology, Mahasarakham University, Mahasarakham, 44150, Thailand2 Department of Chemistry, Faculty of Science, Naresuan University, Phitsanulok, 65000, Thailand3 Sustainable Environment and Energy Research Unit, Faculty of Environment and Resource Studies, Mahasarakham University,
Mahasarakham, 44150, Thailand
* Corresponding author E-mail: [email protected]
Effect of Calcination Time on Physical and Chemical Properties of CaO- catalyst Derived
from Industrial-eggshell Wastes
Teepakorn Pornchai1, Ajchara Imkum Putkham2 Apipong Putkham2,3*
Received: 1 December 2015; Accepted: 30 March 2016
Abstract
In this study, eggshell wastes from a hatchery industrial plant were carefully-calcined under air-atmosphere at 800 ºC
in the range of 1 to 4 hours. Then both physical and chemical properties of calcium oxide derived from calcination
of eggshell wastes were systematically characterized by XRF, XRD, SEM, particle size analyzer and gas adsorption
experiment. The XRF results and the XRD patterns indicate that all calcination times completely transformed the
eggshell wastes to be a crystalline calcium oxide phase with about 98 % w purity of calcium oxide. The SEM
characterization results indicate rod-liked porous surface on the obtained calcium oxide and size of surface pore are
slightly increased with increasing of calcination times. The Langmuir surface area of the obtained calcium oxides was
determined by N2 adsorption experiment at -195 °C. This experiment showed that the surface area of the obtained
calcium oxides is rapidly decreased from 14.9 to 2.0 m2/g with increasing of calcination times from 1 to 4 hour. These
results indicate that calcination time is one of the factors determining both physical and chemical properties of calcium
oxide. Additionally, this present study also provides a new optimum condition to produce calcium oxide from
industrial-eggshell wastes with both physical and chemical properties comparable to commercial calcium oxide.
Keywords: Calcium oxide, Catalyst, Eggshell
Introduction
In Thailand, large hatchery farms generate eggshell
wastes (about 6.6 tons per annum) and this waste
normally goes to landfi ll site. This waste management
scheme leads to several environmental concerns e.g.
landfi ll leachate, odor and methane emission from landfi ll. Furthermore, landfi ll site normally cause a crucial confl ict between hatchery farms and their neighbors. So, large
amount of eggshell wastes have to be managed properly.
Recently, eggshell has been extensively studied as a
starting material for preparing low-cost calcium oxide. This
is because calcium oxide is normally used as an environ-
mentally-friendly heterogeneous catalyst in a wide range
of processes, e.g. chemical synthesis, petrochemical
industry and biodiesel production process. In addition,
calcium oxide can be separated from product and can be
regenerated\reused in several cycles of production
process. Currently, researchers reported that high purity
of calcium oxide can be produced from eggshells due to
it contain with high content of CaCO3. Thermal decom-
position of eggshell above 700 °C is a facile method to
decompose eggshell in to carbon dioxide and calcium
oxide. Several synthesis conditions on thermal decompo-
sition of eggshell at different temperatures and under
different atmospheric conditions were reported. However,
the effect of calcination time on surface properties of
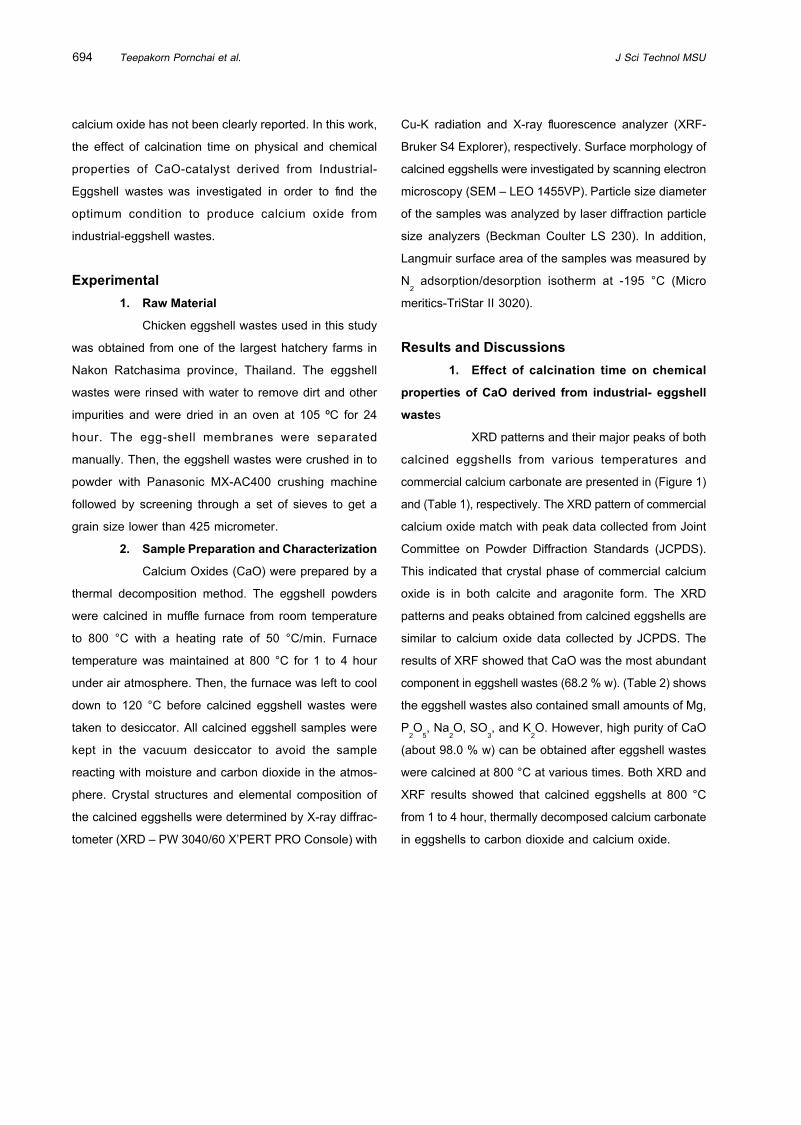
Teepakorn Pornchai et al. J Sci Technol MSU694
calcium oxide has not been clearly reported. In this work,
the effect of calcination time on physical and chemical
properties of CaO-catalyst derived from Industrial-
Eggshell wastes was investigated in order to fi nd the
optimum condition to produce calcium oxide from
industrial-eggshell wastes.
Experimental
1. Raw Material
Chicken eggshell wastes used in this study
was obtained from one of the largest hatchery farms in
Nakon Ratchasima province, Thailand. The eggshell
wastes were rinsed with water to remove dirt and other
impurities and were dried in an oven at 105 ºC for 24
hour. The egg-shell membranes were separated
manually. Then, the eggshell wastes were crushed in to
powder with Panasonic MX-AC400 crushing machine
followed by screening through a set of sieves to get a
grain size lower than 425 micrometer.
2. Sample Preparation and Characterization
Calcium Oxides (CaO) were prepared by a
thermal decomposition method. The eggshell powders
were calcined in muffl e furnace from room temperature
to 800 °C with a heating rate of 50 °C/min. Furnace
temperature was maintained at 800 °C for 1 to 4 hour
under air atmosphere. Then, the furnace was left to cool
down to 120 °C before calcined eggshell wastes were
taken to desiccator. All calcined eggshell samples were
kept in the vacuum desiccator to avoid the sample
reacting with moisture and carbon dioxide in the atmos-
phere. Crystal structures and elemental composition of
the calcined eggshells were determined by X-ray diffrac-
tometer (XRD – PW 3040/60 X’PERT PRO Console) with
Cu-K radiation and X-ray fl uorescence analyzer (XRF-
Bruker S4 Explorer), respectively. Surface morphology of
calcined eggshells were investigated by scanning electron
microscopy (SEM – LEO 1455VP). Particle size diameter
of the samples was analyzed by laser diffraction particle
size analyzers (Beckman Coulter LS 230). In addition,
Langmuir surface area of the samples was measured by
N2 adsorption/desorption isotherm at -195 °C (Micro
meritics-TriStar II 3020).
Results and Discussions
1. Effect of calcination time on chemical
properties of CaO derived from industrial- eggshell
wastes
XRD patterns and their major peaks of both
calcined eggshells from various temperatures and
commercial calcium carbonate are presented in (Figure 1)
and (Table 1), respectively. The XRD pattern of commercial
calcium oxide match with peak data collected from Joint
Committee on Powder Diffraction Standards (JCPDS).
This indicated that crystal phase of commercial calcium
oxide is in both calcite and aragonite form. The XRD
patterns and peaks obtained from calcined eggshells are
similar to calcium oxide data collected by JCPDS. The
results of XRF showed that CaO was the most abundant
component in eggshell wastes (68.2 % w). (Table 2) shows
the eggshell wastes also contained small amounts of Mg,
P2O
5, Na
2O, SO
3, and K
2O. However, high purity of CaO
(about 98.0 % w) can be obtained after eggshell wastes
were calcined at 800 °C at various times. Both XRD and
XRF results showed that calcined eggshells at 800 °C
from 1 to 4 hour, thermally decomposed calcium carbonate
in eggshells to carbon dioxide and calcium oxide.
Vol 35. No 6, November-December 2016 Effect of Calcination Time on Physical and Chemical Properties
of CaO-catalyst Derived from Industrial-eggshell Wastes
695
Figure 1 XRD patterns of commercial CaCO3 and calcined eggshell waste at 800 ◦C for 1 to 4 hr
Table 1 Major diffraction peaks of commercial CaO and calcined eggshell waste collected by XRD technique.
Sample Decomposition
temperature
Compound 2θ
JCPDS data [1] - CaCO3
29.4° 39.4° 43.2° 47.4° 48.5°
CaO 32.2° 37.3° 58.3° 64.1° 67.3°
Egg-shell wastes[2] 800 °C 2h CaO 32.3° 37.42° 53.92° 64.22° 67.42°
Egg-shell wastes
(this study)
As received
800 °C 1h
800 °C 2h
800 °C 3h
800 °C 4h
CaCO3
CaO
CaO
CaO
CaO
29.4° 39.5° 43.2° 47.6° 48.6°
32.2° 37.4° 53.9° 64.2° 67.4°
32.2° 37.4° 53.9° 64.2° 67.4°
32.2° 37.4° 53.9° 64.2° 67.4°
32.2° 37.4° 53.9° 64.2° 67.4°
Table 2 Chemical composition of the samples determined by X-ray fl uorescence spectrophotometer.
Element (%w) CaO-1 CaO-2 CaO-3 CaO-4 CaO [3] Eggshell
CaO
MgO
P2O
5
Na2O
SO3
K2O
97.9
0.977
0.543
0.223
0.111
0.065
98.0
0.984
0.530
0.162
0.107
0.034
97.9
1.01
0.579
0.171
0.116
0.045
97.9
1.01
0.532
0.161
0.120
0.036
97.42
1.63
0.52
-
0.26
0.08
68.2
0.459
0.396
0.103
0.105
0.0622
2. Effect of calcination time on physical
properties of CaO derived from industrial-eggshell
wastes
(Figure 2-3) shows SEM photographs of eggshell
and calcined eggshell wastes, respectively. It expressed
the rough surface of eggshell with some small pores while
calcined eggshell waste obtained from different calcination
times showed similar micromorphology of rod-liked or
dumbbell shaped. This rod-liked shape occurred during
thermal decomposition of carbonate contained in eggshell
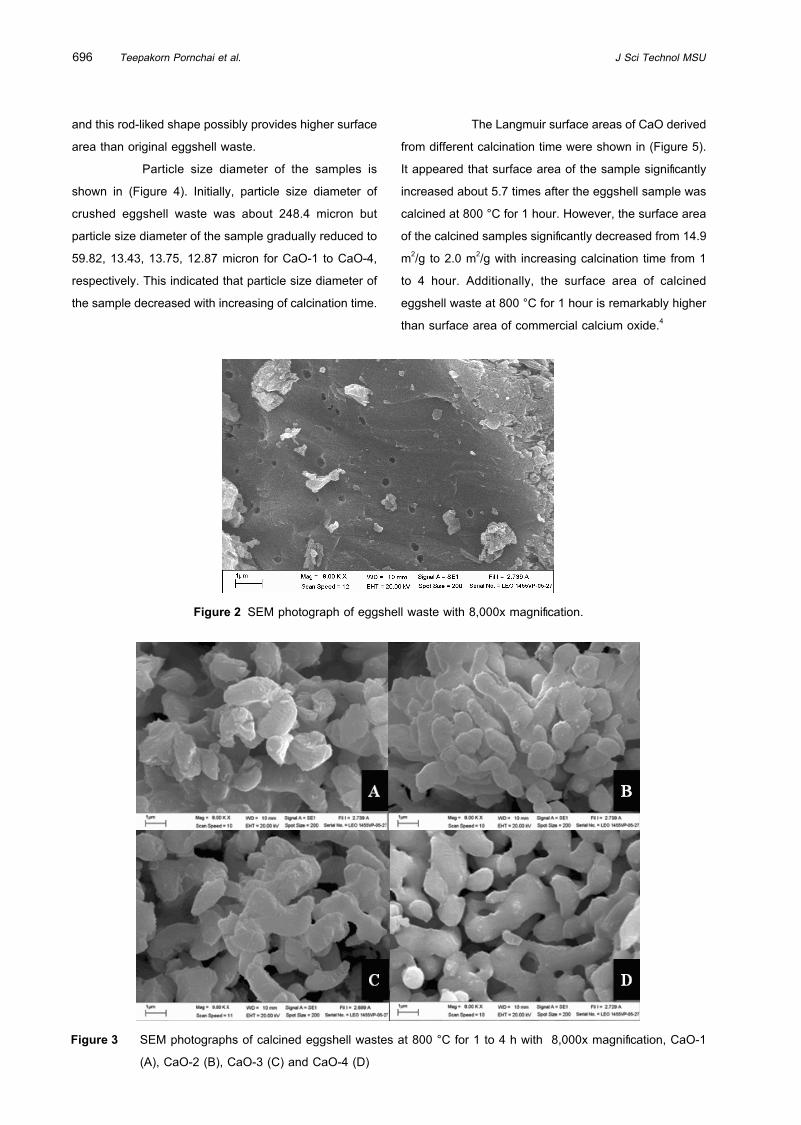
Teepakorn Pornchai et al. J Sci Technol MSU696
and this rod-liked shape possibly provides higher surface
area than original eggshell waste.
Particle size diameter of the samples is
shown in (Figure 4). Initially, particle size diameter of
crushed eggshell waste was about 248.4 micron but
particle size diameter of the sample gradually reduced to
59.82, 13.43, 13.75, 12.87 micron for CaO-1 to CaO-4,
respectively. This indicated that particle size diameter of
the sample decreased with increasing of calcination time.
The Langmuir surface areas of CaO derived
from different calcination time were shown in (Figure 5).
It appeared that surface area of the sample signifi cantly
increased about 5.7 times after the eggshell sample was
calcined at 800 °C for 1 hour. However, the surface area
of the calcined samples signifi cantly decreased from 14.9
m2/g to 2.0 m2/g with increasing calcination time from 1
to 4 hour. Additionally, the surface area of calcined
eggshell waste at 800 °C for 1 hour is remarkably higher
than surface area of commercial calcium oxide.4
Figure 2 SEM photograph of eggshell waste with 8,000x magnifi cation.
Figure 3 SEM photographs of calcined eggshell wastes at 800 °C for 1 to 4 h with 8,000x magnifi cation, CaO-1
(A), CaO-2 (B), CaO-3 (C) and CaO-4 (D)
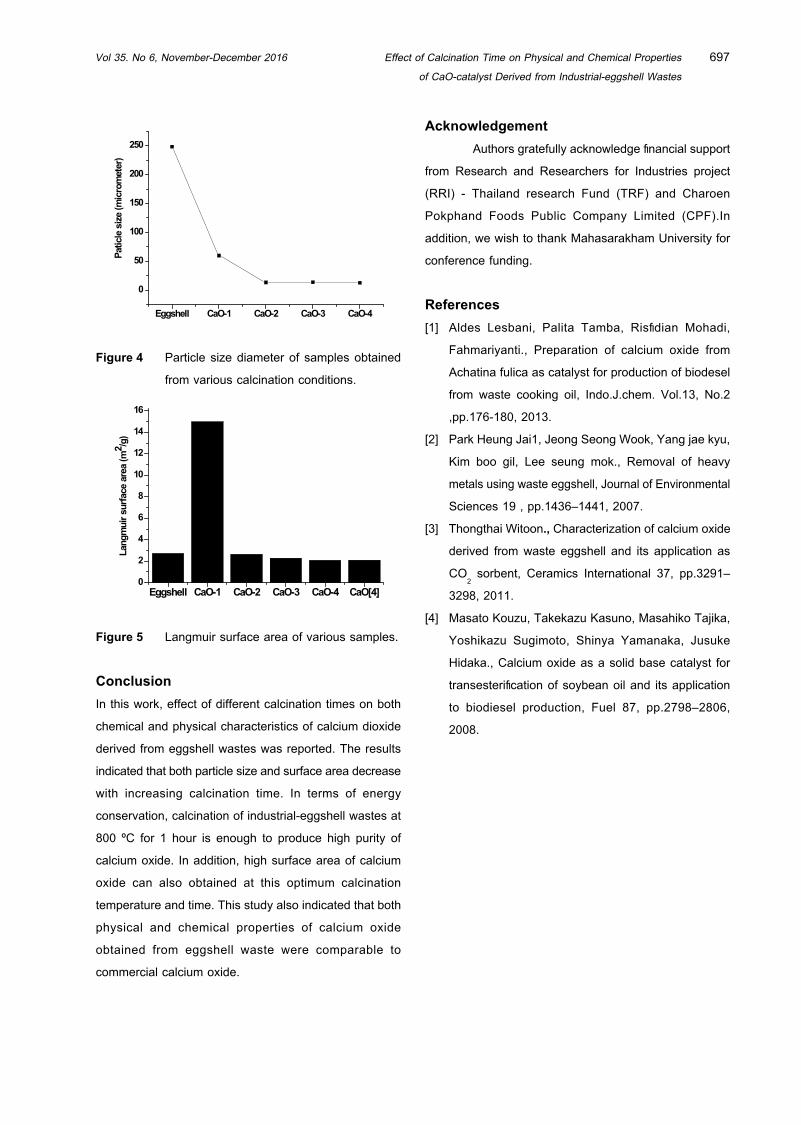
Vol 35. No 6, November-December 2016 Effect of Calcination Time on Physical and Chemical Properties
of CaO-catalyst Derived from Industrial-eggshell Wastes
697
Eggshell CaO-1 CaO-2 CaO-3 CaO-4
0
50
100
150
200
250
Patic
le s
ize
(mic
rom
eter
)
Figure 4 Particle size diameter of samples obtained
from various calcination conditions.
Eggshell CaO-1 CaO-2 CaO-3 CaO-4 CaO[4]0
2
4
6
8
10
12
14
16
Lang
mui
r sur
face
are
a (m
2 /g)
Figure 5 Langmuir surface area of various samples.
Conclusion
In this work, effect of different calcination times on both
chemical and physical characteristics of calcium dioxide
derived from eggshell wastes was reported. The results
indicated that both particle size and surface area decrease
with increasing calcination time. In terms of energy
conservation, calcination of industrial-eggshell wastes at
800 ºC for 1 hour is enough to produce high purity of
calcium oxide. In addition, high surface area of calcium
oxide can also obtained at this optimum calcination
temperature and time. This study also indicated that bot h
physical and chemical properties of calcium oxide
obtained from eggshell waste were comparable to
commercial calcium oxide.
Acknowledgement
Authors gratefully acknowledge fi nancial support
from Research and Researchers for Industries project
(RRI) - Thailand research Fund (TRF) and Charoen
Pokphand Foods Public Company Limited (CPF).In
addition, we wish to thank Mahasarakham University for
conference funding.
References
[1] Aldes Lesbani, Palita Tamba, Risfi dian Mohadi,
Fahmariyanti., Preparation of calcium oxide from
Achatina fulica as catalyst for production of biodesel
from waste cooking oil, Indo.J.chem. Vol.13, No.2
,pp.176-180, 2013.
[2] Park Heung Jai1, Jeong Seong Wook, Yang jae kyu,
Kim boo gil, Lee seung mok., Removal of heavy
metals using waste eggshell, Journal of Environmental
Sciences 19 , pp.1436–1441, 2007.
[3] Thongthai Witoon., Characterization of calcium oxide
derived from waste eggshell and its application as
CO2 sorbent, Ceramics International 37, pp.3291–
3298, 2011.
[4] Masato Kouzu, Takekazu Kasuno, Masahiko Tajika,
Yoshikazu Sugimoto, Shinya Yamanaka, Jusuke
Hidaka., Calcium oxide as a solid base catalyst for
transesterifi cation of soybean oil and its application
to biodiesel production, Fuel 87, pp.2798–2806,
2008.

Original
1,2Joint Graduate School of Energy and Environment, King Mongkut’s University of Technology Thonburi, Bangkok, Thailand
E-mail: [email protected]
Heat Transmission of Double-Pane Windows with Horizontal Slats for Thailand
Vichuda Mettanant1,*, Pipat Chaiwiwatworakul2
Received: 15 December 2015; Accepted: 30 March 2016
Abstract
An automated blind can provide energy saving and improve comfort. To obtain these benefi ts a computer program
that is able to calculate interior illuminance, heat gain, glare discomfort and thermal comfort has been developed. The
thermal performance of the window system was investigated. From the study it was found that installing a venetian
blind in between the double-pane glass window causes a signifi cant reduction in heat gain compared to the plain glass
window. The heat gain through the window system in the shortwave part of the radiation was analyzed. The slat
refl ectance, slat angle and solar profi le angle have the major effect on the shortwave part of solar heat gain coeffi cient.
The blind using a lower value of slat refl ectance has a lower shortwave part of solar heat gain coeffi cient. The effective
solar heat gain coeffi cient (SHGC) and the effective overall heat transfer coeffi cient (U) for the double-pane glassed
window with enclosed horizontal slats was developed. These SHGC and U value can be used with the equation to
calculate the Overall Thermal Transfer Value (OTTV) of Thailand’s building energy code to evaluate a
building that use the double-pane glassed window with enclosed venetian blind.
Keywords: automated blind, solar heat gain coeffi cient, overall heat transfer coeffi cient
Introduction
Venetian blinds are popular shading devices used in
commercial buildings. Blinds facilitate daylight into buildings
by blocking excessive light while views are still possible.
Utilization of daylight increases worker satisfaction and
productivity. For tropical climate or summer conditions
daylight is highly available and buildings are cooling load
dominated. Daylight can be used to replace electric light;
reduce electricity consumption for lighting and cooling
system. However heat gain due to solar radiation is an
important part of cooling load in Thailand.
Solar Heat Gain Coeffi cient (SHGC) measures
how much heat from the sun is blocked. It is the fraction
of incident irradiance that enters through the window and
becomes heat gain. It includes both the directly transmitted
portion and the absorbed and reemitted portion1,2. The
SHGC and the U values are signifi cant factors for rating
of fenestration2 and also used for building design and
rating3,4.
The results of Klems and Warner5 confi rmed that
the SHGC for fenestrations incorporating venetian blinds
depends strongly on the incident direction of beam solar
radiation. Using a single value of SHGC to characterize
window with blind systems would lead to nonsensical
energy choices. However, the study was conducted only
at few slat angles.
Therefore, in this study an investigation of
thermal performance of the window system was evaluated
and the effective SHGC and the effective U values were
developed and analyzed in detail based on weather of
Thailand.
Thermal Performance of Venetian Blind Window
System
The heat transfer through venetian blind window
system can be written as6

Vol 35. No 6, November-December 2016 Heat Transmission of Double-Pane Windows with Horizontal Slats for Thailand 699
q SHGC I U T u � u' (1)
Where q is the heat gain (W/m2). SHGC is the
solar heat gain coeffi cient. U is the overall heat transfer
coeffi cient (W/(m2-K)). ∆T is the temperature difference
between the indoor and outdoor condition (K). I is the
incident solar radiation (W/m2). The solar heat gain coeffi cient
for a venetian blind window system can be divided into
the solar heat gain coeffi cient in the shortwave part and
the solar heat gain coeffi cient in the longwave part.
In this analysis the effect of the slat refl ectance,
slat angle and solar profi le angle on the SHGC of the
direct solar radiation of the system of glass window and
blind are investigated. The solar profi le angle is the
relationship between the solar altitude angle and the
solar azimuth angle. The solar profi le angle can be written
as
1 tan( )tan
cos( )s
ss w
DIJ J
� § · ¨ ¸�© ¹
(2)
Where φs is the solar profi le angle, α
s is the
solar altitude angle. γs is the solar azimuth angle. γ
w is
the window azimuth angle. The solar heat gain coeffi cient
(SHGC) and the solar heat gain coeffi cient in the short-
wave part (ShW SHGC) for the fenestration system are
calculated from the developed mathematical model as
presented in7.
(Figures 1 to 3) show the variations of SHGC for
venetian blind at 0o, 45o and -45o, respectively. The SHGC
of the single pane clear glass window is also shown for
comparison. The results show that the SHGC of the clear
glass window and window with venetian blind are depend-
ent on the solar profi le angle. The dotted lines in (Figure
1-3) represent the shortwave transmittance for the direct
radiation indicated as solar heat gain coeffi cient in the
shortwave part (ShW SHGC). The differences between
the solid and dotted lines in (Figure 1 to 3) are the values
of longwave transmittance for the direct radiation, which
are shown as the values of the solar heat gain coeffi cient
in the long wave part.
Figure 1 SHGC and ShW SHGC of the window with the blind in different slat refl ectances when the slat is set at
0o. ref = slat refl ectance. Clear = clear glass window.
From the results the SHGC values of clear glass
pane are higher than the window with blinds. For a single
pane clear glass window, the values of solar heat gain
coeffi cient in the shortwave part are dominant and the
values of longwave part of SHGC are small when it is
compared to the window with blind. The ShW SHGC is
high when the slat is in the position that the slats are able
to refl ect radiation into the room. In any case, the values
of ShW SHGC are low at the low slat refl ectance values
because the slat can refl ect lower ration into the room.
The effect of slat refl ectance on SHGC is low
when the slat is in the position that solar radiation is not
incident on the slat or at the slat position that most of the
solar radiation is blocked by the slat.
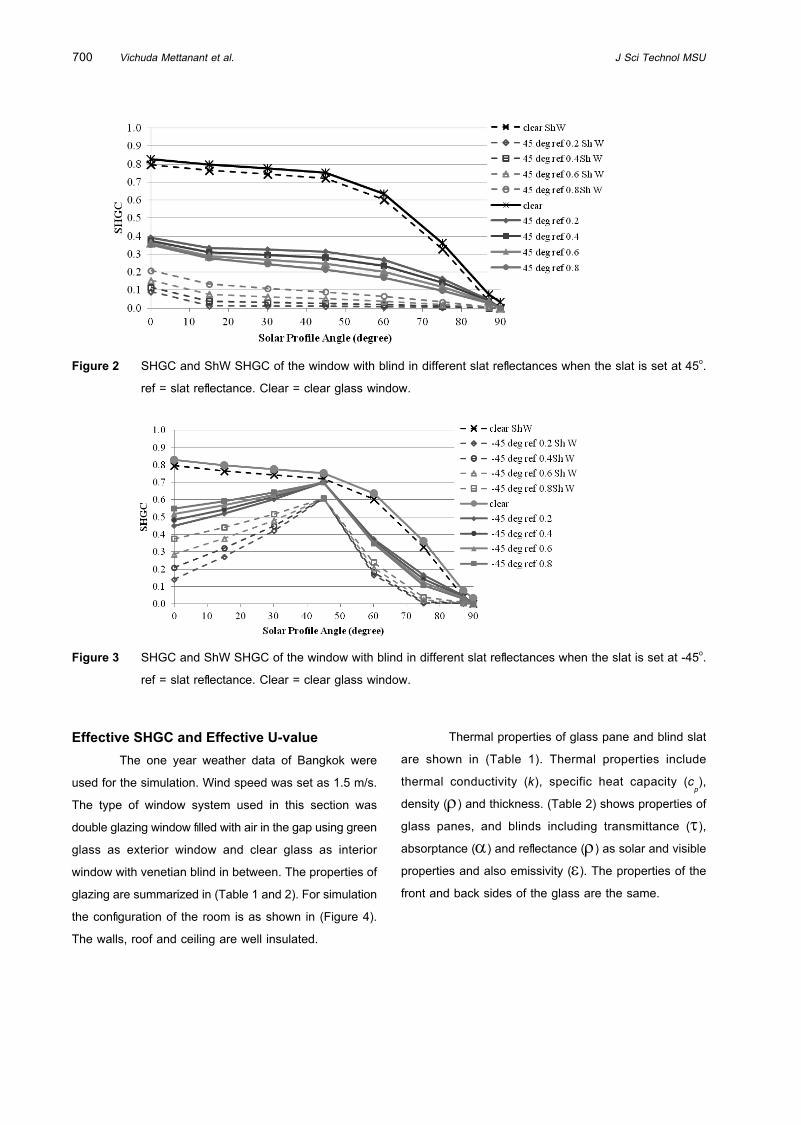
Vichuda Mettanant et al. J Sci Technol MSU700
Figure 2 SHGC and ShW SHGC of the window with blind in different slat refl ectances when the slat is set at 45o.
ref = slat refl ectance. Clear = clear glass window.
Figure 3 SHGC and ShW SHGC of the window with blind in different slat refl ectances when the slat is set at -45o.
ref = slat refl ectance. Clear = clear glass window.
Effective SHGC and Effective U-value
The one year weather data of Bangkok were
used for the simulation. Wind speed was set as 1.5 m/s.
The type of window system used in this section was
double glazing window fi lled with air in the gap using green
glass as exterior window and clear glass as interior
window with venetian blind in between. The properties of
glazing are summarized in (Table 1 and 2). For simulation
the confi guration of the room is as shown in (Figure 4).
The walls, roof and ceiling are well insulated.
Thermal properties of glass pane and blind slat
are shown in (Table 1). Thermal properties include
thermal conductivity (k), specific heat capacity (cp),
density (ρ) and thickness. (Table 2) shows properties of
glass panes, and blinds including transmittance (τ),
absorptance (α) and refl ectance (ρ) as solar and visible
properties and also emissivity (ε). The properties of the
front and back sides of the glass are the same.

Vol 35. No 6, November-December 2016 Heat Transmission of Double-Pane Windows with Horizontal Slats for Thailand 701
Figure 4 Building confi guration
Table 1 Thermal properties of glass panes and blind slat
Material k cp U� Thickness
W/m.K kJ/kg.K kg/m3 m
Glass pane 1.05 0.840 2500 0.006
Blind slat - 0.870 2700 0.001
Table 2 Solar and visible properties of glass panes and blind slat
Section W� D� U� H�
Clear glass (solar) 0.80 0.13 0.07 0.85
Clear glass (visible) 0.80 0.12 0.08 -
Green glass (solar) 0.26 0.68 0.06 0.85
Green glass (visible) 0.67 0.21 0.12 -
Blind slat(solar) 0 0.316 0.684 0.316
Blind slat (visible) 0 0.266 0.774 -
The blind chosen for this study was a 50 mm
venetian blind. The distance between the two glass panes
was 100 mm. Figure 5 shows the position of the blind
when the slat angle (β) is positive. (Figure 5) also illustrates
slat width and distance between each slat (slat separation)
which are 0.05 m and 0.042 m, respectively.

Vichuda Mettanant et al. J Sci Technol MSU702
0.042 m
0.05 m
Figure 5 Side view of two adjacent slats
The developed computer program was used to
calculate heat transfer through a double-pane window
with a blind. The values of monthly average of the window
heat gain are shown in (Figure 6). At high degrees of
blind angles such as -50, -60, 50, and 60 degree, heat
gain through window reduces because the blind slats are
almost close and beam radiation cannot penetrate through
the gaps between blind slats. It was found that there are
higher values of heat gain through the window system in
the cases of negative slat angles when comparing to the
cases of positive slat angles. When blind angles are
negative, there are higher chances that blind slats tilt
parallel to the direction of beam solar radiation so higher
heat passes through the window system.
Fig. 6. Monthly average heat gain through window (south orientation)
The effective SHGC and U-value are calculated
by using Equation 1 divided by the solar radiation incident
on window in vertical direction (I):
q TSHGC UI I
' � u (3)
(Figure 7) shows the plot of the ratio between
heat gain through window and the solar radiation incident
on window in vertical direction and the ratio between the
temperature difference between the indoor and outdoor
air and the solar radiation incident on window. Each dot
in the graph represents the data at a particular hour. The

Vol 35. No 6, November-December 2016 Heat Transmission of Double-Pane Windows with Horizontal Slats for Thailand 703
slope of the data in (Figure 7) is the U-value and the
intercept of the graph is the SHGC. One set of data in
the case of 0 degree blind angles in October is shown as
an example. Each graph provides the SHGC and the
U-value for a particular month and a particular slat angle.
p p
Figure 7 q/I and DT/I in October at 0 degree slat angle
The effective SHGC values and the effective
U-value of each month and each blind angle are shown
in (Figure 8 and 9), respectively. The results are analyzed
for the data during the daytime (8 a.m. to 7 p.m.) and the
profi le angles are in the range of 22-90 degree. The
yearly average profi le angle during daytime is 63 degree.
It is found that the results are high when the blind angles
are negative which are in an agreement with the results
show in (Figure 1 to 3).
When blind angles are negative, the shortwave
part of SHGC is dominant. When blind angles are positive,
the longwave part of SHGC is dominant because most
of the solar radiation is blocked by the slat.
During the daytime (8 a.m. to 7 p.m.), an average
temperature difference between the indoor and outdoor
conditions is 7.3 oC when the indoor temperature is set
as 25oC. When slat angles are positive, the effective
U-values are highest at 0o blind slat angle and decrease
when the blind angle increases. As the blind closes,
increasingly it blocks the direct exchange of longwave
radiation between the glass panes. This is probably the
dominant effect that causes the decrease in U-value as
the blind is closed.
Figure 8 The monthly effective SHGC of the double-pane window with blind
Figure 9 The monthly effective U-value of the double-pane window with blind

Vichuda Mettanant et al. J Sci Technol MSU704
Applications of Effective SHGC and U-value
The results of the effective SHGC and the ef-
fective U-value in the previous section can be used to
calculate the heat gain through the window (W/m2) by
Equation 1. The case of January 1st when blind angle is
-30o is selected as an example. The effective SHGC and
the effective U-value for January are 0.256 and 4.233,
respectively. The room air temperature is set as 25oC.
The ambient air temperature and solar radiation incident
on window on the selected day are shown in (Figure 10).
The heat transfer through the window on the selected day
is shown in (Figure 11). The heat transfer through the
window is calculated by the computer program based on
the heat balance equation and the radiative exchange
equation is also shown in (Figure 11) as dotted line. The
results from Equation 1 show good agreement with the
results from the computer simulation program at maximum
7.8% error.
Figure 10 Ambient air temperature and solar radiation incident on window of the example date
i h h f h h i d h l d
Figure 11 The heat transfer through window on the example date
The effective SHGC and the effective U-value in
(Figure 8 and 9) can also be used for calculation of the
Overall Thermal Transfer Value (OTTV) in the building
energy code of Thailand. The terms of the total thermal
transmittance (Uf) and the solar heat gain coeffi cient
(SHGC) of the OTTV equation can be calculated when
double-pane windows with venetian blind are used.
Conclusion
The SHGC and U-value for calculation of heat transfer
through window systems was developed.
The directly transmitted portion of Solar Heat
Gain Coeffi cient (SHGC) and the SHGC that includes the
both directly transmitted portion and absorbed and reemit-
ted portion of SHGC were analyzed. The results show
that the SHGC are dependent on the solar profi le angle
and blind refl ectance. The monthly effective SHGC values
and the monthly effective U-value of white aluminum blind
are developed. The heat transfer through window esti-
mated from the developed effective SHGC and effective
U-value show well agreement with the heat transfer
through window calculated by the computer program that

Vol 35. No 6, November-December 2016 Heat Transmission of Double-Pane Windows with Horizontal Slats for Thailand 705
based on the heat balance equation and the radiative
exchange equation at maximum 7.8% error. These SHGC
and U value can be used to calculate the Overall Thermal
Transfer Value (OTTV) of Thailand’s building energy code
for a building that use the double-pane glassed window
with enclosed venetian blind.
References
[1] ASHRAE, ASHRAE Handbook Fundamentals,
American Society of Heating, Refrigerating and Air-
Conditioning Engineers, Inc. Atlanta, Georgia, 2005.
[2] The National Fenestration Rating Council, Energy
Rating, Retrieved from www. nfrc.org, 2015.
[3] Li, D. H.W., Lam, J. C., Solar heat gain factors and
the implications to building designs in subtropical
regions, Energy and Buildings, Vol. 32, No. 1, pp.
47–55, 2000.
[4] Chirarattananon, S. and Taveekun, J, An OTTV-
based Energy Estimation Model for Commercial
Buildings in Thailand, Energy and Buildings Journal,
Vol .36, pp. 680-689, 2004.
[5] Klems, J. H. and Warner, J. L., Solar Heat Gain
Coeffi cient of Complex Fenestrations With a Venetian
Blind for Differing Slat Tilt Angles, ASHRAE Transac-
tions , Vol. 103, No. 1, 1997.
[6] Chaiyapinunt, S. and Khamporn, N., Heat transmission
through a glass window with a curved venetian blind
installed, Solar Energy, Vol. 110, pp.71–82, 2014.
[7] Fathoni, A.M., and Chaiwiwatworakul, P (2011)
Double-Pane Window with Internal Fixed-Angle Slats
for Daylight Application in the Tropics, Master-degree
Thesis, Joint Graduate School of Energy and Environ-
ment, King’s Monkut University of Technology,
Thonburi.

Instruction for Authors
Research manuscripts relevant to subject matters outlined in the objectives are accepted from all
institutions and private parties provided they have not been preprinted elsewhere. The context of the papers may
be revised as appropriate to the standard. Vol.1 (January-February) Vol.2 (March-April) Vol.3 (May-June) Vol.4
(July-August) Vol.5 (September-October) Vol.6 (November-December)
Preparation of manuscripts:1. Manuscripts can be written in either Thai or English with the abstract in both Thai and Ehglish. Papers
should be specific, clear, concise, accurate, and consistent. English language manuscripts should be checked by
an English language editor prior to submission.
2. Manuscripts should be typed in MS word ".doc" or ".rtf" (Rich Text) on standard size paper, A4 or
8.5x11 inches, and arranged in two columns: single space for English, double space for Thai language.
3. Browallia font type is required with font siqe as follows:
Title the article: 18 pt. Bold
Name(s) of the authors: 16 pt.
Main Heading: 16 pt. Bold
Sub-heading: 14 pt. Bold
Body of the text: 14 pt
Footnotes for authors and their affiliations: 12pt.
4. The number of pages to 15, including references, tables, graphs, or pictures.
5. Types of munuscripts accepted: research articles and review articles.
6. Organization of research articles.
Title: denoted in both Thai and English, must be concise and specific to the point, normally less than 100
characters.
Name(s): of the author(s) and their affiliation must be given in both Thai and English.
Abstract: This section of the paper should follow an informative style, concisely covering all the important findings
in the text. Authors should attempt to restrict the abstract to no more than 250 words.
Keywords: Give at least 4-5 concise words.
The body of the text comprises the following headings:
Introduction: A summary of who is doing what, why where, and when?
Materials and Methods: A discussion of the materials used, and a description clearly detailing how the experiment
was undertaken, e.g., experimental desigh, data collection and analysis, and interpretation.
Results: Present the output. Li the information in complicated, add tables, graphs, disgrams etc., as necessary.
Discussion and Conclusion: Discuss how the results are relevant to the objectives or former findings, why?
Finally state what recommendations could be drawn.

Tables, figures,diagrams, pictures: should be screened for those important to support the findings, and
separated from the text. Captions should be placed above the tables but under the figures.
Acknowledgement: the name of the persons, organization, or funding agencies who helped support the research
are acknowledged in this section.
References: listed and referred to in vancouver style.
(http://www.library.uq edu.au/training/citation/vancouv.thml)
7. Authors of review articles should follow the typical format style. This includes an introduction, the body
of content, conclusion, and references.
Submission of manuscripts Manuscripts can be submitted to the Editorial Board, Department of Research Support and Development,
Mahasarakham University, Khamriang Subdistrict, Kantarawichai District,
Maha Sarakham Province, 44150. Tel: 0-43754416 or 0-43754416 ext. 1339. Fax: 0-43754416.
The author should submit the original paper and one copy together with a written disc.
Review of manuscripts: 1. The editorial board will review all manuscripts for format compliance. Manuscripts formatted
incorrectly will be returned to the author for correction.
2. Following submission of the corrected manuscript, the Peer Review Committee will review and offer
comments
3. Manuscripts receiving the approval of the Peer Review Committe may be returned to the author for
revision as advised by the Committee. Manuscripts failing to adopt the Committee's suggestions will not be
published.

ใบสมัครเปนสมาชิกวารสารวิทยาศาสตรและเทคโนโลยีมหาวิทยาลัยมหาสารคาม
วันที่............เดือน.......................................พ.ศ..............
ชือ่-นามสกลุ ......................................................................................................................................................................
ทีอ่ย ูบานเลขที.่...............หมูที.่............ถนน.....................................................แขวง/ตาํบล...............................................
อําเภอ.....................................................จังหวัด.....................................................รหัสไปรษณีย.....................................
โทรศัพท.............................................โทรสาร...........................................E-mail.............................................................
หนวยงาน.........................................................................................................................................................................
........................................................................................................................................................................................
........................................................................................................................................................................................
ถนน..................................................แขวง/ตําบล...................................................อําเภอ................................................
จังัหวดั.....................................................รหสัไปรษณยี.................................................โทรศพัท......................................
❏ สมัครเปนสมาชิกหนึ่งป คาสมัคร 400 บาท
❏ สมัครเปนสมาชิกสองปติดตอกัน คาสมัคร 800 บาท
ทานสามารถส่ังจายธนาณัติหรือตั๋วแลกเงิน สั่งจาย ปณ.ทาขอนยาง ในนาม:
นางฉวีวรรณ อังครรคะเศรษฐัง กองสงเสริมการวิจัยและบริการวิชาการ มหาวิทยาลัยมหาสารคาม ตําบลขามเรียง อําเภอกันทรวิชัย จังหวัดมหาสารคาม 44150
✄

Membership Application FormJournal of Science and Technology Mahasarakham University
Date.................................................................
Name (Last)......................................................................(First)......................................................................................
Mailing Address...............................................................................................................................................................
........................................................................................................................................................................................
Sub-district...................................................................... District..............................................................................
Province (City/state)........................................................ Country.............................................................................
Postal Code..................................................................... E-mail Address.................................................................
Telephone No.................................................................. Fax No.............................................................................
❏ One-Year membership (400 Baht)
❏ Two Year Membership (800 Baht)
Please send your personal check or money order to the following address:
Mrs.Chaweewan Akkasesthang, Division of Research Supprt and Development, Boromarachakumaree
Building, Khamriang Sub-district, Kantharawichai District, Maha Sarakham Province 44150
พิมพที่ : หจก. โรงพิมพคลังนานาวิทยา โทร.043-328589-91 โทรสาร 043-328592 Email : [email protected]
✄


![Semiphoras vnd Schemhamphoras Salomonis Regis [1686]](https://img.pdfslide.us/doc/110x75/56d6bf301a28ab3016953bee/semiphoras-vnd-schemhamphoras-salomonis-regis-1686.jpg)