Embed Size (px)
Citation preview

A
FooDSFOOD DEMAND SURVEY
Volume 3, Issue 12: April 15, 2016
Food Demand Survey | Oklahoma State University | [email protected] Lusk | Regents Professor & Willard Sparks Endowed Chair | 405-744-7465
Susan Murray | Research Specialist | 405-744-4857This project is supported by a Willard Sparks Endowment, the Oklahoma Agricultural Experiment Station, and the
Agricultural and Food Research Initiative Competitive Program of the USDA National Institute of Food and Agriculture.
FooDS tracks consumer preferences and sentiments on the safety, quality, and price of food at home and away from home with particular focus on meat demand. FooDS is a monthly on-line survey with a sample size of at least 1,000 individuals, weighted to match the US population in terms of age, gender, education and region of residence. See the online technical document for more details.
About the Survey
Compared to last month, willingness-to-pay (WTP) decreased for all food products fell. The greatest percent decrease from one month ago was for hamburger at -9.5%. Compared to one year ago, WTP is lower for all meat products.
MEAT DEMAND
Expenditures on food eaten at home decreased slightly from March to April and expenditures on food purchased away from home increased 5.42% relative to last month. Compared to last month, consumers expect to see higher prices for beef, chicken, and pork. Plans for eating out remained virtually unchanged compared to last month, while plans to buy chicken, beef, and pork all slightly fell.
FOOD EXPENDITURES
Willingness-to-Pay
Steak Chicken Breast
Hamburger Pork Chop Deli Ham Chicken Wing
Beans & Rice
Pasta
Last Year:April 2015
$8.02 $5.59 $4.46 $3.97 $2.51 $2.42 $2.33 $3.61
Last Month:March 2016
$7.76 $5.53 $4.52 $4.02 $2.45 $2.79 $3.10 $3.51
April 2016 $7.47 $5.29 $4.09 $3.94 $2.33 $2.76 $3.07 $3.31
% change(March - April)
-3.74% -4.34% -9.51% -1.99% -4.90% -1.08% -0.97% -5.70%
Current weekly at home
Current weekly away from home
Anticipated change in at home in next 2 weeks
Anticipated change away from home in next 2 weeks
April 2015 $97.05 $53.02 -0.21% -1.24%
March 2016 $98.51 $52.58 -0.28% -1.22%
April 2016 $97.17 $55.43 -0.50% -1.22%
% change(March - April)
-1.36% 5.42% -------- --------

Food Demand Survey | Oklahoma State University | [email protected] Lusk | Regents Professor & Willard Sparks Endowed Chair | 405-744-7465
Susan Murray | Research Specialist | 405-744-4857This project is supported by a Willard Sparks Endowment, the Oklahoma Agricultural Experiment Station, and the
Agricultural and Food Research Initiative Competitive Program of the USDA National Institute of Food and Agriculture.
Consumer Expectations FooDS Page 2
GMO’s, E. coli, and Salmonella remained the most visible issues in the news over the past two weeks. The largest percent increase in awareness over the last month was for cloning. Among the most visible issues, the largest percent decrease from March to April was for Salmonella. Salmonella, E. coli, and hormones were ranked as the top three concerns during April. The largest percent increases in concern were for pink slime and GMOs. The largest percent decrease in concern was for BSE. The issue “cancer and meat consumption” was added to the lists and its presence will continue in future months.
AWARENESS & CONCERN TRACKING
Awareness of Food Issues

Food Demand Survey | Oklahoma State University | [email protected] Lusk | Regents Professor & Willard Sparks Endowed Chair | 405-744-7465
Susan Murray | Research Specialist | 405-744-4857This project is supported by a Willard Sparks Endowment, the Oklahoma Agricultural Experiment Station, and the
Agricultural and Food Research Initiative Competitive Program of the USDA National Institute of Food and Agriculture.
Concern for Food Issues FooDS Page 3
Taste, safety, and price remained consumers’ most important values when purchasing food this month. Consumers’ food values remained similar to those in past months, with slight decreases in perceived values of price and nutrition and increases in perceived values of fairness and convenience. Similar to previous months, consumers reported that their main challenge was finding affordable foods that fit within their budget. Finding foods my children will eat was the challenging experiencing the largest percentage increase. In April 6.21% of participants reported having food poisoning, a 10% decrease from one month ago.
GENERAL FOOD VALUES
Consumer Challenges Consumer Values
Food Demand Survey | Oklahoma State University | [email protected] Lusk | Regents Professor & Willard Sparks Endowed Chair | 405-744-7465
Susan Murray | Research Specialist | 405-744-4857This project is supported by a Willard Sparks Endowment, the Oklahoma Agricultural Experiment Station, and the
Agricultural and Food Research Initiative Competitive Program of the USDA National Institute of Food and Agriculture.
FooDS Page 4
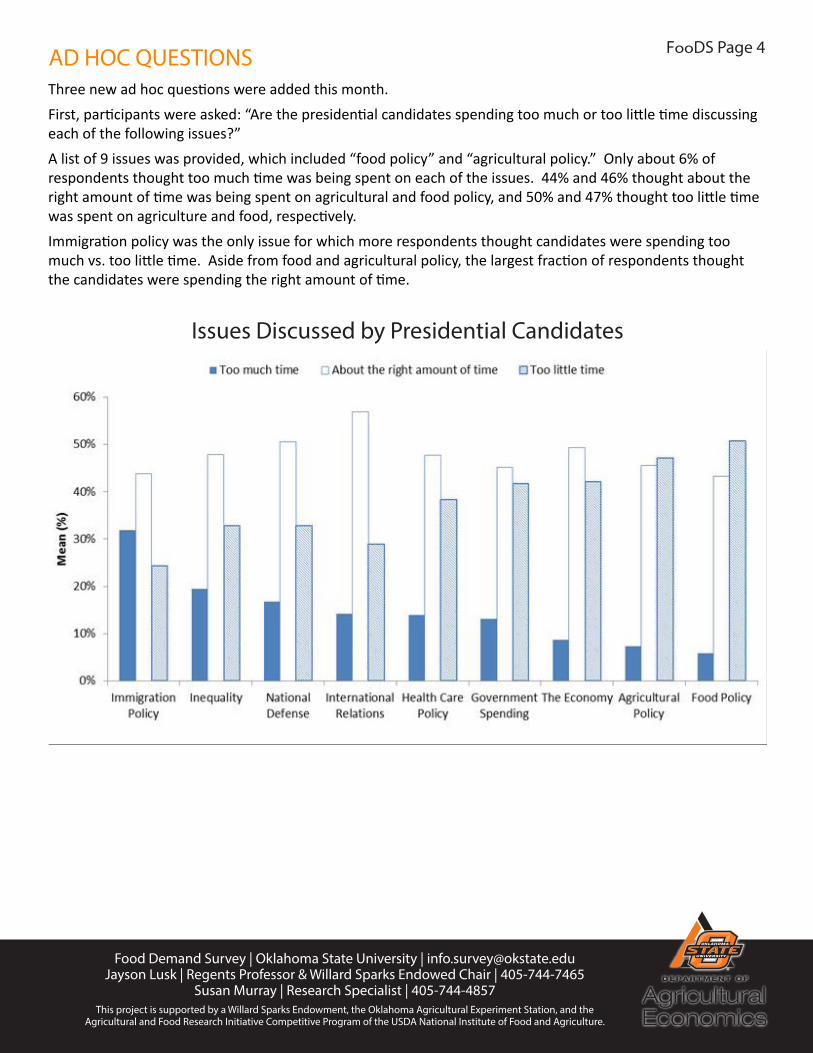
Three new ad hoc questions were added this month. First, participants were asked: “Are the presidential candidates spending too much or too little time discussing each of the following issues?” A list of 9 issues was provided, which included “food policy” and “agricultural policy.” Only about 6% of respondents thought too much time was being spent on each of the issues. 44% and 46% thought about the right amount of time was being spent on agricultural and food policy, and 50% and 47% thought too little time was spent on agriculture and food, respectively. Immigration policy was the only issue for which more respondents thought candidates were spending too much vs. too little time. Aside from food and agricultural policy, the largest fraction of respondents thought the candidates were spending the right amount of time.
AD HOC QUESTIONS
Issues Discussed by Presidential Candidates

Food Demand Survey | Oklahoma State University | [email protected] Lusk | Regents Professor & Willard Sparks Endowed Chair | 405-744-7465
Susan Murray | Research Specialist | 405-744-4857This project is supported by a Willard Sparks Endowment, the Oklahoma Agricultural Experiment Station, and the
Agricultural and Food Research Initiative Competitive Program of the USDA National Institute of Food and Agriculture.
FooDS Page 5
Secondly, participants were asked “Should the government’s role in regulating the US food system be more active, less active, or the same?”. Over half of the participants (59%) believe that the government should become more active in regulating the US food system, while less than 13% of participants believe the government should be less active in regulating the US food system.
AD HOC QUESTIONS
Government Involvement in the US Food System

Food Demand Survey | Oklahoma State University | [email protected] Lusk | Regents Professor & Willard Sparks Endowed Chair | 405-744-7465
Susan Murray | Research Specialist | 405-744-4857This project is supported by a Willard Sparks Endowment, the Oklahoma Agricultural Experiment Station, and the
Agricultural and Food Research Initiative Competitive Program of the USDA National Institute of Food and Agriculture.
FooDS Page 6
Last, respondents were asked the question, “To what extent do you agree or disagree with the following statements”. Respondents were asked to respond to a list of nine statements related to the perceived taste, affordablility, and health of fruits and vegetables that are either fresh, frozen, or canned.In terms of taste, fresh rated higher than frozen, which was rated higher than canned. All three had a mean score above 3, meaning respondents were more likely than not to agree that all three types of fruits and vegetables were tasty. In terms of affordability, the ranking was exactly reversed with canned being perceived as most affordable and fresh least affordable (although all three were far about the mean of 3, implying most consumers though all three were affordable. Finally, perceived health lined up almost exactly with perceived tasted: fresh was perceived as healthier than frozen which was perceived healthier than canned.
AD HOC QUESTIONS
Perceptions of Fresh, Frozen, and Canned Fruits and Vegetables