Embed Size (px)
Citation preview

M E D I C A L S U R V E I L L A N C E M O N T H L Y R E P O R T
msmrmsmr
A publication of the Armed Forces Health Surveillance Center
NOVEMBER 2013
Volume 20Number 11
P A G E 2 Syncope among U.S. Air Force Basic Military Trainees, August 2012-July 2013 Bryant Webber, MD, MPH; Thomas Cropper, DVM, MPVM, DACVPM; Susan Federinko, MD, MPH
P A G E 5 Syncope, active and reserve components, U.S. Armed Forces, 1998-2012
P A G E 1 0 Update: motor vehicle-related deaths, active and reserve components, U.S. Armed Forces, 1999-2012
P A G E 1 5 Surveillance snapshot: bacterial meningitis among beneficiaries of the Military Health System, 1998-2013
P A G E 1 6 Surveillance snapshot: age and gender distribution of service members, active component, U.S. Armed Forces, compared to the U.S. population, 2011
S U M M A R Y T A B L E S A N D F I G U R E S
P A G E 1 7 Deployment-related conditions of special surveillance interest

Report Documentation Page Form ApprovedOMB No. 0704-0188
Public reporting burden for the collection of information is estimated to average 1 hour per response, including the time for reviewing instructions, searching existing data sources, gathering andmaintaining the data needed, and completing and reviewing the collection of information. Send comments regarding this burden estimate or any other aspect of this collection of information,including suggestions for reducing this burden, to Washington Headquarters Services, Directorate for Information Operations and Reports, 1215 Jefferson Davis Highway, Suite 1204, ArlingtonVA 22202-4302. Respondents should be aware that notwithstanding any other provision of law, no person shall be subject to a penalty for failing to comply with a collection of information if itdoes not display a currently valid OMB control number.
1. REPORT DATE NOV 2013 2. REPORT TYPE
3. DATES COVERED 00-00-2013 to 00-00-2013
4. TITLE AND SUBTITLE Medical Surveillance Monthly Report, Vol 20, Number 11
5a. CONTRACT NUMBER
5b. GRANT NUMBER
5c. PROGRAM ELEMENT NUMBER
6. AUTHOR(S) 5d. PROJECT NUMBER
5e. TASK NUMBER
5f. WORK UNIT NUMBER
7. PERFORMING ORGANIZATION NAME(S) AND ADDRESS(ES) Medical Surveillance Monthly Report (MSMR),Armed Forces HealthSurveillance Center,11800 Tech Road, Suite 220 (MCAF-CS),Silver Spring,MD,20904
8. PERFORMING ORGANIZATIONREPORT NUMBER
9. SPONSORING/MONITORING AGENCY NAME(S) AND ADDRESS(ES) 10. SPONSOR/MONITOR’S ACRONYM(S)
11. SPONSOR/MONITOR’S REPORT NUMBER(S)
12. DISTRIBUTION/AVAILABILITY STATEMENT Approved for public release; distribution unlimited
13. SUPPLEMENTARY NOTES
14. ABSTRACT
15. SUBJECT TERMS
16. SECURITY CLASSIFICATION OF: 17. LIMITATION OF ABSTRACT Same as
Report (SAR)
18. NUMBEROF PAGES
21
19a. NAME OFRESPONSIBLE PERSON
a. REPORT unclassified
b. ABSTRACT unclassified
c. THIS PAGE unclassified
Standard Form 298 (Rev. 8-98) Prescribed by ANSI Std Z39-18

M S M R Vol. 20 No. 11 November 2013 Page 2
Documented civilian rates are lower. Th e Framingham Off spring study found rates of 2.6 and 4.7 per 1,000 p-yrs for males and females, respectively, between the ages of 20 and 29 years.6 In younger individuals, prominent syncopal triggers are warm envi-ronments (31% of events), prolonged stand-ing (27%), pain (25%), illness (18%), alcohol (13%), emotion (11%), and venipuncture/seeing blood (10%).7
Th is report summarizes counts, rates, etiologies, and surrounding circumstances for syncopal and pre-syncopal events among U.S. Air Force basic military trainees over a one-year surveillance period.
M E T H O D S
Cases of syncope and pre-syncope were ascertained from the Joint Base San Anto-nio (JBSA)-Lackland disease and non-battle injury database, which synthesizes diag-noses made in the electronic health record during all trainee medical encounters with demographic information from the basic military training (BMT) personnel fi le. Th e database was queried for International Classifi cation of Diseases, Ninth Revision, Clinical Modifi cation (ICD-9-CM) diag-nostic code 780.2 (“syncope and collapse”) to identify cases. A trainee could be a case only once during the surveillance period of 1 August 2012 through 31 July 2013.
For all cases identifi ed by this query, retrospective electronic chart reviews were performed to determine the circumstances surrounding the event, the week of train-ing (WOT) in which it occurred, comor-bid conditions diagnosed and laboratory values found during the workup (specifi -cally hemoglobin, glucose, and electro-lyte levels), whether or not an injury was sustained, and whether or not the event prompted military separation (i.e., entry level separation or medical evaluation board). In accordance with standard ref-erence values, anemia was defi ned as a hemoglobin concentration of <13.5 g/dL in
Syncope Among U.S. Air Force Basic Military Trainees, August 2012-July 2013
Syncope is a common event with many possible etiologies, ranging from benign to severe. Syncopal episodes of any origin, however, may result in traumatic injury due to postural collapse. Based on the prevalence of inter-nal and external stressors during training, basic military trainees may be at increased risk for syncope. Between 1 August 2012 and 31 July 2013, there were 112 unique individuals who experienced syncopal or pre-syncopal events among basic military trainees at Joint Base San Antonio-Lackland, Texas, the only basic training site in the U.S. Air Force. Th e overall rate was 19.6 cases per 1,000 person-years (18.4 and 36.1 per 1,000 person-years in males and females, respectively). Based upon the fi ndings of electronic chart review of the 112 cases, a majority of events occurred either during or immediately aft er exercise (n=38) or during a blood draw, immunization, or laceration repair (n=22). Th e most common etiologies were judged to be neurocardiogenic (n=54) and orthostatic hypotension (n=40), and two cases were attributed to cardiovascular disease. Th ese fi ndings support current pre-ventive measures, including anemia screening during medical in-processing, an emphasis on hydration throughout training, and a padded fl oor in the trainee vaccination bay.
syncope is a transient loss of conscious-ness due to impaired global cerebral perfusion. Th is hypoperfusion can be
traced to a number of factors, broadly cat-egorized into three etiologic classes: refl ex-mediated; orthostatic; and cardiovascular.1 Th e fi rst category – which represents the largest fraction of cases among individuals of all ages – can be further subdivided into neurocardiogenic syncope, situational syn-cope (e.g., during urination), and carotid sinus hypersensitivity.2 Nonetheless, in order to rule out cardiovascular disease as the underlying cause, the evaluations of patients who have experienced syncope oft en include electrocardiograms, echo-cardiograms, and 24-hour Holter monitor-ing1,3 – costly diagnostics in terms of dollars spent and, for military trainees, training time interrupted.
A pre-syncopal state, characterized by lightheadedness, diaphoresis, nausea, and blurred vision without loss of con-sciousness, precedes some, but not all epi-sodes of syncope. During pre-syncope, the
individual or nearby witnesses may be able to prevent injury by preparing for postural collapse. Even in the presence of witnesses, distinguishing between syncope and pre-syncope may be diffi cult; moreover, given their similar etiologies, the two conditions oft en prompt the same kind of diagnostic evaluation.3
Over a third of individuals will experi-ence a syncopal event at some point in their lives, with a peak incidence of fi rst cases occurring between the ages of 10 and 35 years.4 Between 1998 and 2012, the crude incidence rate of syncope among active component members of the U.S. Armed Forces was 7.2 per 1,000 person-years (p-yrs). Rates were higher among females and highest in those aged <20 years. Among males and females in this age cohort, respec-tive rates were approximately 13 and 40 per 1,000 p-yrs. Immunizations were found to be a major trigger of events among young, newly enlisted personnel, and incidence of postvaccination syncope was correlated to the number of immunizations delivered.5
Bryant J. Webber, MD, MPH (Capt, USAF); Th omas L. Cropper, DVM, MPVM, DACVPM (Col, USAF, Ret); Susan P. Federinko, MD, MPH (Lt Col, USAF)

November 2013 Vol. 20 No. 11 M S M R Page 3
F I G U R E 1 . Syncopal and pre-syncopal events by circumstances and gender, U.S. Air Force Basic Military Trainees, August 2012-July 2013
aOne of the syncopal events occurred during a laceration repair
0
5
10
15
20
25
30
35
40
Exer
cise
/pos
t-exe
rcis
e
Bloo
d dr
aw,
imm
uniz
atio
n, e
tc.
Stan
ding
in fo
rmat
ion
or m
eal l
ine
Sitti
ng in
cla
ss o
r dor
m
In fu
ll ch
emic
alpr
otec
tive
clot
hing
Dur
ing
urin
atio
n
Dur
ing
vom
iting
Unk
now
n
No.
r of t
rain
ees
Male
Female
a
aThe fi ve situational causes of syncope were urination (n=4) and vomiting (n=1).
males or <12.0 g/dL in females, hypoglyce-mia as a random glucose concentration of <70 mg/dL at the time of initial evaluation, hyponatremia as <135 mEq/L, and hypoka-lemia as <3.5 mEq/L.8 For the sake of more detailed analysis, anemia was further strati-fi ed according to hemoglobin concentra-tions, with diff erent criteria among males and females, as severe (<11.5 g/dL and <10.0 g/dL, respectively), moderate (11.5-12.9 g/dL and 10.0-11.4 g/dL, respectively), and borderline (13.0-13.4 g/dL and 11.5-11.9 g/dL, respectively).
Using denominator data provided by the 737th Training Support Squadron, period prevalence rates were calculated, where period was defi ned by the 8.5-week BMT session. It was assumed that all train-ees completed exactly 8.5 weeks of training (i.e., no attrition and no prolonged training).
R E S U L T S
Among the 34,791 basic military train-ees at JBSA-Lackland between 1 August 2012 and 31 July 2013, there were 112 cases of syncope or pre-syncope, for a period prevalence of 3.2 per 1,000 trainees (3.0 per 1,000 male trainees and 5.9 per 1,000 female trainees). Under the assumptions outlined above, the overall incidence rate was 19.6 per 1,000 p-yrs, and the rates for males and females were 18.4 and 36.1 per 1,000 p-yrs, respectively. Th irty-one cases (28%) were specifi cally classifi ed by the health care provider as pre-syncope; the remaining 81 cases were either classifi ed as syncope or were not further distinguished in the patients’ medical records. Th e major-ity of events occurred either during or immediately aft er exercise (n=38) or dur-ing a blood draw, immunization, or lacera-tion repair (n=22). Seventeen events (15%) occurred while the trainee was standing in formation or in a meal line (Figure 1).
Based upon either the etiology assigned by the provider or the investigators’ best clinical judgment during chart review, the most frequent etiologies were determined to be neurocardiogenic (n=54) and orthostatic hypotension (n=40); two cases were attrib-uted to cardiovascular disease (Figure 2).
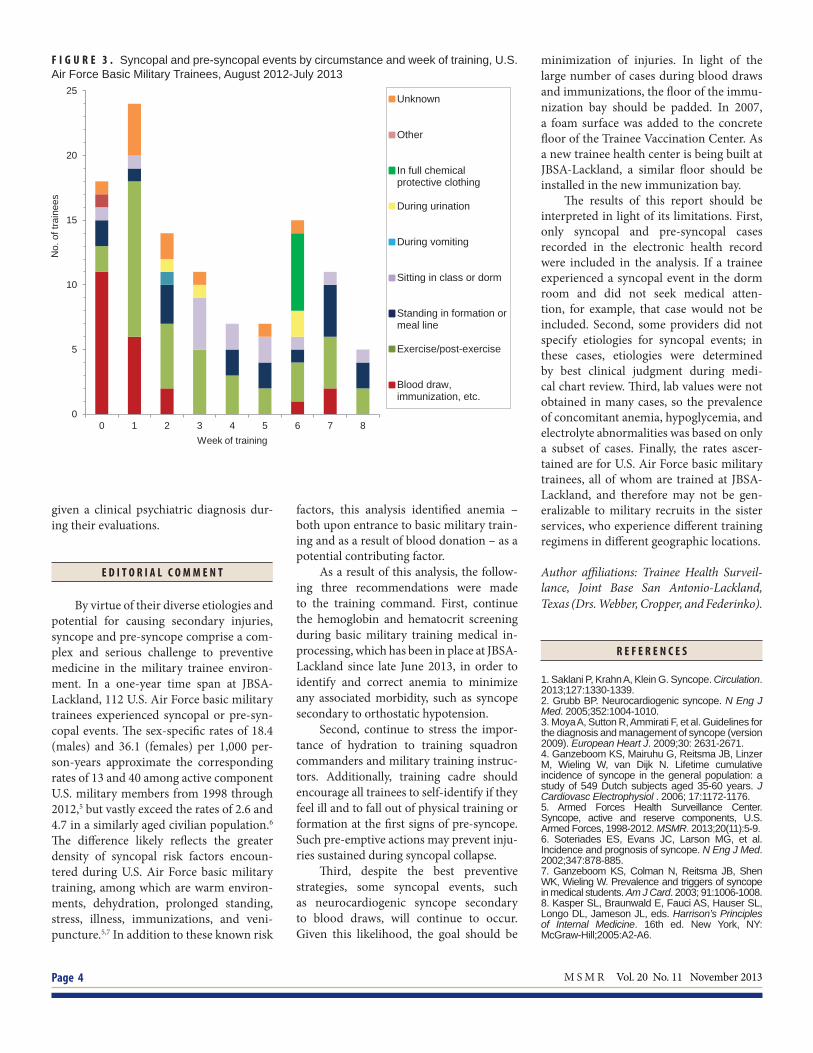
Syncopal events occurred throughout the 8.5 weeks of training (Figure 3). Early in
training (0 WOT and 1 WOT), the major-ity of events were due to either blood draw/immunizations or exercise. Th e second-ary peak during the sixth week of training (“BEAST week”) was likely associated with the use of Mission Oriented Protective Pos-ture (MOPP) gear. Two cases during WOT 7 were attributed to blood donation.
In terms of contributing factors, 26 trainees were diagnosed with comorbid conditions during their syncope evalua-tions. Th ese conditions included clinical psychiatric diagnoses (n=9), unexplained leukocytosis (n=5), upper respiratory infections (n=5), acute gastroenteritis (n=2), cardiovascular disease (n=2), pneu-monia (n=1), urinary tract infection (n=1), and hypothyroidism (n=1). Of those with cardiovascular disease, one had signifi cant coronary heart disease and the other had long QT syndrome with anomalous venous return. Twenty-three trainees were ane-mic, representing 38 percent of those tested (52 trainees with syncope did not have a hemoglobin measurement). Of those with moderate (n=11) or severe (n=2) anemia, six had syncopal events during or imme-diately aft er exercise and three while in formation. Among trainees who had a metabolic panel, three (7%) were hypogly-cemic, four (9%) were hypokalemic, two (4%) were hyponatremic, and one (2%) was
both hypokalemic and hyponatremic. Four trainees (3.6%) sustained lacerations dur-ing syncopal collapse, requiring repair with sutures.
Fourteen trainees began the military separation process shortly aft er their syn-copal events. Of these, seven (50%) were
F I G U R E 2 . Syncopal and pre-syncopal events by etiology and gender, U.S. Air Force Basic Military Trainees, August 2012-July 2013
05
10152025303540455055
Neu
roca
rdio
geni
c
Orth
osta
tic
Situ
atio
nal
Car
diov
ascu
lar
Unk
now
n
No.
of t
rain
ees
Male
Female
a
M S M R Vol. 20 No. 11 November 2013 Page 4
F I G U R E 3 . Syncopal and pre-syncopal events by circumstance and week of training, U.S. Air Force Basic Military Trainees, August 2012-July 2013
given a clinical psychiatric diagnosis dur-ing their evaluations.
E D I T O R I A L C O M M E N T
By virtue of their diverse etiologies and potential for causing secondary injuries, syncope and pre-syncope comprise a com-plex and serious challenge to preventive medicine in the military trainee environ-ment. In a one-year time span at JBSA-Lackland, 112 U.S. Air Force basic military trainees experienced syncopal or pre-syn-copal events. Th e sex-specifi c rates of 18.4 (males) and 36.1 (females) per 1,000 per-son-years approximate the corresponding rates of 13 and 40 among active component U.S. military members from 1998 through 2012,5 but vastly exceed the rates of 2.6 and 4.7 in a similarly aged civilian population.6 Th e diff erence likely refl ects the greater density of syncopal risk factors encoun-tered during U.S. Air Force basic military training, among which are warm environ-ments, dehydration, prolonged standing, stress, illness, immunizations, and veni-puncture.5,7 In addition to these known risk
factors, this analysis identifi ed anemia – both upon entrance to basic military train-ing and as a result of blood donation – as a potential contributing factor.
As a result of this analysis, the follow-ing three recommendations were made to the training command. First, continue the hemoglobin and hematocrit screening during basic military training medical in-processing, which has been in place at JBSA-Lackland since late June 2013, in order to identify and correct anemia to minimize any associated morbidity, such as syncope secondary to orthostatic hypotension.
Second, continue to stress the impor-tance of hydration to training squadron commanders and military training instruc-tors. Additionally, training cadre should encourage all trainees to self-identify if they feel ill and to fall out of physical training or formation at the fi rst signs of pre-syncope. Such pre-emptive actions may prevent inju-ries sustained during syncopal collapse.
Th ird, despite the best preventive strategies, some syncopal events, such as neurocardiogenic syncope secondary to blood draws, will continue to occur. Given this likelihood, the goal should be
minimization of injuries. In light of the large number of cases during blood draws and immunizations, the fl oor of the immu-nization bay should be padded. In 2007, a foam surface was added to the concrete fl oor of the Trainee Vaccination Center. As a new trainee health center is being built at JBSA-Lackland, a similar fl oor should be installed in the new immunization bay.
Th e results of this report should be interpreted in light of its limitations. First, only syncopal and pre-syncopal cases recorded in the electronic health record were included in the analysis. If a trainee experienced a syncopal event in the dorm room and did not seek medical atten-tion, for example, that case would not be included. Second, some providers did not specify etiologies for syncopal events; in these cases, etiologies were determined by best clinical judgment during medi-cal chart review. Th ird, lab values were not obtained in many cases, so the prevalence of concomitant anemia, hypoglycemia, and electrolyte abnormalities was based on only a subset of cases. Finally, the rates ascer-tained are for U.S. Air Force basic military trainees, all of whom are trained at JBSA-Lackland, and therefore may not be gen-eralizable to military recruits in the sister services, who experience diff erent training regimens in diff erent geographic locations.
Author affi liations: Trainee Health Surveil-lance, Joint Base San Antonio-Lackland, Texas (Drs. Webber, Cropper, and Federinko).
R E F E R E N C E S
1. Saklani P, Krahn A, Klein G. Syncope. Circulation. 2013;127:1330-1339.2. Grubb BP. Neurocardiogenic syncope. N Eng J Med. 2005;352:1004-1010.3. Moya A, Sutton R, Ammirati F, et al. Guidelines for the diagnosis and management of syncope (version 2009). European Heart J. 2009;30: 2631-2671.4. Ganzeboom KS, Mairuhu G, Reitsma JB, Linzer M, Wieling W, van Dijk N. Lifetime cumulative incidence of syncope in the general population: a study of 549 Dutch subjects aged 35-60 years. J Cardiovasc Electrophysiol . 2006; 17:1172-1176.5. Armed Forces Health Surveillance Center. Syncope, active and reserve components, U.S. Armed Forces, 1998-2012. MSMR. 2013;20(11):5-9.6. Soteriades ES, Evans JC, Larson MG, et al. Incidence and prognosis of syncope. N Eng J Med. 2002;347:878-885.7. Ganzeboom KS, Colman N, Reitsma JB, Shen WK, Wieling W. Prevalence and triggers of syncope in medical students. Am J Card. 2003; 91:1006-1008.8. Kasper SL, Braunwald E, Fauci AS, Hauser SL, Longo DL, Jameson JL, eds. Harrison’s Principles of Internal Medicine. 16th ed. New York, NY: McGraw-Hill;2005:A2-A6.
0
5
10
15
20
25
0 1 2 3 4 5 6 7 8
No.
of t
rain
ees
Week of training
Unknown
Other
In full chemicalprotective clothing
During urination
During vomiting
Sitting in class or dorm
Standing in formation ormeal line
Exercise/post-exercise
Blood draw,immunization, etc.

November 2013 Vol. 20 No. 11 M S M R Page 5
Syncope, Active and Reserve Components, U.S. Armed Forces, 1998-2012
syncope (fainting) is a temporary loss of consciousness due to sud-den reduction of blood fl ow to the
brain. Syncope is relatively common, even among young, healthy adults such as mil-itary members. Situations that are associ-ated with syncope in members of the U.S. Armed Forces include invasive medical procedures (such as blood donations, other venipunctures, and immunizations), stand-ing for long periods (such as in military formations or waiting lines), and physically demanding training or exercise, especially in hot environments.1-3 Frequencies and rates of syncope and postvaccination syn-cope among U.S. military members have been described previously in the MSMR,1,2 and an in depth study among Air Force basic military trainees is reported in this month’s MSMR (page 2).3
Th e objective of this analysis was to update the estimated frequencies, rates, trends, correlates of risk, and co-occur-ring conditions for syncope among active
During the period of 1 January 1998 to 31 December 2012, the health care records of 153,172 active component service members documented at least one health care encounter with a diagnosis of “syncope and collapse” (over-all incidence rate of 7.2 cases per 1,000 person-years). Th e annual incidence rates rose by 89 percent during the period. During the 15-year surveillance period, there were 4,954 instances of a documented health care encounter with a diagnosis of syncope on the same day that the service member had received an immunization by injection. Annual rates of syncope associated with immunization ranged from a low of 4.4 events per 100,000 immuniza-tion episodes in 1998 to a maximum of 14.1 events per 100,000 episodes in 2006. For both syncope diagnoses in general and syncope associated with immunization, rates were higher among women than men and were high-est among those under age 20. Nearly ten percent of syncopal events asso-ciated with immunization occurred during the fi rst two weeks of military service. Rates of syncope increased with the number of injections received per immunization episode. Diagnoses of physical injury were documented in the records of health care encounters for syncope for 4.0 percent of all synco-pal events and 6.9 percent of episodes of syncope linked to immunizations.
component U.S. service members dur-ing a recent 15-year period. Addition-ally, the experiences of active and reserve component members of the U.S. military regarding syncope related to injectable immunizations (postvaccination syncope) are described.
M E T H O D S
Th e surveillance period was 1 January 1998 to 31 December 2012. For surveillance purposes, cases of syncope were identifi ed from medical records of inpatient and out-patient encounters that included diagno-ses of “syncope and collapse” (ICD-9-CM code: 780.2) in any diagnostic position.
For summary purposes, a “case” of syn-cope was defi ned as a service member with at least one medical encounter for “syncope and collapse” any time during the surveil-lance period; as such, each individual could be a case only once during the period. A
“syncopal event” was defi ned as a service member with at least one syncope-related encounter in a day; as such, service mem-bers could be aff ected by multiple syncope events during the surveillance period. Fre-quencies, rates, and trends of syncope cases and syncopal events were calculated sepa-rately. For incidence rate estimates, popu-lation-time at risk was all active duty time of individuals serving in the active compo-nent of the U.S. Armed Forces during the surveillance period.
For estimation purposes, an immu-nization episode was defi ned as one or more immunizations administered to an individual in a given day. A case of “post-vaccination syncope” was defi ned as a syncope-related medical encounter that occurred on the same day as an immuni-zation episode. Aff ected service members could be considered cases of postvaccina-tion syncope only once per day regardless of the number of immunizations received during the immunization episode.
Rates of postvaccination syncope were calculated by dividing the number of post-vaccination syncope cases by the number of “immunization episodes” in a popula-tion and during a time period of interest.
Because immunizations given by injection are those most consistently asso-ciated with syncope risk, vaccines admin-istered orally (e.g., adenovirus vaccine) or nasally (e.g., FluMist® infl uenza vaccine) and tuberculin skin tests were not consid-ered exposures of interest in the analysis.
Illnesses and injuries were considered “co-occurring” with syncope if they were diagnosed (and reported in the fi rst or sec-ond diagnostic positions) during a medi-cal encounter in which syncope was also diagnosed.
R E S U L T S
During the 15-year surveillance period, 322,823 syncopal events were doc-umented among 153,172 aff ected service members (mean: 2.1 syncopal events per

M S M R Vol. 20 No. 11 November 2013 Page 6
T A B L E 1 . Incident counts and incidence rates (per 1,000 person-years) of syncope casesa and syncopal events,b active component, U.S. Armed Forces, 1998-2012
Syncope casesa Syncopal eventsb
No. Rate No. Rate
Total 153,172 7.2 322,823 15.1
Gender
Male 106,437 5.8 221,106 12.1
Female 46,735 15.1 101,717 32.9
Age
<20 28,256 18.0 48,985 31.2
20-24 57,605 8.3 119,589 17.1
25-29 26,991 5.8 60,139 12.9
30-34 15,122 4.8 34,873 11.0
35-39 12,662 4.6 29,238 10.6
40+ 12,536 5.6 29,999 13.5
Race/ethnicity
White, non-Hispanic 96,850 7.2 205,996 15.3
Black, non-Hispanic 29,746 8.0 63,481 17.1
Hispanic 13,143 6.2 26,375 12.4
Asian/Pacifi c Islander 4,280 5.2 8,375 10.2
Other/unknown 9,153 7.3 18,596 14.7
Service
Army 62,200 8.2 133,087 17.5
Navy 31,988 6.1 63,594 12.1
Air Force 38,176 7.3 83,509 16.1
Marine Corps 17,248 6.3 34,645 12.6
Coast Guard 3,560 6.1 7,988 13.8
Grade
Enlisted 138,304 7.7 290,614 16.3
Offi cer 14,868 4.3 32,209 9.2
Status
Recruit 13,113 30.5 19,672 45.8
Active (non-recruit) 140,059 6.7 303,151 14.5
Military occupation
Combat-specifi cc 15,064 5.7 31,814 12.0
Armor/motor transport 7,515 8.0 15,225 16.2
Pilot/aircrew 2,839 3.6 5,575 7.0
Repair/engineer 36,603 5.8 79,750 12.7
Communication/intelligence 34,991 7.2 76,207 15.7
Health care 14,588 8.3 31,381 17.9
Other 41,572 10.1 82,871 20.1
aA syncope case=one syncope medical encounter per person per surveillance period.bA syncopal event=one syncope medical encounter per person per day.cInfantry, artillery, combat engineering
aff ected individual) (Table 1). Th e incidence rate of syncope in active component service members was 7.2 per 1,000 person-years (p-yrs); the rate of syncopal events was 15.1 per 1,000 p-yrs.
Of all aff ected individuals, approxi-mately two-thirds (n=99,046; 64.6%) had one, 15.9 percent (n=24,322) had two, 6.8 percent (n=10,436) had three, 3.8 per-cent (n=5,790) had four, and 2.5 percent
(n=3,773) had fi ve syncopal events during the surveillance period (data not shown). Th e remaining 6.5 percent (n=10,025) of aff ected service members had from 6 to 88 reported syncopal events during the period.
Th e crude annual incidence rate of syncope cases increased by 88.6 percent from 1998 (rate: 4.6 per 1,000 p-yrs) to 2012 (8.6 per 1,000 p-yrs) (Figure 1). Over-all and in every year during the period, incidence rates of syncope cases were high-est among service members under 20 years of age. Th e incidence rate in service mem-bers under 20 years of age increased 115 percent from 1998 to 2007 (23.2 per 1,000 p-yrs), was stable from 2007 to 2009, and then decreased 21 percent through 2012 (18.3 per 1,000 p-yrs). Incidence rates in the other age groups increased linearly, but by much less overall, from 1998 through 2012 (Figure 1).
In general, incidence rates of both syn-cope cases and syncopal events were much higher among women than men, particu-larly among those younger than age 20. Among both males and females, incidence rates of syncope were highest by far in the youngest group (<20 years) and declined with increasing age through the mid-thir-ties (Table 1, Figure 2).
Among racial/ethnic groups, rates of syncope and syncopal events were high-est among service members who were black, non-Hispanic or “other/unknown” racial/ethnic identities and lowest among Asian/Pacifi c Islanders (Table 1). Com-pared to their respective counterparts, service members who were in the Army, enlisted, recruits, and with “other” mili-tary occupations (e.g., no military occupa-tional specialty skills, initial entry trainees) had higher rates and those in pilot/aircrew occupations had lower rates, of syncope and syncopal events.
Co-occurring conditions
Injuries were diagnosed during 12,998 (4.0%) medical encounters at which “syn-cope and collapse” was also diagnosed (data not shown). Th e injuries that were most fre-quently diagnosed during the same medical encounters as syncope were open wounds of the head (n=2,547); other/unspeci-fi ed injuries (n=2,590); contusions of the

November 2013 Vol. 20 No. 11 M S M R Page 7
F I G U R E 2 . Incidence rates of syncope casesa and syncopal eventsb by gender, active component, U.S. Armed Forces, 1998-2012
F I G U R E 1 . Incidence rates of syncope casesa overall and by age groups, active component, U.S. Armed Forces, 1998-2012
T A B L E 2 . Countsa and rates (per 100,000 immunizations) of postvaccination syncope,a active and reserve compo-nents, U.S. Armed Forces, 1998-2012
aOne per person during the surveillance period.bOne event per person per day.
No. RateTotal 4,954 9.7Component Active 3,863 10.4 Reserve\Guard 1,091 7.8Gender Male 3,655 8.4 Female 1,299 17.5Age <20 1,426 21.0 20-24 1,838 11.1 25-29 688 7.2 30-34 347 5.3 35-39 306 5.6 40+ 349 5.7Race/ethnicity White, non-Hispanic 3,630 11.0 Black, non-Hispanic 616 7.7 Hispanic 331 6.3 Asian/Pacifi c Islander 89 4.7 Other/unknown 288 10.2Service Army 1,895 8.9 Navy 727 7.5 Air Force 1,689 13.4 Marine Corps 525 7.7 Coast Guard 118 15.7Grade Enlisted 4,438 10.0 Offi cer 516 7.5Military occupation Combat-specifi cb 381 5.8 Armor/motor transport 193 7.9 Pilot/aircrew 97 5.7 Repair/engineer 972 7.5 Communication/ intelligence 815 8.4
Health care 271 7.4 Other 2,225 15.8
head (n=1,395); concussions (n=1,145); sprains and strains of the back (n=667); and fractures of the skull, face, clavicle, or vertebrae (n=584). Of note, more seri-ous injuries within these categories include skull fractures (n=119), fractures of verte-bral column (n=91), cerebral lacerations, contusions, or other intracranial injuries (n=335), and open wound of the eyeball or ocular adnexa (n=62).
Other relatively common diagnoses during syncope-related medical encounters were diseases and symptoms involving the cardiovascular system (e.g., dysrhythmias, palpitations, hypertension) (n=23,995); diseases and symptoms involving the respiratory system (e.g., respiratory infec-tions, unspecifi ed chest pain) (n=22,965);
symptoms involving the head and neck (e.g., headache and migraines) (n=12,151); disor-ders of fl uid, electrolyte, and acid-base bal-ance (e.g., dehydration, volume depletion) (n=8,558); and diseases and symptoms of the digestive system (e.g., nausea/vomiting, viral enteritis) (n=7,420) (data not shown).
Postvaccination syncope
During the 15-year surveillance period, there were 51,101,639 immuniza-tion episodes and 4,954 medical encoun-ters for “syncope and collapse” on the same days as immunization episodes. Th e crude overall rate of medical encounters for post-vaccination syncope was 9.7 per 100,000 immunization episodes (Table 2).
Annual rates of postvaccination syn-cope more than tripled from 1998 (4.4 per 100,000 immunization episodes) to 2006 (14.1 per 100,000 immunization episodes) and then were relatively stable from 2006 to 2012 (range: 11.0-13.6 per 100,000 immu-nization episodes) (Figure 3). Overall, and in every year of the period, rates of postvac-cination syncope were much higher among
0.0
5.0
10.0
15.0
20.0
25.019
98
1999
2000
2001
2002
2003
2004
2005
2006
2007
2008
2009
2010
2011
2012
Inci
denc
e ra
te p
er 1
,000
per
son-
year
s
<20
20-24
25-29
30-34
35-39
40+
Total
0.0
12.5
25.0
37.5
50.0
62.5
75.0
<20 20-24 25-29 30-34 35-39 40+
Inci
denc
e ra
te p
er 1
,000
per
son-
year
s Events among femalesFemale casesEvents among malesMale cases
aNo more than one immunization episode per indi-vidual per day.bInfantry, artillery, combat engineering
aOne per person during the surveillance period.

M S M R Vol. 20 No. 11 November 2013 Page 8
F I G U R E 4 . Rates (per 100,000 immunizations) of post-vaccination syncope by gender, active and reserve components, U.S. Armed Forces, 1998-2012
F I G U R E 3 . Rates (per 100,000 immunizations) of postvaccination syncope by age, active and reserve components, U.S. Armed Forces, 1998-2012
F I G U R E 5 . Rates (per 100,000 immunization episodes) of postvaccination syncope by the number of immunizations given during an immunization episode, active and reserve component, U.S. Armed Forces, 1998-2012
0.0
0.5
1.0
1.5
2.0
2.5
3.0
3.519
9819
9920
0020
0120
0220
0320
0420
0520
0620
0720
0820
0920
1020
1120
12
Rat
e pe
r 100
,000
imm
uniz
atio
n ep
isod
es <20
20-24
25-29
30-34
35-39
40+
Total
0.0
5.0
10.0
15.0
20.0
25.0
30.0
35.0
1 2 3 4 or more
Rat
e pe
r 100
,000
imm
uniz
atio
n ep
isod
es
No. of immunizations during the immunization episode
0.0
5.0
10.0
15.0
20.0
25.0
30.0
35.0
40.0
<20
20-2
4
25-2
9
30-3
4
35-3
9
40+
Rat
e pe
r 100
,000
imm
uniz
atio
n ep
isod
es Females
Males
service members younger versus older than 20 years.
Th e rate of postvaccination syncope was more than twice as high among females as males and sharply declined with increas-ing age (Table 2, Figure 4). Crude rates were higher among members of the Coast Guard and Air Force, those in “other” occupations (which include those without an identi-fi ed occupation, e.g., recruits), and among white, non-Hispanic and enlisted service members compared to their respective counterparts (Table 2).
Approximately 9.7 percent of all postvaccination syncope cases (n=479) occurred during the fi rst two weeks of ser-vice (data not shown). Th e Marine Corps (16.8%), Coast Guard (13.6%), and Air Force (12.0%) had higher percentages of postvaccination syncope cases during the fi rst two weeks of service than the Navy (6.6%) and Army (6.5%).
In general, the rate of syncope sharply increased as the number of injections per immunization episode increased. Com-pared to episodes with only one injection, rates of syncope were 100 percent, 286 percent, and 409 percent higher during episodes with two, three, and four or more injections, respectively (Figure 5).
Co-occurring conditions
Injuries were diagnosed during 343 (6.9%) of the 4,954 medical encounters for postvaccination “syncope and collapse” (data not shown). Th e most frequently co-occurring injuries with postvaccination syncope were open wounds of the head (n=111); contusions of the head (n=65); other/unspecifi ed injuries (n=46); concus-sions (n=22); other/unspecifi ed injuries of the head (n=15); and fractures of the skull, face, or clavicle (n=10). Of note, more seri-ous injuries within these categories include other intracranial injuries (n=5), skull frac-tures (n=2), and open wound of the eyeball or ocular adnexa (n=2).
Other conditions that were relatively frequently diagnosed during the same med-ical encounters as postvaccination syncope were diseases and symptoms involving the cardiovascular system (e.g., dysrhythmias, hypertension) (n=202); disorders of fl uid, electrolyte, and acid-base balance (e.g., dehydration, volume depletion) (n=177); diseases and symptoms involving the respi-ratory system (e.g., respiratory infections, unspecifi ed chest pain) (n=264); and symp-toms involving the head and neck (e.g., headache and migraines) (n=118) (data not shown).
E D I T O R I A L C O M M E N T
Th is report documents that, each year on average over the past 15 years, approxi-mately 21,500 syncopal events (all types) have aff ected 10,200 active component ser-vice members.

November 2013 Vol. 20 No. 11 M S M R Page 9
Many syncopal events were associated with medical conditions that likely pre-cipitated the syncopal episodes (e.g., car-diac arrhythmias, acute gastrointestinal/respiratory illnesses) or with injuries that likely were caused by syncope-related col-lapses. Of particular note, some injuries that were diagnosed at the same medical encounters as syncope were extremely seri-ous and potentially life threatening (e.g., cerebral lacerations/contusions, spinal col-umn fractures). Th e fi ndings strongly sug-gest the need for better syncope-related injury prevention policies and practices. In this regard, the identifi cation and protec-tion from injury of individuals at particu-larly high risk of postvaccination syncope and collapse should be a high priority. Such individuals include military recruits (par-ticularly females) and adults of all ages and genders with histories of immunization-related syncope.
In this report, aft er a fi rst documented syncopal episode while in military service, approximately one-third of those aff ected had had at least one additional syncopal event during service. Aft er a second or third syncopal episode while in military service, more than one half (55%) and two-thirds (65%), respectively, of those so aff ected had at least one additional syncopal event during service. Clearly, service members with any history of syncope are at sharply increased risk of additional episodes – and those with multiple prior episodes of syn-cope are at extremely increased risk of addi-tional episodes and should be specifi cally protected from syncope-related injuries.
Syncope is a well-known consequence of vaccination. During the 15-year sur-veillance period, 4,954 syncope events occurred on the same days as immuniza-tions. Th e rate of postvaccination syncope among active and reserve component ser-vice members was 9.7 per 100,000 immu-nizations. Similar to rates of syncope (all types) in the active component, postvacci-nation syncope was highest among females and younger aged service members. Th e Coast Guard and Air Force had the high-est rates of postvaccination syncope (>13 per 100,000 immunizations) as well as the relatively highest proportions of postvacci-nation syncope during the fi rst two weeks of service.
Th e rate of clinically signifi cant syn-cope aft er receiving immunizations by injection is generally low; however, this report documents that the rate sharply increased when multiple injections were administered. Because so many service members receive immunizations by injec-tion, and since multiple injections are oft en given concurrently, hundreds of service members are treated for postvaccination syncope each year. Th is report documented hundreds of traumatic injuries that were at least temporally related to syncope and col-lapse of service members aft er immuniza-tion; many such injuries were severe, and most, if not all, likely were preventable.
Th e Advisory Committee on Immu-nization Practices (ACIP) of the Cen-ters for Disease Control and Prevention (CDC) recommends that vaccine provid-ers “strongly consider observing patients for 15 minutes aft er they are vaccinated. If syncope develops, patients should be observed until symptoms resolve.”4 At the start of recruit training, newly inducted service members receive multiple immuni-zations by injection; and in preparation for overseas deployments, members of military units oft en receive immunizations in large groups. Th e risk of serious complications of postvaccination syncope may be increased when immunizations are given to military groups outside of medical facilities - rather than to individuals in clinic settings. For example, in clinics, vaccinees can be seated during and aft er injections and monitored for syncope for reasonable time periods; in addition, fl ooring can be padded, and fur-niture and equipment can be shielded or removed from immunization rooms and patient waiting areas. Such precautions may be diffi cult to implement in non-med-ical facilities where mass immunizations are given (e.g., theaters, gymnasiums). Nonetheless, every measure to ensure the safety of immunization recipients should be taken, regardless of the location, setting, or circumstances of administration.
Th e results presented in this report should be interpreted in light of several limitations. Th e numbers reported here likely underestimate the actual numbers of syncope cases (individuals) and events (both overall and for postvaccination syn-cope). Uncomplicated syncopal episodes
may be managed at sites where they occur (for example, at a medical aid station or a troop clinic) but may not be documented in medical records. Furthermore, some indi-viduals may never seek care for syncopal episodes occurring at home and/or while off -duty.
Conversely, in the analysis that exam-ined the total numbers of syncopal events and the numbers of such events per per-son, it is possible that the numbers of such events were overestimated. Th e diagnostic evaluations of some persons who experi-enced syncope may have required a series of subsequent outpatient encounters for consultations, special testing (e.g., Holter monitoring, other cardiovascular assess-ments), and follow-up visits. Th e medical record documentation of such encounters may have included repeat recordings of the diagnostic code for the original synco-pal events that precipitated the follow-on evaluations. Th is analysis did not attempt to clarify the impact of follow-up care for syncope on the numbers of encounters for service members whose records suggested multiple events.
Additionally, the defi nition of post-vaccination syncope used in this report is based on a temporal association (same day occurrence). True cause and eff ect (i.e., the vaccination caused the syncope event) could not be confi rmed; therefore, some postvaccination syncope events may be classifi ed as such incorrectly. Similarly, a cause and eff ect relationship between syn-cope and co-occurring conditions – par-ticularly injuries – documented during the same encounter cannot be established with certainty.
R E F E R E N C E S
1. Army Medical Surveillance Activity. Syncope, active duty, U.S. Armed Forces, 1998-2002. MSMR. 9(4):5-8.2. Armed Forces Health Surveillance Center. Syncope after immunization by injection, U.S. Armed Forces, 1998-2007. MSMR. 15(7):2-5.3. Webber BJ, Cropper TL, Federinko SP. Syncope among U.S. Air Force Basic Military Trainees, August 2012-July 2013. MSMR. 20(11):2-4.4. Advisory Committee on Immunization Practices (ACIP), Centers for Disease Control and Prevention. General recommendations on immunization. MMWR. 2006;55(No. RR-15):19.

M S M R Vol. 20 No. 11 November 2013 Page 10
Update: Motor Vehicle-related Deaths, Active and Reserve Components, U.S. Armed Forces, 1999-2012
motor vehicle accidents (MVAs) have accounted for nearly one third of U.S. military deaths
annually, and through 2009 were the lead-ing non-war-related cause of death among U.S. military personnel.1,2 Deaths due to MVAs among service members have been declining in recent years, to such an extent that in 2010 and 2011 there were more deaths from suicide and from war than from transportation accidents.
Studies focused on service members have identifi ed several factors associated with increased risk of death due to motor vehicle crashes: relative youth, single mari-tal status, male gender, and highest educa-tional level of high-school completion.3,4 Compared to their older counterparts, younger service members more commonly take risks while driving (e.g., speeding, inconsistent use of seat belts, driving while intoxicated) or ride motorcycles.
All services within the U.S. Armed Forces conduct safe driving campaigns and make such information available to their
From 1999 to 2012, there were 4,479 motor vehicle accident (MVA)-related deaths among members of the U.S. Armed Forces. Of these, the single most common underlying cause of death was motorcycle accidents (n=1,134; 25.6%). Among active component service members during the 14-year sur-veillance period, the annual number (n=355) and rate (25.1 per 100,000 per-son-years[p-yrs]) of MVA-related deaths peaked in 2004. Since then, a steady downward trend followed and the 2012 number (n=184) and rate (13.2 per 100,000 p-yrs) were the lowest of the entire period. For members of the reserve component, the annual number of deaths peaked in 2005 (n=86), but the number in 2012 (n=22) was the lowest of the period. In 2012, the number (n=90) and rate of deaths (6.5 per 100,000 p-yrs) related to motorcycle acci-dents among active component service members almost equaled the num-ber (n=94) and rate of deaths (6.7 per 100,000 p-yrs) from all other types of motor vehicle accidents combined. During the entire period, numbers of fatal motor vehicle accidents tended to be higher in the warmer months of the year. Aft er 2009, motor vehicle accidents were no longer the leading, non-war-related cause of death among U.S. service members.
respective service members using a variety of media. Th e Army for example, requires all soldiers to undergo the Army Traffi c Safety Training Program, which includes mandatory motorcycle training under the Progressive Motorcycle Program for sol-diers who own motorcycles. Apart from the usual messaging on the avoidance of, or moderate consumption of alcohol before driving, wearing seat belts or helmets as appropriate, and defensive driving, these safety training programs extend to cover such topics as the proper installation and use of child safety seats, and maintaining safe personal motor vehicles in order to safeguard the lives of family members and other passengers.
Th is report updates previous sum-maries of numbers, rates, trends, and cor-relates of risk of motor vehicle accident related fatalities among service members since 1999. Th is report also describes mil-itary and demographic characteristics of service members who died in motorcycle and other motor vehicle accidents.
M E T H O D S
Th e surveillance period was 1 January 1999 to 31 December 2012. Th e surveil-lance population included all individuals who served on active duty as members of the active or reserve components of the U.S. Armed Forces at any time during the sur-veillance period.
Motor vehicle-related deaths of service members were ascertained from records maintained in the DoD Medical Registry of the Armed Forces Medical Examiner Sys-tem and routinely provided to the Armed Forces Health Surveillance Center for inte-gration into the Defense Medical Surveil-lance System (DMSS). For this analysis, a motor vehicle-related death was defi ned by a casualty record with an “underlying cause of death” code corresponding to a collision or non-collision motor vehicle accident. Motor vehicle deaths that were considered “intentional” (i.e., suicide or homicide) or war-related were excluded.
In this analysis, the summaries com-prise numbers of deaths in the surveillance population overall (i.e., active and reserve component members on active duty) and mortality rates for members of the active component using person-years at risk rather than individuals at risk. Mortality rates were calculated as deaths per 100,000 person-years of active military service dur-ing the surveillance period. Th e U.S. mili-tary is a dynamic cohort – each day many individuals enter and many others leave service. Th us, in a given year there are many more individuals with any service than there are total person-years of active service. Reserve component members were not included in rate calculations because the start and end dates of their active duty service periods were not available.
R E S U L T S
Th ere were 4,479 motor vehicle-related deaths among service members during the

November 2013 Vol. 20 No. 11 M S M R Page 11
F I G U R E 1 . Annual numbers and rates of motor vehicle-related deaths, active component, U.S. Armed Forces, January 1999-December 2012
14-year surveillance period from 1999 through 2012 (Table 1). Th ese included 3,784 deaths in the active component (rate: 19.5 per 100,000 person-years [p-yrs]) and 695 deaths in the reserve component (Table 2). Among the 10 categories of underly-ing motor vehicle accident-associated cause of death used in this analysis, the largest number of service member deaths (n=1,158; 25.9% of the total) was associated with motorcycle accidents (motorcyclist involved in any accident except collision with railway train).
Th e second highest number of deaths in a single category of vehicle deaths was for “other and unspecifi ed” motor vehi-cle accidents which accounted for 783 or 17.5 percent of all MVA deaths. Th rough-out the surveillance period, there were 262 (5.8%) pedestrian-involved fatalities in col-lisions with motor vehicles. Th e fi ve catego-ries that specifi ed that the decedent was the occupant of a vehicle accounted for 2,243 deaths (50.1% of all MVA deaths) (Table 1). Overall, there were 3,321 non-motorcycle related deaths during the period.
Annual numbers of deaths from MVA among active component service members during the surveillance period peaked in 2004 (n=355; rate: 25.1 per 100,000 p-yrs) (Figure 1). In general, annual counts and rates of motor-vehicle related deaths among active component service members have been declining since 2007. Th e year 2012 had the lowest annual number (n=184) and rate (13.2 per 100,000 p-yrs) of MVA deaths among active component service members during the entire surveillance period (Figure 1).
Annual MVA deaths among reserve component service members were highest from 2003 to 2005 (81, 81, and 86 deaths, respectively), but have been consistently lower since 2008. Most notably, reserve component MVA deaths in 2012 (n=22) were by far the fewest of any year in the sur-veillance period (Figure 2).
Among active component service members in all of the services, the Army had the highest number of motor vehi-cle-related deaths overall (n=1,568; rate: 22.0 per 100,000 p-yrs; 41.4% of all MVA deaths) (Table 2) and in each year during the 14-year period (Figure 3). However, the Marines had the highest overall rate, 29.8 per 100,000 p-yrs (Table 2).
T A B L E 1 . Motor vehicle-related deaths by underlying cause of death category, active and reserve components, U.S. Armed Forces, January 1999-December 2012Underlying cause of death (UCOD) Service member deaths
No. % of totalMotorcyclist involved in any accident except collision with railway train 1,158 25.9Other and unspecifi ed motor vehicle accidents 783 17.5Occupant of car, pickup, truck, or van involved in collision with other motor vehicle 663 14.8
Occupant of motor vehicle involved in collision with non-motorized road vehicle streetcar, animal, pedestrian, or fi xed object 607 13.6
Occupant of motor vehicle involved in noncollision accident 521 11.6Occupant of special-use motor vehicle involved in any accident (including military vehicle) 447 10.0
Pedestrian involved in collision with motor vehicle 262 5.8Pedal cyclist involved in collision with motor vehicle 22 0.5Other motor vehicle accident involving collision with railway train 11 0.2Occupant of heavy transport vehicle or bus involved in collision with other motor vehicle 5 0.1
Total 4,479 100.0
0.0
5.0
10.0
15.0
20.0
25.0
30.0
0
50
100
150
200
250
300
350
400
1999
2000
2001
2002
2003
2004
2005
2006
2007
2008
2009
2010
2011
2012
Rat
e pe
r 100
,000
per
son-
year
s (li
ne)
No.
of d
eath
s (b
ars)
F I G U R E 2 . Annual numbers of motor vehicle-related deaths, reserve component, U.S. Armed Forces, January 1999-December 2012
0
10
20
30
40
50
60
70
80
90
1999
2000
2001
2002
2003
2004
2005
2006
2007
2008
2009
2010
2011
2012
No.
of d
eath
s
Male service members died as a result of MVAs at a higher rate overall when com-pared to their female counterparts (male rate: 21.4 per 100,000 p-yrs vs. female rate: 8.4 per 100,000 p-yrs). Although there were more deaths (counts) among white, non-Hispanic service members and those aged 20-24 compared to their respective counterparts, the rates of MVA deaths were highest among black, non-Hispanic service members (rate: 22.2 per 100,000 p-yrs) and those under the age of 20 (rate: 29.5 per 100,000 p-yrs) (Table 2).
In 2012, each of the services (except Navy) had its lowest annual number of

M S M R Vol. 20 No. 11 November 2013 Page 12
MVA-related deaths (active and reserve components combined) of the entire sur-veillance period. Among active compo-nent service members, 2012 had the lowest annual rates of MVA-related deaths among the Army and Marine Corps (Figure 3).
Dramatic declines in the numbers and rates of non-motorcycle-related MVA deaths were responsible for the fall in rates for all MVA-related deaths (Figure 4). For the entire 14-year surveillance period, slightly over 25 percent of all motor vehi-cle-related deaths were due to motorcycle accidents among active and reserve compo-nent service members combined. However, as a result of the decline in non-motor-cycle-related MVA deaths since 2005, motorcycle-related deaths have become an increasingly higher proportion of all MVA-related deaths in the latter part of the sur-veillance period (Figure 4).
In 2012, among active component ser-vice members, the rate of motorcycle deaths (6.5 per 100,000 p-yrs) was almost that of non-motorcycle MVAs (6.7 per 100,000 p-yrs) (Figure 4). Th e largest numbers of motorcycle-related deaths aff ected active component service members (n=1,023), soldiers (n=457 overall; n=373 and rate: 5.2 per 100,000 p-yrs among active component
T A B L E 2 . Demographic and military characteristics of motor vehicle-related deaths (all types), active and reserve components, U.S. Armed Forces, January 1999 - December 2012
Active and reserve components Active component
No. No. of deaths Ratea
Total 4,479 3,784 19.5Service Army 2,067 1,568 22.0 Navy 847 798 16.4 Air Force 740 651 13.5 Marine Corps 825 767 29.8Sex Male 4,173 3,547 21.4 Female 306 237 8.4Race/ethnicity White, non-Hispanic 2,772 2,329 19.2 Black, non-Hispanic 863 761 22.2 Other 844 694 18.0 Age <20 489 424 29.5 20-24 2,058 1,835 28.7 25-29 874 755 17.8 30-39 765 609 11.4 40+ 293 161 8.0Military occupation Combat-specifi c 1,170 1,032 25.4 Health care 210 184 11.4 Admin/supply 985 791 17.2 Other 2,114 1,777 19.4aRate per 100,000 person-years
F I G U R E 3 . Annual numbers of motor vehicle-related deaths, by service, active and reserve components, U.S. Armed Forces, January 1999-December 2012
F I G U R E 4 . Motor vehicle-related deaths by year and underlying cause (motorcycle vs. all other), active component, U.S. Armed Forces, January 1999-December 2012
0
25
50
75
100
125
150
175
200
225
1999
2000
2001
2002
2003
2004
2005
2006
2007
2008
2009
2010
2011
2012
No.
of a
nnua
l dea
ths
Army Navy Air Force Marine Corps
0.0
2.5
5.0
7.5
10.0
12.5
15.0
17.5
20.0
0
25
50
75
100
125
150
175
200
225
250
275
1999
2000
2001
2002
2003
2004
2005
2006
2007
2008
2009
2010
2011
2012
Rat
e pe
r 100
,000
per
son-
year
s (li
nes)
No.
of d
eath
s (b
ars)
No. of non-motorcycle deaths No. of motorcycle deathsRates of non-motorcycle deaths Rates of motorcycle deaths

November 2013 Vol. 20 No. 11 M S M R Page 13
only), those aged 20-24 years, males, and white, non-Hispanics. Th e highest rates (active component only) were among Marines (rate: 6.9 per 100,000 p-yrs), those aged 20-24 years (rate: 6.4 per 100,000 p-yrs), and black, non-Hispanics (rate: 6.8 per 100,000 p-yrs) (Table 3).
For the entire surveillance period, motorcycle-related death counts were lowest in January and higher during the months of April to September (warmer months) (Figure 5). Th e average number of motorcycle-related deaths per month over the surveillance period was highest in July (n=150 overall). July also had the highest average number of deaths per day overall during the 14-year surveillance period. For non-motorcycle MVA-related deaths, there was a similar, though less-striking, seasonal pattern of numbers of fatalities.
When compared to all causes of death among service members for the last fi ve years (2008 through 2012), MVA-related deaths have accounted for a decreasing proportion of all deaths in the active and reserve components of the U.S. Armed Forces (Figure 6). In 2012, the percentage of all deaths among active and reserve compo-nent service members attributable to MVAs was the lowest (15.8%) in the 5-year period.
T A B L E 3 . Demographic and military characteristics of motorcycle-related deaths, active and reserve components, U.S. Armed Forces, January 1999-December 2012
Active and reserve components Active component
No. No. of deaths Ratea
Total 1,158 1,023 5.3Service Army 457 373 5.2 Navy 272 260 5.3 Air Force 235 211 4.4 Marine Corps 194 179 6.9Sex Male 1,128 998 6.0 Female 30 25 0.9Race/ethnicity White, non-Hispanic 718 636 5.2 Black, non-Hispanic 255 232 6.8 Other 185 155 4.0 Age <20 42 40 2.8 20-24 442 412 6.4 25-29 292 262 6.2 30-39 280 245 4.6 40+ 102 64 3.2Military occupation Combat-specifi c 270 252 6.2 Health care 49 42 2.6 Admin/supply 233 185 4.0 Other 606 544 5.9aRate per 100,000 person-years
F I G U R E 5 . Motor vehicle-related deaths by month (motorcycle vs. all other), active and reserve components, U.S. Armed Forces, 1999-2012
F I G U R E 6 . Comparison of number of deaths from all non-motor vehicle-related causes to motor vehicle-related deaths, active and reserve components, U.S. Armed Forces, 2008-2012
0.00
0.25
0.50
0.75
0
25
50
75
100
125
150
175
200
225
250
275
300
325
Janu
ary
Febr
uary
Mar
ch
April
May
June July
Augu
st
Sept
embe
r
Oct
ober
Nov
embe
r
Dec
embe
r
Ave
rage
no.
of d
eath
s pe
r day
(lin
es)
No.
of d
eath
s (b
ars)
Non-motorcycle-related deaths Motorcycle-related deaths
AVG non-motorcycle deaths per day AVG motorcycle deaths per day
20.9%17.6% 16.4% 17.1%
15.8%
0
200
400
600
800
1,000
1,200
1,400
1,600
2008 2009 2010 2011 2012
No.
of d
eath
s
Motor vehicle-related deaths
No. of non-motor vehicle-related deaths
% motor vehicle-related deaths

M S M R Vol. 20 No. 11 November 2013 Page 14
E D I T O R I A L C O M M E N T
Bell, et al.4 reported in a 2000 analysis of self-reported risk taking behaviors among soldiers hospitalized for injuries as a result of motor vehicle accidents that heavy drink-ing, drinking and driving, speeding, low seat belt use, younger age, minority race/eth-nicity, and enlisted rank were signifi cantly associated with motor vehicle injury. Th ey concluded that many of the self-identifi ed risk factors associated with motor vehicle injuries were indeed modifi able (e.g., drink-ing, speeding, and infrequent seat belt use). Moreover, the authors’ recommendation was that programs that meet the needs of young and minority soldiers, and that tar-get high risk behaviors are needed. Twelve years later, the data in this report show some encouraging improvements within the U.S. military population.
During the 14-year surveillance period, annual counts and rates of MVA deaths among active component service members peaked in 2004, and began a sustained decline through 2012. By 2012, annual deaths due to MVAs had declined by 34.8 percent since 1999 and by 48.2 per-cent since the peak in 2004. In 2012 counts and rates of MVA deaths in the active com-ponent of all services reached their low-est levels of the entire surveillance period. Similarly, MVA deaths among reservists in 2012 were dramatically lower than any other year of the surveillance period.
Although the fi ndings of this update are encouraging with respect to motor vehicle accidents overall, it is concerning that rates of motorcycle-related fatalities among service members have risen in the two years since 2010. Moreover, the counts and rates of motorcycle-related deaths among U.S. military service members have remained higher in recent years than they were at the beginning of the surveillance period. In 2012, the counts and rates of deaths from motorcycle accidents among active component service members were nearly equal to those from non-motorcycle accidents.
Since 2009, the Department of Defense has required service members who intend to own a motorcycle to enroll and partic-ipate in motorcycle safety courses. Such
training is expected to be conducted within 30 duty days of request for training for ini-tial riders, and at least every fi ve years as a refresher.5 Th e underlying or main chal-lenges in reducing motorcycle-related fatalities among service members remain unclear. By all appearances, the requisite policies and programs are in place, and have been made applicable to all service members meeting the criteria (i.e., those who own or intend to own a motorcycle). Furthermore, the safety training programs incorporate motorcycle maintenance tips and advice on protective clothing, and some even go so far as to provide fi rst hand testimonials from service members who have been involved in accidents, but some-how survived. Perhaps greater eff orts need to be made to encourage those most at risk – young service members – to appreci-ate their own vulnerability with respect to motorcycle crashes and to modify their rid-ing behaviors accordingly.
Several diff erences in temporal and epidemiologic characteristics of fatal MVAs are described in this report. Fatalities due to motorcycle accidents occurred more fre-quently during warmer months, in contrast to the less dramatic seasonal pattern of inci-dent non-motorcycle-related fatalities. Male service members in the active component died from motor vehicle accidents at a rate more than twice that of their female coun-terparts. Compared to their older coun-terparts, younger members of the Armed Forces are at a higher risk of fatalities due to motor vehicle accidents. Th e same is true for black, non-Hispanic service members in comparison to their counterparts.
Th ere are several limitations to this analysis that should be considered when interpreting the results. First, the outcomes measured were deaths from MVAs. Th e analysis did not compile the numbers or rates of all MVAs (fatal and non-fatal), so it was not possible to assess whether or not a decrease in rates of MVAs was responsible for the decline in MVA death rates. Accord-ingly, it is unclear if the previously described safety training initiatives have had the desired eff ect on the incidence of MVA acci-dents overall, a major determinant of MVA fatalities. It is possible that modern automo-tive engineering advances designed to make MVAs more survivable have yielded lower
fatality rates even if the numbers of acci-dents have not declined appreciably.
Second, although the documented recent trends in fatal MVAs attributable to motorcycle accidents do not show major improvements in the associated rates – in contrast to the sharp declines in deaths from non-motorcycle MVAs – this analy-sis does not clarify the risks attendant to motorcycle-related deaths. Rates in this report were calculated using a population-based denominator, i.e., person-years of all active component service members. A bet-ter denominator for assessment of trends in motorcycle fatalities would be person-years of service of motorcycle operators. It is possible that the numbers of motorcycle owners or operators have increased signifi -cantly during the surveillance period, so a more accurate, rate-based estimate of the risk of fatal motorcycle accidents over time would be possible with such exposure data (currently not available).
Th ird, the analysis does not account for the deaths of service members who were on active duty at the time of ultimately fatal MVAs but who died of the resulting inju-ries aft er they left active duty (e.g., following medical disability retirement). Also the anal-ysis did not account for fatal MVAs among reserve component members who were not on active duty at the times of their accidents. Because such deaths were not included, the mortality impact of motor vehicle acci-dents on the total U.S. Armed Forces is likely underestimated in this report.
R E F E R E N C E S
1. Krahl PL, Jankosky CJ, Thomas RJ, Hooper TI. Systematic review of military motor vehicle crash-related injuries. Am J Pre Med. 2010: 38(1S); S189-S196.2. Armed Forces Health Surveillance Center. Deaths while on active duty in the U.S. Armed Forces, 1990-2011. MSMR. 2012 May. 19(5): 2-5. 3. Hooper TI, Debakey SF, Bellis KS, et al. Understanding the effect of deployment on the risk of fatal motor vehicle crashes: a nested case-control study of fatalities in Gulf War era veterans, 1991-1995. Accid Anal Prev. 206 may; 38(3):518-525.4. Bell NS, Amoroso PJ, Yore MM, Smith GS, Jones BH. Self-reported risk taking behaviors and hospitalization for motor vehicle injury among active duty Army personnel. Am J Prev Med. 2000 Apr; 18(3 Suppl):85-95.5. DoDI 6055.04. DOD Traffi c Safety Program. January 2013.

November 2013 Vol. 20 No. 11 M S M R Page 15
Surveillance Snapshot: Bacterial Meningitis Among Beneficiaries of the Military Health System, 1998-2013
F I G U R E 1 . Percentage distribution, by bacterial etiology,a of cases of bacterial meningitis among Military Health System benefi ciaries, 1998-2013b
Salmonella meningitis
Gonococcal meningitis
Syphlitic meningitis
Tuberculosis meningitis
Anaerobic meningitis
Hemophilus meningitis
Pneumococcal meningitis
Meningitis due to gram-negbacteriaStaphylococcal meningitis
Streptococcal meningitis
Meningococcal meningitis
Other/unspecified bacterialmeningitis
F I G U R E 2 . Incident counts and incidence rates of meningococcal meningitis cases by benefi ciary type, benefi ciaries of the Military Health System, 1998-2013a
0.0
0.1
0.2
0.3
0.4
0.5
0.6
0.7
0.8
0
5
10
15
20
25
30
1998
1999
2000
2001
2002
2003
2004
2005
2006
2007
2008
2009
2010
2011
2012
2013
Inci
denc
e ra
te p
er 1
00,0
00 p
erso
n-ye
ars
(line
)
No.
of c
ases
(bar
s)
ActiveReserve/GuardOther beneficiariesRate (active only)
n=432 n=91 n=3,259
48.140.7 39.2
21.1
15.4
7.7
6.9
14.3
19.1
6.7
5.57.6
6.311.0
8.0
4.9 9.912.0
3.5 1.1 2.7
0%
10%
20%
30%
40%
50%
60%
70%
80%
90%
100%
Act
ive
Res
erve
nefic
iarie
s
Per
cent
age
of to
tal c
ases
All
othe
r be
nefi c
iarie
s
a
aPartial yearaBacterial meningitis less than 1% are not numerically displayed.bPartial year
From 1998 to 2013 (partial year), 3,782 benefi ciaries of the Military Health System (MHS) were diagnosed as cases of bacterial meningitis. Cases were ascertained from diagnoses recorded in special electronic reports of meningococcal meningitis (a Reportable Medical Event in the MHS) or in records of inpatient hospital stays in which bacterial meningitis was documented in the primary or secondary diagnostic position. Among the three types of benefi ciary groups, the proportions of meningitis cases by bacterial type varied (Figure 1). In active and Reserve/Guard component service members, meningococcal meningitis was the most commonly documented specifi ed type of bacterial meningitis. Among all other benefi ciaries (e.g., spouses, children, retirees, etc.) streptococcal meningitis was the most commonly specifi ed type of bacterial meningitis.
Meningococcal meningitis was diagnosed among 91 active component service members, 14 Reserve/Guard service members, and 251 other benefi ciaries (Figure 2). Th e overall rate in active component service members was 0.41 per 100,000 person-years. Th e incidence rate was relatively stable from 1998 to 2008, and then varied greatly from 2009 through 2013. In 2009 and 2011, there were no cases of meningococcal meningitis in active component service members. During the entire surveillance period, there were docu-mented an additional 266 cases of meningococcal disease that were not recorded as meningitis. Th ese included meningococcemia (n=150), carditis (n=13), and other specifi ed and unspecifi ed meningococcal infections (n=103). Th ese cases aff ected 38 active com-ponent members, 6 Reserve and Guard members, and 222 other benefi ciaries.

M S M R Vol. 20 No. 11 November 2013 Page 16
Surveillance Snapshot: Age and Gender Distribution of Service Members, Active Component, U.S. Armed Forces, Compared to the U.S. Population, 2011
F I G U R E 1 . Percentage distribution by age and gender, active component, U.S. Armed Forces, 2011
Figures 1 and 2 depict the 2011 population pyramids for the active component of the U.S. Armed Forces and for the U.S. civilian population. Th ere were no service members under the age of 17 and 95.9 percent of male service members and 96.4 percent of female service members were under the age of 45. Th e median age of males was 27 years and that of females was 26 years. Males constitute 85.4 percent of active component service members and women 14.6 percent.
In contrast, 22.4 percent of the 2011 U.S. civilian population was under the age of 17 and the proportions of men and women who were in the age range 17 through 44 were 38.7 percent and 36.9 percent respectively. Th e median ages of civilian males and females were 35 and 38 years, respectively. Th e U.S. civilian population was 49.2 percent male and 50.8 percent female.
Although the Armed Forces Health Surveillance Center’s Defense Medical Surveillance System contains records of all service members’ demographic characteristics and of almost all their health care encounters (diagnoses and procedures) in the Military Health System, the results of epidemiologic analyses of this population are usually not generalizable to the U.S. population as a whole. Not only does the age and gender distribution of active component service members diff er greatly from the general U.S. population, but applicants for military service must meet standards of health and fi tness in order to qualify for entry. As a result, the vast major-ity – although not all – of the relatively young members of the Armed Forces begin their service free of detectable chronic disease and pre-morbid conditions.
F I G U R E 2 . Percentage distribution by age and gender, U.S. general population, 2011
32.1% 33.6%
40 30 20 10 0 10 20 30 40
0 to 4 years
10 to 14 years
20 to 24 years
30 to 34 years
40 to 44 years
50 to 54 years
60 to 64 years
70 to 74 years
80 to 84 years
Percentage of all males Percentage of all females
Age
Male Female
7.3%
7.2%
10 8 6 4 2 0 2 4 6 8 10
0 to 4 years
10 to 14 years
20 to 24 years
30 to 34 years
40 to 44 years
50 to 54 years
60 to 64 years
70 to 74 years
80 to 84 years
Percentage of all males Percentage of all females
Age
Male Female
November 2013 Vol. 20 No. 11 M S M R Page 17
0
5
10
15
20
25
30
Janu
ary
2003
April
200
3Ju
ly 2
003
Oct
ober
200
3Ja
nuar
y 20
04Ap
ril 2
004
July
200
4O
ctob
er 2
004
Janu
ary
2005
April
200
5Ju
ly 2
005
Oct
ober
200
5Ja
nuar
y 20
06Ap
ril 2
006
July
200
6O
ctob
er 2
006
Janu
ary
2007
April
200
7Ju
ly 2
007
Oct
ober
200
7Ja
nuar
y 20
08Ap
ril 2
008
July
200
8O
ctob
er 2
008
Janu
ary
2009
April
200
9Ju
ly 2
009
Oct
ober
200
9Ja
nuar
y 20
10Ap
ril 2
010
July
201
0O
ctob
er 2
010
Janu
ary
2011
April
201
1Ju
ly 2
011
Oct
ober
201
1Ja
nuar
y 20
12Ap
ril 2
012
July
201
2O
ctob
er 2
012
Janu
ary
2013
April
201
3Ju
ly 2
013
Oct
ober
201
3
No.
of c
ases
Marine Corps
Air Force
Navy
Army
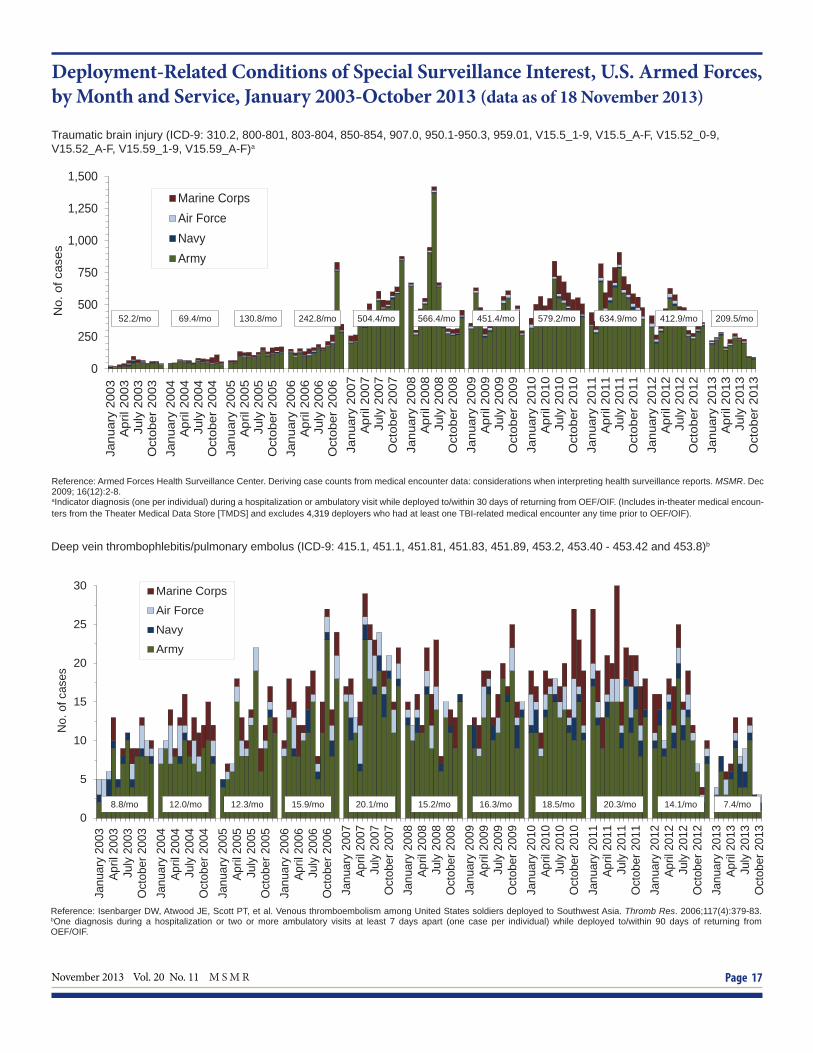
Deployment-Related Conditions of Special Surveillance Interest, U.S. Armed Forces, by Month and Service, January 2003-October 2013 (data as of 18 November 2013)
Traumatic brain injury (ICD-9: 310.2, 800-801, 803-804, 850-854, 907.0, 950.1-950.3, 959.01, V15.5_1-9, V15.5_A-F, V15.52_0-9, V15.52_A-F, V15.59_1-9, V15.59_A-F)a
0
250
500
750
1,000
1,250
1,500
Janu
ary
2003
Apr
il 20
03Ju
ly 2
003
Oct
ober
200
3Ja
nuar
y 20
04A
pril
2004
July
200
4O
ctob
er 2
004
Janu
ary
2005
Apr
il 20
05Ju
ly 2
005
Oct
ober
200
5Ja
nuar
y 20
06A
pril
2006
July
200
6O
ctob
er 2
006
Janu
ary
2007
Apr
il 20
07Ju
ly 2
007
Oct
ober
200
7Ja
nuar
y 20
08A
pril
2008
July
200
8O
ctob
er 2
008
Janu
ary
2009
Apr
il 20
09Ju
ly 2
009
Oct
ober
200
9Ja
nuar
y 20
10A
pril
2010
July
201
0O
ctob
er 2
010
Janu
ary
2011
Apr
il 20
11Ju
ly 2
011
Oct
ober
201
1Ja
nuar
y 20
12A
pril
2012
July
201
2O
ctob
er 2
012
Janu
ary
2013
Apr
il 20
13Ju
ly 2
013
Oct
ober
201
3
No.
of c
ases
Marine CorpsAir ForceNavyArmy
Reference: Armed Forces Health Surveillance Center. Deriving case counts from medical encounter data: considerations when interpreting health surveillance reports. MSMR. Dec 2009; 16(12):2-8.aIndicator diagnosis (one per individual) during a hospitalization or ambulatory visit while deployed to/within 30 days of returning from OEF/OIF. (Includes in-theater medical encoun-ters from the Theater Medical Data Store [TMDS] and excludes 4,319 deployers who had at least one TBI-related medical encounter any time prior to OEF/OIF).
Reference: Isenbarger DW, Atwood JE, Scott PT, et al. Venous thromboembolism among United States soldiers deployed to Southwest Asia. Thromb Res. 2006;117(4):379-83.bOne diagnosis during a hospitalization or two or more ambulatory visits at least 7 days apart (one case per individual) while deployed to/within 90 days of returning fromOEF/OIF.
Deep vein thrombophlebitis/pulmonary embolus (ICD-9: 415.1, 451.1, 451.81, 451.83, 451.89, 453.2, 453.40 - 453.42 and 453.8)b
8.8/mo 12.0/mo 12.3/mo 15.9/mo 20.1/mo 15.2/mo 16.3/mo 18.5/mo 20.3/mo 14.1/mo 7.4/mo
52.2/mo 69.4/mo 130.8/mo 242.8/mo 504.4/mo 566.4/mo 451.4/mo 579.2/mo 634.9/mo 412.9/mo 209.5/mo
M S M R Vol. 20 No. 11 November 2013 Page 18
0
5
10
15
20
Janu
ary
2003
April
200
3Ju
ly 2
003
Oct
ober
200
3Ja
nuar
y 20
04Ap
ril 2
004
July
200
4O
ctob
er 2
004
Janu
ary
2005
April
200
5Ju
ly 2
005
Oct
ober
200
5Ja
nuar
y 20
06Ap
ril 2
006
July
200
6O
ctob
er 2
006
Janu
ary
2007
April
200
7Ju
ly 2
007
Oct
ober
200
7Ja
nuar
y 20
08Ap
ril 2
008
July
200
8O
ctob
er 2
008
Janu
ary
2009
April
200
9Ju
ly 2
009
Oct
ober
200
9Ja
nuar
y 20
10Ap
ril 2
010
July
201
0O
ctob
er 2
010
Janu
ary
2011
April
201
1Ju
ly 2
011
Oct
ober
201
1Ja
nuar
y 20
12Ap
ril 2
012
July
201
2O
ctob
er 2
012
Janu
ary
2013
April
201
3Ju
ly 2
013
Oct
ober
201
3
No.
of c
ases
Marine CorpsAir ForceNavyArmy
0
5
10
15
20
25
30
35
40
Janu
ary
2003
April
200
3Ju
ly 2
003
Oct
ober
200
3Ja
nuar
y 20
04Ap
ril 2
004
July
200
4O
ctob
er 2
004
Janu
ary
2005
April
200
5Ju
ly 2
005
Oct
ober
200
5Ja
nuar
y 20
06Ap
ril 2
006
July
200
6O
ctob
er 2
006
Janu
ary
2007
April
200
7Ju
ly 2
007
Oct
ober
200
7Ja
nuar
y 20
08Ap
ril 2
008
July
200
8O
ctob
er 2
008
Janu
ary
2009
April
200
9Ju
ly 2
009
Oct
ober
200
9Ja
nuar
y 20
10Ap
ril 2
010
July
201
0O
ctob
er 2
010
Janu
ary
2011
April
201
1Ju
ly 2
011
Oct
ober
201
1Ja
nuar
y 20
12Ap
ril 2
012
July
201
2O
ctob
er 2
012
Janu
ary
2013
April
201
3Ju
ly 2
013
Oct
ober
201
3
No.
of c
ases
Marine CorpsAir ForceNavyArmy
Deployment-related conditions of special surveillance interest, U.S. Armed Forces, by month and service, January 2003-October 2013 (data as of 18 November 2013)
Amputations (ICD-9-CM: 887, 896, 897, V49.6 except V49.61-V49.62, V49.7 except V49.71-V49.72, PR 84.0-PR 84.1, except PR 84.01-PR 84.02 and PR 84.11)a
Reference: Army Medical Surveillance Activity. Deployment-related condition of special surveillance interest: amputations. Amputations of lower and upper extremities, U.S. Armed Forces, 1990-2004. MSMR. Jan 2005;11(1):2-6.aIndicator diagnosis (one per individual) during a hospitalization while deployed to/within 365 days of returning from OEF/OIF/OND.
Heterotopic ossifi cation (ICD-9: 728.12, 728.13, 728.19)b
Reference: Army Medical Surveillance Activity. Heterotopic ossifi cation, active components, U.S. Armed Forces, 2002-2007. MSMR. Aug 2007; 14(5):7-9.bOne diagnosis during a hospitalization or two or more ambulatory visits at least 7 days apart (one case per individual) while deployed to/within 365 days of returning from OEF/OIF/OND.
5.6/mo 10.7/mo 12.6/mo 13.3/mo 16.9/mo 7.8/mo 7.3/mo 16.7/mo 21.8/mo 11.8/mo 2.8/mo
0.8/mo 2.7/mo 5.0/mo 7.8/mo 10.8/mo 9.1/mo 5.2/mo 6.3/mo 10.3/mo 9.7/mo 4.8/mo

November 2013 Vol. 20 No. 11 M S M R Page 19
0
25
50
75
100
125
Janu
ary
2003
April
200
3Ju
ly 2
003
Oct
ober
200
3Ja
nuar
y 20
04Ap
ril 2
004
July
200
4O
ctob
er 2
004
Janu
ary
2005
April
200
5Ju
ly 2
005
Oct
ober
200
5Ja
nuar
y 20
06Ap
ril 2
006
July
200
6O
ctob
er 2
006
Janu
ary
2007
April
200
7Ju
ly 2
007
Oct
ober
200
7Ja
nuar
y 20
08Ap
ril 2
008
July
200
8O
ctob
er 2
008
Janu
ary
2009
April
200
9Ju
ly 2
009
Oct
ober
200
9Ja
nuar
y 20
10Ap
ril 2
010
July
201
0O
ctob
er 2
010
Janu
ary
2011
April
201
1Ju
ly 2
011
Oct
ober
201
1Ja
nuar
y 20
12Ap
ril 2
012
July
201
2O
ctob
er 2
012
Janu
ary
2013
April
201
3Ju
ly 2
013
Oct
ober
201
3
No.
of c
ases
Marine Corps
Air Force
Navy
Army
0
1
2
3
4
5
6
Janu
ary
2003
April
200
3Ju
ly 2
003
Oct
ober
200
3Ja
nuar
y 20
04Ap
ril 2
004
July
200
4O
ctob
er 2
004
Janu
ary
2005
April
200
5Ju
ly 2
005
Oct
ober
200
5Ja
nuar
y 20
06Ap
ril 2
006
July
200
6O
ctob
er 2
006
Janu
ary
2007
April
200
7Ju
ly 2
007
Oct
ober
200
7Ja
nuar
y 20
08Ap
ril 2
008
July
200
8O
ctob
er 2
008
Janu
ary
2009
April
200
9Ju
ly 2
009
Oct
ober
200
9Ja
nuar
y 20
10Ap
ril 2
010
July
201
0O
ctob
er 2
010
Janu
ary
2011
April
201
1Ju
ly 2
011
Oct
ober
201
1Ja
nuar
y 20
12Ap
ril 2
012
July
201
2O
ctob
er 2
012
Janu
ary
2013
April
201
3Ju
ly 2
013
Oct
ober
201
3
No.
of c
ases
Marine Corps
Air Force
Navy
Army
Deployment-Related Conditions of Special Surveillance Interest, U.S. Armed Forces, by Month and Service, January 2003-October 2013 (data as of 18 November 2013)
Severe acute pneumonia (ICD-9: 518.81, 518.82, 480-487, 786.09)a
Leishmaniasis (ICD-9: 085.0 to 085.9)b
1.9/mo 0.3/mo 0.9/mo 1.1/mo 1.1/mo 0.7/mo 0.8/mo 0.9/mo 0.7/mo 0.4/mo 0.3/mo
41.7/mo 44.2/mo 13.4/mo 8.7/mo 4.5/mo 4.7/mo 3.3/mo 5.5/mo 3.1/mo 2.1/mo 0.9/mo
Reference: Army Medical Surveillance Activity. Deployment-related condition of special surveillance interest: severe acute pneumonia. Hospitalizations for acute respiratory failure (ARF)/acute respiratory distress syndrome (ARDS) among participants in Operation Enduring Freedom/Operation Iraqi Freedom, active components, U.S. Armed Forces, January 2003-November 2004. MSMR. Nov/Dec 2004;10(6):6-7.aIndicator diagnosis (one per individual) during a hospitalization while deployed to/within 30 days of returning from OEF/OIF/OND.
Reference: Army Medical Surveillance Activity. Deployment-related condition of special surveillance interest: leishmaniasis. Leishmaniasis among U.S. Armed Forces, January 2003-November 2004. MSMR. Nov/Dec 2004;10(6):2-4.bIndicator diagnosis (one per individual) during a hospitalization, ambulatory visit, and/or from a notifi able medical event during/after service in OEF/OIF/OND.

Medical Surveillance Monthly Report (MSMR)Armed Forces Health Surveillance Center11800 Tech Road, Suite 220 (MCAF-CS)Silver Spring, MD 20904
THE MEDICAL SURVEILLANCE MONTHLY REPORT (MSMR), in continuous publication since 1995, is produced by the Armed Forces Health Surveillance Center (AFHSC). Th e MSMR provides evidence-based estimates of the incidence, distribution, impact and trends of illness and injuries among United States military members and associated populations. Most reports in the MSMR are based on summaries of medical administrative data that are routinely provided to the AFHSC and integrated into the Defense Medical Surveillance System for health surveillance purposes.
All previous issues of the MSMR are available online at www.afh sc.mil. Subscriptions (electronic and hard copy) may be requested online at www.afh sc.mil/msmrSubscribe or by contacting AFHSC at (301) 319-3240. E-mail: msmr.afh [email protected]
Submissions: Instructions to authors are available at www.afh sc.mil/msmr.
All material in the MSMR is in the public domain and may be used and reprinted without permission. Citation formats are available at www.afh sc.mil/msmr
Opinions and assertions expressed in the MSMR should not be construed as refl ecting offi cial views, policies, or positions of the Department of Defense or the United States Government.
Follow us: www.facebook.com/AFHSCPAGE
http://twitter.com/AFHSCPAGE
ISSN 2158-0111 (print)ISSN 2152-8217 (online)
Director, Armed Forces Health Surveillance Center
CAPT Kevin L. Russell, MD, MTM&H, FIDSA (USN)
Editor
Francis L. O’Donnell, MD, MPH
Writer-Editor
Denise Olive Daniele, MSCatherine W. Mitchem
Contributing Editor
John F. Brundage, MD, MPH Leslie L. Clark, PhD, MS
Data Analysis
Stephen B. Taubman, PhD Kathleen M. Shannon, MPHMonique-Nicole Anthony, MPH
Editorial Oversight
CAPT Sharon L. Ludwig, MD, MPH (USCG)COL William P. Corr, MD, MPH (USA)Joel C. Gaydos, MD, MPHMark V. Rubertone, MD, MPH