Embed Size (px)
Citation preview

Final Report- Immunization Resource Tracking Exercise: Case Study of Tajikistan
44510
Immunization Resource Tracking Exercise:
Case Study on the
Republic of Tajikistan
Logan Brenzel, HDNHE
With contributions from
Santiago Cornejo, HDNHE
Ivdity Chikovani, Curatio, Georgia
Ajay Behl, CDC, Atlanta
Maya Vijayaragavan, CDC, Atlanta
June 2008
Pub
lic D
iscl
osur
e A
utho
rized
Pub
lic D
iscl
osur
e A
utho
rized
Pub
lic D
iscl
osur
e A
utho
rized
Pub
lic D
iscl
osur
e A
utho
rized
Pub
lic D
iscl
osur
e A
utho
rized
Pub
lic D
iscl
osur
e A
utho
rized
Pub
lic D
iscl
osur
e A
utho
rized
Pub
lic D
iscl
osur
e A
utho
rized
Final Report: Immunization Resource Tracking Exercise: Case Study of Tajikistan
i
Acknowledgements
This Case Study was prepared as part of the Knowledge Product on Immunization Resource Tracking/Sustainable Financing of Immunization in HDNHE, financed by the Dutch Trust Fund (BNPP) and the GAVI Trust Fund. Several researchers made considerable contributions to data collection and analysis and need to be recognized for their work. Santiago Cornejo was responsible for field work in Tajikistan both the Health PETS and the immunization module. Ivdity Chikovani, Curatio Foundation, Republic of Georgia conducted primary data collection and analysis of the evaluation of the vertical immunization program in Tajikistan. Maya Vijaragavan and Ajay Behl, Centers for Disease Control and Prevention (CDC) undertook initial data analysis of the facility survey for the immunization component of the Health PETS in Tajikistan. The support of the Health PETS team, including Jariya Hoffman, Anne Bakilana, Sarbani Chakrabarty, Wale Wane, Rekha Menon, and Vladimir Kolchin should be acknowledged for their contributions to survey and questionnaire design, quality control of data, and feedback on the work. Mention should be made of Zerkalo in Dushanbe, Tajikisan for data collection and entry of the facility survey. Finally, this case study benefited from the contributions of our peer reviewers, Pia Schneider (ECSHD), Magnus Lindelow (EASHD), and Waly Wane (DECRG), A.K. Nandakumar (BMGF), and Miloud Kaddar (WHO). The immunization team in HDNHE (Amie Batson, Joe Naimoli, Anthony Measham) provided valuable comments along the way.
Final Report: Immunization Resource Tracking Exercise: Case Study of Tajikistan
ii
Table of Contents
Abbreviations.................................................................................................................................. iv
Executive Summary......................................................................................................................... 1
Section 1: Motivation for the Immunization Resource Tracking Exercise...................................... 4
Section 2: Background on the Health Sector and the National Immunization Program in the Republic of Tajikistan ..................................................................................................... 5
Section 3: Methods for the Immunization Resource Tracking Exercise ......................................... 9
Section 4: Findings of the Immunization Component of the Tajikistan Health PETS .................. 13
Section 5: Results from the Analysis of the NIP ........................................................................... 26
Section 6: Main Findings and Recommendations ......................................................................... 32
References...................................................................................................................................... 37
Final Report: Immunization Resource Tracking Exercise: Case Study of Tajikistan
iii
List of Tables
Table 1: GAVI Alliance Commitments to Selected Countries in the ECA Region......................... 7
Table 2: Sample for the Facility-Based Immunization Survey, Health PETS 12
Table 3: Mean Value of Staff Contributions per Facility for Outreach, Supervision, Vaccine Collection, and Meetings in Tajikistan.......................................................................... 14
Table 4: Outreach and Supervision Trips in 2005 ......................................................................... 16
Table 5a: Percent of Facilities with Stockouts in 2005 by Vaccine 17
Table 5b: Average Number of Weeks Without Vaccine in 2005 .................................................. 17
Table 6: Mean Number of Vaccine Doses Administered by Facility and Location ...................... 18
Table 7: Total Immunization Resource Requirements by Type of Facility.................................... 20
Table 8: Descriptive Statistics for the Variables Included in the Regression Analysis 21
Table 9: Results of the OLS Regression Analysis of Determinants of Immunization Dose Levels ................................................................................................................... 22
Table 10: Immunization Program Expenditures by Source in Tajikistan...................................... 24
Table 11: Immunization Expenditures as a Percent of GHE in Tajikistan (2001-2005) ............... 24
Table 12: Government NIP Budget Allocations to RegCIs by Indicator (2005-2006).................. 26
Table 13: Allocation of Donor Funding to Regions in Tajikistan ................................................. 27
Table 14: Discrepancies in Accounting of GAVI ISS Funding Between Republican and Regional. Level, 2005.................................................................................................................... 29
List of Figures
Figure 1: Evolution of DTP3 Coverage Rates in Selected ECA Countries ..................................... 7
Figure 2: Flow of Funds for the NIP, Tajikistan.............................................................................. 9
Figure 3: Share of Financing for Immunization Services in Health Facilities in Tajikstan........... 13
Figure 4: Cost Profile of Immunization Resource Needs (Non-Wage) in Tajikistan Facilities .... 19
Figure 5: Average NIP Financing by Source in Tajikistan (2002-2005) ....................................... 25
Figure 6: Trends in Donor Financing of the NIP in Tajikistan, 2001-2005................................... 25
Figure 7: Comparison of GAVI ISS and Government NIP Expenditures (2002-2005) 28
Figure 8: Allocation of GAVI ISS Funds to Regional Level in Tajikistan, 2005.......................... 28
Final Report: Immunization Resource Tracking Exercise: Case Study of Tajikistan
iv
Abbreviations
AKF Aga Khan Foundation
AKHS Aga Khan Health Services
BCG Bacille Calmette Guerin
CPIA Country Policy and Institutional Assessment
CRH Central Rayon Hospital
DTP Diphtheria, Tetanus and Pertussis vaccine
EPI Expanded Program on Immunization
GAVI Global Alliance for Vaccines and Immunization
FSP Financial Sustainability Plan
FTE Full-Time Equivalent
GAVI GAVI Alliance
GNI Gross National Income
GoT Government of Tajikistan
GBAO Gorno Badakshan Autonomous Oblast
HSS Health Systems Strenghtening
ICC Inter-agency Coordinating Committee
INS Injection Safety Support
ISS Immunization Services Support
JICA Japan International Cooperation Agency
MH Medical Houses
MoF Ministry of Finance
MoH Ministry of Health
NVS New and Underused Vaccine Support
OPV Oral polio vaccine
PETS Public Expenditure Tracking Survey
PHC Primary Health Care
PRSP Poverty Reduction Strategy Paper
RayCI Rayon Center of Immunoprophylaxis
RegCI Rayon Center of Immunoprophylaxis
RepCI Republican Center of Immunoprophylaxis
SM Local Currency – Somoni ($1USD=S3.4418)
SUB Rural hospitals
SVA Rural physician ambulatories
VPDs Vaccine Preventable Diseases

Final Report: Immunization Resource Tracking Exercise: Case Study of Tajikistan
v

Final Report: Immunization Resource Tracking Exercise: Case Study of Tajikistan
1
Executive Summary
Rationale and Purpose
1. While there has been substantial fundraising for national immunization programs in recent years to achieve the Millennium Development Goals, particularly MDG4, there some evidence to suggest that impact on coverage rates have been slow and that resources are not reaching front line providers. The Republic of Tajikistan provides an interesting case study in which to examine the relationships between increased financing and coverage rates for the national immunization program, and to explore the extent to which these resources reach down to service delivery providers in primary health care facilities.
2. Between 2001 and 2005, the Government of Tajikistan substantially increased their contributions to the National Immunization Program (NIP). In addition, Tajikistan received approximately $8 million in commodity and cash support from the GAVI Alliance, including more than $1 million in cash support for Immunization Systems Strengthening (ISS) from the GAVI Alliance. Total donor contributions to the national immunization program exceeded S16 million. However, in the aggregate, coverage rates did not appear to be positively affected by additional resources, with some areas of the country reporting slight declines in DTP3 coverage over this period.
3. This Case Study summarizes the approach and findings of an immunization resource tracking exercise undertaken in the Republic of Tajikistan for the period 2001-2005, with focus on 2005 as the reference year. The case is an exploratory exercise to examine allocation and use of both donor and government resources. The hypotheses explored are that: a) allocation of government and donor resources for immunization services from the central to sub-national level is inequitable and unrelated to needs or program performance; b) financing for the national immunization program (NIP) is fragmented and highly centralized, limiting resources available to frontline providers; c) the NIP is underfunded and has significant sustainability issues; and, 4) GAVI resources play an important role in the NIP in Tajikistan.
4. The study was conducted in three phases and began with a fact-finding mission to learn about the Tajikistan immunization program and health sector organization and financing. This was followed by a program-specific analysis of government and donor budgets and expenditures; immunization program performance and coverage; vaccine stock positions; and, budget processes using standardized data collection instruments. Interviews also were conducted with program managers and central, regional, and rayon levels, and donor representatives to obtain their impressions on resource allocation, GAVI financing, and the sustainability of the program.
5. Subsequent to the evaluation of the NIP, there was an opportunity to integrate an immunization-specific module into the Tajikistan Health Public Expenditure Tracking Survey (PETS). Data were collected using a pre-tested questionnaire from a nationally representative sample of 328 health facilities on staffing, outreach and supervision activities, vaccine supply, travel, facility financing, GAVI and in-kind contributions, and immunization doses and coverage. Facility data were collected in 2006 for the previous year – 2005. Data were entered into a statistical database for analysis using STATA.
Results
6. The results of the immunization resource tracking exercise are the following:

Final Report: Immunization Resource Tracking Exercise: Case Study of Tajikistan
2
6.1 Financing of the NIP increased annually between 2001 and 2005 to approximately $1.5 million per year, or $0.22 per capita. The NIP was highly dependent upon external financing (97% of total financing), and the level of contribution by donors (UNICEF, WHO, JICA, GAVI Alliance, and others) varies from year to year. This volatility placed the program in a vulnerable position vis-à-vis sustainability, particularly as the period of GAVI financing for the tetravalent vaccine and ISS comes to an end.
6.2 GAVI resources were important for the national immunization program in Tajikistan. However, more than 90% of GAVI ISS resources were retained at national level, and they financed capital expenditures. The recurrent cost implications of capital equipment purchases will exacerbate future funding gaps and pose challenges to the financial sustainability of the program. At the health facility level, GAVI resources were positively related to the number of doses, but this result was insignificant.
6.3 The study found that allocation of government and donor resources for immunization services from the central to sub-national level in Tajikistan is inequitable and unrelated to needs or program performance. The study also found that financing for the NIP is fragmented and highly centralized, limiting the availability of resources for frontline providers to ensure adequate, quality service delivery.
6.4 There is significant underfunding of immunization services at the facility level. The mean total requirement for immunization activities for the sample of 328 facilities in 2005 was S2,079 ($650), which is more than four-times the level of government resources (in-kind and budget) allocated to primary health facilities.
6.5 At the facility level, voluntary payments by staff (contributions) represented 20% of total facility financing for immunization activities, including supervision, outreach, and vaccine collection. This is an area that warrants further investigation.
6.6 While the government reported stock-outs of oral polio vaccine (OPV) in 2005, the PETS survey uncovered widespread stock-outs for all childhood vaccines. Ninety-eight percent of facilities reported a stock-out of at least one vaccine in 2005, and facilities were without vaccines for six weeks on average. This finding may be related to poor forecasting of vaccine needs, leading to frequent travel for stock replenishment, and resulting in high transactions costs and inefficiencies for the health system.
6.7 Controlling for population income and regional characteristics, the study found that the availability of facility resources and hours worked by facility staff positively and significantly influenced the number of doses administered in 2005.
Recommendations
7. The reforms being undertaken presently to strengthen the Tajikistan health sector, including per capita financing of primary health care and movement toward a Sector-Wide Approach will help to alleviate some of the problems related to under-funding of the national immunization program, fragmentation of government and donor financing, and potential leakages of resources between levels of the health system. Additional recommended activities to be undertaken by the national immunization program, the ministries of health and finance, and the donor community include:
¾ Greater advocacy should be undertaken by the national immunization program and the Ministry of Health working with the Ministry of Finance to ensure adequate allocation of resources for facility operating costs at rayon and jamoat levels.
Final Report: Immunization Resource Tracking Exercise: Case Study of Tajikistan
3
¾ The National Immunization Program should provide annual reports on the allocation and use of donor funding, including GAVI commodity and cash resources, to ministries of health and finance.
¾ A short policy note should be developed that outlines specific criteria to be used to allocate donor resources and to generate better alignment and harmonization of donor resources for immunization outcomes.
¾ Parallel to the development of the SWAp in Tajikistan, a simple tracking tools could be developed to monitor how donor and government resources are allocated to sub-national levels over time based on the criteria established.
¾ The NIP monitoring system needs to be revamped, including updated denominator information, streamlining vaccination reporting forms, building capacity in record-keeping and reporting.
¾ Vaccine stock management and logistics needs to be strengthened, including better forecasting of vaccine needs, and generating a tracking system for monitoring critical supplies and supply points. This is urgently needed as an input into the development of the conditional cash transfer component of the Community Based Health Project of the World Bank.
¾ A capital equipment register, particularly for vehicles, needs to be developed and implemented. This could include a system of vehicle logbooks for tracking vehicle usage.
¾ Guidelines on best practice examples for planning, budgeting, resource allocation, financial management and reporting of GAVI cash assistance (ISS and HSS) should be developed and disseminated by the GAVI Secretariat.
8. The Tajikistan Health PETS provided an interesting opportunity to examine immunization-specific resource flows to health facilities. In addition to benefitting from the expertise of the Health PETS team, the immunization resource tracking exercise could be placed within the larger context of health sector resource flows and expenditures. The process of conducting the PETS led to greater resource allocation to the NIP on the part of the national government. However, there were limitations to the information that could be obtained for immunization resource flows using the PETS methodology. Because primary health facilities did not prepare budgets, it was not possible to evaluate differences between expected and actual resource flows to frontline providers.
9. The cost and time required for field work may preclude other countries from undertaking such an extensive immunization resource tracking exercise. Modification of the approaches undertaken for the Tajikistan immunization resource tracking exercise may be useful for future exercises. A National Health Accounts (NHA) framework (recently developed Child Health Sub-Accounts) may be useful for organizing information about donor and government contributions to vertical aspects of national programs, and provide links between funding sources, intermediaries, and uses of funds. An NHA framework could be supplemented with interviews about the resource allocation process and a purposive sample of facilities to obtain in-depth information on resource flows, bottlenecks, and leakages to the facility level.
6.10 Additional research needs to be conducted to learn more about staff contributions to PHC and immunization services in Tajikistan. In particular, it would be useful to learn the sources of the contributions and to what extent staff use other benefits and income to compensate for these expenditures.
Final Report: Immunization Resource Tracking Exercise: Case Study of Tajikistan
4
Section 1: Motivation for the Immunization Resource Tracking Exercise in Tajikstan 1.1 This paper summarizes the approach and findings of a case study of an immunization resource tracking exercise undertaken in the Republic of Tajikistan for 2005. The immunization resource tracking exercise in Tajikistan was largely an exploratory exercise to examine allocation and use of both donor and government resources for the national immunization program and immunization service delivery.
1.2 Tajikistan was selected as the focus of this work for several reasons: a) Tajikistan has received significant external financing of immunization services from the GAVI Alliance since 2001, and introduced new vaccines (Hepatitis B) in 2002.; b) immunization program performance, measured as the number of DTP3 doses provided, has not increased at commensurate levels as immunization financing; and, c) the start of a Health PETS was an opportunity to link immunization tracking to health resource tracking. The study had the benefit of seeing how results in immunization resource flows fit within those of the health sector. This case study represents one of the first systematic assessments of immunization resource flows at country level.
1.3 The literature also suggests that additional funding for immunization services may not necessarily be associated with increased immunization coverage. Loevinsohn and others (2006) show that physical and financial inputs do not appear to explain low coverage or variation in coverage between districts in Pakistan. 1 Another study found variation between countries in terms of management, allocation patterns, and uses of GAVI ISS funding (Chee and others, 2007, Chee and others, 2004).
1.4 There are several possible explanations as to why additional funding for immunization services might not translate into increased immunization coverage levels. First, as coverage levels increase, so does the cost of reaching additional children (Damien and others, 2005; Brenzel, 2005). Additional financing does not translate into the same number of additional children immunized because of decreasing returns to scale. The main factors influencing costs as coverage increases include location and infrastructure (costs in rural areas are likely to be higher with increasing coverage levels); current health manpower constraints and the need for incentives or more personnel to scale up; the size of fixed costs; and the management and organization required to achieve higher coverage levels (Johns, et al, 2004).
1.5 Second, there may be health system bottlenecks that cannot be overcome with financing for immunization services alone. Health system constraints affecting immunization program coverage include lack of health personnel in remote, rural health clinics to provide vaccinations; weak logistics and supply management systems; weak governance and public expenditure management, among others. Additional funding targeted at the national immunization program will not specifically address these constraints which often require broader health sector reforms or those in other sectors.
1.6 Third, while the immunization program may have substantial resources, these funds may not trickle down to front line providers affecting the level and quality of services provided. Without material, financial, and physical resources, health workers and facilities are unlikely to be able to respond to demand for immunization or to seek out children who need vaccinations. Funds for the
1 Chunling Liu and others (2007) find that GAVI ISS allocations per surviving infant had a significant and positive relationship with DTP3 coverage in countries with coverage of 65% or less. However, this study measured disbursements from the GAVI Secretariat in Geneva to the country and not expenditures made within the country for immunization activities, so that conclusions about causality between GAVI ISS funding and immunization coverage are spurious.

Final Report: Immunization Resource Tracking Exercise: Case Study of Tajikistan
5
immunization program may be reallocated toward other uses or geographical areas during the course of the year, such as the need to respond to unanticipated disease outbreaks and additional surveillance. Finally, immunization resources may be allocated toward unintended or illegitimate purposes, and be subject to fraud and graft.
Section 2: Background on the Health Sector and the National Immunization Program in the Republic of Tajikistan2.1 The Republic of Tajikistan is a highly mountainous and landlocked country with a population of approximately 6.4 million in 2005. With independence in the early 1990s (after 70 years of Soviet rule) and a civil war from 1992 to 1997, Tajikistan experienced severe economic disruption. The Republic of Tajikistan is among the poorest countries in the world with a GNI per capita of $US390 (2007). Health and development indicators are dismal and the health sector in Tajikistan faces multiple challenges. The infant mortality rate is approximately 90/1,000 live births, and the under-5 mortality rate (U5MR) is near 120/1,000 live births. Maternal mortality ratio is estimated to be 100/100,000 live births, and long-term malnutrition among children is near 30 percent (Republic of Tajikistan, Public Expenditure Tracking Survey, Health Sector, 2007). The country is ranked 122 out of 177 in the Human Development Index (UNDP, 2007).
2.2 Tajikistan has inherited a Soviet-style medical system structured around a network of health facilities with emphasis on in-patient care. The country has a total of 5 oblasts (regions), 61 rayons (provinces), and 445 Jaomats (districts). This system is highly specialized, hierarchical, and fragmented. The State is the main provider of health care services, although private, out-of-pocket expenditures are the largest source of financing in the country at 71% of total resources (Tajikistan Health Sector Note, 2005). In corruption surveys, the health sector is ranked as the most corrupt sector in Tajikistan (Lewis, 2006).
2.3 The Ministry of Health (MoH) is responsible for health sector planning, policy development and budgeting. In addition, the MOH also is responsible for managing and financing Republican level health care facilities (e.g., tertiary clinics and research institutes), as well as public health functions, such as the Republican Center of Immunoprophylaxis (RepCI).
2.4 A total of 2,617 health facilities have been identified in Tajikistan (Tajikistan Health PETS, 2008). Outpatient and inpatient services are provided through a hierarchical system, beginning at the level of the Central Rayon Hospital (CRH). The CRH provides services and allocates public resources to the set of primary health care facilities for which it is responsible. Primary and secondary level health facilities also are subordinated to local administrations or hukumats.
2.5 Health expenditures are extremely low for the ECA region and the world at $1 per capita (Tajikistan Health PETS, 2008). Increasing public financing for health is considered a key policy objective. Health financing as a percentage of total government expenditures increased from 5.7 percent in 2004 to 7.4 percent in 2005. Donors provide significant resources for variable inputs.2 Eighty percent of public health expenditures are allocated by local governments (Cashin, 2004). The oblast and rayon health sector budget allocations are typically insufficient to operate the local health care system.
2.6 The health sector features prominently in the Government of Tajikistan’s (GOT) Poverty Reduction Strategy (PRSP), and the GOT has committed to accelerating progress on the MDGs. The Government of Tajikistan has implemented reform measures to strengthen primary care. In 2005, the Ministry of Health and development partners adopted a Health Financing Strategy
2 World Bank Health Policy Note (2005), World Bank Poverty Assessment (2005).
Final Report: Immunization Resource Tracking Exercise: Case Study of Tajikistan
6
which introduced per capita financing for PHC in two pilot rayons and a guaranteed Basic Benefits Package (BBP).3 The MOH and MOF also have agreed to pool and redistribute resources at the Oblast level.
2.7 Health budget formulation in Tajikistan continues to be norm- and input-based and is highly centralized. The Ministry of Finance (MOF) is responsible for the overall budgeting process. Draft budgets are prepared by oblasts, Dushanbe city, GBAO and RRS from bottom-up estimates of expenditure requirements based on norms for the level of inputs (e.g. number of health facilities, hospital beds, and staff) and targets set by the MOF for salaries, energy and utility costs, protected items, and inflation. Final budget allocations are distributed to and managed by oblast administrations.
National Immunization Program in Tajikistan
2.8 Prior to 1996, the national immunization program was supervised and controlled by the Sanitary Epidemiology Stations (SES). However, in response to disease outbreaks in 1993-94, a vertical program -- the Republican Center for Immunoprophylaxis (RepCI) was created in 1996. The RepCI is responsible for planning, budgeting, and monitoring immunization activities; provision of vaccines and supplies; data analysis and reporting; and, surveillance. The RepCI reports directly to the Minister of Health.
2.9 Six regional branches were created later (1997-2003) in Dushanbe, Khatlon (Kurgan-Tube), Sogd (Khujand), GBAO (Khorog), Kuliab zone of Khatlon region (Kuliab City) and Rasht valley for six rayons of republican subordination (RRS). The RegCIs are accountable to the RepCI on programmatic and financial matters. At the rayon level, RayCIs were created at central rayon hospitals (CRH). The RayCIs are responsible for planning preventive activities in the rayon; providing vaccines and supplies to PHC facilities; facilitating outreach activities; maintaining vaccine cold stores; monitoring and reporting to the RegCIs; and, providing technical assistance to EPI providers. Rayons coordinate their activities with the RegCIs but they are financed by the CRH budget.
2.10 Immunization is one of the main primary health care services and is provided by PHC facilities and maternity units. In rural areas, immunization services are delivered through rayon policlinics, rural hospitals (SUB), rural physician ambulatories (SVA), rural health centers (RCZ), and medical houses (MH).
2.11 For the ECA region, Tajikistan has received the largest allocation of GAVI Alliance support since 2002 at $8 million (Table 1).
3 The BBP provides free services for vulnerable population groups and provides a legal framework for developing the co-payment policy for selected health services in hospitals. The implementation of BBP in hospitals will support efforts to formalize informal payments by allowing hospitals to charge for services not covered by the state under the BBP (paid services).

Final Report: Immunization Resource Tracking Exercise: Case Study of Tajikistan
7
Table 1: GAVI Alliance Commitments to Selected Countries in the ECA Region
Country HSS 4 INS ISS NVS Grand Total Albania 101,000 2,952,908 3,053,908 Armenia 57,000 79,860 611,558 748,418 Azerbaijan 154,000 749,380 1,126,247 2,029,627 Bosnia & Herzegovina
63,071 2,231,377 2,294,448
Georgia 435,500 65,600 135,500 804,798 1,441,398 Kyrgyz Republic 1,155,000 178,000 256,000 1,708,199 3,297,199 Moldova 88,000 1,880,015 1,968,015 Tajikistan 347,093 1,042,000 6,647,534 8,036,627 Turkmenistan 155,500 1,083,000 1,238,500
Ukraine 792,000 3,534,280 4,326,280 Uzbekistan 853,300 4,619,575 5,472,875
Grand Total 1,590,500 2,854,564 2,262,740 24,246,584 30,853,388
Source: GAVI, 2008.
2.12 Tajikistan has the lowest DTP3 coverage rates within the ECA region. Figure 1 shows that DPT3 coverage rates range from 97% in the Republic of Moldova to 86% in the Republic of Tajikistan, which also has the lowest measles coverage rates in the region. Despite additional resources ($8 million) provided to Tajikistan (in red), aggregate coverage increases were slight, if at all.
Figure 1: Evolution of DTP3 Coverage Rates in Selected ECA Countries
40
50
60
70
80
90
100
110
1992 1993 1994 1995 1996 1997 1998 1999 2000 2001 2002 2003 2004 2005 2006
Armenia Azerbaijan Georgia
Kyrgyzstan Republic of Moldova Tajikistan
Turkey Uzbekistan
Source: WHO-UNICEF Best Estimates (WHO, 2007). 5
2.13 There are significant differences between official (reported) DTP3 coverage rates in Tajikistan and survey results. For the last five years, official immunization coverage rates have been reported officially as over 90% for all EPI antigens. However, there are serious concerns that these figures are overestimated because of gaps in birth registration and deficiencies in
4 HSS refers to Health Systems Strengthening; INS refers to safe injection supplies; ISS refers to Immunization Services Strengthening; and NVS refers to new vaccines. 5 These figures do not reflect official government data For instance, official statistics for Tajikistan report 96% coverage, which have since been modified to be more in line with WHO-UNICEF estimates.

Final Report: Immunization Resource Tracking Exercise: Case Study of Tajikistan
8
coverage calculation. There is no standardized procedure for defining the appropriate denominator for different antigens, which contributes to inaccuracy of coverage figures. In addition, based on the 2000 census, the State Statistical Department estimates there are 26,000 more children in the target population than is used by the NIP to estimate coverage rates. This figure is based on the 2000 census. In 2007, given the discrepancies, the NIP agreed to review coverage using Statistical Department estimates which led to a reduction by 10 percentage points in official coverage rates.
2.14 The Multiple Indicator Cluster Survey (MICS) conducted in 2000 reported coverage rates for children less than one year of age that were 20 percentage points lower than official routine reported coverage rates. For instance, in the survey DTP3 coverage was estimated to be 76% instead of 96%; OPV3 was estimated at 78% rather than 96%; and measles coverage was 61% compared to 97%.
NIP Budgeting
2.15 Budget planning for the national immunization program is a top-down process performed by the RepCI. In August of each year, the RepCI develops a lump-sum budget estimate that includes regional and central level requirements, except for vaccines which is financed by donors or through the drugs budget. In November/December, after approval of the entire Ministry of Health budget by the Ministry of Finance, the RepCI receives a verbal communication on the total budget level which is usually 30% of the initial estimate. Based on the total approved budget, the RepCI prepares a detailed line item budget (Smeta) reflecting RepCI and RegCI needs. The RegCIs sometimes make an initial budget request, but these generally are not incorporated into the total budget request.
2.16 Once they are informed of their annual line item budget, the Central Rayon Hospital Chief Doctor prepares a line item budget, which includes all funding for RayCIs and facilities. This process is also top-down in that the RayCIs are not consulted regarding their financial needs. PHC facilities do not prepare budgets, nor do they know how much funding is allocated to them for operating costs.
Flow of funds for the NIP and for health facilities
2.17 Figure 2 provides an overview of the flow of funds for the health sector and to the national immunization program. Based upon agreed upon budgets and Smeta for the year, the Ministry of Finance makes budget transfers to the Oblast (regional) level to cover payroll and operating costs. Oblasts also generate their own revenue and report revenue forecasts to the Ministry of Finance. In cases when revenue collection at the oblast level is lower than expected, the difference is subsidized by the central government. The Oblast is responsible for transferring operating funds to the Hukumat (rayon) level based on rayon budgets, including the Central Rayon Hospital (CRH) budget. The figure also shows that each CRH is in charge of financing the operating costs of primary health care facilities within the rayon, through the funding provided by Oblasts. Jaomats (village level) also generate revenues and can provide funding directly to facilities.
2.18 There are three funding channels for the national immunization program. First, the government contribution to vertical immunization activities is channeled from the Ministry of Finance to the Ministry of Health, which in turn allocates the budget to the RepCI. These resources are allocated to the RegCIs and RayCIs from the RepCI. Second, donor financing, which has been maintained in separate bank accounts, flows directly to the RepCI from the Ministry of Finance. Donor funds are then allocated to activities and sub-national levels.

Final Report: Immunization Resource Tracking Exercise: Case Study of Tajikistan
9
Third, the government contribution for operational expenditures that has been allocated from the Ministry of Finance to the regional and rayon administration.
Figure 2: Flow of Funds for the National Immunization Program
Ministry of Health
Regional Center ofImmunoprophylaxis
(RegCI)
Ministry of Finance
Oblast (Regional) Administration (central
budget transfers)
Central Rayon Hospital n=61Rayon Centers of
Immunoprophylaxis (RayCIs)
Hukumat - Rayon Administration (local budget)
Jamoat -Village Administration PHC Facilities
n=2,617
Republican Center of Immunoprophylaxis
(RepCI)
Operational Budget Program Budget
Donor Financing
2.19 Figure 2 shows that the EPI Director controls budgets and resource allocation for immunization services down to the regional level, but has limited influence over resources allocated for operating costs at the rayon and facility levels where services are implemented. It is up to the local and regional governments to allocate sufficient operating resources to facilities to make them effective at providing services.
Section 3: Methods for the Immunization Resource Tracking Exercise3.1 The hypotheses considered for the immunization resource tracking study are the following:
• Allocation of government and donor resources for immunization services from the central to sub-national level is inequitable and unrelated to needs or program performance.
• Financing for the NIP is fragmented and highly centralized, limiting resources available to frontline providers.
• The National Immunization Program in Tajikistan is underfunded and has significant sustainability issues.
• GAVI resources play a significant role in the NIP in Tajikistan.

Final Report: Immunization Resource Tracking Exercise: Case Study of Tajikistan
10
3.2 The immunization resource tracking exercise in Tajikistan was conducted in three phases. Phase 1 consisted of a fact-finding mission to understand health sector and immunization program planning, budgeting and financing, and resulted in a Background Report that outlined funding flows and helped to develop initial questionnaires. 6
3.3 Subsequently, a program-specific analysis was conducted on government and donor budgets and expenditures; immunization program performance and coverage; vaccine stock positions; and, budget processes using standardized data collection instruments between 2001 and 2005 (Phase 2). This assessment consisted of a review of documents, such as GAVI Alliance Annual Progress Reports, the Financial Sustainability Plan, the Comprehensive Multi-Year Plan (cMYP), and the coverage survey data. Data were collected on government and donor budgets and expenditures, immunization program performance and coverage, vaccine stock positions, and budget processes for the vertical immunization program (see Annex 1 for questionnaires). Structured interviews also were conducted with the NIP Director, the six regional immunization directors, and representatives of donor organizations using pre-tested questionnaires to obtain their impressions on resource allocation, GAVI financing, and the sustainability of the program. This phase resulted in a report, the findings of which are discussed in a subsequent section (Chikovani, 2007).
Public Expenditure Tracking Surveys
3.4 In Phase 3 there was an opportunity to integrate an immunization-specific module into the Tajikistan Health Public Expenditure Tracking Survey (PETS). The PETS methodology evaluates the extent to which budgeted resources reach their intended destinations in the social sectors. Through health facility surveys, this approach generally examines the flow of funds and commodities from the national government, through sub-national governments, to health facilities to evaluate “breaks in the chain” (Devaranjan, 2002). These surveys assess the allocation and execution of the budget; distribution and management of essential commodities and supplies; collection and management of user fees; human resource availability; inventory and stocks of equipment and infrastructure; and service delivery bottlenecks that are related to underlying differences in performance (Reinikka and Smith, 2004; Renikka and Svensson, 2002).
3.5 The first PETS was conducted in Uganda in 1996 in the education and health sectors, where it was found that 87 percent of earmarked funding never reached intended schools (Dehn and others, 2003). Approximately 20 PETS have been conducted for the health sector, primarily in Sub-Saharan Africa. PETs have been conducted in Latin America (Peru, 2001) and East Asia (Papua New Guinea and Cambodia). Most PETS in Africa have been motivated by the objectives of increasing information on social sector spending, and to understand the weak link between expenditures and health outcomes. PETS carried out in Africa have found very high rates of leakage (difference between intended allocation and receipts from one level to the next). At one extreme is the situation of Chad, where only 1% of intended resources arrive at primary health facilities (Gauthier and Wane, 2007). Leakage rates were 70% or higher in Ghana, Tanzania, and Uganda, and non-wage expenditures were associated with higher leakage rates. Leakage appears to be more pronounced for in-kind resources than financial flows.
3.6 High leakage rates result in inadequate funding for operational costs, and prevent primary health care workers from having adequate resources to do their jobs. While leakage rates may be an indication of corruption, this relationship is difficult to establish for several reasons. First, resources may be reallocated for legitimate reasons during the year, and problems with budget
6 Cornejo, S. 2006. Immunization Resource Study in Tajikistan: Report of a Fact-Finding Mission. World Bank. Washington, D.C.

Final Report: Immunization Resource Tracking Exercise: Case Study of Tajikistan
11
execution and bottlenecks in public expenditure management may be the underlying factor (Lindelow and others, 2007).
3.7 Tracking of resource flows in the health sector is challenging because of the multiple sources of funds, each with their own administrative procedures. In addition, the availability and reliability of survey findings are related to the quality of recordkeeping on budgets, expenditures, commodities, and payroll, among other items. For example, in Mozambique, only 40% of districts could provide complete district-level data; and in Ghana, less than half of district offices had complete records. Records are poorly kept because of a lack of capacity, weak procedures, and efforts by staff to ‘game’ the system (Lewis, 2007).
3.8 In a few countries, such as Cambodia, it has not been possible to reach firm conclusions about the source and extent of leakage, primarily because budget information was unavailable at the service delivery point. However, additional information obtained from these tracking surveys are useful in their own right in terms of identifying bottlenecks and funds flow issues (Lewis, 2007).
Findings of the Tajikistan Health PETS
3.9 The Tajikistan Health PETS was conducted as an exploratory exercise to map health funding flows and expenditure patterns; to trace relationship between planning and budgeting processes from the rayon to the facility level; to assess current budgeting and resource allocation practices, and to evaluate the extent to which public health sector funds reach front line providers (World Bank, 2008). Because field work took place in 2006, facility data were collected retrospectively on activities, budgets, expenditures, inputs, outputs, and processes for 2005. The Tajikistan Health PETS included an in-depth analysis of health facility staff management and informal payments. However, the health PETS could not evaluate the extent of leakage to frontline providers because PHC facilities do not prepared budgets and are unaware of how much resources they have been allocated.
3.10 Facility surveys were conducted by trained enumerators between November 2006 and January 2007 using a pre-tested immunization questionnaire translated into Russian and Tajik. Six pre-tested questionnaires were designed for the purpose of the Health PETS: rayon, central rayon hospital (CRH), jaomat, health facilities, staff, and immunization services. Data were entered into a statistical database for analysis using STATA. For the immunization module, data were collected on staffing, outreach and supervision activities, vaccine supply, travel, facility financing, in-kind contributions, GAVI, and immunization doses and coverage (see Annex 2).
3.11 The sample for the Health PETS (and immunization resource tracking study) was drawn from a full list of health facilities in Tajikistan.7 Within five oblasts (regions) and 61 rayons (districts), there are approximately 2,560 health facilities, excluding the Central Rayon Hospitals. Dushanbe, the capital city, is considered both as an oblast and rayon by itself for the survey’s purpose. For the survey, the total number of rayons included was fixed at 30. Dangara and Khatlon rayons were purposively included because they are piloting the World Bank supported per capita financing scheme for primary health care. Dushanbe also was purposively included because it is the capital city and figures prominently in service provision. The remaining twenty-seven rayons are sampled on a stratified basis with probability proportional to size (PPS) – size is defined as the number of facilities in the oblast. Jaomats were selected with equal probability up to a maximum of 4 jaomats per rayon, resulting in a total of 107 jamoats in the survey. Ten facilities were chosen randomly per jaomat. Facility weights were generated and all results have been weighted. Details of the sampling procedure are contained in the Health PETS report (2008).
7 Prior to conducting the PETS, a full listing was unavailable.

Final Report: Immunization Resource Tracking Exercise: Case Study of Tajikistan
12
3.12 Table 2 shows the distribution of facilities (328) in the sample for the immunization resource tracking exercise. The analysis sample was 326 facilities due to weighting. Seventy-eight percent of the sample facilities were in rural areas.
Table 2: Sample for the Facility-Based Immunization Survey, Health PETS, Tajikistan (2008)
Facility/ Oblast
CRH Other Hospita
l
Polyclinic
SUB SVA Medical
House
Other Total
Dushanbe 0 4 6 0 0 0 1 11Sogd 8 4 4 10 16 43 3 88 Khatlon 11 8 4 10 26 69 2 130 RRP 6 0 2 5 14 38 1 66 GBAO 3 6 2 2 2 16 2 33 Total 28 22 18 27 58 166 9 328
3.13 The main results of the Tajikistan Health PETS are the following: 8
• The Health PETS underscores the low level of health financing and priority given to health in Tajikistan relative to other sectors at all levels. The top-down planning and budgeting process does not take into account service delivery needs (based on norms and historical trends).The highly fragmented sources of funding at facility level exacerbating weak planning, poor resource allocation and management.
• Resource allocation by the central and local governments varies enormously by oblast
and rayon even when controlling for type and size of facility. This variation shows the high degree of discretionary power at the oblast and rayon level. Health expenditures are biased toward hospitals and wages, leaving primary health care services and operating costs significantly under-funded.
• Tajikistan’s health workers consider themselves grossly underpaid and employ coping
strategies, some of which are illegal. 46 percent of the health workers admit to receiving informal payments (gifts in cash or in-kind) from patients to supplement their income. The average health worker is able to extract as much as 28 somonis per month ($9) from patients, with a peak of 124 somonis for doctors in Dushanbe. Although official wages are low, there is a sizeable amount of unallocated funds in the rayon’s wage budget which can be used to allocate extra stavkas or ‘workloads’ or as bonuses for the staff.
• Many health facilities do not have the basic infrastructure necessary to provide health services. Rural primary health care facilities appear to be systematically under funded. Rural PHC facilities also receive fewer funds or in-kind allocations (e.g., drugs) than urban facilities making it difficult to provide reasonable quality services to patients. 16% of facilities received no other support in addition to wages. The PETS survey shows significant out-of-pocket expenditures by health staff to cover costs.
• Control over funds is very poor and leakages are likely because there is no functioning system for the government to adequately monitor who gets funds and how they are spent.
8 Details can be found in Republic of Tajikistan, Public Expenditure Tracking Survey (PETS), The Health Sector, forthcoming, 2008.

Final Report: Immunization Resource Tracking Exercise: Case Study of Tajikistan
13
Frontline providers do not have approved budgets. Since most facilities receive inputs (such as medicines and food) in-kind, monitoring the use of these resources is difficult.
Section 4: Findings of the Immunization Component of the Tajikistan Health PETS4.1 In order to gain a better understanding of the level and composition of resource flows for immunization service delivery from rayon level to frontline providers, an immunization module was integrated into the Health PETS in Tajikistan. This section reports the main findings and further details can be found in Annex 3.Nearly three-quarters of the sample provided immunization services on a monthly basis. Facilities in Dushanbe region provided immunizations on a daily basis. Sixteen percent of the sample (hospitals and medical houses) did not provide immunization services, and most of these were in Khatlon oblast. 9
4.2 Immunization services in health facilities are financed by donors, in-kind and in-cash support from central and local governments and communities, and health worker contributions. The mean estimated financing for immunization services in 2005 in the sample of health facilities in Tajikistan was S6,523 ($2,045). Financing was highest for Central Rayon Hospitals (S110,905) and lowest for medical houses (S659, $207) in 2005. Figure 3 below illustrates the source of financing for the sample of health facilities. Operating costs, such as fuel, utilities, food, drugs, and other expenditures financed by central and local governments accounted for 41% of total resources for immunization services in health facilities. Wages paid by local government accounted for 24% of total financing.10 Contributions made by facility staff for immunization activities accounted for 20% of total average financing. GAVI support accounted for approximately 5%, and additional cash financing from local governments and communities accounted for 9%. For the sample of medical houses, wage financing accounted for 30%, and contributions from staff declined to 13% of total financing.
Figure 3: Share of Financing for Immunization Services in Health Facilities in Tajikistan, 2005
9 It was not possible to determine why these facilities did not provide immunization services, and this could be explored in further evaluations of vaccine stock and supply.
10 The Health PETS determined that 16% of facilities did not receive other funds or resources except for salaries.

Final Report: Immunization Resource Tracking Exercise: Case Study of Tajikistan
14
Operating41%
Wage24%
Hwpay20%
Gavi5%
Inkind1%
Cash9%
4.3 The study found that both cash and in-kind support for immunization services were received primarily by non-PHC facilities operating in Dushanbe. Only 7% (n=19) of facilities reported receiving direct cash support for immunization services in 2005. The mean value of cash support received was S161 ($47). Sogd oblast received on average S380, and RRP received S121 in cash assistance. Approximately 31% of facilities received in-kind support for immunization in 2005. The average value of in-kind donations received was estimated to be S95 ( $28).
4.4 Health workers in Tajikistan make substantial contributions from their own pockets to implement and carry out immunization activities, despite low health worker salaries. Table 3 shows the mean value of staff contributions per facility for immunization activities in 2005 was S177 ($51), ranging from 0 to S3,118 ($905). The staff of central rayon hospitals contributed the largest amount (S528 on average, or $153). Contributions made by staff in non-PHC facilities were significantly higher than payments made by PHC facility staff for that year (p>0.0000). Facility staff in RRP oblast made the greatest contributions on average in 2005 at S331 ($96). Staff contributions were a main source of financing for vaccine collection (96% of facilities), outreach (92% of facilities), and supervision (88% of facilities). Staff expenditures accounted for 70% of funding for seminars, meetings, and planning sessions.
4.5 The average contribution per health worker involved in immunization per facility was S113.3 or $35, ranging from 0 to S1,324 ($415). Per health worker contributions were highest for CRH staff and lowest for polyclinic staff (S204 vs. S30). Using the average full monthly official salary of S48 per health worker per month in Tajikistan, contributions for immunization could represent up to 20% of salary. However, staff salaries are augmented by additional stavkas and informal payments from patients, so contributions are not likely to account for such a high proportion of actual earnings (Tajikistan Health PETS, 2008).
Table 3: Mean Value of Staff Contributions per Facility to Outreach, Supervision, Vaccine Collection and Meetings in Tajikistan
(Somonis, 2005) Facility/ Region
Outreach Supervision
Vaccine Collection
Meetings 11 Total (n=326)
11 The contributions of staff for travel for meetings, seminars, and workshops was estimated based on the number of trips and the average contribution per trip.

Final Report: Immunization Resource Tracking Exercise: Case Study of Tajikistan
15
CRH 30.3 143.2 192.6 162.0 528.2 Other hospital
2.5 3.7 12.5 11.4 41.4
Polyclinic 5.2 5.7 11.3 68.0 90.2 SUB 6.8 35.5 146.2 71.3 279.6 SVA 12.7 18.7 100.0 142.3 278.4 Medical House
5.1 5.1 74.3 119.6 135.2
Non-PHC 10.9 46.6 67.3 57.2 189.0 PHC 6.9 11.0 82.4 72.47 176.3 Urban 6.05 18.5 45.9 36.2 122.4 Rural 7.8 13.4 84.5 76.2 183.9 Dushanbe 15.6 17.4 27.6 62.9 123.5 Sogd 4.8 20.0 82.5 24.1 138.8 Khatlon 2.6 5.1 59.2 55.1 126.9 RRP 18.0 26.5 127.2 159.0 331.5 GBAO 0 0 39.3 8.6 48.6 Total 7.2 14.2 81.0 71.1 177.4
4.6 Significant staff contributions indicate the level of underfunding of the operational aspects of immunization services. There also may be additional reasons why staff would be willing to finance costs out-of-pocket, such as financial or other incentives related to travel for immunization activities. Staff may be allocated additional stavkas (shifts) that lead to higher salaries to compensate for their contributions made. 12
4.7 Another coping mechanism for low salaries is informal payments from patients. The Health PETS (2007) found that almost half (45.7%) of staff receive informal payments. The average health worker is able to extract as much as 27.8 Somonis per month from patients, with 25% of staff receiving 30 or more Somonis. The prevalence of informal charges varies widely across oblasts, from 7.7% of staff charging payments in GBAO to as high as 71.5% in Dushanbe (Tajikitsan Health PETS, 2008).
4.8 The number of staff and the amount of time they spend on immunization activities appears high, particularly in a setting with relatively small target populations. 13 The mean number of health workers involved in immunization activities was 2.03 per facility, ranging from 1 to 10. Nurses were the most common staff involved in immunization activities and in providing injections. Facilities in Sogd Oblast reported the highest number of workers involved in immunization (2.2 on average), and GBAO the lowest (1.23).
4.9 Non-PHC facilities had significantly more health workers involved in immunization services than PHC facilities (p>0.001). SUBs had the most staff involved in immunization (3.8) compared
12 There are three outcomes worth noting regarding staffing. First, employees can be allocated more than one stavkas (shift) to compensate for lower salaries. The official norm is 1.5 stavkas per person, but data suggest that more stavkas are allocated than this figure. Second, center directors, including the EPI Director have full discretion over the number of persons hired, as well as the resulting salary paid to those persons (because of variations in stavkas allocated to employees). The director considers the volume of work, the person’s experience and the salary scale recommendations. Third, in the Smeta, the historically high volume of FTEs is used to preserve payroll funding levels from year to year. At the end of the year, any unused funds from the payroll line item are used as bonuses for regional and center level staff, and these bonus allocations are also under the discretion of director. Employees can compensate for lower salaries by having more than one stavkas and by being paid bonuses. 13 High reported involvement in immunization activities may be related to a “Hawthorne effect” or over-reporting.
Final Report: Immunization Resource Tracking Exercise: Case Study of Tajikistan
16
to medical houses (1.4) on average. Despite the large number of doctors working on immunization services in non-PHC settings, they were less likely to administer injections than doctors working in PHC facilities (p<0.06).
4.10 On average, facility staff spent 41 hours per month, or 1.86 hours per day on immunization. The average number of reported hours was highest in Dushanbe (92.3 hours per month) and lowest in GBAO (24 hours per month). Doctors and nurses in non-PHC facilities spent significantly more time than those in PHC settings (p>0.0001).
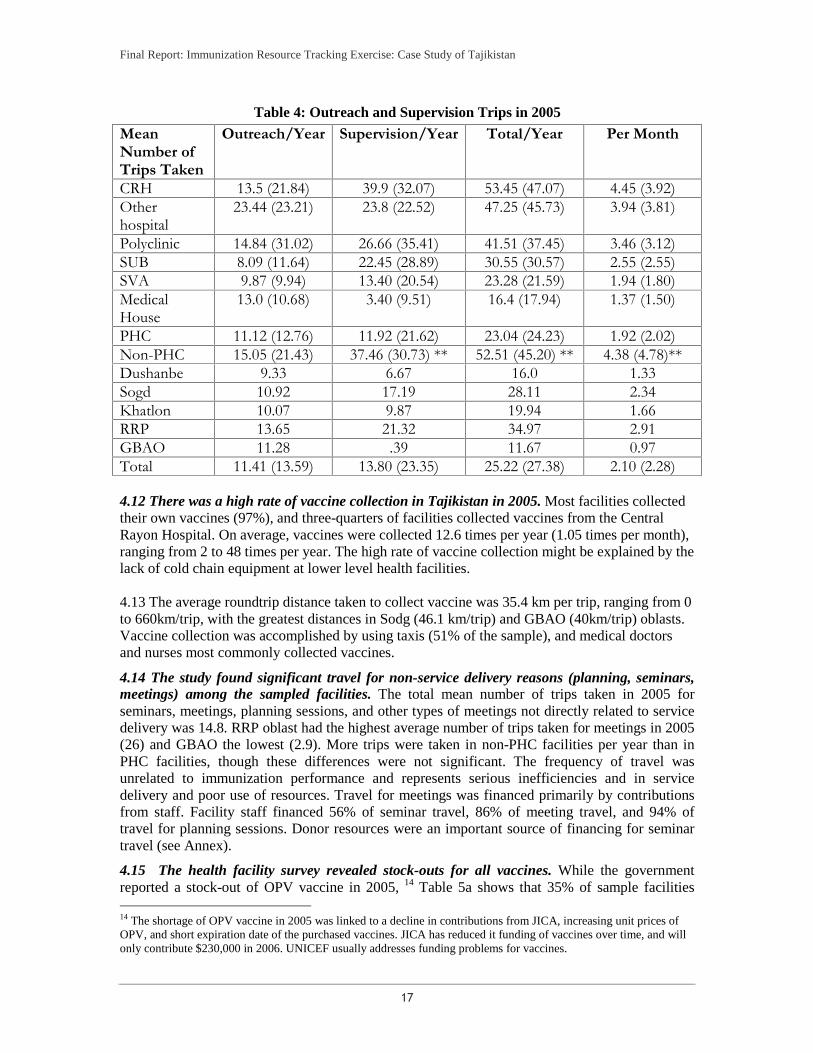
4.11 Facilities reported substantial travel for outreach, supervision, vaccine collection, and meetings/seminars in 2005. Ninety-five percent of facilities reported receiving supervision visits in 2005. On average, facilities received 4.8 supervision visits per year. Table 4 below shows that in the sample of facilities, 25 trips were made per year for supervision (14) and outreach (11) visits on average in 2005. PHC facilities made significantly more supervision visits than non-PHC facilities for the year (p>0.000). Facilities in RRP oblast reported the greatest number of outreach and supervision activities, compared to those in Dushanbe oblast.
Final Report: Immunization Resource Tracking Exercise: Case Study of Tajikistan
17
Table 4: Outreach and Supervision Trips in 2005
Mean Number of Trips Taken
Outreach/Year Supervision/Year Total/Year Per Month
CRH 13.5 (21.84) 39.9 (32.07) 53.45 (47.07) 4.45 (3.92) Other hospital
23.44 (23.21) 23.8 (22.52) 47.25 (45.73) 3.94 (3.81)
Polyclinic 14.84 (31.02) 26.66 (35.41) 41.51 (37.45) 3.46 (3.12) SUB 8.09 (11.64) 22.45 (28.89) 30.55 (30.57) 2.55 (2.55) SVA 9.87 (9.94) 13.40 (20.54) 23.28 (21.59) 1.94 (1.80) Medical House
13.0 (10.68) 3.40 (9.51) 16.4 (17.94) 1.37 (1.50)
PHC 11.12 (12.76) 11.92 (21.62) 23.04 (24.23) 1.92 (2.02) Non-PHC 15.05 (21.43) 37.46 (30.73) ** 52.51 (45.20) ** 4.38 (4.78)** Dushanbe 9.33 6.67 16.0 1.33 Sogd 10.92 17.19 28.11 2.34 Khatlon 10.07 9.87 19.94 1.66 RRP 13.65 21.32 34.97 2.91 GBAO 11.28 .39 11.67 0.97 Total 11.41 (13.59) 13.80 (23.35) 25.22 (27.38) 2.10 (2.28)
4.12 There was a high rate of vaccine collection in Tajikistan in 2005. Most facilities collected their own vaccines (97%), and three-quarters of facilities collected vaccines from the Central Rayon Hospital. On average, vaccines were collected 12.6 times per year (1.05 times per month), ranging from 2 to 48 times per year. The high rate of vaccine collection might be explained by the lack of cold chain equipment at lower level health facilities. 4.13 The average roundtrip distance taken to collect vaccine was 35.4 km per trip, ranging from 0 to 660km/trip, with the greatest distances in Sodg (46.1 km/trip) and GBAO (40km/trip) oblasts. Vaccine collection was accomplished by using taxis (51% of the sample), and medical doctors and nurses most commonly collected vaccines.
4.14 The study found significant travel for non-service delivery reasons (planning, seminars, meetings) among the sampled facilities. The total mean number of trips taken in 2005 for seminars, meetings, planning sessions, and other types of meetings not directly related to service delivery was 14.8. RRP oblast had the highest average number of trips taken for meetings in 2005 (26) and GBAO the lowest (2.9). More trips were taken in non-PHC facilities per year than in PHC facilities, though these differences were not significant. The frequency of travel was unrelated to immunization performance and represents serious inefficiencies and in service delivery and poor use of resources. Travel for meetings was financed primarily by contributions from staff. Facility staff financed 56% of seminar travel, 86% of meeting travel, and 94% of travel for planning sessions. Donor resources were an important source of financing for seminar travel (see Annex).
4.15 The health facility survey revealed stock-outs for all vaccines. While the government reported a stock-out of OPV vaccine in 2005, 14 Table 5a shows that 35% of sample facilities
14 The shortage of OPV vaccine in 2005 was linked to a decline in contributions from JICA, increasing unit prices of OPV, and short expiration date of the purchased vaccines. JICA has reduced it funding of vaccines over time, and will only contribute $230,000 in 2006. UNICEF usually addresses funding problems for vaccines.

Final Report: Immunization Resource Tracking Exercise: Case Study of Tajikistan
18
reported stock-outs for BCG; 14% for stock-outs of DTP; 10% for OPV; and 6% for measles vaccine in 2005. Facilities also reported unavailability of vaccine when they went to collect vaccines. For instance, 53% of facilities reported that BCG was unavailable at the time of vaccine collection; 34% of facilities reported that DTP was unavailable. There was a 31% unavailability for OPV, a 17% unavailability for measles; and a 4% unavailability for hepatitis B vaccines.
Table 5a: Percent of Facilities with Stockouts in 2005 by Vaccine
Vaccine BCG DTP OPV Measles Hepatitis B CRH (n=28) 32% 39.3% 32.1% 3.6% - Polyclinic (n=18)
22.2% 11.1% 5.6% 11.1% 5.6%
SUB (n=27) 25.9% 25.9% 3.7% 3.7% 3.7% SVA (n=58) 13.8% 8.6% 12.0% 6.9% 1.7% Medical house (n=166)
20% 12.7% 9.6% 7.2% 0.6%
Total (n=326) 35% 14% 10.4% 6.1% 1.2%
4.16 On average, facilities were without vaccines for six weeks in 2005, ranging from 8 weeks for hepatitis B to 4 weeks for OPV. Table 5b shows that non-PHC facilities were without vaccines for a slightly longer period of time than PHC facilities. Forty-seven percent of facilities in Khatlon region reported they were unable to provide vaccinations at some time during the year. Vaccine shortages were experienced more frequently in August (18% of facilities), September (24% of facilities), and October (12.5% of facilities).
Table 5b: Average Number of Weeks Without Vaccines in 2005
Vaccine BCG (n=63)
DTP (n=46)
OPV (n=34)
Measles (n=20)
Hepatitis B (n=4)
CRH 5.46 (3.23) 4.72 (1.6) 4.7 (1.9) 6 (0) - Other hosp
5.86 (2.82) - - - -
Polyclinic 4.3 (1.77) 4 (0) 4 (0) 7.0 (1.4) 8 SUB 5.75 (3.78) 4.4 (1.9) 4 (0) 4 (0) 8 SVA 6.29 (3.22) 4.7 (1.7) 4.1 (3.5) 3.6 (0.96) 12 Medical house
4.76 (2.30) 4.67 (3.8) 3.8 (2.2) 4.3 (1.9) 4
Total 5.15 (2.67) 4.61 (2.48) 34.0 (2.5) 4.3 (1.8) 7.78 (3.25)
4.17 The prevalence of vaccine shortages in the study sample suggests poor information for vaccine planning at all levels of the health system. The shortage of vaccines may also explain the large number of trips for vaccine collection in the study sample. With outdated denominator information, facilities will run out of stock or not be able to replenish stock when needed, requiring frequent visits for vaccine collection. In addition, the non-availability of vaccines reflects a weak distribution and logistics system. Poor planning for vaccines leads to inefficiencies and high transaction costs to collect vaccines as they run out.
Immunization Program Performance
Final Report: Immunization Resource Tracking Exercise: Case Study of Tajikistan
19
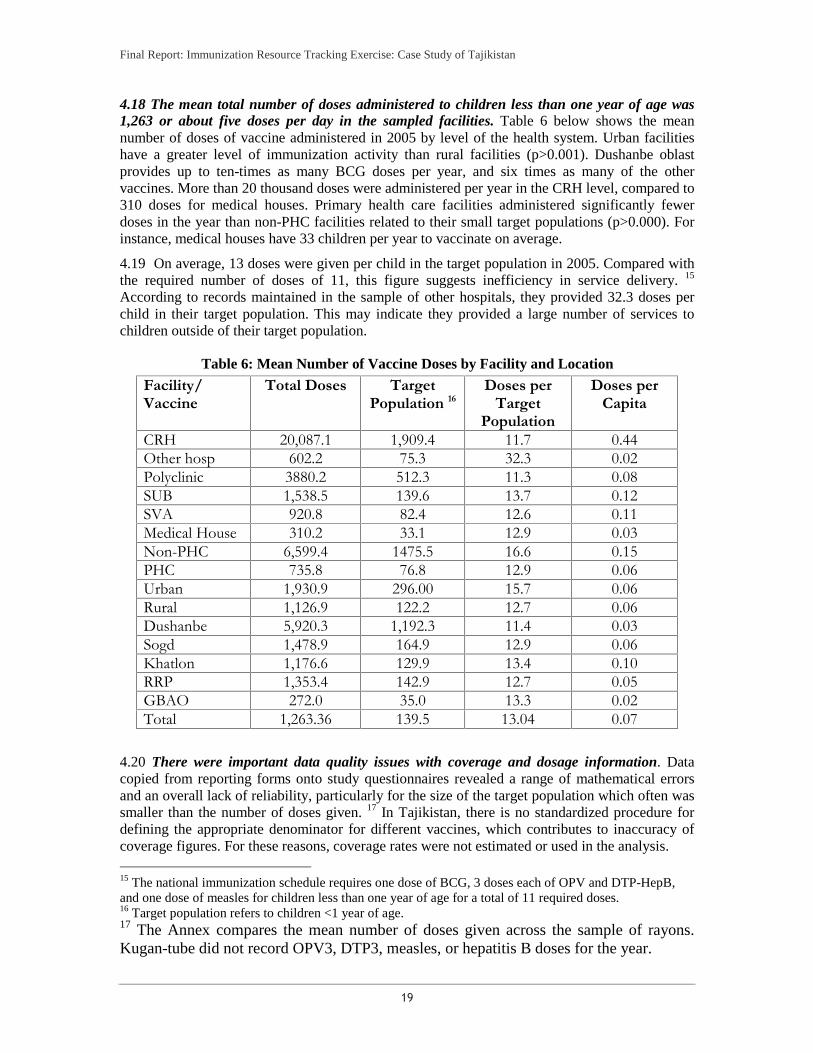
4.18 The mean total number of doses administered to children less than one year of age was 1,263 or about five doses per day in the sampled facilities. Table 6 below shows the mean number of doses of vaccine administered in 2005 by level of the health system. Urban facilities have a greater level of immunization activity than rural facilities (p>0.001). Dushanbe oblast provides up to ten-times as many BCG doses per year, and six times as many of the other vaccines. More than 20 thousand doses were administered per year in the CRH level, compared to 310 doses for medical houses. Primary health care facilities administered significantly fewer doses in the year than non-PHC facilities related to their small target populations (p>0.000). For instance, medical houses have 33 children per year to vaccinate on average.
4.19 On average, 13 doses were given per child in the target population in 2005. Compared with the required number of doses of 11, this figure suggests inefficiency in service delivery. 15 According to records maintained in the sample of other hospitals, they provided 32.3 doses per child in their target population. This may indicate they provided a large number of services to children outside of their target population.
Table 6: Mean Number of Vaccine Doses by Facility and Location
Facility/ Vaccine
Total Doses Target Population 16
Doses per Target
Population
Doses per Capita
CRH 20,087.1 1,909.4 11.7 0.44 Other hosp 602.2 75.3 32.3 0.02 Polyclinic 3880.2 512.3 11.3 0.08 SUB 1,538.5 139.6 13.7 0.12 SVA 920.8 82.4 12.6 0.11 Medical House 310.2 33.1 12.9 0.03 Non-PHC 6,599.4 1475.5 16.6 0.15 PHC 735.8 76.8 12.9 0.06 Urban 1,930.9 296.00 15.7 0.06 Rural 1,126.9 122.2 12.7 0.06 Dushanbe 5,920.3 1,192.3 11.4 0.03 Sogd 1,478.9 164.9 12.9 0.06 Khatlon 1,176.6 129.9 13.4 0.10 RRP 1,353.4 142.9 12.7 0.05 GBAO 272.0 35.0 13.3 0.02 Total 1,263.36 139.5 13.04 0.07
4.20 There were important data quality issues with coverage and dosage information. Data copied from reporting forms onto study questionnaires revealed a range of mathematical errors and an overall lack of reliability, particularly for the size of the target population which often was smaller than the number of doses given. 17 In Tajikistan, there is no standardized procedure for defining the appropriate denominator for different vaccines, which contributes to inaccuracy of coverage figures. For these reasons, coverage rates were not estimated or used in the analysis.
15 The national immunization schedule requires one dose of BCG, 3 doses each of OPV and DTP-HepB, and one dose of measles for children less than one year of age for a total of 11 required doses. 16 Target population refers to children <1 year of age. 17 The Annex compares the mean number of doses given across the sample of rayons. Kugan-tube did not record OPV3, DTP3, measles, or hepatitis B doses for the year.
Final Report: Immunization Resource Tracking Exercise: Case Study of Tajikistan
20
4.21 The information system for the NIP suffers significant shortcomings in verification and handling of immunization data. There is a hierarchical monthly reporting system for immunization statistics from the facility to the rayon and regional levels, up to the RepCI. The facility level completes a vaccination coverage level form, but these forms are not standardized, adding to variability in results. There is also discrepancy as to whether data are reported for the under-one population or for older children as well. There is interest to improve this system, as well as recognition that there are areas of the country with low coverage rates that need to be addressed. 18 In 2007, the NIP agreed to review coverage using Statistical Department estimates which led to a reduction by 10 percentage points in official coverage rates.
NIP Resource Requirements
4.22 Estimates were made of the resource requirements for the immunization program in each facility based on inputs and unit prices of vaccines and supplies, travel, staff contributions, cold chain and other equipment, and training. Assumptions used to build the cost requirements were based on standard immunization costing approaches (WHO, 2002). For instance, the value of time spent on immunization was based on staff salary rates by type of staff, multiplied by the ratio of number of immunization hours to total working hours per month. Vaccine costs were estimated based on the unit prices of vaccines (GAVI, 2008) multiplied by a wastage rate and the number of doses of vaccine administered in the facility. The average cost per kilometer traveled was based on facility data and the mean cost of petrol. This figure was multiplied by the distance traveled to collect vaccine and undertake supervision and outreach to estimate the travel costs associated with these activities. The official per diem rate is 42 Somonis and this figure is multiplied by the number of trips taken for supervision. The annualized value of capital equipment was estimated by multiplying the number of equipment by unit price (UNICEF, 2008) and dividing by an estimate of useful life.
4.23 The mean non-wage resource requirement for immunization services in 2005 per facility was S2,076 ($650) per year. Requirements were highest for CRH (S18,700, or $5,433) and lowest for medical houses (S827, $240). Resource requirements were significantly higher among non-PHC facilities (p>0.0000) and urban facilities (p>0.01). Requirements represented only S0.03 ($0.008) per capita, on average.
4.24 Recurrent costs, including vaccines, accounted for the highest share of total resource requirements (60%), with capital costs for cold chain equipment representing the balance (40%). Figure 4 below illustrates the distribution of recurrent cost requirements for the immunization program at the facility level. Training and per diem costs accounted for 16% of total requirements each, followed by the costs for vaccines and syringes (9% each).
Figure 4: Cost Profile of Immunization Resource Needs (Non-Wage) in Tajikistan Facilities
18 An analysis of the data reveals discrepancies in target group of children less than one year of age for the third dose of Hepatitis B and DTP/OPV in 2005 (154,312 and 155,871 children, respectively). The number of live born children in 2004 (148,253) is less than estimates of children less than one year of age in 2005 (154,312). A similar pattern holds for 2005/2006.
Final Report: Immunization Resource Tracking Exercise: Case Study of Tajikistan
21
Vaccine, 14.2%
Syringes, 12.7%
Per Diem, 21.8%Training, 17.0%
Cold Chain, 34.3%
4.25 In the sample, recurrent cost requirements were significantly smaller in non-PHC facilities (69% of total cost) compared to PHC facilities (59% of total cost). Recurrent cost requirements were highest for CRHs (S12,400, or $3,602) and lowest for other hospitals (S384, $112) and medical houses (S517, $150). Recurrent costs were highest in Dushanbe (S2823) and RRS (S2132) oblasts, and lowest for GBAO (S368).
4.26 Table 7 below shows that the value of non-wage facility resources provided by the government declines with the size of the facility to approximately S178 ($52) on average in 2005.19 This figure was based on the value of transfers for fuel, food, utilities, drugs, and supplies to the facility. At the CRH level, potential government resources amount to S111,112 ($32,3283) compared to government resources at medical houses (S178, $52) in 2005.
Table 7: Total Immunization Resource Requirements by Type of Facility Type of Facility Mean Estimated
Immunization Resources
Needed (Somonis)
Mean Non-Wage Government Resources (Somonis)
Immunization Resource Needs as a % of Facility-Level
Non-Wage Government Resources
Non-Vaccine Recurrent Cost as a % of Facility-Level
Non-Wage Government Resources
Central Rayon Hospital (n=28)
18,687 ($5,429) 111,112 ($32,283) 10.3% 2.0%
Polyclinic (n=18) 5,089 ($1,479) 15,883 ($1,834) 3.6% 20.4% SUB (n=27) 3,374 ($980) 6,312 ($170) 147.3% 65.0% SVA (n=58) 2,650 ($770) 585 ($52) 443.1% 252% Medical House (n=166)
827 ($240) 178 ($1,724) 309.9% 173%
Total 2,076 ($603) 5,935 274.1% 152%
4.27 For the sample of PHC facilities, immunization resource requirements are much higher than the value of government resources. The resources required for immunization services also declines by the size of the facility. For SVAs, immunization resources required were more than four times the available government resources. Resource requirements were three times higher than total available public resources in PHC facilities compared to non-PHC facilities (p<0.001).
19 Total public funding for a facility is derived from the value of drugs, food, fuel, utilities, and stationery and other supplies.
Final Report: Immunization Resource Tracking Exercise: Case Study of Tajikistan
22
Rural facilities also had significantly higher cost requirements (p<0.05). 20 This finding suggests that the immunization program is underfinanced and that resource availability from the government in PHC facilities is highly inadequate. Program performance and inputs 4.28 Given the additional resources that have been directed toward the national immunization program, an analysis was undertaken to determine to what extent facility funding and other underlying factors contributed to immunization performance in Tajikistan. Specifically, Q = f(P,q, Z), where (1) Q = Immunization doses administered in 2005 P = Resources available at the facility level (public sector and GAVI) q = Quality of immunization services (time devoted to service, supervision, and
management Z = Vector of other factors, such as size of the catchment population, regional location, and
household income 4.29 A log-linear function was estimated using OLS regression. The dependent variable is the natural log of the number of childhood immunization doses administered by the facility in 2005. The number of doses was chosen over other measures of immunization performance, such as coverage rates, because of issues surrounding the quality of denominator data. 21
4.30 The resources available at the facility level are captured in a variable for the non-wage public sector resources for the facility in 2005 (lnnwpublic). Since facilities do not receive a budget, these resources have been estimated as part of the larger Health PETS work in Tajikistan through top-down allocation from oblasts to facilities based on catchment population. The total value of in-kind resources provided with GAVI ISS funding (lngavivalue) provided to the facility in 2005 was also estimated and included in the regression analysis. 22 Resources available to the facility are expected to be positively related to immunization doses provided by the facility. Table 8: Descriptive Statistics for the Variables Included in the Regression Analysis 23 Variable Name
Variable Description N Mean Value (SD)
Lndoses Dependent variable: total number of doses for full immunization of children by the facility in 2005 (BCG, three doses of OPV, three doses DTP, three doses of HepB, and one dose of measles)
326 2.26 (7.59)
Lnmean Mean value of community consumption 316 3.77 (0.44)
20 If capital costs are removed from the analysis, immunization resource requirements are still more than 100% of public funding for SUBs, SVA,s and medical houses. 21 The regression analysis showed similar results for the number of DTP3 doses given as the dependent variable. 22 Values were obtained by multiplying the quantities of goods received (vehicles, computers, other materials) by unit price estimates. 23 Results are weighted on a population per facility basis, so that total analysis sample size reduced to 326 observations from 328.

Final Report: Immunization Resource Tracking Exercise: Case Study of Tajikistan
23
per month (Somonis) lnnwpublic Non-wage public sector resources for the
facility in 2005. Includes drugs, fuel, utilities, food, and other resources (Simonis)
326 2.45 (7.04)
Dushanbe 0/1 dummy variable as to whether the facility belongs to the Dushanbe region
326 0.12 (.109)
Repci 0/1 dummy variable as to whether staff in the facility must travel to the Republican Center for Immunoprophylaxis to collect vaccines
326 0.39 (.193)
Lnhrsmo Continuous variable: the number of hours spent by all health workers in a facility on immunization services per month
326 0.914 (5.42)
lngavivalue Continuous variable: the amount of resources for a facility in 2005 based on in-kind donations sponsored by GAVI
326 -10.33 (4.69)
Lndist Continuous variable: the roundtrip distance required to collect vaccines (kms)
321 0.385(5.76)
4.31 Quality variables have been captured in this analysis in two ways. First, a dummy variable as to whether facility staff must travel to the Republican Center for Immunoprophylaxis in Dushanbe (repci) was included because it was thought to measure how well linked and integrated the facility was with overall management and administration of the national program. Facilities which had regular interaction with the RepCI are expected to have higher output levels. Second, the number of hours spent by all staff in the facility on immunization services was included as a measure of quality of service (lnhrsmo). A hypothesis here is that more hours will translate into better service and a higher number of doses administered. 4.32 Other factors thought to influence the number of doses administered in a facility related to the distance traveled for vaccine collection (lndist)—the further the distance, the lower the number of doses; and a dummy variable of whether the facility is located in Dushanbe, the most populated region, or not (Dushanbe). The PHC and Dushanbe dummy variables also can control for unobservable effects of facility type and region on outputs. 4.33 Finally, a variable for mean household income in the community surrounding the facility (lnmean) was added to control for possible demand-side effects on immunization activity. It is expected that this variable will be positively related to the number of doses administered in the facility. 24
4.34 The results of the OLS regression is reported in Table 9. The regression is weighted by the composition of facilities in the sample. The regression resulted in an R2 of 0.6116.
Table 9: Results of the OLS Regression Analysis of Determinants of Immunization Activity Levels
24 Other variables, such as the catchment population, were examined in the regression analysis. This variable had low explanatory power and because of missing values, was excluded from the final regression.
Final Report: Immunization Resource Tracking Exercise: Case Study of Tajikistan
24
Dependent Variable: Ln of Total Immunization Doses Given in 2005 in the Facility . regress lndoses lnmean lnnwpublic lngavi lnhrsmo lndist dushanbe repci [aw=fw] (sum of wgt is 2.5342e+03)
Source | SS df MS Number of obs = 311 -------------+------------------------------ F( 7, 303) = 68.17
Model | 10347.4733 7 1478.21047 Prob > F = 0.0000 Residual | 6570.4492 303 21.6846508 R-squared = 0.6116
-------------+------------------------------ Adj R-squared = 0.6027 Total | 16917.9225 310 54.5739435 Root MSE = 4.6567
------------------------------------------------------------------------------ lndoses | Coef. Std. Err. t P>|t| [95% Conf. Interval]
-------------+---------------------------------------------------------------- lnmean | .2617346 .5950713 0.44 0.660 -.9092611 1.43273
lnnwpublic | .0964112 .0385849 2.50 0.013 .0204828 .1723396 lngavi | .0431146 .057712 0.75 0.456 -.0704524 .1566817
lnhrsmo | .9963043 .1079179 9.23 0.000 .7839409 1.208668 lndist | .1051846 .0992747 1.06 0.290 -.0901706 .3005398
dushanbe | -.2413027 2.508725 -0.10 0.923 -5.178033 4.695428 repci | 1.537723 1.529864 1.01 0.316 -1.47278 4.548226 _cons | .4064281 2.337701 0.17 0.862 -4.193756 5.006612
------------------------------------------------------------------------------
4.35 Both non-wage government resources were significantly and positively associated with the number of doses administered (p>0.001). The marginal product of additional financing with respect to the number of doses administered is small—a 1% increase in government financing will increase output by 0.3%. 4.36 The number of hours spent by health workers on immunization per month per facility was positively and significantly related to the number of doses provided (p>0.0000). Controlling for other variables, this finding suggests that effort does matter in achieving immunization coverage. 4.37 While GAVI support and the number of doses provided were positively related, this result was insignificant in the regression analysis controlling for other factors. This finding suggests that GAVI resources did not have as significant an effect on program activity and coverage as expected. 4.38 There is a large positive relationship between whether the facility collects vaccines from the RepCI, the income level of the community, and distance to collect vaccine and number of doses administered in 2005, but these results were insignificant. Facilities with greater interaction with program management and administration seem to provide more doses. Frequent interaction provides opportunities to request additional resources, learn of changing priorities and policies, and obtain needed technical support and supplies. This finding may support the notion that “the squeaky wheel gets the grease” in Tajikistan. 4.39 Finally, the regional dummy for Dushanbe is large and negative with respect to the number of doses administered. This finding suggests that facilities in Dushanbe region underperform when controlling for factors such as community income, quality of service, and resource availability. 4.40 A limitation of the analysis is that there are limited demand-side variables in the regression to explain variation in vaccine doses given. A related issue is that of endogeneity: use of inputs in

Final Report: Immunization Resource Tracking Exercise: Case Study of Tajikistan
25
facilities is simultaneously chosen with the amount of output. For instance, facilities that perform well may have influence and are able to obtain higher levels of some inputs, so that the impact of these inputs on number of doses given would be over-estimated in the cross-sectional analysis. There was the difficulty of identifying a suitable instrumental variable which is correlated with the inputs but not with doses given.
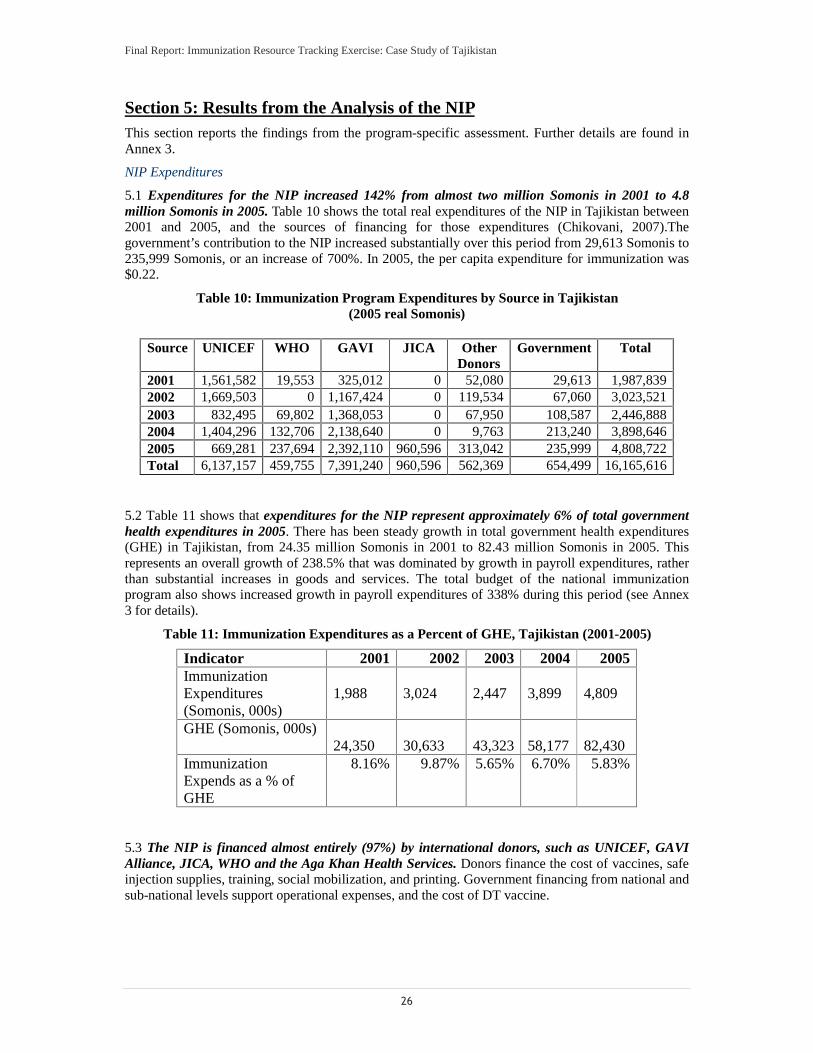
Final Report: Immunization Resource Tracking Exercise: Case Study of Tajikistan
26
Section 5: Results from the Analysis of the NIPThis section reports the findings from the program-specific assessment. Further details are found in Annex 3.
NIP Expenditures
5.1 Expenditures for the NIP increased 142% from almost two million Somonis in 2001 to 4.8 million Somonis in 2005. Table 10 shows the total real expenditures of the NIP in Tajikistan between 2001 and 2005, and the sources of financing for those expenditures (Chikovani, 2007).The government’s contribution to the NIP increased substantially over this period from 29,613 Somonis to 235,999 Somonis, or an increase of 700%. In 2005, the per capita expenditure for immunization was $0.22.
Table 10: Immunization Program Expenditures by Source in Tajikistan (2005 real Somonis)
Source UNICEF WHO GAVI JICA Other
Donors Government Total
2001 1,561,582 19,553 325,012 0 52,080 29,613 1,987,8392002 1,669,503 0 1,167,424 0 119,534 67,060 3,023,5212003 832,495 69,802 1,368,053 0 67,950 108,587 2,446,8882004 1,404,296 132,706 2,138,640 0 9,763 213,240 3,898,6462005 669,281 237,694 2,392,110 960,596 313,042 235,999 4,808,722Total 6,137,157 459,755 7,391,240 960,596 562,369 654,499 16,165,616
5.2 Table 11 shows that expenditures for the NIP represent approximately 6% of total government health expenditures in 2005. There has been steady growth in total government health expenditures (GHE) in Tajikistan, from 24.35 million Somonis in 2001 to 82.43 million Somonis in 2005. This represents an overall growth of 238.5% that was dominated by growth in payroll expenditures, rather than substantial increases in goods and services. The total budget of the national immunization program also shows increased growth in payroll expenditures of 338% during this period (see Annex 3 for details).
Table 11: Immunization Expenditures as a Percent of GHE, Tajikistan (2001-2005)
Indicator 2001 2002 2003 2004 2005Immunization Expenditures (Somonis, 000s)
1,988
3,024
2,447
3,899
4,809
GHE (Somonis, 000s) 24,350
30,633
43,323 58,177 82,430
Immunization Expends as a % of GHE
8.16% 9.87% 5.65% 6.70% 5.83%
5.3 The NIP is financed almost entirely (97%) by international donors, such as UNICEF, GAVI Alliance, JICA, WHO and the Aga Khan Health Services. Donors finance the cost of vaccines, safe injection supplies, training, social mobilization, and printing. Government financing from national and sub-national levels support operational expenses, and the cost of DT vaccine.
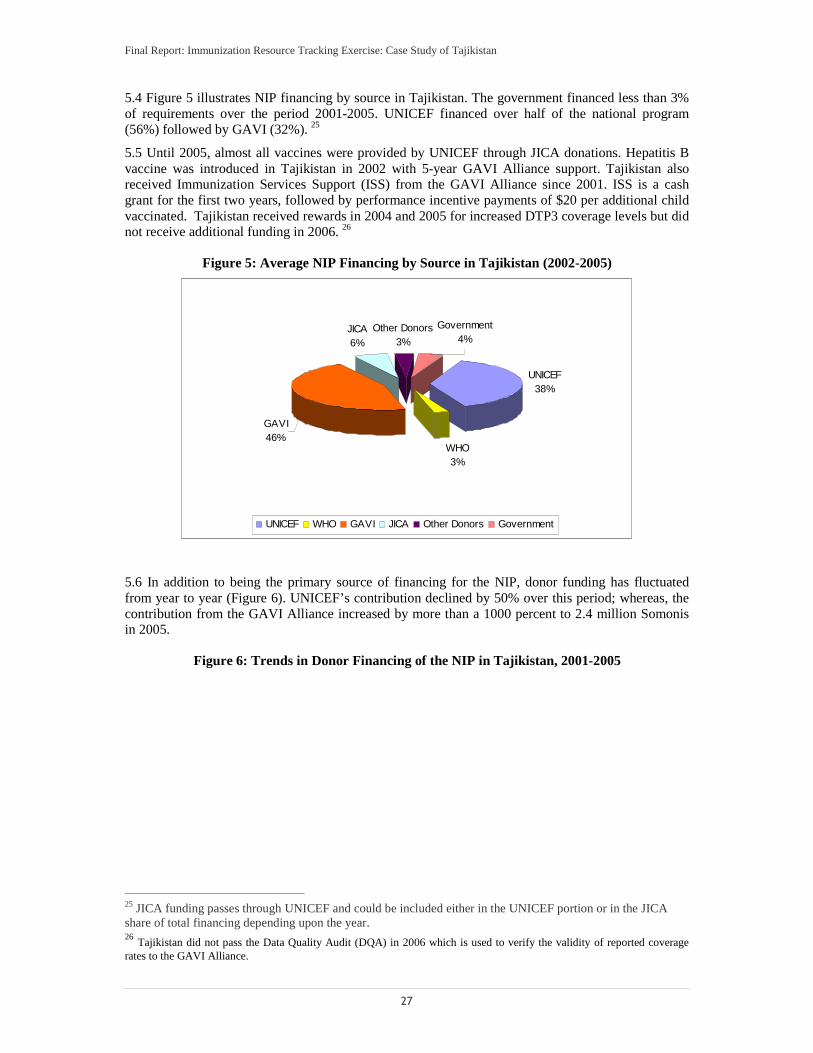
Final Report: Immunization Resource Tracking Exercise: Case Study of Tajikistan
27
5.4 Figure 5 illustrates NIP financing by source in Tajikistan. The government financed less than 3% of requirements over the period 2001-2005. UNICEF financed over half of the national program (56%) followed by GAVI (32%). 25
5.5 Until 2005, almost all vaccines were provided by UNICEF through JICA donations. Hepatitis B vaccine was introduced in Tajikistan in 2002 with 5-year GAVI Alliance support. Tajikistan also received Immunization Services Support (ISS) from the GAVI Alliance since 2001. ISS is a cash grant for the first two years, followed by performance incentive payments of $20 per additional child vaccinated. Tajikistan received rewards in 2004 and 2005 for increased DTP3 coverage levels but did not receive additional funding in 2006. 26
Figure 5: Average NIP Financing by Source in Tajikistan (2002-2005)
UNICEF38%
WHO3%
JICA6%
Other Donors3%
GAVI46%
Government4%
UNICEF WHO GAVI JICA Other Donors Government
5.6 In addition to being the primary source of financing for the NIP, donor funding has fluctuated from year to year (Figure 6). UNICEF’s contribution declined by 50% over this period; whereas, the contribution from the GAVI Alliance increased by more than a 1000 percent to 2.4 million Somonis in 2005.
Figure 6: Trends in Donor Financing of the NIP in Tajikistan, 2001-2005
25 JICA funding passes through UNICEF and could be included either in the UNICEF portion or in the JICA share of total financing depending upon the year. 26 Tajikistan did not pass the Data Quality Audit (DQA) in 2006 which is used to verify the validity of reported coverage rates to the GAVI Alliance.
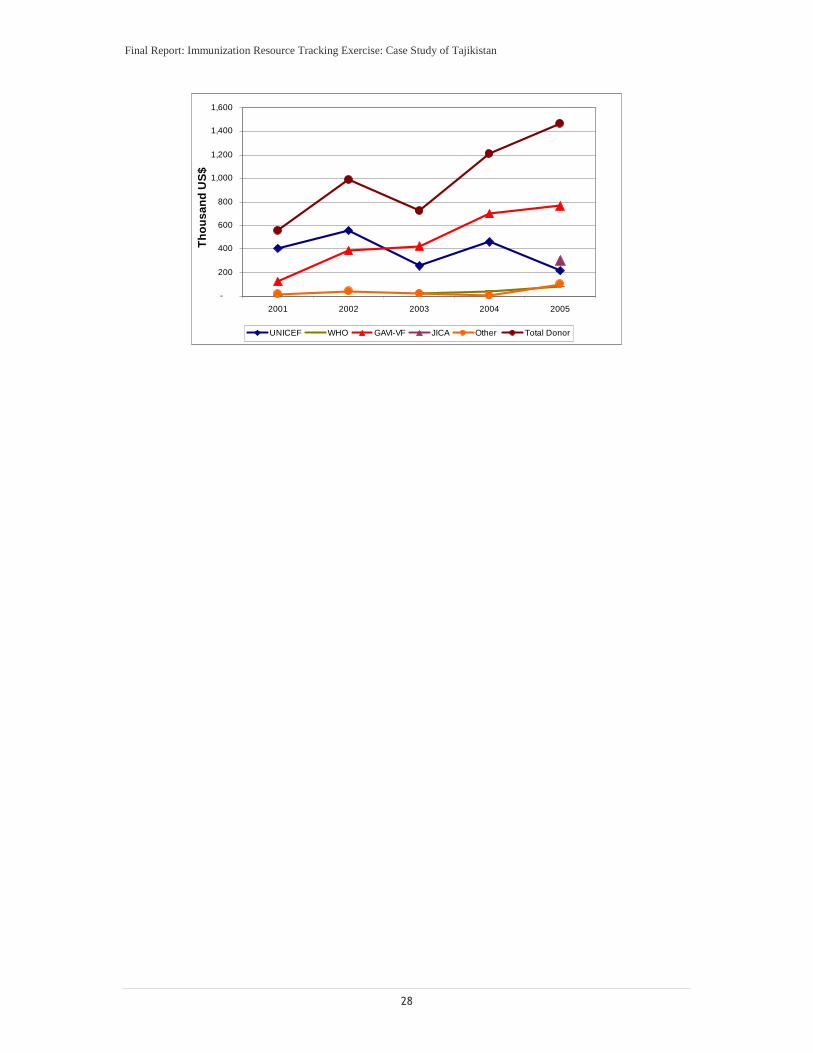
Final Report: Immunization Resource Tracking Exercise: Case Study of Tajikistan
28
-
200
400
600
800
1,000
1,200
1,400
1,600
2001 2002 2003 2004 2005
Th
ou
san
dU
S$
UNICEF WHO GAVI-VF JICA Other Total Donor
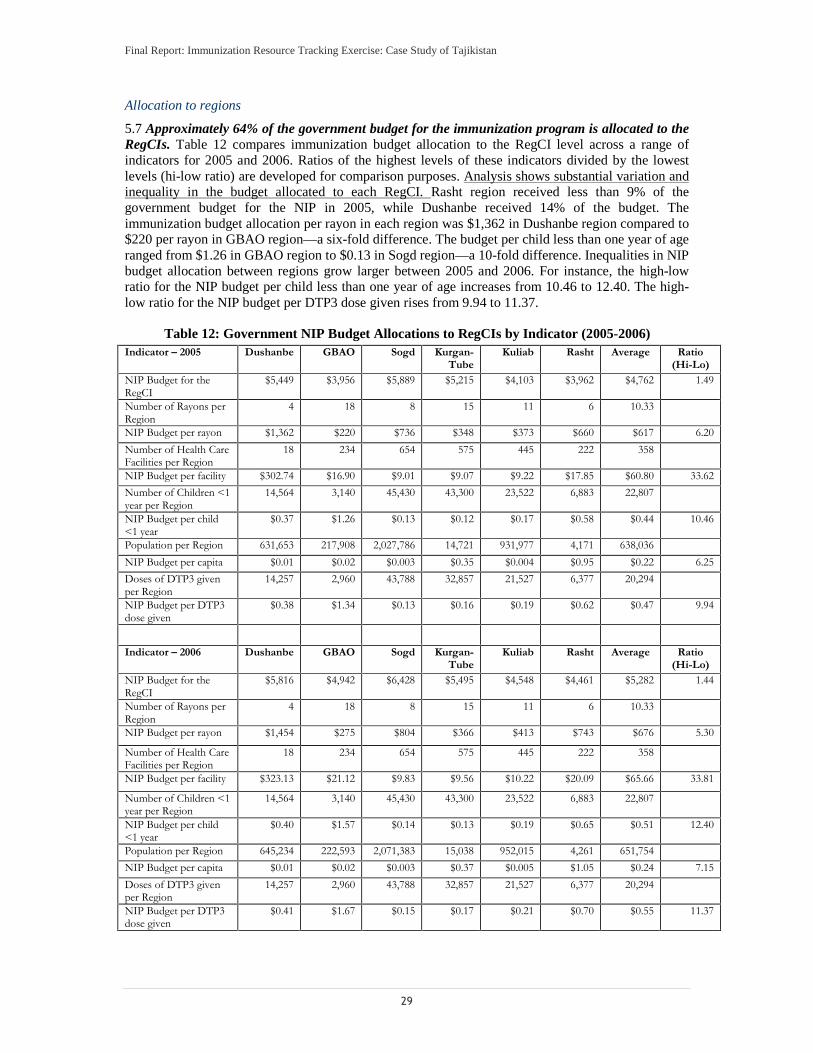
Final Report: Immunization Resource Tracking Exercise: Case Study of Tajikistan
29
Allocation to regions
5.7 Approximately 64% of the government budget for the immunization program is allocated to the RegCIs. Table 12 compares immunization budget allocation to the RegCI level across a range of indicators for 2005 and 2006. Ratios of the highest levels of these indicators divided by the lowest levels (hi-low ratio) are developed for comparison purposes. Analysis shows substantial variation and inequality in the budget allocated to each RegCI. Rasht region received less than 9% of the government budget for the NIP in 2005, while Dushanbe received 14% of the budget. The immunization budget allocation per rayon in each region was $1,362 in Dushanbe region compared to $220 per rayon in GBAO region—a six-fold difference. The budget per child less than one year of age ranged from $1.26 in GBAO region to $0.13 in Sogd region—a 10-fold difference. Inequalities in NIP budget allocation between regions grow larger between 2005 and 2006. For instance, the high-low ratio for the NIP budget per child less than one year of age increases from 10.46 to 12.40. The high-low ratio for the NIP budget per DTP3 dose given rises from 9.94 to 11.37.
Table 12: Government NIP Budget Allocations to RegCIs by Indicator (2005-2006) Indicator – 2005 Dushanbe GBAO Sogd Kurgan-
Tube Kuliab Rasht Average Ratio
(Hi-Lo) NIP Budget for the RegCI
$5,449 $3,956 $5,889 $5,215 $4,103 $3,962 $4,762 1.49
Number of Rayons per Region
4 18 8 15 11 6 10.33
NIP Budget per rayon $1,362 $220 $736 $348 $373 $660 $617 6.20 Number of Health Care Facilities per Region
18 234 654 575 445 222 358
NIP Budget per facility $302.74 $16.90 $9.01 $9.07 $9.22 $17.85 $60.80 33.62 Number of Children <1 year per Region
14,564 3,140 45,430 43,300 23,522 6,883 22,807
NIP Budget per child <1 year
$0.37 $1.26 $0.13 $0.12 $0.17 $0.58 $0.44 10.46
Population per Region 631,653 217,908 2,027,786 14,721 931,977 4,171 638,036 NIP Budget per capita $0.01 $0.02 $0.003 $0.35 $0.004 $0.95 $0.22 6.25 Doses of DTP3 given per Region
14,257 2,960 43,788 32,857 21,527 6,377 20,294
NIP Budget per DTP3 dose given
$0.38 $1.34 $0.13 $0.16 $0.19 $0.62 $0.47 9.94
Indicator – 2006 Dushanbe GBAO Sogd Kurgan-Tube
Kuliab Rasht Average Ratio (Hi-Lo)
NIP Budget for the RegCI
$5,816 $4,942 $6,428 $5,495 $4,548 $4,461 $5,282 1.44
Number of Rayons per Region
4 18 8 15 11 6 10.33
NIP Budget per rayon $1,454 $275 $804 $366 $413 $743 $676 5.30
Number of Health Care Facilities per Region
18 234 654 575 445 222 358
NIP Budget per facility $323.13 $21.12 $9.83 $9.56 $10.22 $20.09 $65.66 33.81
Number of Children <1 year per Region
14,564 3,140 45,430 43,300 23,522 6,883 22,807
NIP Budget per child <1 year
$0.40 $1.57 $0.14 $0.13 $0.19 $0.65 $0.51 12.40
Population per Region 645,234 222,593 2,071,383 15,038 952,015 4,261 651,754 NIP Budget per capita $0.01 $0.02 $0.003 $0.37 $0.005 $1.05 $0.24 7.15 Doses of DTP3 given per Region
14,257 2,960 43,788 32,857 21,527 6,377 20,294
NIP Budget per DTP3 dose given
$0.41 $1.67 $0.15 $0.17 $0.21 $0.70 $0.55 11.37
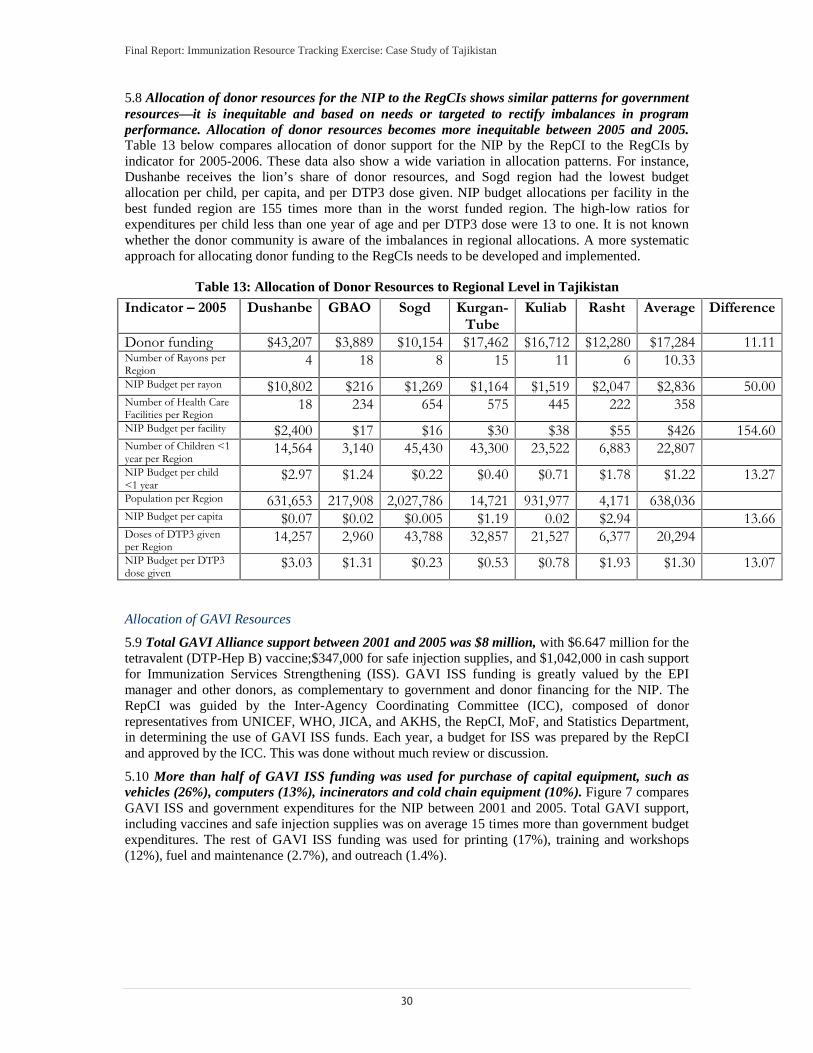
Final Report: Immunization Resource Tracking Exercise: Case Study of Tajikistan
30
5.8 Allocation of donor resources for the NIP to the RegCIs shows similar patterns for government resources—it is inequitable and based on needs or targeted to rectify imbalances in program performance. Allocation of donor resources becomes more inequitable between 2005 and 2005. Table 13 below compares allocation of donor support for the NIP by the RepCI to the RegCIs by indicator for 2005-2006. These data also show a wide variation in allocation patterns. For instance, Dushanbe receives the lion’s share of donor resources, and Sogd region had the lowest budget allocation per child, per capita, and per DTP3 dose given. NIP budget allocations per facility in the best funded region are 155 times more than in the worst funded region. The high-low ratios for expenditures per child less than one year of age and per DTP3 dose were 13 to one. It is not known whether the donor community is aware of the imbalances in regional allocations. A more systematic approach for allocating donor funding to the RegCIs needs to be developed and implemented.
Table 13: Allocation of Donor Resources to Regional Level in Tajikistan
Indicator – 2005 Dushanbe GBAO Sogd Kurgan-Tube
Kuliab Rasht Average Difference
Donor funding $43,207 $3,889 $10,154 $17,462 $16,712 $12,280 $17,284 11.11Number of Rayons per Region
4 18 8 15 11 6 10.33NIP Budget per rayon $10,802 $216 $1,269 $1,164 $1,519 $2,047 $2,836 50.00Number of Health Care Facilities per Region
18 234 654 575 445 222 358NIP Budget per facility $2,400 $17 $16 $30 $38 $55 $426 154.60Number of Children <1 year per Region
14,564 3,140 45,430 43,300 23,522 6,883 22,807NIP Budget per child <1 year
$2.97 $1.24 $0.22 $0.40 $0.71 $1.78 $1.22 13.27Population per Region 631,653 217,908 2,027,786 14,721 931,977 4,171 638,036NIP Budget per capita $0.07 $0.02 $0.005 $1.19 0.02 $2.94 13.66Doses of DTP3 given per Region
14,257 2,960 43,788 32,857 21,527 6,377 20,294NIP Budget per DTP3 dose given
$3.03 $1.31 $0.23 $0.53 $0.78 $1.93 $1.30 13.07
Allocation of GAVI Resources
5.9 Total GAVI Alliance support between 2001 and 2005 was $8 million, with $6.647 million for the tetravalent (DTP-Hep B) vaccine;$347,000 for safe injection supplies, and $1,042,000 in cash support for Immunization Services Strengthening (ISS). GAVI ISS funding is greatly valued by the EPI manager and other donors, as complementary to government and donor financing for the NIP. The RepCI was guided by the Inter-Agency Coordinating Committee (ICC), composed of donor representatives from UNICEF, WHO, JICA, and AKHS, the RepCI, MoF, and Statistics Department, in determining the use of GAVI ISS funds. Each year, a budget for ISS was prepared by the RepCI and approved by the ICC. This was done without much review or discussion.
5.10 More than half of GAVI ISS funding was used for purchase of capital equipment, such as vehicles (26%), computers (13%), incinerators and cold chain equipment (10%). Figure 7 compares GAVI ISS and government expenditures for the NIP between 2001 and 2005. Total GAVI support, including vaccines and safe injection supplies was on average 15 times more than government budget expenditures. The rest of GAVI ISS funding was used for printing (17%), training and workshops (12%), fuel and maintenance (2.7%), and outreach (1.4%).
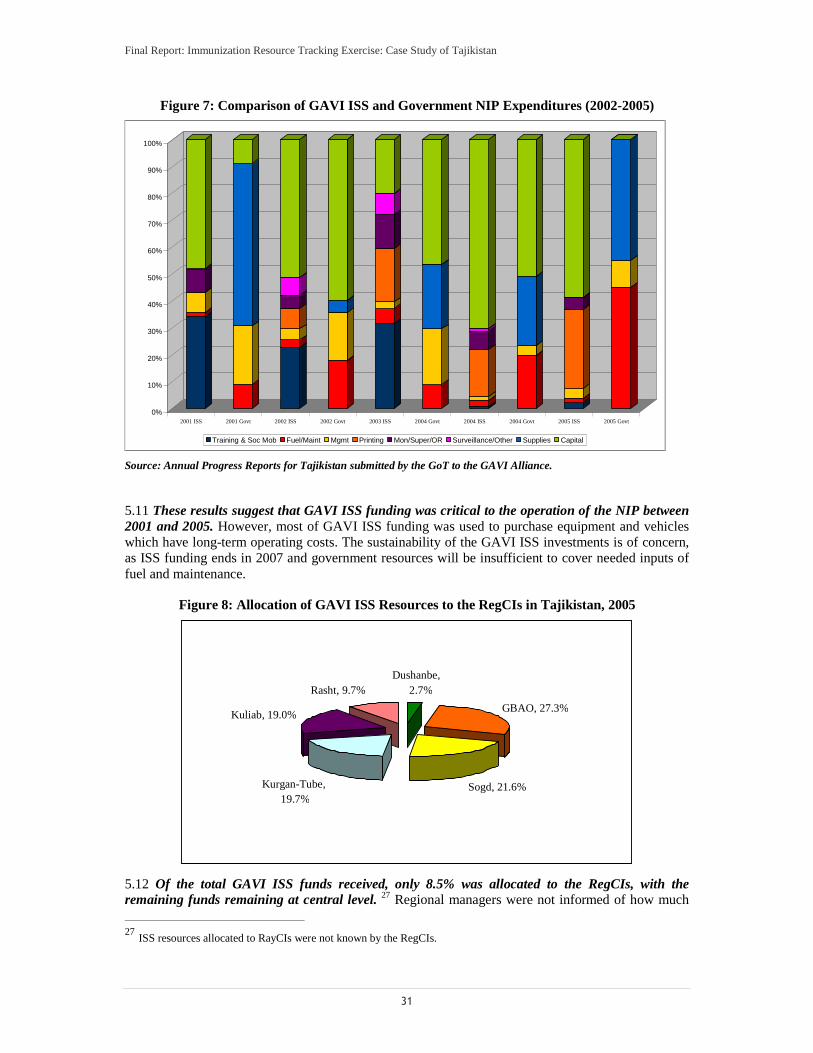
Final Report: Immunization Resource Tracking Exercise: Case Study of Tajikistan
31
Figure 7: Comparison of GAVI ISS and Government NIP Expenditures (2002-2005)
0%
10%
20%
30%
40%
50%
60%
70%
80%
90%
100%
2001 ISS 2001 Govt 2002 ISS 2002 Govt 2003 ISS 2004 Govt 2004 ISS 2004 Govt 2005 ISS 2005 Govt
Training & Soc Mob Fuel/Maint Mgmt Printing Mon/Super/OR Surveillance/Other Supplies Capital
Source: Annual Progress Reports for Tajikistan submitted by the GoT to the GAVI Alliance.
5.11 These results suggest that GAVI ISS funding was critical to the operation of the NIP between 2001 and 2005. However, most of GAVI ISS funding was used to purchase equipment and vehicles which have long-term operating costs. The sustainability of the GAVI ISS investments is of concern, as ISS funding ends in 2007 and government resources will be insufficient to cover needed inputs of fuel and maintenance.
Figure 8: Allocation of GAVI ISS Resources to the RegCIs in Tajikistan, 2005
5.12 Of the total GAVI ISS funds received, only 8.5% was allocated to the RegCIs, with the remaining funds remaining at central level. 27 Regional managers were not informed of how much
27 ISS resources allocated to RayCIs were not known by the RegCIs.
Dushanbe,2.7%
GBAO, 27.3%
Sogd, 21.6%Kurgan-Tube,19.7%
Kuliab, 19.0%
Rasht, 9.7%

Final Report: Immunization Resource Tracking Exercise: Case Study of Tajikistan
32
total GAVI ISS funding was available, and were not asked to submit requests for these funds. Figure 8 shows that GBAO received 27% of GAVI ISS resources, compared to Dushanbe which received 2.7% of the total. Kuliab, Kurgan-Tube, and Sogd received relatively equal amounts (approximately 20%) in 2005.
5.13 Analysis reveals some indication of leakage of GAVI ISS resources. There are differences in the amount of GAVI ISS resources allocated to the RegCIs and the amount the RegCIs estimate they received from the RepCI. Table 14 below shows that several regions (GBAO, Kurgan-Tube, and Dushanbe) reported receiving fewer resources than reported on RepCI records. Exact determination and confirmation of leakage is not possible due to potentially poor record-keeping on the part of the RegCIs. There may have been legitimate reallocation of GAVI ISS resources during the year that were not recorded.
Table 14: Discrepancies in Accounting of GAVI ISS Resources between Republican and Regional Levels, 2005 ($US)
Region RepCI Data
RegCI Data
Difference (Leakage?)
% Diff
Dushanbe $567 - -$567 -100.0%GBAO $5,693 $3,862 -$1,831 -32.2%Sogd $4,498 $7,676 $3,178 70.7%Kurgan-Tube
$4,120 $1,765 -$2,355 -57.2%
Kuliab $3,963 $6,455 $2,492 62.9%Rasht $2,020 $2,700 $680 33.7%Total $20,861 $22,458 $1,597 7.7%
5.14 The findings revealed a less-than-desirable process for budgeting and financial management of GAVI ISS resources in Tajikistan. GAVI ISS funds were not reported at year’s end to the Ministry of Health or Ministry of Finance. The only reporting regarding the use of ISS funds was to the ICC and the GAVI Alliance in Annual Progress Reports (APRs). At global level, no guidance exists for countries on proper accounting and financial management of ISS funding, 5.15 In addition to weak management, there was low involvement of donors in planning and discussion of allocations, and limited transparency. The fact that most ISS resources were retained at central level and used for capital purchases may have limited the impact of these resources on achieving higher immunization performance.
Section 6: Main Findings and Recommendations6.1 The immunization resource tracking exercise in Tajikistan highlighted financing and expenditure management challenges faced by a priority public health program within a larger health system. The study found that allocation of government and donor resources for immunization services from the central to sub-national level in Tajikistan is inequitable and unrelated to needs or program performance. The study also found that financing for the NIP is fragmented and highly centralized, limiting the availability of resources for frontline providers to ensure adequate, quality service delivery.
¾ While NIP budget development in Tajikistan is top-down, norm-based and historical, there appears to be few explicit parameters or requirements for allocating both government and donor resources. Analysis shows that immunization resources are not allocated on the basis of improving the equity between regions or rayons, improving performance, or meeting target population needs. The lack of explicit requirements creates an environment whereby NIP decision-makers can have significant discretionary power without concomitant oversight and accountability in allocation and use of funds.
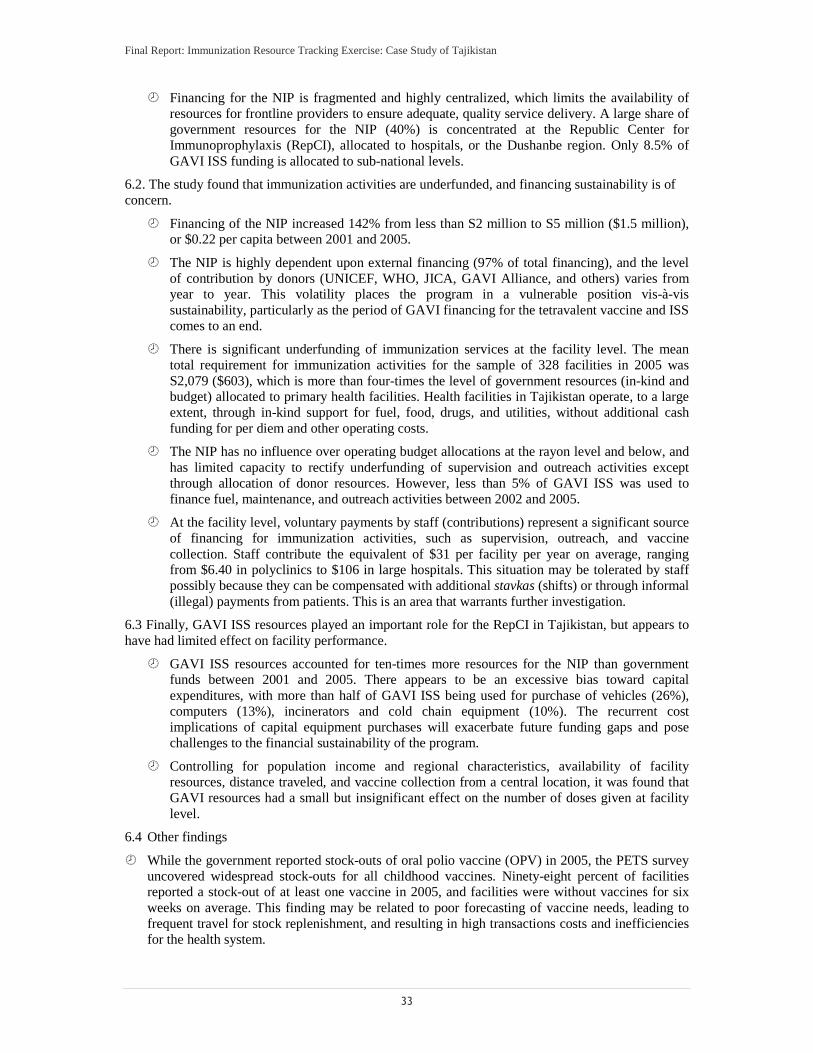
Final Report: Immunization Resource Tracking Exercise: Case Study of Tajikistan
33
¾ Financing for the NIP is fragmented and highly centralized, which limits the availability of resources for frontline providers to ensure adequate, quality service delivery. A large share of government resources for the NIP (40%) is concentrated at the Republic Center for Immunoprophylaxis (RepCI), allocated to hospitals, or the Dushanbe region. Only 8.5% of GAVI ISS funding is allocated to sub-national levels.
6.2. The study found that immunization activities are underfunded, and financing sustainability is of concern.
¾ Financing of the NIP increased 142% from less than S2 million to S5 million ($1.5 million), or $0.22 per capita between 2001 and 2005.
¾ The NIP is highly dependent upon external financing (97% of total financing), and the level of contribution by donors (UNICEF, WHO, JICA, GAVI Alliance, and others) varies from year to year. This volatility places the program in a vulnerable position vis-à-vis sustainability, particularly as the period of GAVI financing for the tetravalent vaccine and ISS comes to an end.
¾ There is significant underfunding of immunization services at the facility level. The mean total requirement for immunization activities for the sample of 328 facilities in 2005 was S2,079 ($603), which is more than four-times the level of government resources (in-kind and budget) allocated to primary health facilities. Health facilities in Tajikistan operate, to a large extent, through in-kind support for fuel, food, drugs, and utilities, without additional cash funding for per diem and other operating costs.
¾ The NIP has no influence over operating budget allocations at the rayon level and below, and has limited capacity to rectify underfunding of supervision and outreach activities except through allocation of donor resources. However, less than 5% of GAVI ISS was used to finance fuel, maintenance, and outreach activities between 2002 and 2005.
¾ At the facility level, voluntary payments by staff (contributions) represent a significant source of financing for immunization activities, such as supervision, outreach, and vaccine collection. Staff contribute the equivalent of $31 per facility per year on average, ranging from $6.40 in polyclinics to $106 in large hospitals. This situation may be tolerated by staff possibly because they can be compensated with additional stavkas (shifts) or through informal (illegal) payments from patients. This is an area that warrants further investigation.
6.3 Finally, GAVI ISS resources played an important role for the RepCI in Tajikistan, but appears to have had limited effect on facility performance.
¾ GAVI ISS resources accounted for ten-times more resources for the NIP than government funds between 2001 and 2005. There appears to be an excessive bias toward capital expenditures, with more than half of GAVI ISS being used for purchase of vehicles (26%), computers (13%), incinerators and cold chain equipment (10%). The recurrent cost implications of capital equipment purchases will exacerbate future funding gaps and pose challenges to the financial sustainability of the program.
¾ Controlling for population income and regional characteristics, availability of facility resources, distance traveled, and vaccine collection from a central location, it was found that GAVI resources had a small but insignificant effect on the number of doses given at facility level.
6.4 Other findings
¾ While the government reported stock-outs of oral polio vaccine (OPV) in 2005, the PETS survey uncovered widespread stock-outs for all childhood vaccines. Ninety-eight percent of facilities reported a stock-out of at least one vaccine in 2005, and facilities were without vaccines for six weeks on average. This finding may be related to poor forecasting of vaccine needs, leading to frequent travel for stock replenishment, and resulting in high transactions costs and inefficiencies for the health system.
Final Report: Immunization Resource Tracking Exercise: Case Study of Tajikistan
34
Recommendations 6.5 The table below outlines the specific recommendations for enhancing sustainability, strengthening resource allocation to sub-national levels, and reducing any potential leakages in funds flow for the national immunization program in Tajikistan to health facilities. Recommendation Activities to be Undertaken Responsible Additional Comments
The sustainability of the national immunization program needs to be increased.
- Advocacy activities need to be undertaken at sub-national levels to improve allocation to primary health care services, particularly for financing operating costs. - Explore adding a vaccine or immunization program line item to the national and regional budgets. This has been shown to improve resource allocation over time in other settings. - The SWAp process proposed for Tajikistan will also help to address under-financing and sustainability issues.
National Immunization Program working with the MOH and oblast and rayon administrations; NIP working with the Ministry of Finance, World Bank and other partners
Donor funding for immunization, including GAVI, needs to be on- budget and integrated within the national budgeting, financial management and reporting systems of the Government of Tajikistan.
- The National Immunization Program should provide annual reports on allocation and use of donor funds, including GAVI commodity and cash resources, to the Ministry of Health and the Ministry of Finance. - Integration of donor resources will be enhanced by the SWAp process proposed in Tajikistan.
National Immunization Program, Ministry of Finance, and donor partners
Incentives for and reasons why staff contributions for health and immunization services are so high need to be studied.
- A future study could explore more in-depth how (from what sources) and why staff finance their contributions to cover travel for PHC and immunization-related activities.
World Bank and Ministry of Health (NIP)
High contribution levels are likely to be linked to low wages and informal payments by clients, so that reforms will need to be comprehensive to address critical financial incentives.
Criteria for allocating government and donor resources for the national immunization program need to be developed, and allocations monitored.
- A short policy should be developed that outlines criteria to be used (per capita, per facility, etc) to allocate donor resources and to generate better alignment and harmonization of donor resources for better immunization outcomes. - A tracking system could be instituted to monitor how donor and government resources are being allocated to sub-national levels.
Inter-Agency Coordinating Committee of the NIP (of which the World Bank is a member)
This process should improve targeting of resources to lower-performing rayons, reduce imbalances between service delivery needs and funding, and contribute to achieving MDG 4.

Final Report: Immunization Resource Tracking Exercise: Case Study of Tajikistan
35
Recommendation Activities to be Undertaken Responsible Additional Comments Immediate attention needs to be paid to revamping the NIP monitoring system.
- Denominator information at oblast and rayon levels should be corrected. - The target population for specific vaccines needs to be clearly specified and communicated to facility staff. - Vaccine reporting formats need to be streamlined and improved to reduce redundancies and to obtain the most efficient amount of critical information needed for the program. - Retraining in record-keeping is urgently needed to improve quality of reporting. - Periodic household/cluster surveys should be undertaken to confirm coverage reporting.
National Immunization Program (RepCI and RegCIs) working with WHO, UNICEF, and the World Bank.
Proper monitoring and reporting of immunization activity will be a critical piece for the conditional transfers to women financed by the Global Food Crisis Trust Fund through the World Bank Community and Basic Health Project (CBHP).
Vaccine stock management and logistics needs to be improved.
- Capacity within the government for vaccine forecasting needs to be developed and strengthened based on revised denominator data. - Mechanisms need to be put in place to prevent stock-outs and ensure adequate availability of vaccines when needed. - A tracking system for monitoring critical supplies and supply points for the conditional cash transfer program should be developed and instituted on a regular basis.
National Immunization Program (RepCI and RegCIs) working with local WHO and UNICEF offices, as well as WHO/EURO.
The success of the World Bank proposed conditional cash transfer component of the CBHP will depend upon the availability of vaccines for women and children at the time of service. Without adequate supply, the transfer scheme will be at risk.
A capital equipment register, particularly for vehicles used by the program, needs to be developed and implemented to improve facility, rayon, regional and national levels.
- Vehicle details (make, model, major repairs) need to be registered and maintained at regional and central levels. - A vehicle logbook could be instituted at facility level to track usage of vehicles (purpose, distance traveled, etc).
Ministry of Health working with the World Bank
Guidelines need to be developed on effective use and management of cash assistance from the GAVI Alliance (ISS and HSS).
- Guidelines should include best practice examples on planning & budgeting, resource allocation to sub-national levels, financial management, and financial and activity reporting.
GAVI Secretariat
Lessons Learned
6.6 The process of conducting the immunization resource tracking exercise focused policy discussions around vaccine financing, with the government increasing its allocation from $15,000 to $400,000 for vaccines in 2006. In addition, this work facilitated dialogue around the need to reform and update denominator information for appropriate planning and vaccine forecasting.
6.7 The Tajikistan Health PETS provided an interesting opportunity to examine immunization-specific resource flows to health facilities. In addition to benefitting from the expertise of the Health PETS team, the immunization resource tracking exercise could be placed within the larger context of health sector resource flows and expenditures. However, there were limitations to the information that could be obtained for immunization resource flows using the PETS methodology. Because primary health facilities did not prepare budgets, it was not possible to evaluate differences between expected and actual resource flows to frontline providers. The study used an approach for estimating
Final Report: Immunization Resource Tracking Exercise: Case Study of Tajikistan
36
immunization resource requirements at facility level based on quantities of inputs and assumptions regarding unit prices.
6.8 Data quality on both budgets/expenditures and immunization program performance were of concern for this study. Where possible, information was collected from multiple sources to improve reliability of data. Immunization coverage rates were difficult to ascertain, given data quality issues and variation in the denominator data for the target population.
6.9 The combination of methods used for tracking and evaluating resource flows for the vertical immunization program and for health facility resource use had the advantage of providing an aggregate picture of specific immunization funding flows and constraints. The nationally representative sample drawn for the Health PETS permitted generalization of facility-based findings. However, the cost and time required for field work may preclude other countries from undertaking such an extensive immunization resource tracking exercise.
6.8 Modification of the approaches undertaken for the Tajikistan immunization resource tracking exercise may be useful for future exercises. A National Health Accounts (NHA) framework (recently developed Child Health Sub-Accounts) may be useful for organizing information about donor and government contributions to vertical aspects of national programs, and provide links between funding sources, intermediaries, and uses of funds. An NHA framework could be supplemented with interviews about the resource allocation process and a purposive sample of facilities to obtain in-depth information on resource flows, bottlenecks, and leakages to the facility level.
6.10 Additional research needs to be conducted to learn more about staff contributions to PHC and immunization services in Tajikistan. In particular, it would be useful to learn the sources of the contributions and to what extent staff use other benefits and income to compensate for these expenditures.

Final Report: Immunization Resource Tracking Exercise: Case Study of Tajikistan
37
References
Brenzel, L. 2005. Note on Returns to Scale for Immunization Services: Prepared as an Economic and Sector Work on Economics of Vaccination. HDNHE. The World Bank, Washington, D.C.
Brenzel L, Wolfson L, Fox-Rushby J, Miller M, and Halsey N. Chapter XX. Vaccine Preventable Diseases, in Jamison D, Breman J, Measham A, Alleyne G, Claeson M, Evans D, Jha P, Mills A, and Musgrove P, eds., 2nd edition, Oxford University Press for the World Bank, forthcoming 2006.
Cashin C. 2004. Tajikistan Health Sector Note: Health Financing Report. The World Bank, ECSHD. Washington, D.C.
Center for Global Development. 2007. Following the Money: Toward Better Tracking of Global Health Resources. Report of the Global Health Resource Tracking Working Group. Washington, D.C.
Chee G. Fields R. Hsi N. and Schott W. 2004. “Evaluation of GAVI Immunization Services Support Funding.” Bethesda, MD: Abt Associates, Inc.
Das Gupta M, Gauri V, and Khemani S. 2003. Primary Health Care in Nigeria: Decentralized Service Delivery in the States of Lagos and Kogi. The World Bank Africa Region Human Development Working Paper Series. No. 70. Washington, D.C.
Das J, Dercon S, Hayarimana J, and Krishnan P. 2004. Public and Private Funding of Basic Education in Zambia: Implications of Budgetary Allocations for Service Delivery. The World Bank Africa Region Human Development Working Paper Series. Washington, D.C.
Dehn J. Reinkka R. and Svensson J. 2002. Chapter 9: Survey Tools for Assessing Performance in Service Delivery. Washington, D.C. Mimeograph.
Foster, M. 2006. “Fiscal Space and Sustainability: Towards a Solution for the Health Sector.” In High-Level Forum on the Health Millennium Development Goals, Selected Papers 2003–2005, WHO, 2006.
Gauthier B. 2006. PETS-QSDS in Sub-Saharan Africa: A Stocktaking Study. The World Bank. Mimeograph.
Gauthier B. and Wane W. 2007. Leakage of Public Resources in the Health Sector: An Empirical Investigation of Chad. Policy Research Working Paper 4351. The World Bank. Development Research Group. Human Development and Public Services Team. Washington, D.C.
Gauthier B. and Wane W. 2004. “Suivi des Depenses Publiques a Destination dans le Secteur Sante au Tchad: Analyse des Resultats d’Enquete. World Bank. Washington,D.C. Mimeograph.
GAVI, 2003. Guidelines for Preparing a National Immunization Programme Financial Sustainability Plan. http://www.who.int/immunization_financing/tools/en/.
GAVI Alliance. 2008. www.gavialliance.org. Accessed on March 25, 2008.
Gupta S, Davoodi H, and Tiongson E. 2000. Corruption and the Provision of Health Care and Education Services. IMF Working Paper. WP/00/116. Washington, D.C.
Heller, P. 2005. Understanding Fiscal Space. IMF Policy Discussion Paper, PDP/05/4. Washington, D.C.
Johns B and Torres TT, on behalf of WHO-CHOICE. 2005. “Costs of scaling up health interventions: a systematic review,” Health Policy and Planning, 20(1): 1-13.
Khaleghian P. 2003. Decentralization and Public Services: The Case of Immunization. World Bank Policy Research Working Paper No. 2989. Washington, D.C.
Kenya Institute for Public Policy Research and Analysis (KIPPRA) 2003. Budget Mechanisms and Public Expenditure Tracking in Kenya. Social Sector and Macroeconomic Division, Mimeograph.
Final Report: Immunization Resource Tracking Exercise: Case Study of Tajikistan
38
Levine R. and the What Works Working Group. 2004. Millions Saved: Proven Sucesses in Global Health. Center for Global Development. Washington, D.C.
Lewis M. 2006. Governance and Corruption in Public Health Care Systems. Center for Global Development, Working Paper Number 78. Washington, D.C.
Lewis M. 2006. Tackling Healthcare Corruption and Governance Woes in Developing Countries.CGD Brief. Washington, D.C.
Lindelow M. 2006. Tracking Public Money in the Health Sector in Mozambique: Conceptual and Practical Challenges. Draft mimeo.
Lindelow M and Wagstaff A. 2003. Health Facility Surveys: An Introduction. Policy Research Working Paper 2953, The World Bank Development Research Group, Washington, D.C.
Lindelow M, Ward P, and Zorzi N. 2004. Primary Health Care in Mozambique: Service Delivery in a Complex Hierarchy. The World Bank, Africa Region Human Development Working Paper Series –No.69. Washington, D.C.
Lindelow M. Kushnarova I. and Kaiser K. Measuring corruption in the health sector: what we can learn from public expenditure tracking and service delivery surveys in developing countries.Washington, D.C. Draft mimeograph.
Loevinsohn B. Hong R. and Gauri V. 2006. “Will more inputs improve the delivery of health services?- analysis of district vaccination coverage in Pakistan.” International Journal of Health Planning and Management. 21:45-54.
Lu C. Michaud C. Gakidou E. Khan K. and Murray C. 2006. “Effect of the Global Alliance for vaccines and immunization on diphtheria, pertussis and tetanus vaccine coverage: an independent assessment.” Lancet: 368. pp. 1088-95.
Lydon, P. 2004. “Financial Sustainability Plan Analysis: A Look across 22 GAVI Countries.” World Health Organization, Geneva.
Lydon, P. Levine R. Makinen M. Brenzel L. Mitchell V. Milstein J. Kamara L. and Landry S. 2008. New Vaccines in the Poorest Countries- What did we learn from the GAVI experience with financial sustainability. Vaccine (forthcoming).
Naimoli J. Challa S. Schneidman M. Kostermans K. and Sharma R. 2005. Benchmarking Immunization Program Performance in the Africa Region. The World Bank, HDNHE. Washington, D.C.
PHRPlus. 2006. Insights for Implementers: Improving Primary Health Care by Strengthening Accountability in the Health Sector. Bethesda, MD.
Reinnka R. 2004. Recovery in Service Delivery: Evidence from Schools and Health Centers.Washington, D.C. Mimeograph.
Reinnka R. and Svensson J. 2002. Assessing Frontline Service Delivery. World Bank Development Research Group, Public Services, Washington, D.C.
Stone & Webster Consultants. 2005. Tajikistan Facility Surveys. Submitted to the World Bank, Washington, D.C. Mimeograph.
Vian T. 2002. Corruption and the Health Sector. Sectoral Perspectives on Corruption. MSI. Washington, D.C.
Walker D, Mosquiera NR, Penny ME, Lanata CF, Clark AD, Sanderson EFB, and Fox-Rushby JA. 2004. “Variation in the costs of delivering routine immunization services in Peru,” Bulletin of the World Health Organization, 82(9).
Wane W. 2001. Expenditure Tracking Survey in Senegal: The Health Sector. Plan Pratique “Pauvrete Sante.” The World Bank. Washington, D.C. Mimeograph.
The World Bank. 2004. World Development Report. Washington, D.C.
Final Report: Immunization Resource Tracking Exercise: Case Study of Tajikistan
39
The World Bank. 2004. Tajikistan Public Expenditure and Institutional Review. Poverty Reduction and Economic Management Unit, Europe and Central Asia Region. Washington, D.C.
The World Bank. 2008. Cambodia Health PETS: Public Expenditure and Tracking Survey Report(draft). Human Development Sector Unit. East Asia and the Pacific Region. World Bank. Washington, D.C.
The World Bank. 2008. Republic of Tajikistan, Public Expenditure Tracking Study (PETS)- The Health Sector. (draft) Poverty Reduction and Economic Management Unit. Europe and Central Asia Region. Washington, D.C.
The World Health Organization.2008. http://www.who.int/immunization_monitoring/data/data_subject/en/coverage_estimates_series.xls
Final Report: Immunization Resource Tracking Exercise: Case Study of Tajikistan
40