Embed Size (px)
Citation preview
Volu
me 2
N
um
ber 2
D
ece
mbe
r 2014
tbr
Chief Patron
ISSN 2348 - 3784
Volume 2 Number 2 December 2014
Articles
Ÿ
- Massand Ajay Balrambhai and Gopalakrishna B V
Ÿ Interaction of competencies and commitment of higher education teachers
- J Anitha and PM Reema
Ÿ A study on the utilisation of internet banking
- E Meera, K Govindarajan and M Inbalakshmi
Ÿ Employees' motivation and valued rewards as a key to effective QWL - from the perspective of Expectancy theory
- HemaMalini P H and Anthea Washington
Ÿ Understanding food mile: An qualitative study on the concept of food mile
- Smita Ghoshal
Ÿ Does a speculative trade in food commodities influence food price inflation in India?- S Pushparaj and Vidya Suresh
Book Review
Ÿ Four-Cornered Leadership: A framework for making decisions- Harish B
Perspective
Ÿ Commodities markets: improving trade volumes - K G Karmakar
Foreign Direct Investment in Indian banking sector: trends, opportunities and impact

Thiagarajar School of Management (TSM), Madurai has established itself in the Southern
part of India as one of the premier citadels of learning, rendering creditable service to the
cause of higher education. TSM was founded in 1962 by the doyen of the South Indian
textile industry, Mr. Karumuttu Thiagarajar Chettiar - a great philanthropist who also
founded several engineering and arts colleges, polytechnics; teacher's training institutes,
and primary and secondary schools.
TSM offers a choice of management education streams: All India Council of Technical
Education (AICTE) approved PGDM (Post Graduate Diploma in Management)
programme which was launched in 2011 and the MBA (Master of Business
Administration) programme - approved by AICTE, accredited by National Board of
Accreditation (NBA), autonomous status granted by UGC and affiliated to Madurai
Kamaraj University. Both the programmes are 2-year full-time, fully residential. PGDM is
the flagship programme of TSM. .
TSM is run by the Manickavasagam Charitable Foundation - an organization that has been
actively involved in several primary and higher educational projects. Mr.
Manickavasagam Chettiar, the prime mover behind TSM, was its Founder
Correspondent. TSM prides itself on being one of the few institutions that does not accept
any capitation fees from students seeking admission. The school is fully supported and
funded by the Loyal Textiles Group. The Chairman & Managing Director of the group, Mr.
Manikam Ramaswami, a Gold Medalist from IIT Chennai, is the present Correspondent of
TSM. .
Eminent faculty members in the areas of Marketing, Finance, Human Resources,
Operations and Systems give wider and deeper insights both in theory & practice to the
students. Situated in a picturesque location, equipped with a state of art infrastructure,
TSM delivers more than what it promises and it is no wonder that a TSM student is
academically sound, professionally proficient and ethically correct. The outcome, TSM's
excellent placement record and academic performance are the result of the processes that
are in place at TSM –processes for excellence in management education.
About Thiagarajar School of Management

TSM Business Review INTERNATIONAL JOURNAL OF MANAGEMENT
(A Double Blind, Peer Reviewed Bi- Annual Journal)
Volume 2 Number 2 December 2014
Chief Patron Prof. Gautam Ghosh
Pambanswamy Nagar, Thiruparankundram, Madurai, Tamil Nadu www.tsm.ac.in
TSM Business Review (TBR) is the official bi-annual publication of Thiagarajar School of Management, Madurai, India. TBR is published since 2013 regularly during the months of June and December. It provides an open platform for reading and sharing articles, research papers and case studies that have a high impact on the management field. It has a special emphasis on management issues that are relevant to emerging economies and aims at providing a link between academic research and practical implications. CONTACT ADDRESS Chief Patron TSM Business Review Office THIAGARAJAR SCHOOL OF MANAGEMENT Pambanswamy Nagar, Thiruparankundram, Madurai – 625005, India Email: [email protected] DISCLAIMER The authors are solely accountable for the contents of the papers compiled in this volume. The publishers or editors do not take any responsibility for the same in any way. Errors, if any, are purely involuntary and readers are requested to communicate such errors to the editors or publishers to avoid discrepancies in future. PUBLISHING CONSULTANCY Shanlax Press 61, TPK Main Road, Vasantha Nagar, Madurai – 625 003 e-mail: [email protected] web: www.shanlaxpress.com
TSM Business Review INTERNATIONAL JOURNAL OF MANAGEMENT (A Double Blind, Peer Reviewed, Bi- Annual Journal)
Volume 2 Number 2 December 2014
Chief Patron Prof. Gautam Ghosh, Director, TSM, Madurai
Members of Editorial Board
Dr. Kamal Ghose, Director, International Relations, Lincoln University, New Zealand Dr. K. Prakash Vel, Associate Professor, University of Wollongong, Dubai Dr. Sethu. G, Professor, IIM Tiruchirappalli Dr. M. Ramakrishnan, Sr., VP- HR Loyal Textiles Ltd., Chennai Dr. Bipasha Maity, Associate Professor, TSM, Madurai Dr. Vidya Suresh, Associate Professor, TSM, Madurai
Members of Advisory Board
Shri. B.T. Bangera, MD, Hi-Tech Arai Limited, Madurai Shri. Joseph Zachariah, Director, Vikaasa School, Madurai Dr. R. Kannan, Prof. & Head, Department of Sociology, Madurai Kamaraj University, Madurai Mr. Nagaraj K, MD, Aparajitha Corporate Services, Madurai Mr. Srinivasa Varadhan, President, TVS Tyres, Madurai Prof. A. Uma Rani, Director, TATA Dhan Academy, Madurai Dr. N. Chandrasekaran, VP- Corporate Affairs, Take Solutions Ltd., Chennai

EDITORIAL
This issue of TSM Business Review has touched a new milestone of getting international recognition through the process of indexing. I’ am happy to announce that we are indexed and abstracted in ProQuest. Articles published in TBR are subjected to review by two referees. Each referee writes his comments
to the editor expressing his outlook. This consolidated report is sent to the author along with the editor’s decision. The editors rely on input from referees. Thus, acceptance for publication requires the agreement of both the editors and reviewers. Rejections occur due to misfit with the journal’s scope or weak academic work. My accolades to authors of this issue for their perseverance and commitment enhance the quality of their work. This issue dwells on a number of contemporary issues. We have articles focusing on banking sector by Massand and Gopalakrishna on the opportunities for FDI in Indian banking sector, and internet banking usage by Meera, Govindarajan and Inbalakshmi. On the HR side, Anitha and Reema talk about competencies and commitment of higher education teachers, while HemaMalini and Anthea lay emphasis on expectancy theory. Smita uses thematic content analysis to study the concept of food mile, and Pushparaj applies time series analysis to conclude that there is no influence of trading in food commodity futures on wholesale price indices. In addition to articles, we have a book reviewed by Harish and a perspective by Karmakar on commodities markets. I hope that TBR will continue the process of enhancing the reputation of the journal in the forthcoming issues.
Gautam Ghosh


CONTENTS
Articles…. Foreign Direct Investment in Indian banking sector: trends, opportunities and impact……………………………….............................................................001 Massand Ajay Balrambhai and Gopalakrishna B V This paper explores the opportunities for Foreign Direct Investment in Indian Banking Sector and highlights its various forms of presence in India. Investigates the trends in FDI into Indian banking sector by using secondary data and thereby discusses the RBI’s amendments and recent foreign policy. Interaction of competencies and commitment of higher education teachers ……………………………………………………………………..................013 J Anitha and PM Reema Teachers have a significant role in influencing the belief and thought process of students. This study tries to find if there is any significant relationship between existing level of commitment and competence among educators. Simple random sampling technique with a sample of 185 educators from various higher institutes was used. It concludes that educators’ professional competence increases as their designation go higher. A study on the utilisation of internet banking …………………………………………………………………......................028 E Meera, K Govindarajan and M Inbalakshmi This paper examines the utilization of net banking and their awareness. Using analysis of variance, authors concluded that demographic factors have a significant role in influencing the awareness level and utilization of certain services on internet banking. Banks have to educate public to get rid of their inhibitions on net banking. Employees’ motivation and valued rewards as a key to effective QWL - from the perspective of Expectancy theory……………………………………….045 HemaMalini P H and Anthea Washington
Employees around the world are motivated to work and perform effectively based on the kind of positive rewards they expect to earn as a result of their performance. This paper relates quality of work life with the expectancy theory proposed by Victor Vroom.

Understanding food mile: An qualitative study on the concept of food mile ……………………………………………………………………..... ..........055 Smita Ghoshal Food mile is an important topic for debate for developed nations who are against global food supply chain and for organizations who are working on sustainable and environmental issues. This article investigates related literature on the concept of food mile and tries to bring forth a different perspective to the issue in relation to the Indian subcontinent. Does a speculative trade in food commodities influence food price inflation in India? …………………………………………………………………….071 S Pushparaj and Vidya Suresh Inflation pressure on food products is caused by interplay of multiple factors. This paper analyses the relationship between wholesale food price index and trading on agricultural commodities in Multi-Commodity Exchange of India (MCX) using the monthly data between 2004 and 2014 from CSO and MCX respectively. Using time series analysis the study indicates that there is no influence of trading on food commodity futures on wholesale price indices. Book Review…. Four-Cornered Leadership: A framework for making decisions. Written by John Roland Schultz; CRC Press (Taylor& Francis Group), 2014, 261pages, £38.99 Harish B 085 Organized in seven chapters, the book presents the concept of leadership based on Edward Deming’s system of profound knowledge. The author had done lot of research to consolidate and present useful tools and metrices for practicing managers. The book was able to bring in an exhaustive range of management tools (both classic and modern) under one umbrella of Deming’s System of Profound Knowledge. This can be useful as a quick reference guide of these metrices. Perspective…… Commodities Markets: Improving Trade Volumes K G Karmakar 087 The report highlights the success story of the Chicago Board of Trade (CBOT) of USA and suggests the need of the same to be replicated for India. The author suggests that by forming association, farmer’s can improve their profit and financial margins. This association will not only grade, sort and aggregate farm produce but also take trading positions in commodity exchanges.
Article ISSN: 2348-3784
Massand Ajay Balrambhai, Research Scholar, Department of Humanities, Social Sciences and Management, National Institute of Technology Karnataka (NITK), Surathkal, Srinivasnagar-575025, Dakshina Kannada, Karnataka. Email: [email protected]/[email protected], Phone: +919886091217. (Corresponding Author) Dr. Gopalakrishna B V, Assistant Professor, Department of Humanities, Social Sciences and Management, National Institute of Technology Karnataka (NITK), Surathkal, Srinivasnagar-575025, Dakshina Kannada, Karnataka. Email: [email protected]/ [email protected], Phone: +918453429906
Foreign Direct Investment in Indian Banking Sector: Trends, Opportunities and Impact
Massand Ajay Balrambhai and Gopalakrishna B V
Abstract In the rapidly changing economic environment, Foreign Direct Investment (FDI) is used as the stimulus for growth in the most of developing countries including India. Globalization has engulfed all the sectors into its fold, out of which the banking sector is a crucial one. FDI in Indian banking sector has a lot of opportunities as well as challenges. This Paper explores the opportunities for FDI in Indian banking sector and highlights its various forms of presence in India. It further investigates the trends in FDI into Indian banking sector and attempts to reckon the impact of presence of foreign banks on Indian domestic banks. The study also throws light on RBI’s amendments and recent foreign policy with respect to FDI in India. Key Words: Foreign Direct Investment (FDI), RBI, Indian Banking Sector, Foreign Banks 1. Introduction Foreign Direct Investment (FDI) is considered to be life blood of economic development especially for developing and underdeveloped countries (Shylajan, 2011). Though FDI has its own shortcomings, many developing countries have opened up their economies. For last two decades, the attentions of developed countries have been drawn by developing countries due to their high growth potential, untapped market and investor friendly environment. In 2012, developing countries took over the developed countries, first time ever, in attracting FDI accounting for 52 per cent of global FDI flows. One of the reasons may be the rate of return. The return on FDI was 7 per cent globally and higher in both developing (8 per cent) and transition economies (13 percent) than in developed ones (5 per cent). India has been ranked at 15th Place in receiving FDI in 2012. It gained the 3rd place in attracting FDI in the world (IMF, 2013). Foreign Direct Investment is used as the stimulus for growth in the most of developing countries including India. Globalization has engulfed all the sectors into its fold, out of

2 Foreign Direct Investment in Indian Banking Sector: Trends, Opportunities and Impact
TSM Business Review, Vol. 2, No. 2, December 2014
which the banking sector is the crucial one. FDI in Indian banking sector has lot of opportunities as well as challenges. According to the Department of Industrial Policy and Promotion (DIPP), India has attracted US$ 293,641million as a cumulative foreign inflow from 2000-2013, out of which the service sector bagged the highest portion of 19%. With the rise in International service transactions and economic integration, the banking services befitted as crucial activities for any business. This has further led to high opportunities for FDI in the Indian banking sector. 2. Objectives The present study tries to reduce the gap by studying on foreign banks in India and by digging various opportunities for FDI in Indian banking sector. By having handful of studies on foreign banks in India, the present study has the following objectives in mind. • To explores the opportunity for foreign direct investment in Indian banking
sector. • To investigate the trends in the matter of foreign investment into Indian banking
sector. • To determine the impact of foreign banks presence on Indian domestic banks. • To discuss the role of new phase of FDI policy by Reserve Bank of India (RBI) in
Indian banking. 3. Methodology and Data Sources The information for the study has been collected mainly from secondary sources. The present study is descriptive and analytical in nature. The data is obtained from various publications like Narasimhan committee report, RBI Bulletin, statistical tables relating to banks in India, Basic Statistical Returns of Scheduled Commercial Banks in India and Handbook of Statistics on Indian Economy published by the RBI from year to year. The data collected relate to FDI in banking sector in India are analyzed through simple tabular and graphical statistical methods. By surveying the available theoretical and empirical evidences in the Indian context from various research studies, the study examines the role of new phase of FDI policy by RBI in Indian banking. 4. Literature Survey There is abundance of literature available on FDI in Indian economy but it is shocking that very few have focused on FDI in Indian banking sector. Though studies on Indian banking system repetitively highlighted about the lack of competition as high net interest margin prevails in the Indian banking sector; however, the focus of studies on scope for foreign banks’ entry is minimal. The discussion on FDI in Indian banking sector, opportunities for foreign banks and their impact on Indian banks through literature support is provided. FDI in banking sector has different forms, nature and scope depending on the development level of economy and its Central Bank’s policies (Hurduc & Nitu, 2011).

Foreign Direct Investment in Indian Banking Sector: Trends, Opportunities and Impact 3
TSM Business Review, Vol. 2, No. 2, December 2014
While the impact of foreign banks on domestic banks also depends on the financial development of host country, banking rules can discriminate between countries of origin, based on bilateral treaties, reciprocity reasons or industry structure (Hermes and Lensink, 2004). Alternatively, a country may restrict the expansion of its banks abroad (Hurduc & Nitu, 2011). The existing literature shows that local market opportunities are major factors in attracting foreign banks into new markets (Dunning, 1977). According to Kim and Pant (2010), Indian market is attractive to foreign investors for a variety of reasons including customer base, a relatively developed financial sector and high economic growth. Claessens et. al. (2001) has an interesting finding that foreign bank entry alerts domestic banks and not the market share of foreign banks. There are two forms of entry on a foreign market: Greenfield investment, which involves setting up an institution from scratch. The newly established institution may require a capital infusion from the beginning, but in the cases of a representative office or a branch, the transfer is very limited or replaced only by the transfer of human capital; secondly acquisition of a control position from a local institution. Acquisition size can range from a 100% purchase of the social capital of a given institution to a minority stake (Hurduc & Nitu, 2011). Rezvanian and Mehdian (2008) strongly urged to promote merger and acquisition among Indian banks. From the institutional point of view, the foreign investment is associated with establishing or acquiring one of the following organizational structures: a local representative office, a branch office or a subsidiary. Representative offices of foreign banks do not perform self-independent activities; they rather attract and set up businesses abroad for the mother company. A branch is not an independent legal entity, but an integral part of the mother company. It can offer a complete range of banking services. Subsidiaries of foreign banks are legally independent from their mother company and use their own capital for performing their activities. Hence, foreign banks need to invest more capital abroad if they want to facilitate the same level of lending activity through a subsidiary rather than through a branch. Under the Basel agreements, the supervisory authorities from the host country are responsible for prudential supervision of subsidiaries and the authorities from the country of origin are responsible for the branches of the mother company. If a foreign affiliate bank does not have control over its subsidiary, it has a clear exploring role and does not express a long-term commitment. Acquisitions may be advantageous for multinational banks where little is known about host markets (Hurduc & Nitu, 2011). From the investor’s point of view, the determining factors for their investment in the host countries are important. But, for host countries, the impact of foreign investment in the banking sector on them is crucial, especially if the host countries are developing countries (Kim & Pant, 2010). However, Lensink and Hermes (2004), report that foreign entry is associated with shrinking margins in developing countries but not necessarily in developed countries. Gosh (2012) analysis favors foreign bank presence for improving

4 Foreign Direct Investment in Indian Banking Sector: Trends, Opportunities and Impact
TSM Business Review, Vol. 2, No. 2, December 2014
profitability and asset classes of Indian domestic banks. The study concludes by accepting foreign banks more as assets than as a liability for India. Kalluru & Bhat (2009) found a negative correlation of foreign bank presence with the net interest margins and non-interest income of public sector banks. The study concludes that foreign bank entry in the Indian banking system adversely affects the operations of public sector banks. Nam (2013) concluded that foreign banks were believed to be good friends in tranquil times, but they could become foes in times of crisis especially at the time of their parent banks suffering with illiquidity. Mohan (2013) highlighted various pros and cons of foreign banks entry in India by analyzing the World Bank’s Global Development Financial Report 2008. He has welcomed the innovative products, risk management techniques, cross-border services and quality of service delivery of foreign banks. However, he criticized the role of foreign banks in improved access to financial services, improved efficiency of banks and easing of domestic credit constraints on manufacturing firms. Among the Indian studies, Rezvanian and Mehdian (2008) indicated that foreign ownership was significantly more efficient than public and private ownership. Panandikar (2013) observed that foreign banks have the highest average market based efficiency. The study by Bhattacharya and Pal (2013) also revealed that first phase of reforms in 1991-92 had a positive impact on banks efficiency, whereas the second phase of reforms in 1998 had a negative impact on efficiency of banks. Ghosh (2012) showed that foreign banks presence dampened spreads in Indian domestic banks, as foreign banks lend money through hard information and they give away loans at very lower rate than the domestic banks. The study also claimed that foreign banks also influence the maturity of credit portfolio of domestic banks. The empirical study by Kalluru & Bhat (2009) showed that foreign banks entry was associated with increasing profitability, growing overhead expenses and rising non-performing loans in Indian public sector banks. The study concluded that foreign bank entry in the Indian banking system adversely affects the operations of public sector banks. 5. Conceptual Clarification: Opportunities for FDI into Indian Banking Sector Government of India (GOI) launched economic reforms to resolve the deficit problem in 1991 and suggested to deregulate financial sector specified by Narasimham Committee. Though foreign bank entry in India had been made in 1853 by Hong Kong and Shanghai (HSBC) bank, the real foreign investment was gained after liberalization in 1991-92. Indian banking sector was liberalized by Government of India with the objective to enhance efficiency, productivity and profitability through competition. RBI does not maintain any data to measure FDI in Indian banking sector. Thus, foreign banks are mainly considered as FDI into Indian banking system (Kim & Pant, 2009). As a founder member of World Trade Organization (WTO), India is abided by WTO’s guideline to allow opening up of 12 branches of foreign banks in a single year.

Foreign Direct Investment in Indian Banking Sector: Trends, Opportunities and Impact 5
TSM Business Review, Vol. 2, No. 2, December 2014
In 2005, RBI announced its “Roadmap for the presence of foreign banks” in India. In the first phase, foreign banks were allowed to establish their own subsidiary or transform the existing branches into a Wholly Owned Subsidiary (WOS). In this phase RBI also allowed to open up more than 12 branches in a single year by considering the principle of reciprocity. After reviewing the first phase by April 2009, RBI was supposed to initiate second Phase which was delayed due to global financial crisis in 2008. The committee on financial sector chaired by Dr. Raghuram Rajan also supported further opening up of foreign bank’s entry into India to improve the banking sector. Besides, India has being engaged with bilateral trade agreements with Singapore and Korea. The Agreement with Singaporean banks, Comprehensive Economic Cooperation Agreement (CECA) granted them permission to open 15 branches in India within four years from the 2006. While the agreement with Korean banks, Comprehensive Economic Partnership Agreement (CEPA) permitted them to open 10 branches within four years from 2010. Direct investment into Indian banking Sector follows four distinct channels. In order to invest in Indian banking sector, Foreign Direct Investors would open their branches or wholly owned subsidiary (WOS), but not both. According to consolidated FDI Policy by DIPP-2014, Foreign Direct Investors can invest into Indian private banks up to 74%. This 74 percentage limit will include investment under the Portfolio Investment Scheme (PIS) by FIIs, NRIs and shares acquired prior to September 16, 2003 by erstwhile OCBs, and continue to include IPOs, Private placements, GDR/ADRs and acquisition of shares from existing shareholders. Out of 74 percent limit, 49 percent would be invested through automatic route. But in order to invest beyond 49 percent and up to 74 percent, Government route is a must. 5.1 Trends of FDI in Indian Banking Sector Trends of FDI in Indian banking sector would be represented as the number of foreign banks entered into Indian markets, the increasing number of branches and asset share in the total banking system. The rising trend is high stock of foreign investors in private and public sector banks in India. Most of FDI into Indian banking Sector exist in the form of branches or acquiring a stake in Indian banks. Though RBI has allowed foreign banks to establish WOS, not a single WOS has been established so far.
Table 1: Number of foreign banks present throughout 1980 -2013 Year 1980 1985 1990 1995 2000 2005 2010 2013
No. of Foreign banks 13 20 22 27 42 31 32 43 Source: Database on Indian Economy by RBI

6 Foreign Direct Investment in Indian Banking Sector: Trends, Opportunities and Impact
TSM Business Review, Vol. 2, No. 2, December 2014
Figure-1: Presence of foreign banks in India
(Data is in numbers) Source: Database on Indian Economy by RBI The table-1 shows that the number of foreign banks tripled from 1980 to 2013 from 12 to 43, which may represent the determination of foreign banks to enter into India. In 1991, when Indian economy was liberalized, the rules for foreign bank entry were also liberalized further which generated the opportunity for foreign banks to enter. Most of the times, developing countries open their market through economic reforms due to financial crisis or current account deficit, which creates scope for foreign investment (Mohan, 2013). Banking crisis creates opportunities for a foreign bank to acquire domestic banks as its asset value declines for example, Thailand in 1997 crisis (Clark, 2008). It is learnt from the chart that foreign banks entered in India in a large number in 1997 during Asian financial crisis. After reaching to the peak in 1999, the number declined sharply and it surged again from 2009at the time of Global financial crisis. Thus, the good number of foreign banks entry during Asian financial crisis and Global financial crisis in India is to be observed. Foreign banks have shown interest to establish as branches rather than in any other forms. It is also noted that before 2006, ATMs of foreign banks were also considered branches. Hence, foreign banks had a little opportunity to open up more branches. But, As soon as India has allowed 12 branches per year to foreign banks and ATMs were excluded to be considered as branches, foreign banks branches were rapidly enhanced throughout the country. There were 145 offices in 1990 and the number of foreign banks' offices increased by 100 ending up with 272 offices in 2007 (Kim & Pant, 2010). As per Figure-2, foreign banks branches raised 29 percent in 2013 considering 2006 as the base year and it is raised by 130 percent by considering 1990 as a base year. It has also interesting to note that till 2006; ATMs of foreign banks were considered branches by GOI.
Foreign Direct Investment in Indian Banking Sector: Trends, Opportunities and Impact 7
TSM Business Review, Vol. 2, No. 2, December 2014
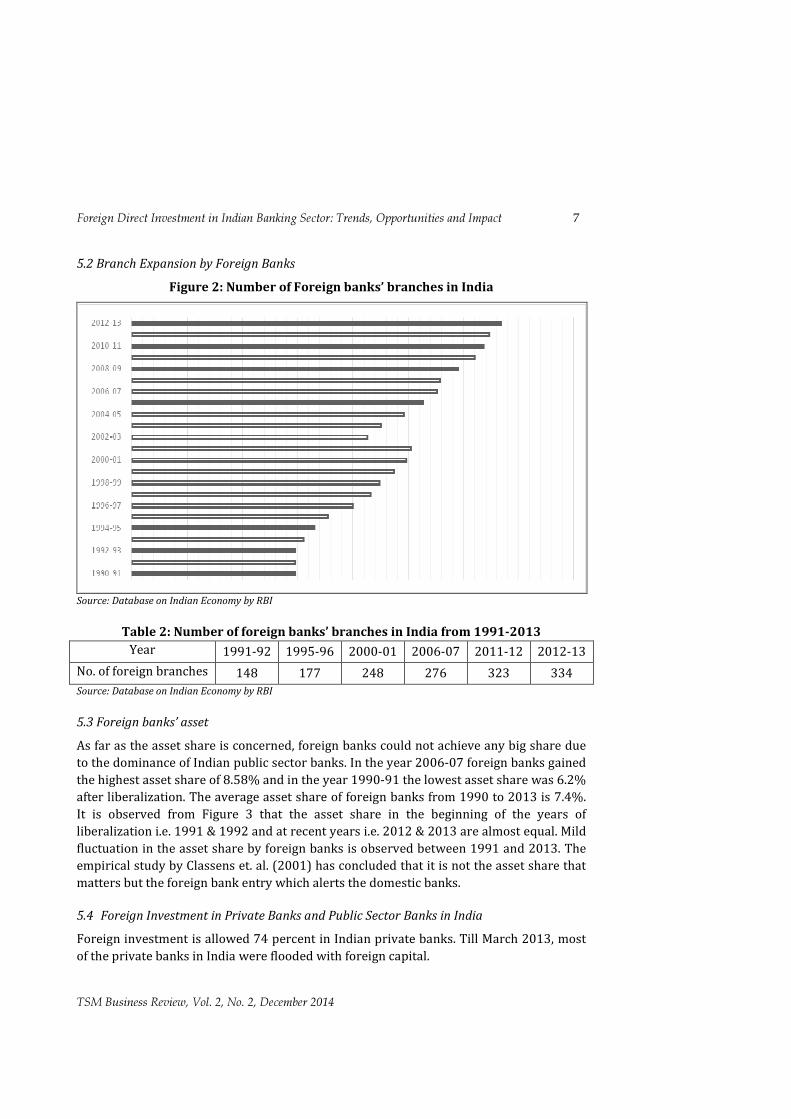
5.2 Branch Expansion by Foreign Banks
Figure 2: Number of Foreign banks’ branches in India
Source: Database on Indian Economy by RBI
Table 2: Number of foreign banks’ branches in India from 1991-2013 Year 1991-92 1995-96 2000-01 2006-07 2011-12 2012-13
No. of foreign branches 148 177 248 276 323 334 Source: Database on Indian Economy by RBI 5.3 Foreign banks’ asset As far as the asset share is concerned, foreign banks could not achieve any big share due to the dominance of Indian public sector banks. In the year 2006-07 foreign banks gained the highest asset share of 8.58% and in the year 1990-91 the lowest asset share was 6.2% after liberalization. The average asset share of foreign banks from 1990 to 2013 is 7.4%. It is observed from Figure 3 that the asset share in the beginning of the years of liberalization i.e. 1991 & 1992 and at recent years i.e. 2012 & 2013 are almost equal. Mild fluctuation in the asset share by foreign banks is observed between 1991 and 2013. The empirical study by Classens et. al. (2001) has concluded that it is not the asset share that matters but the foreign bank entry which alerts the domestic banks. 5.4 Foreign Investment in Private Banks and Public Sector Banks in India Foreign investment is allowed 74 percent in Indian private banks. Till March 2013, most of the private banks in India were flooded with foreign capital.

8 Foreign Direct Investment in Indian Banking Sector: Trends, Opportunities and Impact
TSM Business Review, Vol. 2, No. 2, December 2014
Figure 3: Percentage of asset share by foreign banks’ in India
Source: Database on Indian Economy by RBI
Figure 4: Foreign investment in private banks in India
(In percentage, as on March2013) Source: Database on Indian Economy by RBI It is visible from the figure 4 that ING-Vysya, ICICI and Indus Ind banks availed higher foreign capital than the rest of private banks in India. According to the recent news, FIPB has declined the HDFC bank’s request to raise foreign capital as it would have crossed the limit of 74 percent cumulative foreign capital. In PSBs the limit is 20% for foreign investment. It is obvious from figure-5 that Bank of Baroda, Punjab National Bank and Dena Bank have acquired higher foreign capital till March 2013.There are banks like Union Bank of India, State Bank of Patiala, State Bank of Mysore and State Bank of Hyderabad having no foreign investment.

Foreign Direct Investment in Indian Banking Sector: Trends, Opportunities and Impact 9
TSM Business Review, Vol. 2, No. 2, December 2014
Figure 5: Foreign investment in PSBs
(In percentage, as on March 2013) Source: Database on Indian Economy by RBI 5.5 Impact of foreign banks on Domestic Indian Banks There are a few studies available on measuring impact of foreign bank entry on Indian domestic banks. Foreign banks improve profitability and asset quality, although they dampen spreads (Ghosh 2012). Foreign banks bring modern technology and new financial services to home country as a spillover effect (Kalluru & Bhat, 2010). In India, foreign banks introduced the sophisticated technology and products. The first ATM was introduced by HSBC in 1987, while Citibank and Standard Chartered Bank introduced credit card and credit card with photo respectively for the first time in India (Kim &Pant, 2010). As these sophisticated products help banks to reduce their labor and administrative cost, the contribution of foreign banks in the direction of improving efficiency of domestic banks do exist. Few studies also claimed that foreign banks adopt “follow your customer” theory. They find their own country mates and grant high credits to them and encourage them in their businesses. But, on the other hand they neglect the need for local entrepreneurs. Foreign banks “Cherry Pick” customers in the home country and grant loan to only few potential corporate. The critics also confine that domestic banks may follow high credit allocation and finds themselves in trouble by raising their Non-Performing Assets (NPA) (Kalluru& Bhat,2009; Kim & Pant, 2010; Nam,2013). 5.6 FDI Policy in Indian Banking Sector As a sequel to the roadmap of 2005 and pursuant to the announcements made in the Annual Policy Statement for 2010-11, the Reserve Bank issued a discussion paper in January 2011 on “The mode of presence of foreign banks in India”. The framework for setting up of WOS by foreign banks in India has been finalized taking into account the feedback received on the discussion paper and factoring in the lessons from the crisis which favors a subsidiary mode of presence from financial stability perspective (RBI,

10 Foreign Direct Investment in Indian Banking Sector: Trends, Opportunities and Impact
TSM Business Review, Vol. 2, No. 2, December 2014
2013). However, RBI has left it on foreign banks to choose any one option to present either in the form of branch or WOS. Reserve Bank, in terms of the powers conferred on it under Section 35A with Section 44A of the Banking Regulation Act, 1949, in the public interest and in the interest of banking policy issued a ‘Scheme for Setting up of Wholly Owned Subsidiaries (WOS) by foreign banks in India’. Foreign banks which commenced banking business in India from August 2010 onwards were required to furnish an undertaking that they would convert their branches into wholly owned subsidiaries if so required by RBI. RBI has incentivized foreign banks by providing national treatment to WOS of foreign banks. WOS can be opened up in any city from tier-1 to tier-6, removing the previous restriction of only in tier-1 and tier-2 cities. Thus, WOSs of the foreign banks, even though locally incorporated, being foreign owned and controlled companies, will be treated as “foreign banks” which also can be listed on Indian stock market for disinvestment up to 26 percent. The main purpose of incentivized foreign banks with national treatment to WOS is financial stability. In order to reduce down size risk, prior approval is needed when the capital and reserves of the foreign banks (i.e. WOSs and foreign bank branches) in India exceed 20% of the capital and reserves of the banking system. Moreover as per the WTO commitments licenses for new foreign banks may be denied when the maximum share of assets in India both on and off balance sheet of foreign banks’ branches to total assets both on and off balance sheet of the banking system exceeds by 15 %. 6. Conclusion FDI is considered the lifeblood of economic development for developing countries like India. As the economic liberalization leads to entry for foreign international banks which enhance efficiency, productivity and profitability in banking sector; the scope for further liberalization of banking sector in India was expected. In this line, RBI has initiated second phase of Liberalization for Indian banking sector with its new FDI policy in 2014. It is quite clear from the present reforms in the FDI policy on Indian banking sector that foreign banks have wide scope in India. Foreign banks have entered into India taking the advantage of the opportunity given by GOI. The important observation of the study was that good number of foreign banks entered during Asian financial crisis and Global financial crisis in India. Although foreign banks entry in India has increased, the RBIs’ favored WOS a mode of presence has not seen yet. Further it is understood that Indian banking system seeks more competition, which can be achieved through foreign banks entry.
Foreign Direct Investment in Indian Banking Sector: Trends, Opportunities and Impact 11
TSM Business Review, Vol. 2, No. 2, December 2014
References Bhattacharyya, A., & Pal, S. (2013). Financial reforms and technical efficiency in Indian
commercial banking: A generalized stochastic frontier analysis. Review of Financial Economics 22(3), 109–117.
Claessens, S., Demirguc-Kunt, A. & Huizinga, H. (2001). How Does Foreign Entry Affect Domestic Banking Markets? Journal of Banking and Finance, 25(5), 891-911.
Clark, J. L. (2008). An Examination of Bank Sector Deregulation on Inbound FDI: Commercial Bank Acquisitions. International Review of Business Research Papers, 4(1), 85-100.
Claessens, S., & Horen, N. (2012). Foreign Banks: Trends, Impact and Financial Stability. IMF Working Paper.
Dasrupta, R. & Paul, M. T. (2007). Banking and Financial Policy: An Independent View. Economic and Political Weekly, 42(13), 1196-1200.
DIPP Report (2014). Consolidated FDI Policy. Ministry of Commerce and Industry. Government of India.
Dunning, J. (1977). Trade, location of economic activity and the MNE: A search for an eclectic approach. In: Ohlin B., Hesselborn P., Wijkman P., eds., The international allocation of economic activity, London: MacMillan Press, 395–431.
Ghosh, S. (2012). Foreign Banks in India: Liabilities or Assets? The Economic Society of Australia, 31(2), 225-243.
Hermes, N., & Lensink, R. (2004). Foreign Bank Presence, Domestic Bank Performance and Financial Development. Journal of Emerging Market Finance, 3(2), 207–229. doi:10.1177/097265270400300206.
Hurduc, N., & Nitu, A. (2011). Forms and Strategies of the Banks to Enter on a Foreign Market. Theoretical and Applied Economics, XVIII, 7(560), 43-52.
International Monetary Fund (2007). Global Financial Stability Report (October). IMF, UNTAD, Washington DC.
International Monetary Fund (2013). Global Financial Stability Report (October). IMF, UNTAD, Washington DC.
Kalluru, S. R., & Bhatt, S. (2009). Does Foreign Bank Entry Affect Operations of Domestic Banks? A Study on Indian Public Sector Banks. The IUP Journal of Managerial Economics, 40-51.
Kim, M., & Pant, M. (2010). Foreign Investment in the Banking Sector: A Case Study of India, 1986-2007. Ph.D. thesis, Jawaharlal Nehru University, New Delhi, India.
Lee, C., Hsieh, M. & Dai, H. (2011). How does foreign bank ownership in the Banking Sector affect Domestic Bank Behavior? A Dynamic Panel Data Analysis. Bulletin of Economic Research, Blackwell Publishing Ltd., 64:S1, 2012, 0307-3378.
Mohan, T. T. Ram. (2013). Before and After the Global Crisis, New Delhi, India: Gyan Publishing House.
Nam, J. B. (2013). Foreign Banks in Emerging Economics: Friends or Foes? SERI Quarterly, 41-48.
12 Foreign Direct Investment in Indian Banking Sector: Trends, Opportunities and Impact
TSM Business Review, Vol. 2, No. 2, December 2014
Panandikar, S. C. (2013). Operational and Market based Efficiencies of Indian Commercial Banks: A Comparative Study. The IUP Journal of Bank Management, XII (3).
Patil, A., & Nawani, S. (2007). Technological Capability as a Determinant of FDI Inflows: Evidence from Developing Asia & India. Working Paper No. 193, Indian council for research on international economic relations.
Planning commission report (2008). Financial Sector Reform (Chairman: Prof. Raghuram Rajan). Government of India, Sage Publication Inc. New Delhi.
Rajan, R. S. (2011). Crisis, Capital Flows and FDI in Emerging Asia.New Delhi, India, Oxford University Press.
Reserve Bank of India (2011). Discussion Paper on ‘Presence of Foreign Banks in India’. RBI, Mumbai.
Reserve Bank of India. (1998-2013). ‘Statistical Tables Relating to Banks in India’. RBI, Mumbai.
Rezvanian, R., Rao, N., & Mehdian, S. M. (2008). Efficiency change, technological progress and productivity growth of private, public and foreign banks in India: evidence from the post-liberalization era. Applied Financial Economics, 18(9), 701–713. doi:10.1080/09603100701222317.
Singhania, M., & Gupta, A. (2011). Determinants of Foreign Direct Investment in India. International Trade Law & Policy, 10.1, 64-82.
Song, G. (2009). Empirical Study on Influencing Factors of Foreign banks Entry in China. IEEE.
Shylajan, C. S. (2011). FDI and Its determinants in India. The Indian Economic Review, VIII, 162-169.

Article ISSN: 2348-3784
Dr. J Anitha, Associate Professor, GRG School of Management Studies, Peelamedu, Avinashi road, Coimbatore. E-Mail: [email protected]. Phone: 99420 81079. (Corresponding Author)
PM Reema, Research Scholar, PSGR Krishnammal College for Women, Parakkal House, Kuppiyode Elappully (PO), Palakkad PIN: 678622. E- Mail: [email protected]. Phone: 08129378313
Interaction of Competencies and Commitment of Higher Education Teachers
J Anitha and PM Reema
Abstract Teachers have a significant role in influencing the belief and thought process of students and in shaping their personality. Students while in higher education begin to think for themselves and decide regarding their life and work. It is essential for the teachers, in the higher education sector who deal with these students who are in their maturing phase to explore the real world. This demands that the teachers need to be not only competent but also committed. There are very less research focussing on the interaction of these two characteristics of teachers. The focus of this paper is to find the existing level of commitment and competence of the educators and to find if there is any significant relationship between these variables. This would help the administrators to focus on those competencies that would result in desired commitment that enhances their performance as a teacher. Competence includes a broad range of knowledge, attitudes and observable patterns of behaviour which together account for the ability to deliver a specified professional service. Three dimensions of competence as professional competence, teaching competence and managerial competence were measured. Commitment was measured as affective commitment, continuance commitment and normative commitment. Simple random sampling technique was employed in selecting 185 educators from various higher institutes. The data was collected by using self evaluated statements comprising 59 items for competency and 22 items for commitment. Statistical techniques including ANOVA, correlation and regression were used. The study shows that professional competence of the educator has an important role in developing the affective and normative commitment of educators. The educators’ professional competence increases as according to their occupational status. Institutions have to focus on strategies that would enhance professional competences so as to increase the level of commitment of educators. Key Words: Educators, Higher Education, Commitment, Competence 1. Introduction Organizations nowadays are facing challenges and opportunities due to continuous changing world of business. The changes in the business world include technological advances and changing economic trends in the global market. Werner (2007) states that, “social, cultural, political, technological and global forces challenge organizations to

14 Interaction of Competencies and Commitment of Higher Education Teachers
TSM Business Review, Vol. 2, No. 2, December 2014
redefine their strategies”. These changes affect the various aspects of the functioning of organization such as organizational commitment, organizational culture, work motivation and competency of employees. Committed and competent human resources are considered the most important assets in any organisation that leads to enriched performance and fulfilment in their life and work. A well managed organization possesses well defined roles and list of competencies required to perform each role effectively. This identifies the gap for improving knowledge to develop. Apart from other business sectors, the need is highly felt in the teaching arena too. The increasing complexity of our educational system has given rise to new dimensions and consequently the role of the educator has increased immensely and acquired a new meaning. Competences would be a driving force in determining an individual’s level of commitment to the job or the organization (Blanchard, 1993). Individual with high degree of competence and commitment can be delegated in to any task. Competence and commitment are an integral part of an organization’s workforce and both have to go hand in hand for the organisation to scale up. Apart from enterprises, competence based management is being conducted on educational institutions too. Education is subject to the pressures of the marketplace. It could be observed that major and significant changes in competition have made institutions to function business. The focus of the higher education should largely be on producing qualified citizens for a globalized economy and generating tailor made packages for meeting the pre-requisites of survival in the dynamic competitive environment This study focuses on the level of competencies and commitment of educators and the interaction between the variables. Organizational commitment as an attitude reflects feelings such as attachment, identification and loyalty to the organization as an object of commitment (Morrow 1993). Best (1994) indicates that organizational commitment is behaviour evident when committed individuals enact specific behaviour due to the belief, that it is morally right rather than personally beneficial. In 1990, Allen and Meyer classified Organizational Commitment into three categories and emphasized three different themes in the definition of the term Organizational Commitment: Affective Commitment, Continuance Commitment and Normative Commitment. The interaction of competency and commitment was intended to be explored as both factors signify superior performance and the influence of the various dimensions of one construct on the other will recommend specific steps for enhancing specific characteristics. When competence refers to one’s ability to interact healthily and in a desired fashion in the external environment, commitment is a factor that works so, internally with the individual. Hence there is a need to understand the performance of the individual in a wholesome perspective which could be measured by studying these two constructs. The results of the study may to help identify clues and information that

Interaction of Competencies and Commitment of Higher Education Teachers 15
TSM Business Review, Vol. 2, No. 2, December 2014
influences and motivates teachers internally, by understanding their commitment, and externally, by recognising their competence. This study focuses on studying the relationship between teacher competencies and the three types of commitment. As the characteristics of the three types of commitment are different, the relationship between competencies and commitment are expected to give interesting links. 2. Literature review Earlier researches (Anitha and Krishnaveni, 2013, Analoui, 1995) have shown that professional characteristics of educators include subject knowledge, teaching prowess, updating knowledge, collegiality, commitment, teacher student relationship, empowerment, self development, remuneration and teacher efficacy. These studies comprise various qualities of educators including the different competencies required for the profession and the commitment required for the same to be momentous in the context of the educational institution. This study focuses on the specific literatures that draw attention to competencies and commitment of educators in higher education. 2.1 Competency The term competency was probably first introduced to psychology literature in 1973 by David McClelland. In 1982 it was Boyatzis who first drew together comprehensive data that had been collected in the USA using the McBer & Company ‘Job Competence Assessment’ method. Since then, competency has become a significant factor in HR development practices (Simpson, 2002). According to Cheng et al., (2003) the establishment of the competency of individuals is crucial for further development of an organization. Competency assessment is a versatile and powerful tool in human resource management practices (Armstrong, 2003). This view is strongly upheld by Lado and Wilson, (1994) basing the resource-based theory that competencies lead to firm performance (Barney, 1991) for sustained competitive advantage. To be effective in teaching and capable of adjusting to the evolving needs of learners in a world of rapid social, cultural, economic and technological change, educators themselves need to reflect on their own learning requirements in the context of their particular educational environment, and to take greater responsibility for their own lifelong learning as a means of updating and developing their own knowledge and skills (European Union, 2009) The higher education institutions have experienced substantial change and growth. Yang, (2003) notes that globalization is transforming the functioning and nature of higher education worldwide. According to him, higher education institutions need to become customer focused, embrace the marketplace and function as full business enterprises in order to survive in the global competitive environment. The changes in the higher education environment are especially evident in the shift from collegialism to managerialism (Deem, 1998; Simon, 2007). Parker and Wilson, (2002) confirm the shift

16 Interaction of Competencies and Commitment of Higher Education Teachers
TSM Business Review, Vol. 2, No. 2, December 2014
from collegialism to managerialism in their study of western universities. As a result of the shift from collegialism to managerialism, greater demands are being made on academic personnel. Managerial competencies are activities, knowledge, skills or attitudes and perhaps also personal characteristics necessary to improve management performance. According to Spencer and Spencer (1993) managerial competencies area specialized subset of the competencies, expressing the intention to have certain specific effects. These specific intentions are particularly important for managers. In line with the finding of the review of literature cited above, the competencies of an educator was categorised as professional competency, teaching competency and managerial competency. The different competencies, identified using literature review, including knowledge, skills, assessment and evaluation of student performance, values and ethics, involvement in updating curriculum, designing and implementing curriculum, student affairs, guidance of student internships and projects, career guidance and research and publications are classified under the three competency types for this research. 2.1.1 Professional Competence The term professional competence refers to a set of knowledge, skills values, attitudes, capacities and beliefs people need for success in a profession. Educators’ professional competences include various competences in different areas such as pedagogical, cultural, communicational, personal, intellectual etc which are needed for effective teaching. Professionalism is a state or attitude developed by a person as part of a professional socialization process, by which he or she accepts the common standards shared by the professional group. Educators are expected to exhibit professionalism, i.e. to comply with the generally accepted procedures and standards of the profession (Bourdoncle, 1991). 2.1.2 Teaching competence Teaching competence refers to cognitive knowledge of the educators, which entails effects on student learning. Competence based teaching has a lot to do with the educator education that aims to train students in specific classroom behavior. The teaching competence of educators focuses on their conscious use of their knowledge, abilities, skills and talents to induce students to learn. Teaching competence means knowing how to harness goals, contents, activities, methodology, materials, resources and assessment in order to ensure whether students have acquired the prescribed basic sets of skills. 2.1.3 Managerial Competence Managerial competences are a specific type of individual competences. Based on a survey Boyatzis (1982) defined competence as a human ability to behave in a way to meet job requirements in parameters given by the organization’s environment and thus to achieve the required results. In his work he defined threshold competence as competences crucial

Interaction of Competencies and Commitment of Higher Education Teachers 17
TSM Business Review, Vol. 2, No. 2, December 2014
for managerial work, however, not having any significant causal relationship to its efficiency and better results. Managerial competence includes activities, knowledge, skills or attitudes and perhaps also personal characteristics necessary to improve management performance. According to Spencer and Spencer (1993), managerial competences are a specialized subset of the competences, expressing the intention to have certain specific effects. These specific intentions are particularly important for managers. The following are the variables that were used to measure these competences. Knowledge and skill: Teacher knowledge is crucially important to the improvement of teaching and learning, attention to their development. International research studies emphasis three aspects when defining teaching skills that include, what teachers do (different kinds of abilities), different kinds of knowledge that teachers need in order to be able to act in the best possible way and thirdly, the attitudes and underpinning values that teacher embrace and apply. Knowledge and attitudes are underlying factors that shape a teacher’s actions. The continuing development of new skills and knowledge throughout life is valuable for individuals and essential for the economy Evaluation of student output: The evaluation process is the most important of the learning process and development, among other processes such as planning and implementation. Evaluation is an organized collection of information that is valid and reliable, effective and appropriate analysis of the degree of this information to set standards for the goals set in advance to take appropriate decisions there on (Al-Azzeh and Yahya, 2011). Test or examination is a means or a tool of measurement of students output and the other tools such as Interview, questionnaire, problem analysis, performance evaluation, and report analysis (Sadler, 2005). Values and ethics: One of the hallmarks of any profession is the commitment of its members to a code of ethics which sets out professional values and responsibilities. Values are often seen as aspirations or driving forces, often not openly articulated, which effectively shape people’s lives and determine where they will direct their energies and what they will hold to be of importance. Updating the knowledge: Teachers have the responsibility to convey updated knowledge to students, otherwise they may mislead them. We live in the information era, where up-to-date information is available everywhere. Teachers need to keep updated themselves through research, conventions and conferences (Anitha and Krishnaveni, 2013) of live information to be relevant in their performance. Beside subject knowledge, pedagogical skills and content knowledge are also to be updated. Designing and implementing curriculum: According to Kern, et al. (1998), a curriculum is “a planned educational experience”. Hence, the main intention of curriculum design at the tertiary level is to enhance the academic achievement of students. A well-designed and
18 Interaction of Competencies and Commitment of Higher Education Teachers
TSM Business Review, Vol. 2, No. 2, December 2014
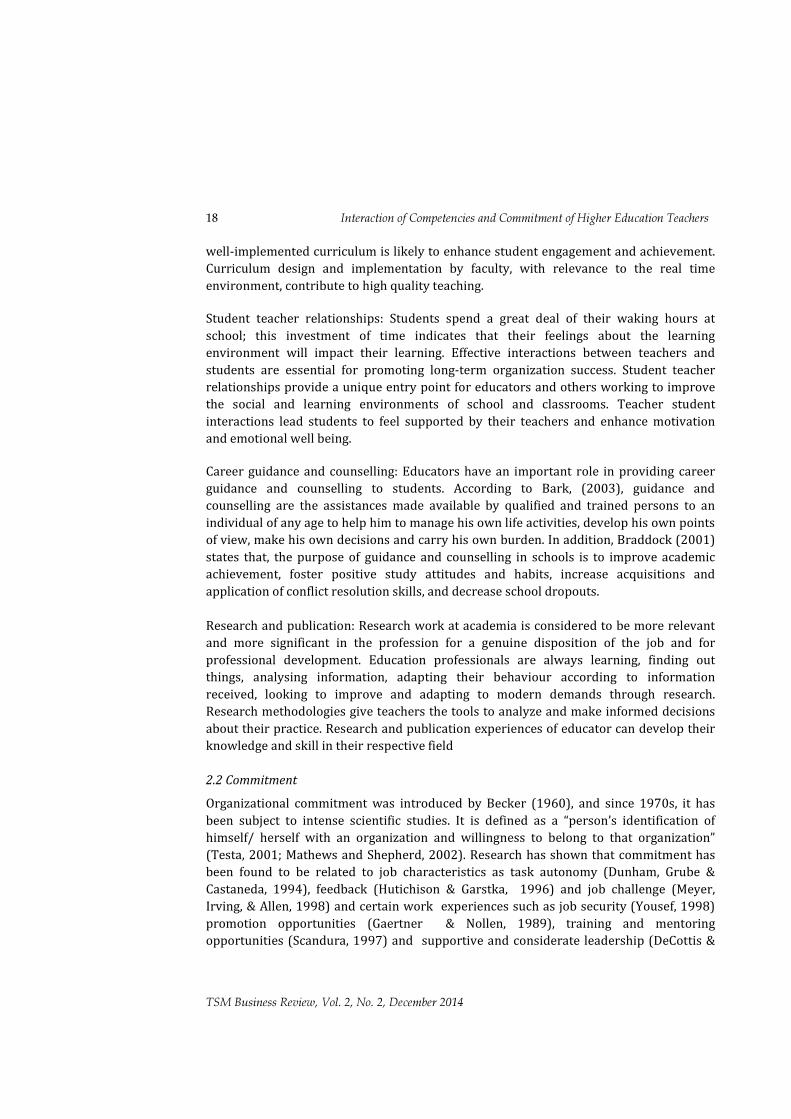
well-implemented curriculum is likely to enhance student engagement and achievement. Curriculum design and implementation by faculty, with relevance to the real time environment, contribute to high quality teaching. Student teacher relationships: Students spend a great deal of their waking hours at school; this investment of time indicates that their feelings about the learning environment will impact their learning. Effective interactions between teachers and students are essential for promoting long-term organization success. Student teacher relationships provide a unique entry point for educators and others working to improve the social and learning environments of school and classrooms. Teacher student interactions lead students to feel supported by their teachers and enhance motivation and emotional well being. Career guidance and counselling: Educators have an important role in providing career guidance and counselling to students. According to Bark, (2003), guidance and counselling are the assistances made available by qualified and trained persons to an individual of any age to help him to manage his own life activities, develop his own points of view, make his own decisions and carry his own burden. In addition, Braddock (2001) states that, the purpose of guidance and counselling in schools is to improve academic achievement, foster positive study attitudes and habits, increase acquisitions and application of conflict resolution skills, and decrease school dropouts. Research and publication: Research work at academia is considered to be more relevant and more significant in the profession for a genuine disposition of the job and for professional development. Education professionals are always learning, finding out things, analysing information, adapting their behaviour according to information received, looking to improve and adapting to modern demands through research. Research methodologies give teachers the tools to analyze and make informed decisions about their practice. Research and publication experiences of educator can develop their knowledge and skill in their respective field 2.2 Commitment Organizational commitment was introduced by Becker (1960), and since 1970s, it has been subject to intense scientific studies. It is defined as a “person’s identification of himself/ herself with an organization and willingness to belong to that organization” (Testa, 2001; Mathews and Shepherd, 2002). Research has shown that commitment has been found to be related to job characteristics as task autonomy (Dunham, Grube & Castaneda, 1994), feedback (Hutichison & Garstka, 1996) and job challenge (Meyer, Irving, & Allen, 1998) and certain work experiences such as job security (Yousef, 1998) promotion opportunities (Gaertner & Nollen, 1989), training and mentoring opportunities (Scandura, 1997) and supportive and considerate leadership (DeCottis &

Interaction of Competencies and Commitment of Higher Education Teachers 19
TSM Business Review, Vol. 2, No. 2, December 2014
Summers, 1987). The present study is to focus on the relationship of competencies with commitment. Most of the research on organizational commitment has been done by industrial organizational and occupational psychologists (Mueller, Wallace & Price, 1992). Very little research on organizational commitment has been conducted within educational settings. The focus of the present study is to identify the level of organizational commitment among higher educational educators. Fostering organizational commitment among the academic staff is important because employees, who are highly committed stay longer, perform better, miss less work, and engage in organizational citizenship behaviours. The study aims to find the existing level of different competencies and different commitment types and the interaction between these constructs. As professional competence among other competences is found to be more value adding (Bourdoncle, 1991, Bella Joseph, 1999) to the educators’ performance, it was also intended to study if the professional competence of educators enhanced with experience or with increasing hierarchy. The study was pursued with the following hypotheses:
H01: There is no significant difference in professional competence in relation to designation.
H02: There is no significant impact of the competences on affective commitment, continuance commitment and normative commitment.
3. Objectives
• To study the prevalent level of Competencies and Commitment of educators in the higher education.
• To study if there is any significant difference in observing the professional competence based on the designation of the educator.
• To study the predicting power of Competencies that explain the different Commitment types.
This study aims to explore the association of competency and commitment among educators working in higher educational sector. Considering the nature of required data, a descriptive design has been opted. The descriptive method tries to find out the present status of the phenomena under study. A sample of 185 educators was taken for the study. About 73% of the educators were female and 25% of them were male. About 30% of the respondents have 6 to 10 years of experience, 28% of the respondents have 2 to 5 years of experience and 28% of them have <2 years of experience. Simple random sampling technique was employed in selecting the educators from various higher institutes.
20 Interaction of Competencies and Commitment of Higher Education Teachers
TSM Business Review, Vol. 2, No. 2, December 2014
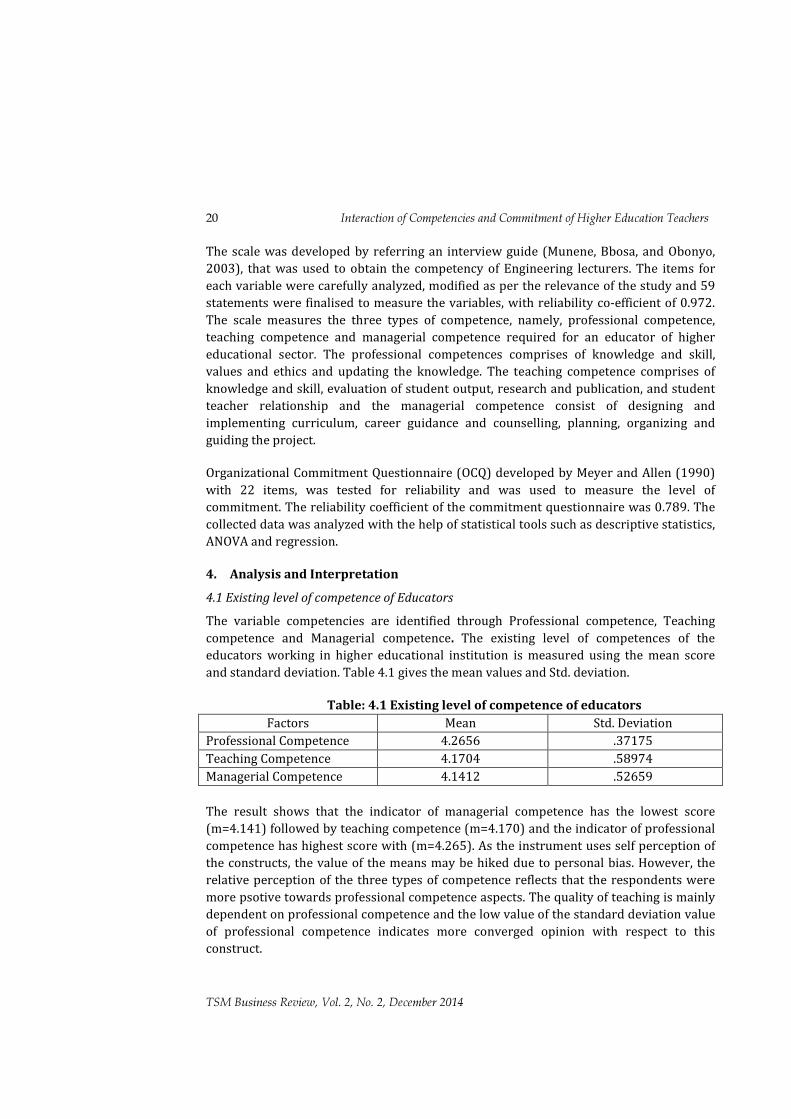
The scale was developed by referring an interview guide (Munene, Bbosa, and Obonyo, 2003), that was used to obtain the competency of Engineering lecturers. The items for each variable were carefully analyzed, modified as per the relevance of the study and 59 statements were finalised to measure the variables, with reliability co-efficient of 0.972. The scale measures the three types of competence, namely, professional competence, teaching competence and managerial competence required for an educator of higher educational sector. The professional competences comprises of knowledge and skill, values and ethics and updating the knowledge. The teaching competence comprises of knowledge and skill, evaluation of student output, research and publication, and student teacher relationship and the managerial competence consist of designing and implementing curriculum, career guidance and counselling, planning, organizing and guiding the project. Organizational Commitment Questionnaire (OCQ) developed by Meyer and Allen (1990) with 22 items, was tested for reliability and was used to measure the level of commitment. The reliability coefficient of the commitment questionnaire was 0.789. The collected data was analyzed with the help of statistical tools such as descriptive statistics, ANOVA and regression. 4. Analysis and Interpretation 4.1 Existing level of competence of Educators The variable competencies are identified through Professional competence, Teaching competence and Managerial competence. The existing level of competences of the educators working in higher educational institution is measured using the mean score and standard deviation. Table 4.1 gives the mean values and Std. deviation.
Table: 4.1 Existing level of competence of educators
Factors Mean Std. Deviation Professional Competence 4.2656 .37175 Teaching Competence 4.1704 .58974 Managerial Competence 4.1412 .52659
The result shows that the indicator of managerial competence has the lowest score (m=4.141) followed by teaching competence (m=4.170) and the indicator of professional competence has highest score with (m=4.265). As the instrument uses self perception of the constructs, the value of the means may be hiked due to personal bias. However, the relative perception of the three types of competence reflects that the respondents were more psotive towards professional competence aspects. The quality of teaching is mainly dependent on professional competence and the low value of the standard deviation value of professional competence indicates more converged opinion with respect to this construct.
Interaction of Competencies and Commitment of Higher Education Teachers 21
TSM Business Review, Vol. 2, No. 2, December 2014
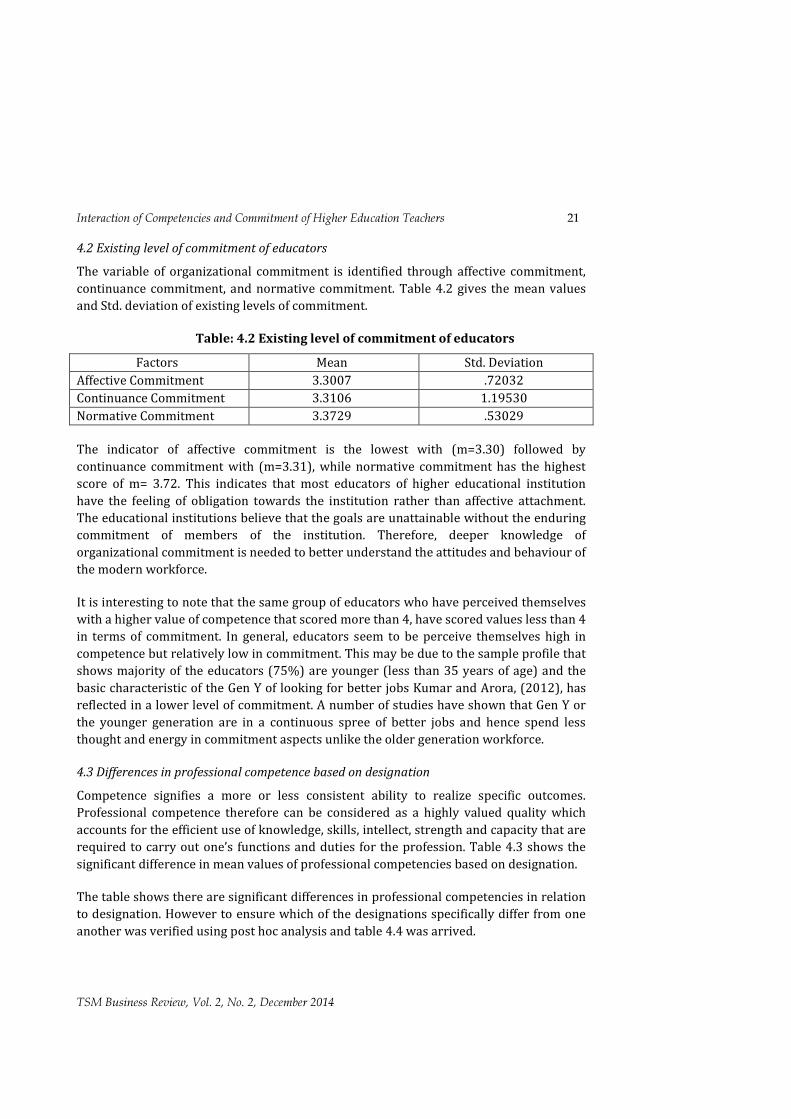
4.2 Existing level of commitment of educators The variable of organizational commitment is identified through affective commitment, continuance commitment, and normative commitment. Table 4.2 gives the mean values and Std. deviation of existing levels of commitment.
Table: 4.2 Existing level of commitment of educators
Factors Mean Std. Deviation Affective Commitment 3.3007 .72032 Continuance Commitment 3.3106 1.19530 Normative Commitment 3.3729 .53029 The indicator of affective commitment is the lowest with (m=3.30) followed by continuance commitment with (m=3.31), while normative commitment has the highest score of m= 3.72. This indicates that most educators of higher educational institution have the feeling of obligation towards the institution rather than affective attachment. The educational institutions believe that the goals are unattainable without the enduring commitment of members of the institution. Therefore, deeper knowledge of organizational commitment is needed to better understand the attitudes and behaviour of the modern workforce. It is interesting to note that the same group of educators who have perceived themselves with a higher value of competence that scored more than 4, have scored values less than 4 in terms of commitment. In general, educators seem to be perceive themselves high in competence but relatively low in commitment. This may be due to the sample profile that shows majority of the educators (75%) are younger (less than 35 years of age) and the basic characteristic of the Gen Y of looking for better jobs Kumar and Arora, (2012), has reflected in a lower level of commitment. A number of studies have shown that Gen Y or the younger generation are in a continuous spree of better jobs and hence spend less thought and energy in commitment aspects unlike the older generation workforce. 4.3 Differences in professional competence based on designation Competence signifies a more or less consistent ability to realize specific outcomes. Professional competence therefore can be considered as a highly valued quality which accounts for the efficient use of knowledge, skills, intellect, strength and capacity that are required to carry out one’s functions and duties for the profession. Table 4.3 shows the significant difference in mean values of professional competencies based on designation. The table shows there are significant differences in professional competencies in relation to designation. However to ensure which of the designations specifically differ from one another was verified using post hoc analysis and table 4.4 was arrived.

22 Interaction of Competencies and Commitment of Higher Education Teachers
TSM Business Review, Vol. 2, No. 2, December 2014
Table 4.3: Differences in professional competence based on designation
Factors Senior Lecturer
Assistant Professor
Associate Professor Professor F Value Sig
(p value) Professional Competence 2.944 3.23 3.21 3.38 2.831 .017* *Significant at 0.05 level of significance
Table: 4.4 Homogeneous subset
Designation Subset for alpha = 0.05 1 2
Senior Lecturer 2.9444 Lecturer 3.0815 Associate Professor 3.2192 3.2192 Assistant Professor 3.2306 3.2306 Professor 3.3833
This table indicates that lecturer and senior lecturer fall in subset 1 or have similar characteristics. Associate professor and assistant professor seem to be in both sub sets. However the mean values of these cadres lie more close to the professor cadre than that of the least value of the senior lecturer score. Hence the associate professor and assistant professor cadres are nearer the professor cadre. Hence it is seen that professional competence is significantly higher for the higher designation levels and low for the lower cadres. Therefore the null hypothesis H01: there is no significant difference in professional competence in relation to designation is rejected. Professionalism has been described as stages of development or the degree of expertise. The knowledge, skill and ability of the educators are developed when they move higher in their hierarchy. 4.4 Strength and impact of different competencies on commitment Educators possess required competencies to perform their job to a satisfactory level. They are also committed to their profession, to the institute and the community at large that includes students and parents. It was intended to study if the competencies possessed by the educator have any influence on the commitment towards one’s profession. It was expected that the more the competent an educator is, the more committed he can be. The impact of different competencies on commitment and its strength was measured using regression analysis. The competences (professional, teaching and managerial) were taken as independent variables and the commitment (affective, continuance and
Interaction of Competencies and Commitment of Higher Education Teachers 23
TSM Business Review, Vol. 2, No. 2, December 2014
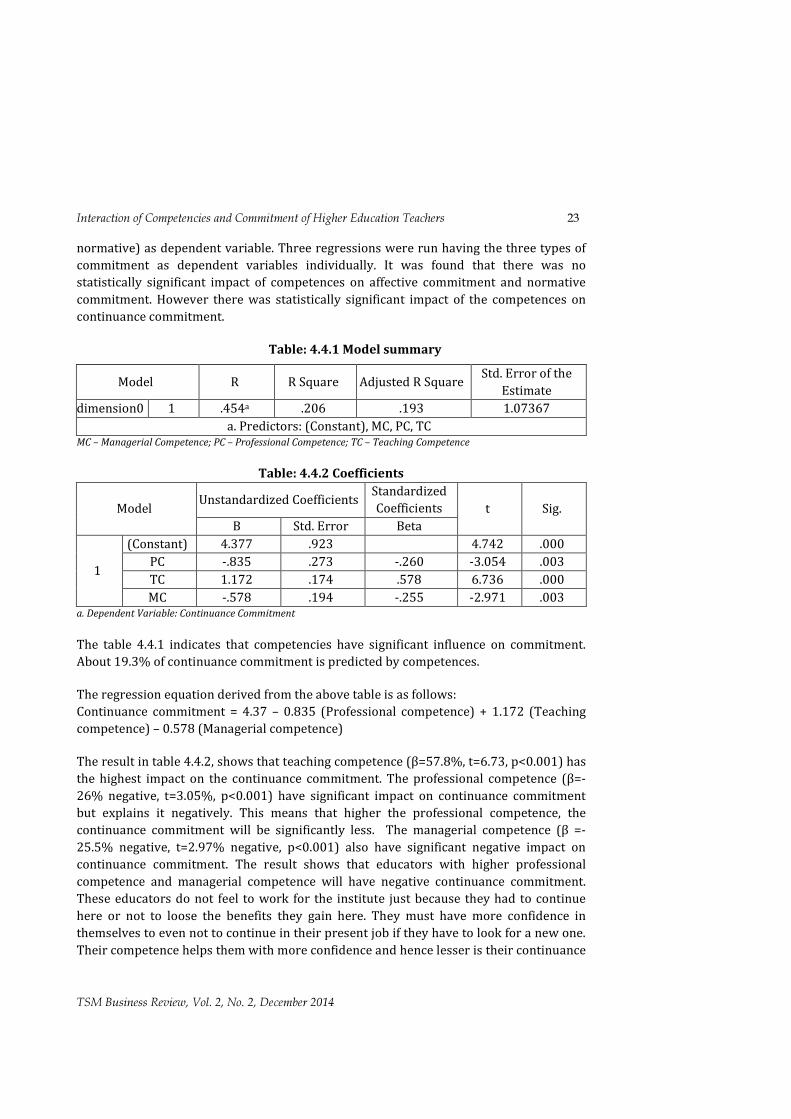
normative) as dependent variable. Three regressions were run having the three types of commitment as dependent variables individually. It was found that there was no statistically significant impact of competences on affective commitment and normative commitment. However there was statistically significant impact of the competences on continuance commitment.
Table: 4.4.1 Model summary
Model R R Square Adjusted R Square Std. Error of the Estimate
dimension0 1 .454a .206 .193 1.07367 a. Predictors: (Constant), MC, PC, TC
MC – Managerial Competence; PC – Professional Competence; TC – Teaching Competence
Table: 4.4.2 Coefficients
Model Unstandardized Coefficients Standardized Coefficients t Sig.
B Std. Error Beta
1 (Constant) 4.377 .923 4.742 .000
PC -.835 .273 -.260 -3.054 .003 TC 1.172 .174 .578 6.736 .000 MC -.578 .194 -.255 -2.971 .003
a. Dependent Variable: Continuance Commitment The table 4.4.1 indicates that competencies have significant influence on commitment. About 19.3% of continuance commitment is predicted by competences. The regression equation derived from the above table is as follows: Continuance commitment = 4.37 – 0.835 (Professional competence) + 1.172 (Teaching competence) – 0.578 (Managerial competence) The result in table 4.4.2, shows that teaching competence (β=57.8%, t=6.73, p<0.001) has the highest impact on the continuance commitment. The professional competence (β=-26% negative, t=3.05%, p<0.001) have significant impact on continuance commitment but explains it negatively. This means that higher the professional competence, the continuance commitment will be significantly less. The managerial competence (β =-25.5% negative, t=2.97% negative, p<0.001) also have significant negative impact on continuance commitment. The result shows that educators with higher professional competence and managerial competence will have negative continuance commitment. These educators do not feel to work for the institute just because they had to continue here or not to loose the benefits they gain here. They must have more confidence in themselves to even not to continue in their present job if they have to look for a new one. Their competence helps them with more confidence and hence lesser is their continuance
24 Interaction of Competencies and Commitment of Higher Education Teachers
TSM Business Review, Vol. 2, No. 2, December 2014
commitment. The regression analysis suggests that teaching competence can predict continuance commitment of educators positively. Therefore the null hypothesis H05: There is no significant impact of competency on commitment is rejected. The result indicates that competence has influence on commitment. About 19% of continuance commitment is predicted by the teaching competence. 5. Discussion The analysis and result shows that educators working in higher educational sector perceive relatively high professional competence. The educators with high professional competency are more committed towards their institution. Professional competence is the ability of educators to master the knowledge. Knowledge and Skill, Value and ethics and updating the knowledge are seen as an important aspect of professional competence. The quality of teaching is mainly dependent on the professional competence of the educator, which includes subject matter knowledge, pedagogical content knowledge, knowledge of teaching and learning, curricular knowledge and values and ethics. (Shulman, 1986; Westera, 2001). Professional competence will provide the employee with greater labor market opportunities and greater belief in these opportunities. The result reveals that the educators in higher grade naturally strengthen their knowledge base and thus have high professional competence compare to educators in lower grade. The result of regression analysis conveys the impact of competencies on commitment. Teaching competencies have positive significant impact on continuance commitment. The other competencies (professional and managerial) have negative impact on continuance commitment. About 19.3% of continuance commitment is predicted by competencies. This signifies that educators who are competent in teaching characteristics and qualities are more comfortable with the job and want to stay with the job due to their comfort in the competence. Hence their continuance commitment seems to be higher and they opt not to switch over to other job or look for other opportunities. The educators with professional and managerial competencies are more comfortable with other occupational characteristics and qualities, other than teaching. Hence they are more confident to even look for other opportunities or take up other jobs due to their varied competence. Hence their continuance commitment is relatively less and their intention to retain in the organisation is flexible than others, with a higher level of teaching competence. 6. Suggestions and conclusion The result indicates the importance of competencies and commitment of educators in higher educational sector. The present study has given emphasis on professional competency. The study perceived brokers and competence relatively higher than other competencies by the educators. Competence would be a driving force in determining an individual’s level of commitment to the job or the organization (Blanchard, 1993).

Interaction of Competencies and Commitment of Higher Education Teachers 25
TSM Business Review, Vol. 2, No. 2, December 2014
Teaching competence is found to be more important for an individual to continue in the teaching profession even more than the other types of competences. Competency and commitment are an integral part of an organization’s workforce and both have to go hand in hand for the organisation to scale up therefore, it is widely accepted that competent and committed employees are valuable assets that must be retained within the organization. Competency development must be a continuous process in the educational institution. Competences that instigate better performance of the educator needs to be focused and motivated by the management and administrators. References Al-Azzeh, F. M. and A. A. Yahya. (2011). Quality criteria's of computing disciplines. Eur. J.
Sci. Res., 48: 352-360,http://www.eurojournals.com/EJSR_48_3_02.pdf.5 Handbook on Procedures and Standards for Quality, 2009. Assurance in Higher Education Institutions of Jordan/Accreditation Commission of Higher Education.http://www.heac.org.jo/EditorFiles/uploadDocument. (Handbook in Arabic).
Allen, N. J. & Meyer, J, P. (1990). The measurement and antecedents of affective, continuance and normative commitment to the organization, Journal of occupational Psychology, 63:1-18.
Analoui, F. (1995). Teachers as managers: an exploration into teaching styles. International. Journal of Educational Management, 9(5), 16-19.
Anitha, J & Krishnaveni, R. (2013). Professional characteristics of an educator: A survey of literature. Journal of Management and Development Studies Vol. 25(1): 1- 22
http://nasc.org.np © 2013 Nepal Administrative Staff College. Armstrong, M. (2003). A Handbook of Human Resource Management Practice, 9th ed.,
Kogan Page, London. Bark, B. G. (2003). Guidance and counseling: A Manual; Sterling. New Delhi: Vikas
Compograhic Barney, J.B. (1991). Firm resources and sustained competitive advantage. Journal of Management, Vol. 17 No. 1, pp. 99-120.
Becker, H. S. (1960). Notes on the concept of commitment. American Journal of Sociology, 66: 32-40.
Bella, J. (1999). A study of professional competence and its impact on professional pleasure among secondary school teachers of Visakhapatna district. M.Ed Dissertation, Andhra University.
Best, J. (1994). Social Progress and Social Problems: Toward a sociology of gloom. The Sociological Quarterly, 42(1), 1-12. Blanchard, K., D. Zigarmi, & B. Nelson. (1993). Situational Leadership® after 25 Years: A
Retrospective. The Journal of Leadership Studies. Boyatzis, R. E. (1982). The Competent Manager: A Model for Effective Performance. New
York: John Villey & Sons. Braddock, L. (2001). Guidance program pages. Retrieved on 19th January 2009, from
http:// www.fcps.com.

26 Interaction of Competencies and Commitment of Higher Education Teachers
TSM Business Review, Vol. 2, No. 2, December 2014
Cheng, M., Dainty, A. & Moore, D. (2003). The differing faces of managerial competency in Britain and America. Journal of Management Development, 22(6), 527-37
DeCottis, T. A., & Summers, T. P. (1987). A path analysis of a model of the antecedents and consequences of organizational commitment. Human Relations, 40(7), 445-470.
Deem, R. (1998). New managerialism and higher education: the management of performances and cultures in universities in the United Kingdom. International Studies in Sociology of Education , 8(1).
Dunham, R. B., Grube, J. A., & Castaneda, M. B. (1994). Organization commitment: The utility of an integrative definition. Journal of Applied Psychology, 79, 370- 380
European Union (2009). Council Conclusions of 26 November 2009 on the professional development of teachers and school leaders (Official Journal 2009/C 302/04, 12.12.2009).
Gaertner, K. N., & Nollen, S. D. (1989). Career experiences, perceptions of employment practice and psychological commitment to the organization. Human Relation, 42, 975-991
Hutchison, S., & Garstka, M. L. (1996). Sources of perceived organizational support: Goal setting and feedback. Journal of Applied Social Psychology, 26, 1351-1366Indian Education Commission 1964-66.
Kern, D. E.; Thomas, P. A.; Howard, D. M. & Bass, E. B. (1998). Curriculum Development for Medical Education. Baltimore: The John Hopkins University Press.
Kumar, R., & Arora, R. (2012), Determinants of Talent Retention in BPO Industry, The Indian Journal of Industrial Relations, 48(2).
Lado, A. and Wilson, M. (1994). Human resource systems and sustained competitive advantage: a competency-based perspective. Academy of Management Review, Vol. 19 No. 4, pp. 699-727
Mathews, B. P., & Shepherd, J. L. (2002). Dimensionality of Cook and Wall's (1980) British Organizational Commitment Scale revisited. Journal of Occupational & Organizational Psychology, 75(3), 369-375.
McClelland, D. C. (1973). Testing for Competence Rather Than for Intelligence. American Psychologist, 28, 1-14. http://dx.doi.org/10.1037/h0034092.
Meyer, J. P., Irving, G. P., & Allen, N. J. (1998). Test of the moderating effect of work values on the the relations between early work experiences and organizational commitment. Journal of Organizational Behavior, 19, 29-52.
Morrow, P. C. and Wirth, R. E. (1989). Work commitment among salaried professionals. Journal of Vocational Behaviour, 34, 40-56
Mueller, C. W., Wallace, J. E., & Price, J. L. (1992). Employee commitment: Resolving some issues. Work and Occupations, 19, 211-236
Munene, J. C., Bbosa, R. & Obonyo, F. (2003). Operant competence management framework for enhancing competence management and development in organizations in Africa. Paper presented in at the American Management Conference, OH
Parker, L & Wilson, M. (2002). Becoming an academic head of department: sink or swim? New Zealand: HERDSA.

Interaction of Competencies and Commitment of Higher Education Teachers 27
TSM Business Review, Vol. 2, No. 2, December 2014
Sadler, R., 2005. Interpretations of criteria-based assessment and grading in education. J. Higher of Edu. 30: 175-194. DOI: 10.3844/jssp.2010.153.161.
Scandura, T. A. (1997). Mentoring and organizational justice. An empirical investigation. Journal of Vocational Behavior, 51, 58-69.
Shulman, l.s. (1986). Those who understand: knowledge growth in teaching. Educational Research, pp. 4-14. SHULMAN L.S. (1987). Knowledge and teaching: foundations of the new reform. Harvard Educational Review, 57, 1.
Simon, P. (2007). Transformation agenda. Available at: http://blogs.uct.ac.za/blog/ transformation-agenda/archives/2007/08/ (accessed on 20/03/2008).
Simpson, B. (2002). The Knowledge Needs of Innovating Organizations. The University of Auckland.
Spencer, L. M. & Spencer S. M. (1993). Competence at Work. New York: John Wisley & Sons Testa, M.R. (2001). Organizational Commitment, Job Satisfaction and Effort in the Service
Environment. Journal of Psychology, 135(2), pp. 226-236 Werner, A. (2007). Organizational Behaviour: A Contemporary South African Perspective.
Pretoria: Van SchaickWestera, 2001 Westera, W. (2001). Competences in education: A confusion of tongues. Journal of
Curriculum Studies, 33(1), 75–88. Yang, R., (2003). Globalization and Higher Education Development: a Critical Analysis, in:
International Review of Education, 49(3), 269-291. Yousef, D. A. (1998). Satisfaction with job security as a predictor of organizational
commitment and job performance in a multicultural environment. International Journal of Manpower, 19(3), 184-194.

Article ISSN: 2348-3784
E Meera, Research Scholar in Commerce, G.T.N Arts College, Dindigul, Tamilnadu, India. E-Mail: [email protected], Phone: 7418374487
K Govindarajan, Professor, School of Management, SASTRA University, Thanjavur, Tamilnadu, India. E-Mail: [email protected], Phone: 9894360702
Dr. M Inbalakshmi, Associate Professor, G.T.N. Arts College, Dindigul, Tamilnadu, India. E-Mail: [email protected], Phone: 9442035617. (Corresponding Author)
A Study on the Utilisation of Internet Banking
E Meera, K Govindarajan and M Inbalakshmi Abstract Banking is one of the oldest professions known to mankind. It is no exception to the rule of nature that change is the only thing permanent in this world. It has undergone many transitions since its inception and internet banking is one of the latest in the list of such transitions. It has helped the transition of traditional banking based on brick and mortar system to click and portal system. So, most of the customers have Internet banking for their banking activities. This paper, therefore, examines the extent of their utilisation of net banking and their awareness towards various services that can be availed through net banking. Analysis of variance is used to test the hypotheses. Results reveal that the demographic factors have a significant role in influencing the awareness and utilisation of certain services on internet banking. Further Mann Whitney U test and Kruskal Wallis test have been used to find out the relationship between the demographic factors and the problems perceived by the respondents in the usage of Internet banking. The results reveal the fact that there is no significant difference between the demographic factors such as age, marital status, education and monthly income and the problems perceived in using internet banking. Thus, banks have to educate them to get rid of their fears over net banking and make the utmost use of the services of internet banking. Keywords: Internet Banking, Awareness, Utilisation 1. Introduction Internet banking is nothing but banking on the internet-the network of networks. Internet banking is one of the tools of electronic banking (E-Banking) that enabled the customers to bank at their homes round the clock. Thus, Internet banking has enabled the ‘AA’ (Double A) banking possible, that is anytime and anywhere banking. This service can be availed by the bank customers through their personal computers, laptops or palmtops or mobile phones or any other intelligent device. Customers of banks include both individuals and corporate. The banking products offered to these two types cannot be the same. Retail and fiduciary products are being offered to
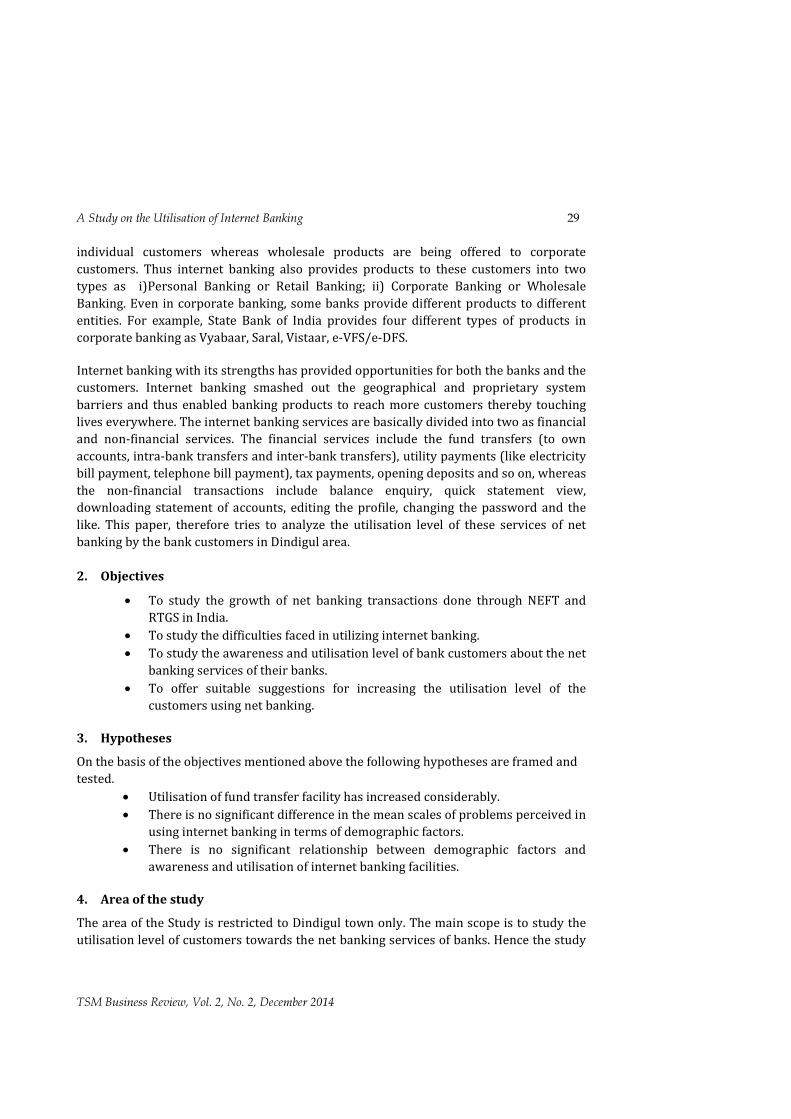
A Study on the Utilisation of Internet Banking 29
TSM Business Review, Vol. 2, No. 2, December 2014
individual customers whereas wholesale products are being offered to corporate customers. Thus internet banking also provides products to these customers into two types as i)Personal Banking or Retail Banking; ii) Corporate Banking or Wholesale Banking. Even in corporate banking, some banks provide different products to different entities. For example, State Bank of India provides four different types of products in corporate banking as Vyabaar, Saral, Vistaar, e-VFS/e-DFS. Internet banking with its strengths has provided opportunities for both the banks and the customers. Internet banking smashed out the geographical and proprietary system barriers and thus enabled banking products to reach more customers thereby touching lives everywhere. The internet banking services are basically divided into two as financial and non-financial services. The financial services include the fund transfers (to own accounts, intra-bank transfers and inter-bank transfers), utility payments (like electricity bill payment, telephone bill payment), tax payments, opening deposits and so on, whereas the non-financial transactions include balance enquiry, quick statement view, downloading statement of accounts, editing the profile, changing the password and the like. This paper, therefore tries to analyze the utilisation level of these services of net banking by the bank customers in Dindigul area. 2. Objectives
• To study the growth of net banking transactions done through NEFT and RTGS in India.
• To study the difficulties faced in utilizing internet banking. • To study the awareness and utilisation level of bank customers about the net
banking services of their banks. • To offer suitable suggestions for increasing the utilisation level of the
customers using net banking.
3. Hypotheses On the basis of the objectives mentioned above the following hypotheses are framed and tested.
• Utilisation of fund transfer facility has increased considerably. • There is no significant difference in the mean scales of problems perceived in
using internet banking in terms of demographic factors. • There is no significant relationship between demographic factors and
awareness and utilisation of internet banking facilities. 4. Area of the study The area of the Study is restricted to Dindigul town only. The main scope is to study the utilisation level of customers towards the net banking services of banks. Hence the study
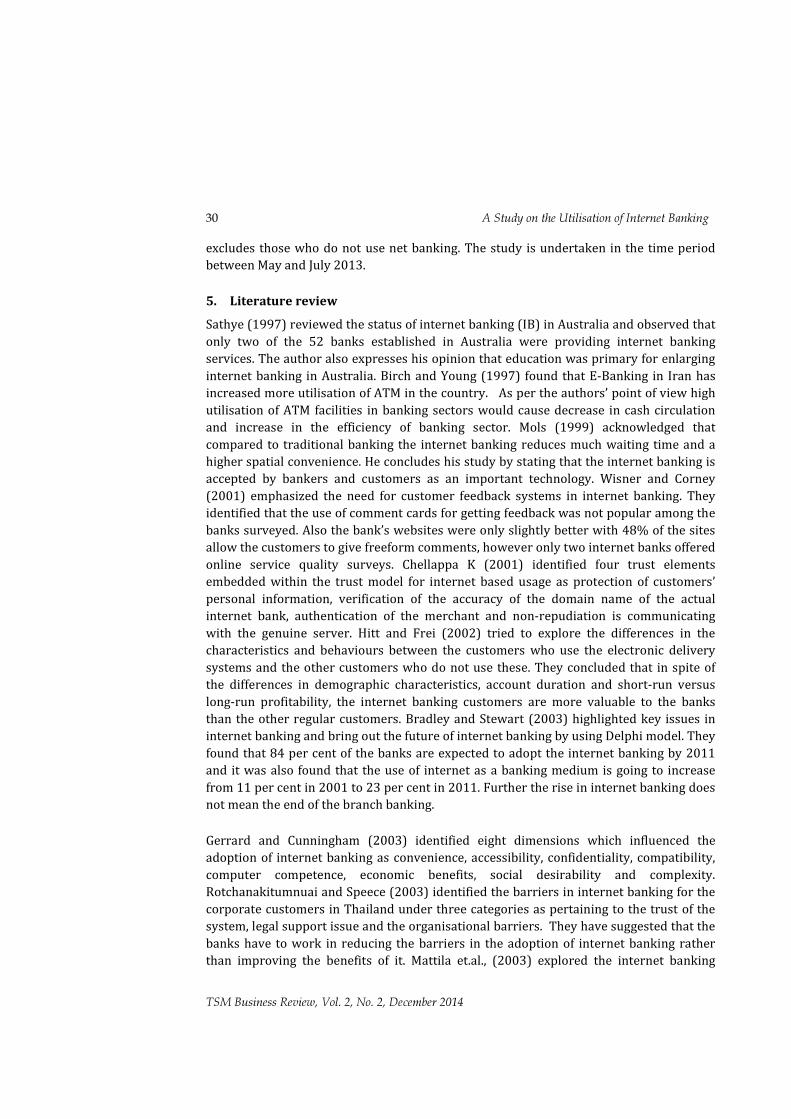
30 A Study on the Utilisation of Internet Banking
TSM Business Review, Vol. 2, No. 2, December 2014
excludes those who do not use net banking. The study is undertaken in the time period between May and July 2013. 5. Literature review Sathye (1997) reviewed the status of internet banking (IB) in Australia and observed that only two of the 52 banks established in Australia were providing internet banking services. The author also expresses his opinion that education was primary for enlarging internet banking in Australia. Birch and Young (1997) found that E-Banking in Iran has increased more utilisation of ATM in the country. As per the authors’ point of view high utilisation of ATM facilities in banking sectors would cause decrease in cash circulation and increase in the efficiency of banking sector. Mols (1999) acknowledged that compared to traditional banking the internet banking reduces much waiting time and a higher spatial convenience. He concludes his study by stating that the internet banking is accepted by bankers and customers as an important technology. Wisner and Corney (2001) emphasized the need for customer feedback systems in internet banking. They identified that the use of comment cards for getting feedback was not popular among the banks surveyed. Also the bank’s websites were only slightly better with 48% of the sites allow the customers to give freeform comments, however only two internet banks offered online service quality surveys. Chellappa K (2001) identified four trust elements embedded within the trust model for internet based usage as protection of customers’ personal information, verification of the accuracy of the domain name of the actual internet bank, authentication of the merchant and non-repudiation is communicating with the genuine server. Hitt and Frei (2002) tried to explore the differences in the characteristics and behaviours between the customers who use the electronic delivery systems and the other customers who do not use these. They concluded that in spite of the differences in demographic characteristics, account duration and short-run versus long-run profitability, the internet banking customers are more valuable to the banks than the other regular customers. Bradley and Stewart (2003) highlighted key issues in internet banking and bring out the future of internet banking by using Delphi model. They found that 84 per cent of the banks are expected to adopt the internet banking by 2011 and it was also found that the use of internet as a banking medium is going to increase from 11 per cent in 2001 to 23 per cent in 2011. Further the rise in internet banking does not mean the end of the branch banking. Gerrard and Cunningham (2003) identified eight dimensions which influenced the adoption of internet banking as convenience, accessibility, confidentiality, compatibility, computer competence, economic benefits, social desirability and complexity. Rotchanakitumnuai and Speece (2003) identified the barriers in internet banking for the corporate customers in Thailand under three categories as pertaining to the trust of the system, legal support issue and the organisational barriers. They have suggested that the banks have to work in reducing the barriers in the adoption of internet banking rather than improving the benefits of it. Mattila et.al., (2003) explored the internet banking
A Study on the Utilisation of Internet Banking 31
TSM Business Review, Vol. 2, No. 2, December 2014
adoption among the mature customers who are above 65 years of age in Finland. Their survey results clearly indicated that over half of the mature customers are late adopters in the terms of their net banking adoption. Kim and Prabhakar (2004) found in their study that in internet banking, there is one trustier (the online banker), and two trustees (the internet as a banking medium, and the financial institution offering the internet banking services). They stated that consumer trust, acceptance, and use of online banking technologies are possibly also related to the characteristics of the individual consumer and of the specific technology employed. Lee et.al., (2005) classified the non-adopters of internet banking into 2 types as persistent non-adopters and prospective adopters. Their findings included that the differences found between the current adopters and persistent non-adopters were in terms of perceived service, attributes, perceived risk and compatibility, whereas experience with the computer technology along with compatibility factor make a significant difference between the prospective adopters and the persistent non-adopters. Young De Robert (2005) has developed a business model “internet only” for the banking industry. He observed that the internet banking could ensure high volume and low cost strategy for delivering the basic banking services. Gerrard et.al., (2006) identified eight factors which explained why consumers are not using internet banking. They suggested the banks to consider these eight factors and to take steps accordingly before increasing the number of internet banking users. Malhotra Pooja and Singh Balwinder (2007) attempted to discover the factors which considerably affect the adoption of internet banking by banks in India. They used logistic regression technique for the analysis. Their results indicated that the rate of adoption of internet banking was high in case of larger banks, banks with younger age and banks with large deposits. Laukkanen Pekka et.al., (2008) divided the non-adopters on net banking into three categories like postponers, opponents and rejecters. They found that the resistance of rejecters was much stronger than the other two categories. The postponers show only slight resistance. They intended to adopt internet banking within a year. Maenpaa et.al., (2008) reported differences in perception and behaviour among novice, moderate and expert users in the context of internet banking. The results revealed that novice users value and would utilize service dimensions like auxiliary features and personal finances to support and facilitate their daily actions in internet banking. Wang and Pho (2009) attempted to identify the determinants of customer intention to use online banking and found that brand credibility also positively affected customer intention. Incorporating complimentary relationship into the website quality model; this study provides a new model for measuring website quality in online banking. Jeevan (2010) observed that changes in technology, competition and lifestyles had changed the face of banking and banks in the present environment are looking for alternative ways like internet banking to provide differentiated services. He also found that online banking has come out as a significant strategy for banks to attract and retain customers. The results of the survey done by Chandra and Sharma (2010) revealed that only 43% of the banks had posted their privacy policies on their websites and there is no common standard format for privacy policy in India. They concluded that it would be very helpful

32 A Study on the Utilisation of Internet Banking
TSM Business Review, Vol. 2, No. 2, December 2014
for internet banking customers, if there is any authority to monitor and control the proper format and points included in the privacy policies for banks. Zahid Nauman et.al., (2010) found that perceived usefulness was significantly related with acceptance of online banking while the other two such as privacy and security, and quality of internet services were insignificantly related to it. Further speed and reliability of the internet connection were not regarded as important by the respondents. Devi and Malarvizhi (2010) identified six factors as influencing factors of the adoption of E-Banking. The factors include consumers’ satisfaction, problems encountered by them, reliability on banks, bank’s efficiency in delivering the services, the negative factor on E-Banking usages which include high hidden cost and the accessibility. 6. Research Methodology This study is based on both primary data and secondary data. The secondary data were collected from journals and websites. The primary data were collected from 150 respondents who are using the net banking services. The researcher has adopted the convenient sampling method and used an interview schedule for collecting this data. The respondents include customers using the net banking services of public sector banks, old private sector banks and new private sector banks. The following statistical techniques were used for analysis.
• Percentage Analysis • Mann Whitney U Test • Kruskal Wallis Test • Analysis of Variance (ANOVA)
7. Limitation of the Study The Study is based on the non-random sampling method. A sample of only 150 respondents was taken from the town of Dindigul. Since the sample size of this study is limited, the results of this study may not be applicable to the entire universe. 8. Growth of NEFT and RTGS Services The funds transfer facility of Internet Banking is enabled through two channels like NEFT (National Electronic Funds Transfer) and RTGS (Real Time Gross Settlement). The NEFT enables funds transfers across different accounts in batches on different basis by netting debits with credits. As on May 31, 2013, 146 branches of different banks are covered through NEFT. On the other hand, RTGS enables funds transfers in real time, without netting of debits and credits. The settlements are done one-by-one, transaction-by-transaction individually. At present, more than 74,000 branches at more than 20,000 places are covered under RTGS system. Objective 1: To study the growth of net banking transactions done through NEFT and RTGS in India.
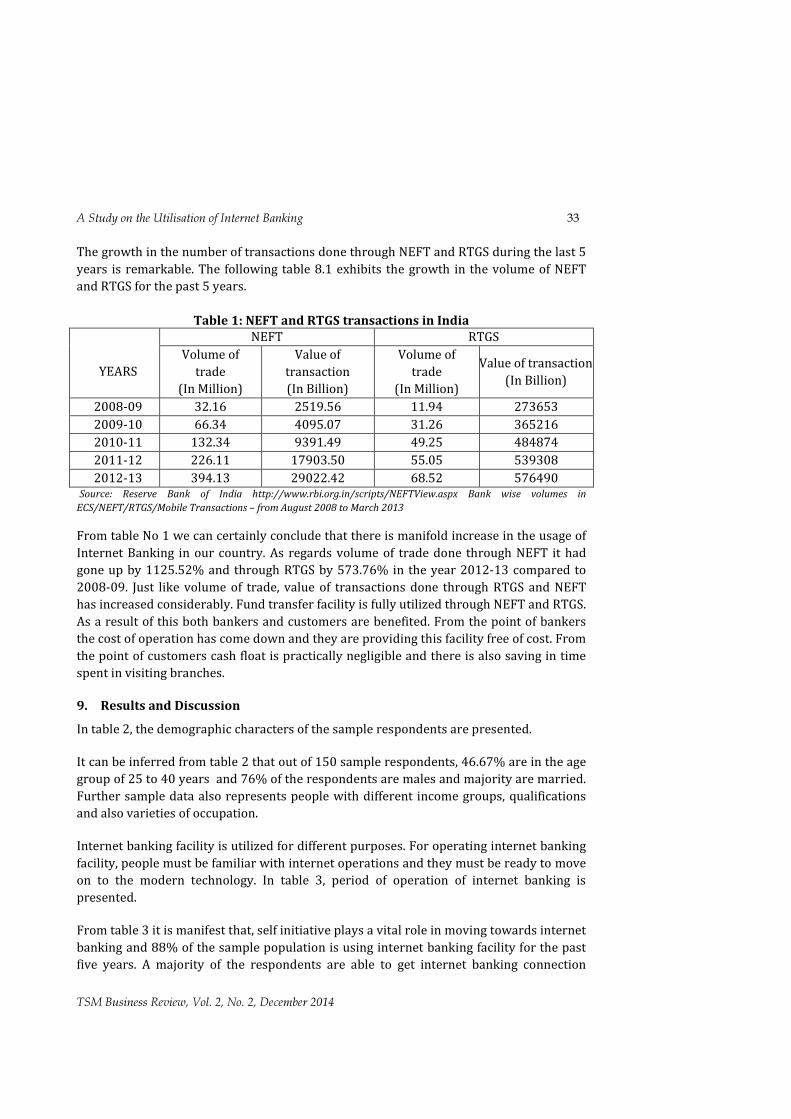
A Study on the Utilisation of Internet Banking 33
TSM Business Review, Vol. 2, No. 2, December 2014
The growth in the number of transactions done through NEFT and RTGS during the last 5 years is remarkable. The following table 8.1 exhibits the growth in the volume of NEFT and RTGS for the past 5 years.
Table 1: NEFT and RTGS transactions in India
YEARS
NEFT RTGS Volume of
trade (In Million)
Value of transaction (In Billion)
Volume of trade
(In Million) Value of transaction
(In Billion) 2008-09 32.16 2519.56 11.94 273653 2009-10 66.34 4095.07 31.26 365216 2010-11 132.34 9391.49 49.25 484874 2011-12 226.11 17903.50 55.05 539308 2012-13 394.13 29022.42 68.52 576490
Source: Reserve Bank of India http://www.rbi.org.in/scripts/NEFTView.aspx Bank wise volumes in ECS/NEFT/RTGS/Mobile Transactions – from August 2008 to March 2013 From table No 1 we can certainly conclude that there is manifold increase in the usage of Internet Banking in our country. As regards volume of trade done through NEFT it had gone up by 1125.52% and through RTGS by 573.76% in the year 2012-13 compared to 2008-09. Just like volume of trade, value of transactions done through RTGS and NEFT has increased considerably. Fund transfer facility is fully utilized through NEFT and RTGS. As a result of this both bankers and customers are benefited. From the point of bankers the cost of operation has come down and they are providing this facility free of cost. From the point of customers cash float is practically negligible and there is also saving in time spent in visiting branches. 9. Results and Discussion In table 2, the demographic characters of the sample respondents are presented.
It can be inferred from table 2 that out of 150 sample respondents, 46.67% are in the age group of 25 to 40 years and 76% of the respondents are males and majority are married. Further sample data also represents people with different income groups, qualifications and also varieties of occupation. Internet banking facility is utilized for different purposes. For operating internet banking facility, people must be familiar with internet operations and they must be ready to move on to the modern technology. In table 3, period of operation of internet banking is presented. From table 3 it is manifest that, self initiative plays a vital role in moving towards internet banking and 88% of the sample population is using internet banking facility for the past five years. A majority of the respondents are able to get internet banking connection

34 A Study on the Utilisation of Internet Banking
TSM Business Review, Vol. 2, No. 2, December 2014
without much waiting time and they prefer to operate the banking operation through their own computers. The table also reveals that only 8% of the sample respondents are having account in old private sector banks. In internet banking, the login id and password are essential for entering into the bank’s website. In addition to this are requires transaction password for transfer of funds. Further certain banks insist customers to change their password once in three months. If customers fail to change their password, the internet banking operation may be withheld. In table no 4, the difficulties expressed by the respondents with password and login id are presented.
Table 2: Demographic characters Particulars Total Users
Valid Frequency Percentage
Age Below 25 years 22 14.66 25 to 40 years 70 46.67 Above 40 years 58 38.67
Total 150 100.00
Gender Males 114 76.00 Females 36 24.00
Total 150 100.00
Marital Status Married 104 69.33 Unmarried 46 30.67
Total 150 100.00
Education
HSC 8 5.33 UG 52 34.67 PG 64 42.67 Diploma 12 8.00 Professional 14 9.33
Total 150 100.00
Occupation
Students 6 4.00 Private Employees 26 17.33 Government Employees 44 29.33 Business 26 17.33 Professional 44 29.34 House Wives 4 2.67
Total 150 100.00
Monthly Income Below 20,000 42 28.00
20,000 to 50,000 68 45.33 Above 50,000 40 26.67
Total 150 100.00 Source: Primary Data

A Study on the Utilisation of Internet Banking 35
TSM Business Review, Vol. 2, No. 2, December 2014
Table 3: Period of using banking operations Particulars Total Users
Valid Frequency Percentage
Name of the Bank
Nationalised Banks 54 36.00 State Bank Group 42 28.00 Old Private Sector 12 8.00 New Private Sector 42 28.00
Total 150 100.00
Duration of A/C maintenance
Upto 5 Years 82 54.67 5 to 10 Years 40 26.67 Above 10 Years 28 18.66
Total 150 100.00
Period of Using Internet Banking
Upto 5 Years 112 74.66 5 to 10 Years 34 22.67 Above 10 Years 4 2.67
Total 150 100.00
Waiting Time after applying
Less than 3 days 68 45.33 3 to 7 days 46 30.67 8 to 30 days 32 21.33 More than 30 days 4 2.67
Total 150 100.00
Adoption of Net banking
Bank’s Advertisements 10 6.67 Self initialisation 92 61.33 Friend’s recommendation 14 9.33 Bank’s recommendation 30 20.00 Relative Recommendation 4 2.67
Total 150 100.00
Access Net banking
Own Personal Computer 100 66.67 System at office 44 29.33 Mobile phones 4 2.67 Cafes 2 1.33
Total 150 100.00 Source: Primary Data From table 4 it could be seen that, a majority of the respondents do not have difficulty in remembering the password and due to secrecy they do not want to store in mobiles and in diaries. Hence the hypothesis framed is rejected. Further majority of the respondents are aware of changing password, method of action to be taken in case of forgetting password, login id and charges for regenerating password. Hardly below 10% of the sample is population ignorant of the action to be taken in case of forgetting the login id and password.
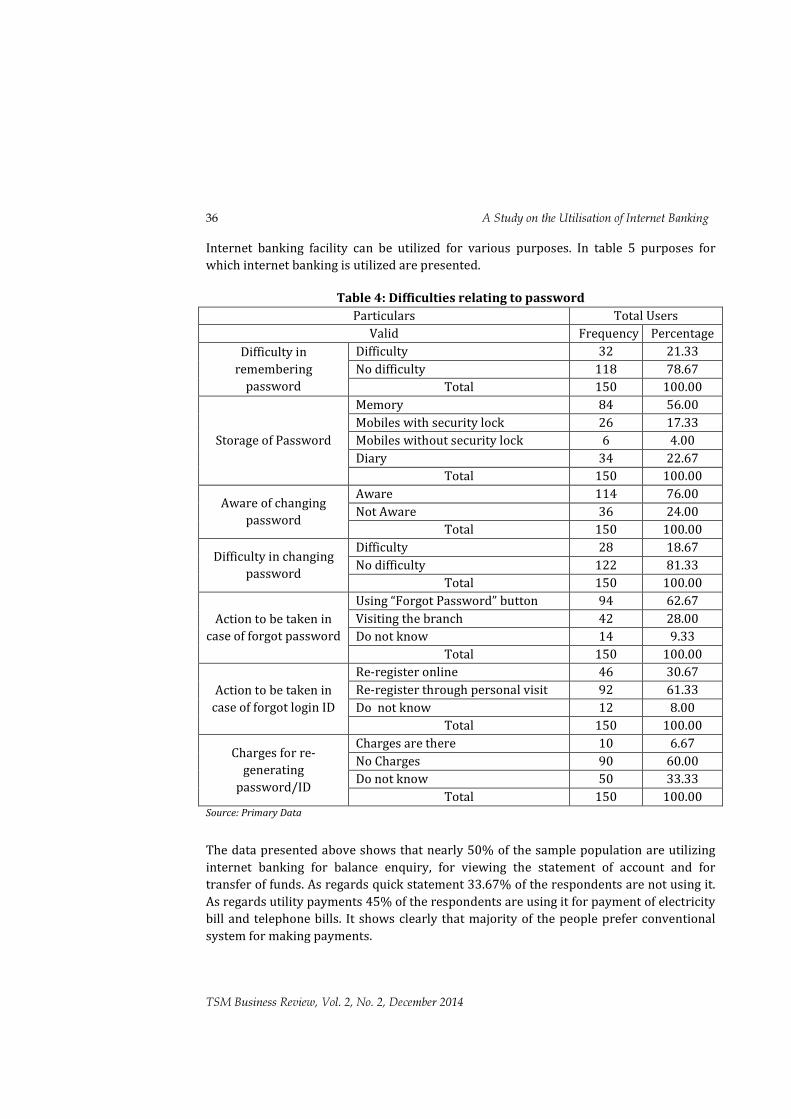
36 A Study on the Utilisation of Internet Banking
TSM Business Review, Vol. 2, No. 2, December 2014
Internet banking facility can be utilized for various purposes. In table 5 purposes for which internet banking is utilized are presented.
Table 4: Difficulties relating to password Particulars Total Users
Valid Frequency Percentage Difficulty in
remembering password
Difficulty 32 21.33 No difficulty 118 78.67
Total 150 100.00
Storage of Password
Memory 84 56.00 Mobiles with security lock 26 17.33 Mobiles without security lock 6 4.00 Diary 34 22.67
Total 150 100.00 Aware of changing
password Aware 114 76.00 Not Aware 36 24.00
Total 150 100.00 Difficulty in changing
password Difficulty 28 18.67 No difficulty 122 81.33
Total 150 100.00
Action to be taken in case of forgot password
Using “Forgot Password” button 94 62.67 Visiting the branch 42 28.00 Do not know 14 9.33
Total 150 100.00
Action to be taken in case of forgot login ID
Re-register online 46 30.67 Re-register through personal visit 92 61.33 Do not know 12 8.00
Total 150 100.00 Charges for re-
generating password/ID
Charges are there 10 6.67 No Charges 90 60.00 Do not know 50 33.33
Total 150 100.00 Source: Primary Data
The data presented above shows that nearly 50% of the sample population are utilizing internet banking for balance enquiry, for viewing the statement of account and for transfer of funds. As regards quick statement 33.67% of the respondents are not using it. As regards utility payments 45% of the respondents are using it for payment of electricity bill and telephone bills. It shows clearly that majority of the people prefer conventional system for making payments.

A Study on the Utilisation of Internet Banking 37
TSM Business Review, Vol. 2, No. 2, December 2014
Table 5: Purpose of using net banking (In a month) Particulars Total Users
Valid Frequency Percentage
Balance Enquiry Less than 5 times 72 48.00 5 to 10 times 20 13.33 More than 10 times 54 36.00 Not Using 4 2.67
Total 150 100.00
Statement of Accounts Less than 5 times 90 60.00 5 to 10 times 12 8.00 More than 10 times 18 12.00 Not Using 30 20.00
Total 150 100.00
Quick Statement View Less than 5 times 50 33.33 5 to 10 times 16 10.67 More than 10 times 34 22.66 Not Using 50 33.33
Total 150 100.00
Funds Transfer-Within Banks Less than 5 times 76 50.67 5 to 10 times 36 24.00 Not Using 38 25.33
Total 150 100.00
Funds Transfer-Other Banks Less than 5 times 68 45.33 5 to 10 times 30 20.00 Not Using 52 34.67
Total 150 100.00 Utility Payments: EB Payment
Once in Two Months 68 45.33 Not Using 82 54.67
Total 150 100.00 Telephone Bill Payment
Once in a month 68 45.34 Not Using 82 54.66
Total 150 100.00
Railway Ticket Booking Once in a month 80 53.33 1 to 5 times 10 6.67 Not Using 60 40.00
Total 150 100.00
Insurance Premium Once in a year 46 30.67 1 to 5 times in a year 6 4.00 Not Using 98 65.33
Total 150 100.00 Institutional Fees
Less than 5 times 14 9.33 Not Using 136 90.67
Total 150 100.00
Online Shopping Less than 5 times 46 30.67 5 to 10 times 2 1.33 Not Using 102 68.00
Total 150 100.00
Mobile Recharge Less than 5 times 14 9.33 More than 10 times 2 1.33 Not Using 134 89.33
Total 150 100.00 DTH Recharge
Less than 5 times 12 8.00 Not Using 138 92.00
Total 150 100.00 Bus and Movie Tickets
Less than 5 times 6 4.00 Not Using 144 96.00
Total 150 100.00 Source: Primary Data

38 A Study on the Utilisation of Internet Banking
TSM Business Review, Vol. 2, No. 2, December 2014
Booking railway ticket seems to be popular through online. More than 50% of the respondents are using internet banking facility for booking railway ticket. Only 33% of the respondents are using Internet Banking facility for payment of insurance premium and for online shopping majority of persons are not using internet banking facility. Objective 2: To study the difficulties faced in utilizing internet banking Moving from conventional banking to technology based banking calls for acceptance and faith in the new system. If customers are having some apprehension about the new system then it can never be successful. The problems that are faced by the respondents in internet banking are taken as lack of trust in the bank’s website and security, less personal contact, fear of hidden costs, fraudulent activities by employees, high charges for transferring funds, legal risks, security problem, server being too busy, Problem in transferring funds beyond business hours and fear of loss of vital data when the bank’s server crashes. The respondents are asked to rank these problems and the scores so obtained are added up. To find out the relationship between the demographic factors and problems perceived by the respondents, the Mann Whitney U test and Kruskal Wallis test are used. In table no 6 the relationship between the demographic factors and problems perceived are presented.
Table 6: Relationship between demographic factors and problems perceived in
internet banking Demographic Factors Significance at 5% Level p value
Mann Whitney Test Kruskal Wallis Test Age - 0.112(NS) Gender 0.000(S) - Marital Status 0.758(NS) - Education - 0.253(NS) Occupation - 0.000(S) Monthly Income - 0.845(NS) Source: Primary Data. S – Significant (p value is less than 0.05), NS – Not Significant (p value is more than 0.05) From table 6, one can form an opinion that, there is no significant difference between the demographic factors such as age, marital status, education and monthly income and the problems perceived in using internet banking. At the same time, there is quite a significant difference between two demographic factors such as gender and occupation and the problems perceived by them. Thus the null hypothesis “There is no significant difference between age, marital status, education and monthly income and the problems perceived in using internet banking” is accepted, whereas the null hypothesis “There is no significant difference between gender and occupation and the problems perceived in using internet banking” is rejected. The main feature of internet banking is the transferring funds instantly to other accounts either under NEFT or under RTGS. But there are problems in transferring funds beyond
A Study on the Utilisation of Internet Banking 39
TSM Business Review, Vol. 2, No. 2, December 2014
business hours. As per RBI guidelines, the NEFT settlement timings are between 8 a.m and 7 p.m on week days and between 8 a.m and 1 p.m on Saturdays, whereas the RTGS settlements timings are available between 9 a.m and 4.30 p.m on weekdays and between 9 a.m and 1.30 p.m on Saturdays. But, banks follow their own timings where the starting and ending times for NEFT and RTGS differ from that of RBI. In the website of Indian bank, the NEFT closing time on Saturdays is specified at 1.00 p.m whereas it closes at 12.30 p.m itself. Thus if a fund is transferred (NEFT) at 4 p.m on Saturday, it reaches the beneficiary only after 40 hours. The worst is the case with the Indian bank net banking. This bank’s net banking does not permit even to schedule transfers beyond the business hours. For example, if the option of fund transfer is chosen after 12.30 p.m in Saturdays, it just reports that it cannot be affected since business hour is closed. Objective 3: To study the awareness and utilisation level of bank customers about the net banking services of their banks In table 7 the demographic factors age, education, occupation and income are related with awareness and utilisation of internet banking by using One-Way Analysis of Variance. The significance is tested at 5 per cent level. From the above Table 7, one can infer that, there is a significant role of the age factor in the awareness and utilisation of certain services like change password, tax payments, downloading statement of accounts, making NEFT and RTGS settlements, suspending debit cards, availing demat facility, opening term deposits, viewing the login history, stopping the cheque payment, enquiring about the NEFT/RTGS transfers made and exercising the option of forgot password. At the same time, the age factor does not play a significant role in the awareness and utilisation of other services. In the case of gender, it has a significant role in the awareness and utilisation of one service of internet banking that is downloading the statement of accounts. But it has no significant role in the awareness and utilisation of all the other services of internet banking.
The next demographic factor called the marital status plays a vital role in the awareness and utilisation of changing password and downloading statement of accounts. But it has no role in the awareness and utilisation of other services.
The ANOVA explaining the relationship between the remaining three demographic factors (education, occupation and monthly income) and awareness and utilisation of internet banking services are presented in the following Table 8. Table 8 shows that, the educational level of the respondents has a significant role in the awareness and utilisation of services like viewing quick statement, making tax payments,

40 A Study on the Utilisation of Internet Banking
TSM Business Review, Vol. 2, No. 2, December 2014
using virtual keyboard, opening term deposits, and stopping the cheque payments. But it has no important role in the awareness and utilisation of other services.
Table 7: Three demographic factors (age, gender and marital status) and awareness and utilisation of internet banking services –Analysis of Variance
(One Way) Available Facilities Calculated Significance (Significance at 5% Level) p value
Age Gender Marital Status F Value p value F Value p value F Value p value
Balance Enquiry facility 2.376 0.097(NS) 1.292 0.258(NS) 0.716 0.399(NS) Quick Statement View 0.518 0.597(NS) 1.866 0.174(NS) 0.437 0.510(NS) Change Password 5.377 0.006(S) 0.139 0.710(NS) 4.984 0.027(S) Edit Profile 0.682 0.507(NS) 0.975 0.325(NS) 1.140 0.287(NS) Fund Transfer – Within Banks 0.689 0.504(NS) 0.001 0.977(NS) 1.077 0.301(NS) Fund Transfer – Other Banks 1.229 0.296(NS) 0.126 0.723(NS) 0.031 0.860(NS) Utility Payments 1.636 0.198(NS) 0.719 0.398(NS) 1.704 0.194(NS) Tax Payments 4.336 0.015(S) 2.903 0.091(NS) 0.550 0.459(NS) Statement of Accounts 3.303 0.040(S) 6.626 0.011(S) 4.779 0.030(S) NEFT Settlement 5.988 0.003(S) 1.344 0.248(NS) 0.001 0.982(NS) RTGS Settlement 3.515 0.032(S) 0.283 0.596(NS) 0.337 0.562(NS) Credit Card Payment 0.344 0.709(NS) 0.073 0.787(NS) 0.607 0.437(NS) Suspend Debit Cards 11.335 0.000(S) 0.104 0.748(NS) 1.032 0.311(NS) Demat Facility 6.755 0.002(S) 1.344 0.248(NS) 1.306 0.255(NS) Virtual Keyboard 1.676 0.191(NS) 2.116 0.148(NS) 0.088 0.767(NS) Online Shopping 1.485 0.230(NS) 0.392 0.532(NS) 1.905 0.170(NS) Opening Term Deposits 10.403 0.000(S) 0.096 0.757(NS) 0.260 0.611(NS) Login History 15.774 0.000(S) 0.028 0.866(NS) 1.308 0.255(NS) Cheque Status Enquiry 2.693 0.071(NS) 3.754 0.055(NS) 0.997 0.320(NS) Stop Cheque Payment 3.462 0.034(S) 1.072 0.302(NS) 0.017 0.896(NS) NEFT/RTGS Enquiry 3.931 0.022(S) 0.013 0.908(NS) 1.447 0.231(NS) Pension Enquiry 2.452 0.090(NS) 0.421 0.518(NS) 1.780 0.184(NS) Forgot Password 3.384 0.037(S) 0.355 0.552(NS) 0.304 0.582(NS) Donations 2.372 0.097(NS) 0.129 0.720(NS) 1.001 0.319(NS) Source: Primary Data. S – Significant (p value is less than 0.05), NS – Not Significant (p value is more than 0.05)
The occupational status of the respondents has a significant role to play in the awareness and utilisation of balance enquiry facility, quick statement view, making intra and inter-Bank fund transfers, making utility payments, downloading statement of accounts, effecting NEFT and RTGS settlements, downloading statement of accounts, demat facility, suspending debit cards online, opening term deposits, making cheque status and

A Study on the Utilisation of Internet Banking 41
TSM Business Review, Vol. 2, No. 2, December 2014
NEFT/RTGS enquiry. But it has no significant influence on the awareness and utilisation of other services.
Table 8: Demographic factors (education, occupation and monthly income) and awareness and utilisation of internet banking services –Analysis of Variance
(One Way)
Available Facilities Calculated Significance (Significance at 5% Level) p value Education Occupation Monthly Income
F Value p value F Value p value F Value p value Balance Enquiry facility 0.308 0.873(NS) 4.329 0.001(S) 1.711 0.184(NS) Quick Statement View 3.757 0.006(S) 3.855 0.003(S) 3.199 0.044(S) Change Password 0.647 0.630(NS) 0.937 0.459(NS) 0.767 0.466(NS) Edit Profile 1.538 0.194(NS) 1.417 0.222(NS) 0.807 0.448(NS) Fund Transfer – Within Banks 0.925 0.451(NS) 5.312 0.000(S) 0.299 0.742(NS) Fund Transfer – Other Banks 1.421 0.230(NS) 3.230 0.009(S) 3.366 0.037(S) Utility Payments 0.923 0.452(NS) 3.271 0.008(S) 10.057 0.000(S) Tax Payments 5.457 0.000(S) 1.935 0.092(NS) 2.829 0.062(NS) Statement of Accounts 1.880 0.117(NS) 6.861 0.000(S) 6.283 0.002(S) NEFT Settlement 1.451 0.220(NS) 4.032 0.002(S) 3.724 0.026(S) RTGS Settlement 2.047 0.091(NS) 4.338 0.001(S) 3.884 0.023(S) Credit Card Payment 1.852 0.122(NS) 1.772 0.122(NS) 1.777 0.173(NS) Suspend Debit Cards 0.337 0.853(NS) 2.720 0.022(S) 0.408 0.666(NS) Demat Facility 1.065 0.376(NS) 2.581 0.029(S) 0.785 0.458(NS) Virtual Keyboard 2.547 0.042(S) 1.562 0.174(NS) 1.357 0.261(NS) Online Shopping 0.603 0.661(NS) 1.713 0.135(NS) 1.562 0.213(NS) Opening Term Deposits 2.706 0.033(S) 4.212 0.001(S) 3.462 0.034(S) Login History 2.003 0.097(NS) 2.098 0.069(NS) 1.266 0.285(NS) Cheque Status Enquiry 0.662 0.619(NS) 3.654 0.004(S) 5.418 0.005(S) Stop Cheque Payment 2.772 0.029(S) 1.556 0.176(NS) 0.511 0.601(NS) NEFT/RTGS Enquiry 2.013 0.096(NS) 3.620 0.004(S) 1.462 0.235(NS) Pension Enquiry 0.774 0.544(NS) 2.075 0.072(NS) 0.999 0.371(NS) Forgot Password 1.520 0.199(NS) 1.946 0.090(NS) 1.518 0.223(NS) Donations 1.059 0.379(NS) 1.330 0.255(NS) 4.269 0.016(S) Source: Primary Data. S – Significant (p value is less than 0.05), NS – Not Significant (p value is more than 0.05)

42 A Study on the Utilisation of Internet Banking
TSM Business Review, Vol. 2, No. 2, December 2014
There is a considerable role of the respondents’ family monthly income in the awareness and utilisation of services like quick statement view, inter-Bank fund transfers, making utility payments, downloading statement of accounts, effecting NEFT and RTGS settlements, opening term deposits, cheque status enquiry and making donations. But it has no noteworthy role to play in the awareness and utilisation of other services. 10. Conclusion Internet banking helps people to do banking operations at home itself rather than visiting banking premises. Bankers are concerned with in internet banking so that they can reduce the cost of operation. The Government is also interested in popularizing internet banking so as to reduce physical cash movement and thus saving the cost of printing currency notes. From the point of banking customers, it is time saving and user friendly. In India, one can witness tremendous growth in the utilisation of funds transfer facility through NEFT and RTGS in the year 2012-13 compared to 2008-09. As regards utilisation of internet banking, more than 50% of the people are utilising for ticket booking for railways. It is also noted that there is less utilisation for other utility payments. People are quite comfortable with the login id and password and majority of them are not having any difficulty in remembering or changing the password. 44% of the respondents have revealed the places where they store their passwords. This may be a clue for the hackers to steal their passwords. So the bankers may advice their customers not to disclose even the place where they store their password. There is no significant difference between the demographic factors such as age, marital status, education and monthly income and the problems perceived in using internet banking. While at the same time, there is quite a significant difference between two demographic factors such as gender and occupation and the problems perceived by them. The ANOVA tests show that the demographic factors have significant role to play on the awareness and utilisation of certain services of internet banking. 11. Managerial Implications Bankers must educate the customers about the security aspects so that they can remove the fear in the minds of the customers. Further, the banks must create awareness about various services available in internet banking for increasing the utilisation level of these services by the internet banking users. For this they may frequently send messages about the services by e-mails and sms. They may also conduct “Internet Banking Awareness Week” or “Internet Banking Awareness Camp” at banks’ premises or at important public places for popularizing the services. They can enter into partnerships with various organisations like Airlines, Online shopping stores etc, to encourage payment through net banking. Taking these steps in promoting the utilisation of internet banking services can cost much to the banks. But this additional cost is to be borne by the banks only at the beginning of these steps. After therefore, they can manage these costs by increasing the customer base. The Government can take steps in increasing the usage of internet banking by making mandatory e-payments as in the case of payment of excise duty and

A Study on the Utilisation of Internet Banking 43
TSM Business Review, Vol. 2, No. 2, December 2014
service tax and income tax for companies. This scope can be further widened to other tax payers also. To reduce the circulation of physical currency, the Government can make use of internet banking for increasing the electronic payments. To popularize internet banking for meeting utility bills, vendors can provide some discount if payment is made through internet. 12. Suggestions for future Research Future research can be done taking a comparative study on internet banking of public sector and private sector banks with various demographic distinction features, like young users and old-aged users and so on. Awareness and utilisation of alternative delivery channels of electronic banking and barriers in the adoption of electronic banking can be looked into. References
Birch, D., & Young, M. (1997). Financial Services and the Internet: What Does the Cyberspace Mean for the Financial Services Industry? Internet Research: Electronic Networking Applications and Policy, 7(2), 120-128.
Bradley, L., & Stewart, K. (2003). A Delphi Study of Internet Banking. Marketing Intelligence and Planning, 21(5), 272-281, ISSN 0263-4503.
Chandra, A., & Sharma, V. (2010). Analytical Research on Indian Online Banking and Users’ Privacy. Global Journal of Enterprise Information System, 2(I)
Chellappa, K. (2001). Contrasting Classical Electronic Infrastructure and the Internet: A Tale of Caution. [Research Paper]. Marshall School of Business, University of Southern California, Los Angeles.
Devi A. P., & Malarvizhi, V. (2010). Customers’ perception of E-Banking: Factor Analysis. IUP Journal of Management Research. 9(6).
Gerrard, P. & Cunningham B. J. (2003). The diffusion of Internet Banking among Singapore Customers. International Journal of Bank Marketing, 21(1), 16-28
Gerrard P., Cunningham B. J., & Devlin J. F. (2006). Why Consumers are not Using Internet Banking? A Qualitative Study. Journal of Service Marketing, 20(3), 160-168
Hitt L. M., & Frei F. X. (2002). Do Better Customers Utilise Electronic Distribution Channels? The Case of PC Banking. Management Science, 48(6), 732-748.
Jeevan, M. T. (2010), Only Banks - No Bricks, Voice and Data. Retrieved from website http://www.voicendata.com/content/convergence/trends/100111102.asp. (20 Sept, 2010).
Kim, K., & Prabhakar, B. (2004), Initial trust and the adoption of B2C e-commerce: The case of Internet Banking. Database for Advances in Information Systems. 35(2), 50-64.
Laukkanen, P., Sinkkonen, S., & Laukkanen, T. (2008). Consumer Resistance to Internet Banking: Postponers, Opponents and Rejectors. International Journal of Bank Marketing. 26(6), 440-455.
44 A Study on the Utilisation of Internet Banking
TSM Business Review, Vol. 2, No. 2, December 2014
Lee, E. J., Kwon, K. N., & Schumann, D. W. (2005). Segmenting the Non-adopter Category in the Diffusion of Internet Banking. International Journal of Bank Marketing. 23(5), 417-437.
Maenpaa, K., Kale, H., Sudhir, K. H., & Mesiranta, N. (2008). Consumer perceptions of Internet Banking in Finland: The moderating role of familiarity. Retreived from website: http://epublications.bond.edu.au/business_pubs/89.
Malhotra, P., & Singh, B. (2007). Determinants of Internet Banking Adoption by Banks in India. Internet Research, 17(3), 323-339.
Mattila M., Karjaluoto, H., & Pento, T. (2003). Internet Banking Adoption among Mature Customers: Early majorityor laggards? Journal of Services Marketing, 17(5), 514-528.
Mols, N. P. (1999). The Internet and banks’ strategic distribution channel decision. International Journal of Bank marketing, 17(6), 295-300.
Rotchanakitumnuai, S., & Speece, M. (2003). Barriers to Internet Banking: A Qualitative Study among Corporate Customers in Thailand. International Journal of Bank Marketing. 21(6/7), 312-323.
Sathye, M. (1997). Internet Banking in Australia. Journal of Internet Banking and Commerce. 2(4).
Wang, J. S., & Pho, T. S. (2009). Drivers of Customer Intention to use Online Banking: An Empirical Study in Vietnam. African Journal of Business Management. 3(11), 669-677.
Wisner D. J., & Corney, J. W. (2001). Comparing Practices for Capturing Bank Customer Feedback – Internet Versus Traditional Banking. Benchmarking: An International Journal, 8(3), 240-250, MCB University Press.
Young, D. R. (2005). The performance of Internet-Based Business Models: Evidence from the Banking Industry. Journal of Business, 78(3), University of Chicago Press.
Zahid, N., Mujtaba, A., & Riaz, A. (2010). Consumer Acceptance of Online Banking. European Journal of Economics, Finance and Administrative Sciences 27(1), 2010.
Article ISSN: 2348-3784
HemaMalini P H, Research Scholar, Department of Management Studies, Anna University, Chennai. E-Mail: [email protected]
Dr. Anthea Washington, Senior Lecturer, Department of Educational & Professional Development, Caledonian College of Engineering, P.O Box 2322, CPO Seeb 111, Sultanate of Oman. E-Mail: [email protected], Phone: 00968 24536165/ 968 97101468, Fax: 00968 24535675 (Corresponding Author)
Employees’ Motivation and Valued Rewards as a Key to Effective QWL- from the Perspective of
Expectancy Theory
HemaMalini PH and Anthea Washington Abstract Employees around the world are motivated to work and perform effectively based on the kind of positive rewards they expect to earn as a result of their performance. This paper is an attempt to relate quality of work life with the Expectancy theory proposed by Victor Vroom. The three factors of the theory are associated and viewed from the perspective of various work related components such as working environment, amenities and resources with reference to an educational institution in Oman. The paper supports the idea that employees’ efforts propelled by positive behavior and valued goals are instrumental in increasing the QWL. Key Words: Quality of Work life, expectancy theory, motivation, rewards 1. Introduction Quality of Work Life (QWL) has gained the attention of people worldwide, particularly in the last two decades and has been an interesting area of study for researchers, academicians, managers and experts who have looked at it as a core indicator for job satisfaction, employee motivation, performance management and enhanced productivity. Numerous studies have reported that QWL is an important factor for employee retention and improving the productivity of the organization. It is indeed true that work – life balance is imperative for an organization to be successful. Employees need to be provided the right kind of work atmosphere and facilities to enhance the effectiveness of the organization. This has made organizations worldwide to look into the finer aspects of developing healthy QWL for the employees. It is generally believed that it is the organisation’s responsibility to take initiatives for improving the QWL for their employees. Several studies have reported that the organization need to provide job security, safe and healthy working conditions, fair
46 Employees’ Motivation and Valued Rewards as a Key to Effective QWL- from the Perspective of Expectancy Theory
TSM Business Review, Vol. 2, No. 2, December 2014
compensation, career opportunities and welfare facilities for the employees in order to improve the QWL. While this is largely necessary, it also takes initiatives from the employees themselves to enhance the QWL. In this paper the authors have taken efforts to show how employees’ efforts propelled by positive behavior and valued goals are instrumental in increasing the QWL. The authors have presented a model showing effectiveness of QWL among staff in an educational institution in Oman by adapting the Victor Vroom’s Expectancy theory. 2. Definitions According to J. Richard and J. Loy, "QWL is the degree to which members of a work organization are able to satisfy important personal needs through their experiences in the organization". Society for Training and Development defined QWL as “a process of work organization which enables its members at all levels to actively participate in shaping the organization’s environments, methods and outcomes. Robbins (1989) defined QWL as "a process by which an organization responds to employee needs by developing mechanisms to allow them to share fully in making the decisions that design their lives at work”. Furthermore, Guest (Saklani, 2004) has referred to QWL as the measure of the quality of human experience in the organization. Similarly, Skinner and Ivancevich (2008) urged that QWL is associated with adequate and fair compensation, safe & healthy working conditions, opportunities to develop human capacities, opportunities for continuous growth and job security, more flexible work scheduling and job assignment, careful attention to job design and workflow, better union-management cooperation, and less structural supervision and development of effective work teams. From the above definitions, it can be inferred that quality of work life is a concept driven by factors associated with organizational inputs as well as something which is intrinsic in a person; something that relates to a person’s attitudes and experiences (Ayesha Tabassum, 2011). 3. Literature Review Numerous studies have been made by different authors and experts on QWL. Many studies have focused on the components of QWL and the factors adding up to positive quality of work life. To quote few of these studies- Mirvis and Lawler (1984) found in their study that quality of working life was related with satisfaction with wages, hours and working conditions, describing the “essentials of a good quality of work life” as; safe work environment, equitable wages, equal employment opportunities and opportunities for advancement. Quality of working life is a holistic concept, which not only considers work-based factors such as job satisfaction, satisfaction with pay and relationships with work colleagues, but also includes factors that predict life satisfaction and general feelings of well-being (Danna & Griffin, 1999).

Employees’ Motivation and Valued Rewards as a Key to Effective QWL- from the Perspective of Expectancy Theory 47
TSM Business Review, Vol. 2, No. 2, December 2014
Gnanayudam and Dharmasiri (2007) have viewed QWL as the employee’s overall satisfaction with work life leading to develop work-life balance. A meta-analysis study concerning nurses and QWL conducted by Knox and Irving (Lewis, 2001) indicated that autonomy is significantly associated with QWL. The feeling of career achievement is reflected in the willingness to spend extra time at job. It was observed that positive QWL acts as a motivation behind willingly working for long hours that was enjoyed by the executives (Cannings & Montmarquette, 1991). Ellis and Pompli (2002) in their study on nurses identified numerous factors resulting in job dissatisfaction and quality of working life, including: Poor working environments, resident aggression, workload, unable to deliver quality of care expected, balance of work and family, shift work, non-involvement in decision making, professional isolation, non-recognition of work, unhealthy relationships with supervisor/peers, role conflict, absence opportunity to learn new skills. It has also been observed that, work-related stress and balancing work and non-work life domains (Loscocco & Roschelle, 1991) affect QWL significantly and should conceptually be considered as determinant of quality of working life. However a general conception is that quality of working life fundamentally relates to well-being of employees but it is differentiated from job satisfaction which solely represents the workplace domain (Lawler, 1982). Royuela et al. (2007), European Commission (EC) proposed ten dimensions for QWL, which are (1) intrinsic job quality, (2) skills, life-long learning and career development, (3) gender equality (4) health and safety at work, (5) flexibility and security, (6) inclusion and access to the labor market, (7) work organization and work-life balance, (8) social dialogue and worker involvement, (9) diversity and non-discrimination, and (10) overall work performance(Tabassum, 2011). Hend Al Muftah and HananLafi (2011) in their paper titled, “Impact of QWL on employee satisfaction case of oil and gas industry in Qatar” report that the physical, psychological and social factors’ centrality has a significant relationship with QWL which indirectly influence employees’ satisfaction. It was also indicated that individual’s family life correlated significantly with his/her level of QWL. Chaudhary (2014) observed that there was an increase in level of performance of employees when the more motivational environment was established. He also reported that there was an increase in the self-confidence of employees when the supervision was directed and Facilities provided by the work place like education, training, welfare, wages and bonus time increased the morale of employee. Ukaejiofo Rex Uzonna (2013) in his study reported that majority of respondents agreed that recognition and authority were the most important of expected non-monetary rewards. When it comes to bringing out the best performance of employees, growth

48 Employees’ Motivation and Valued Rewards as a Key to Effective QWL- from the Perspective of Expectancy Theory
TSM Business Review, Vol. 2, No. 2, December 2014
opportunities and challenges, recognition and non-cash rewards are more effective motivators than money. Tripathy (2006) is of the view that employee reward covers how people are rewarded in accordance with their value to an organization, which is a both financial and non-financial reward. Monis H and Sreedhara TN (2011) in their study have reported interesting findings such as the statement “If I do good work, I can count on making more money” has obtained 64.86 per cent in the Indian MNCs and 64.79 per cent in foreign MNCs. Similarly the statement “If I do good work, I can count on being promoted” has secured 71.77 percent in the Indian MNCs and 72.02 percent in the foreign MNCs Taylor (1979) more pragmatically identified the essential components of quality of working life as basic extrinsic job factors of wages, hours and working conditions, and the intrinsic job notions of the nature of the work itself. He suggested that a number of other aspects could be added, including: individual power, employee participation in the management, fairness and equity, social support, use of one’s present skills, self-development, a meaningful future at work, social relevance of the work or product, effect on extra work activities. Taylor suggests that relevant quality of working life concepts may vary according to organisation and employee group. To sum up, it stands to reason that with the diversified workforce, different people are motivated differently and the terms ‘happy’ employee, ‘motivated’ employee, ‘satisfied’ employee are more figurative than a proven fact. Job satisfaction, motivation, quality of work life etc. are largely dependent on the individual himself than on organizational or environmental factors. It is the individual employee himself / herself who has to be motivated to work towards attaining a healthy QWL. An employee’s performance is tied to the rewards expected as an outcome of doing the work and the value placed on the rewards. Therefore, a better performer and an achiever will enjoy a healthy QWL. 4. Objectives • To show the link between personal motivation and perceived rewards for
deriving QWL • To present the factors that lead to quality of work life among employees in an
educational institution from the perspective of expectancy theory.
Employees’ Motivation and Valued Rewards as a Key to Effective QWL- from the Perspective of Expectancy Theory 49
TSM Business Review, Vol. 2, No. 2, December 2014
5. Methodology This is a descriptive study based on secondary data. The paper looks into the factors that lead to quality of work life among staff members in an engineering college in Oman. The paper is based on the assumption that personal motivation is imperative for improved efforts and better performance which will lead to expected perceived rewards. Secondary data such as reports, feedback from staff, survey results from quality office and e-mails have been taken as inputs for the study. 6. Application of Expectancy Theory The three components of Victor Vroom’s expectancy theory are Expectancy, Instrumentality and Valence. Expectancy refers to the probability perceived by the individual that exerting a given amount of effort will lead to performance (Robbins, 2003). It is the belief that one’s effort will affect performance (Greenberg, 2005). Instrumentality refers to the belief that one’s performance will be rewarded. Valence refers to the perceived value of the expected rewards (Greenberg, 2005). The following model (Figure- 1) explains how quality of work life is attained among the staff in the institution in light of the expectant theory.
The Expectancy theory suggests that people put in their efforts on the perception that their efforts will lead to performance and that effective performance will result in obtaining positive rewards. Taking this as a basis, figure1 depicts that efforts lead to performance which in turn is believed to be rewarded and that these rewards are valued by the employees. The authors believe and suggest that efforts are largely based on goals. The goals could be both individual goals as well as organizational goals. Both these goals will have to be balanced and pursued upon so that an individual is able to put in the required efforts. These efforts lead to performance by the individuals. In the above figure, the factors that enable performance by the individuals (staff members) to be effective at work place are depicted under performance. That is, these factors are instrumental for effective performance by the employees who perceive that their performance will be rewarded. These factors include working environment – in terms of office atmosphere, availability of resources, smart classrooms, communication strategies, protocol and ergonomics, open door policy – the staff have easy access to heads of the respective departments to discuss issues and share opinions; problems are heard and solutions are given quickly, interpersonal relationship – strong bond is promoted among staff through working groups, team work in research and departmental activities, common lunch and celebrations, innovative programme design & delivery – the institution is constantly committed to improving the teaching and learning strategies, introducing new initiatives in teaching methods, introducing new programmes and modules, revamping existing modules and taking up challenges in academic areas,
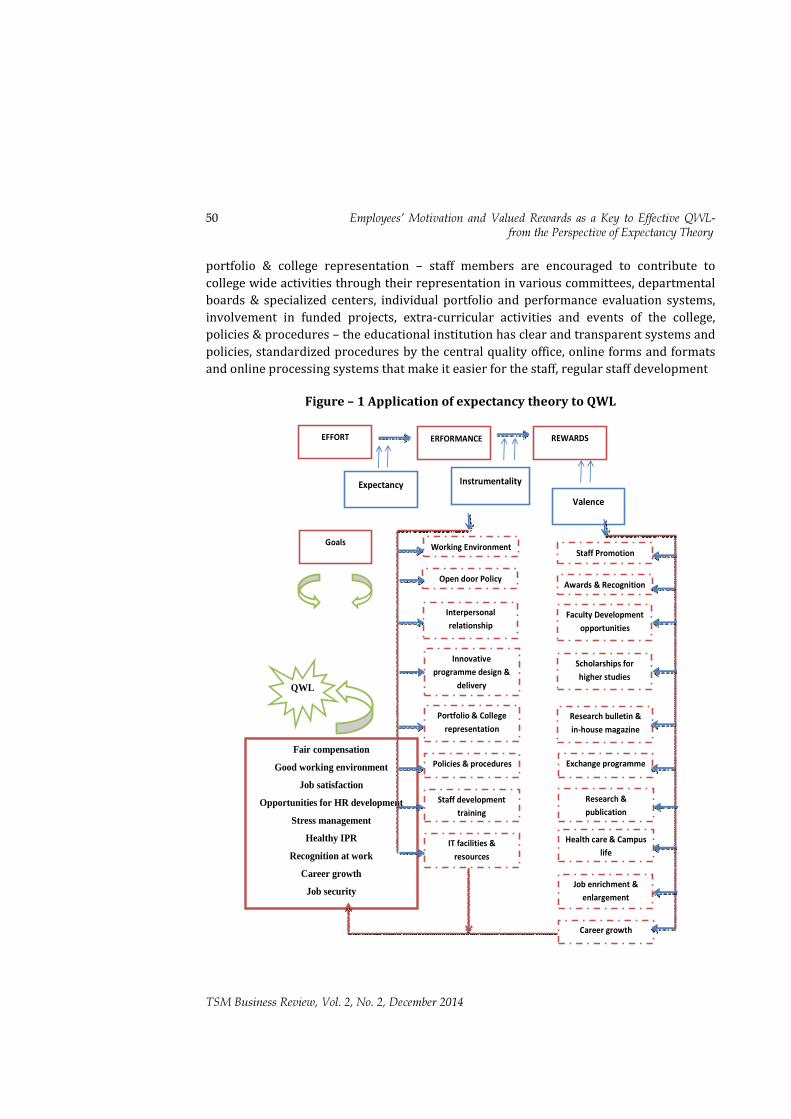
50 Employees’ Motivation and Valued Rewards as a Key to Effective QWL- from the Perspective of Expectancy Theory
TSM Business Review, Vol. 2, No. 2, December 2014
portfolio & college representation – staff members are encouraged to contribute to college wide activities through their representation in various committees, departmental boards & specialized centers, individual portfolio and performance evaluation systems, involvement in funded projects, extra-curricular activities and events of the college, policies & procedures – the educational institution has clear and transparent systems and policies, standardized procedures by the central quality office, online forms and formats and online processing systems that make it easier for the staff, regular staff development
Figure – 1 Application of expectancy theory to QWL
EFFORT PERFORMANCE REWARDS
Expectancy Instrumentality Valence
Goals
Fair compensation
Good working environment
Job satisfaction
Opportunities for HR development
Stress management
Healthy IPR
Recognition at work
Career growth
Job security
Staff Promotion
Awards & Recognition
Faculty Development opportunities
Exchange programme
Scholarships for higher studies
Research & publication
Health care & Campus life
Job enrichment & enlargement
Working Environment
Open door Policy
Interpersonal relationship
Portfolio & College representation
Innovative programme design &
delivery
Policies & procedures
Staff development training
IT facilities & resources
Research bulletin & in-house magazine
Career growth
QWL
Employees’ Motivation and Valued Rewards as a Key to Effective QWL- from the Perspective of Expectancy Theory 51
TSM Business Review, Vol. 2, No. 2, December 2014
training and workshops are organized within and outside the campus by both in-house and external experts that are aimed at providing the best opportunities for staff development, IT facilities & resources – staff have unlimited access to internet facilities, latest software, library resources and learning aids. Since the above factors are conducive for effective performance, it is believed that this performance leads to positive rewards (Instrumentality), which further results in placing high value on the rewards (Valence). The institution under discussion provides various reward mechanisms for its employees in recognition of their performance. It is believed that the rewards provided by the institution propel individuals to deliver effective performance. These rewards include staff promotion – there is a clear system for promotion which is transparent and well utilized by the staff, awards & recognition – the college has awards such as the best researcher award, best teacher award and recognition of staff with long years of experience in the institution, faculty development opportunities –members of staff are encouraged to pursue higher studies through extending tie-up with other institutions & supervisory support and are encouraged to take up funding projects, scholarship for higher studies – the college provides monetary support and scholarships for both nationals and expatriates to take up further studies, research bulletin & in-house magazine – staff members are motivated to contribute to in-house magazine and their achievements/ research endeavours are published in the research bulletin which boosts the profile of the staff., exchange programme – staff members are sent to other countries to have an exposure on latest state-of-art and to learn in their respective fields. They are also encouraged to share and apply the rich experiences gained outside in the college, research & publication – the college has research centre and the staff are encouraged to take up research and laboratory experiments in varied fields of interest; they are also encouraged to publish papers in the journal published by the college, health care & campus life – staff members have access to health care facilities and other campus facilities like canteen, playground, relaxation room, learning resource centre, etc., job enrichment & enlargement – The staff are given ample opportunities to exhibit their abilities and aptitudes through involving them in academic support activities. They are encouraged to extend their services to community programmes, corporate social responsibility programmes and other college-wide activities, career growth – employees are given freedom to plan their career and the management supports them through extending funds, provision of resources and leave. Employees work towards better performance, since they know that the institution will reward the best performers and further, the employees’ performance is boosted based on their perceived value placed on the rewards. All the rewards mentioned above enable the employees to enjoy job satisfaction, job security, fair compensation and good working environment, opportunities for continued HR development, stress management, healthy interpersonal relationship, career growth and recognition at work. These things essentially lead to increased quality of work life.
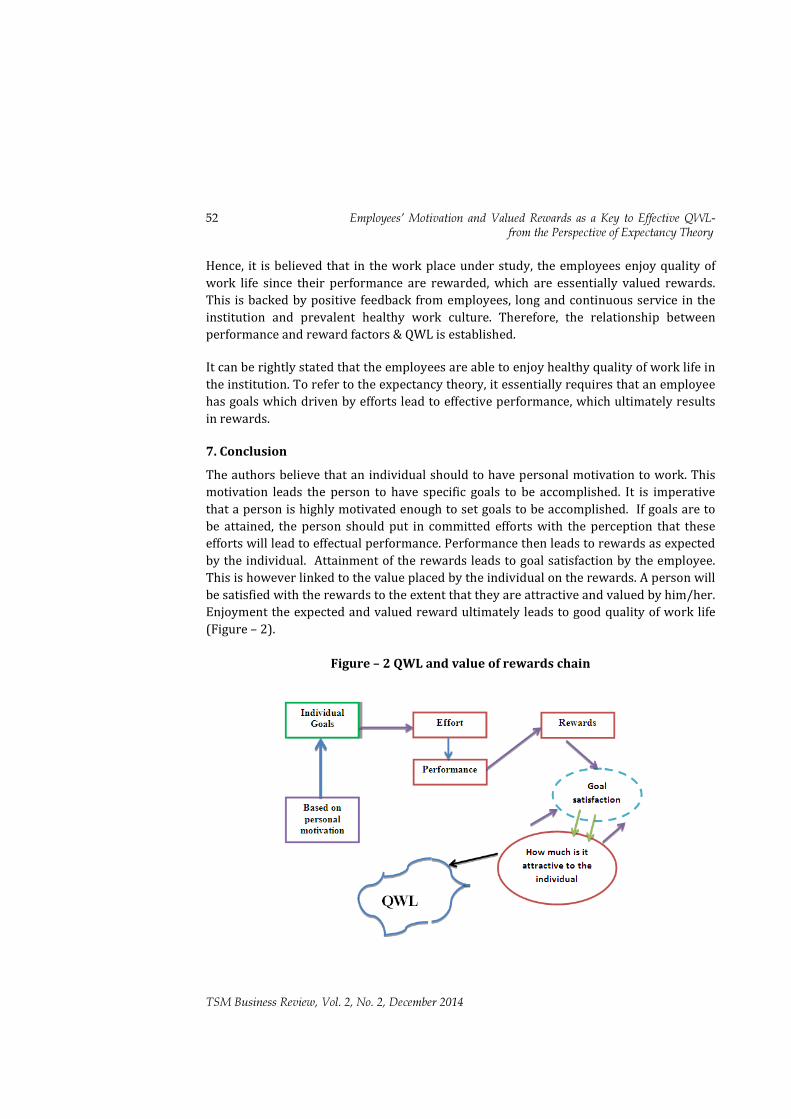
52 Employees’ Motivation and Valued Rewards as a Key to Effective QWL- from the Perspective of Expectancy Theory
TSM Business Review, Vol. 2, No. 2, December 2014
Hence, it is believed that in the work place under study, the employees enjoy quality of work life since their performance are rewarded, which are essentially valued rewards. This is backed by positive feedback from employees, long and continuous service in the institution and prevalent healthy work culture. Therefore, the relationship between performance and reward factors & QWL is established. It can be rightly stated that the employees are able to enjoy healthy quality of work life in the institution. To refer to the expectancy theory, it essentially requires that an employee has goals which driven by efforts lead to effective performance, which ultimately results in rewards. 7. Conclusion The authors believe that an individual should to have personal motivation to work. This motivation leads the person to have specific goals to be accomplished. It is imperative that a person is highly motivated enough to set goals to be accomplished. If goals are to be attained, the person should put in committed efforts with the perception that these efforts will lead to effectual performance. Performance then leads to rewards as expected by the individual. Attainment of the rewards leads to goal satisfaction by the employee. This is however linked to the value placed by the individual on the rewards. A person will be satisfied with the rewards to the extent that they are attractive and valued by him/her. Enjoyment the expected and valued reward ultimately leads to good quality of work life (Figure – 2).
Figure – 2 QWL and value of rewards chain

Employees’ Motivation and Valued Rewards as a Key to Effective QWL- from the Perspective of Expectancy Theory 53
TSM Business Review, Vol. 2, No. 2, December 2014
The authors would like to stress the fact that QWL is a resultant of a motivated employee having specific goals, which is put into action for getting the benefits. Therefore QWL = M x G x E x P x R Where M is motivation, G is goals, E is expectancy, P is performance and R is rewards. Quality of work life can be achieved only if the employee is motivated to set goals that are to be accomplished. He / she must further have the expectancy that the efforts put in for achieving the goals lead to effective performance, and this perceived performance leads to positive rewards. It therefore rests with the employee to derive maximum quality of work life through putting in commendable efforts and setting perceived valued rewards. References Al Muftah., H., & Lafi., H. (2011). Advances in Management & Applied Economics,
vol.1, no.2, 2011, 107-134, International Scientific Press, online website: http://www.scienpress.com/upload/AMAE/Vol%201_2_6.pdf
Cannings, K., & Montmarquette, C. (1991). Managerial momentum: a simultaneous model of the career progress of male and female managers. Industrial and Labor Relations Review, 44, 212-228.
Chaudhary, P. (2014). A Study over Expectancy Theory of Motivation in Small Scale Industries in NCR. International Journal of Research & Development in Technology and Management Science, 21.
Danna, K., & Griffin, R. W. (1999). Health and well-being in the workplace: A review and synthesis of the literature. Journal of Management, 25, 357-384.
Ellis N., & Pompli A. (2002). Quality of working life for nurses. Commonwealth Dept. of Health and Ageing. Canberra.
Gnanayudam, J., & Dharmasiri, A. S. (2007). Quality of Work Life and its influence on organizational commitment: A study of the apparel industry. The Sri Lankan Journal of Management, 12(3&4).
Greenberg, J. (2005). Managing Behaviour in Organizations. (4th edition). Pearson Education, International, New Jersey.
Lawler, E. (1982). Strategies for improving the quality of work life. American Psychologist, 37, 2005, 486-493.
Lewis, D., Brazil, K., Krueger, P., Lohfeld, L., & Tjam, E. (2001). Extrinsic and intrinsic determinants of quality of work life. Leadership in Health Services, 14(2), 9-15
Loscocco, K. A., & Roschelle, A. N. (1991). Influences on the Quality of Work and Nonwork Life: Two Decades in Review. Journal of Vocational Behavior, 39, 182-225.
Mirvis, P. H., & Lawler, E. E. (1984) Accounting for the Quality of Work Life. Journal of Occupational Behavior. 5. 197-212.
Mohla, C. (2011). Importance of QWL with specific references to TCS, Zenith International. Journal of Multidisciplinary Research, 1 (3), 129-138.

54 Employees’ Motivation and Valued Rewards as a Key to Effective QWL- from the Perspective of Expectancy Theory
TSM Business Review, Vol. 2, No. 2, December 2014
Monis, H., & Sreedhara, T. N. (2011). Employee Perceptions of Reward & Recognition Policy A Comparative Study of Indian & Foreign MNC BPO Firms, JM International Journal of Management Research, 122 – 130.
Quality of work life. (2014, August 26). online website: http://www.whatishumanresource.com/quality-of-work-life.
Robbins, S. P. (2003), Organizational Behavior, Prentice Hall, New Jersey. Rollinson, D. (2008). Organisational Behaviour & Analysis – An Interpreted Approach, 4th
Ed, Pearson Education Ltd, England. Saklani, D. R. (2004). Quality of work life in the Indian context: An empirical investigation.
Decision, 31(2), 101-135. Tabassum, A., Rahman, T.,& Jahan, K. (2011).Quality of Work Life among Male and Female
Employees of Private Commercial Banks in Bangladesh. International Journal of Economics and Management, 5(1), 266 – 282.
Tripathy., K. (2006). Study on the Work life of BPO Employees and the various Human Resource Practices in a BPO - A Case Study of Convergys, online website: http://www.indianmba.com/Faculty_Column/FC391/fc391.html
Uzonna, U. R. (2013). Impact of motivation on employees’ performance: A case study of Credit West Bank Cyprus, Journal of Economics and International Finance, 5(5), 199-211.

Article ISSN: 2348-3784
Smita Ghoshal, Research Scholar, Monad University, 4S 501, AWHO Housing Complex Gurjinder Vihar, Sector CHI, Pocket 5, Greater Noida 201308. E-Mail: [email protected]. Phone: 8800614464
Understanding Food Mile: An Qualitative Study on the Concept of Food Mile
Smita Ghoshal
Abstract Food mile is an important topic for debate for developed nations who are against global food supply chain and for organizations who are working on sustainable and environmental issues. This article investigates related literature on the concept of food mile and tries to bring forth a different perspective to the issue in relation to the Indian subcontinent. It talks about the various arguments given by researchers from developed nations against food mile. The article is about how local farmers’ gain can only come at the expense of consumers who will be forced to pay higher prices for similar food items or similar prices for lesser quality food items and how farmers from developing nations are deprived to make their economic condition better if international food trading is given a red signal. A focus group study was also conducted to understand the perception of Indian consumer about food mile concept. The results for this qualitative study was later analysed using Thematic Content Analysis. Keywords: Food mile, Sustainable Development, Life Cycle Assessment 1. Introduction Food miles as a term was first used by the United Kingdom’s SAFE Alliance in 1994 to highlight the environmental and social impacts caused by the increasing distances travelled by food. It is defined as the distance in kilometres or miles that food travels from farm gate to the consumer (Paxton, 1994). Food mile is the distance travelled by a food item from point of production to point of supply and the critics of this concept state that greater the food mile, more harmful it is to the environment due to higher CO2 emission from transportation. Food mile is the distance travelled by a food item from point of production to point of consumption and the associated green house gases with it. The term was apparently first coined in the United Kingdom in the early 1990s, and has been variously attributed to ‘‘The Food Miles Report’’ published by the SAFE Alliance in 1994. Researchers, environmental decision makers and activists are convinced of the importance of ‘food miles’ and use them as an indicator of sustainable development (Pirog and Schuh, 2003; Smith et al., 2005). The campaigners of the food mile concept give various appeals to the customers to buy locally produced food like high quality seasonal food which are locally produced, food which are cheap and provide economic and health benefit. Critics also force the

56 Understanding Food mile: An qualitative study on the concept of Food mile
TSM Business Review, Vol. 2, No. 2, December 2014
customers to consume local food as the source of food production is known, which implies more freshness and hygiene. All these reasons seem to be legitimate by a common consumer and motivate him to personally choose to buy food locally. However, the expected environmental advantages of buying food locally are often based on an improper assessment of the overall sources of greenhouse gas emissions in the food production and distribution process, as well as a misunderstanding of the advantages of geographic specialization. This paper aims to bring forth all the research and the arguments each of the paper presents to support or criticize the food mile concept. 2. Relevant literature During the last four decades, a progressive increase in environmental consciousness has emerged as the environment moved from a fringe, to a mainstream issue (Grant, 2007; Goleman, 2009). A lot of study and research on food mile has been conducted in Europe and North America. This subject has become a hot topic in recent years for government, industry, and environmental and consumer groups. At its core are environmental and social concerns relating to the impact our food choices are having on the environment, a growing interest in the safety, ethics and origins of the food we eat, and spiralling costs in relation to energy usage (Emma Conroy, 2006). In India very little work has been done so far on this issue prior to this research work. 2.1. Defining food mile In their report “The Validity of Food miles as an Indicator of Sustainable Development: Final report”, Paul Watkiss et.al, 2005 define food mile as distance food travels from the farm to consumer. It can also be defined as food mile is the distance travelled by a food item from point of production to point of supply and the critics of this concept state that greater the Food mile, more harmful it is to the environment due to higher CO2 emission from transportation. ‘‘Food miles help make the environmental impacts of long-distance transportation more visible over space and time’’ (Iles, 2005). With increase in globalisation and India being an attractive destination for foreign players, we can see large number of imported food products in Indian retail stores and also Indian agriculture exporting food items to various countries around the world. But this exporting and importing of food can come with a high price; it can be environmentally critical, spoil regional economies, and hamper many aspects of local communities. Reducing food miles may support local farms, reduce dependency on fossil fuels, and help strengthen local economy and create more self-sufficient communities (Govindswamy et.al, 2012). Food mile measurement is a tedious process and sometimes is not only the factor to be taken into consideration while analysing which is better among global & local food. To
Understanding Food mile: An qualitative study on the concept of Food mile 57
TSM Business Review, Vol. 2, No. 2, December 2014
measure the environmental effects of agricultural and food production and consumption, the analysis must take into account off-farm environmental effects. For example, food waste ending up in landfills, in store refrigeration, and the distance food travels from producer to consumer, called ‘food miles’, have implications in terms of energy use and pollutants (Sirieix et.al, 2008) The term “food mile” was first coined by British academic professor Tim Lang in the mid-1990s (Paxton, 1994). According to him greater distance the food item travels to reach the customer, the worse it is for the environment. The total distance is nothing but the total supply chain from farm to plate with short chain like (i) farm to process house (ii) from process house to storage place (iii) from storage place to vendor warehouse and finally to (iv) consumers. Food mile became more widely used towards the end of 1990’s and was being counted as one of the economic agents responsible for increasing environmental concerns. The messages in the media of UK and US campaigned against the long distance foods and gave consumer an easy way to reduce their carbon footprint by avoiding consumption of food items travelling long way, instead consuming local substitutes. Carbon footprint is defined as the emission of GHGs (Green House Gasses). Some articles in UK published articles on food mile and questioned consumer: why buy imported lamb from New Zealand, when one can get a perfectly good substitute in Wales? Similarly question was raised on imported wine from Australia when sourcing is much easier from France and Italy for something similar. The sudden hype and discussion in these parts of the world on Food mile commenced due to commercial advertising, food security and lobbying by environmental groups (Ballingall & Winchester, 2008). Environmental activists, NGOs and Farming Associations were major promoters of food mile in these nations. Advertising campaigns on websites and other promotional tool like print ads and banners were adopted by agricultural producers in Europe and United States, to convey the importance of eating “Local”. Shifting our focus from developed nations, if we come to underdeveloped nations like Africa, we will see that these continents often heavily are dependent on export of primary products coming from faraway places. A reduction in purchases of items from developing countries due to food miles concerns could have a significant detrimental effect on agricultural exports from these countries. Kenya has responded to food miles movements with the ‘Grown under the sun” (http://grownunderthesun.com) campaign, highlighting that Kenyan horticulture uses relatively few energy-intensive inputs compared to European producers (Ballingall & Winchester, 2008). The food mile concept has gained much popularity but it’s not obvious that it’s the only correct measure for environmental sustainability. Many other factors in total contributes to the emission associated with a food item.

58 Understanding Food mile: An qualitative study on the concept of Food mile
TSM Business Review, Vol. 2, No. 2, December 2014
2.2. Measuring food mile Talking about food mile and the environmental impact associated with it is much easier than actually measuring the environmental impact of distribution of food items to the market. Many critics have questioned the relevancy of considering distance as the only factor to measure environmental impact. They have been vocal in stating the distance travelled is not an accurate measure of environmental impact (Smith & McKenzie, 2006). The campaigner of food mile has somewhere forgotten the other factors like driver training, vehicle specification and transport logistics as the greatest influence on fuel efficiency (Whiteing & Murray, 2002) Smith, Stancu & McKenzie (2006) states in their paper, that transport of goods over identical distances will have more or less GHG emissions depending on: • The type of transport • The type of fuel used • Weather condition during transport • Weight load factor • Weather the produce is held at ambient temperature, cooled or chilled • Other operating conditions and storage requirements during transport
The simple formula to calculate or measure emissions from freight is Freight tonnage / distance (tonnage-kilometers) But the above factors should also be considered. Kilometric performance mentioned by Smith et.al is also an apt way to measure freight emissions. They proposed that the first step to measure emissions is to involve identification of all direct and indirect sources of GHG emissions that are considered material i.e including those that are significant as a proportion of total emissions, important to stakeholders and those emissions that can be reduced easily. According to Ballingall & Winchester reducing purchases of imported food will not necessarily reduce GHG emissions. They gave few steps to calculate or measure food mile. • Calculating GHGs emission during product life cycle, including sowing, growing,
harvesting, packaging, storage, transportation and consumption. • Calculate the GHG efficiency of alternative transport modes, while calculating
only distance travelled and associated Green house gas with it. Here we see food mile out of so many stages of product life cycle focuses only on transportation and also ignores the mode of transportation used for the distribution. For example carbon emissions from long haul, air freight are over 100 times larger than from sea freight (DEFRA, 2001&2005 and Mason, 2002).

Understanding Food mile: An qualitative study on the concept of Food mile 59
TSM Business Review, Vol. 2, No. 2, December 2014
As food mile neglects the total product life cycle, several studies highlight it to be an inadequate factor for environmental sustainability measurement. For example DEFRA (2005) notes that it can be more sustainable (in terms of energy) to import tomatoes from Spain than to produce them in heated green houses in the U.K. Similar results have been found by other researchers too. Saunders et.al (2006) also argued that the energy associated with consuming dairy products, lambs, apples and onions from New Zealand is lower than that associated with local equivalent substitute. To support this argument by Saunders, Schlich & Fleissner (2006) presented the fact that energy used in the production phase in New Zealand lamb has lower energy inputs than lamb produced in Germany. Similar results have been obtained even with research on “Flower Miles”. Williams (2006) estimates that carbon emissions associated with importing Kenyan roses in the UK, are almost six times lower than for roses imported from the Netherlands (where roses are artificially heated), even after accounting for emission associated with air freight. Research done to compare the GHGs emission associated with domestic freight and international freight has also confirmed that domestic freights are major contributor. Domestic freight accounts for 82% of vehicle kilometres associated with transporting food consumed in the UK DEFRA (2005). A standard British shopping trip of 6.4 kilometres in a large family to collect 20 kilograms of food uses 25.6 mega joules of energy, the same of energy used to transport 20 kilograms of food over 8500 km by sea (Heyes and Smith 2008). Researches on these factors in India are none and much can be done in coming years. Although this research just aims to understand what will be the affect of distance of food on the purchase pattern and behaviour of Indian consumers. Pretty (2005) compare external environmental costs of sea and air freight with the total cost for consumption of representative food baskets in the U.K. External environmental costs associated with increased carbon emissions from fossil fuel consumption. Total cost on the other hand includes monetary plus environmental cost. The research brought out amazing data to ponder upon. Sea, internal water and air transport account for ‘trivial’ proportion (0.0002 percent) of the total food costs, and just 0.003 percent of total food externalities. On the other hand on farm externalities domestic road transport and household shopping trips account for nearly two-thirds of total food externalities. 2.3. Why is food mile an issue? Food mile talks about the distance a food item travels from farm to plate and it talks about the associated harmful gases emitted during this travel. The environmental activists and local farmers in US and Europe have presented Food mile as an issue to the whole world. They have considered one factor distance to be the most important aspect and have argued that the greater distance a food item travels from its place of origin to its

60 Understanding Food mile: An qualitative study on the concept of Food mile
TSM Business Review, Vol. 2, No. 2, December 2014
place of consumption, greater problem it creates for the environment as more GHGs emissions are due to this travelling. Recent studies have shown that this distance has been steadily increasing over the last fifty years. Studies estimate that processed food in the United States travels over 1,300 miles, and fresh produce travels over 1,500 miles, before being consumed (Holly, 2008). As the climate change patterns have become so apparent in last two decades, the concept of food mile has received an increasing amount of attention. Food mile is an issue and also a method to evaluate the sustainability parameter of global food system in terms of GHGs emission and energy use during transportation. Researchers have also pointed out that food mile is an issue as it affects both producers and consumers. The global food system has changed substantially over the last five decades due to various circumstances including the globalization and centralization of the food industry and the concentration of the food supply onto fewer, larger suppliers. The global food supply chain today is made up of complex, indirect network of a few large, centralized producers, processors, transporters and distributors and various food items now passes through these channels before reaching the consumer. To allure the consumers, these multinational firms source food from outside of regional, state and even national boundaries in order to provide consistent products at low prices to the consumers. Consumer expectation has increased due to development of global food transport. They choose from wide variety of food items all through the year regardless of their original season of growth and location of production. The prices of these products are kept low, which is an additional attraction for the consumers. The ability to enjoy consistent produce and exotic ingredients at all times of the year is a luxury that, according to many food system analysts, has its price. The farther food travels and the longer it takes en route to the consumer, the more freshness declines and the more nutrients are lost. Many fruits and vegetables are engineered for a long shelf life, sacrificing taste and nutrition for preservation. Changes in the food system have resulted in a broad range of social and economic implications, but the present food system also has an environmental cost. The farther food travels, the more fossil fuels are required for transport. The burning of fossil fuels leads to the emission of greenhouse gases, which contribute to global warming (Holly, 2008). Food mile is an issue in the eyes of economists and anti foreign product, according to them large multinational companies gain control over the food industry and small local farmers suffer.

Understanding Food mile: An qualitative study on the concept of Food mile 61
TSM Business Review, Vol. 2, No. 2, December 2014
2.4. Local v/s imported food products While talking about food production, we must understand first the distinction between subsistence agriculture and commercial agriculture. In their economic note, "Will Buying Food Locally Save The Planet?" Montreal Economic Institute, February 2010, Pierre Desrochers, and Hiroko Shimizu stated that “subsistence agriculture was the traditional way of food production where, food is consumed in the community in which it is produced. In this form of agriculture at the end of the growing season food crop is stored and used until the next harvest. Crop failure in this system was managed by domesticated livestock. Recurring famines and starvation are still the part of subsistence agriculture, which is seen mostly in underdeveloped nations and some parts of developing countries. They mentioned that developed nations brought in the commercial agriculture which focused on development of the mass transport of foodstuffs and large scale storage facilities. This system of food production implied reliance on trade with producers in more remote locations. Rising productivity and advancing specialization in this system made people free to develop expertise in other fields”.
The scenario in advanced economies now is that they generally specialise in a few crops and are so technologically sound that they often generate enough surpluses to enter international trade. Modern technologies, better training program to the farmers and full government support helps them to increase their field productivity unlike to food producers in developing and underdeveloped nations. The commercialization of agriculture with huge export and import between nations contributed to a higher standard of living for all the involved parties than would otherwise be the case.
In 2008, Pierre Desrochers and Hiroko Shimizu in their paper “YES, WE HAVE NO BANANAS: A Critique of the “food miles” perspective”; October 2008; mentioned that the most fundamental advocate of the food mile perspective are people who willingly limit their food consumption to items grown or caught within a 100-mile radius of their residences. They highlighted one case in their report were a Canadian couple based in southwest British Columbia took this up as eco-challenge for a year and documented their experiences online and in a book. Their experiment quickly highlighted some fundamental problems with the 100-mile approach: • Locally grown organic products or substitutes for conventional products, in
general, cost more (often significantly more) than conventional products. • Lack of variety and all popular food items could not be produced locally.
In winter, only a very narrow selection of vegetables was available. • The time spent acquiring and preparing food was comparable to holding a
part-time job. And thus it was not an easy task for everyone and thus sophisticated division of labour in form of import was necessary. The experiment illustrates the large and very tangible benefits of trade.

62 Understanding Food mile: An qualitative study on the concept of Food mile
TSM Business Review, Vol. 2, No. 2, December 2014
2.5. What is the meaning of local? Locally produced, marketed and consumed food is called as local food. Developed nations like U.S and U.K have shown recent interest in local food and this somewhere points to the fact that “local” is now being used in new and different ways, and by people and organisations that have previously had no interest in movements that challenged the mainstream food system (Michael & Martinez, 2010). Many campaigns and public discourse have been launched to promote local food. Newspapers, magazine, articles, books, television shows and other electronic media in developed nations have been devoted to local foods and its advocates. The term local has been promoted at the highest levels of government and codified into federal law and regulations (Michael & Martinez, 2010). But among all these, what actually the term “local” means to the consumer? Is it different for different individuals? Can it be standardized? Will consumer motivation, interest and their place of origin, change the definitions of “local food”? Many definitions of local food has been cited in various journals, newspapers, magazine and research papers and in all the definitions following set of demands are fulfilled by a local food item (a) quality and freshness (b) social or environmental sustainability (c) economic well being. Local foods usually are considered the food items produced in close proximity to the consumer. This area may represent an existing or imagined “food shed”- the area from which a locality derives its food supply (Peters et.al 2008). This definition being general in nature is acceptable but other definitions for local food argues on the geographic circumscription and proximity that are relevant for a given location, food product, or individual consumer (Michael & Martinez, 2010). Consumer may have different opinion and attitude about the distance and proximity of food they purchase and what they consider local, but in general food produced and consumed within a 100 mile radius is considered local. Consumers’ exhibit great variation in the distance they consider to be local, and this distance may be different for fresh and processed products (Durham and Roheim, 2009). Some consumers think of local foods as those that come from within certain political boundaries, such as their county, metropolitan area, state, or region. Studies of consumer purchases indicate that state of origin may be a natural geographic definition of local for some consumers (Darby., 2008), and that consumers are willing to pay a premium for in-state products (Giraud, Bond, and Bond, 2005) and products from within the consumers’ county (Schneider and Francis, 2005). State boundaries also fail to capture consumer definitions of local food (Ostrom, 2007). State of origin may only be important for some products (Eastwood, Brooker, and Orr, 1987), and consumers may use regional definitions of local that cross state boundaries (Brown, 2003). In a survey of 120 food shoppers yielded 140 unique responses to an

Understanding Food mile: An qualitative study on the concept of Food mile 63
TSM Business Review, Vol. 2, No. 2, December 2014
open-ended question of the definition of local foods; only 3% of respondents identified state, county or community boundaries as the relevant local geography (Wilkins, Bowdish, and Sobal, 2002). A definition of local in which products are produced within a certain distance of where they are marketed may be thought to reduce transportation distances and thus transportation fuel use and emissions (Michael & Martinez, 2010). Thus different definitions of local are stated according to the required demand of the market and the attitude of the consumer. 3. Analysis With the relevant literature and arguments from researchers around the world, various problem areas of this food mile perspective can be seen, which if taken care can give a whole new dimension to the discussion all round the globe on this sustainability issue. Problem areas in the Food-Mile Perspective The problematic areas in this concept and whole food-mile perspective are: • Food mile Ignores productivity differentials between geographical locations: Food
mile campaigners assume that producing a given food item requires the same amount of inputs independently of where and how it is produced. For example India is the leading exporter of the Basmati Rice to the global market. Now the production of basmati in India is under ideal condition with much more intensive and efficient use of fuel, capital, machinery and other resources than any other part of the world. The country has exported 31,78,174.42 MT of Basmati Rice to the world for the worth of Rs. 15,449.61croresduring the year 2011-12 and the country has exported 39,97,719.57 MT of non-basmati rice to the world for the worth of Rs. 8,659.13 crores during the year 2011-12. Major export destinations for non basmati rice are Nigeria, Senegal, cote d ivoire, Indonesia and United Arab Emirates.
• Food mile does not consider the whole life cycle of food production: Food mile
concept does not consider the whole life cycle of a food item. This drawback of food mile concept has been highlighted by researchers working on Life cycle Assessment of a product. Life cycle assessment (LCA) is the systematic analysis of the environmental impact of products during their entire life cycle. It comprises of all the phases of product’s life cycle including production, use and disposal phases and all through the phases the environmental impacts are evaluated throughout. The LCA of a food item can be diagrammatically shown as in below:
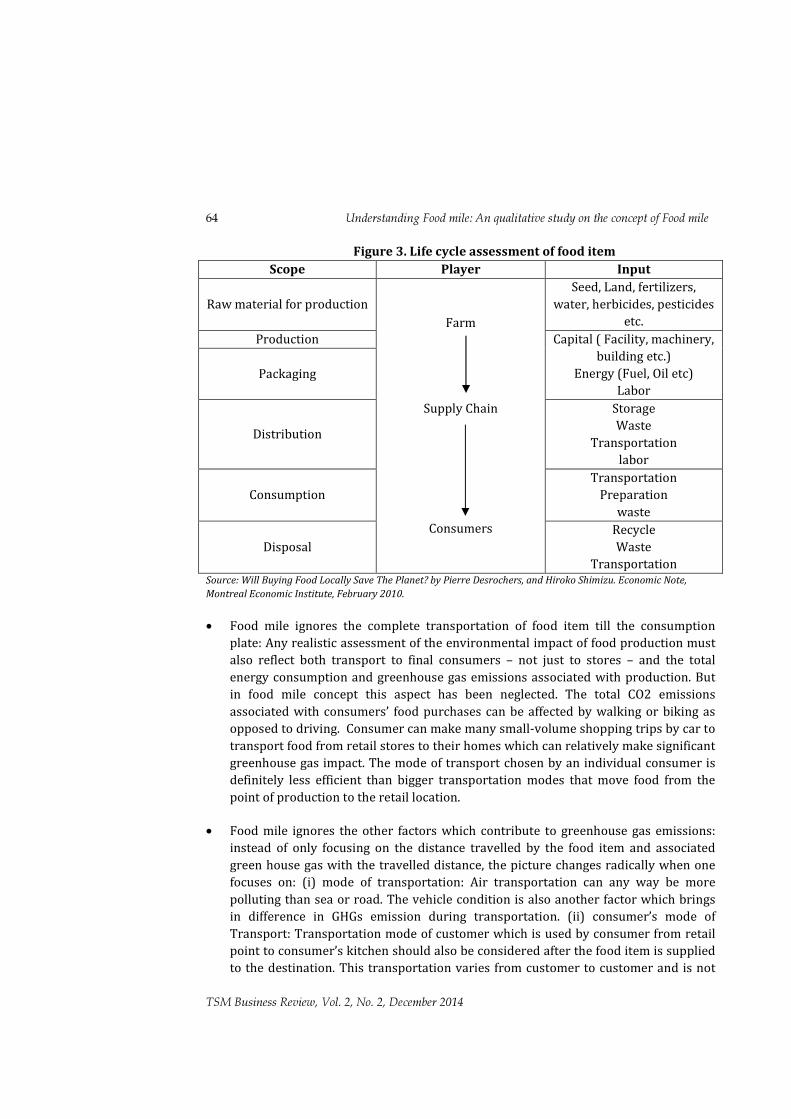
64 Understanding Food mile: An qualitative study on the concept of Food mile
TSM Business Review, Vol. 2, No. 2, December 2014
Figure 3. Life cycle assessment of food item Scope Player Input
Raw material for production Farm
Supply Chain
Consumers
Seed, Land, fertilizers, water, herbicides, pesticides
etc. Production Capital ( Facility, machinery,
building etc.) Energy (Fuel, Oil etc)
Labor Packaging
Distribution Storage Waste
Transportation labor
Consumption Transportation
Preparation waste
Disposal Recycle Waste
Transportation Source: Will Buying Food Locally Save The Planet? by Pierre Desrochers, and Hiroko Shimizu. Economic Note, Montreal Economic Institute, February 2010. • Food mile ignores the complete transportation of food item till the consumption
plate: Any realistic assessment of the environmental impact of food production must also reflect both transport to final consumers – not just to stores – and the total energy consumption and greenhouse gas emissions associated with production. But in food mile concept this aspect has been neglected. The total CO2 emissions associated with consumers’ food purchases can be affected by walking or biking as opposed to driving. Consumer can make many small-volume shopping trips by car to transport food from retail stores to their homes which can relatively make significant greenhouse gas impact. The mode of transport chosen by an individual consumer is definitely less efficient than bigger transportation modes that move food from the point of production to the retail location.
• Food mile ignores the other factors which contribute to greenhouse gas emissions:
instead of only focusing on the distance travelled by the food item and associated green house gas with the travelled distance, the picture changes radically when one focuses on: (i) mode of transportation: Air transportation can any way be more polluting than sea or road. The vehicle condition is also another factor which brings in difference in GHGs emission during transportation. (ii) consumer’s mode of Transport: Transportation mode of customer which is used by consumer from retail point to consumer’s kitchen should also be considered after the food item is supplied to the destination. This transportation varies from customer to customer and is not

Understanding Food mile: An qualitative study on the concept of Food mile 65
TSM Business Review, Vol. 2, No. 2, December 2014
scrutinized or questioned. Research shows frequent use of cars in a week by a customer to bring daily grocery from a nearby store to his house. (iii) Green house gas emission during production stage: The most energy-intensive segments of the agricultural production chain are instead related to the production stage (fertilizers, pesticides, irrigation, energy required to power machinery, etc.). In their report, Alison Smith et al., The Validity of Food miles as an Indicator of Sustainable Development, Report ED50254, Issue 7, July 2005 mentioned that in USA, in a study on food mile 11% of greenhouse gas emissions related to food were from the transportation segment as a whole, while 83% came from the production stage (Table 3.1).
Table 3.1: Various food products and their associated GHGs emission
Crop/Animal Product
GHG Emission (g Kg-1) CH4 N2O CO2 GWP(CO2 eq)
Wheat 0.0 0.3 45.0 119.5 Rice 43.0 0.2 75.0 1221.3 Rice Basmati 0.0 0.3 82.5 1515.4 Pulse 0.0 0.8 83.3 306.8 Potato 0.0 0.1 10.0 24.9 Cauliflower 0.0 0.1 13.3 28.2 Brinjal 0.0 0.1 12.5 31.1 Oilseed 0.0 1.3 50.0 422.5 Poultry Meat 0.0 2.7 50.0 846.5 Mutton 482.5 0.0 0.0 12062.7 Egg 0.0 2.0 1.0 588.4 Milk 29.2 0.0 0.0 729.2 Banana 0.0 0.2 10.0 71.6 Apple 0.0 1.0 41.7 331.4 Spice 0.0 2.5 100.0 845.0 Fish 25.0 0.3 18.8 718.3 Source: calculated from Bhatia et.al (2004), NATCOM(2004), Chabra et.al (2009), Pathak et.al(2009b)
• GHGs emitted per unit of food item exported: To be clearer, the point of discussion
here is whether only the quantity of GHGs emitted should be taken into consideration or should the no of units or the volume of food item transported and the GHGs associated with it should also be a part of the whole discussion. For example, let us see a hypothetical situation given below ( it’s an assumption not a fact). Now what can be inferred from here is that in this situation, distance travelled is not area of focus but how much green house gas emission is associated with the quantity of food item supplied from point A to point B because according to FAO the consumption need is increasing and to meet the growing demand, food agriculture trade between far-off countries becomes mandatory.

66 Understanding Food mile: An qualitative study on the concept of Food mile
TSM Business Review, Vol. 2, No. 2, December 2014
Table 3.2: Hypothetical assumption to show why distance should not be considered as the primary factor for green house gas emission in food transport
Sl.No Food Item
Production Location
Supply Location
Metric tonne GHGs emitted
during transportation
Quantity of food item
transported in quintals
(Q)
GHGs/Q
1. Rice Texas, USA USA 100 10 10
2. Rice West
Bengal, India
USA 250 100 2.5
4. Methodology The qualitative and interpretive approaches to studying consumption pattern of consumers have played an increasing role (Beckmann and Elliott, 2001). Many of the earlier researches show that to gain more information and insight on perception about food mile and consumption pattern, qualitative research is more suitable than simple polling. First focus group interviews with 6 people were conducted in September 2014. Interactions between participants allowed the researcher to explore consumers’ motives and barriers related to food coming from far away, and to reveal consensus or diversity of opinions amongst the participants. The study with the focus group : The 8 participants of the focus group were faculties from department of Environmental science (2), Agriculture (2) and Economics (4) from universities located in NCR, India. The invitation was given to 15 faculties through personal email out of which 8 accepted the invitation. The discussion was for two hours thirty minutes and the procedures to conduct the focus group study were similar as in the study conducted in France by Sirieix (2006). In the study by Sirieix (2006) the two product chosen were bottled imported water from Fiji and salt from Himalaya. The researcher argued the products were chosen because of neither seasonal bias nor other availability issues. But in this study water was chosen, not because of the reason stated by previous researchers, but because imported bottled water in India like developed countries is becoming more and more a fashionable lifestyle product. In the metro cities we can even buy the famous brands of Italian and French mineral water and thus “Perrier” was chosen as the first product in the focus group study. Furthermore, water by its very nature and in comparison with other food products, present several methodological advantages: absence of intolerance or allergies, daily consumption, no ‘freshness’ and conservation concern, reduced variability of production methods and of use and preparation (Sirieix, 2006). The purpose of presenting the group
Understanding Food mile: An qualitative study on the concept of Food mile 67
TSM Business Review, Vol. 2, No. 2, December 2014
with imported water was to know their perception in regards to items travelling such a long distance and to know their general perception about imported items. The process implemented with focus group is indicated in table 1. The participants were not disclosed about the topic “Food Mile” in the beginning of the discussion and were introduced to the topic at the last hour of discussion unlike to the research by Sirieix (2006) as the objective of the paper was also to find difference of opinion on food mile by consumers of developed and developing countries. The group members were asked to write on few open questions about food Mile & developing country like India and the product shown (e.g. Do you think that food mile is a relevant to Indian subcontinent? Why or why not?) The notes taken by the interviewer was later transcript using thematic content analysis (TCA) (Boyatzis, 1998; Krippendorff, 2004). TCA is the most foundational of qualitative analytic procedures and in some way informs all qualitative methods (Anderson, 2007). 5. Major Findings The 8 member focus group analysed the data with the use of Thematic Content Analysis and three major themes were identified:
• Influence of imported food • Positive and negative influence of distance • Complexity of Food supply Chain
Indian consumers are heavily influenced by imported food, and are bringing its use more in their daily dietary habits. The study of focus group showed that the consumption of imported food is low but growing.. Increased use of imported food was reasoned for increased urbanization, growing income, influence of media on lifestyle, increased influence of western culture and working women. Food products from western companies in every organised retail store and these items slowly occupying the shelves at unorganised retail, also is a major factor today, which have influenced the Indian customer for imported food product. Experimenting nature of Indians was also discussed in the group as a reason for intake of imported food item in various metros of India. In overall judging food consumption pattern, distance is perceived to have both negative and positive feature. The study revealed that the distance associated with imported food items was considered more as an exotic food product. Phrases like “better production technique in developed nation”, “exclusive food item as it comes from far off place”, “not available in local market makes it special product”, “they are distinctive” etc. highlights the positive connotation of distance. Few group members were concerned about environmental and freshness issue due to long distance, (“how fresh is the food product, that is the question”, “what about the environmental cost and economic cost associated with these products”, “what about the food security issues?”) but the positive features outweighed the negative feature. Some members did point out that there is no valid reason for importing bottled water as water is available in plenty in India (“why should we import water, it isn’t a scarce resource?”). Thus we see, distance in positive

68 Understanding Food mile: An qualitative study on the concept of Food mile
TSM Business Review, Vol. 2, No. 2, December 2014
connotation is pure emotion whereas negative feature of distance is more of moral reasoning. Complexity of food supply chain for imported food products is a known factor in purchase process. The focus group study showed that distance does not reveal the production process and the associated GHGs emission. The members of the focus group were aware about the issues of food security, local farmer’s livelihood issues, fair trade practices and environmental and social conditions for food production both in developed and developing nations. The focus group discussions lead to a more sensitive issue of fair trade than the transport issue and its associated environmental effect, "longer supply chain is an issue, but what about food export to places with inadequate food production". Another angle to this discussion was, "will export of food product will bring inadequacy in local supply". The discussion brought in the negative feature about longer supply chain, imported food product and sustainable food chain. 6. Conclusion One can talk about the benefits of local production as very fresh produce, platform to socialize with neighbours and have an evening or morning with spouse or grand children but saving the planet, or improving the local economy, are definitely not the benefits of this economy as brought out by the focus group discussion. Food mile concept does not consider the whole life cycle of a food item, the production process and other activity involved in food supply beside transportation. This drawback of food mile concept has been highlighted by researchers working on Life cycle Assessment of a product and also pointed out in the discussion. Missing from this perspective, however, is the fact that, if imposed by political intervention, local farmers’ gains can only come at the expense of consumers who will be forced to pay higher prices for similar food items, or similar prices for lesser quality food items. The end result of such policies is the local economy is made worse off overall and farmers from developing nations are deprived to make their economic condition better. In a modern economy, people specialize in what they do best and trade with one another. This ensures both lower prices and a greater variety and year-round supply of goods. The idea is not to stop trading and turning backward towards the traditional method of farming and consumption but trying to feed the growing world population in a sustainable manner through agricultural free trade. This kind of free trade should insure that food is produced the most efficiently in the most suitable locations, with optimum utilization of required inputs in the whole process of production and not just transportation of food item from origin to plate. This will create more wealth and a better environment for everyone.
Understanding Food mile: An qualitative study on the concept of Food mile 69
TSM Business Review, Vol. 2, No. 2, December 2014
References Beckmann, S. & Elliott, R. (ED) (2001) Interpretive Consumer Research. Copenhagen
Business School Press, Copenhagen. Ballingall. J & Winchester .N, (2008), Food miles: Starving the poor? Business School press,
University of Otago. Brown, C. (2003). Consumers’ preferences for locally produced food: A study in southeast
Missouri, American Journal of Alternative Agriculture. Braun, V., & Clarke, V. (2006) Using thematic analysis in psychology Qualitative Research in
Psychology. Boyatzis, R. E. (1998) Transforming Qualitative Information: Thematic Analysis and Code
Development. Sage, Thousand Oaks, CA. Coyle M, Whiteing, A. E & Murray, W. (2002), Fuel Saving Interventions: Facts and Fiction,
Transport and logistics Research Unit, University of Huddersfield. Durham, C. A., King, R. P., & Roheim, C. A. (2009). Consumer definitions of ‘locally grown’
for fresh fruits and vegetables. Journal of Food Distribution Research, March. Darby, K., Batte, M. T., Ernst, S., & Roe, B. (2008). Decomposing local: A conjoint analysis of
locally produced foods. American Journal of Agricultural Economics. Emma C., (2006). The Food miles Challenge: How Consumers and Retailers in the UK are
Responding. Eastwood, D. B., Brooker, J. R., & Orr, R. H. (1987). Consumer preferences for local versus
out-of-state grown selected fresh produce: The case of Knoxville, Tennessee. Southern Journal of Agricultural Economics.
Govindasamya, R., Pudurib, V., Kelleyc, M. K. & Simond, J. (2010). Increased Purchases of Locally Grown Ethnic Greens and Herbs due to Concerns about Food miles. FDRS, Journal of Food Distribution Research, 43(3).
Goleman, D. (2009). Ecological Intelligence, Broadway Books, New York, NY. Grant, J. (2007). Green Marketing Manifesto, John Wiley & Sons, New York, NY. Giraud, K. L., Bond, C. A., & Bond, J. J. (2005). Consumer preferences for locally made
specialty food products across northern New England. Agricultural and Resource Economics Review.
Holly, H. (2008). Food miles: Background and Marketing", NCAT Research, ATTRA-National Sustainable Agriculture Information Service.
Iles, A. (2005). Learning in sustainable agriculture: food miles and missing objects, Environmental Values.
Kissinger, M. (2012), International trade related food miles – The case of Canada,Food Policy.
Krippendorff, K. (2004) Content Analysis: An Introduction to Its Methodology. Sage, Thousand Oaks, CA.
Lieblein, G., Francis, C. A. & Torjusen, H. (2001) Future interconnections among ecological farmers, processors, marketers, and consumers in Hedmark County, Norway: creating shared vision. Human Ecology Review.
70 Understanding Food mile: An qualitative study on the concept of Food mile
TSM Business Review, Vol. 2, No. 2, December 2014
Morgan & Krueger. (1993). When to use focus groups and why: In Successful Focus Groups: Advancing the State of the Art (ed. by D.L.Morgan), Sage Publications, Newbury Park, CA.
Mason R., Simons, D., Peckham, C. & Wakeman, T. (2002). Life cycle modelling CO2 emissions for lettuce, apples and cherries” [online], report to UK ministry of Transport.
Ostrom, M. (2007). Everyday meanings of ‘local food’: Views from home and field. Community Development.
Paxton, A. (1994). The Food Miles Report: The Dangers of Long Distance Food Transport. The SAFE Alliance, London.
Pirog, R. & Schuh, P. (2003). The road less travelled: examining the potential of using food miles and CO2 emissions in eco-labels.
Pierre, D. & Hiroko, S. (2008). Yes, We Have No Bananas: A Critique of the “Food miles” Perspective. Policy Primer, Mercatus Center at George Mason University
Pierre, D. & Hiroko, S. (2010) Will Buying Food Locally Save The Planet? Montreal Economic Institute.
Paxton, A. (1994), The food miles report: The dangers of long distance food transport, London: Safe Alliance.
Pretty, J. N., Ball, A. S., Lang, T. & Morison, J. I. L. (2005), Farm costs and food miles: An assessment of the full cost of the UK weekly food basket.
Peters, C. J., Bills, N. L., Wilkins, J. L., & Fick, G. W. (2008). Foodshed analysis and its relevance to sustainability. Renewable Agriculture and Food Systems.
Rosemarie, A. (2007) Thematic Content Analysis (TCA) 1 Descriptive Presentation of Qualitative Data, Study material, Institute of Transpersonal Psychology, Palo Alto, CA.
SAFE Alliance (1994), The Food miles Report: The dangers of long distance food transport. Schneider, M. L., & Francis, C. A. (2005). Marketing locally produced foods: Consumer and
farmer opinions in Washington County, Nebraska. Renewable Agriculture and Food Systems.
Smith, A., Watkiss, P., Tewddle, G., McKinnon, A., Browne, M., Hunt, A., Trevelen, C., Nash, C. & Cross, S. (2005) The Validity of Food miles as an Indicator of Sustainable Development. DEFRA, London.
Sirieix, L., Persillet, V. & Alessandrin, A. (2006) Consumers and organic food in France: a means-end chain study. In Sociological Perspectives of Organic Agriculture.
Wilkins, J. L., Bowdish, E., & Sobal, J. (2002). Consumer perceptions of seasonal and local foods: A study in a U.S. community. Ecology of Food and Nutrition.

Article ISSN: 2348-3784
Dr. S. Pushparaj, Department of Econometrics, School of Economics, Madurai Kamaraj University, Madurai, Tamilnadu, India. E-Mail: [email protected] Phone: +91 9488678678. (Corresponding Author) Dr. Vidya Suresh, Thiagarajar School of Management, Madurai-625005, Tamilnadu, India. E-Mail- [email protected] Phone: +919750420360
Does a Speculative Trade in Food Commodities Influence Food Price Inflation in India?
S. Pushparaj and Vidya Suresh
Abstract Inflation, especially the food inflation has become a major economic challenge for the public policy in the contemporary India. Inflation pressure on food products is caused by interplay of multiple factors. The literature has identified various sources of food price inflation that included institutional factors, market conditions and institutional arrangements. The effect of institutional arrangements like speculative trade in commodity on the inflation is studied in many studies. Yet similar studies have not been attempted in the Indian context though the speculative trade is permitted in commodities from 2003 onwards. This paper analyses the relationship between wholesale food price index and trading on agricultural commodities in Multi-Commodity Exchange of India (MCX) using the monthly data between 2004 and 2014 from CSO and MCX respectively. The researchers have used time series analysis to draw conclusions from the study which indicates that there is no influence of trading on food commodity futures on wholesale price indices. However, the trading in MCX is influenced by fluctuations in wholesale price indices which may have implications for the future of food commodities prices in India.
1. Introduction In economic terms, inflation is a sustained rise in the general level of prices. Higher degree of inflation is a source of greater uncertainty that would dampen economic performance and distort economic decisions viz., investment and consumption decisions which would eventually undermine economic growth. Inflation by its very nature redistributes income and wealth of all the factors of production in asymmetric proportions. At the individual level, inflation may lower standard of living through increased cost of living and so would erode public faith in the reliability of social and political system. Though price inflation has been discussed commonly at the aggregate level, in the present context, price inflation among food commodities assumes special significance. In this paper, the first section discusses the measurement and causes of food price inflation in India that include the speculative trade in food items. The second section elaborates the methodology adopted to trace the link between the speculative trade and the food price. Third section presents the results and last section provides the conclusion.

72 Does a Speculative Trade in Food Commodities Influence Food Price Inflation in India?
TSM Business Review, Vol. 2, No. 2, December 2014
In practice, inflation is measured as a rise in general level of prices of goods and services in an economy over a period of time. Inflation is usually measured as a growth of price indices1. A price index reflects the overall change in a set of prices paid by a broad group of consumers or producers. In India three major national indices are used for measuring inflation or price levels. They are (a) The Wholesale Price Index (base 1993-94) which is considered as the headline inflation indicator in India; (b) In addition to Whole Price Index (WPI), there are four different consumer price indices which are used to assess the inflation for different sections of the labor force; and (c) In addition to the above indices, the GDP deflator is available for the economy as a whole for different sectors on a quarterly basis. However, there are two categories of price indices for measuring inflation i.e. consumer prices and wholesale prices. Firstly, the CPI measures price change from the perspective of the retail buyer. It reflects the actual inflation that is borne by the individual or the end user. CPI is designed to measure changes over time in the level of retail prices of selected goods and services on which consumers of a defined group spend their incomes2. According to which four series of indices are defined. The four CPIs reflect the effect of price fluctuations of various goods and services consumed by specific segments of population in the country. Central Statistics Office (CSO) of the Ministry of Statistics and Program Implementation has started compiling a new series of CPI from 20123. Old or new, the Consumer Price Index provides a consumer wise price indices but the commodity-wise break up of price index is not provided. Secondly, the Wholesale Price Index (WPI) is the widely used inflation indicator in India by Government, banks, industry and business circles as it captures price movements in a most comprehensive way. The data is compiled by Central Statistical Organisation database with 2004-05 as a base year. Key monetary and fiscal policy changes are linked to WPI movements and these are used since 1939 besides being published since 1947 regularly. Inflation in India is the percentage change in the value of the Wholesale Price Index (WPI) on a year-on-year basis. WPI is used to measure the variation in the prices of basket of goods and services for a year. The WPI has a basket of 676 items with category wise price indices breakup. The WPI index system includes index numbers for food items. Using this index the food inflation is computed.
1 For month-wise data, inflation is calculated using the below formula, Inflation=
(WPIt –WPIt-12) WPIt-12
x 100
2 The four CPIs include (1) Industrial Workers (IW) (base 2001); (2) Agricultural Labourer (AL) (base 1986-87) ; (3) Rural Labourer (RL) (base 1986-87) ; (4) Urban Non-Manual Employees (UNME) (base 1984-85).
3 The New CPI include (a) CPI for the entire urban population viz CPI (Urban); (b) CPI for the entire rural population viz CPI (Rural) and (c) Consolidated CPI for Urban + Rural will also be compiled based on above two CPIs.
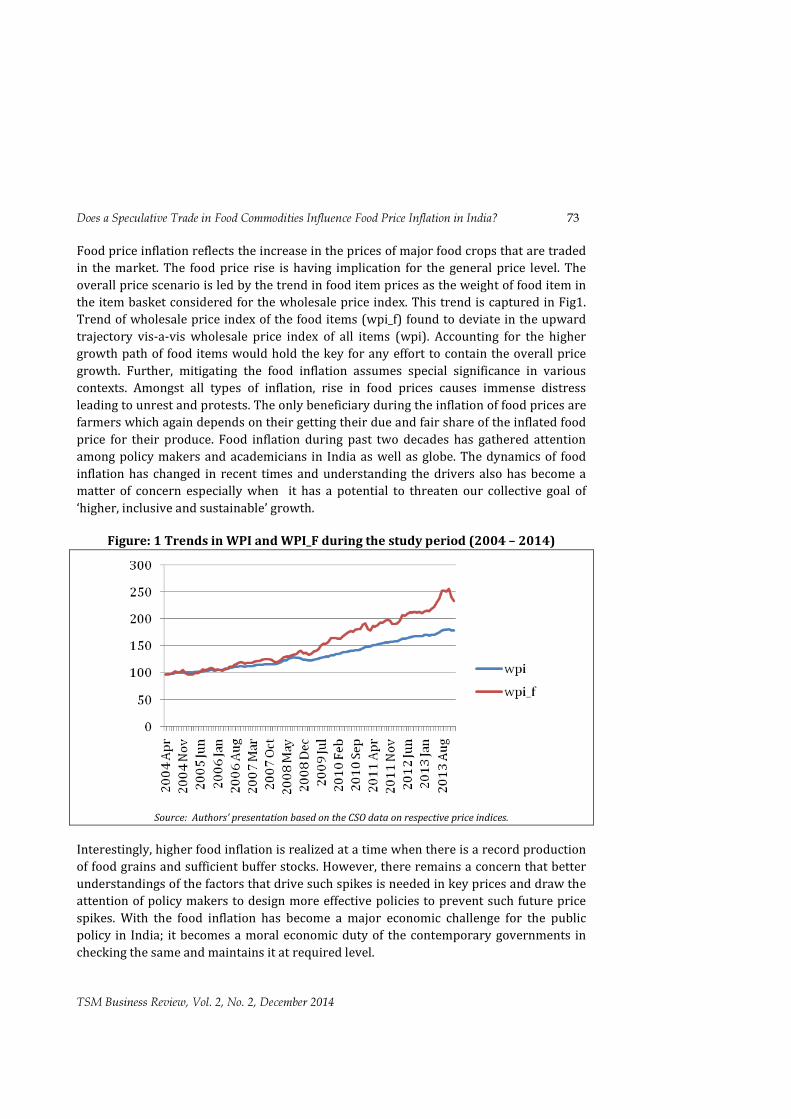
Does a Speculative Trade in Food Commodities Influence Food Price Inflation in India? 73
TSM Business Review, Vol. 2, No. 2, December 2014
Food price inflation reflects the increase in the prices of major food crops that are traded in the market. The food price rise is having implication for the general price level. The overall price scenario is led by the trend in food item prices as the weight of food item in the item basket considered for the wholesale price index. This trend is captured in Fig1. Trend of wholesale price index of the food items (wpi_f) found to deviate in the upward trajectory vis-a-vis wholesale price index of all items (wpi). Accounting for the higher growth path of food items would hold the key for any effort to contain the overall price growth. Further, mitigating the food inflation assumes special significance in various contexts. Amongst all types of inflation, rise in food prices causes immense distress leading to unrest and protests. The only beneficiary during the inflation of food prices are farmers which again depends on their getting their due and fair share of the inflated food price for their produce. Food inflation during past two decades has gathered attention among policy makers and academicians in India as well as globe. The dynamics of food inflation has changed in recent times and understanding the drivers also has become a matter of concern especially when it has a potential to threaten our collective goal of ‘higher, inclusive and sustainable’ growth.
Figure: 1 Trends in WPI and WPI_F during the study period (2004 – 2014)
Source: Authors’ presentation based on the CSO data on respective price indices.
Interestingly, higher food inflation is realized at a time when there is a record production of food grains and sufficient buffer stocks. However, there remains a concern that better understandings of the factors that drive such spikes is needed in key prices and draw the attention of policy makers to design more effective policies to prevent such future price spikes. With the food inflation has become a major economic challenge for the public policy in India; it becomes a moral economic duty of the contemporary governments in checking the same and maintains it at required level.

74 Does a Speculative Trade in Food Commodities Influence Food Price Inflation in India?
TSM Business Review, Vol. 2, No. 2, December 2014
1.1 Reasons for food inflation In the literature, there has been lot of discussion about various causes of inflation in India. It has discussed broad range of reasons that caused inflationary trends. The market agents that caused such movements may be classified into supply, demand and other institutional factors. The supply factors were held responsible for the price rise in the following studies. RBI (2010) in its annual report 2009-10, has a discussed the price situation in India. The study has noted that the per capita daily net availability of food grains has declined considerably. The study reasoned the supply shortage in food grains as the primary reason for the food price increase during 1990-2010. Chand (2010) studied the nature and causes of food inflation. The study observed that the low growth of food grain production in the preceding years and the drought in 2009 contributed mainly to to a surge in food prices in 2010. World Bank (2010) in its study South Asia Economic Update 2010: Moving Up, Looking East, presented various economic challenges faced by south Asian nations. The study reported that the rise in food prices in India was the result of lagged effects of higher food prices in preceding years in the global markets and a severe drought in 2009. The drought resulted in reduced crop-sown area during July to September 2009. The Kharif (summer crop) season area sown under paddy and oilseeds in 2009 was lower than in 2008. Kharif food grain production in 2009–10 fell by 15 percent, whereas domestic demand for food raised, thus driving food prices higher. Sharma (2011) analyzed the various factors influencing the prices of Onions, an important food crop in India. The study found that rise in prices of onion is due to the decline in Kharif production resulted from unseasonal rains at harvest time. Some studies have held demand factors responsible for the food price inflation. For instance, Landes (2007) has analysed the various phases of Indian agricultural policy and placed such policies in their context. In this pursuit the study has found that rapid economic growth and urbanization has raised per capita income in the post liberalization period. The faster growth in per capita incomes has stimulated demand growth for fruits, vegetables, fats and oils and animal products. These developments have not attracted sufficient focus on change in agricultural policy and supply response. The study has concluded that this resulted in food inflation in India. Gokarn (2010) studied the food price inflation in the context of changing house hold demand pattern. The study observed that there was an increased demand for key sources of protein namely viz., pulses, milk, eggs, meat and fish across India. Income elasticity of demand for protein rich food, a sign of affluence resulted from the affordability. The supply was not sufficient to cope up with the demand shift which resulted in the food price inflation in India. DBS Group Research (2011) assessed the food inflation scenario. The study has shown that the food inflation was driven to a greater extent by relative change in dietary pattern. A structural shift in dietary pattern was shown to cause a demand shift and food inflation, as there was a mute supply response. RBI (2011) has discussed about the India food inflation trends in its annual report. The report has found that there has been a structural change in food

Does a Speculative Trade in Food Commodities Influence Food Price Inflation in India? 75
TSM Business Review, Vol. 2, No. 2, December 2014
consumption pattern favoring protein rich food items while the share of cereals in food has declined. The demand shift was largely attributed to rising income level. This amounted to a demand for protein rich items viz., meat, fish, eggs, fruits and vegetables had raised faster than its supply. The structural imbalance of this kind has created food inflation, the study observed. Mohanty (2011) studied the changed in inflation dynamics in India. The study suggested that the persistence of protein inflation has changed the inflation dynamics in the latter half of the 2000s. Protein items inflation was significant and was markedly higher for milk. This inflation was considered as a consequence of rising affluence resulting in the dietary habits and higher demand for protein items, in absence of adequate supply response, and was further accentuated by renewed global food price shock during 2010–11. The institutional arrangements are also found to cause inflation in some studies. Mitra (2008) studied the crop specific causes for the global food price inflation. The study has found there was a steady rise in the rice eating population in India accompanied by a dramatic rice crop failure in 2002 has left the food stocks depleted. The failure to recover food stocks have lag effects on the supply side and abetted the rice price inflation. Mitra and Josling (2009) has analyzed the implications of agricultural export restrictions. The study discussed the structural problems relating to Public distribution systems like problems of corruption, theft, lack of accessibility of rural population in the context of food security. The study has concluded that the failure of demand management mechanism like PDS in India as primary reason for food price inflation in India. Singh and Blanc (2009) used Monte Carlo simulation technique to examine the impact of trade policy on global rice prices in different policy scenarios. The study analyzed the impact on rice prices given the export/import restrictions. The study had found that the international rice price rises when India imposes trade restriction at the same time the study established that the world rice price stabilized when India allowed free trade. The study has inferred India’s intervention in the rice market March 2008 drove up world prices. Iqbal and Van Der Merwe (2010) analysed the various aspects of food crisis and examined the trends in production, procurement and availability of state wise food grains. The study has found that the ineffective and inefficient marketing strategies lack of adequate storage facilities and black marketeering or hording as India is prone to uncertain weather. Further some of the studies have found that the speculation in commodity futures market as cause of food price inflation in the international context (Cooke and Robles 2009; Robles, Torero and von Braun 2009; Hernandez and Torero 2010). In the Indian context, Sahi (2006) analysed the effect of futures trading on the spot price volatility. The study found the destabilizing effect of futures trading on agricultural commodity markets. It is observed that futures trading volumes were found to have a significant unidirectional causal effect on spot price volatility in major agricultural commodities except raw cotton. IIMB (2008) studied the impact of futures trading in some select agricultural commodities. This study found that that inflation increased in some commodities after
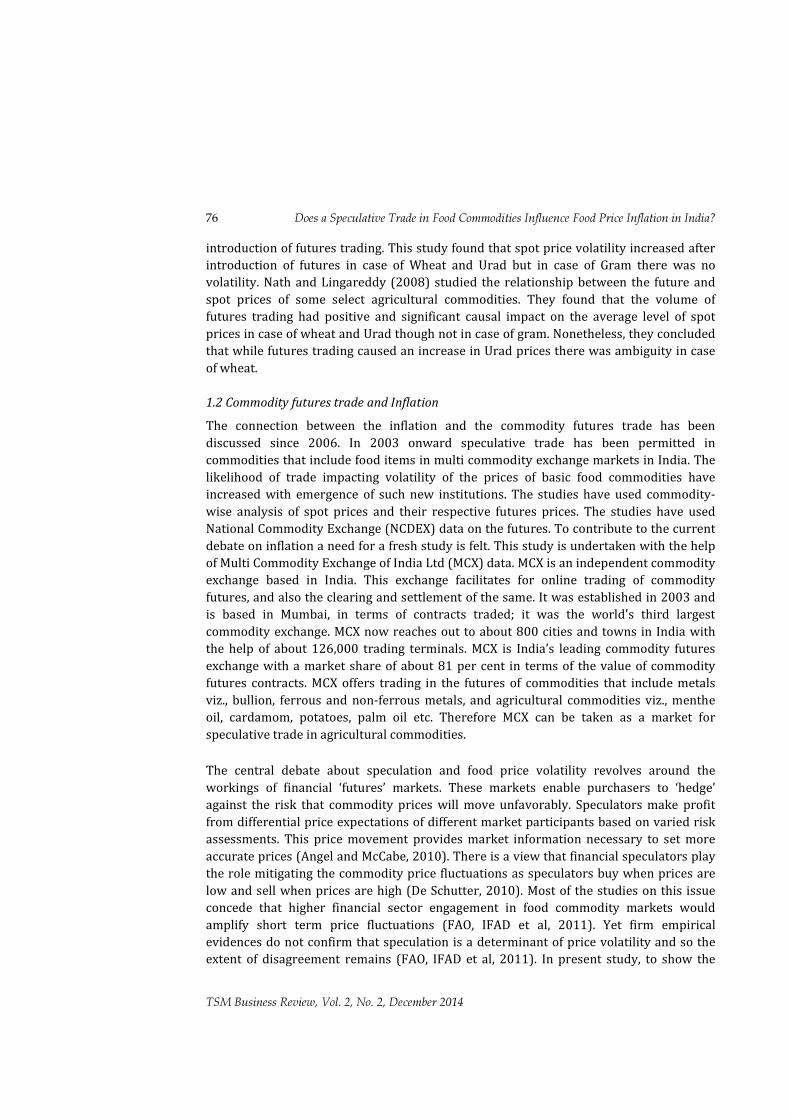
76 Does a Speculative Trade in Food Commodities Influence Food Price Inflation in India?
TSM Business Review, Vol. 2, No. 2, December 2014
introduction of futures trading. This study found that spot price volatility increased after introduction of futures in case of Wheat and Urad but in case of Gram there was no volatility. Nath and Lingareddy (2008) studied the relationship between the future and spot prices of some select agricultural commodities. They found that the volume of futures trading had positive and significant causal impact on the average level of spot prices in case of wheat and Urad though not in case of gram. Nonetheless, they concluded that while futures trading caused an increase in Urad prices there was ambiguity in case of wheat. 1.2 Commodity futures trade and Inflation The connection between the inflation and the commodity futures trade has been discussed since 2006. In 2003 onward speculative trade has been permitted in commodities that include food items in multi commodity exchange markets in India. The likelihood of trade impacting volatility of the prices of basic food commodities have increased with emergence of such new institutions. The studies have used commodity- wise analysis of spot prices and their respective futures prices. The studies have used National Commodity Exchange (NCDEX) data on the futures. To contribute to the current debate on inflation a need for a fresh study is felt. This study is undertaken with the help of Multi Commodity Exchange of India Ltd (MCX) data. MCX is an independent commodity exchange based in India. This exchange facilitates for online trading of commodity futures, and also the clearing and settlement of the same. It was established in 2003 and is based in Mumbai, in terms of contracts traded; it was the world's third largest commodity exchange. MCX now reaches out to about 800 cities and towns in India with the help of about 126,000 trading terminals. MCX is India’s leading commodity futures exchange with a market share of about 81 per cent in terms of the value of commodity futures contracts. MCX offers trading in the futures of commodities that include metals viz., bullion, ferrous and non-ferrous metals, and agricultural commodities viz., menthe oil, cardamom, potatoes, palm oil etc. Therefore MCX can be taken as a market for speculative trade in agricultural commodities.
The central debate about speculation and food price volatility revolves around the workings of financial ‘futures’ markets. These markets enable purchasers to ‘hedge’ against the risk that commodity prices will move unfavorably. Speculators make profit from differential price expectations of different market participants based on varied risk assessments. This price movement provides market information necessary to set more accurate prices (Angel and McCabe, 2010). There is a view that financial speculators play the role mitigating the commodity price fluctuations as speculators buy when prices are low and sell when prices are high (De Schutter, 2010). Most of the studies on this issue concede that higher financial sector engagement in food commodity markets would amplify short term price fluctuations (FAO, IFAD et al, 2011). Yet firm empirical evidences do not confirm that speculation is a determinant of price volatility and so the extent of disagreement remains (FAO, IFAD et al, 2011). In present study, to show the
Does a Speculative Trade in Food Commodities Influence Food Price Inflation in India? 77
TSM Business Review, Vol. 2, No. 2, December 2014
relationship between the speculative trading volume in the agricultural commodities and the wpi_f, a line graph is presented in Fig 2. The speculative trade is found to be highly volatile while the wpi_f showing a smooth upward trend. However, in 2012 the speculative trade is showing a synchronized trend with some time lags. On the whole, a weak synchronization of the two time series may be observed in that figure. However, validating this observation requires application of appropriate time series methodology.
Fig 2: Trends in WPI_F and MCX trading volume in agricultural items
during the period 2004–2014
Source: Authors’ calculation 2. Methodology This paper intends to analyze possible connection between wholesale food price index and trading volume on agricultural commodities in Multi-Commodity Exchange of India (MCX) using the monthly data between April 2004 and January 2014 from CSO and MCX respectively. The agricultural commodities in MCX include viz., menthe oil, cardamom, potatoes, palm oil etc. The study used the following time series techniques to draw meaningful conclusions on the issue. 2.1 Tools of analysis The time series literature has suggested that the traditional statistical analysis may be misleading in the presence of ‘non-stationary’ phenomenon among time series variables. Consequently, a genuine analysis of relationship between time series variables commences with test for stationarity. Once the stationarity of time series variable is

78 Does a Speculative Trade in Food Commodities Influence Food Price Inflation in India?
TSM Business Review, Vol. 2, No. 2, December 2014
ensured, the existence of long run relationship between the variables is tested using the test of co-integration. 2.1.1 Tests of Stationarity A time series is said to be stationary if the statistical property of the time series does not change with time. Two approaches are used to test the stationary aspect of a time series. One is the classical/graphical method based on the correlogram that charts the Auto Correlation Function (ACF) / Partial Autocorrelation (PACF) for different time lags. If the auto correlations of the study variable for different time lags lie within the critical line bands as shown below, then the variable is said to stationary.
This stationarity test is based on the evaluation of graph which needs to be confirmed using formal statistical test. This statistical testing is done using unit roots test. The specifications of Augmented Dickey Fuller (ADF) test in its three variants are used for the analysis.
∆Yt = γYt-1 + ∑j=1
p(δj∆Yt-j) + et (without intercept and trend)
∆Yt = α+γYt-1 + ∑j=1
p(δj∆Yt-j) + et (with intercept)
∆Yt = α+ βt +γYt-1 + ∑j=1
p(δj∆Yt-j) + et (with intercept and trend)
where, t is the time index, α is an intercept constant called a drift, β is the coefficient on a time trend, γ is the coefficient presenting process root, i.e. the focus of testing, p is the lag order of the first-differences autoregressive process, et is an independent identically distributes residual term.

Does a Speculative Trade in Food Commodities Influence Food Price Inflation in India? 79
TSM Business Review, Vol. 2, No. 2, December 2014
If a series is stationary, say Yt, then the series is said to be integrated of order zero and denoted by Yt ∼ I(0). When the series is non stationary, a its differenced series, say ∆Yt (where, ∆Yt = Yt – Yt-1), may be stationary. In that case Yt is said to be integrated of order 1 and is denoted by Yt ∼ I(1). The order of integration is determined by the number of times the series need to be differenced to make it into a stationary series. This procedure helps to analyse the stationarity tendency of the study variables wpi_f and mcx. 2.1.2 Test of Co-integration If all the study variables are stationary then the Ordinary Least Square (OLS) regression models may be used to analyse the relationship among them. When all the variables are integrated of order one, the existence of long-run relationship among variables depends on the cointegrated relationship. To test for the co-integration between two variables, say Xt and Yt, Engel-Granger framework can be used.
Δyt = β0 + Σ βiΔyt-i + ΣγjΔxt-j + φzt-1 + et Here, zt, the "error-correction term", is got from the OLS residual of the long-run "cointegrating regression", yt = α0 + α1xt + vt. If the coefficient φ is negative and significant, then Xt and Yt is said to be cointegrated. However, if one of the variables are stationary [I(0)], and the other is I(1), the ARDL / Bounds Testing specification of Pesaran and Shin (1999) and Pesaran et al. (2001) may be used which is given below:
Δyt = β0 + Σ βiΔyt-i + ΣγjΔxt-j + θ0yt-1 + θ1xt-1 + et Here, if θ0 and θ1 are jointly zero (wald test) then the test concludes there is no cointegrated relationship between Xt and Yt exists. Otherwise if the ‘joint’ is rejected and θ0 is negative and significant then the test concludes that there exist a cointegrated relationship between Xt and Yt exists. However, the usual critical values of F may not be used as the series with mixed order of integration and so the critical values for the Wald’s test are taken from the Pesaran et al. (1999) as suggested in the bounds test methodology. This study used ARDL Add-in for EViews developed by Yashar Tarverdi to implement Bounds test methodology and got calculated F value of Wald’s test. This value is compared with critical values got from Pesaran et al. (1999). Two critical F values would be provided with the assumption of I(0) and I(1) respectively. If the calculated F value is less than the critical value with I(0) assumption, then it is concluded that there is no cointegrated relationship between Xt and Yt. If, on the other hand, the calculated F value is greater than the critical value with I(1) assumption, then it is concluded that there is cointegrated relationship between Xt and Yt. If the calculated F value lies between the critical F values with I(0) and I(1) assumptions, then the inference is inconclusive. For testing the significance of the θ0 and θ1 separately, critical values similar to F values are given for t- test also and the decision rule is similar to the inference for F test.
80 Does a Speculative Trade in Food Commodities Influence Food Price Inflation in India?
TSM Business Review, Vol. 2, No. 2, December 2014
3. Results and Discussions The table 3.1 shows the results of different stationary test of MCX Trading volume and Wholesale Price Index (WPI) of food items. With the correlogram for the variable MCX is not giving a conclusive evidence for stationarity, except for the first variant (without intercept and trend) of ADF, the results of the remaining two variants show that the series does not have unit root. Hence it may be inferred that MCX is I(0). The wpi_f is found to be non-stationary from the correlogram. This result is further confirmed from the ADF results that the t values are not significant in all the three variants. Further, result of correlogram indicates that the differenced wpi_f is stationary and this is confirmed by the ADF test that all statistical measures are significant at 5 per cent level. Hence wpi_f is an I (1) series. The study variables are mixed bundles as for as the order of integration of variables are concerned. In the presence of mixed series to test the cointegration between MCX and wpi_f, bounds test methodology is applied as suggested in the previous section. Maximum 4 lags are considered for the study of cointegration between MCX and wpi_f with wpi_f as dependent variable. The optimum ARDL model is chosen based on the Akaike Information Criteria(AIC). The result showed that ARDL (4,1) model had the least AIC value. The calculated F value of the wald test is 0.5567.
From the table 3.2 it could be observed that the calculated F value 0.5567 is lower than I(0) values of all the levels of significance (3.7, 3.79 and 5.15), so it is inferred that there is no co-integration exist between WPI_F and MCX. This is confirmed from the t-values of the coefficients of first lag variables wpi_f and MCX, given in table 3.3. The respective t-values 0.837 and 0.076 are positive and is greater than critical t values with I(0) assumption at all levels of significance viz., -2.57, -2.86 and -3.43. Therefore, both the coefficients are insignificant. Maximum 4 lags are considered for the study of Co-integration between wpi_f and MCX with MCX as dependent variable. The result showed that ARDL (1,2) model had the least AIC value. The calculated F value of the wald test is 5.807. From the table 3.2 it could be observed that the calculated F value 5.807is higher than critical value of F with I(1) assumption at 5 percent level of significance (4.85) , so it is inferred that there is co-integrating relationship exist between MCX and WPI_F. This is confirmed from the t-values of the coefficients of first lag variables MCX and wpi_f, given in table 3.4. The t-value of coefficient of first lag values of MCX is -3.407. The t value is less than critical t values with I(1) assumption at 5 percent level of significance viz., -2.86. Therefore, coefficient of first lag values of MCX is significant and negative. This indicates that in the long run wpi_f determines MCX.
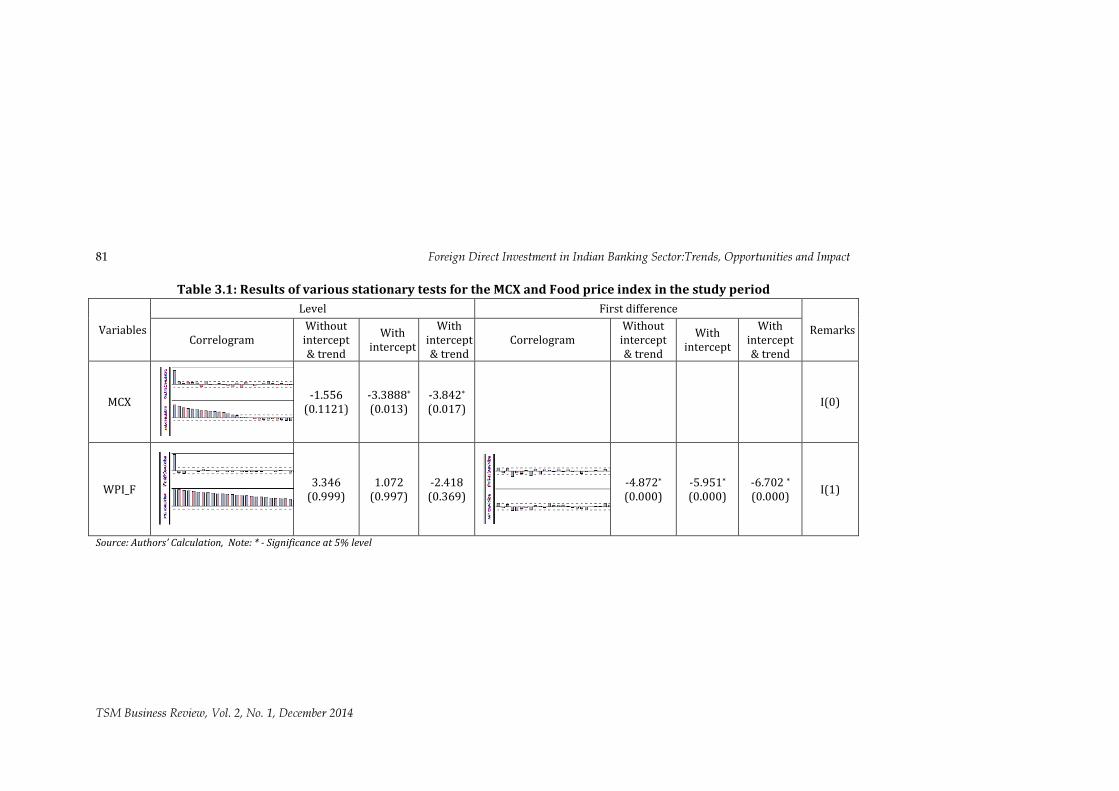
81 Foreign Direct Investment in Indian Banking Sector:Trends, Opportunities and Impact
TSM Business Review, Vol. 2, No. 1, December 2014
Table 3.1: Results of various stationary tests for the MCX and Food price index in the study period
Variables Level First difference
Remarks Correlogram Without intercept & trend
With intercept
With intercept & trend
Correlogram Without intercept & trend
With intercept
With intercept & trend
MCX -1.556 (0.1121)
-3.3888* (0.013)
-3.842* (0.017) I(0)
WPI_F 3.346 (0.999)
1.072 (0.997)
-2.418 (0.369)
-4.872* (0.000)
-5.951* (0.000)
-6.702 * (0.000) I(1)
Source: Authors’ Calculation, Note: * - Significance at 5% level

82 Does a Speculative Trade in Food Commodities Influence Food Price Inflation in India?
TSM Business Review, Vol. 2, No. 2, December 2014
Table 3.2: Critical values of F and t – tests with I(0) and I(1) assumptions (for K=2)
F value T value 90% 95% 99% 90% 95% 99%
I (0) I (1) I (0) I (1) I (0) I (1) I (0) I (1) I (0) I (1) I (0) I (1) 3.7 4.14 3.79 4.85 5.15 6.36 - 2.57 -
3.21 -
2.86 - 2.53 - 3.43 - 4.10 Source: Table –C 1 iii : Case III with unrestricted intercept with No Trend from Pesaran et al. (1999) Page T.2 and T.4 respectively
Table 3.3: Results of ARDL Model ( 4,1) with D(WPI_F) as dependent variable
Variable Coefficient Std. Error t-Statistic Prob. C 0.043 1.216 0.035 0.972
WPI_F(-1) 0.008 0.01 0.837 0.404 MCX(-1) 0.000 0.000 0.076 0.939
D(WPI_F(-1)) 0.278 0.092 3.016 0.003 D(WPI_F(-2)) -0.225 0.109 -2.061 0.042 D(WPI_F(-3)) 0.281 0.107 2.632 0.01 D(WPI_F(-4)) -0.439 0.110 -3.981 0.00 D(MCX(-1)) 0.000 0.00 -0.194 0.846 R-squared 0.206 Mean dependent var 1.157
Adjusted R-squared 0.153 S.D. dependent var 3.676 S.E. of regression 3.383 Akaike info criterion 5.343
Sum squared resid -293.907 Schwarz criterion 5.537 Log likelihood 3.898 Hannan-Quinn criter. 5.421
F-statistic 0.001 Durbin-Watson stat 2.092 Prob(F-statistic) -293.907
Therefore, this study found that there is no influence of trading on food commodity futures on wholesale price indices. However the trading in MCX is influenced by fluctuations in wholesale price indexes. 4. Conclusion This paper is intended to explore the link between the speculative trade in food commodities and the food items price inflation as food inflation has become a major economic challenge for the public policy in the contemporary India. Though, many reasons have been attributed for the accelerated food inflation, the possibility of speculation in commodity futures market on food price inflation was not explored in the Indian context. This paper analyzed the possible connection between wholesale food price index and trading on food commodities in Multi-Commodity Exchange of India (MCX) using the monthly data between 2004 and 2014 from CSO and MCX respectively. The study used time series analysis to draw conclusions on the connection between wpi_f

Does a Speculative Trade in Food Commodities Influence Food Price Inflation in India? 83
TSM Business Review, Vol. 2, No. 2, December 2014
and MCX. Based on the methodology, this study has found that there is no influence of trading on food commodity futures on wholesale price index. However the trading in MCX is influenced by fluctuations in wholesale price indices which may have implications on the future of food commodities prices in India.
Table 3.4: Results of ARDL Model (1,2) with D(MCX) as dependent variable Variable Coefficient Std. Error t-Statistic Prob.
C -29965.520 141161.100 -0.212 0.832 MCX(-1) -0.221 0.065 -3.407 0.001
WPI_F(-1) 1958.626 1063.739 1.841 0.0680 D(MCX(-1)) -0.128 0.095 -1.347 0.181
D(WPI_F(-1)) -12647.030 11044.420 -1.145 0.255 D(WPI_F(-2)) -3956.128 12809.600 -0.309 0.758
R-squared 0.148 Mean dependent var 15668.340 Adjusted R-squared 0.109 S.D. dependent var 435465.900
S.E. of regression 411020.500 Akaike info criterion 28.741 Sum squared resid 0.000 Schwarz criterion 28.885
Log likelihood -1646.633 Hannan-Quinn criter. 28.799 F-statistic 3.793 Durbin-Watson stat 1.997
Prob(F-statistic) 0.003 References Ministry of Consumer Affairs, Food and Public Distribution, Government of India. (2008).
Study on the impact of futures trading on agricultural commodity prices: Report of Abhijit Sen Committee.
Baffes, J., & Tassos, H. (2010). Placing the 2006-08 commodity price boom into perspective. The World Bank Policy Research Working Paper, No 5371.
Basu, K. (2011). India’s food grains policy: An economic theory perspective. Economic & Political Weekly, 46(05), 37-45.
Chand, R. (2005). Whither India’s food policy. Economic & Political Weekly, 40(11), 1055-62.
Chandrasekhar, C. P., & Jayati, G. (2008, April 8). Global inflation and India. The Hindu- Business Line.
Cooke, B., & Robles, M. (2009). Recent food price movements: A time series analysis. International Food Policy Research Institute, 00942.

84 Does a Speculative Trade in Food Commodities Influence Food Price Inflation in India?
TSM Business Review, Vol. 2, No. 2, December 2014
Economic Advisory Council to the Prime Minister (EACPM). (2009). Economic Outlook for 2009-10.
Food Ethics Council. (2012). http://www.foodethicscouncil.org/system/files/2012-Ethics%20of%20speculation%20discussion%20paper-March%202012.pdf.
Ministry of Finance, Government of India. (2009). Economic Survey 2008-2009. Gulati, A. (2010). Accelerating agriculture growth: Moving from farming to value chains.
India’s Economy: Performance and Challenges, New Delhi Oxford University Press, 213-44.
Hernandez, M. A., Robles, M., & Torero, M. (2010). Beyond the numbers: How urban households in Central America responded to the recent global crises. Issue brief- International Food Policy Research Institute (IFPRI), 67.
Hoda, A., & Ashok, G. (2007). WTO negotiations on agriculture and developing countries. New Delhi Oxford University Press.
IIMB Report. (2008). Impact of futures trading in Wheat, Sugar, Pulses and Guar Seed on farmers: Indian Institute of Management Bangalore and Commissioned by the Forward Markets Commission.
Kumar, R., Pankaj, V., & Gunajit, K. (2010). Food inflation: Contingent and structural factors. Economic & Political Weekly, 45(10), 16-9.
Lokare, S. M. (2007). Commodity derivatives and price risk management: An empirical anecdote from India. Reserve Bank of India Occasional Papers.
Nair, S. R., & Leena, M. E. (2011). Wheat price inflation in recent times: Causes, lessons and new perspectives. Economic & Political Weekly, 46(36), 58-65.
Nath, G. C., & Lingareddy, T. (2008). Commodity derivative market and its impact on spot market. SSRN: http://ssrn.com/abstract=1087904.
Nitesh, R. (2005). Role of commodity exchanges, futures & options - A case study on Soya oil. Occasional paper 46, Department of Economic Analysis and Research, NABARD.
Olivier, D. S. (2011). Food crises: Five priorities for the G20. The Guardian, UN Special Rapporteur on the right to food.
Rakshit, M. (2009). India amidst the global crisis. Economic & Political Weekly, 44(13), 94-106.
Robles, M., Torero, M., & Von, B. J. (2009). When speculation matters. International Food Policy Research Institute, IFPRI Brief 57.
Sahi, G. S. (2006). Influence of commodity derivatives on volatility of underlying. SSRN:http://ssrn.com/abstract=953594.
Singh, J. B. (2000). Futures markets and price stabilization: Evidence from Indian Hessian market. http://www.sasnet.lu.se/EASASpapers/8JatinderSingh.pdf
Yang, J., Brian, B. R., & David, J. L. (2005). Futures trading activity and commodity cash price volatility. Journal of Business Finance Accounting, 32(1), 297-323.
Book Review ISSN: 2348-3784
Harish B, Assistant Professor, Rajagiri College of Social Sciences, Rajagiri Valley, Kakkanad, Cochin, Kerala. PIN: 682039, India. E-Mail: [email protected]. Phone: 9846246185
Four- Cornered Leadership: A Framework for Making Decisions
Harish B
Four-Cornered Leadership: A framework for making decisions is written by John Roland Schultz who is an independent management consultant and retired professor. The author describes the book as one on leadership. Borrowing heavily from the work of Edward Deming, the author centers the book on four elements comprising the system of profound knowledge. The book is organized in seven chapters. The first chapter gives a very clear and concise view of the concept of leadership. This chapter offers a remarkable outline of the theoretical foundation of leadership theory. A reader who has a formal management education will feel nostalgic while reading through the various theories of leadership described in the book. The author assumes that the reader has some theoretical knowledge about the theories of leadership and hence makes only a ringside view about the concepts. The second chapter deals with the basics of organization and the importance of system interdependencies. The author takes a theoretical approach describing the various concepts of organizational theory and behavior. The third chapter is concerned with the individual behavior touching upon the concepts like motivation, learning, complexity of human nature etc. The chapter briefs the readers about group and organizational dynamics stressing the importance of understanding formal and informal networks in an organization. The fourth chapter focuses on organizational learning. The author roots in the theories of Jung and Deming putting forth an impressive commentary on learning and development. The fifth highlights the variability of work. The author impresses upon the importance of using data for decision making. Starting with a basic framework of using charts and graphs for interpreting data, author proceed to give a nice view of using various types of measurements used in management and their indicators. Chapter six deals with creating a purposeful organization and examines the importance of purpose and proceeds to explain how to create a statement of purpose. The chapter also touches on the importance of anchoring the purpose through action and communicating the purpose to the stakeholders.

86 Four-Cornered Leadership A Framework for Making Decisions
TSM Business Review, Vol. 2, No. 2, December 2014
The final chapter relates to managing the dynamics, interdependencies and interactions that characterize the system of profound knowledge. The chapter talks about the need for planning (strategy) and then organize (create structure) coordinate and control. The chapter elaborates on the various management functions like monitoring, problem-solving, decision making, building relationships. The entire book is based on Edward Deming’s system of profound knowledge. The four pillars of system of profound knowledge are
• Appreciation for the system • Understanding variation and data based decisions • Understanding individual and organizational psychology • Understanding individual and organizational learning.
The title of the book: Four-Cornered Leadership gives an impression that the book is about leadership and discloses some new perspectives about leadership. But the book falls short of doing justice to the theme. The readers are given a thorough grounding on the various management theories but the book fails to move beyond the current literature. The book is a good read for management professionals in the middle management cadre who desire to revisit the concepts learned during their management education. The book will be useful for trainers and consultants for acquiring a perspective of the tools used for measuring organizational performance. The only new perspective revealed in this book is the connect established between Edward Deming’s ‘System of Profound Knowledge ‘and Leadership. The book has lot of insights and the best part of the book is the various tools presented to practicing managers. The author has done lot of research to consolidate and present useful tools and metrics for practicing managers. The book indicates an exhaustive range of management tools (both classic and modern) under one umbrella of Deming’s System of Profound Knowledge. This book can be useful as a quick reference guide of these metrics. There lies the question whether the author has been able to bring in any new thoughts or metrics is successfully. Conclusion The book can be described as a book on ‘Management theory’ than on ‘Leadership’. The reader will be disappointed if he/she expects the book to give insights into new leadership perspectives. The book however gives a concise view of the important theoretical frameworks which can be used for better decision making.

Perspective ISSN: 2348-3784
Dr. Krishna Gopal Karmakar,Professor, SPJain Institute of Management and Research, Bhavans campus, Munshi nagar, Dadabhai raod, Andheri-West, Mumbai, PIN: 400058.E-Mail: [email protected]. Phone: 022-61454214
Commodities Markets: Improving Trade Volumes
K G Karmakar Introduction Commodity derivatives trading spanning over 130 years, has had a long and chequered history in India. Mumbai’s Cotton Exchange is one of the world’s oldest cotton exchanges founded in the 1850’s, even before the country’s stock market exchange came into existence in 1875.It was essentially a tale of two cotton markets , the spot market at Sewree and the futures exchange at Kalbadevi and was formally called the East India Cotton Association. Over the years the Mumbai Cotton Exchange evolved since 1921 and is still in existence though trading volumes are low in comparison with MCX and NCDEX. The commodity derivative exchanges have witnessed several ups and downs for the past 13 decades including a ban on such trading for almost a decade after the outbreak of Second World War in 1939. On January 26 1949, the subject of futures trading came under the Union list. The Central Government passed the Forward Contracts (Regulation) Act, 1952 (FCRA) and established the Forward Market Commission (FMC) in 1953. Under the FCRA, futures trading were allowed in select agricultural commodities and their products under the auspices of Associations recognized by GOI. By mid 1960’s around 30 Associations were recognized for trading of commodities. Trading was subject to severe regulatory measures. Following the launch of economic reforms early in 1990s, the World Bank and UNCTAD submitted a joint report to GOI, recommending the revival of futures trading in farm commodities and their products to render trade in such commodities competitive in the world markets after the envisaged removal of trade and non-trade barriers. As a result, futures’ trading was revived after a lapse of three and a half decades, towards the close of 20th century. The onset of the new millennium thereafter witnessed the setting of three new national commodity exchanges. At present, there are almost two dozen commodity exchanges, including 3 national exchanges. Trading takes place in about a 100 commodities. The New Commodity Exchanges in India The new national commodity exchanges marked a distinct shift in the commodity derivatives trading landscape in the country against the conventional commodity exchanges. The new national exchanges organized derivatives trading on a screen-based anonymous automated electronic system. Despite a long history of commodity futures trading in the country, future markets are still viewed with suspicion by many in academic and official circles. The recent deflation in the values of various assets underlying the different derivatives, including commodity derivatives, following the global meltdown since 2008, has provoked even more doubts about the much acclaimed economic utility of futures trading for price discovery and risk management.
88 Commodities Markets: Improving Trade Volumes
TSM Business Review, Vol. 2, No. 2, December 2014
As a result, the authorities are yet to permit such trading in several food grains like rice and millets and some major pulses, too. The government also continues to suspend future trading in commodities as soon as it suspects that such trading may affect adversely the prices of those commodities to the detriment of one or the other classes of society. The Forward Market Commission (FMC) and the Union Ministry of Consumer Affairs in India strengthened, enlarged and upgraded the FMC with more regulatory powers. The FMC has been legalized and permitted to trade in intangibles with cash settlement provisions and has allowed the entry of financial institutions including foreign financial institutions in commodity derivative trading business to broaden and deepen the commodity markets. Against such conflicting views, commodity futures markets present a massive research agenda challenge on major policy and empirical issues. Strengthening and expanding the scope of commodity derivative trading The present Forward Contract Regulation Act (FCRA) is essentially an enabling Act and the Forward Market Commission (FMC) is merely an advisory and monitoring body rather than a full-fledged regulatory organization as it does not have specialized and long-term staff attached and the real regulatory powers are still vested under the Act with the Union Government. Hence, it is considered necessary to amend the existing laws to meet the challenges of the new commodity market ecosystem. The envisaged Amendment Bill has legalized options in commodity derivatives to facilitate trading in derivative contracts for intangibles like commodity indices, weather derivatives and also allow the cash settlement of derivative contracts. It may further permit foreign individuals and institutional investors, banks and other financial institutions to trade in commodity derivatives. More specifically, the amendment has given greater teeth to FMC by raising its status to that of the counterpart in the securities market viz. Securities Exchange Board of India (SEBI) through up-grading, expansion and conferring upon it more regulatory and judiciary powers. There is a need for strengthening the FCRA, convergence of the FMC and SEBI for effective regulation of both the securities and commodity exchanges, development and strengthening of derivative contracts and markets, options on commodity futures necessary. It is desirable to settle all commodity futures contracts by payment of cash differences instead of insisting on compulsory deliveries on contract maturities and allowing banks, financial institutions, foreign investors, retail individuals and institutions like pension funds, hedge funds to trade. Impact of futures trading on commodity prices While producers have voiced their concerns about the alleged depressing influence of futures trading during times of surplus supplies, consumers and the end-use industries have complained about their aggravating influence on rising prices under conditions of short supplies, especially in inflationary periods. Even economists are divided almost vertically on the role of commodity derivative markets, marketing and pricing of physical
Commodities Markets: Improving Trade Volumes 89
TSM Business Review, Vol. 2, No. 2, December 2014
commodities. While the advocates of derivative markets vouch for their economic utility for price discovery and price risk management in domestic and export marketing, they argue that speculation in these markets primarily help in the performance of these twin economic functions. They even further contend that speculation essentially stabilises prices and does not aggravate price trends. The opponents of future markets state that after all, price volatility and not price stability gives rise to speculation markets. They, therefore, contend that the volume of speculation is directly correlated to the extent of price variability. Greater the price variability, higher is the speculation and vice versa. It follows that speculation essentially leads to price destabilisation. The way out In view of the conflicting reports and inadequate evidence, there is a crucial need to understand the relationship and dynamics between the futures and the physical markets in commodities and more specifically the impact of derivative trading on the physical market prices. Discussions therefore, concentrated on the economic functions of commodity futures markets and their utility for different market functionaries separately. Whether futures markets will lead to price discovery? What is the meaning of the term “price discovery”? Why futures markets are believed to be leading to better price discovery? Are not prices discovered in the absence of futures markets? Who benefits from the price discovery made in the futures market? How do they benefit? How can one measure the pricing efficiency of the futures market? There are a lot of perplexing queries and not enough adequate answers. Further deliberations were confined to the role and functions of speculation in a futures market, the characteristics of different types of speculation and benefits and evils of different types of speculation. Much debate emerged on the distinction between speculation and manipulation and impact of futures trading on commodity prices in the physical markets, with specific reference to short-term and seasonal price variability, as also cyclical fluctuations as depicted by the famous Cobweb Theorem in agricultural economics. Some academicians argued as to whether adequate empirical evidence exists to establish the price integrating influence both horizontally and vertically and whether commodity markets suffer from some inherent biases in price making that affect adversely one class of hedgers as against the others. We need to analyse reasons as to why the commodities markets are subdued now. SWOT analysis of national-level commodity exchanges in India Strengths • Commodities centric economy of India – a leading producer/consumer in
number of commodities. • Rich history of commodity derivatives trading in the country. • Risk-taking profile of the Indian masses. • Online trading platform accessible from every nook and corner.

90 Commodities Markets: Improving Trade Volumes
TSM Business Review, Vol. 2, No. 2, December 2014
• Strong application of information technology enabling connectivity to trading stations through VSAT, Internet, leased line, CTCL etc.
• Offering large number of commodities across segment for futures trading – thus appealing to large number of commodity stakeholders for futures trading.
• Strategic alliance with global exchanges, domestic trade associations and educational institutions enabling the participants of commodity exchanges to leverage from the knowledge sharing between institutions.
• Extended trade timings overlapping with eastern economies (Japan, Australia etc.) and western economies (Europe, US etc.).
Weaknesses • Commodity derivatives market is still regulated under the archaic law i.e. The
Forward Contracts (Regulation) Act, 1952 – limiting the role and power of the commodity derivatives market regulator, Forward Market Commission (FMC).
• Absence of participation of financial institutions such as banks, FIIs and DIIs etc. It is widely perceived and internationally observed that presence of financial institutions (particularly banks) in the commodity derivatives market makes the market strong and inclusive.
• Absence of different derivatives products, viz. indices and options. These products are very much in demand in India as they can be tailor-made to suit the risk management demands of specific user groups.
• Fragmented underlying physical market especially in case of agricultural commodities.
• Inadequate support infrastructure across the country in terms of warehouses, quality testing labs etc.
• Administered pricing to a certain extent in few agricultural commodities and select energy commodities.
• Plethora of taxes – at local, state and central levels. The same commodity at times is subject to number of taxes at various levels. Besides, tax rules are introduced without considering the implications for the commodity markets. For instance, as per the existing provisions of Cenvat Credit Rules, only a manufacturer, first stage dealer or a second stage dealer is entitled to credit on the excise duty paid at the time of procurement. In the ecosystem of commodity derivatives, the final procurement is often the culmination of multiple unascertainable instances of purchase and sales. This deprives excise duty credit to the final buyer of the commodity who may take delivery several stages after the second stage of transaction. As a result, potential market participants are dissuaded from hedging in a transparent manner on the futures exchange.
Opportunities • Increasing volatility of commodity prices-making commodity derivatives trading
attractive both for hedgers as well as speculators.
Commodities Markets: Improving Trade Volumes 91
TSM Business Review, Vol. 2, No. 2, December 2014
• Large number of commodities yet to be tapped for derivatives trading. • Despite growth in commodity futures trading in past decade, the future-physical
multiplier in most global commodities are way below in comparison to global benchmarks – signifying huge potential for future growth.
• Derivatives instruments other than futures, such as options, indices etc. are yet to be launched – presenting huge opportunities for further growth, if allowed.
• Currently, institutional players such as banks, mutual funds, insurers, FIIs are not allowed to participate on commodity exchanges. Enabling of their participation can lead to huge growth in commodity derivatives trading.
• Cross listing of contracts between exchanges including from global arena can lead to huge growth opportunity for commodity exchanges in India.
• Big scope for foray into bringing forward commodities contracts on established regulated national level exchange
Threats • Imposition of CTT (Commodity Transaction Tax) has not only crippled the
growth in futures trading but in fact was led to significant fall in trading. Sustenance of CTT can further hamper commodity futures trading in the country.
• Any increase in the existing taxes levied on commodity futures transactions or imposition of any new tax—either by the central or state governments, can also adversely affect commodity derivatives trading.
• Government/regulatory interventions, which have the potential to disrupt commodity futures trading, e.g. restrictions on trading following inflationary conditions, can hamper commodity derivatives trading.
• Secular rise of equity market can wean away participants from commodity derivatives market.
With all these factors operating, innovative suggestions to improve trade are needed: Suggestions for enhancing trading volumes of commodity exchanges • Sustained awareness and education campaigns (including through print media)
at various levels can help in deepening and widening the market participation. In this context, following activities could be undertaken: • Workshops for increasing hedge participation, targeting not only
farmers but also finance/treasury department of companies exposed to commodity price risks.
• Training trainers – faculty of colleges and universities, progressive farmers, etc. who can then be assigned the task of conducting awareness programs. Universities may be prevailed upon to include commodity derivatives in the compulsory subjects in their commerce/ economics/ finance courses.

92 Commodities Markets: Improving Trade Volumes
TSM Business Review, Vol. 2, No. 2, December 2014
• Awareness campaigns at large scale need to be undertaken at all levels of commodity supply chain highlighting the benefit of commodity derivatives trading.
• Special seminars aiming at non-hedging participants need to be conducted, helping them understand the benefits of participating in commodity derivatives trading.
• Efforts need to be put in hand-holding first-time/potential hedgers’ with respect
to their participation on commodity exchanges especially in terms of operational requirements.
• Product/service innovation – Futures contracts in new commodities or more variants of existing commodity contracts which suit the needs of most stake-holders can be launched.
• Similarly augmenting the existing services provided by the exchange, say in terms of adding the number of delivery centers, launching more services such as EFP (Exchange of future for physical) etc. can be initiated.
Desired policy-related initiatives • Amendment to the Forward Contracts (Regulation) Act, 1952 would provide a
major fillip to commodity derivative trading volume. The amendment would not only empower FMC with the necessary powers and policies necessary efficient regulation of the market, but would also enable the launch of derivatives products other such as options and indices, which are currently not allowed. The availability of commodity options, indices would not only help in the growth of trading volume but would also help in better risk management.
• Repeal of CTT, as it is already unfolding deleterious impacts for the commodity markets, can prove to be major boost in efforts towards rising trading volume. Fall in transaction cost-by way of repealing of CTT would certainly help in some volume restoration especially helping the smaller players like the SMEs, who need a cost-effective risk management platform.
• Currently banks are not allowed to participate in commodity derivatives trading – despite their exposure to commodity prices risk owing to their loaning to commodity specific enterprises. Hence, notifications be issued under the Banking Regulation Act, 1949 to permit Banks to deal in the business of commodities including their derivatives. The participation of Banks in the commodities market would ensure greater penetration of commodity-market-based or warehouse-receipt-based lending and commodity exchanges-linked risk management services to the masses.
• Similarly other institutional bodies such as mutual funds, insurers, foreign institutional investors etc. need to be allowed to trade in commodity derivatives trading. Their participation would not only help in their respective investment objectives, but also add quality liquidity in commodity market.

Commodities Markets: Improving Trade Volumes 93
TSM Business Review, Vol. 2, No. 2, December 2014
• In respect to the deterrent to hedgers participation due to existing provisions of Cenvat Credit Rules (seen above in Weakness section), Central Excise Rules, 2002 be amended so as to consider exchange accredited warehouse as a first stage dealer as well as a second stage dealer. Necessary provisions may be made in the new GST policy to reflect this requirement.
• Supporting market infrastructure – smaller warehouses, cold storages, vaults, quality testing labs, grading centers, advisory services, etc. which provide critical support services to the commodity derivatives market need to be developed.
Conclusion The success story of the Chicago Board of Trade (CBOT) set up in 1848 in the USA needs to be replicated in India. The number of Farmers Associations which are members and actively trade on the exchange needs to be emulated especially for the smallholder farmers in India who earn only 12-18% of the produce profits after taking upon themselves 80% of the risks during the production stages. Traders who share only 20% of the risks towards marketing are able to siphon off over 70% of the profits which is totally and adversely affecting the smallholder farmer financial margins. With the help of USAID, the Department Of Agriculture (USA) and CBOT, as also FMC, Department Of Agriculture (India), Commodity Exchanges in India and Chambers of Commerce and Farmer Associations, NABARD and NABCONS, there is a need to ensure that Farmers’ Associations and Farmer Producer Organizations are involved in commodity trades which in India are entirely trader-driven and trader-dominated. The only slender hope for smallholder farmers to improve their profit and financial margins is by forming Farmer Associations which will not only grade, sort and aggregate farm produce but also take trading positions in commodity exchanges. Only then can smallholder farmers break the monopoly of traders who have a stranglehold on profits and margins, thereby ensuring that farmers are reduced to a life of penury and abject poverty. References Ghosh, N., Dey, D., & Jain, N. (2014): “Options: A critical missing link in India’s Commodity
Market” MCX Occasional Paper No. 5. Giovannucci, D., Varangis, P., & Larson, D. (2000).Warehouse Receipts: Facilitating Credit
and Commodity Markets-World Bank Website. Karmakar, K. G. (2013). Warehouse Logistics: A Boost for Food security, National Seminar
on Sustainability, IIT-Roorkee, 7-9 March 2014- Conference Proceedings. Misra, V. (2011). India’s New Warehouses. Forbes, 12 August 2013. Naira, S. & Gopinath, S. (2014). Impact Assessment of Cardamom Futures Trading at
Micro and Meso Levels. Draft Report for IIM, Kozhikode.


TSM Business Review Advertisement Form
We wish to advertise in TBR (bi-annual) in Black & White/ Colour.
Name ______________________
Address___________________________________
_________________________________________
City_________________________ Pin__________
Country___________________________________
Email Address______________________________
Mobile____________________________________
___________________
Signature
ADVERTISEMENT RATES FOR HALF PAGEADVERTISEMENT RATES FOR HALF PAGEADVERTISEMENT RATES FOR HALF PAGEADVERTISEMENT RATES FOR HALF PAGE
PreferencePreferencePreferencePreference 1 Year1 Year1 Year1 Year
(Rs)(Rs)(Rs)(Rs)
2 Years2 Years2 Years2 Years
(Rs)(Rs)(Rs)(Rs)
Black and WhiteBlack and WhiteBlack and WhiteBlack and White 2000 3500
ColourColourColourColour 4000 7500
Two copies of the journal along
with the bill will be dispatched
soon after publication. TBR
accepts corporate and product
advertisements. Please send your
advertisement material along
with demand draft in the favour
of the Thiagarajar School of
Management, Madurai.
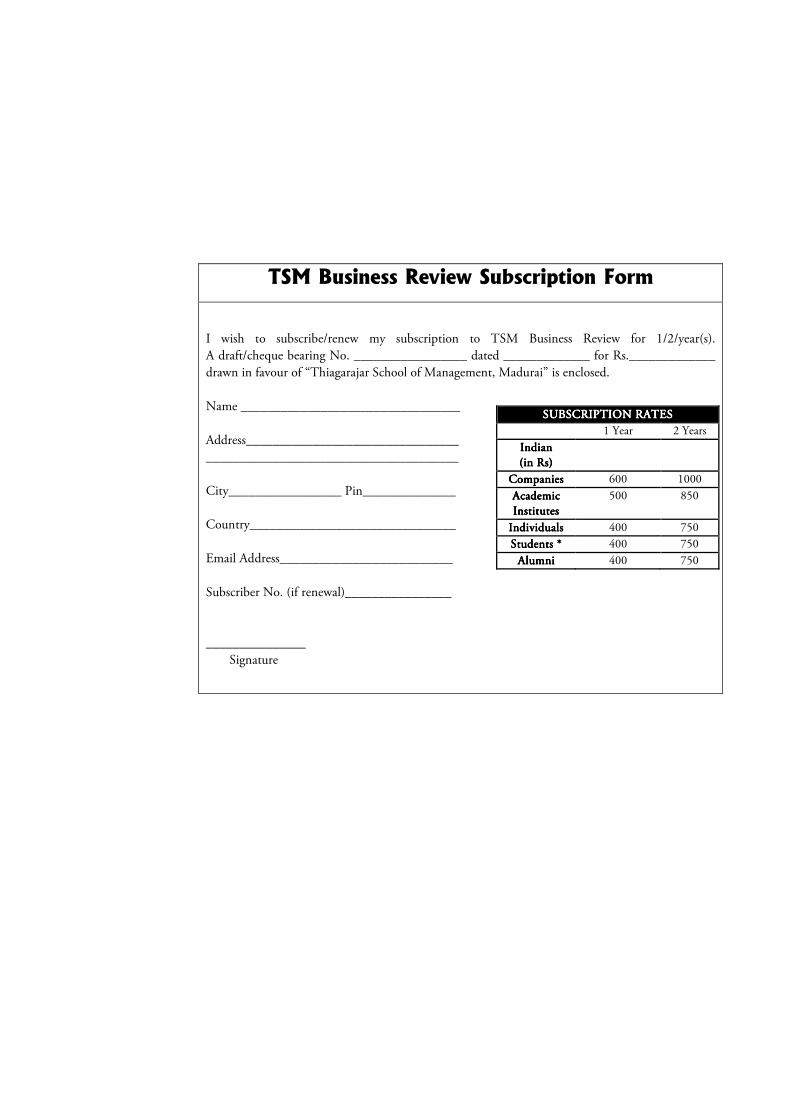
TSM Business Review Subscription Form
I wish to subscribe/renew my subscription to TSM Business Review for 1/2/year(s).
A draft/cheque bearing No. _________________ dated _____________ for Rs._____________
drawn in favour of “Thiagarajar School of Management, Madurai” is enclosed.
Name _________________________________
Address________________________________
______________________________________
City_________________ Pin______________
Country_______________________________
Email Address__________________________
Subscriber No. (if renewal)________________
_______________
Signature
SUBSCRIPTION RATESSUBSCRIPTION RATESSUBSCRIPTION RATESSUBSCRIPTION RATES
1 Year 2 Years
Indian Indian Indian Indian
(in Rs)(in Rs)(in Rs)(in Rs)
CompaniesCompaniesCompaniesCompanies 600 1000
Academic Academic Academic Academic
InstitutesInstitutesInstitutesInstitutes
500 850
IndividualsIndividualsIndividualsIndividuals 400 750
Students *Students *Students *Students * 400 750
AlumniAlumniAlumniAlumni 400 750

Faculty Requirements at TSM The specific requirements, along with the desired profiles, are listed below. Log on to www.tsm.ac.in to have detail information.
1. Operations and Supply Chain Management
Candidates should be engineers, with post graduation in management from a reputed B-school. They should be doctorates, or should be at an advanced stage of completing their doctorate.
2. Human Resource Management Candidates should be doctorates + MBAs/PGDMs from a reputed B-school.
3. Finance & Accounts Candidates should either be doctorates + MBAs/PGDMs, or Chartered Accountants with extensive industry experience.
4. Quantitative Techniques Candidates should be doctorates in applied Mathematics/Statistics/Decision Sciences, preceded by an MSc or MBA/PGDM with specialisation in quantitative techniques.
5. Marketing Candidates should be doctorates + MBAS/PGDMs from a reputed B-school.
CALL FOR CONTRIBUTIONS TSM Business Review, published by Thiagarajar School of Management, Madurai is an international bi-annual, double blind, peer-reviewed journal with ISSN 2348 –3784. TBR welcomes original research papers, case studies with teaching note, book reviews, discussion papers and perspectives on various functional areas of management science. It aims to present the latest thinking and research on major management topics in form of articles that meet high academic quality standards, while still being accessible to non-specialists. The journal has a distinguished editorial board composed of leading experts/researchers from around the world. We encourage authors to bring rigorous empirical and high quality research work from the areas of Human Resource Management, Organizational Behavior, Marketing Management, Accounting Research, Financial Management, Banking and Financial Institutions, Microeconomics, Macroeconomics, Development Economics, Operations Management, Business Innovation Business Information and Technology, Project Management, Knowledge Management Organizational Development, Strategic Management, Business Process, Reengineering and Benchmarking, Productivity, Competitiveness and Business Growth, Entrepreneurship and Small Business, New Product Development, Leadership and Organizational Change, Service and Manufacturing Management, Supply Chain and Value Analysis, General Management, Banking, Insurance, Corporate Governance, Information Technology and emerging trends in allied subjects across the globe. Papers should not have been simultaneously submitted for publication to another journal or any other source. If the paper has appeared earlier in a different version, we would appreciate you to send a copy of the same with your contribution. Authors are requested to follow TBR guidelines to fine tune their contributions. It will help immensely to speed up the review process and would lead to zero error. The writers are requested to strictly follow the submission guidelines especially with regard to citation and preparation of the bibliography. The back volumes, submission guidelines and sample paper are available on the below URL : http://www.tsm.ac.in/TSMBusinessReview.html Kindly send your manuscript (research paper/ case/article/book review) on the following email address: [email protected]

Frequency of Publication Biannual Month of Publication December and June Submission of research paper/case/reviews Throughout the year
Notification of acceptance Within 15 working days of submission through email
Processing and Publication fees There is no processing and publication fee
Who can contribute Academicians, research scholars, experts from corporate, NGO’s, Politicians, Government officers
Author’s receivable Authors shall receive free copy of the journal.

CALL TO JOIN REVIEW BOARD Academic fraternity is welcome to Join the review board of TBR. Please email your CV to TBR office. Since TBR is not for profit, we shall not pay any honorarium for review. Your name shall be recognized in the journal. Decision of acceptance of your request as reviewers shall be done by editorial board. REVIEW BOARD MEMBERS The TSM Business Review (TBR) gratefully acknowledges these individuals who completed review (s) for this issue during 2014. Reviewers are listed area wise.
Faculty Qualification Area: Organisational Behaviour and Human Resources Management
Dr J Sathyakumar M Com, MA, MBA, PhD Dr Medha Satishkumar M.Sc, PhD (IIT Madras) Ms Kundhavai S BBA, MBA., M. Phil Mr Gautam Ghosh B.Tech from IIT Kanpur, PGDM from IIM Calcutta Dr N Manjula MBA, M Phil, PhD Dr Mehir Kumar Baidya MBA, PhD (IIT-KGP) Dr B Janarthanan MBA, PhD (NITT) Dr M Selvalakshmi MBA, M Phil, FDPM (IIM-A), PhD
Area: Economics, Quantitave Techniques & Business Statistics Dr Vidya Suresh MA, PhD, FDPM (IIM-A) Dr Bipasha Maity M.Sc, Ph. D (IIT-KGP)
Area: Operations Management Mr P R C Gopal B.Tech , MBA, PhD(IIT-KGP Pursuing) Mr M Balaji ME, MBA, PhD (IIT-Madras, Pursuing), FDPM (IIM-A) Area: Operations Research, Production and Operations Management, Quantitative
Techniques, Probability Theory
Mr Goutam Sutar MSc (Mathematics, NIT Rourkela), PhD (Operations Mangement, IIT-Kharagpur, Pursuing)
Area: Finance Dr Prema Sankaran Ph.D, M.B.A Dr Shailesh Rastogi MBA (MNNIT), PhD (MJP Rohilkhand University) Dr M Jeevananthan MBA, PhD (NITT)
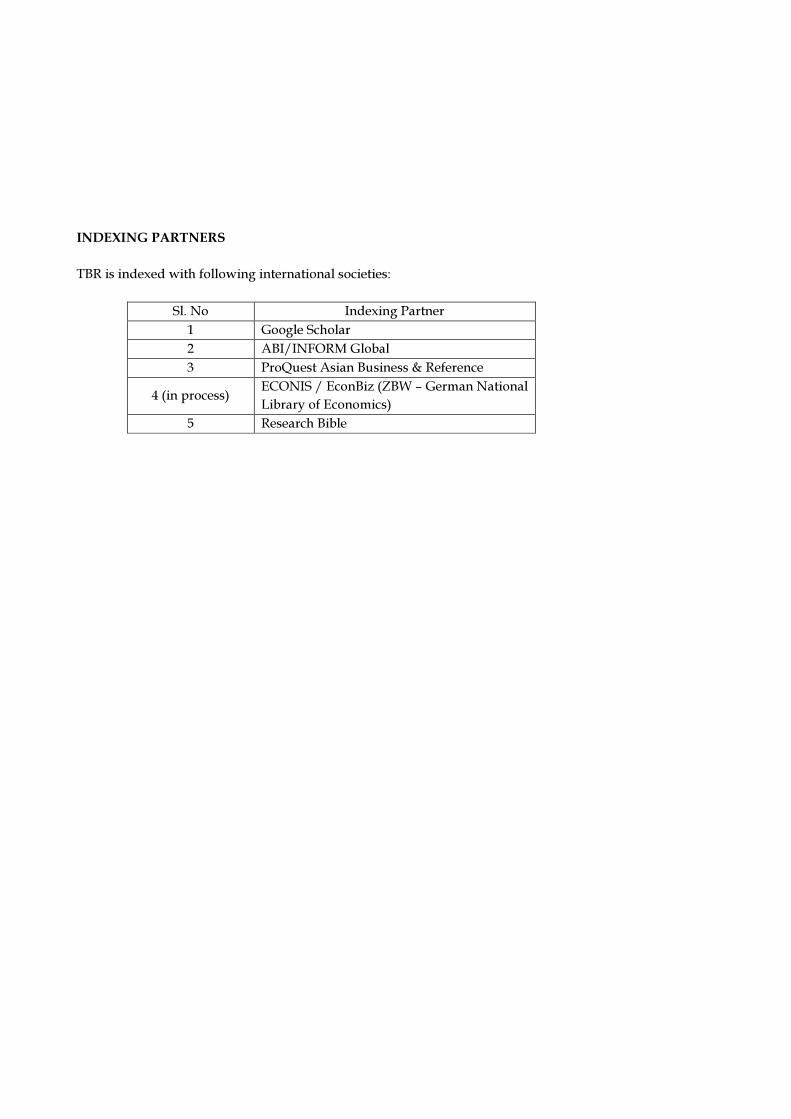
INDEXING PARTNERS TBR is indexed with following international societies:
Sl. No Indexing Partner 1 Google Scholar 2 ABI/INFORM Global 3 ProQuest Asian Business & Reference
4 (in process) ECONIS / EconBiz (ZBW – German National Library of Economics)
5 Research Bible

GUIDELINES FOR AUTHORS Description TSM Business Review (TBR), published by Thiagarajar School of Management, Madurai is an international bi-annual peer-reviewed journal. The journal publishes full length articles but review papers, case studies, book reviews and research notes are welcome. TBR provides a dynamic platform for all functional areas of management but is not limited to Human Resource Management, Organizational Behavior, Marketing Management, Accounting Research, Financial Management, Banking and Financial Institutions, Microeconomics and Macroeconomics, Development Economics, Operations Management, Business Innovation Business Information and Technology, Project Management, Knowledge Management Organizational Development, Strategic Management, Business Process, Reengineering and Benchmarking, Productivity, Competitiveness and Business Growth, Entrepreneurship and Small Business, New Product Development, Leadership and Organizational Change, Service and Manufacturing Management, Supply Chain and Value Analysis. TBR aims to present the latest thinking and research on major management topics in form of articles that meet high academic quality standards, while still being accessible to non-specialists. The journal has a distinguished editorial board composed of leading experts/researchers from around the world. Manuscript requirement Author name In order to facilitate a blind review, author’s name should appear on the first page containing article title, author’s name and affiliation, mailing address, phone and fax numbers and email address. Details of authors should not appear elsewhere in the manuscript. Corresponding author In case of multiple authors, the first page should indicate the author to whom correspondence should be addressed. Make sure that along with e-mail address and the complete postal address of that author, his/her telephone number (with country and area code) must also be written. Title Title of your work should be very crisp and meaningful and to be less than 20 words. Title will appear in the first page of the manuscript where you are providing author’s information and also in the second page from where the content begins.

Abstract Your research work should be accompanied by an abstract which should not exceed 200 words. This abstract should entail the purpose of the study, methodology employed and findings of the study. Abstracts should be in italics. Keywords Right after the abstract, write down a maximum of 3-6 keywords. Try to avoid general and plural terms and multiple concepts (avoid, for instance, ‘and’, ‘of’). Be very careful while using abbreviations in keywords; use only those abbreviations which are definitely recognized in the field of study. Guidelines for text in Manuscript Authors should adopt the following rules for the text to be written in their manuscript. These rules are meant to be for whole text which may include abstract, keywords, headings and references. Font: Times New Roman; Size: 12 Line Spacing: Double Heading 1: Times New Roman; Size-12; Bold; for example, 1. Introduction Heading 2: Times New Roman; Size-12; Italic; for example, 1.1 Leadership Heading 3: Times New Roman; Size-13; for example, 1.1.1 Leadership Theories Tables, Figures, and Formulae Note that tables and figures should be numbered one after another according to their appearance in the text. Title of tables and figures should be presented right above the body of the table, left aligned. Footnote of the table and figure should contain the source of information. Where possible, avoid vertical rules. Kindly make that data presented in the table do not duplicate the results presented in the manuscript elsewhere. The text size of the formula, if any, should be similar to the normal text size of the manuscript. References Authors are advised to follow the referencing style used by American Psychological Association (APA). The whole citation should follow the APA style. Book with Single Author: Gore, A. (2006). An inconvenient truth: The planetary emergency of global warming and what we can do about it. Emmaus, PA: Rodale. In-text reference: (Gore, 2006) Book with Two Authors: Michaels, P. J., & Balling, R. C., Jr. (2000). The satanic gases: Clearing the air about global

warming. Washington, DC: Cato Institute. In-text reference: (Michaels & Balling, 2000) Book with Editor as Author: Galley. K. E. (Ed.). (2004). Global climate change and wildlife in North America. Bethesda, MD: Wildlife Society. In-text reference: (Galley, 2004) Brochure or Pamphlet: New York State Department of Health. (2002). After a sexual assault. [Brochure]. Albany, NY: Author. In-text reference: (New York, 2002) Magazine Articles: Allen, L. (2004, August). Will Tuvalu disappear beneath the sea? Global warming threatens to swamp a small island nation. Smithsonian, 35(5), 44-52. Begley, S., & Murr, A. (2007, July 2). Which of these is not causing global warming? A. Sport utility vehicles; B. Rice fields; C. Increased solar output. Newsweek, 150(2), 48-50. In-text references: (Allen, 2004) (Begley, 2007) Newspaper Articles : College officials agree to cut greenhouse gases. (2007, June 13). Albany Times Union, p. A4. Landler, M. (2007, June 2). Bush’s Greenhouse Gas Plan Throws Europe Off Guard. New York Times, p. A7. In-text references: (“College Officials”, 2007) (Landler, 2007) Journal Articles: Bogdonoff, S., & Rubin, J. (2007). The regional greenhouse gas initiative: Taking action in Maine. Environment, 49(2), 9-16. In-text reference: (Bogdonoff & Rubin, 2007) Miller-Rushing, A. J., Primack, R. B., Primack, D., & Mukunda, S. (2006). Photographs and herbarium specimens as tools to document phonological changes in response to global warming. American Journal of Botany, 93, 1667-1674. In-text reference: (Miller-Rushing, Primack, Primack, & Mukunda, 2006)

Website: United States Environmental Protection Agency. (2007, May 4). Climate Change. Retrieved from the Environmental Protection Agency website: http://www.epa.gov/climatechange In-text reference: (United States Environmental, 2007) Gelspan, R. (2007). The Heat Is Online. Lake Oswego, OR: Green House Network. Retrieved from The Heat Is Online website: http://www.heatisonline.org In-text reference: (Gelspan, 2007)