Embed Size (px)
DESCRIPTION
The International Food and Agribusiness Management Review is published quarterly by IFAMA. Learn more by visiting www.ifama.org
Citation preview

International Food and Agribusiness Management Review
Official Journal of the InternationalFood and Agribusiness Management Association
Volume 18 Issue 22015
International Food and Agribusiness Management Review
Editorial StaffExecutive Editor
Peter Goldsmith, University of Illinois, USA
Regional Managing EditorsAsia, Australia, and New Zealand
Murray McGregor, University of South Australia, AustraliaNicola M. Shadbolt, Massey University, New Zealand
EuropeJacques Trienekens, Wageningen University, The Netherlands
Vera Bitsch, Technical University of Munich, GermanyAlessio Cavicchi, University of Macerata, Italy
Diogo Souza Monteiro, University of Kent, United KingdomYuliya Bolotova, Clemson University, USA (Russia)
North AmericaRam Acharya, New Mexico State University, USA
Corinne Alexander, Purdue University, USAMichael Gunderson, Purdue University, USA
Vincent R. Amanor-Boadu, Kansas State University, USAMark Hansen, Brigham Young University, USADavid Van Fleet, Arizona State University, USA
David Sparling, The University of Western Ontario, CanadaR. Brent Ross, Michigan State University, USA
Cheryl Wachenheim, North Dakota State University, USA
South AmericaJoao Martines-Filho, Universidade de São Paulo, Brazil
AfricaAjuruchukwu Obi, University of Fort Hare, South Africa
Filippo Arfini, Universita’ di Parma, ItalyStefano Boccaletti, Universita’ Cattolica, ItalyMichael Boehlje, Purdue University, USAFabio Chaddad, University of Missouri, USADennis Conley, University of Nebraska - Lincoln, USAFrancis Declerck, ESSEC Business School, FranceHamish Gow, Massey University, New ZealandJukka Kola, University of Helsinki, FinlandJay Lillywhite, New Mexico State University, USA
Woody Maijers, INHOLLAND University, The NetherlandsMarcos Fava Neves, FEA / USP / PENSA, BrazilOnno Omta, Wageningen University, The NetherlandsHernán Palau, Buenos Aires University, ArgentinaChristopher Peterson, Michigan State University, USAThomas Reardon, Michigan State University, USAMary Shelman, Harvard Business School, USAJohan van Rooyen, University of Stellenbosch, South Africa
The IFAMR (ISSN #: 1559-2448) is published quarterly and is available at http://www.ifama.org. For copyright and publishing information, please contact: Kathryn White, Administrative Editor. IFAMA Business Office • 1010 Vermont Avenue, Suite 201, Washington, DC 20005 • USA • Tel: 1 (202) 429-1610 • Fax: 1 (202) 628.9044 • E-mail: [email protected] • Web: http://www.ifama.org

International Food and Agribusiness Management Review
STUDY AGRICOMMERCE
AT MASSEY
WORLD LEADING IN AGRIFOOD
MASSEY.AC.NZ0800 MASSEY
The IFAMR Open Access Project is supported in part through contributions from these institutions. Scholars, practitioners, students, and policymakers may now read and download the most current and archival content from the IFAMR website. The Board of Directors of the International Food and Agribusiness Management Association feel that open and immediate access to IFAMR’s articles and case studies dramatically elevates the quality of scientific inquiry and instruction around the world in the field of agribusiness. If you would like to support this effort please contact: Kathryn White, Email: [email protected].
Food and Agribusiness Management
University of Fort HareTogether in Excellence
Strong Roots - Bright Future
International Food and Agribusiness Management Review Volume 18 Issue 2, 2015
TABLE OF CONTENTS
Research
1. Grocery Shopping via T-Commerce in Korea: New Shopping Channel Adoption Behavior Based on Prior E-Commerce Experience Dongmin Lee, Haeyoung Jeong, Jongpyo Cho, Jaeseok Jeong, and Junghoon Moon .........................................................................................................
p. 1
2. Preferences for Farmstead, Artisan, and Other Cheese Attributes: Evidence from a Conjoint Study in the Northeast United States Qingbin Wang, Ethan Thompson, and Robert Parsons...............................................
p. 17
3. Agri-Food Competitive Performance in EU Countries: A Fifteen-Year Retrospective Laura Carraresi and Alessandro Banterle..........................
p. 37
4. Uncovering Success Attributes for Direct Farmers’ Markets and Agri-Tourism in the Mid-Atlantic Region of the United States Benjamin Onyango, Ramu Govindasamy, and Clydette Michelle Alsup-Egbers........
p. 63
5. Farmers’ Willingness to Pay for a Porcine Reproductive and Respiratory Syndrome (PRRS) Vaccine in Thua Thien Hue Province, Vietnam Haifeng Zhang, Hiroichi Kono, Satoko Kubota and Jun Wang .....................................................................................................................
p. 79
6. Millennials Leaning In: Can Women in Agribusiness Benefit from Technology and Social Collaboration in Higher Education? Xiaowei Cai, Lindsey Higgins, and Marianne McGarry Wolf.............
p. 93
7. Exploring the Role of Farmers in Short Food Supply Chains: The Case of Italy Luigi Mastronardi, Davide Marino, Aurora Cavallo, and Agostino Giannelli.......................................................................................................
p. 109
8. Innovation in the Canadian Food Processing Industry: Evidence from the Workplace and Employee Survey Sean Cahill, Tabitha Rich, and Brian Cozzarin......................................................................................................
p. 131
2015 International Food and Agribusiness Management Association (IFAMA). All rights reserved. i
International Food and Agribusiness Management Review Volume 18 Issue 2, 2015
Case Study
9.
The Integrated Management of Food Processing Waste: The Use of the Full Cost Method for Planning and Pricing Mediterranean Citrus By-Products Daniele Vergamini, David Cuming, and Davide Viaggi.....
p. 153
10.
Syngenta: Changing a Global Company Elizabeth A Yeager, W. Scott Downey, and David A Widmar....................................................................................
p. 173
2015 International Food and Agribusiness Management Association (IFAMA). All rights reserved. ii

International Food and Agribusiness Management Review Volume 18 Issue 2, 2015
EDITOR’S NOTE Dear Colleagues, Enclosed is our second issue of the year. It is important to stop and thank the editorial team at the IFAMR for publishing its 26th straight quarterly issue on time. It is another full issue with ten articles, nine research manuscripts and one case study. Well done team. We continue to support scholars’ ambitions who seek to publish special issues on a topic of their choice. Forthcoming in June will be a special issue on the Global Poultry Industry, edited by staff at the USDA-ERS. We will issue calls at the annual meeting next month for two new special issues; one on big data and agribusiness edited by an industry-academic team put together by Conservis, LLC of Minneapolis; and a second special issue by a USDA-ERS team on the future of the global dairy complex. Look for the calls so you can get your work published. There are a number of very nice pieces in this issue. Let me draw your attention to a couple of highlights. First is a teaching case study on Syngenta that has students exploring the critical area of relationship marketing and customer intimacy. The work is poignant as firms explore news ways to connect with customers who increasingly have alternatives ways to increase profitability. We bring to the IFAMR readership two articles from Asian authors sharing perspectives on new high growth markets in the global food system. There are three articles from Italian authors. Thanks in no small part to our managing editor, Alessio Cavicchi at the University of Macerata, we have seen a dramatic increase in submissions from Italy. Finally, consistent with the IFAMA strategy supporting; students looking for jobs and firms seeking high quality talent, we published an interesting paper from the United States on gender balance among food and agribusiness applicants. Peter Goldsmith, Executive Editor, IFAMR
© 2015 International Food and Agribusiness Management Association (IFAMA). All rights reserved. iii

International Food and Agribusiness Management Review Volume 18 Issue 1, 2015
© 2015 International Food and Agribusiness Management Association (IFAMA). All rights reserved. iv
International Food and Agribusiness Management Review Volume 18 Issue 2, 2015
Grocery Shopping via T-Commerce in Korea:
New Shopping Channel Adoption Behavior Based on Prior E-Commerce Experience
Dongmin Leea, Haeyoung Jeongb, Jongpyo Choc, Jaeseok Jeong d, and Junghoon Moone
aResearcher , Food Business Lab., Program in Regional Information, Seoul National University 1, Gwanak-ro, Gwanak-gu, Seoul, 151-742, Republic of Korea
b Researcher, International Market Research Division, Gallup Korea
70, Sajik-ro, Chongro-gu, Seoul, 110-054, Republic of Korea
c Researcher, Food Business Lab., Program in Regional Information, Seoul National University 1, Gwanak-ro, Gwanak-gu, Seoul, 151-742, Republic of Korea
d Associate professor, Graduate School of Pan-Pacific International Studies, Kyung Hee University
1732, Deogyeong-daero, Giheung-gu, Yongin, 446-701, Republic of Korea
e Associate professor, Food Business Lab., Program in Regional Information, Seoul National University 1, Gwanak-ro, Gwanak-gu, Seoul, 151-742, Republic of Korea
Abstract The main goal of this study is to investigate the willingness to adopt t-commerce for grocery shopping in South Korea. This study endeavors to recognize existing differences among consumer behaviors based on e-commerce experience. The sample was divided into two groups: one group with online grocery shopping experience and one group without online grocery shopping experience. The groups were compared to identify differences in willingness to adopt t-commerce as a new shopping medium. The two groups showed different motivations for t-commerce-based grocery shopping based on their previous shopping experience. Keywords: t-commerce, online grocery shopping, Internet Protocol Television, compatibility
Corresponding author: Tel: + 82.2.880.4722
Email: D. Lee: [email protected] H. Jeong: [email protected] J. Cho: [email protected] J. Jeong: [email protected] J. Moon: [email protected]
2015 International Food and Agribusiness Management Association (IFAMA). All rights reserved
1
Lee et al. Volume 18 Issue 2, 2015
Introduction As part of a direct agricultural market policy, the Korean government informatized agriculture by developing electronic commerce (e-commerce) in the late 1990s for local farmers (Moon et al. 2012). E-commerce has been associated with policies that shortened the supply chain by minimizing the role of a middleman, and thus provide consumers fresher product at lower prices along with higher profits for farmers. This has contributed to continuously expanding the e-commerce market for agricultural products; the market has increased from 182 million USD in 2001 to 3,847 million USD in 2012 (Statistics Korea 2013). The retail formats of grocery shopping have diversified into e-commerce and other non-store formats. Following the success of e-commerce as a medium for the direct agricultural market, TV commerce (t-commerce) based on Internet Protocol TV (IPTV) has received attention as an innovative transaction channel for increased competitiveness of the agricultural sector. T-commerce is an electronically mediated form of commerce that uses television as an interactive tool (Yu et al. 2005). T-commerce is also a non-store transaction format, similar to TV home shopping and e-commerce. This tool, like that of previous e-commerce activities, is expected to shorten the previous supply chain and thus enhance the welfare of farmers and consumers. Although the number of IPTV subscribers in South Korea has been increasing, and exceeded 7 million in 2013, the current t-commerce market is still in initial stages relative to other non-store transaction formats (Korea On-Line Shopping & Association 2013). Moreover, only a few empirical and theoretical studies address t-commerce in academia. Only a few studies (e.g., Yu et al. 2005, Brown et al. 2006, Park 2008, Jung 2011, Kim et al. 2011) focused on finding the factors that affect users’ adoption of t-commerce. This study is the first to compare customers’ attitudes toward adopting t-commerce by focusing on consumers’ previous online grocery shopping experience. The main goals of this study are as follows:
(1) to examine the relationship between prior online grocery shopping experience and preference for other retail formats (Study 1) and;
(2) to investigate the differences in attitudes toward adopting t-commerce for grocery shopping, based on prior online grocery shopping experience (Study 2).
T-Commerce and IPTV in Korea T-commerce refers to ‘all kinds of commercial services that occur through a digital set top box of either a cable TV or an IPTV’ (Lee 2013). As an electronically mediated business, t-commerce uses interactive television that combines video, voice, and transactional functions (Yu et al. 2005). It is one of various non-store shopping formats, such as TV home shopping and e-commerce (Dholakia et al. 2002). Oh (2010) classified t-commerce as ‘exclusive t-commerce’ and ‘subsidiary t-commerce’. Exclusive t-commerce provides t-commerce services only via an exclusive television channel. Subsidiary t-commerce, however, synchronizes with an existing television channel such as cable
2015 International Food and Agribusiness Management Association (IFAMA). All rights reserved
2
Lee et al. Volume 18 Issue 2, 2015
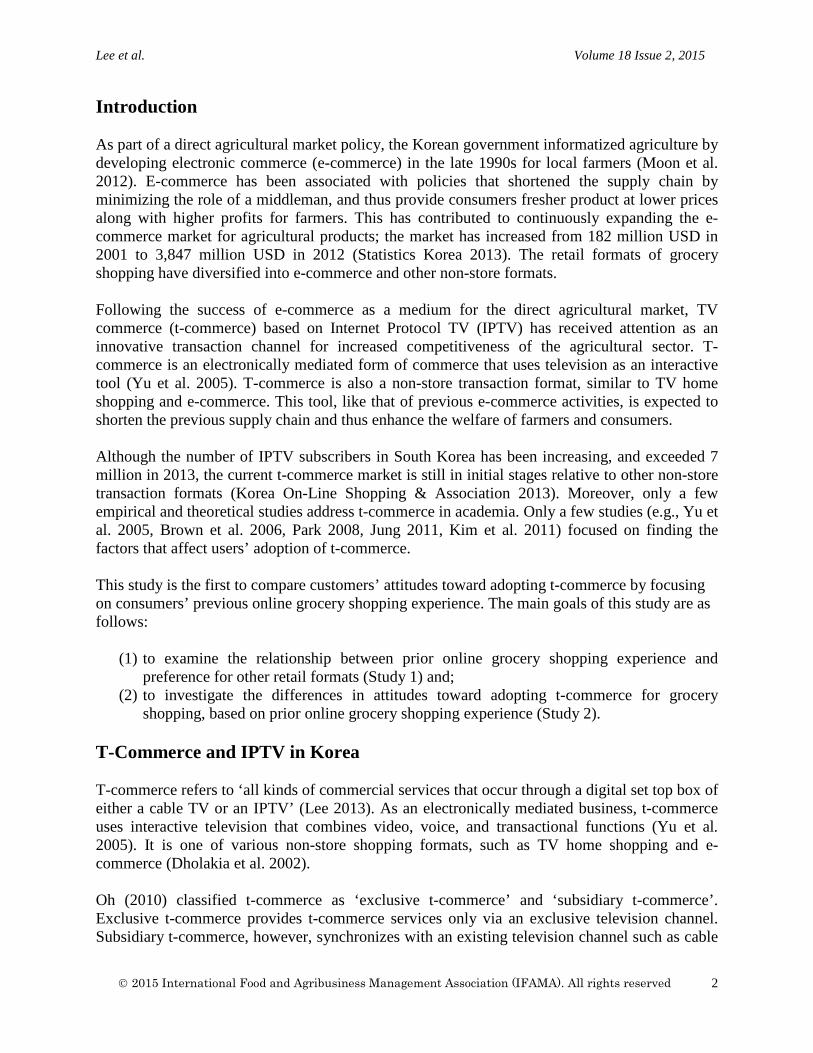
or terrestrial channels to provide t-commerce services. Most existing t-commerce channels in Korea are subsidiary t-commerce, and usually synchronize with TV home shopping channels. T-commerce in Korea is still at an early stage. Nevertheless, South Korea’s t-commerce market is expected to increase substantially as shown in Table 1. According to the Korea Communications Commission (KCC), the t-commerce market increased by an estimated 170 million USD in 2014. Table 1. Sales growth of and prospects for t-commerce (unit: million USD)
2010 2011 2012 2013(F) 2014(F) Sales 56.81 75.75 85.22 113.63 160.97 Growth Rate - 33.3% 12.5% 33.3% 41.7%
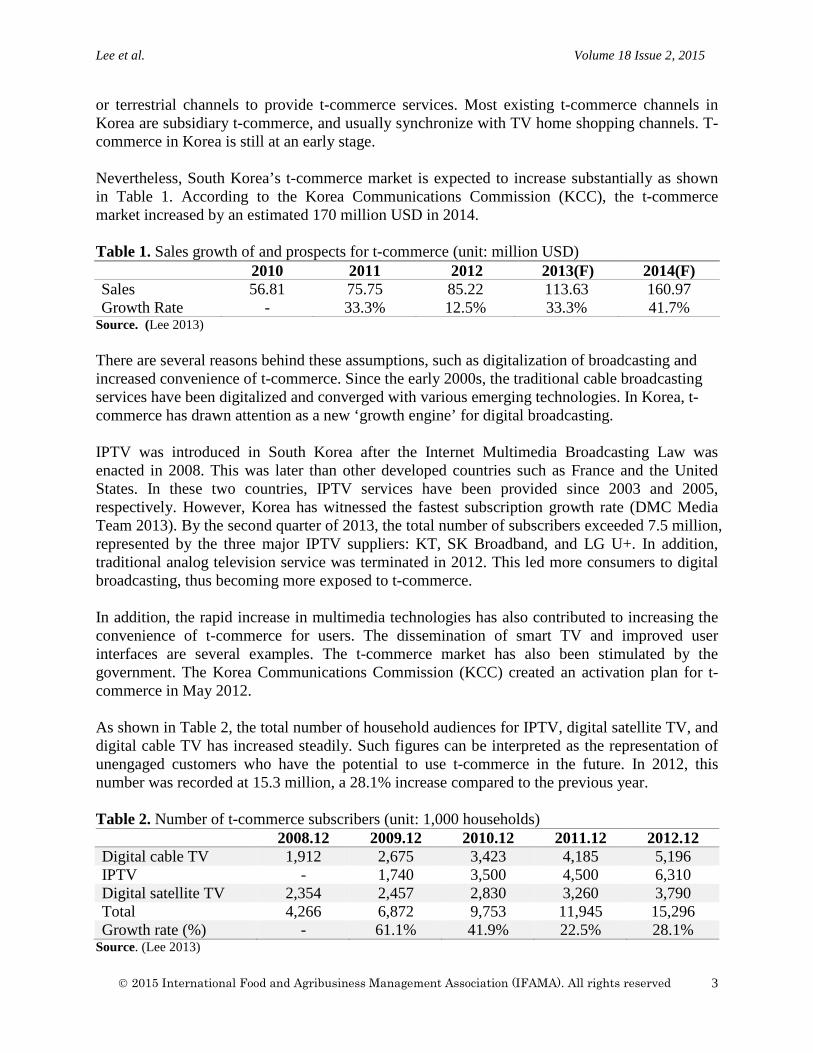
Source. (Lee 2013) There are several reasons behind these assumptions, such as digitalization of broadcasting and increased convenience of t-commerce. Since the early 2000s, the traditional cable broadcasting services have been digitalized and converged with various emerging technologies. In Korea, t-commerce has drawn attention as a new ‘growth engine’ for digital broadcasting. IPTV was introduced in South Korea after the Internet Multimedia Broadcasting Law was enacted in 2008. This was later than other developed countries such as France and the United States. In these two countries, IPTV services have been provided since 2003 and 2005, respectively. However, Korea has witnessed the fastest subscription growth rate (DMC Media Team 2013). By the second quarter of 2013, the total number of subscribers exceeded 7.5 million, represented by the three major IPTV suppliers: KT, SK Broadband, and LG U+. In addition, traditional analog television service was terminated in 2012. This led more consumers to digital broadcasting, thus becoming more exposed to t-commerce. In addition, the rapid increase in multimedia technologies has also contributed to increasing the convenience of t-commerce for users. The dissemination of smart TV and improved user interfaces are several examples. The t-commerce market has also been stimulated by the government. The Korea Communications Commission (KCC) created an activation plan for t-commerce in May 2012. As shown in Table 2, the total number of household audiences for IPTV, digital satellite TV, and digital cable TV has increased steadily. Such figures can be interpreted as the representation of unengaged customers who have the potential to use t-commerce in the future. In 2012, this number was recorded at 15.3 million, a 28.1% increase compared to the previous year. Table 2. Number of t-commerce subscribers (unit: 1,000 households)
2008.12 2009.12 2010.12 2011.12 2012.12 Digital cable TV 1,912 2,675 3,423 4,185 5,196 IPTV - 1,740 3,500 4,500 6,310 Digital satellite TV 2,354 2,457 2,830 3,260 3,790 Total 4,266 6,872 9,753 11,945 15,296 Growth rate (%) - 61.1% 41.9% 22.5% 28.1%
Source. (Lee 2013)
2015 International Food and Agribusiness Management Association (IFAMA). All rights reserved
3
Lee et al. Volume 18 Issue 2, 2015
Although all channels listed in Table 2 are eligible to provide t-commerce services, IPTV holds the biggest market share and expected growth (Kim et al. 2006). Therefore, in this study, the scope of defining t-commerce is limited to IPTV.
Despite the increase in t-commerce, only a few empirical and theoretical studies address t-commerce in academia. Some studies (e.g., Park 2008, Kim et al. 2011) addressed consumers’ prior experience in other non-store media as an important factor that explains the current extension of t-commerce technology. Park (2008) investigated factors that influence willingness to adopt t-commerce. The results showed that the maximum willingness to pay for t-commerce tends to increase along with an increase in the average frequency of non-store transactions per month. Kim et al. (2011) also referred to compatibility in explaining the adoption of t-commerce, which they called ‘media substitutability’. The positive effect of the perceived substitutability of t-commerce for e-commerce on user intention to adopt t-commerce was investigated. Here, t-commerce is assumed to have similar functions to support e-commerce transactions; therefore, t-commerce is compatible with e-commerce. Although prior studies have attempted to draw out a relationship between a consumer’s experience and t-commerce, such studies were focused on ‘perceived’ media substitutability (Kim et al. 2011). Instead of examining the effect of ‘perceived’ substitutability, the present study endeavors to recognize the existing differences among the behaviors of t-commerce adoption, based on e-commerce experience by asking directly about the frequency of and preference for each retail format. Moreover, various retail formats (i.e., physical store, TV home shopping, e-commerce) were addressed to investigate the change within existing formats used when a new retail format is adopted. Park (2008) only examined within non-store retail formats.
Theoretical Background Kemp et al. (1998) argued that new technology or advanced technology is not easily accepted and adapted by society. There is not just one barrier to the introduction of alternative or new technologies; various factors hinder the introduction and diffusion. Numerous conditions and methods are required to fit the new technology into the world. Rodger’s (1995) innovation diffusion theory explains the barriers to new technology and the adoption process of information technologies in many studies. According to Rodger (1995), the technology adoption rate is affected by five innovation attributes: relative compatibility, relative advantage, complexity, trialability, and observability. In the same study, Rodger (1995) defined compatibility as ‘the degree to which an innovation is perceived as consistent with the existing values, past experiences, and needs of potential adopters’ (p. 224). Rodger stated that people are more likely to adopt an innovation they feel comfortable with, due to previous experience using a technology with similar functions. Wu et al. (2005) found that compatibility had the most significant influence on perceived usefulness and users’ behavioral intent to use. The researchers empirically tested the integrated model of innovation diffusion theory and the technology acceptance model (TAM). Other scholars agreed that people are more likely to adopt new information technologies compatible with those used previously (Joo et al. 2006, LaRose et al. 1992, Sarrina Li 2004). For
2015 International Food and Agribusiness Management Association (IFAMA). All rights reserved
4
Lee et al. Volume 18 Issue 2, 2015
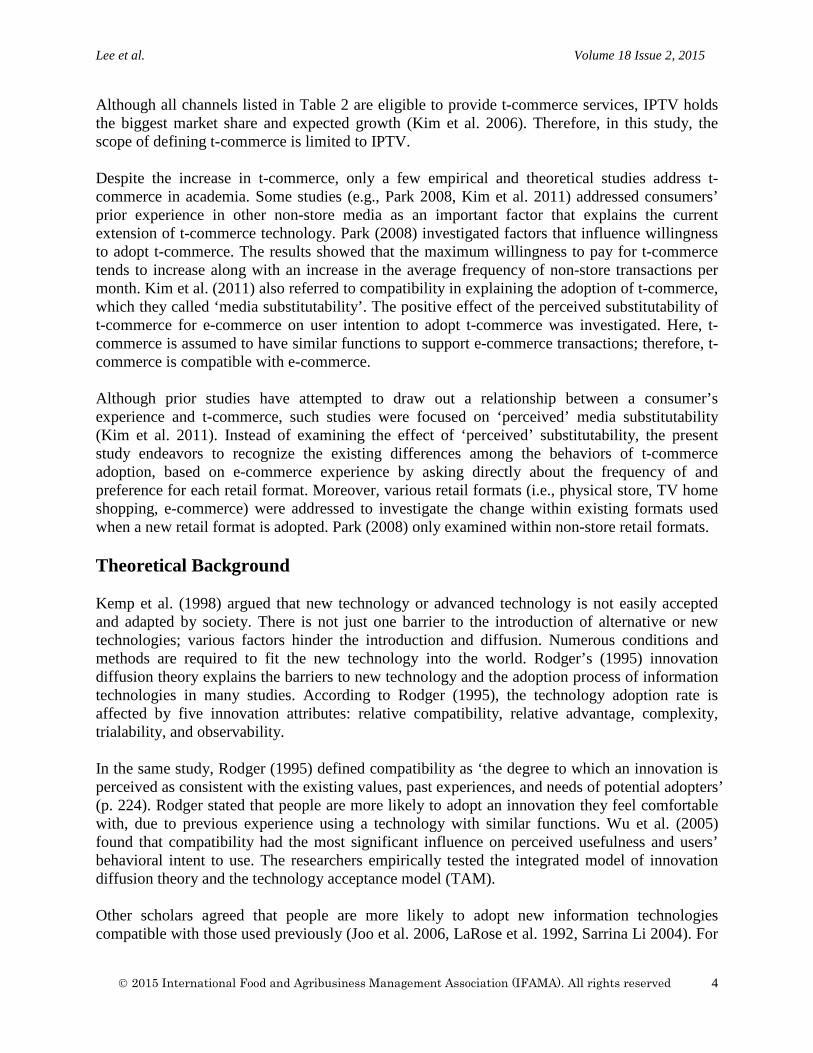
instance, according to Joo et al. (2006) individual intimateness, habit, and functional similarity positively influence the adoption intention when consumers adopt new technology, such as interactive TV. LaRose et al. (1992) investigated the adoption of phone-delivered information services, and Sarrina Li (2004) showed the effect of previous usage experience of similar technology in the adoption of interactive cable television. The effect of technology compatibility has also been explored in the field of retail formats choice. For instance, Eastin (2002) assessed the effect the experience formed through telephone and Internet usage on the adoption of four e-commerce activities (online shopping, online banking, online investing, and electronic payment for Internet services). According to the results, the experience built from previous use of telephone and the Internet positively affected the adoption of all four e-commerce activities. Hypothesis Development Study 1. Relationship between online grocery shopping experience and other grocery shopping channels experience
Figure 1. Relationship between online grocery shopping experience and other grocery shopping channels experience
Study 1 investigated the relationship between online grocery shopping experience and other grocery shopping channels (Figure 1). The ‘compatibility’ of online grocery shopping experience with existing grocery shopping channels was examined first, before addressing the effect of online grocery shopping experience on t-commerce adoption behavior.
Figure 2. Shift from physical stores to non-store retail formats Source. Dholakia et al. 2002
2015 International Food and Agribusiness Management Association (IFAMA). All rights reserved
5
Lee et al. Volume 18 Issue 2, 2015
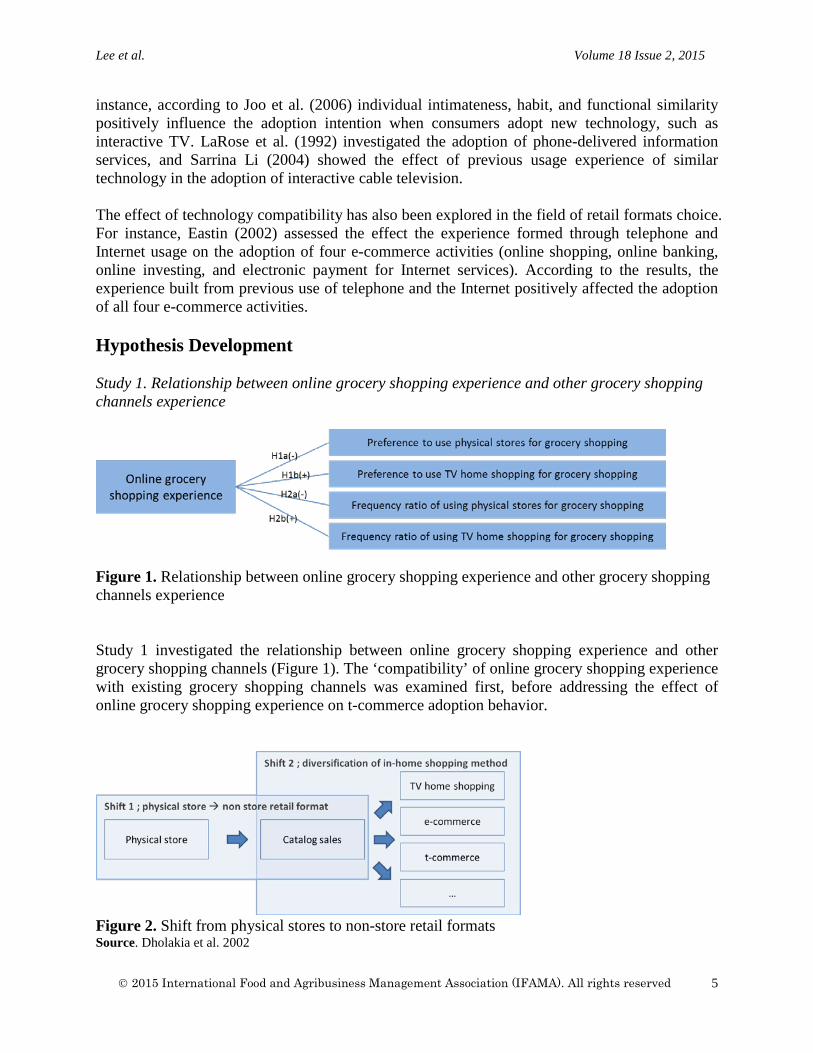
The shift from physical stores to non-store retail formats is divided into two levels (Figure 2; Dholakia et al. 2002). After the shift from physical stores to catalog sales, further shifts may occur within various in-house shopping media ranging from catalog sales and TV home shopping to e-commerce (Dholakia et al. 2002). Since the compatibility of newly introduced innovations with existing technologies is critical (Rodger 1995), e-commerce can be assumed to be compatible with other non-store retail formats (e.g., TV home shopping) but less compatible with traditional physical stores. Thus, consumers without e-commerce experience may favor physical stores with higher frequency compared to those with prior experience. However, consumers with online grocery shopping experience may prefer to use TV home shopping with higher prevalence than consumers without online grocery shopping experience.
H1a: Consumers without online grocery shopping experience prefer to use physical stores more than consumers with online grocery shopping experience.
H1b: Consumers with online grocery shopping experience prefer to use TV home shopping more than consumers without online grocery shopping experience.
H2a: Consumers without online grocery shopping experience use physical stores more frequently than consumers with online grocery shopping experience.
H2b: Consumers with online grocery shopping experience use TV home shopping more frequently than consumers without online grocery shopping experience.
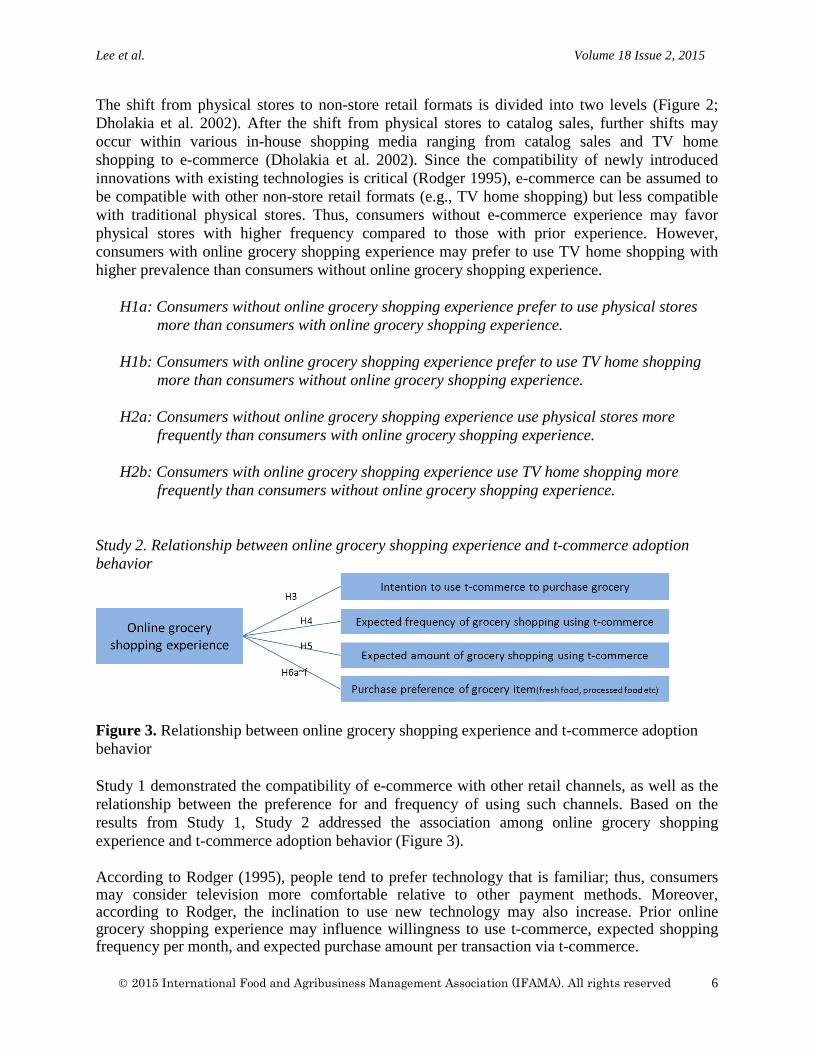
Study 2. Relationship between online grocery shopping experience and t-commerce adoption behavior
Figure 3. Relationship between online grocery shopping experience and t-commerce adoption behavior Study 1 demonstrated the compatibility of e-commerce with other retail channels, as well as the relationship between the preference for and frequency of using such channels. Based on the results from Study 1, Study 2 addressed the association among online grocery shopping experience and t-commerce adoption behavior (Figure 3). According to Rodger (1995), people tend to prefer technology that is familiar; thus, consumers may consider television more comfortable relative to other payment methods. Moreover, according to Rodger, the inclination to use new technology may also increase. Prior online grocery shopping experience may influence willingness to use t-commerce, expected shopping frequency per month, and expected purchase amount per transaction via t-commerce.
2015 International Food and Agribusiness Management Association (IFAMA). All rights reserved
6
Lee et al. Volume 18 Issue 2, 2015
H3: Consumers with online grocery shopping experience have higher willingness to use t-commerce than consumers without online grocery shopping experience.
H4: Consumers with online grocery shopping experience have higher expected shopping frequency using t-commerce than consumers without online grocery shopping experience.
H5: Consumers with online grocery shopping experience have higher purchase amount expected per transaction when using t-commerce than consumers without online grocery shopping experience.
Fresh agricultural products such as vegetables, meats, and fruits are highly heterogeneous, and create different consumer perceptions of product quality (Chung et al. 2006). The complexity in describing such products increases the level of difficulty for consumers to try the goods (Choe et al. 2009). However, more standardized items such as processed or half-processed food are relatively homogeneous, where consumers are less concerned about the freshness of the product. Therefore, grocery items can be either homogeneous or heterogeneous, as can be seen in the range of agricultural products and processed items, respectively. Based on this understanding, the issue of product quality information and its effect on consumers’ willingness to make e-commerce purchases was raised. The findings suggested that customers are willing to pay extra for an item in return for premium information regarding possible risks associated with the product’s heterogeneity. Such data can be applied to e-commerce and t-commerce. This especially concerns the perspective that suggests consumers lack awareness to verify the quality of a heterogeneous product, which generates the issue of information quality. In the present study, six items were selected: three items (fresh vegetables, meats, and fruits) as the heterogeneous category and three other items (half-processed, processed, and grains) as the homogeneous category. Based on this information, a question regarding the differences in grocery shopping behavior shown between e-commerce and t-commerce experience was raised. Previous e-commerce experience may minimize the level of information necessary to increase the preference for t-commerce as a medium for grocery shopping to match that of e-commerce.
H6a–f: Consumers with online grocery shopping experience prefer to shop for grocery items
such as fresh vegetables (H6a), meats (H6b), fruits (H6c), half-processed food (H6d), processed food (H6e), and grains (H6f) using t-commerce more than consumers without online grocery shopping experience.
Data Collection and Sample
A survey was conducted to study the willingness of consumers to use t-commerce for grocery shopping. The survey was conducted in South Korea in May of 2012 with 498 female consumers aged 25 to 59 years who currently subscribe to IPTV services. The average household income was $4,000USD per month, 10% of which was allocated to purchase food on average.
2015 International Food and Agribusiness Management Association (IFAMA). All rights reserved
7
Lee et al. Volume 18 Issue 2, 2015
Questionnaires were developed to explore the relationship between online grocery shopping experience and other grocery shopping channels (see Appendix). The respondents were asked to indicate their preference for each grocery shopping channel, such as physical store, TV home shopping, and e-commerce, using a seven-point Likert scale. There was also an open question that asked about the usage frequency per month of each channel. From this, the relationship between online grocery shopping experience and t-commerce adoption behavior was investigated. After brief instructions were provided about how to use t-commerce for grocery shopping, participants were asked to indicate their willingness to use the channel with a seven-point scale. Expected frequency and expected purchase rate using t-commerce were asked about as open questions. Last, when t-commerce is used, the preferences for each item for grocery shopping were asked with the same seven-point scale. Data Collection and Sample
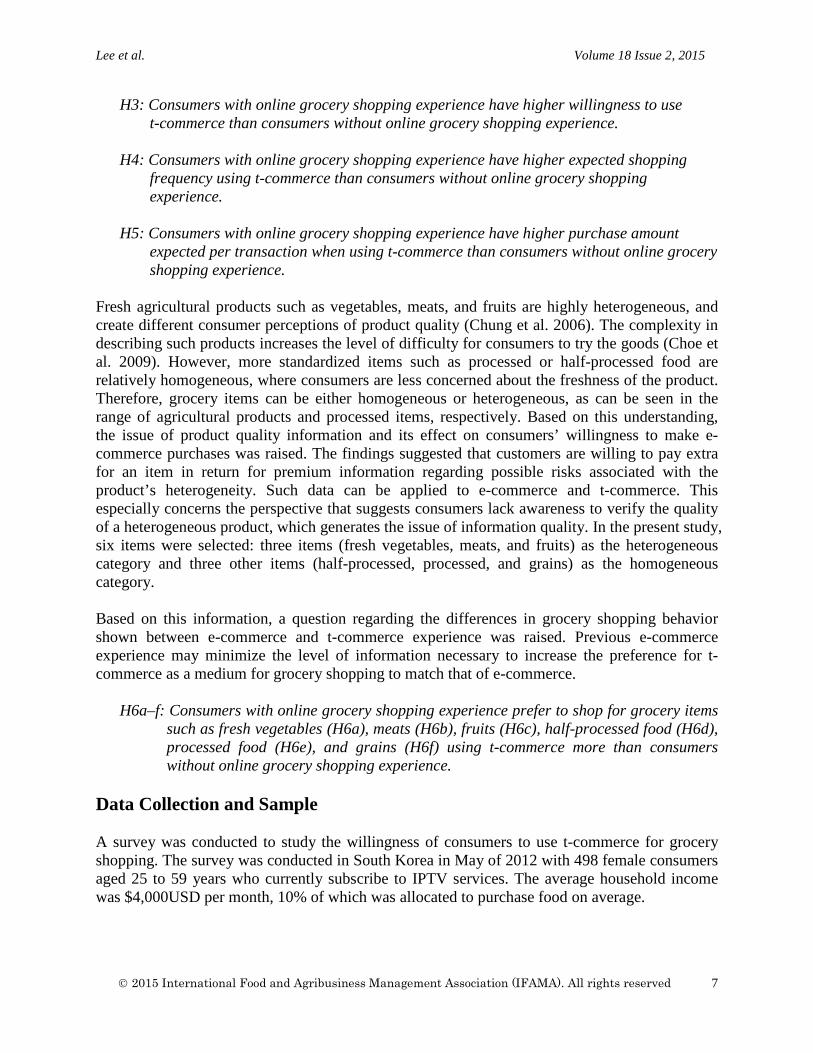
The demographic characteristics of the respondents are presented in Table 3. The average age of the participants was 39 years old. The majority was married, and about half of the respondents were housewives. Table 3. Demographic characteristics of respondents Frequency Percentage
Age (n=498) 25-34 160 32.1 35-44 200 40.2 44-60 138 27.7
Marital status (n=498) Married 427 85.7 Single 71 14.3
Occupation (n=498) Housewife 241 48.4 Other 257 51.6
Profile of Consumers with Online Grocery Shopping Experience and Consumers without Online Grocery Shopping Experience
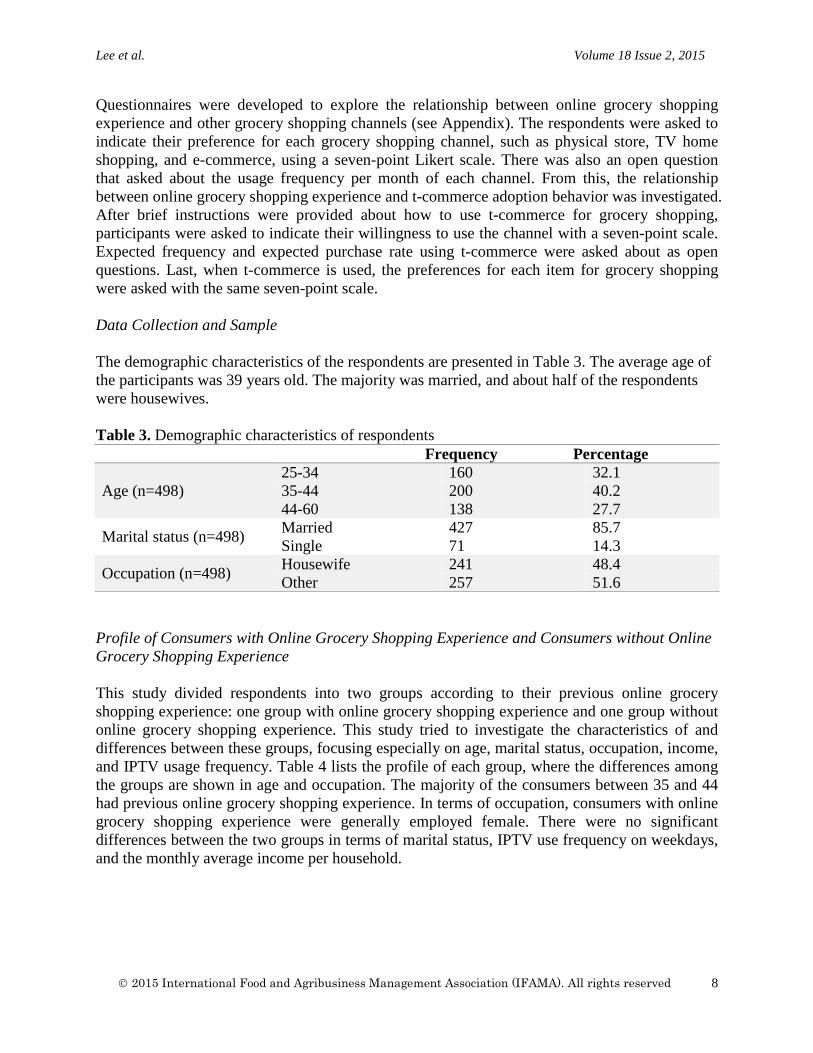
This study divided respondents into two groups according to their previous online grocery shopping experience: one group with online grocery shopping experience and one group without online grocery shopping experience. This study tried to investigate the characteristics of and differences between these groups, focusing especially on age, marital status, occupation, income, and IPTV usage frequency. Table 4 lists the profile of each group, where the differences among the groups are shown in age and occupation. The majority of the consumers between 35 and 44 had previous online grocery shopping experience. In terms of occupation, consumers with online grocery shopping experience were generally employed female. There were no significant differences between the two groups in terms of marital status, IPTV use frequency on weekdays, and the monthly average income per household.
2015 International Food and Agribusiness Management Association (IFAMA). All rights reserved
8
Lee et al. Volume 18 Issue 2, 2015
Table 4. Profile of consumers with and without online grocery shopping experience (n=498)
Customers without online grocery shopping experience (n=191, 38.4%)
Customers with online grocery shopping experience (n=307, 61.6%)
Age* 25-34 69 (13.9%) 91 (18.3%) 35-44 60 (12.0%) 140 (28.1%) 44-60 62 (12.5%) 76 (15.2%)
Marital status Married 164 (33.0%) 263 (52.8%) Single 27 (5.4%) 44 (8.8%)
Occupation* Housewife 106 (21.3%) 135 (27.1%) Employed 85 (17.1%) 172 (34.5%)
IPTV use frequency during weekdays
Less than 6 hours 120 (24.1%) 198 (39.7%) More than 6 hours 71 (14.3%) 109 (21.9%)
Monthly average income 4,423 USD 4,540 USD *p<0.01
Data Analyses and Results Study 1. Relationship between online grocery shopping experience and other grocery shopping channels
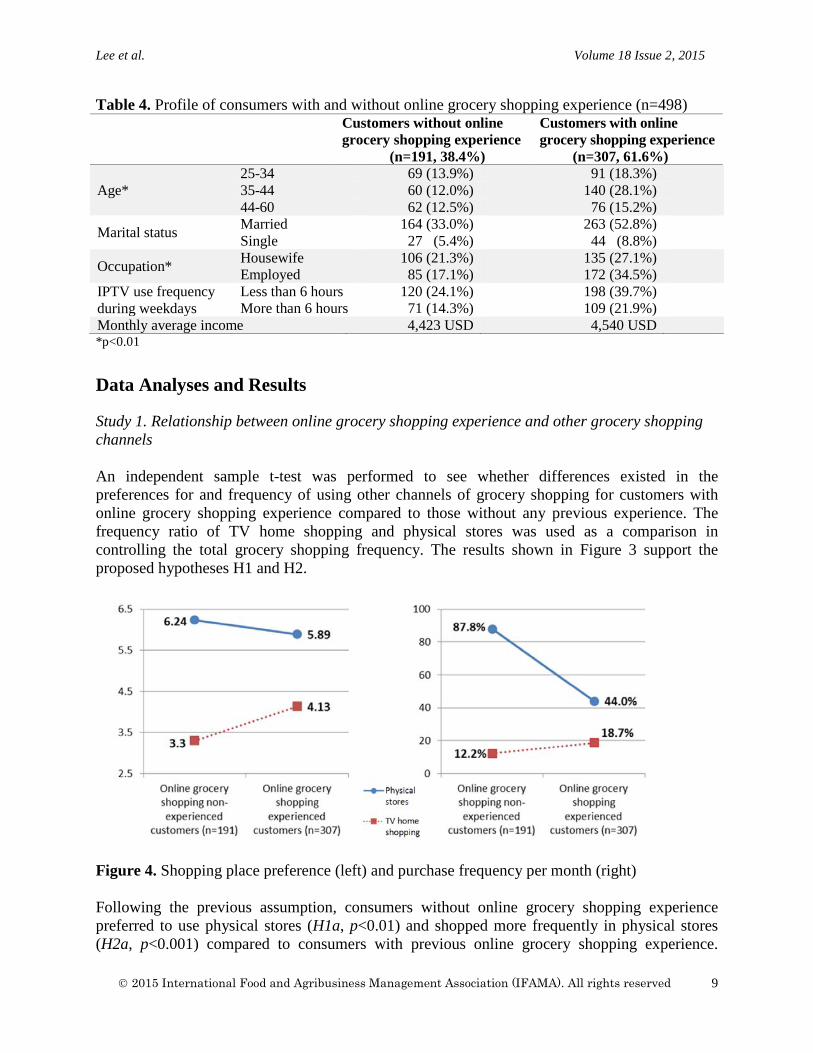
An independent sample t-test was performed to see whether differences existed in the preferences for and frequency of using other channels of grocery shopping for customers with online grocery shopping experience compared to those without any previous experience. The frequency ratio of TV home shopping and physical stores was used as a comparison in controlling the total grocery shopping frequency. The results shown in Figure 3 support the proposed hypotheses H1 and H2.
Figure 4. Shopping place preference (left) and purchase frequency per month (right)
Following the previous assumption, consumers without online grocery shopping experience preferred to use physical stores (H1a, p<0.01) and shopped more frequently in physical stores (H2a, p<0.001) compared to consumers with previous online grocery shopping experience.
2015 International Food and Agribusiness Management Association (IFAMA). All rights reserved
9
Lee et al. Volume 18 Issue 2, 2015
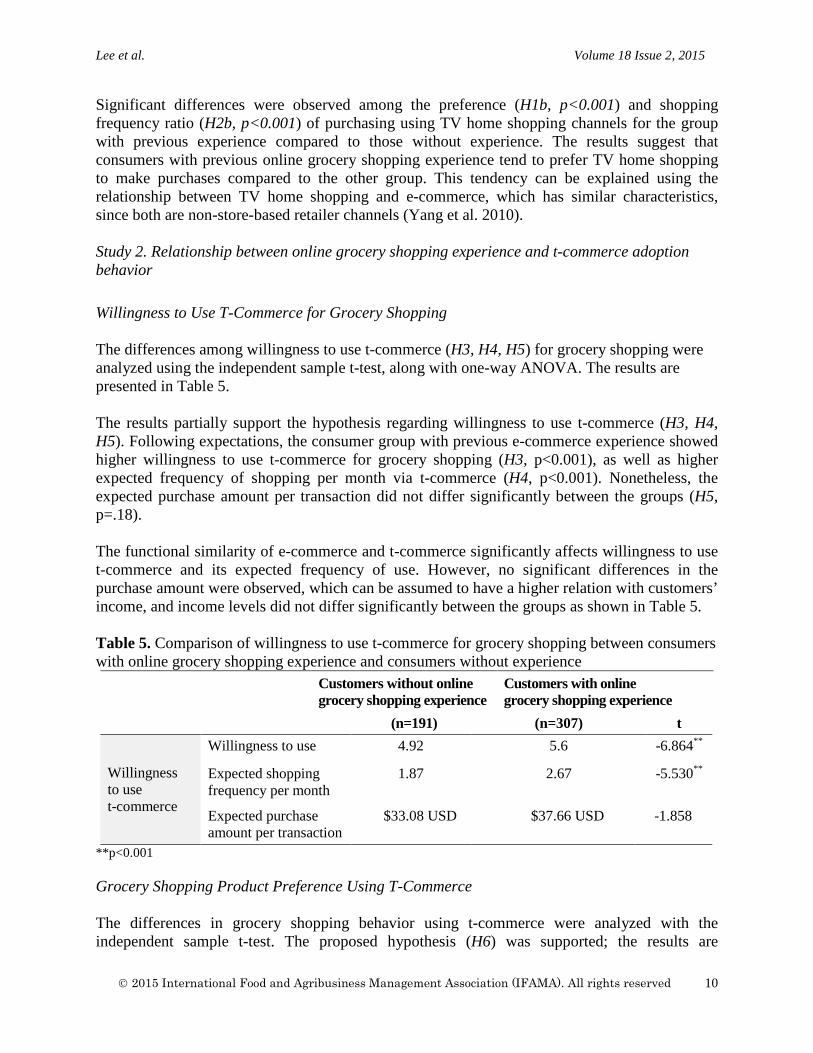
Significant differences were observed among the preference (H1b, p<0.001) and shopping frequency ratio (H2b, p<0.001) of purchasing using TV home shopping channels for the group with previous experience compared to those without experience. The results suggest that consumers with previous online grocery shopping experience tend to prefer TV home shopping to make purchases compared to the other group. This tendency can be explained using the relationship between TV home shopping and e-commerce, which has similar characteristics, since both are non-store-based retailer channels (Yang et al. 2010). Study 2. Relationship between online grocery shopping experience and t-commerce adoption behavior
Willingness to Use T-Commerce for Grocery Shopping
The differences among willingness to use t-commerce (H3, H4, H5) for grocery shopping were analyzed using the independent sample t-test, along with one-way ANOVA. The results are presented in Table 5. The results partially support the hypothesis regarding willingness to use t-commerce (H3, H4, H5). Following expectations, the consumer group with previous e-commerce experience showed higher willingness to use t-commerce for grocery shopping (H3, p<0.001), as well as higher expected frequency of shopping per month via t-commerce (H4, p<0.001). Nonetheless, the expected purchase amount per transaction did not differ significantly between the groups (H5, p=.18). The functional similarity of e-commerce and t-commerce significantly affects willingness to use t-commerce and its expected frequency of use. However, no significant differences in the purchase amount were observed, which can be assumed to have a higher relation with customers’ income, and income levels did not differ significantly between the groups as shown in Table 5. Table 5. Comparison of willingness to use t-commerce for grocery shopping between consumers with online grocery shopping experience and consumers without experience
Customers without online grocery shopping experience
Customers with online grocery shopping experience
(n=191) (n=307) t
Willingness to use t-commerce
Willingness to use 4.92 5.6 -6.864**
Expected shopping frequency per month
1.87 2.67 -5.530**
Expected purchase amount per transaction
$33.08 USD $37.66 USD -1.858
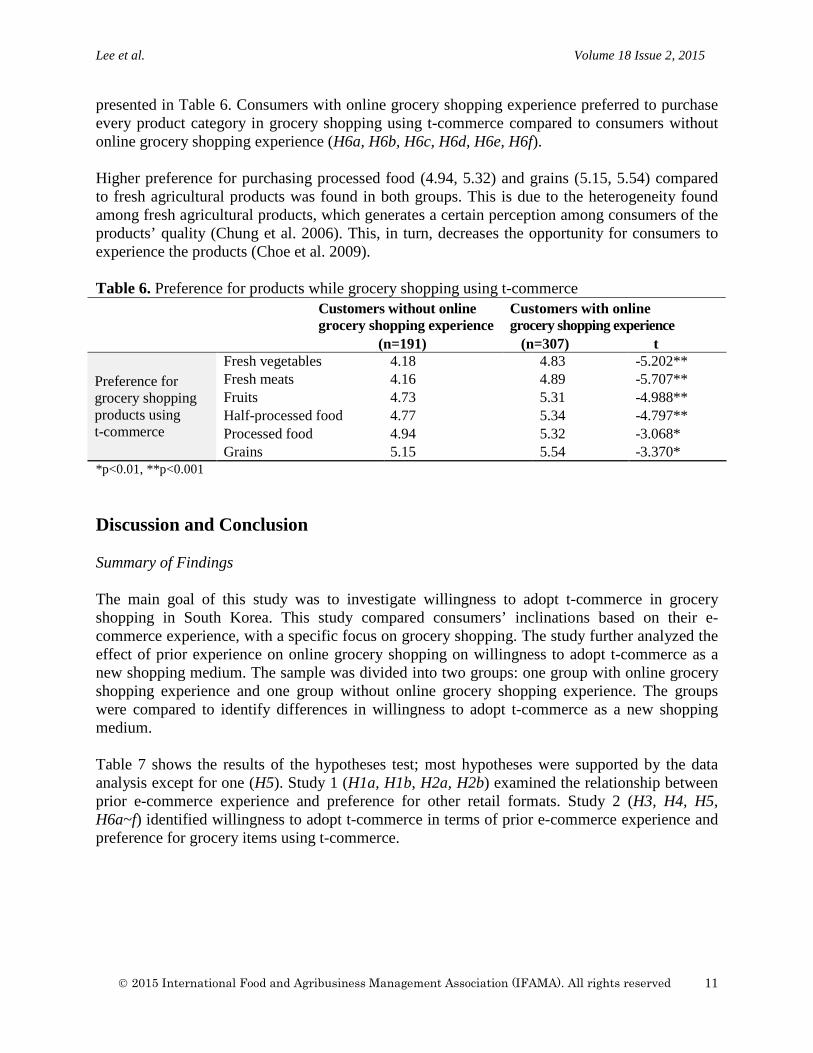
**p<0.001 Grocery Shopping Product Preference Using T-Commerce
The differences in grocery shopping behavior using t-commerce were analyzed with the independent sample t-test. The proposed hypothesis (H6) was supported; the results are
2015 International Food and Agribusiness Management Association (IFAMA). All rights reserved
10
Lee et al. Volume 18 Issue 2, 2015
presented in Table 6. Consumers with online grocery shopping experience preferred to purchase every product category in grocery shopping using t-commerce compared to consumers without online grocery shopping experience (H6a, H6b, H6c, H6d, H6e, H6f). Higher preference for purchasing processed food (4.94, 5.32) and grains (5.15, 5.54) compared to fresh agricultural products was found in both groups. This is due to the heterogeneity found among fresh agricultural products, which generates a certain perception among consumers of the products’ quality (Chung et al. 2006). This, in turn, decreases the opportunity for consumers to experience the products (Choe et al. 2009). Table 6. Preference for products while grocery shopping using t-commerce
Customers without online grocery shopping experience
Customers with online grocery shopping experience
(n=191) (n=307) t
Preference for grocery shopping products using t-commerce
Fresh vegetables 4.18 4.83 -5.202** Fresh meats 4.16 4.89 -5.707** Fruits 4.73 5.31 -4.988** Half-processed food 4.77 5.34 -4.797** Processed food 4.94 5.32 -3.068* Grains 5.15 5.54 -3.370*
*p<0.01, **p<0.001 Discussion and Conclusion
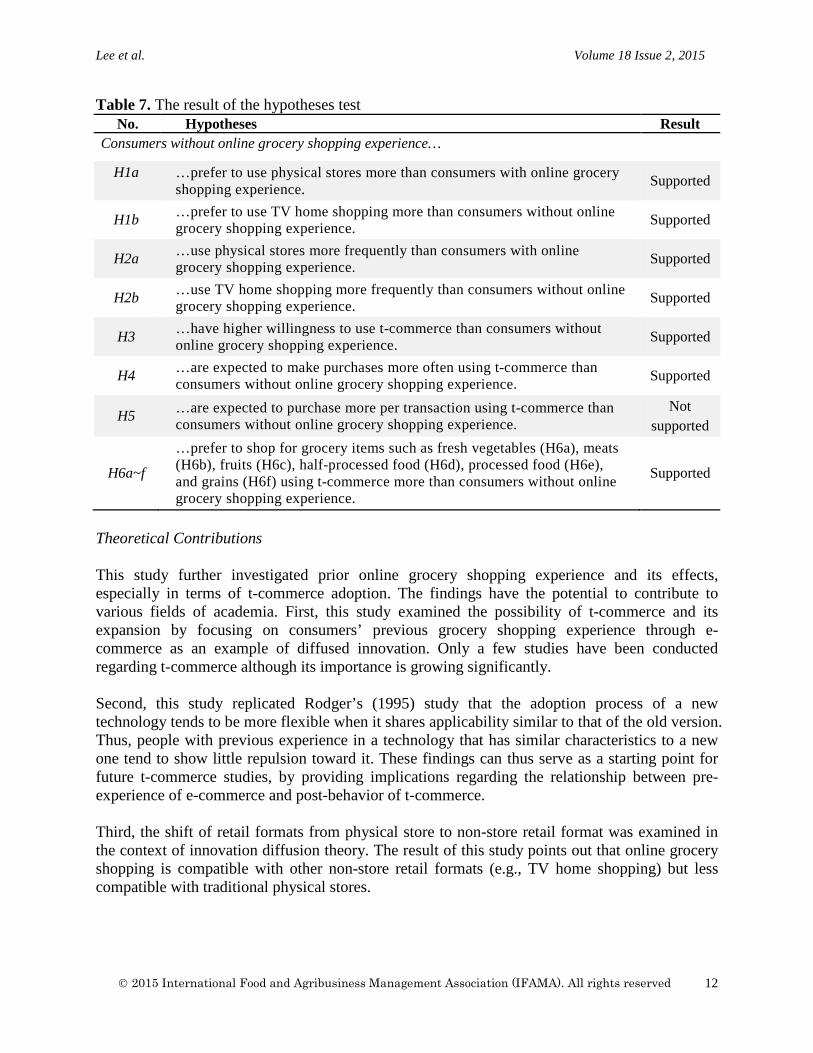
Summary of Findings The main goal of this study was to investigate willingness to adopt t-commerce in grocery shopping in South Korea. This study compared consumers’ inclinations based on their e-commerce experience, with a specific focus on grocery shopping. The study further analyzed the effect of prior experience on online grocery shopping on willingness to adopt t-commerce as a new shopping medium. The sample was divided into two groups: one group with online grocery shopping experience and one group without online grocery shopping experience. The groups were compared to identify differences in willingness to adopt t-commerce as a new shopping medium. Table 7 shows the results of the hypotheses test; most hypotheses were supported by the data analysis except for one (H5). Study 1 (H1a, H1b, H2a, H2b) examined the relationship between prior e-commerce experience and preference for other retail formats. Study 2 (H3, H4, H5, H6a~f) identified willingness to adopt t-commerce in terms of prior e-commerce experience and preference for grocery items using t-commerce.
2015 International Food and Agribusiness Management Association (IFAMA). All rights reserved
11
Lee et al. Volume 18 Issue 2, 2015
Table 7. The result of the hypotheses test No. Hypotheses Result
Consumers without online grocery shopping experience…
H1a …prefer to use physical stores more than consumers with online grocery shopping experience. Supported
H1b …prefer to use TV home shopping more than consumers without online grocery shopping experience. Supported
H2a …use physical stores more frequently than consumers with online grocery shopping experience. Supported
H2b …use TV home shopping more frequently than consumers without online grocery shopping experience. Supported
H3 …have higher willingness to use t-commerce than consumers without online grocery shopping experience. Supported
H4 …are expected to make purchases more often using t-commerce than consumers without online grocery shopping experience. Supported
H5 …are expected to purchase more per transaction using t-commerce than consumers without online grocery shopping experience.
Not supported
H6a~f
…prefer to shop for grocery items such as fresh vegetables (H6a), meats (H6b), fruits (H6c), half-processed food (H6d), processed food (H6e), and grains (H6f) using t-commerce more than consumers without online grocery shopping experience.
Supported
Theoretical Contributions This study further investigated prior online grocery shopping experience and its effects, especially in terms of t-commerce adoption. The findings have the potential to contribute to various fields of academia. First, this study examined the possibility of t-commerce and its expansion by focusing on consumers’ previous grocery shopping experience through e-commerce as an example of diffused innovation. Only a few studies have been conducted regarding t-commerce although its importance is growing significantly. Second, this study replicated Rodger’s (1995) study that the adoption process of a new technology tends to be more flexible when it shares applicability similar to that of the old version. Thus, people with previous experience in a technology that has similar characteristics to a new one tend to show little repulsion toward it. These findings can thus serve as a starting point for future t-commerce studies, by providing implications regarding the relationship between pre-experience of e-commerce and post-behavior of t-commerce. Third, the shift of retail formats from physical store to non-store retail format was examined in the context of innovation diffusion theory. The result of this study points out that online grocery shopping is compatible with other non-store retail formats (e.g., TV home shopping) but less compatible with traditional physical stores.
2015 International Food and Agribusiness Management Association (IFAMA). All rights reserved
12
Lee et al. Volume 18 Issue 2, 2015
Management Implications for Agribusiness Managers For agribusiness managers, the appropriate market segmentation is necessary to increase customers’ positive attitudes toward adopting t-commerce. In this sense, consumers with low inclination to adopt a new technology should be targeted to increase the overall adaptability. However, the findings of this study show that practitioners should target consumers with previous online grocery shopping experience to obtain t-commerce market growth. For instance, advertising a t-commerce-related product (i.e., IPTV) on t-commerce-related media (i.e., Internet shopping mall) is a good example of generating consumers’ first t-commerce experience and transaction. This then contributes to repeated purchases, which are now easier due to experience. Therefore, the findings imply that an advertising strategy that encourages the expansion of the t-commerce market through effective segmentation of target customers is needed. For example, strategies that encourage adoption of t-commerce through more lenient TV advertisement could be effective for expanding the t-commerce market at the initial stage. Since t-commerce is a promising industry, this study can serve as the foundation to spread the technology further. Moreover, this study can be applied to future studies regarding detailed investigations of a specific product category in relation to t-commerce. This is for the insight it offers for the differences in t-commerce adoption for grocery shopping, and its characteristics in terms of the homogeneity (e.g., processed food) and heterogeneity (e.g., fresh vegetables, fresh meats) of a product. In priori, processed food or grains should be promoted to sell through non-store retail format including t-commerce. After several experiences, consumers have higher tendencies to consume more heterogeneous products such as fresh agricultural products via non-store retail format.
Limitations and Future Research Directions Although this study has several findings, there are also some limitations. The study focused solely on grocery products. Thus, in terms of future studies regarding adoption of new technology, the subject should be generalized. Moreover, throughout the study, efforts were made to control factors during the process of making comparisons. The degree of willingness to adopt between consumers with and without e-commerce experience using t-test analysis, in terms of age and occupation, is one, though there were significant differences between the two groups. Thus, in future studies, all factors that influence the results should be removed. Acknowledgements
This research was supported by the MSIP(Ministry of Science, ICT and Future Planning), Korea,under the CITRC(Convergence Information Technology Research Center) support program (NIPA-2014-H0401-14-1008) supervised by the NIPA(National IT Industry Promotion Agency).
2015 International Food and Agribusiness Management Association (IFAMA). All rights reserved
13
Lee et al. Volume 18 Issue 2, 2015
References Brown, I., K. De Rijk, K. Patel, Y. Twum-ampofo, and J. Van. 2006. T-Commerce: An
Investigation of Non-Adoption in South Africa. Proceedings of Conference on Information Science, Technology and Management (CISTM 2006), Chandigarh, India, July 16-18.
Choe, Y.C., J. Park, M. Chung, and J. Moon. 2009. Effect of the Food Traceability System for
Building Trust: Price Premium and Buying Behavior. Information Systems Frontiers 11(2):167-179.
Chung, M., J. Moon, B. Yoo, and Y.C. Choe. 2006. Paradox of Information Quality: Do
Consumers Pay More for Premium Product Information on E-Commerce Sites? Proceedings of Association for Information Systems (AMCIS) 2006 p57.
Dholakia, R.R., and U. Outi. 2002. Switching to electronic stores: consumer characteristics and
the perception of shopping benefits. International Journal of Retail & Distribution Management 30(10):459-469.
DMCMediaTeam. 2013. Evolution of TV and Change of Advertising Market. DMC Report p9. Eastin, M.S. 2002. Diffusion of E-Commerce: An Analysis of the Adoption of Four E-
Commerce Activities. Telematics and Informatics 19(3):251-267. Joo, J.M., and B.K. Park. 2006. A Study on Factors in Adopting the Interactive TV from the
Perspective of Technology Acceptance Model. Korean Journal of Journalism & Communication Studies 50(1):332-354.
Jung, K.S. 2011. Factors of on-Line Retail Purchase Action in T-Commerce. The e-Business
Studies 12(2):229-254. Kemp, R., J. Schot, and R. Hoogma. 1998. Regime shifts to sustainability through processes of
niche formation: the approach of strategic niche management. Technology Analysis & Strategic Management 10(2):175-198.
Kim, E., and S. Ko. 2011. Investigating User Adoption of T-Commerce. Computers. Networks,
Systems and Industrial Engineering (CNSI), 2011 First ACIS/JNU International Conference on: IEEE pp95-99.
Kim, M., Y. Park, and S. Go. 2006. A Study on the Trend and Forecast of IPTV Service.
Electronics and Telecommunication Trends 21(2):53-65. LaRose, R., and D. Atkin. 1992. Audiotext and the Re-Invention of the Telephone as a Mass
Medium. Journalism & Mass Communication Quarterly 69(2):413-421. Lee, K. 2013. Understanding and forecasting online shopping market. KOLSA Report 46-62.
2015 International Food and Agribusiness Management Association (IFAMA). All rights reserved
14
Lee et al. Volume 18 Issue 2, 2015
Moon, J., M.D. Hossain, H.G. Kang, and J. Shin. 2012. An Analysis of Agricultural Informatization in Korea: The Government’s Role in Bridging the Digital Gap. Information Development 28(2):102-116.
Oh, J. S. 2010. Current T-Commerce in Korea: As a retail distribution channel. Broadcasting
and Communications Policy 22(7):1-17. Park, S.Y. 2008. Consumer's Demands for the T-Commerce by the Technology Adoption Types.
Journal of Broadcast Engineering 13(3):319-327. Rodger, E. 1995. Diffusion of Innovations. New York: Free Press. Sarrina Li, S.C. 2004. Exploring the Factors Influencing the Adoption of Interactive Cable
Television Services in Taiwan. Journal of Broadcasting & Electronic Media 48(3):466-483.
Wu, J.H., and S.C. Wang. 2005. What drives mobile commerce? An empirical evaluation of the
revised technology acceptance model. Information & Management 42(5):719-729. Yang, L., and Y. Duan. 2010. Research on Culture-Based Model of TV Home Shopping
Development. Information Technology Journal 9(4):698-703. Yu, J., I. Ha, M. Choi, and J. Rho. 2005. Extending the Tam for a T-Commerce. Information &
Management 42(7):965-976.
2015 International Food and Agribusiness Management Association (IFAMA). All rights reserved
15
Lee et al. Volume 18 Issue 2, 2015
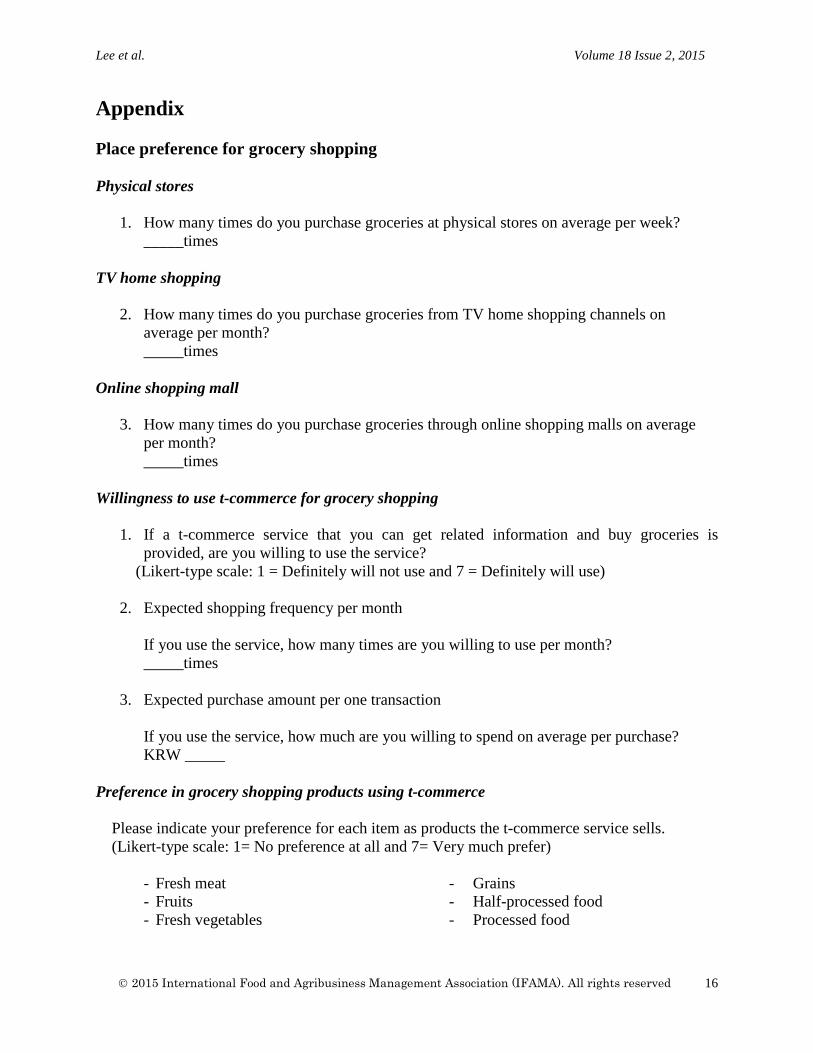
Appendix Place preference for grocery shopping Physical stores
1. How many times do you purchase groceries at physical stores on average per week?
_____times
TV home shopping
2. How many times do you purchase groceries from TV home shopping channels on average per month? _____times
Online shopping mall
3. How many times do you purchase groceries through online shopping malls on average per month? _____times
Willingness to use t-commerce for grocery shopping
1. If a t-commerce service that you can get related information and buy groceries is provided, are you willing to use the service?
(Likert-type scale: 1 = Definitely will not use and 7 = Definitely will use) 2. Expected shopping frequency per month
If you use the service, how many times are you willing to use per month? _____times
3. Expected purchase amount per one transaction
If you use the service, how much are you willing to spend on average per purchase? KRW _____
Preference in grocery shopping products using t-commerce
Please indicate your preference for each item as products the t-commerce service sells. (Likert-type scale: 1= No preference at all and 7= Very much prefer)
- Fresh meat - Fruits - Fresh vegetables
- Grains - Half-processed food - Processed food
2015 International Food and Agribusiness Management Association (IFAMA). All rights reserved
16
International Food and Agribusiness Management Review Volume 18 Issue 2, 2015
Preferences for Farmstead, Artisan, and Other Cheese Attributes:
Evidence from a Conjoint Study in the Northeast United States
Qingbin Wanga, Ethan Thompsonb, and Robert Parsonsc
a Professor, Department of Community Development and Applied Economics, 205C Morrill Hall, The University of Vermont, Burlington, Vermont, 05405, U.S.A.
b Research Associate, Department of Community Development and Applied Economics,
The University of Vermont, Burlington, Vermont, 05405, U.S.A.
c Extension Professor, Department of Community Development and Applied Economics, The University of Vermont, Burlington, Vermont, 05405, U.S.A.
Abstract While many small American dairy farms are struggling to stay in business due to fluctuating milk prices and rising production costs, value-added products such as cheese may help to boost revenue and diversify production practices. This study assesses consumer preferences and willingness to pay (WTP) for selected cheese attributes (farmstead, artisan, organic, local, and use of renewable energy in cheese production) through a conjoint survey conducted in Vermont, Manhattan, and Boston. Survey participants were found to segment into two groups: a quality-seeking group that displays strong preferences and a significant WTP of 15% to 25% more for each of the quality attributes, and a price-sensitive group with preference ratings highly determined by price. This research provides useful information to managers and marketers involved in farmstead and artisan dairy production and marketing. Keywords: farmstead cheese, artisan cheese, conjoint analysis, willingness to pay, Northeast United States
Corresponding author: Tel: + 1 802.656.4564 Email: Q. Wang: [email protected]
E. Thompson: [email protected] R. Parsons: [email protected]
2015 International Food and Agribusiness Management Association (IFAMA). All rights reserved
17
Wang, Thompson and Parsons Volume 18 Issue 2, 2015
Introduction While on-farm production of value-added dairy products such as cheese, yogurt, butter, and ice cream may provide small dairy farms a means to increase revenue, escape the cyclical boom and bust pattern of fluid milk prices, and improve economic stability, the potential opportunities and benefits to dairy farms depend heavily on consumer preferences and willingness to pay (WTP) for such products. This study is motivated by the growing interest in on-farm production of value-added dairy products and by the lack of information on the market potentials for such products. The economic pressure placed on dairy farms by highly variable milk prices is the primary factor in small dairy farm business cessation in the United States (Gierzynski et al. 2010). National trends have moved toward fewer but significantly larger dairy farms, as large farms have been more likely to find efficiencies in production and to survive when the fluid milk price is low (MacDonald et al. 2007). For example, in Vermont, a traditional dairy shed of the Northeast United States, the annual statewide milk production increased from 1.49 billion pounds in 1947 to 2.61 billion pounds in 2013 but, over the same period, the number of dairy farms dropped from 11,206 to fewer than 900 (Gierzynski et al. 2010; Gould 2015; Vermont Agency of Agriculture, Food & Markets 2015). Most dairy farm business cessations in Vermont and across the United States have occurred in operations with 200 or fewer milking cows while the number of large farms with more than 500 cows has increased significantly. As a result, the percentage of milk produced by large farms has increased dramatically. In Vermont, the contribution to total state milk production from farms with more than 500 head rose from 9% in 1997 to 37% in 2007 (Gould 2010). As per capita fluid milk consumption in the United States has decreased significantly in the past three decades, the per capita consumption of cheese has increased year after year—reaching a record high of 33.51 pounds in 2012 (International Dairy Foods Association 2014). To meet the increasing demand for cheese and capture the benefits of economies of scale, modern cheese production has abandoned many traditional practices and embraced industrial-scale production models. The majority of this cheese is produced at factories that rely heavily on mechanization and automation. This cheese, often referred to as industrial, factory, or commodity cheese, is produced in very large batches intended to meet uniform standards, for trading in commodity markets. This process has led to very large increases in the quantities of cheese available in the market, bringing cheese to the diets of many people, but has also favored an agricultural system that relies on efficiency and large-scale production over traditional techniques and skills. Traditional cheeses, often referred to as artisan cheeses, are produced primarily by hand, in small batches, and with particular attention to the tradition and art of cheese making (American Cheese Society 2010). Further designating a cheese as farmstead indicates that the cheese was made on-farm and that the milk used in the cheese-making process came from only the farm where the cheese was made. Artisan and farmstead cheeses typically reflect the traditional flavors and characteristics of the particular region in which the cheese is made (a characteristic known as terroir), support small-scale milk producers, and benefit local economies in multiple ways, including through milk production and cheese-making cooperatives.
2015 International Food and Agribusiness Management Association (IFAMA). All rights reserved
18
Wang, Thompson and Parsons Volume 18 Issue 2, 2015
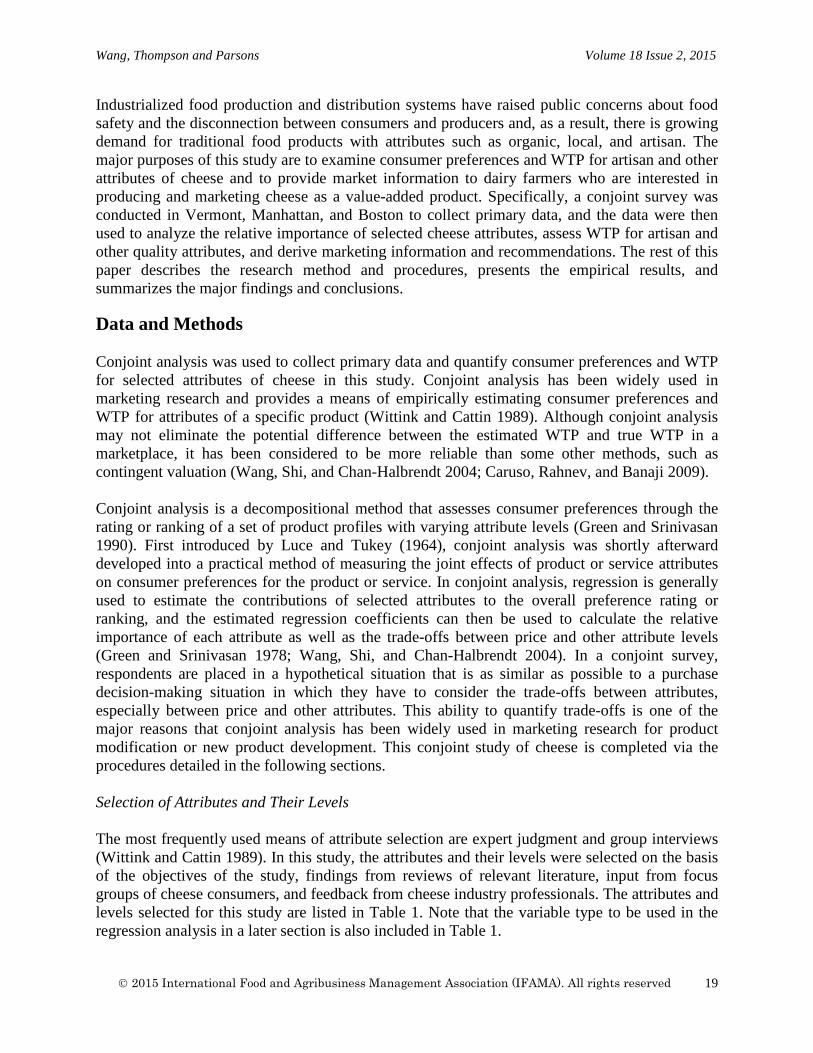
Industrialized food production and distribution systems have raised public concerns about food safety and the disconnection between consumers and producers and, as a result, there is growing demand for traditional food products with attributes such as organic, local, and artisan. The major purposes of this study are to examine consumer preferences and WTP for artisan and other attributes of cheese and to provide market information to dairy farmers who are interested in producing and marketing cheese as a value-added product. Specifically, a conjoint survey was conducted in Vermont, Manhattan, and Boston to collect primary data, and the data were then used to analyze the relative importance of selected cheese attributes, assess WTP for artisan and other quality attributes, and derive marketing information and recommendations. The rest of this paper describes the research method and procedures, presents the empirical results, and summarizes the major findings and conclusions. Data and Methods Conjoint analysis was used to collect primary data and quantify consumer preferences and WTP for selected attributes of cheese in this study. Conjoint analysis has been widely used in marketing research and provides a means of empirically estimating consumer preferences and WTP for attributes of a specific product (Wittink and Cattin 1989). Although conjoint analysis may not eliminate the potential difference between the estimated WTP and true WTP in a marketplace, it has been considered to be more reliable than some other methods, such as contingent valuation (Wang, Shi, and Chan-Halbrendt 2004; Caruso, Rahnev, and Banaji 2009). Conjoint analysis is a decompositional method that assesses consumer preferences through the rating or ranking of a set of product profiles with varying attribute levels (Green and Srinivasan 1990). First introduced by Luce and Tukey (1964), conjoint analysis was shortly afterward developed into a practical method of measuring the joint effects of product or service attributes on consumer preferences for the product or service. In conjoint analysis, regression is generally used to estimate the contributions of selected attributes to the overall preference rating or ranking, and the estimated regression coefficients can then be used to calculate the relative importance of each attribute as well as the trade-offs between price and other attribute levels (Green and Srinivasan 1978; Wang, Shi, and Chan-Halbrendt 2004). In a conjoint survey, respondents are placed in a hypothetical situation that is as similar as possible to a purchase decision-making situation in which they have to consider the trade-offs between attributes, especially between price and other attributes. This ability to quantify trade-offs is one of the major reasons that conjoint analysis has been widely used in marketing research for product modification or new product development. This conjoint study of cheese is completed via the procedures detailed in the following sections. Selection of Attributes and Their Levels The most frequently used means of attribute selection are expert judgment and group interviews (Wittink and Cattin 1989). In this study, the attributes and their levels were selected on the basis of the objectives of the study, findings from reviews of relevant literature, input from focus groups of cheese consumers, and feedback from cheese industry professionals. The attributes and levels selected for this study are listed in Table 1. Note that the variable type to be used in the regression analysis in a later section is also included in Table 1.
2015 International Food and Agribusiness Management Association (IFAMA). All rights reserved
19
Wang, Thompson and Parsons Volume 18 Issue 2, 2015
Table 1. Attribute names, levels, and variable types Attribute Name Attribute Levels Variable Type Production Type Farmstead Effect coding via two
dichotomous variables Artisan Commodity Localness Local1 Dichotomous Not Local Organic Certification USDA-Certified Organic Dichotomous Not Certified Renewable Energy Use Uses Renewable Energy2 Dichotomous None
Unit Price Per Pound $8, $12, $16, $20, and $24 Continuous 1 defined as “produced in your state and within 250 miles of the purchase location.” 2 defined as “production uses more than 50% renewable energy.” Construction of Cheese Profiles The selected levels of attributes are combined to create product profiles for consumers to evaluate. For this study, the first four attributes listed in Table 1 are used to generate 24 unique combinations, or cheese profiles (3 x 2 x 2 x 2 = 24). As price is treated as a dependent attribute of the first four attributes in Table 1, it is therefore not included in the creation of the profiles. Each of the 24 profiles is then assigned a price according to the profile composition. This is logical because cheese price is closely associated with each of the other four attributes. For example, United States Department of Agriculture (USDA) certified organic cheese costs more to produce than non-certified organic cheese, and artisan cheese costs more than commodity cheese. With an assigned price of $8 for a reference cheese that is a commodity cheese that is not local or organic and whose production does not use renewable energy, the price for each of the other 23 profiles was assigned based on the assumption that each of the organic, local, artisan, farmstead, and use of renewable energy attributes would increase the price by $4. For example, a commodity cheese that is local but not organic and whose production does not use renewable energy is assigned a price of $12, and a farmstead cheese that is local and USDA-certified organic and whose production uses renewable energy is assigned a price of $24. These procedures have eliminated profiles that are logically not feasible to producers (e.g., an artisan cheese at a lower price than a commodity cheese) as well as profiles that are logically not acceptable to consumers (e.g., a commodity cheese at a higher price than an artisan cheese). As rating all of the 24 product profiles would be burdensome to respondents, the 24 profiles were randomly split into two survey versions (A and B), and each version included 12 unique profiles. The two versions were then randomly distributed to the survey participants in a mail survey and via an Internet survey, as described in the next section.
2015 International Food and Agribusiness Management Association (IFAMA). All rights reserved
20
Wang, Thompson and Parsons Volume 18 Issue 2, 2015
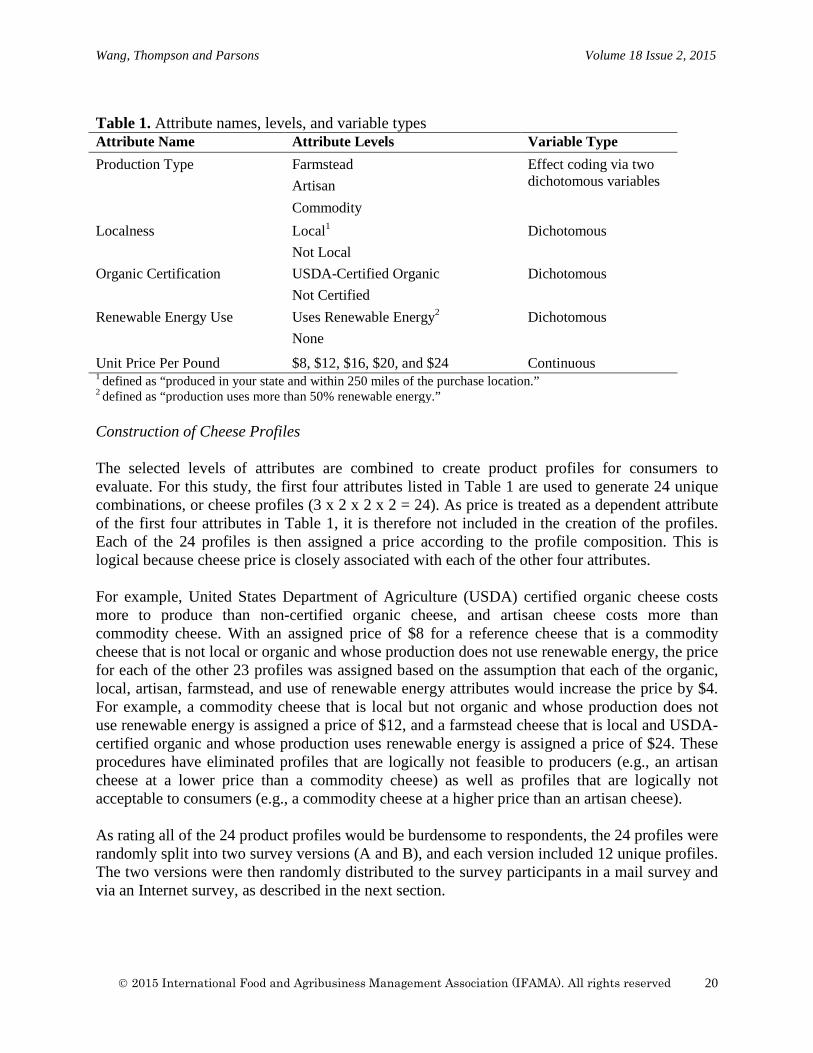
Data Collection The survey questionnaire included four major sections: (1) a one-page introduction to the survey and about how to complete the questionnaire, (2) a table for rating each of the 12 selected cheese profiles, (3) questions about cheese purchase behavior and patterns, and (4) demographic information. Survey instructions requested the primary food shopper in the household to complete the survey. The survey questionnaire also included definitions of artisan, farmstead, and commodity cheese based on the American Cheese Society glossary of terms (American Cheese Society 2010). These definitions are reported in Table 2. Table 2. Definitions of terms included in the survey instrument Artisan cheese Cheese that is produced primarily by hand, in limited production
amounts, using as little mechanization as possible and with particular attention to the tradition and art of cheese making
Farmstead cheese Cheese that is produced on the cheese maker’s farm with milk that comes only from the farmer’s own herd or flock. Almost all farmstead cheeses produced in the northeastern U.S. are also artisan cheeses.
Commodity cheese Cheese that is made in large quantities using a high degree of mechanization, with attention to minimizing cost and meeting uniform quality specifications
Both the rating method and ranking method have commonly been used in conjoint studies. This study uses the rating method, and it is assumed that the rating responses provided by respondents are measured on an interval scale (Louviere 1988). The rating scale used in this study was from 1 to 7, with 1 representing the lowest preference and 7 the highest preference. Also, two or more profiles can receive the same rating. The most frequently used stimulus presentation options in conjoint analysis are verbal cues, written descriptions, tables, pictures, and physical products (Green and Srinivasan 1990). Conjoint surveys are often conducted through face-to-face interviews, by mail questionnaire, or via the Internet. Phone interviews are generally considered to be troublesome for conjoint surveys because there is no readily available option for visual and textual cues (this situation may change when computer-based phone systems with video options are widely used). This study used a combination of mail survey and Internet survey methods. The target population for this study was consumers who are likely to be purchasers of farmstead and artisan cheese. Sample selection for the mail survey was performed using marketing research software to identify household records by geographic region and to select primary householders of a specific age group. Previous studies of artisan and farmstead cheese markets have observed that most consumers of these products are in the middle age ranges (Kupiec and Revell 1998; Mesías et al. 2003), and therefore record selection was limited to primary householders aged 30 to 64. An Internet survey was also conducted to reach more farmstead and artisan cheese purchasers. The Internet survey used the same questionnaire as the mail survey and was distributed directly through advertising and announcements at 11 cheese retailers specializing in
2015 International Food and Agribusiness Management Association (IFAMA). All rights reserved
21
Wang, Thompson and Parsons Volume 18 Issue 2, 2015
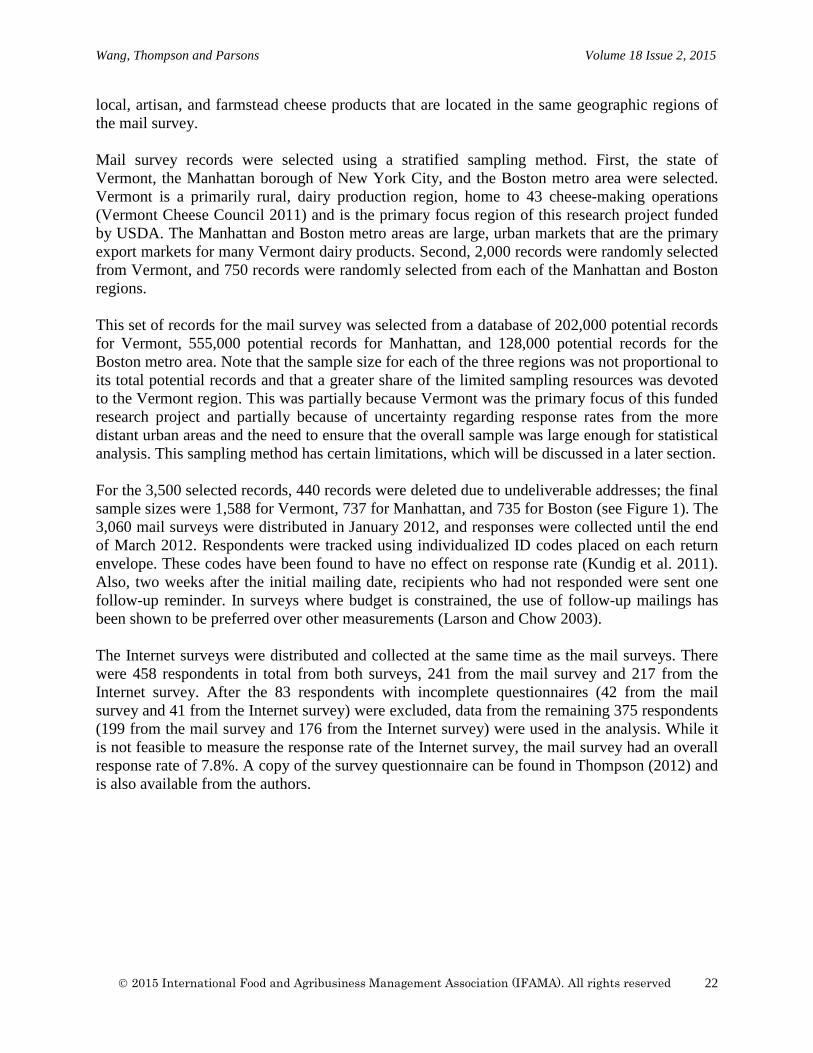
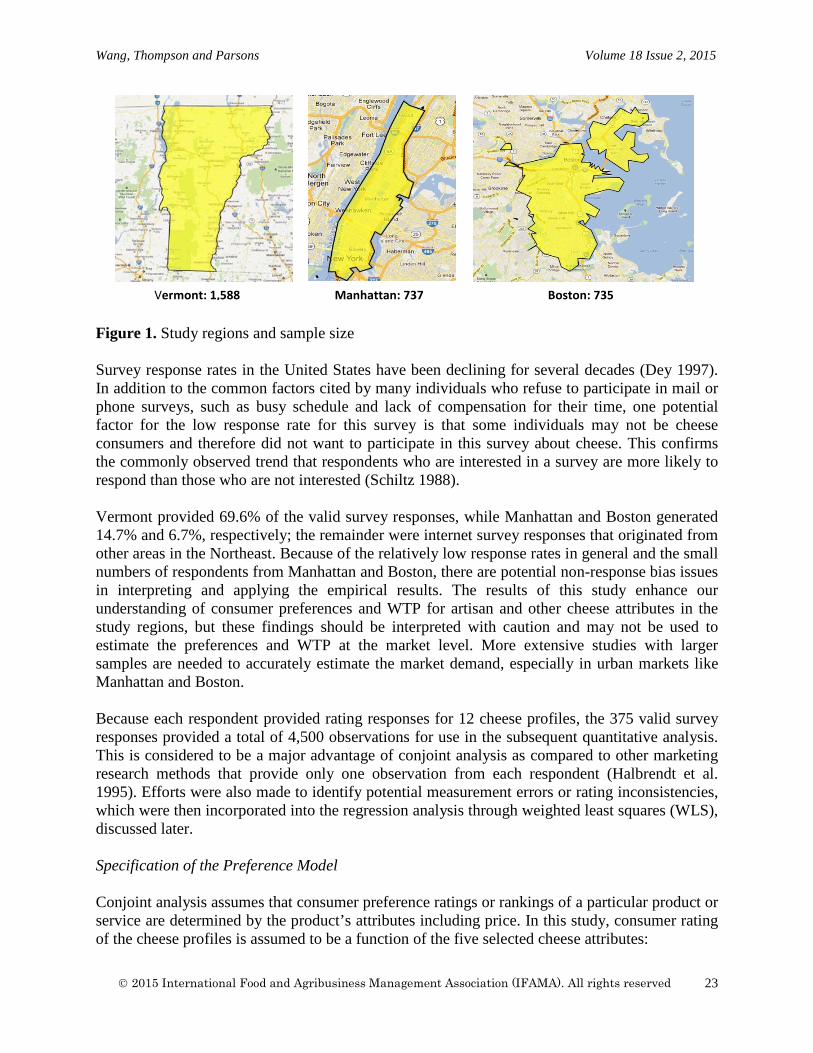
local, artisan, and farmstead cheese products that are located in the same geographic regions of the mail survey. Mail survey records were selected using a stratified sampling method. First, the state of Vermont, the Manhattan borough of New York City, and the Boston metro area were selected. Vermont is a primarily rural, dairy production region, home to 43 cheese-making operations (Vermont Cheese Council 2011) and is the primary focus region of this research project funded by USDA. The Manhattan and Boston metro areas are large, urban markets that are the primary export markets for many Vermont dairy products. Second, 2,000 records were randomly selected from Vermont, and 750 records were randomly selected from each of the Manhattan and Boston regions. This set of records for the mail survey was selected from a database of 202,000 potential records for Vermont, 555,000 potential records for Manhattan, and 128,000 potential records for the Boston metro area. Note that the sample size for each of the three regions was not proportional to its total potential records and that a greater share of the limited sampling resources was devoted to the Vermont region. This was partially because Vermont was the primary focus of this funded research project and partially because of uncertainty regarding response rates from the more distant urban areas and the need to ensure that the overall sample was large enough for statistical analysis. This sampling method has certain limitations, which will be discussed in a later section. For the 3,500 selected records, 440 records were deleted due to undeliverable addresses; the final sample sizes were 1,588 for Vermont, 737 for Manhattan, and 735 for Boston (see Figure 1). The 3,060 mail surveys were distributed in January 2012, and responses were collected until the end of March 2012. Respondents were tracked using individualized ID codes placed on each return envelope. These codes have been found to have no effect on response rate (Kundig et al. 2011). Also, two weeks after the initial mailing date, recipients who had not responded were sent one follow-up reminder. In surveys where budget is constrained, the use of follow-up mailings has been shown to be preferred over other measurements (Larson and Chow 2003). The Internet surveys were distributed and collected at the same time as the mail surveys. There were 458 respondents in total from both surveys, 241 from the mail survey and 217 from the Internet survey. After the 83 respondents with incomplete questionnaires (42 from the mail survey and 41 from the Internet survey) were excluded, data from the remaining 375 respondents (199 from the mail survey and 176 from the Internet survey) were used in the analysis. While it is not feasible to measure the response rate of the Internet survey, the mail survey had an overall response rate of 7.8%. A copy of the survey questionnaire can be found in Thompson (2012) and is also available from the authors.
2015 International Food and Agribusiness Management Association (IFAMA). All rights reserved
22
Wang, Thompson and Parsons Volume 18 Issue 2, 2015
Figure 1. Study regions and sample size Survey response rates in the United States have been declining for several decades (Dey 1997). In addition to the common factors cited by many individuals who refuse to participate in mail or phone surveys, such as busy schedule and lack of compensation for their time, one potential factor for the low response rate for this survey is that some individuals may not be cheese consumers and therefore did not want to participate in this survey about cheese. This confirms the commonly observed trend that respondents who are interested in a survey are more likely to respond than those who are not interested (Schiltz 1988). Vermont provided 69.6% of the valid survey responses, while Manhattan and Boston generated 14.7% and 6.7%, respectively; the remainder were internet survey responses that originated from other areas in the Northeast. Because of the relatively low response rates in general and the small numbers of respondents from Manhattan and Boston, there are potential non-response bias issues in interpreting and applying the empirical results. The results of this study enhance our understanding of consumer preferences and WTP for artisan and other cheese attributes in the study regions, but these findings should be interpreted with caution and may not be used to estimate the preferences and WTP at the market level. More extensive studies with larger samples are needed to accurately estimate the market demand, especially in urban markets like Manhattan and Boston. Because each respondent provided rating responses for 12 cheese profiles, the 375 valid survey responses provided a total of 4,500 observations for use in the subsequent quantitative analysis. This is considered to be a major advantage of conjoint analysis as compared to other marketing research methods that provide only one observation from each respondent (Halbrendt et al. 1995). Efforts were also made to identify potential measurement errors or rating inconsistencies, which were then incorporated into the regression analysis through weighted least squares (WLS), discussed later. Specification of the Preference Model Conjoint analysis assumes that consumer preference ratings or rankings of a particular product or service are determined by the product’s attributes including price. In this study, consumer rating of the cheese profiles is assumed to be a function of the five selected cheese attributes:
Vermont: 1,588 Manhattan: 737 Boston: 735
2015 International Food and Agribusiness Management Association (IFAMA). All rights reserved
23
Wang, Thompson and Parsons Volume 18 Issue 2, 2015
(1) R = f (P, LO, OC, RE, PR) where R is the preference rating for each profile, P represents the production type, LO is localness, OC is the presence of USDA organic certification, RE is the use of renewable energy in cheese production, and PR is the price. In an empirical analysis, the above function needs to be presented in a specific functional form. Following the discussion about alternative preference model specifications by Green and Srinivasan (1978), this study uses a linear function to estimate the impacts of selected cheese attributes on the preference rating:
(2) 𝑅𝑅𝑖𝑖𝑖𝑖 = 𝑎𝑎0 + 𝑎𝑎1𝑃𝑃1𝑖𝑖 + 𝑎𝑎2𝑃𝑃2𝑖𝑖 + 𝑎𝑎3𝐿𝐿𝐿𝐿𝑖𝑖 + 𝑎𝑎4𝐿𝐿𝑂𝑂𝑖𝑖 + 𝑎𝑎5𝑅𝑅𝑅𝑅𝑖𝑖 + 𝑎𝑎6𝑃𝑃𝑅𝑅𝑖𝑖 + 𝑒𝑒𝑖𝑖𝑖𝑖 where Rij is the preference rating of the ith respondent for the jth profile; P1j and P2j are two dichotomous variables to represent production type through effect coding; LOj, OCj, and REj are dichotomous variables for localness, organic certification, and renewable energy use, respectively; PRj is a continuous variable for price; a0 is the intercept; a1–a6 are the coefficients to be estimated; and eii is the error term. As identified in Table 1, the production type is coded using effect coding through two dichotomous variables (P1 and P2). Specifically, P1 equals 1 for farmstead, 0 for artisan, and –1 for commodity, while P2 equals 0 for farmstead, 1 for artisan, and –1 for commodity cheese. Results and Discussion
This section presents the empirical results of the conjoint analysis and discusses the major findings. Market Segmentation
Preliminary analysis of the 4,500 observations in the dataset indicated a very limited association between the preference rating and the five cheese attributes. This finding was quite different from our research hypothesis, which was based on the consumer preference theory and findings from previous studies. One possible reason for this lack of close association for the whole sample was that the respondents might be from different groups or clusters defined by certain characteristics or preferences. Cluster analysis confirmed that the respondents were likely from two groups: one group with strong preferences for quality attributes and the other group with a strong preference for a low price.
The analysis of consumer preferences through a survey relies on a representative sample of the study population. However, when the sample is not from a homogenous population, the analysis based on the sample data can be subject to many problems. For example, in a study of consumer preference for cars, if the sample includes one group or segment that prefers large cars and another group or segment that prefers small cars, the aggregate analysis based on the sample data may suggest a preference for medium cars, which does not accurately represent the views of the individuals in the sample (Stoker 1993). In such a situation, cluster analysis should be used to
2015 International Food and Agribusiness Management Association (IFAMA). All rights reserved
24
Wang, Thompson and Parsons Volume 18 Issue 2, 2015
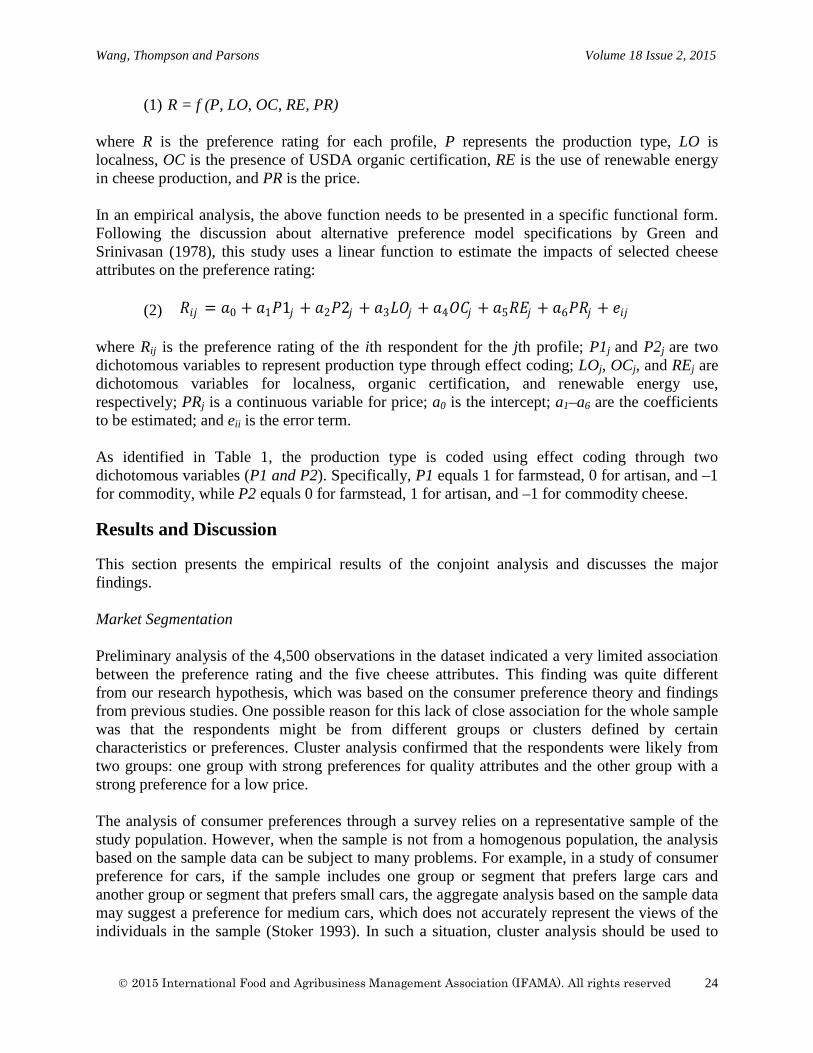
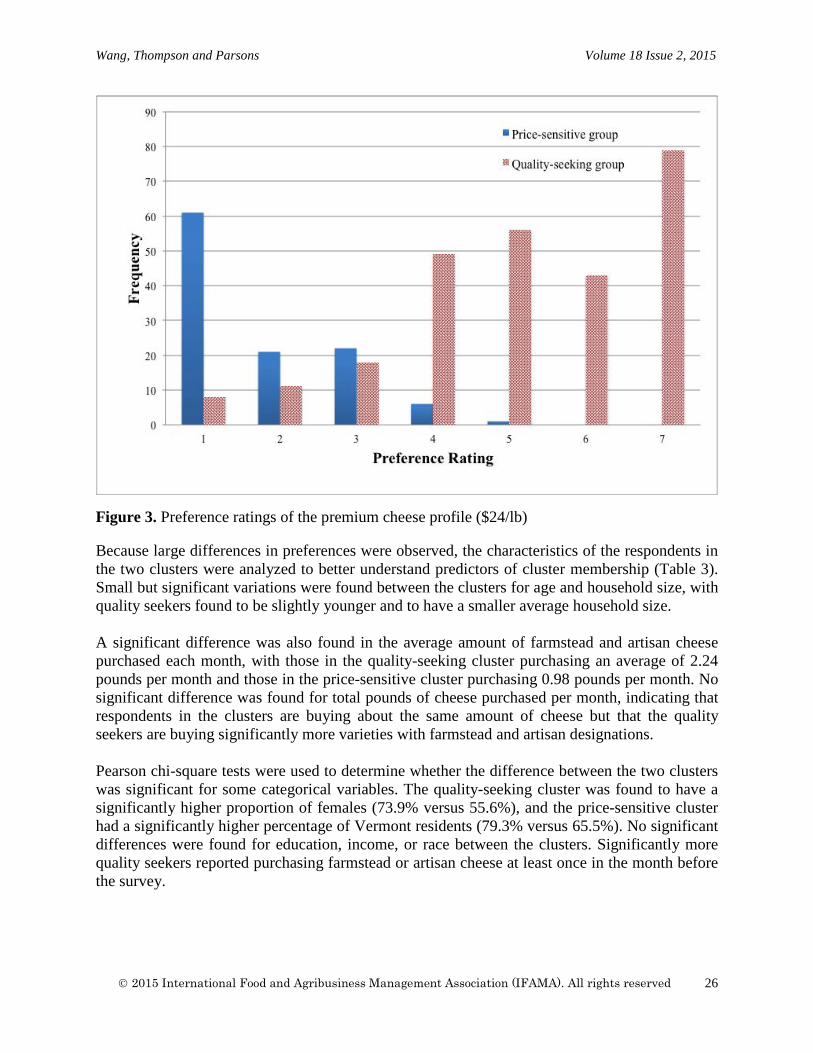
separate the sample into groups with homogenous preferences, as suggested by Hagerty (1985), and preference analysis should be conducted for each group. Cluster analysis was performed using the “two-step” method in SPSS in order to differentiate groups of respondents based on their preferences for cheese profiles. Clustering provides good predictive power for observations that one wishes to describe using a particular set of attributes, and aids in useful communication by allowing for compression of descriptive data (MacKay 2003). Clustering based on preference ratings for the reference profile, premium profile, and a calculated variable capturing the difference between the premium and reference profiles resulted in two distinct clusters: one containing a majority of respondents who prefer the premium profile and one with a majority of respondents who prefer the reference profile (Figures 2 and 3). The cluster displaying a preference for the premium profile was designated “quality seeking,” and the cluster displaying a preference for the reference profile was designated “price sensitive.” The quality-seeking cluster displays increasing preferences for additional quality attributes that also increase the price of the cheese, and the price-sensitive cluster displays decreasing preferences as quality attributes are added that increase the price. Each cluster displays clear and distinctly different patterns of preferences for each cheese profile.
Figure 2. Preference ratings of the reference cheese profile ($8/lb)
2015 International Food and Agribusiness Management Association (IFAMA). All rights reserved
25
Wang, Thompson and Parsons Volume 18 Issue 2, 2015
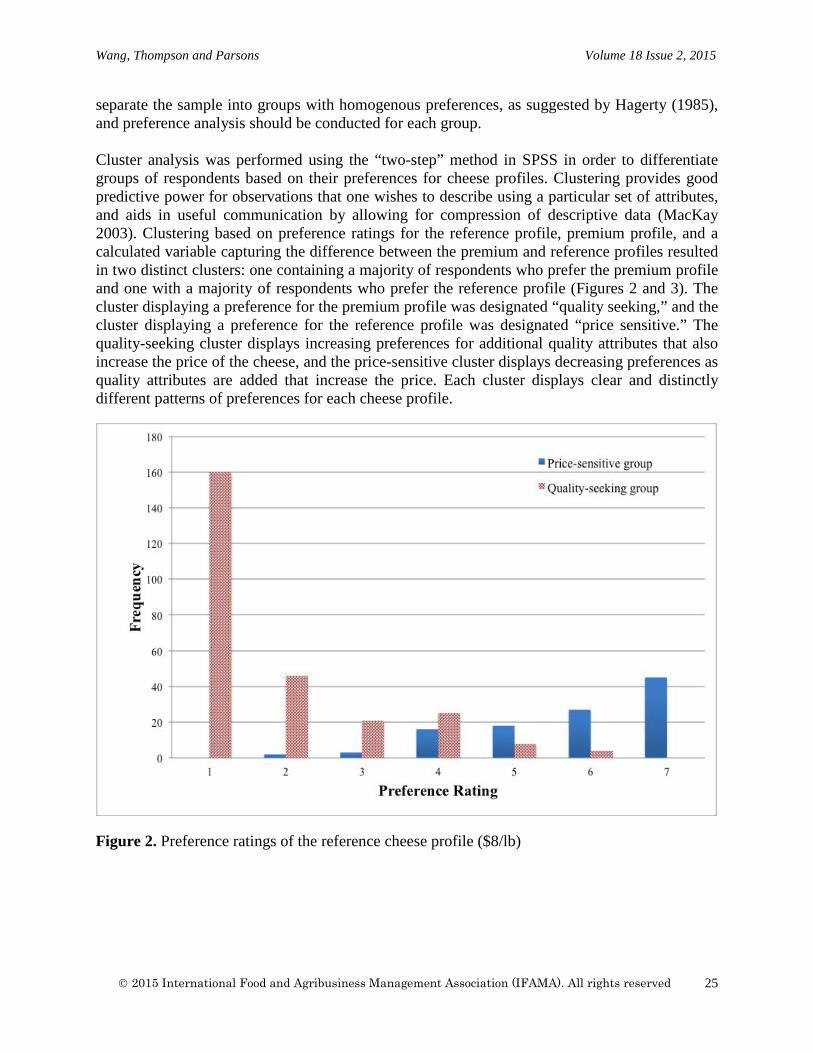
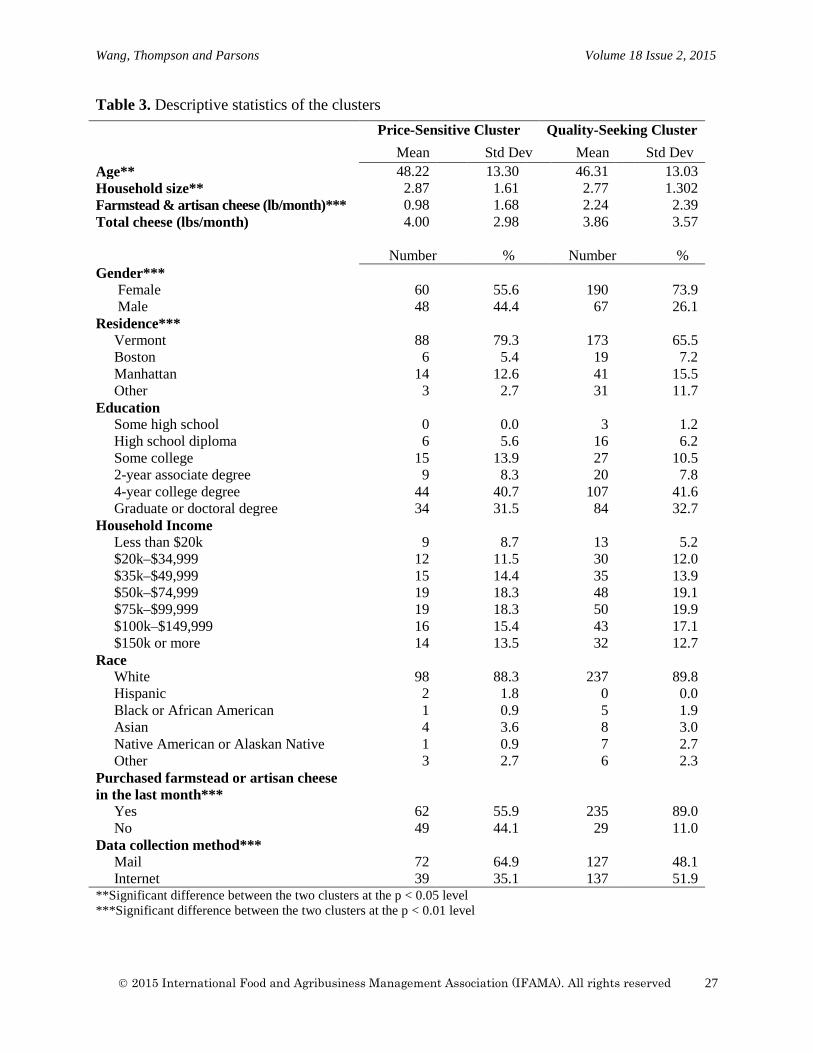
Figure 3. Preference ratings of the premium cheese profile ($24/lb) Because large differences in preferences were observed, the characteristics of the respondents in the two clusters were analyzed to better understand predictors of cluster membership (Table 3). Small but significant variations were found between the clusters for age and household size, with quality seekers found to be slightly younger and to have a smaller average household size.
A significant difference was also found in the average amount of farmstead and artisan cheese purchased each month, with those in the quality-seeking cluster purchasing an average of 2.24 pounds per month and those in the price-sensitive cluster purchasing 0.98 pounds per month. No significant difference was found for total pounds of cheese purchased per month, indicating that respondents in the clusters are buying about the same amount of cheese but that the quality seekers are buying significantly more varieties with farmstead and artisan designations.
Pearson chi-square tests were used to determine whether the difference between the two clusters was significant for some categorical variables. The quality-seeking cluster was found to have a significantly higher proportion of females (73.9% versus 55.6%), and the price-sensitive cluster had a significantly higher percentage of Vermont residents (79.3% versus 65.5%). No significant differences were found for education, income, or race between the clusters. Significantly more quality seekers reported purchasing farmstead or artisan cheese at least once in the month before the survey.
2015 International Food and Agribusiness Management Association (IFAMA). All rights reserved
26
Wang, Thompson and Parsons Volume 18 Issue 2, 2015
Table 3. Descriptive statistics of the clusters
Price-Sensitive Cluster Quality-Seeking Cluster Mean Std Dev Mean Std Dev Age** 48.22 13.30 46.31 13.03 Household size** 2.87 1.61 2.77 1.302 Farmstead & artisan cheese (lb/month)*** 0.98 1.68 2.24 2.39 Total cheese (lbs/month) 4.00 2.98 3.86 3.57 Number % Number % Gender*** Female 60 55.6 190 73.9 Male 48 44.4 67 26.1 Residence*** Vermont 88 79.3 173 65.5
Boston 6 5.4 19 7.2
Manhattan 14 12.6 41 15.5
Other 3 2.7 31 11.7 Education Some high school 0 0.0 3 1.2 High school diploma 6 5.6 16 6.2 Some college 15 13.9 27 10.5 2-year associate degree 9 8.3 20 7.8 4-year college degree 44 40.7 107 41.6 Graduate or doctoral degree 34 31.5 84 32.7 Household Income Less than $20k 9 8.7 13 5.2 $20k–$34,999 12 11.5 30 12.0 $35k–$49,999 15 14.4 35 13.9 $50k–$74,999 19 18.3 48 19.1 $75k–$99,999 19 18.3 50 19.9 $100k–$149,999 16 15.4 43 17.1 $150k or more 14 13.5 32 12.7 Race White 98 88.3 237 89.8 Hispanic 2 1.8 0 0.0 Black or African American 1 0.9 5 1.9 Asian 4 3.6 8 3.0 Native American or Alaskan Native 1 0.9 7 2.7 Other 3 2.7 6 2.3 Purchased farmstead or artisan cheese in the last month***
Yes 62 55.9 235 89.0 No 49 44.1 29 11.0 Data collection method*** Mail 72 64.9 127 48.1 Internet 39 35.1 137 51.9 **Significant difference between the two clusters at the p < 0.05 level ***Significant difference between the two clusters at the p < 0.01 level
2015 International Food and Agribusiness Management Association (IFAMA). All rights reserved
27
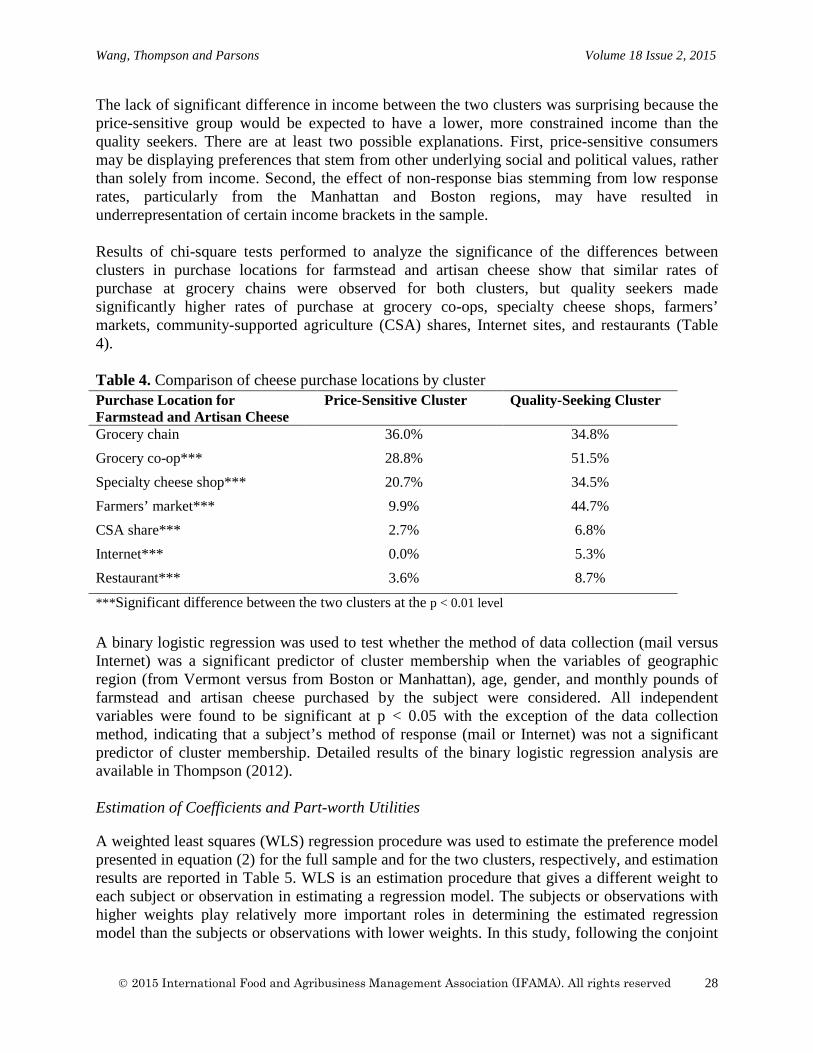
Wang, Thompson and Parsons Volume 18 Issue 2, 2015
The lack of significant difference in income between the two clusters was surprising because the price-sensitive group would be expected to have a lower, more constrained income than the quality seekers. There are at least two possible explanations. First, price-sensitive consumers may be displaying preferences that stem from other underlying social and political values, rather than solely from income. Second, the effect of non-response bias stemming from low response rates, particularly from the Manhattan and Boston regions, may have resulted in underrepresentation of certain income brackets in the sample. Results of chi-square tests performed to analyze the significance of the differences between clusters in purchase locations for farmstead and artisan cheese show that similar rates of purchase at grocery chains were observed for both clusters, but quality seekers made significantly higher rates of purchase at grocery co-ops, specialty cheese shops, farmers’ markets, community-supported agriculture (CSA) shares, Internet sites, and restaurants (Table 4). Table 4. Comparison of cheese purchase locations by cluster
Purchase Location for Farmstead and Artisan Cheese
Price-Sensitive Cluster Quality-Seeking Cluster
Grocery chain 36.0% 34.8% Grocery co-op*** 28.8% 51.5% Specialty cheese shop*** 20.7% 34.5% Farmers’ market*** 9.9% 44.7% CSA share*** 2.7% 6.8% Internet*** 0.0% 5.3% Restaurant*** 3.6% 8.7%
***Significant difference between the two clusters at the p < 0.01 level
A binary logistic regression was used to test whether the method of data collection (mail versus Internet) was a significant predictor of cluster membership when the variables of geographic region (from Vermont versus from Boston or Manhattan), age, gender, and monthly pounds of farmstead and artisan cheese purchased by the subject were considered. All independent variables were found to be significant at p < 0.05 with the exception of the data collection method, indicating that a subject’s method of response (mail or Internet) was not a significant predictor of cluster membership. Detailed results of the binary logistic regression analysis are available in Thompson (2012). Estimation of Coefficients and Part-worth Utilities
A weighted least squares (WLS) regression procedure was used to estimate the preference model presented in equation (2) for the full sample and for the two clusters, respectively, and estimation results are reported in Table 5. WLS is an estimation procedure that gives a different weight to each subject or observation in estimating a regression model. The subjects or observations with higher weights play relatively more important roles in determining the estimated regression model than the subjects or observations with lower weights. In this study, following the conjoint
2015 International Food and Agribusiness Management Association (IFAMA). All rights reserved
28
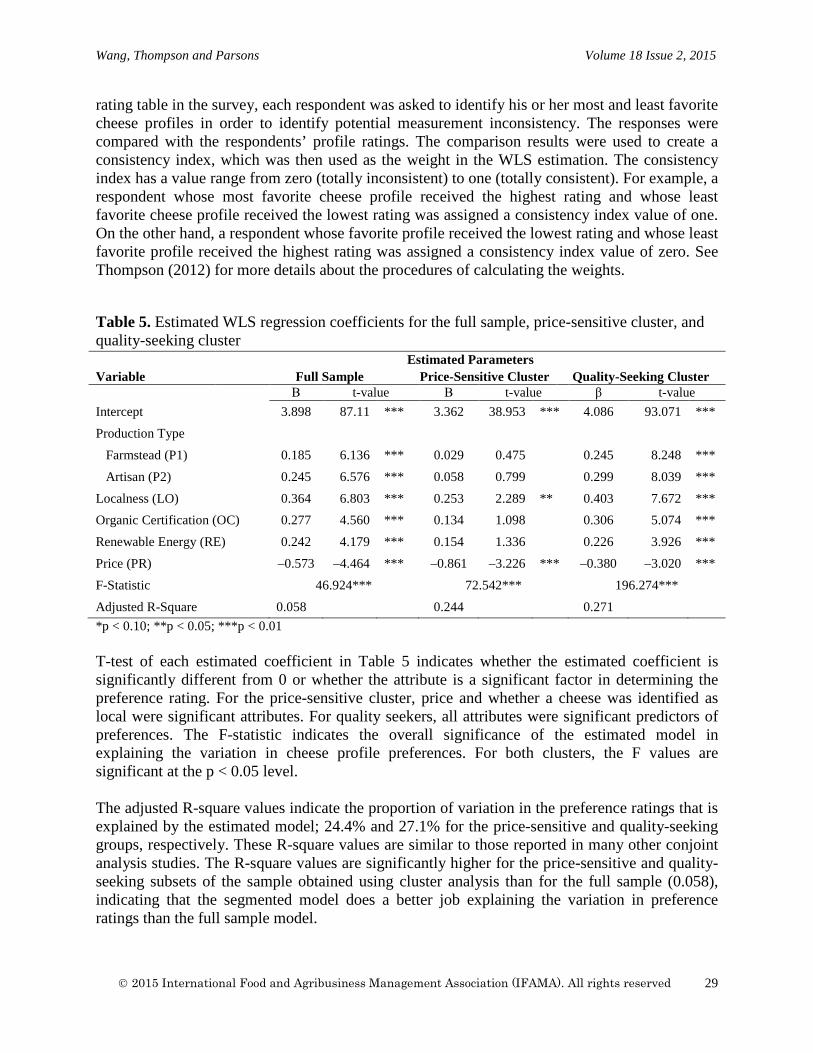
Wang, Thompson and Parsons Volume 18 Issue 2, 2015
rating table in the survey, each respondent was asked to identify his or her most and least favorite cheese profiles in order to identify potential measurement inconsistency. The responses were compared with the respondents’ profile ratings. The comparison results were used to create a consistency index, which was then used as the weight in the WLS estimation. The consistency index has a value range from zero (totally inconsistent) to one (totally consistent). For example, a respondent whose most favorite cheese profile received the highest rating and whose least favorite cheese profile received the lowest rating was assigned a consistency index value of one. On the other hand, a respondent whose favorite profile received the lowest rating and whose least favorite profile received the highest rating was assigned a consistency index value of zero. See Thompson (2012) for more details about the procedures of calculating the weights.
Table 5. Estimated WLS regression coefficients for the full sample, price-sensitive cluster, and quality-seeking cluster
*p < 0.10; **p < 0.05; ***p < 0.01 T-test of each estimated coefficient in Table 5 indicates whether the estimated coefficient is significantly different from 0 or whether the attribute is a significant factor in determining the preference rating. For the price-sensitive cluster, price and whether a cheese was identified as local were significant attributes. For quality seekers, all attributes were significant predictors of preferences. The F-statistic indicates the overall significance of the estimated model in explaining the variation in cheese profile preferences. For both clusters, the F values are significant at the p < 0.05 level.
The adjusted R-square values indicate the proportion of variation in the preference ratings that is explained by the estimated model; 24.4% and 27.1% for the price-sensitive and quality-seeking groups, respectively. These R-square values are similar to those reported in many other conjoint analysis studies. The R-square values are significantly higher for the price-sensitive and quality-seeking subsets of the sample obtained using cluster analysis than for the full sample (0.058), indicating that the segmented model does a better job explaining the variation in preference ratings than the full sample model.
Estimated Parameters Variable Full Sample Price-Sensitive Cluster Quality-Seeking Cluster Β t-value Β t-value β t-value Intercept 3.898 87.11 *** 3.362 38.953 *** 4.086 93.071 *** Production Type Farmstead (P1) 0.185 6.136 *** 0.029 0.475 0.245 8.248 *** Artisan (P2) 0.245 6.576 *** 0.058 0.799 0.299 8.039 *** Localness (LO) 0.364 6.803 *** 0.253 2.289 ** 0.403 7.672 *** Organic Certification (OC) 0.277 4.560 *** 0.134 1.098 0.306 5.074 *** Renewable Energy (RE) 0.242 4.179 *** 0.154 1.336 0.226 3.926 *** Price (PR) –0.573 –4.464 *** –0.861 –3.226 *** –0.380 –3.020 *** F-Statistic 46.924*** 72.542*** 196.274*** Adjusted R-Square 0.058 0.244 0.271
2015 International Food and Agribusiness Management Association (IFAMA). All rights reserved
29
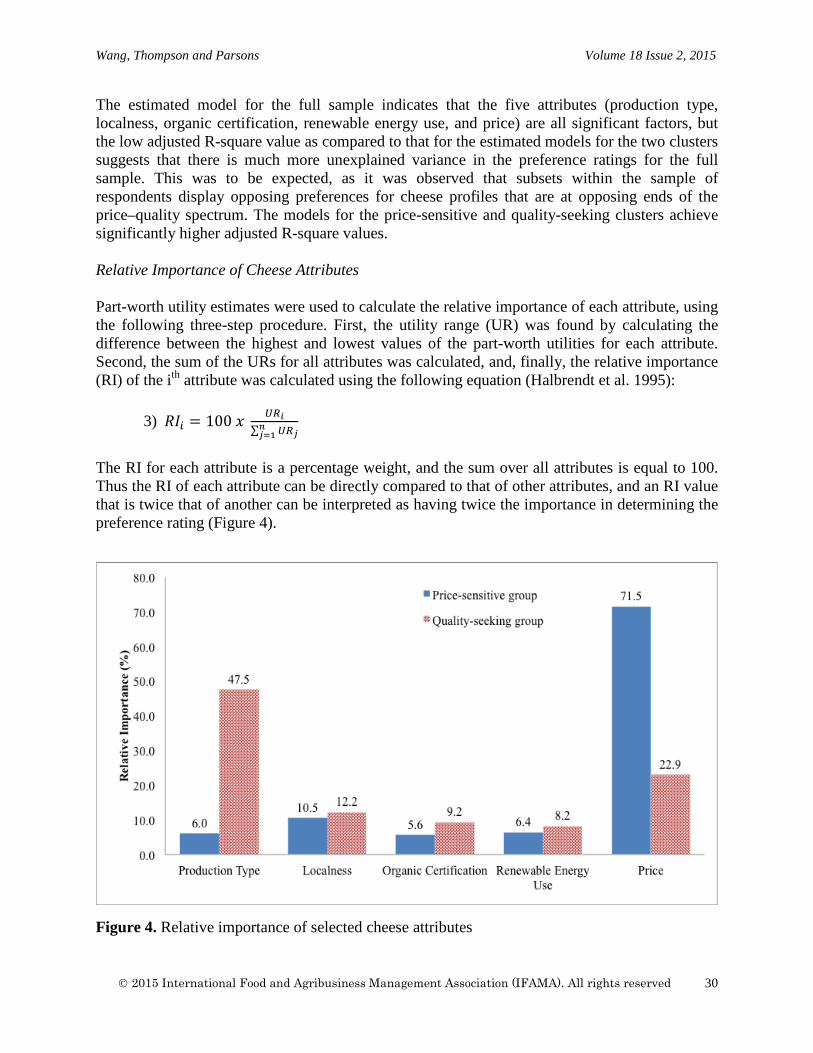
Wang, Thompson and Parsons Volume 18 Issue 2, 2015
The estimated model for the full sample indicates that the five attributes (production type, localness, organic certification, renewable energy use, and price) are all significant factors, but the low adjusted R-square value as compared to that for the estimated models for the two clusters suggests that there is much more unexplained variance in the preference ratings for the full sample. This was to be expected, as it was observed that subsets within the sample of respondents display opposing preferences for cheese profiles that are at opposing ends of the price–quality spectrum. The models for the price-sensitive and quality-seeking clusters achieve significantly higher adjusted R-square values. Relative Importance of Cheese Attributes
Part-worth utility estimates were used to calculate the relative importance of each attribute, using the following three-step procedure. First, the utility range (UR) was found by calculating the difference between the highest and lowest values of the part-worth utilities for each attribute. Second, the sum of the URs for all attributes was calculated, and, finally, the relative importance (RI) of the ith attribute was calculated using the following equation (Halbrendt et al. 1995):
3) 𝑅𝑅𝑅𝑅𝑖𝑖 = 100 𝑥𝑥 𝑈𝑈𝑈𝑈𝑖𝑖
∑ 𝑈𝑈𝑈𝑈𝑗𝑗𝑛𝑛𝑗𝑗=1
The RI for each attribute is a percentage weight, and the sum over all attributes is equal to 100. Thus the RI of each attribute can be directly compared to that of other attributes, and an RI value that is twice that of another can be interpreted as having twice the importance in determining the preference rating (Figure 4).
Figure 4. Relative importance of selected cheese attributes
2015 International Food and Agribusiness Management Association (IFAMA). All rights reserved
30
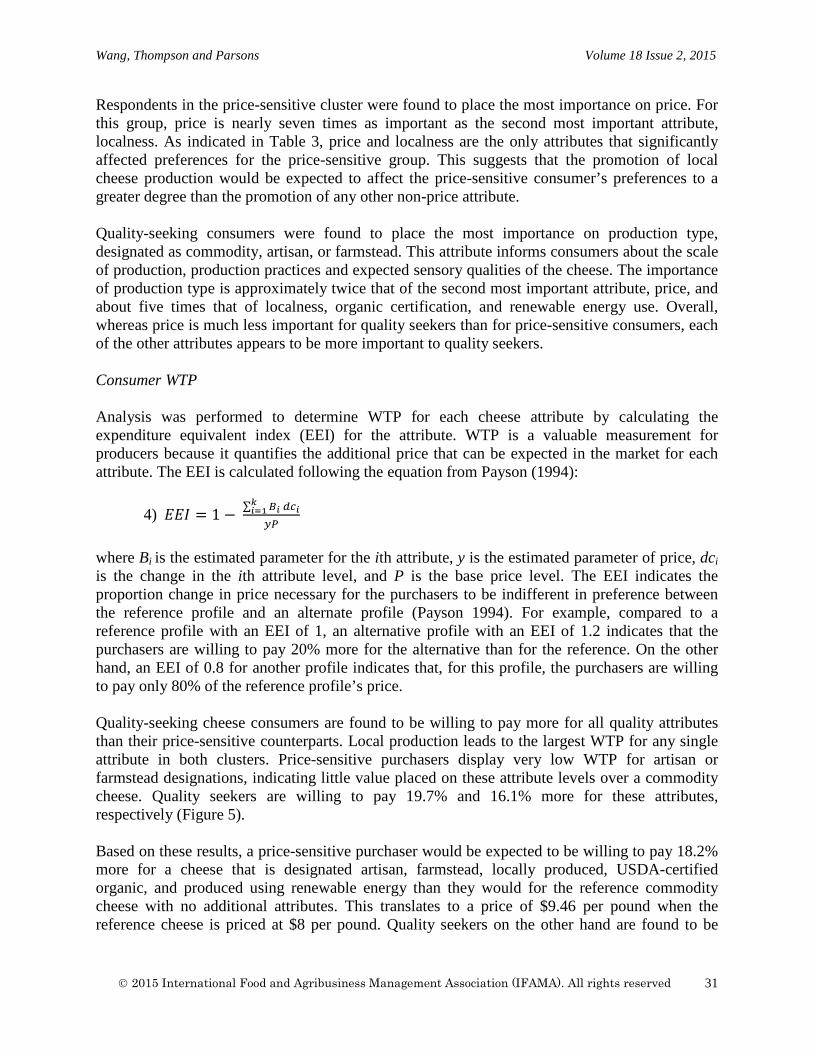
Wang, Thompson and Parsons Volume 18 Issue 2, 2015
Respondents in the price-sensitive cluster were found to place the most importance on price. For this group, price is nearly seven times as important as the second most important attribute, localness. As indicated in Table 3, price and localness are the only attributes that significantly affected preferences for the price-sensitive group. This suggests that the promotion of local cheese production would be expected to affect the price-sensitive consumer’s preferences to a greater degree than the promotion of any other non-price attribute. Quality-seeking consumers were found to place the most importance on production type, designated as commodity, artisan, or farmstead. This attribute informs consumers about the scale of production, production practices and expected sensory qualities of the cheese. The importance of production type is approximately twice that of the second most important attribute, price, and about five times that of localness, organic certification, and renewable energy use. Overall, whereas price is much less important for quality seekers than for price-sensitive consumers, each of the other attributes appears to be more important to quality seekers. Consumer WTP Analysis was performed to determine WTP for each cheese attribute by calculating the expenditure equivalent index (EEI) for the attribute. WTP is a valuable measurement for producers because it quantifies the additional price that can be expected in the market for each attribute. The EEI is calculated following the equation from Payson (1994):
4) 𝑅𝑅𝑅𝑅𝑅𝑅 = 1 − ∑ 𝐵𝐵𝑖𝑖 𝑑𝑑𝑑𝑑𝑖𝑖𝑘𝑘𝑖𝑖=1𝑦𝑦𝑦𝑦
where Bi is the estimated parameter for the ith attribute, y is the estimated parameter of price, dci is the change in the ith attribute level, and P is the base price level. The EEI indicates the proportion change in price necessary for the purchasers to be indifferent in preference between the reference profile and an alternate profile (Payson 1994). For example, compared to a reference profile with an EEI of 1, an alternative profile with an EEI of 1.2 indicates that the purchasers are willing to pay 20% more for the alternative than for the reference. On the other hand, an EEI of 0.8 for another profile indicates that, for this profile, the purchasers are willing to pay only 80% of the reference profile’s price. Quality-seeking cheese consumers are found to be willing to pay more for all quality attributes than their price-sensitive counterparts. Local production leads to the largest WTP for any single attribute in both clusters. Price-sensitive purchasers display very low WTP for artisan or farmstead designations, indicating little value placed on these attribute levels over a commodity cheese. Quality seekers are willing to pay 19.7% and 16.1% more for these attributes, respectively (Figure 5). Based on these results, a price-sensitive purchaser would be expected to be willing to pay 18.2% more for a cheese that is designated artisan, farmstead, locally produced, USDA-certified organic, and produced using renewable energy than they would for the reference commodity cheese with no additional attributes. This translates to a price of $9.46 per pound when the reference cheese is priced at $8 per pound. Quality seekers on the other hand are found to be
2015 International Food and Agribusiness Management Association (IFAMA). All rights reserved
31
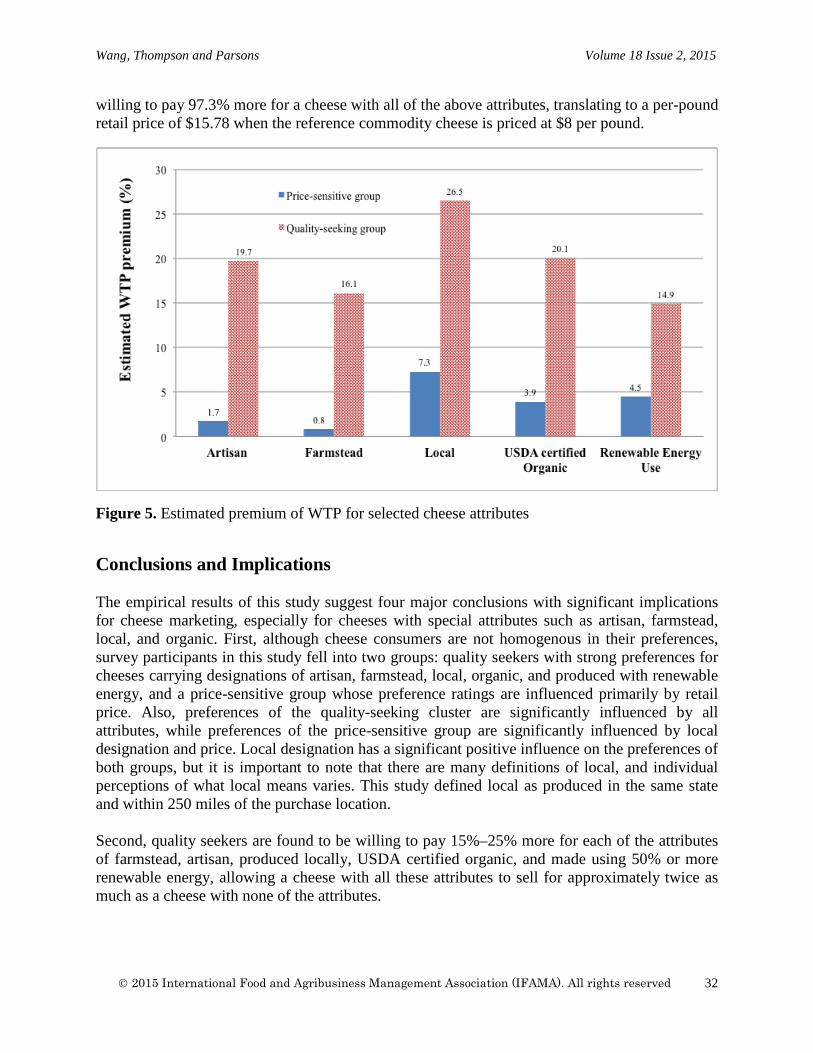
Wang, Thompson and Parsons Volume 18 Issue 2, 2015
willing to pay 97.3% more for a cheese with all of the above attributes, translating to a per-pound retail price of $15.78 when the reference commodity cheese is priced at $8 per pound.
Figure 5. Estimated premium of WTP for selected cheese attributes Conclusions and Implications The empirical results of this study suggest four major conclusions with significant implications for cheese marketing, especially for cheeses with special attributes such as artisan, farmstead, local, and organic. First, although cheese consumers are not homogenous in their preferences, survey participants in this study fell into two groups: quality seekers with strong preferences for cheeses carrying designations of artisan, farmstead, local, organic, and produced with renewable energy, and a price-sensitive group whose preference ratings are influenced primarily by retail price. Also, preferences of the quality-seeking cluster are significantly influenced by all attributes, while preferences of the price-sensitive group are significantly influenced by local designation and price. Local designation has a significant positive influence on the preferences of both groups, but it is important to note that there are many definitions of local, and individual perceptions of what local means varies. This study defined local as produced in the same state and within 250 miles of the purchase location. Second, quality seekers are found to be willing to pay 15%–25% more for each of the attributes of farmstead, artisan, produced locally, USDA certified organic, and made using 50% or more renewable energy, allowing a cheese with all these attributes to sell for approximately twice as much as a cheese with none of the attributes.
2015 International Food and Agribusiness Management Association (IFAMA). All rights reserved
32
Wang, Thompson and Parsons Volume 18 Issue 2, 2015
Third, quality-seeking cheese consumers can be distinguished from price-sensitive cheese consumers by socio-demographic and cheese purchasing behavior variables. Quality seekers are found to be more likely to be younger, live in smaller households, and purchase a larger percentage of artisan and farmstead cheese than price-sensitive cheese consumers. Quality seekers are also more likely to buy artisan and farmstead cheese at grocery co-operatives, farmers’ markets, restaurants, specialty cheese shops and through CSA shares than their price-sensitive counterparts. The level of educational attainment and household income were not found to be significant predictors of group membership, indicating that, although the price of cheese significantly influences the preferences of both groups, the relationship of cluster membership to household socioeconomics is complex and not directly related to income. Fourth, quality seekers were found to be willing to pay more for artisan cheese than for farmstead cheese. This preference may stem from a lack of clear market information regarding the specific meanings of these two designations. Indeed, in almost all cases, farmstead cheeses are of artisan quality but have the additional attribute of being made on-farm, generally providing a greater economic support to regional dairy farms. Both artisan and farmstead cheese making provide a strategy for dairy farmers to transition from fluid milk production toward diversified product lines and value-added niche markets, but the artisan designation was found to garner more market support than the farmstead designation. This finding indicates an area for focused market attention and efforts toward consumer education about the farmstead designation, to highlight that the cheese is made on the farm and so provides the dairy farmers with the revenue benefit of adding value to their milk. Farmstead cheeses possess the same attributes as artisan cheeses—traditional practices, handmade techniques, and small batch size—so, with its additional attribute of small-farm support, farmstead cheese could likely realize greater market support than artisan cheese. In summary, this study found significant WTP for selected cheese attributes, including artisan, farmstead, local, organic, and use of renewable energy in production. Consumer WTP for these attributes translates to additional revenue potential for cheese makers who use milk from their farms or purchase milk from local farms, certify their products as USDA organic, and opt to use a label indicator when renewable energy is used during the production process. Regardless of the desirability of product attributes perceived by quality-seeking consumers, an associated price increase tied to each attribute will cause a segment of the market to be unwilling to pay the premium necessary to support the attribute. In a dairy market that continues to experience steady losses of small and medium farms, artisan and farmstead cheese production and marketing provide an opportunity to enhance the economic viability of struggling farms, preserve traditional working landscapes, create more resilient and diversified production systems, and increase the availability of unique and exciting regional cheeses. Similar to many empirical studies based on consumer surveys, this study was limited by low survey response rates, particularly from the urban markets of Manhattan and Boston, and by the different sampling populations of the mail survey and Internet survey. As a result, it is likely that the proportions of consumers in the price-sensitive and quality-seeking groups differ significantly from that in the general population. While findings from this study help shed light on the preferences and WTP of each of the two groups of respondents, the potential sample bias of the two groups means that the results should not be used to estimate the preferences and WTP
2015 International Food and Agribusiness Management Association (IFAMA). All rights reserved
33
Wang, Thompson and Parsons Volume 18 Issue 2, 2015
at any market level. To accurately measure the market size of quality-seeking cheese consumers in a given region, it may be useful for future research to quantify total commodity and artisan cheese sales, calculate the proportions of each to the whole, and obtain WTP data from statistically representative samples of cheese purchasers. Such information would further this line of research and help the makers and marketers of artisan and farmstead cheeses identify areas with unmet market potential and prioritize marketing and distribution efforts. Acknowledgements This project was supported by Agriculture and Food Research Initiative Competitive Grant no. 2010-85211-20540 from the USDA National Institute of Food and Agriculture. The authors would like to thank Dr. Paul Kindstedt and Dr. Catherine Donnelly at the University of Vermont for their contributions to this research project. We also want to thank the editor and anonymous reviewers of this article for their valuable comments and suggestions.
References
American Cheese Society. 2010. Definition of Terms. http://www.cheesesociety.org/i-heart-
cheese/cheese-glossary/. Caruso, Eugene M., Dobromir A. Rahnev, and Mahzarin R. Banaji. 2009. Using Conjoint
Analysis to Detect Discrimination: Revealing Covert Preferences from Overt Choices. Social Cognition 27 (1): 128–37.
Dey, Eric L. 1997. Working with Low Survey Response Rates: The Efficacy of Weighting
Adjustments. Research in Higher Education 38 (2): 215–27. doi:10.1023/A:1024985704202.
Gierzynski, Anthony, Matt McKeon, Kate Sease, and Jesse Simmons. 2010. Milk Pricing and
the Vermont Dairy Industry. Vermont Legislative Research Service. http://www.uvm.edu/~vlrs/Agriculture/Milk%20Pricing%20and%20the%20Vermont%20Dairy%20Industry.pdf.
Gould, Brian. 2010. Dairy Markets Data & Graphs. http://future.aae.wisc.edu/tab/prices.html. ———. 2015. Dairy Markets - Milk Production - Vermont. http://future.aae.wisc.edu/data/
annual_values/by_area/99?area=Vermont&period=complete. Green, Paul E., and V. Srinivasan. 1978. Conjoint Analysis in Consumer Research: Issues and
Outlook. Journal of Consumer Research 5 (2): 103–23. ———. 1990. Conjoint Analysis in Marketing: New Developments with Implications for
Research and Practice. The Journal of Marketing 54 (4): 3–19. doi:10.2307/1251756.
2015 International Food and Agribusiness Management Association (IFAMA). All rights reserved
34
Wang, Thompson and Parsons Volume 18 Issue 2, 2015
Hagerty, Michael R. 1985. Improving the Predictive Power of Conjoint Analysis: The Use of Factor Analysis and Cluster Analysis. Journal of Marketing Research 22 (2): 168–84. doi:10.2307/3151362.
Halbrendt, Catherine, Qingbin Wang, Cristina Fraiz, and Linda O’Dierno. 1995. Marketing
Problems and Opportunities in Mid-Atlantic Seafood Retailing. American Journal of Agricultural Economics 77 (5): 1313–18. doi:10.2307/1243367.
International Dairy Foods Association. 2014. Cheese. http://www.idfa.org/resource-
center/industry-facts/cheese/. Kundig, François, Anthony Staines, Thompson Kinge, and Thomas V. Perneger. 2011.
Numbering Questionnaires Had No Impact on the Response Rate and Only a Slight Influence on the Response Content of a Patient Safety Culture Survey: A Randomized Trial. Journal of Clinical Epidemiology 64 (11): 1262–65.
Kupiec, Beata, and Brian Revell. 1998. Specialty and Artisanal Cheeses Today: The Product and
the Consumer. British Food Journal 100 (5): 236–43. Larson, Paul D., and Garland Chow. 2003. Total Cost/Response Rate Trade-Offs in Mail Survey
Research: Impact of Follow-Up Mailings and Monetary Incentives. Industrial Marketing Management 32 (7): 533–37. doi:10.1016/S0019-8501(02)00277-8.
Louviere, Jordan J. 1988. Conjoint Analysis Modeling of Stated Preferences. Journal of
Transport Economics and Policy 22 (1): 93–119. Luce, R. Duncan, and John W. Tukey. 1964. Simultaneous Conjoint Measurement: A New Type
of Fundamental Measurement. Journal of Mathematical Psychology 1 (1): 1–27. doi:10.1016/0022-2496(64)90015-X.
MacDonald, James M., Erik J. O’Donoghue, William D. McBride, Richard F. Nehring, Carmen
L. Sandretto, and Roberto Mosheim. 2007. Profits, Costs, and the Changing Structure of Dairy Farming. ERR-47. Economic Research Service / USDA.
MacKay, David. 2003. Information Theory, Inference, and Learning Algorithms. Cambridge
University Press. Mesías, Francisco J., Miguel Escribano, Antonio Rodríguez De Ledesma, and Francisco Pulido.
2003. Market Segmentation of Cheese Consumers: An Approach Using Consumer’s Attitudes, Purchase Behaviour and Sociodemographic Variables. International Journal of Dairy Technology 56 (3): 149–55. doi:10.1046/j.1471-0307.2003.00092.x.
Payson, Steven. 1994. Quality Measurement in Economics: New Perspectives on the Evolution
of Goods and Services. Aldershot, England and Brookfield, VT, USA: Elgar.
2015 International Food and Agribusiness Management Association (IFAMA). All rights reserved
35
Wang, Thompson and Parsons Volume 18 Issue 2, 2015
Schiltz, Michael E. 1988. Professional Standards for Survey Research. Research in Higher Education 28 (1): 67–75.
Stoker, Thomas M. 1993. Empirical Approaches to the Problem of Aggregation Over
Individuals. Journal of Economic Literature 31 (4): 1827–74. Thompson, Ethan. 2012. Assessing Market Support for Value-Added Products on Northeast
Dairy Farms: A Conjoint Analysis of Preferences and Willingness to Pay for Farmstead and Artisan Cheese. Burlington, VT: The University of Vermont.
Vermont Agency of Agriculture, Food & Markets. 2015. Vermont Dairy: The Number of Dairy
Farms in Vermont. [accessed January 9, 2015]. http://www.vermontdairy.com/learn/number-of-farms/.
Vermont Cheese Council. 2011. Vermont Cheese Makers. [accessed May 23, 2014].
http://www.vtcheese.com/cheesemakers.htm. Wang, Qingbin, Guanming Shi, and Catherine Chan-Halbrendt. 2004. Market Potential for
Fine Furniture Manufactured from Low-Grade Hardwood: Evidence from a Conjoint Analysis in the Northeastern United States. Forest Products Journal 54 (5): 19–25.
Wittink, Dick R., and Philippe Cattin. 1989. Commercial Use of Conjoint Analysis: An Update.
The Journal of Marketing 53 (3): 91–96. doi:10.2307/1251345.
2015 International Food and Agribusiness Management Association (IFAMA). All rights reserved
36
International Food and Agribusiness Management Review Volume 18 Issue 2, 2015
Agri-food Competitive Performance in EU Countries:
A Fifteen-Year Retrospective
Laura Carraresia and Alessandro Banterleb
a Research Assistant, Institute for Food and Resource Economics, University of Bonn Meckenheimer Allee 174 – 53115 Bonn, Germany
b Full Professor, Department of Economics, Management and Quantitative Methods, Università degli Studi di
Milano, Via Celoria, 2 – 20133 Milan, Italy
Abstract Competitiveness is a crucial issue in the EU agri-food market. In the last fifteen years, two significant events have affected the competitive performance of agriculture and the food industry in different EU countries, namely the EU accession of Central and Eastern European countries (CEECs) and the global economic crisis of 2008. This paper evaluates the EU countries’ competitive performance at a sector level in the intra-EU market from 1995 to 2011 by comparing the food industry and agriculture; and assessing the effects of the EU expansion and economic crisis on country competitiveness. EMS and RCA indices were used to measure the competitive performance over time. Results showed that although agriculture and the food industry in the EU are interconnected, they often reveal divergent trends in competitive performance. Germany and the Netherlands have profited the most from the opportunities resulting from the enlargement. On the contrary, France has lost competitiveness. A similar trend was found in Belgium. Italy shows a substantial competitive stasis, similar to Spain. Keywords: competitive performance, agriculture, food industry, EU enlargement, global economic crisis.
Corresponding author: Tel: +49(0)228733504
Email: L. Carraresi: [email protected] A. Banterle: [email protected]
2015 International Food and Agribusiness Management Association (IFAMA). All rights reserved
37
Carraresi and Banterle Volume 18 Issue 2, 2015
Introduction Competitiveness is a crucial issue in the European agri-food market, as continuously argued by European Commission (European Commission 2013). In the last fifteen years, two significant events have affected the competitive performance of agriculture and food industry in different EU countries, namely the EU accession of Central and Eastern European countries (CEECs) and the global economic crisis of 2008. The first event led to changes in the competitive positions of these countries creating new opportunities and risks for old and new member states (Caetano et al. 2004). The enlargement opened free trade possibilities for 12 more countries increasing trade flow and a rise in product demand (Bojnec and Fertő 2014; Török and Jámbor 2013; Qineti et al. 2009; Zaghini 2005). These elements intensified the competition among countries while creating new opportunities. Trading between CEECs and other EU countries has been active since the ‘90s due to the elimination of political trade barriers between Eastern and Western Europe (Piazolo 1996; Caetano et al. 2004; Rojec and Ferjančič 2006; Yom Din, 2013) and has intensified since the enlargement. Moreover, especially in the agricultural sector, the EU expansion combined with the effects of CAP reform, a decrease in protection and tariff reduction has led to changes in the agricultural markets and growing competition (Hermans et al. 2010). Second, the global economic crisis of 2008, still afflicting the European economy has shaped trends in agriculture and food industry, although the negative effects seen in the entire manufacturing sector have not been as strong in these examined sectors (European Commission 2009). CEECs, in particular, have been impacted by the crisis as financial market confidence has decreased; moreover, these countries are already characterized by high deficits and a need for international finance (Dietrich et al. 2011; Albulescu 2011). In addition to the EU enlargement and the crisis, the European agriculture and food industry are interested in several other issues affecting their competitive level: globalization, vertical competition between food processors and large retailers, decreases in transportation and logistics costs, sector fragmentation, and changes in consumer preferences for health, safety and environmental sustainability concerns (Harling 2008; Wubben and Isakhanyan 2013). These factors require the competition to find new ways to differentiate products and develop a distinctive identity as trade flows are not only influenced by low prices but also qualitative features (Rademakers 2012; Antimiani et al. 2012; Boehlje et al. 2011; Mayer and Ottaviano 2008; Niemi and Huan-Niemi 2007). As revealed in the literature, the changes and challenges needed to compete in agriculture and the food industry are numerous, especially for the CEECs. Thus, there is a need to study the situation of EU agri-food competitive environment and how different countries have faced the opportunities and threats occurring over the last twenty years. Several approaches in the literature are utilized to evaluate competitiveness. The first approach deals with the computation of trade indices over the years in order to assess the competitive performance of sectors and/or countries. In this category some authors have mainly focused on specific industrial sectors and/or on specific countries in the intra-EU area (Mulder et al. 2004;
2015 International Food and Agribusiness Management Association (IFAMA). All rights reserved
38
Carraresi and Banterle Volume 18 Issue 2, 2015
Drescher and Maurer 1999; Gorton et al. 2000; Bavorova 2003; Bojnec and Fertő 2009; Juhász and Wagner 2013). Others assess competitiveness by using the same indices, but comparing EU countries with extra-EU ones (Wijnands et al. 2008; Ball et al. 2010; Qineti et al. 2009). A second approach uses Porter’s “diamond model” (Porter 1990). In this category some authors have computed performance indicators, such as domestic resource costs, social cost-benefit ratio, costs of production (Banse et al. 1999; Gorton and Davidova 2001; Liefert 2002; Gallagher et al. 2006). Davidova et al. (2003) use profitability indicators, whereas some others compute productivity and efficiency (Brümmer et al. 2002; Fogarasi and Latruffe 2009; Furtan and Sauer 2008; Fischer and Schornberg 2007). Our analysis follows the first approach and contributes to filling the gap in existing literature by comparing the competitive performance of agriculture and the food industry among all EU countries. The analysis of agriculture and food industry competitiveness is interesting as these sectors are strictly interconnected, and the competitiveness of one sector can affect the other and vice-a-versa. Therefore, a key question concerns whether agriculture and the food industry show similar trends in terms of competitive performance or not. Furthermore, in the literature, an overview about the competitiveness of EU countries comparing agriculture and food industry over an extended period of time is missing, as is the effect of economic crisis on these two sectors. To fill this gap, our analysis takes into consideration all 27 EU countries, and the products of both agriculture and the food industry, without limiting the analysis to a few specific countries and/or sectors. Thus, the purpose of this paper is to evaluate the competitive performance of EU countries at sector level in the intra-EU market from 1995 to 2011, comparing food industry and agriculture. In particular, the effect of the EU enlargement and the economic crisis on the competitiveness will be assessed. In this way, it is possible to highlight which countries have profited by the EU enlargement and which ones have been most affected by the economic crisis. Furthermore, is the case of Italy—one of the biggest food producing and exporting countries in the EU. Italy is analyzed in more depth, trying to understand the determinants of competitive performance while highlighting the strengths and weaknesses of Italian agriculture and the food industry. We have chosen Italy because its food sector is third in Europe in terms of sales, after Germany and France (FoodDrinkEurope 2014). Moreover, we have recent data describing trade performance in agriculture and the food industry (INEA 2013). There are also many agri-food products certified as PDO-PGI having a high reputation at international levels, appreciated by foreign consumers, these may affect Italian competitive performance. Here, Italy is used as a kind of case study to reflect on possible determinants of competitive performance, even though it is not the main objective of our paper. The data came from the Eurostat database of international trade. The competitive performance of the EU countries was measured through Export Market Share and Revealed Comparative Advantage, analyzing values over the last fifteen years. The remainder of this paper is structured as follows: the next section defines the scope of competitive performance analyzed in this research, followed by the methodology and
2015 International Food and Agribusiness Management Association (IFAMA). All rights reserved
39
Carraresi and Banterle Volume 18 Issue 2, 2015
presentation of results. Finally, the case of Italy is outlined, leading to a discussion and our concluding remarks. The Evaluation of Competitive Performance The concept of competitiveness does not have one clear universal definition. Often it is synonymous with competitive or comparative advantage although this is not entirely correct (Siggel 2006). Indeed, it is necessary to determine whether we are examining it from a micro or macroeconomic perspective, as the indices to measure it are different. In this paper, we focus on the assessment of competitiveness at a sector level intended to help industry reach, conserve, and increase market share over time against other competitors in the international market (Latruffe 2010; Bojnec and Fertő 2009; Traill 1998; Van Rooyen et al. 2011). The concept of competitiveness is connected to the achievement of competitive advantage, theorized by the Porter’s seminal work (1990). Nevertheless, measuring competitive advantage is not easy. Therefore, the assessment of competitiveness is often done indirectly, taking into consideration the competitive position of a firm or sector in the international market and its competitive performance over a specific time period (Adams et al. 2006). For these two measurements, particular trade indices have been formulated, allowing a comparison of different countries (or firms) or time series data (Latruffe 2010). These indices are typically ex-post indices, useful to demonstrate the competitive performance of a country, although they are not able to outline the source of the advantage (Siggel 2006). Other measurement models do exist in the literature, but require many assumptions, whereas the indices discussed here provide a clear framework for the entire competitive situation, are more controllable and do not require too many notions about the country under examination (Siggel 2006). Moreover, as Lall (2001) asserts, “while competitiveness indices have become significant in the policy discourse in many developing countries, surprisingly little is known about their economic foundations: how soundly they are based in theory and constructed in practice. […] This may be changing, however, as well-known academics enter into debates on competitiveness and also engage in index preparation. In any case, it is useful to analyze the indices simply because they are now so often used for economic policy making and analysis.” Although these indices do not analyze the determinants of competitiveness, they do provide a quick overview for an ensemble of countries. By calculating the trend of the indices over time, it is also easily possible to estimate the gain or loss of competitiveness. Furthermore, by utilizing a few indices together, we are able to analyze competitive performance from several angles. Thus, our analysis evaluates the competitive performance of agriculture and the food industry in 27 EU countries. With this aim, we chose two popular trade indices found in the literature: Export Market Share (EMS) and Balassa Revealed Comparative Advantage (RCA) (Banterle and Carraresi 2007; Lall 2001; Bojnec and Fertő 2014; Sarker and Ratnasena 2014). Aspects of export flow and sectorial export specialization are evaluated over time with a cross-country comparison for a sector in the international market. While EMS assesses the export orientation of a country for a specific sector compared to a set of countries, RCA measures the country export specialization of a specific sector. Values are positive and, if greater than 100, the country is export specialized in the sector analyzed (Balassa
2015 International Food and Agribusiness Management Association (IFAMA). All rights reserved
40
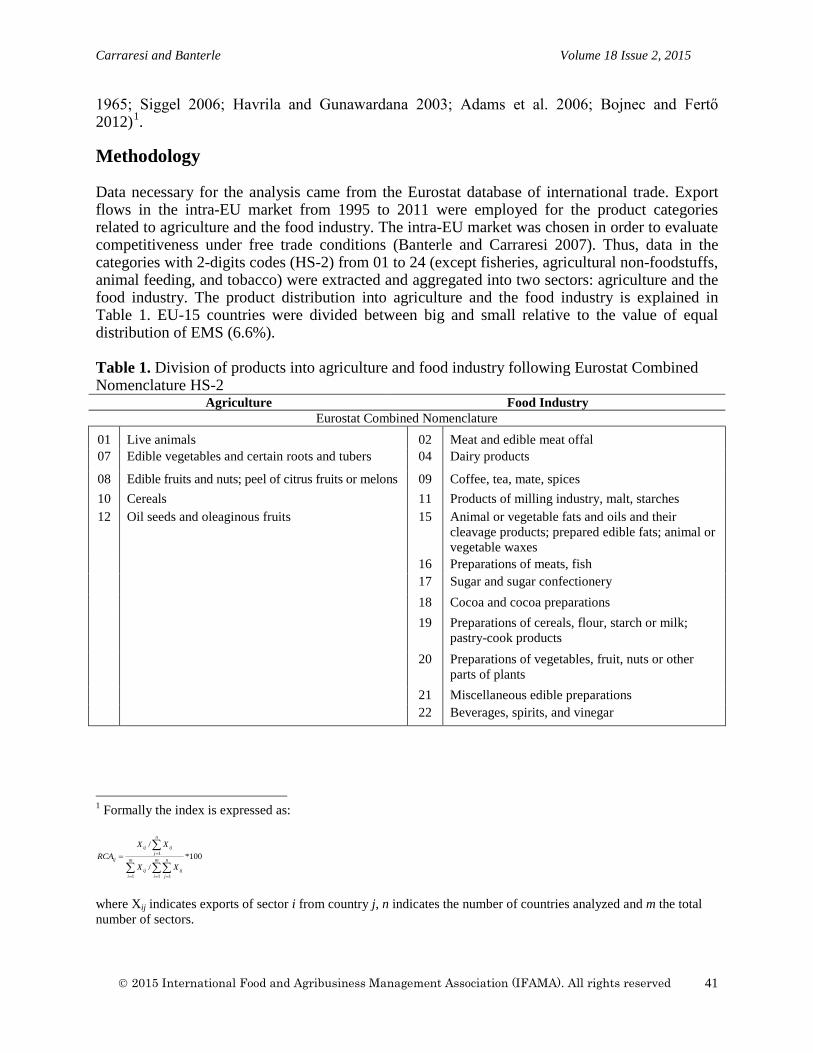
Carraresi and Banterle Volume 18 Issue 2, 2015
1965; Siggel 2006; Havrila and Gunawardana 2003; Adams et al. 2006; Bojnec and Fertő 2012)1. Methodology Data necessary for the analysis came from the Eurostat database of international trade. Export flows in the intra-EU market from 1995 to 2011 were employed for the product categories related to agriculture and the food industry. The intra-EU market was chosen in order to evaluate competitiveness under free trade conditions (Banterle and Carraresi 2007). Thus, data in the categories with 2-digits codes (HS-2) from 01 to 24 (except fisheries, agricultural non-foodstuffs, animal feeding, and tobacco) were extracted and aggregated into two sectors: agriculture and the food industry. The product distribution into agriculture and the food industry is explained in Table 1. EU-15 countries were divided between big and small relative to the value of equal distribution of EMS (6.6%). Table 1. Division of products into agriculture and food industry following Eurostat Combined Nomenclature HS-2
Agriculture Food Industry Eurostat Combined Nomenclature
01 Live animals 02 Meat and edible meat offal 07 Edible vegetables and certain roots and tubers 04 Dairy products
08 Edible fruits and nuts; peel of citrus fruits or melons 09 Coffee, tea, mate, spices 10 Cereals 11 Products of milling industry, malt, starches 12 Oil seeds and oleaginous fruits 15 Animal or vegetable fats and oils and their
cleavage products; prepared edible fats; animal or vegetable waxes
16 Preparations of meats, fish 17 Sugar and sugar confectionery 18 Cocoa and cocoa preparations 19 Preparations of cereals, flour, starch or milk;
pastry-cook products 20 Preparations of vegetables, fruit, nuts or other
parts of plants 21 Miscellaneous edible preparations 22 Beverages, spirits, and vinegar
1 Formally the index is expressed as:
100*/
/
1 1 1
1
∑ ∑∑
∑
= = =
== m
i
m
i
n
jijij
n
jijij
ij
XX
XXRCA
where Xij indicates exports of sector i from country j, n indicates the number of countries analyzed and m the total number of sectors.
2015 International Food and Agribusiness Management Association (IFAMA). All rights reserved
41
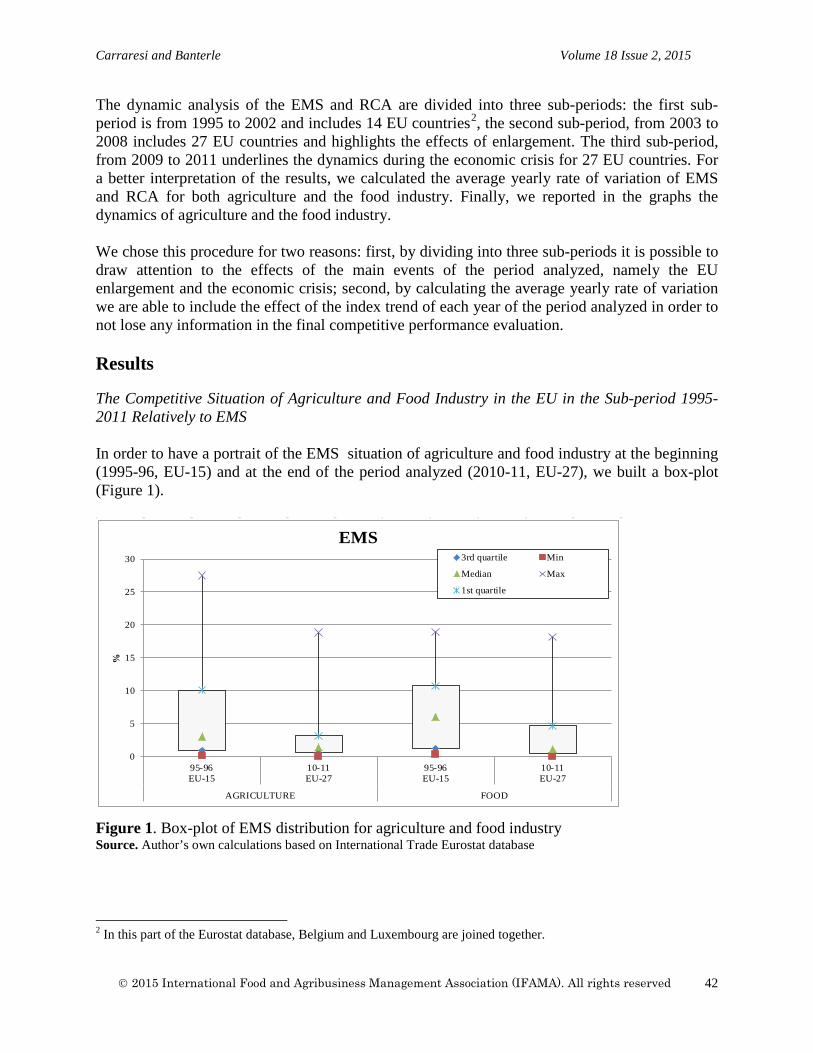
Carraresi and Banterle Volume 18 Issue 2, 2015
The dynamic analysis of the EMS and RCA are divided into three sub-periods: the first sub-period is from 1995 to 2002 and includes 14 EU countries2, the second sub-period, from 2003 to 2008 includes 27 EU countries and highlights the effects of enlargement. The third sub-period, from 2009 to 2011 underlines the dynamics during the economic crisis for 27 EU countries. For a better interpretation of the results, we calculated the average yearly rate of variation of EMS and RCA for both agriculture and the food industry. Finally, we reported in the graphs the dynamics of agriculture and the food industry. We chose this procedure for two reasons: first, by dividing into three sub-periods it is possible to draw attention to the effects of the main events of the period analyzed, namely the EU enlargement and the economic crisis; second, by calculating the average yearly rate of variation we are able to include the effect of the index trend of each year of the period analyzed in order to not lose any information in the final competitive performance evaluation. Results The Competitive Situation of Agriculture and Food Industry in the EU in the Sub-period 1995-2011 Relatively to EMS In order to have a portrait of the EMS situation of agriculture and food industry at the beginning (1995-96, EU-15) and at the end of the period analyzed (2010-11, EU-27), we built a box-plot (Figure 1).
Figure 1. Box-plot of EMS distribution for agriculture and food industry Source. Author’s own calculations based on International Trade Eurostat database
2 In this part of the Eurostat database, Belgium and Luxembourg are joined together.
0
5
10
15
20
25
30
95-96EU-15
10-11EU-27
95-96EU-15
10-11EU-27
AGRICULTURE FOOD
%
EMS3rd quartile Min
Median Max
1st quartile
2015 International Food and Agribusiness Management Association (IFAMA). All rights reserved
42
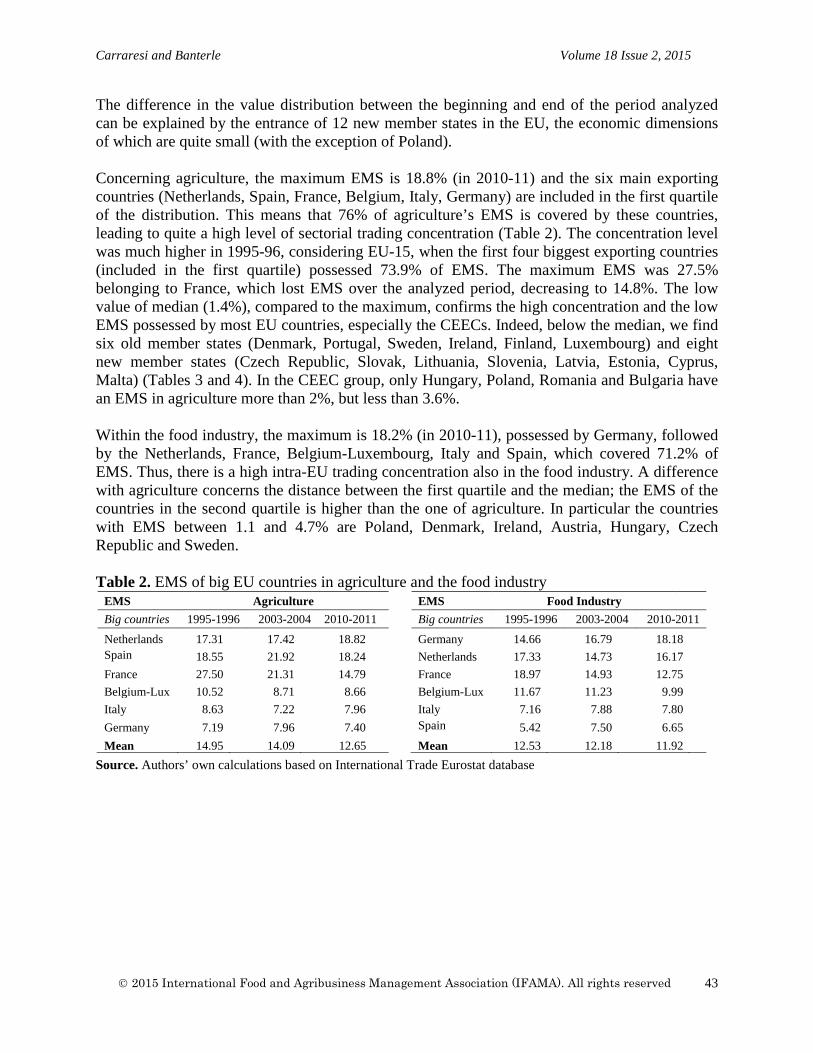
Carraresi and Banterle Volume 18 Issue 2, 2015
The difference in the value distribution between the beginning and end of the period analyzed can be explained by the entrance of 12 new member states in the EU, the economic dimensions of which are quite small (with the exception of Poland). Concerning agriculture, the maximum EMS is 18.8% (in 2010-11) and the six main exporting countries (Netherlands, Spain, France, Belgium, Italy, Germany) are included in the first quartile of the distribution. This means that 76% of agriculture’s EMS is covered by these countries, leading to quite a high level of sectorial trading concentration (Table 2). The concentration level was much higher in 1995-96, considering EU-15, when the first four biggest exporting countries (included in the first quartile) possessed 73.9% of EMS. The maximum EMS was 27.5% belonging to France, which lost EMS over the analyzed period, decreasing to 14.8%. The low value of median (1.4%), compared to the maximum, confirms the high concentration and the low EMS possessed by most EU countries, especially the CEECs. Indeed, below the median, we find six old member states (Denmark, Portugal, Sweden, Ireland, Finland, Luxembourg) and eight new member states (Czech Republic, Slovak, Lithuania, Slovenia, Latvia, Estonia, Cyprus, Malta) (Tables 3 and 4). In the CEEC group, only Hungary, Poland, Romania and Bulgaria have an EMS in agriculture more than 2%, but less than 3.6%. Within the food industry, the maximum is 18.2% (in 2010-11), possessed by Germany, followed by the Netherlands, France, Belgium-Luxembourg, Italy and Spain, which covered 71.2% of EMS. Thus, there is a high intra-EU trading concentration also in the food industry. A difference with agriculture concerns the distance between the first quartile and the median; the EMS of the countries in the second quartile is higher than the one of agriculture. In particular the countries with EMS between 1.1 and 4.7% are Poland, Denmark, Ireland, Austria, Hungary, Czech Republic and Sweden. Table 2. EMS of big EU countries in agriculture and the food industry
Source. Authors’ own calculations based on International Trade Eurostat database
EMS Agriculture EMS Food Industry Big countries 1995-1996 2003-2004 2010-2011 Big countries 1995-1996 2003-2004 2010-2011 Netherlands 17.31 17.42 18.82 Germany 14.66 16.79 18.18 Spain 18.55 21.92 18.24 Netherlands 17.33 14.73 16.17
France 27.50 21.31 14.79 France 18.97 14.93 12.75
Belgium-Lux 10.52 8.71 8.66 Belgium-Lux 11.67 11.23 9.99
Italy 8.63 7.22 7.96 Italy 7.16 7.88 7.80
Germany 7.19 7.96 7.40 Spain 5.42 7.50 6.65
Mean 14.95 14.09 12.65 Mean 12.53 12.18 11.92
2015 International Food and Agribusiness Management Association (IFAMA). All rights reserved
43
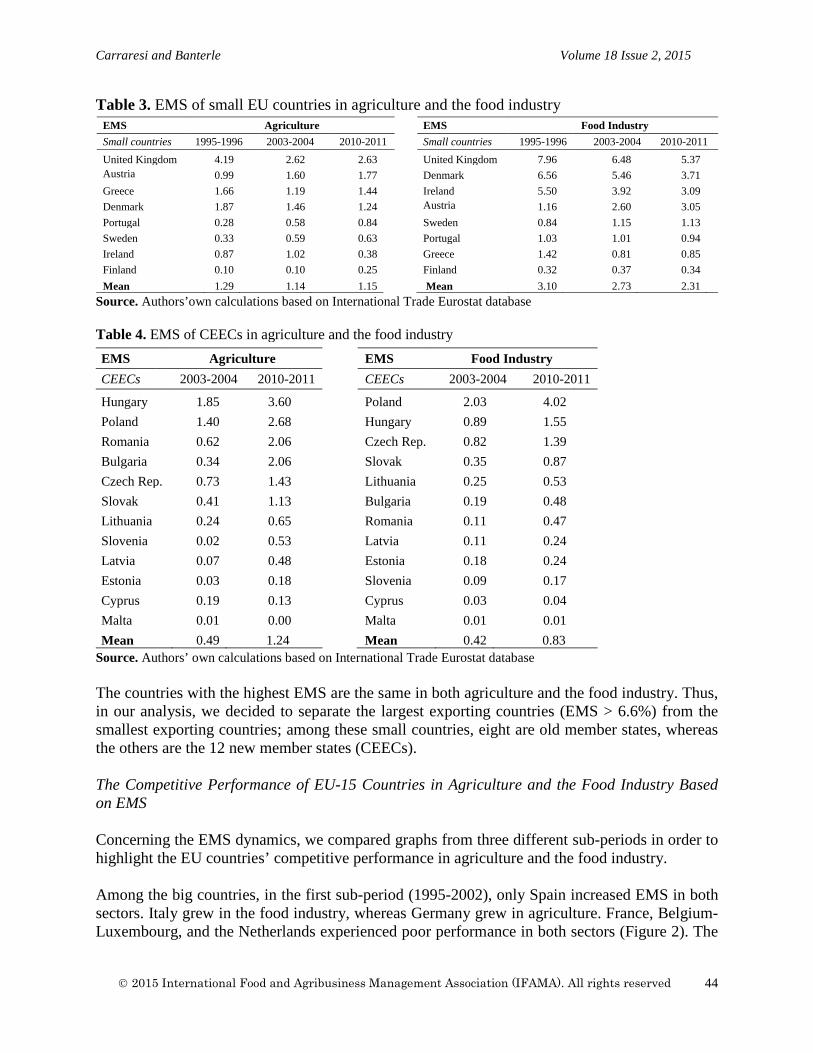
Carraresi and Banterle Volume 18 Issue 2, 2015
Table 3. EMS of small EU countries in agriculture and the food industry
Source. Authors’own calculations based on International Trade Eurostat database
Table 4. EMS of CEECs in agriculture and the food industry
Source. Authors’ own calculations based on International Trade Eurostat database The countries with the highest EMS are the same in both agriculture and the food industry. Thus, in our analysis, we decided to separate the largest exporting countries (EMS > 6.6%) from the smallest exporting countries; among these small countries, eight are old member states, whereas the others are the 12 new member states (CEECs).
The Competitive Performance of EU-15 Countries in Agriculture and the Food Industry Based on EMS Concerning the EMS dynamics, we compared graphs from three different sub-periods in order to highlight the EU countries’ competitive performance in agriculture and the food industry. Among the big countries, in the first sub-period (1995-2002), only Spain increased EMS in both sectors. Italy grew in the food industry, whereas Germany grew in agriculture. France, Belgium-Luxembourg, and the Netherlands experienced poor performance in both sectors (Figure 2). The
EMS Agriculture EMS Food Industry Small countries 1995-1996 2003-2004 2010-2011 Small countries 1995-1996 2003-2004 2010-2011 United Kingdom 4.19 2.62 2.63 United Kingdom 7.96 6.48 5.37 Austria 0.99 1.60 1.77 Denmark 6.56 5.46 3.71
Greece 1.66 1.19 1.44 Ireland 5.50 3.92 3.09
Denmark 1.87 1.46 1.24 Austria 1.16 2.60 3.05
Portugal 0.28 0.58 0.84 Sweden 0.84 1.15 1.13
Sweden 0.33 0.59 0.63 Portugal 1.03 1.01 0.94
Ireland 0.87 1.02 0.38 Greece 1.42 0.81 0.85
Finland 0.10 0.10 0.25 Finland 0.32 0.37 0.34
Mean 1.29 1.14 1.15 Mean 3.10 2.73 2.31
EMS Agriculture EMS Food Industry CEECs 2003-2004 2010-2011 CEECs 2003-2004 2010-2011
Hungary 1.85 3.60 Poland 2.03 4.02 Poland 1.40 2.68 Hungary 0.89 1.55 Romania 0.62 2.06 Czech Rep. 0.82 1.39 Bulgaria 0.34 2.06 Slovak 0.35 0.87 Czech Rep. 0.73 1.43 Lithuania 0.25 0.53 Slovak 0.41 1.13 Bulgaria 0.19 0.48 Lithuania 0.24 0.65 Romania 0.11 0.47 Slovenia 0.02 0.53 Latvia 0.11 0.24 Latvia 0.07 0.48 Estonia 0.18 0.24 Estonia 0.03 0.18 Slovenia 0.09 0.17 Cyprus 0.19 0.13 Cyprus 0.03 0.04 Malta 0.01 0.00 Malta 0.01 0.01 Mean 0.49 1.24 Mean 0.42 0.83
2015 International Food and Agribusiness Management Association (IFAMA). All rights reserved
44
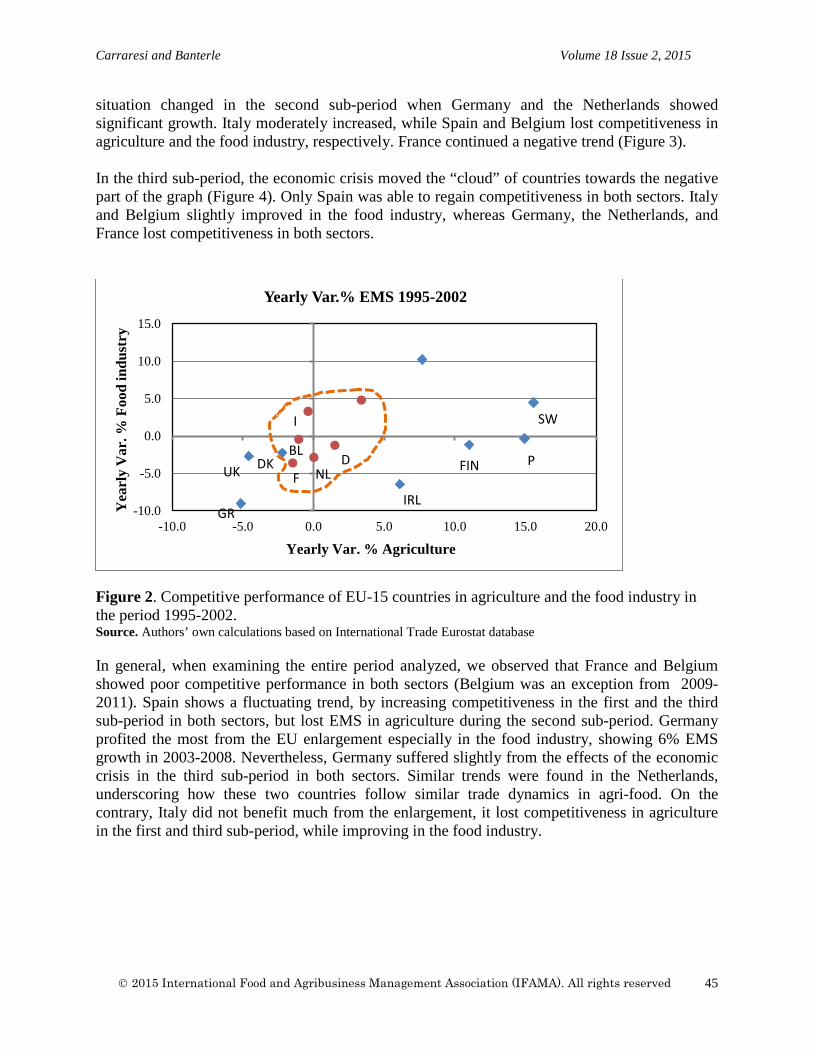
Carraresi and Banterle Volume 18 Issue 2, 2015
situation changed in the second sub-period when Germany and the Netherlands showed significant growth. Italy moderately increased, while Spain and Belgium lost competitiveness in agriculture and the food industry, respectively. France continued a negative trend (Figure 3). In the third sub-period, the economic crisis moved the “cloud” of countries towards the negative part of the graph (Figure 4). Only Spain was able to regain competitiveness in both sectors. Italy and Belgium slightly improved in the food industry, whereas Germany, the Netherlands, and France lost competitiveness in both sectors.
Figure 2. Competitive performance of EU-15 countries in agriculture and the food industry in the period 1995-2002. Source. Authors’ own calculations based on International Trade Eurostat database In general, when examining the entire period analyzed, we observed that France and Belgium showed poor competitive performance in both sectors (Belgium was an exception from 2009-2011). Spain shows a fluctuating trend, by increasing competitiveness in the first and the third sub-period in both sectors, but lost EMS in agriculture during the second sub-period. Germany profited the most from the EU enlargement especially in the food industry, showing 6% EMS growth in 2003-2008. Nevertheless, Germany suffered slightly from the effects of the economic crisis in the third sub-period in both sectors. Similar trends were found in the Netherlands, underscoring how these two countries follow similar trade dynamics in agri-food. On the contrary, Italy did not benefit much from the enlargement, it lost competitiveness in agriculture in the first and third sub-period, while improving in the food industry.
-10.0
-5.0
0.0
5.0
10.0
15.0
-10.0 -5.0 0.0 5.0 10.0 15.0 20.0
Yea
rly
Var
. % F
ood
indu
stry
Yearly Var. % Agriculture
Yearly Var.% EMS 1995-2002
SW I
BL DK UK F NL
GR
D
IRL
FIN P
2015 International Food and Agribusiness Management Association (IFAMA). All rights reserved
45
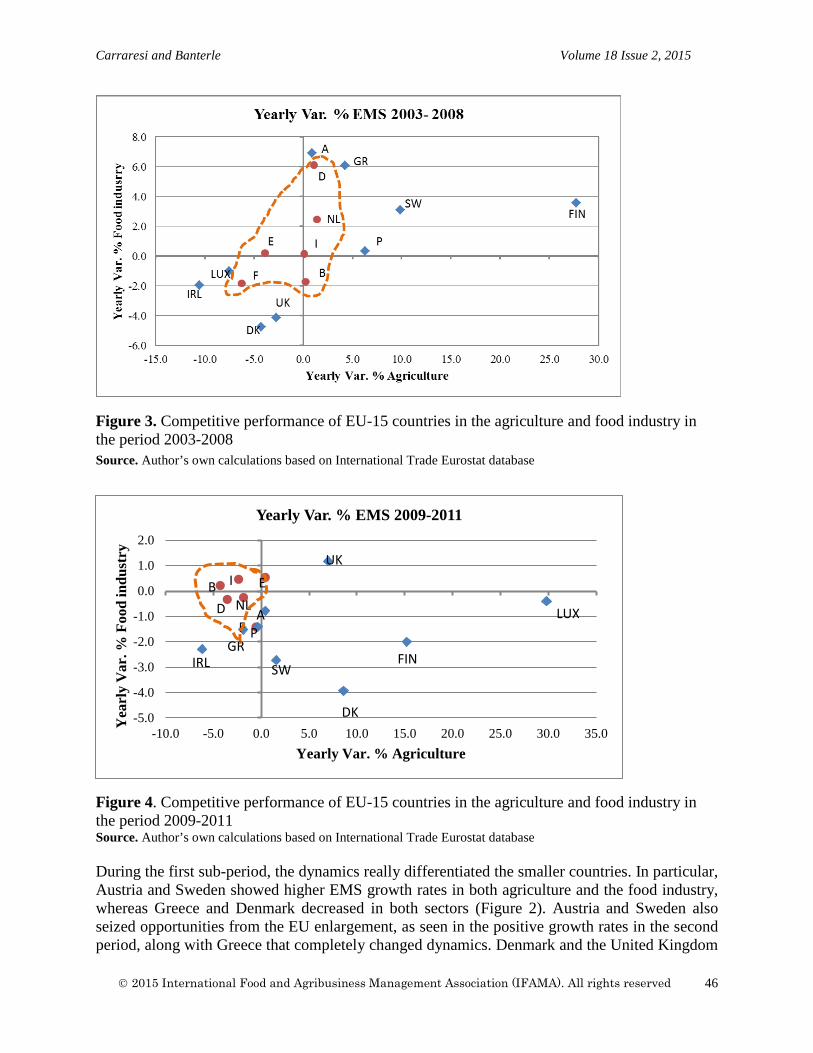
Carraresi and Banterle Volume 18 Issue 2, 2015
Figure 3. Competitive performance of EU-15 countries in the agriculture and food industry in the period 2003-2008 Source. Author’s own calculations based on International Trade Eurostat database
Figure 4. Competitive performance of EU-15 countries in the agriculture and food industry in the period 2009-2011 Source. Author’s own calculations based on International Trade Eurostat database During the first sub-period, the dynamics really differentiated the smaller countries. In particular, Austria and Sweden showed higher EMS growth rates in both agriculture and the food industry, whereas Greece and Denmark decreased in both sectors (Figure 2). Austria and Sweden also seized opportunities from the EU enlargement, as seen in the positive growth rates in the second period, along with Greece that completely changed dynamics. Denmark and the United Kingdom
-5.0
-4.0
-3.0
-2.0
-1.0
0.0
1.0
2.0
-10.0 -5.0 0.0 5.0 10.0 15.0 20.0 25.0 30.0 35.0
Yea
rly
Var
. % F
ood
indu
stry
Yearly Var. % Agriculture
Yearly Var. % EMS 2009-2011
UK
LUX
E
A
FIN
DK
SW
F P GR
IRL
NL D
I B
2015 International Food and Agribusiness Management Association (IFAMA). All rights reserved
46
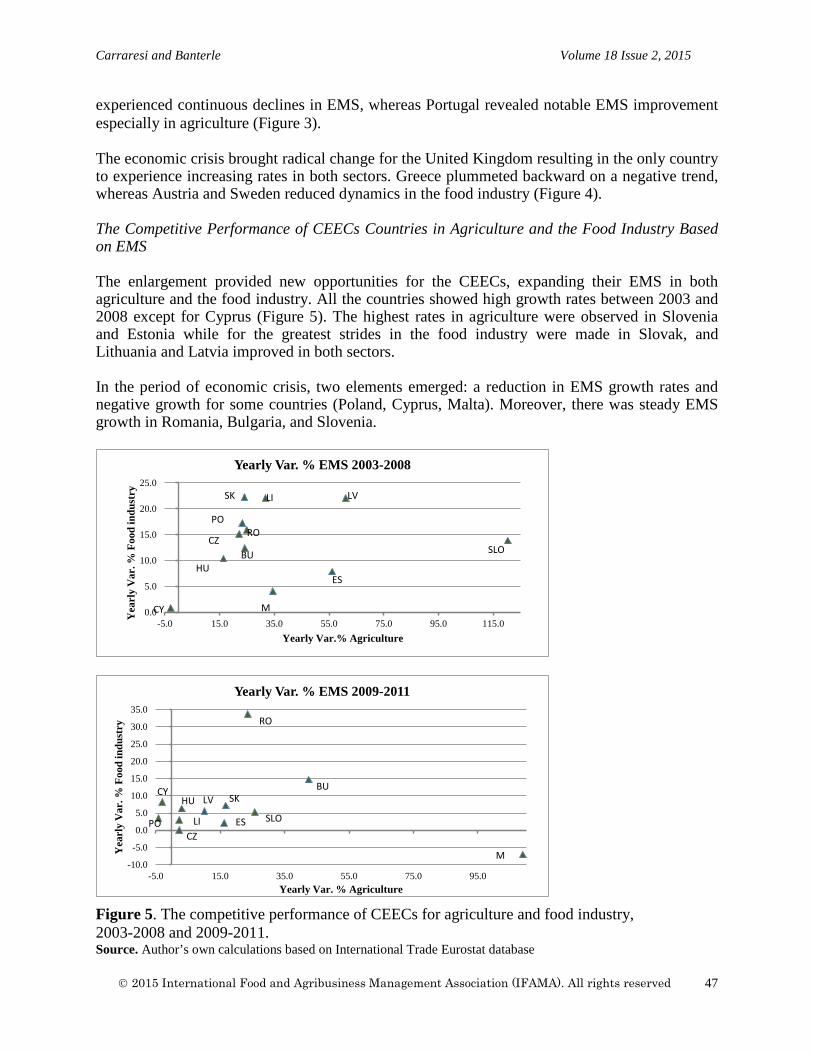
Carraresi and Banterle Volume 18 Issue 2, 2015
experienced continuous declines in EMS, whereas Portugal revealed notable EMS improvement especially in agriculture (Figure 3). The economic crisis brought radical change for the United Kingdom resulting in the only country to experience increasing rates in both sectors. Greece plummeted backward on a negative trend, whereas Austria and Sweden reduced dynamics in the food industry (Figure 4). The Competitive Performance of CEECs Countries in Agriculture and the Food Industry Based on EMS The enlargement provided new opportunities for the CEECs, expanding their EMS in both agriculture and the food industry. All the countries showed high growth rates between 2003 and 2008 except for Cyprus (Figure 5). The highest rates in agriculture were observed in Slovenia and Estonia while for the greatest strides in the food industry were made in Slovak, and Lithuania and Latvia improved in both sectors. In the period of economic crisis, two elements emerged: a reduction in EMS growth rates and negative growth for some countries (Poland, Cyprus, Malta). Moreover, there was steady EMS growth in Romania, Bulgaria, and Slovenia.
Figure 5. The competitive performance of CEECs for agriculture and food industry, 2003-2008 and 2009-2011. Source. Author’s own calculations based on International Trade Eurostat database
0.0
5.0
10.0
15.0
20.0
25.0
-5.0 15.0 35.0 55.0 75.0 95.0 115.0
Yea
rly
Var
. % F
ood
indu
stry
Yearly Var.% Agriculture
Yearly Var. % EMS 2003-2008
CY
HU
M
ES
BUCZ
ROPO
SK LI LV
SLO
-10.0
-5.0
0.0
5.0
10.0
15.0
20.0
25.0
30.0
35.0
-5.0 15.0 35.0 55.0 75.0 95.0
Yea
rly
Var
. % F
ood
indu
stry
Yearly Var. % Agriculture
Yearly Var. % EMS 2009-2011
M
BU
RO
SLO
SK
ES
LVHU
LICZ
PO
CY
2015 International Food and Agribusiness Management Association (IFAMA). All rights reserved
47
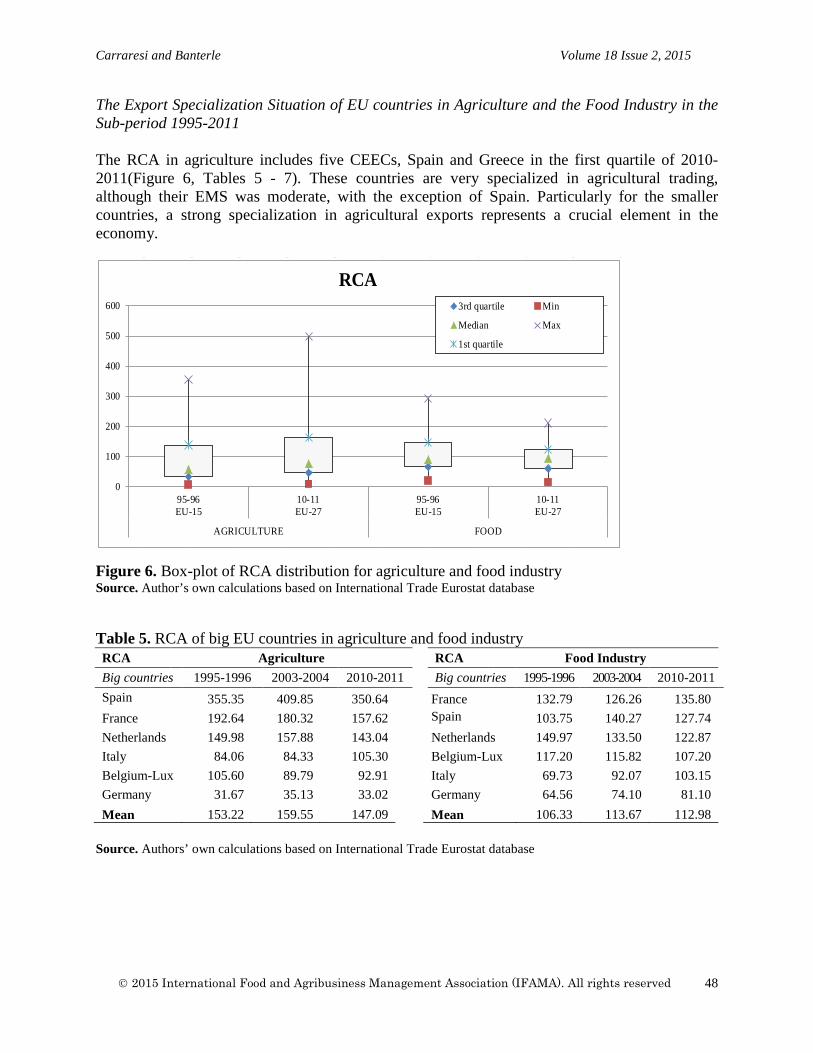
Carraresi and Banterle Volume 18 Issue 2, 2015
The Export Specialization Situation of EU countries in Agriculture and the Food Industry in the Sub-period 1995-2011 The RCA in agriculture includes five CEECs, Spain and Greece in the first quartile of 2010-2011(Figure 6, Tables 5 - 7). These countries are very specialized in agricultural trading, although their EMS was moderate, with the exception of Spain. Particularly for the smaller countries, a strong specialization in agricultural exports represents a crucial element in the economy.
Figure 6. Box-plot of RCA distribution for agriculture and food industry Source. Author’s own calculations based on International Trade Eurostat database Table 5. RCA of big EU countries in agriculture and food industry RCA Agriculture RCA Food Industry Big countries 1995-1996 2003-2004 2010-2011 Big countries 1995-1996 2003-2004 2010-2011 Spain 355.35 409.85 350.64 France 132.79 126.26 135.80
France 192.64 180.32 157.62 Spain 103.75 140.27 127.74
Netherlands 149.98 157.88 143.04 Netherlands 149.97 133.50 122.87
Italy 84.06 84.33 105.30 Belgium-Lux 117.20 115.82 107.20
Belgium-Lux 105.60 89.79 92.91 Italy 69.73 92.07 103.15
Germany 31.67 35.13 33.02 Germany 64.56 74.10 81.10
Mean 153.22 159.55 147.09 Mean 106.33 113.67 112.98
Source. Authors’ own calculations based on International Trade Eurostat database
EU-27
0
100
200
300
400
500
600
95-96EU-15
10-11EU-27
95-96EU-15
10-11EU-27
AGRICULTURE FOOD
RCA3rd quartile Min
Median Max
1st quartile
2015 International Food and Agribusiness Management Association (IFAMA). All rights reserved
48
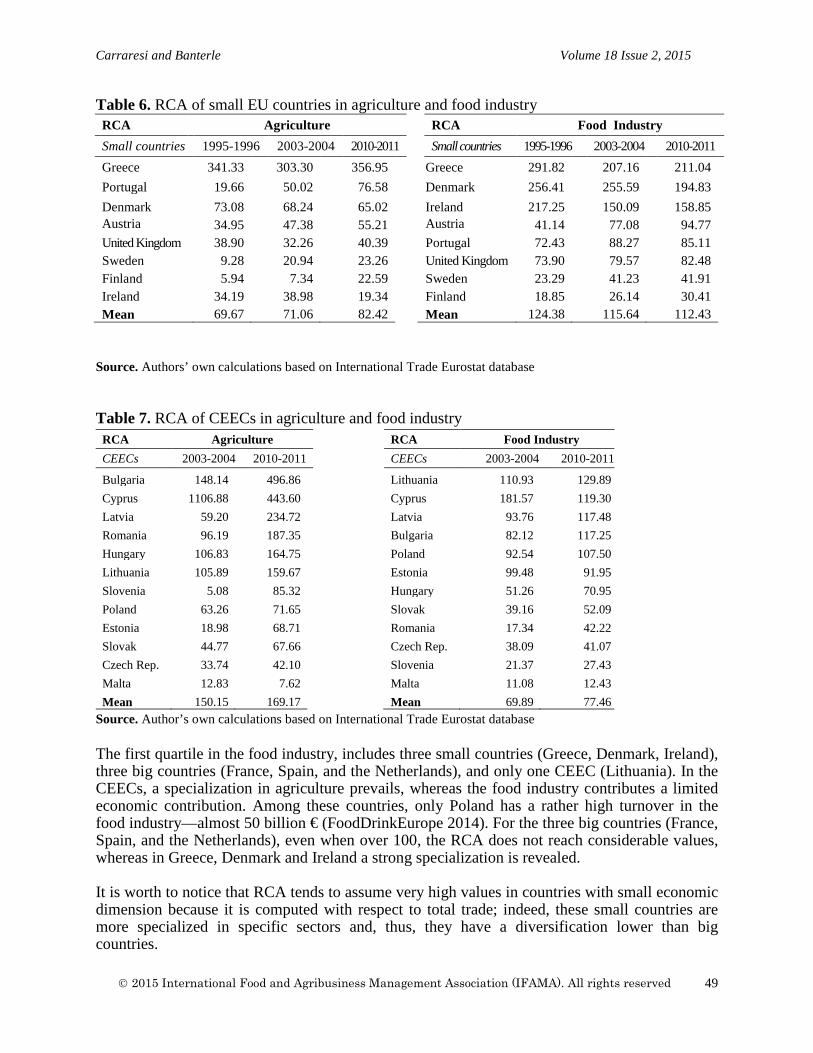
Carraresi and Banterle Volume 18 Issue 2, 2015
Table 6. RCA of small EU countries in agriculture and food industry RCA Agriculture RCA Food Industry Small countries 1995-1996 2003-2004 2010-2011 Small countries 1995-1996 2003-2004 2010-2011 Greece 341.33 303.30 356.95 Greece 291.82 207.16 211.04
Portugal 19.66 50.02 76.58 Denmark 256.41 255.59 194.83
Denmark 73.08 68.24 65.02 Ireland 217.25 150.09 158.85 Austria 34.95 47.38 55.21 Austria 41.14 77.08 94.77 United Kingdom 38.90 32.26 40.39 Portugal 72.43 88.27 85.11 Sweden 9.28 20.94 23.26 United Kingdom 73.90 79.57 82.48 Finland 5.94 7.34 22.59 Sweden 23.29 41.23 41.91 Ireland 34.19 38.98 19.34 Finland 18.85 26.14 30.41 Mean 69.67 71.06 82.42 Mean 124.38 115.64 112.43
Source. Authors’ own calculations based on International Trade Eurostat database
Table 7. RCA of CEECs in agriculture and food industry
Source. Author’s own calculations based on International Trade Eurostat database The first quartile in the food industry, includes three small countries (Greece, Denmark, Ireland), three big countries (France, Spain, and the Netherlands), and only one CEEC (Lithuania). In the CEECs, a specialization in agriculture prevails, whereas the food industry contributes a limited economic contribution. Among these countries, only Poland has a rather high turnover in the food industry—almost 50 billion € (FoodDrinkEurope 2014). For the three big countries (France, Spain, and the Netherlands), even when over 100, the RCA does not reach considerable values, whereas in Greece, Denmark and Ireland a strong specialization is revealed. It is worth to notice that RCA tends to assume very high values in countries with small economic dimension because it is computed with respect to total trade; indeed, these small countries are more specialized in specific sectors and, thus, they have a diversification lower than big countries.
RCA Agriculture RCA Food Industry CEECs 2003-2004 2010-2011 CEECs 2003-2004 2010-2011
Bulgaria 148.14 496.86 Lithuania 110.93 129.89 Cyprus 1106.88 443.60 Cyprus 181.57 119.30 Latvia 59.20 234.72 Latvia 93.76 117.48 Romania 96.19 187.35 Bulgaria 82.12 117.25 Hungary 106.83 164.75 Poland 92.54 107.50 Lithuania 105.89 159.67 Estonia 99.48 91.95 Slovenia 5.08 85.32 Hungary 51.26 70.95 Poland 63.26 71.65 Slovak 39.16 52.09 Estonia 18.98 68.71 Romania 17.34 42.22 Slovak 44.77 67.66 Czech Rep. 38.09 41.07 Czech Rep. 33.74 42.10 Slovenia 21.37 27.43 Malta 12.83 7.62 Malta 11.08 12.43
Mean 150.15 169.17 Mean 69.89 77.46
2015 International Food and Agribusiness Management Association (IFAMA). All rights reserved
49
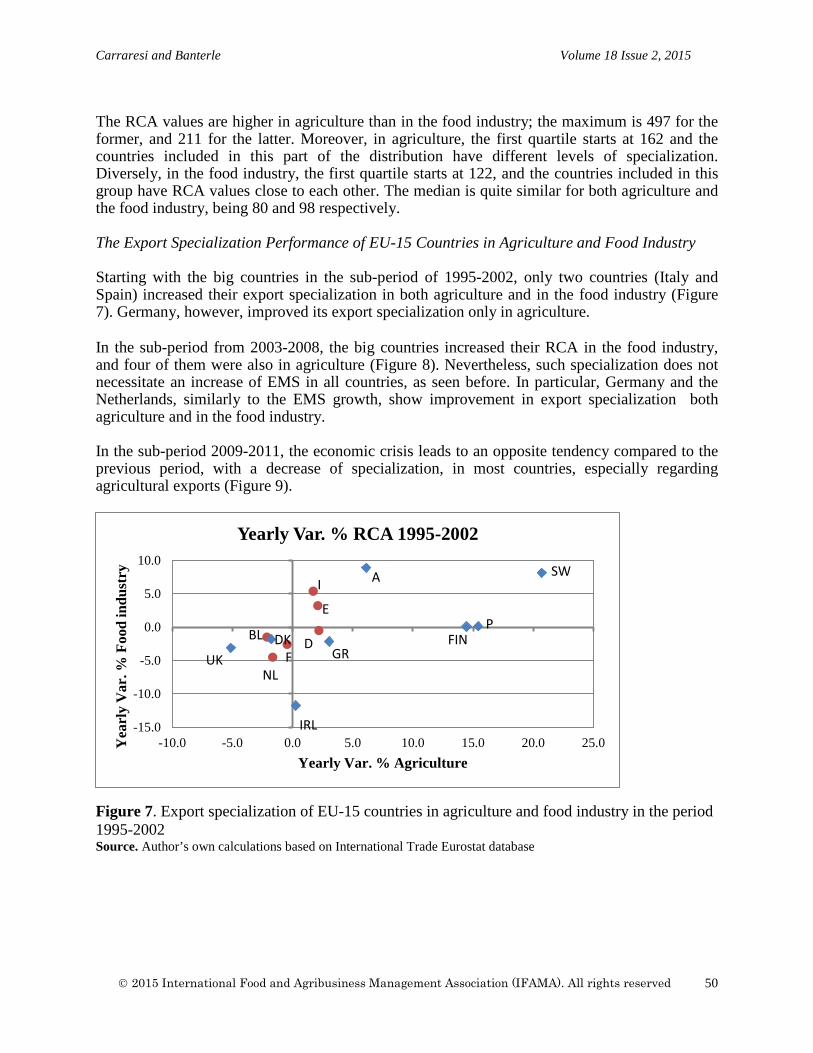
Carraresi and Banterle Volume 18 Issue 2, 2015
The RCA values are higher in agriculture than in the food industry; the maximum is 497 for the former, and 211 for the latter. Moreover, in agriculture, the first quartile starts at 162 and the countries included in this part of the distribution have different levels of specialization. Diversely, in the food industry, the first quartile starts at 122, and the countries included in this group have RCA values close to each other. The median is quite similar for both agriculture and the food industry, being 80 and 98 respectively. The Export Specialization Performance of EU-15 Countries in Agriculture and Food Industry Starting with the big countries in the sub-period of 1995-2002, only two countries (Italy and Spain) increased their export specialization in both agriculture and in the food industry (Figure 7). Germany, however, improved its export specialization only in agriculture. In the sub-period from 2003-2008, the big countries increased their RCA in the food industry, and four of them were also in agriculture (Figure 8). Nevertheless, such specialization does not necessitate an increase of EMS in all countries, as seen before. In particular, Germany and the Netherlands, similarly to the EMS growth, show improvement in export specialization both agriculture and in the food industry. In the sub-period 2009-2011, the economic crisis leads to an opposite tendency compared to the previous period, with a decrease of specialization, in most countries, especially regarding agricultural exports (Figure 9).
Figure 7. Export specialization of EU-15 countries in agriculture and food industry in the period 1995-2002 Source. Author’s own calculations based on International Trade Eurostat database
-15.0
-10.0
-5.0
0.0
5.0
10.0
-10.0 -5.0 0.0 5.0 10.0 15.0 20.0 25.0Yea
rly
Var
. % F
ood
indu
stry
Yearly Var. % Agriculture
Yearly Var. % RCA 1995-2002
SW A I
E P
FIN D GR F
DK BL
UK NL
IRL
2015 International Food and Agribusiness Management Association (IFAMA). All rights reserved
50
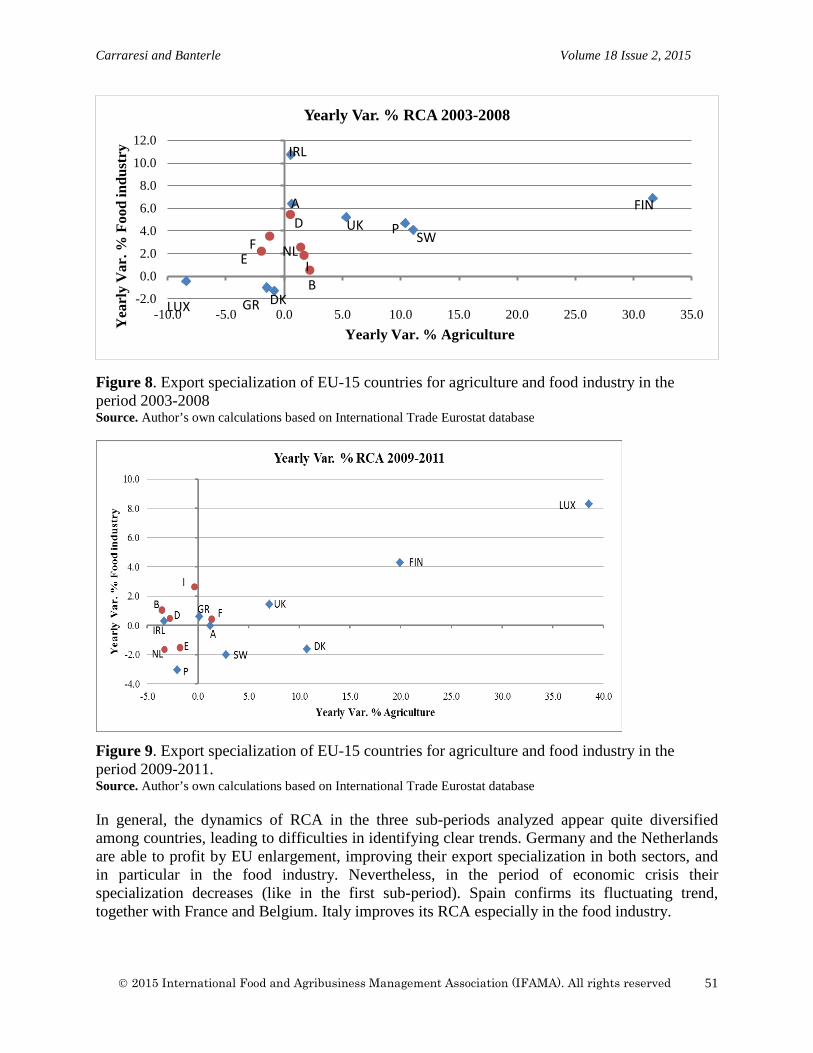
Carraresi and Banterle Volume 18 Issue 2, 2015
Figure 8. Export specialization of EU-15 countries for agriculture and food industry in the period 2003-2008 Source. Author’s own calculations based on International Trade Eurostat database
Figure 9. Export specialization of EU-15 countries for agriculture and food industry in the period 2009-2011. Source. Author’s own calculations based on International Trade Eurostat database
In general, the dynamics of RCA in the three sub-periods analyzed appear quite diversified among countries, leading to difficulties in identifying clear trends. Germany and the Netherlands are able to profit by EU enlargement, improving their export specialization in both sectors, and in particular in the food industry. Nevertheless, in the period of economic crisis their specialization decreases (like in the first sub-period). Spain confirms its fluctuating trend, together with France and Belgium. Italy improves its RCA especially in the food industry.
-2.0
0.0
2.0
4.0
6.0
8.0
10.0
12.0
-10.0 -5.0 0.0 5.0 10.0 15.0 20.0 25.0 30.0 35.0
Yea
rly
Var
. % F
ood
indu
stry
Yearly Var. % Agriculture
Yearly Var. % RCA 2003-2008
IRL
FIN
SW P UK A D
F NL I B
E
LUX DK GR
2015 International Food and Agribusiness Management Association (IFAMA). All rights reserved
51
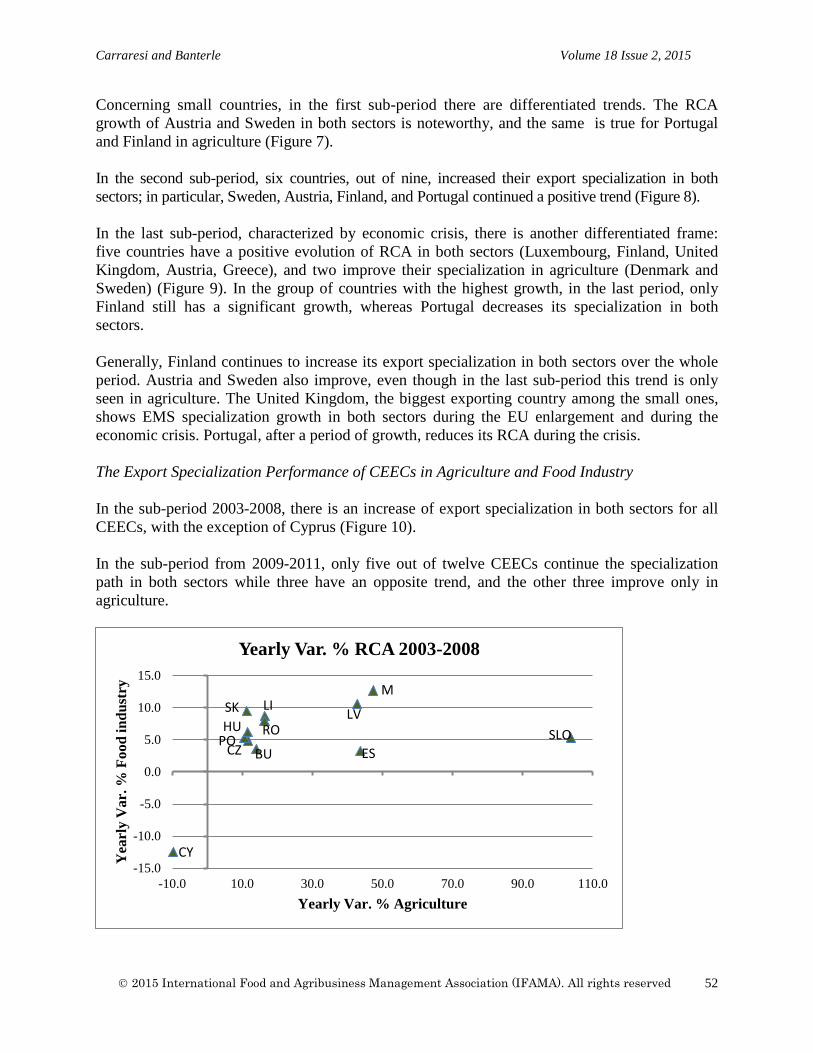
Carraresi and Banterle Volume 18 Issue 2, 2015
Concerning small countries, in the first sub-period there are differentiated trends. The RCA growth of Austria and Sweden in both sectors is noteworthy, and the same is true for Portugal and Finland in agriculture (Figure 7). In the second sub-period, six countries, out of nine, increased their export specialization in both sectors; in particular, Sweden, Austria, Finland, and Portugal continued a positive trend (Figure 8). In the last sub-period, characterized by economic crisis, there is another differentiated frame: five countries have a positive evolution of RCA in both sectors (Luxembourg, Finland, United Kingdom, Austria, Greece), and two improve their specialization in agriculture (Denmark and Sweden) (Figure 9). In the group of countries with the highest growth, in the last period, only Finland still has a significant growth, whereas Portugal decreases its specialization in both sectors. Generally, Finland continues to increase its export specialization in both sectors over the whole period. Austria and Sweden also improve, even though in the last sub-period this trend is only seen in agriculture. The United Kingdom, the biggest exporting country among the small ones, shows EMS specialization growth in both sectors during the EU enlargement and during the economic crisis. Portugal, after a period of growth, reduces its RCA during the crisis. The Export Specialization Performance of CEECs in Agriculture and Food Industry In the sub-period 2003-2008, there is an increase of export specialization in both sectors for all CEECs, with the exception of Cyprus (Figure 10). In the sub-period from 2009-2011, only five out of twelve CEECs continue the specialization path in both sectors while three have an opposite trend, and the other three improve only in agriculture.
-15.0
-10.0
-5.0
0.0
5.0
10.0
15.0
-10.0 10.0 30.0 50.0 70.0 90.0 110.0
Yea
rly
Var
. % F
ood
indu
stry
Yearly Var. % Agriculture
Yearly Var. % RCA 2003-2008
CY
SLO
M
LV
ES
LI
RO SK HU
BU CZ PO
2015 International Food and Agribusiness Management Association (IFAMA). All rights reserved
52
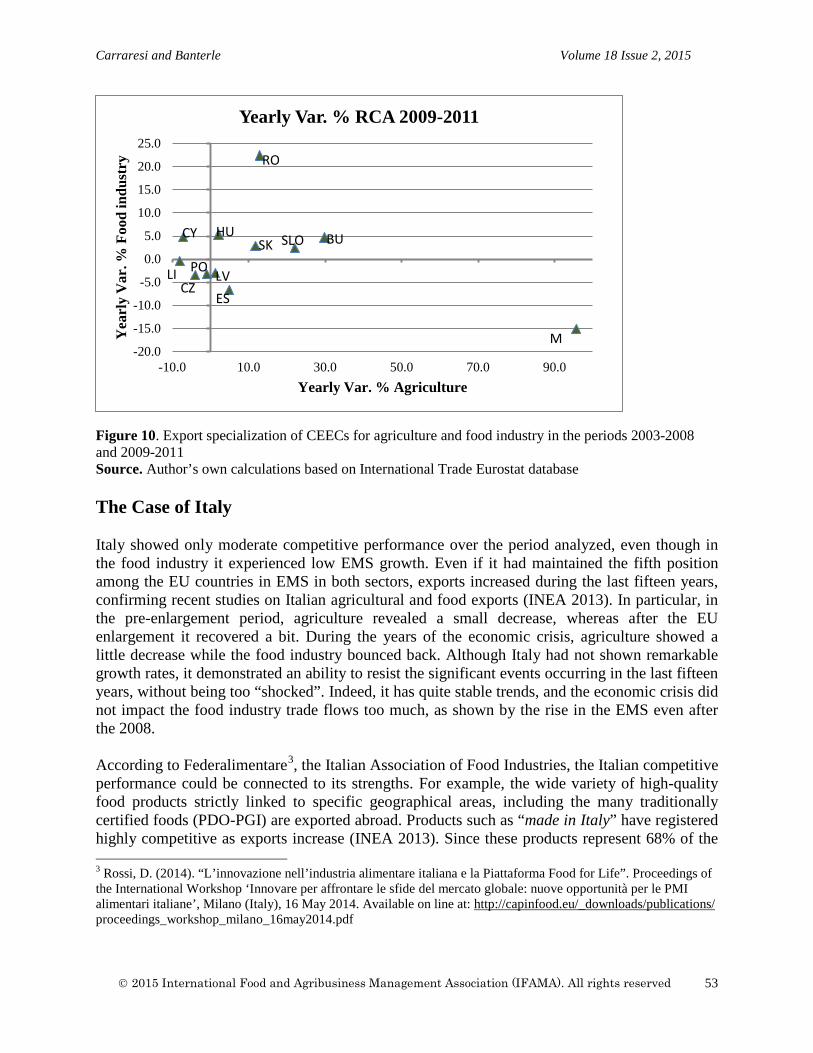
Carraresi and Banterle Volume 18 Issue 2, 2015
Figure 10. Export specialization of CEECs for agriculture and food industry in the periods 2003-2008 and 2009-2011 Source. Author’s own calculations based on International Trade Eurostat database The Case of Italy Italy showed only moderate competitive performance over the period analyzed, even though in the food industry it experienced low EMS growth. Even if it had maintained the fifth position among the EU countries in EMS in both sectors, exports increased during the last fifteen years, confirming recent studies on Italian agricultural and food exports (INEA 2013). In particular, in the pre-enlargement period, agriculture revealed a small decrease, whereas after the EU enlargement it recovered a bit. During the years of the economic crisis, agriculture showed a little decrease while the food industry bounced back. Although Italy had not shown remarkable growth rates, it demonstrated an ability to resist the significant events occurring in the last fifteen years, without being too “shocked”. Indeed, it has quite stable trends, and the economic crisis did not impact the food industry trade flows too much, as shown by the rise in the EMS even after the 2008. According to Federalimentare3, the Italian Association of Food Industries, the Italian competitive performance could be connected to its strengths. For example, the wide variety of high-quality food products strictly linked to specific geographical areas, including the many traditionally certified foods (PDO-PGI) are exported abroad. Products such as “made in Italy” have registered highly competitive as exports increase (INEA 2013). Since these products represent 68% of the
3 Rossi, D. (2014). “L’innovazione nell’industria alimentare italiana e la Piattaforma Food for Life”. Proceedings of the International Workshop ‘Innovare per affrontare le sfide del mercato globale: nuove opportunità per le PMI alimentari italiane’, Milano (Italy), 16 May 2014. Available on line at: http://capinfood.eu/_downloads/publications/ proceedings_workshop_milano_16may2014.pdf
-20.0
-15.0
-10.0
-5.0
0.0
5.0
10.0
15.0
20.0
25.0
-10.0 10.0 30.0 50.0 70.0 90.0
Yea
rly
Var
. % F
ood
indu
stry
Yearly Var. % Agriculture
Yearly Var. % RCA 2009-2011
M
BU SLO SK
RO
HU
ES LV
CZ LI PO
CY
2015 International Food and Agribusiness Management Association (IFAMA). All rights reserved
53
Carraresi and Banterle Volume 18 Issue 2, 2015
total Italian food exports (INEA 2013), we could assert that the positive trend of the export indices is largely derived from them. Furthermore, Italy has high safety standards as a warranty for consumers, and possesses a strong ability to combine tradition with process and product innovation in order to create products like “made in Italy”, but also with convenience features. On the other hand, the Italian food industry also has some weaknesses which hamper its ability to expand its presence in the international market. The Italian food sector is characterized by a large number of SMEs, which often have insufficient capacity to innovate (Wijnands et al. 2008). Logistics and service costs (energy, transports, infrastructures) are very high, reducing their ability to improve competitive indices and reach levels seen in countries such as Germany or the Netherlands. Finally, the absence of Italian retail chains in other countries also constitutes a bottleneck for the competitiveness of Italian food industry. Discussion Our analysis revealed that in the intra-EU trade, there is a high concentration of EMS considering that the first six countries possess 76% of agriculture’s EMS and 71% of food industry’s EMS. In the former case, the largest share is the Netherlands (18.8%), whereas, in the latter case, Germany is the largest exporter (18.2%). Within this group of big countries, four of them (Spain, France, Netherlands, Italy) also have an RCA greater than 100 in agriculture, whereas Belgium and Germany are not specialized. For what concerns the food industry, all big countries are specialized, with the exception of Germany. Thus, a particular finding is that the country with the highest EMS does not reveal any specialization in the sectors analyzed, and this is due to the high level of total trade exports. In the entire period analyzed, Germany and the Netherlands have been able to profit from opportunities connected to the EU enlargement. On the contrary, France has lost competitiveness, confirming outcomes of previous studies (Butault and Requillart 2012; Baudchon 2013). A similar trend was found in Belgium. Italy shows a substantial competitiveness stasis, similar to Spain (especially in the food industry). The Netherlands has been the strongest performing country, among the big ones, in both sectors examined. It has reinforced its competitive position in both sectors even though it has slightly lost specialization, due to a rise in exports in other sectors that have affected the RCA value. Italy is characterized by smaller improvements in competitiveness, especially in the food sector. Moreover, it should be noted that among the big countries, the agricultural EMS does not reveal high rates of growth in the second period and there was a negative tendency in the third period. Although, Germany and the Netherlands did experience high rates in the food industry during the second period, and EMS growth occurred in the third period for three other countries (Spain, Italy, and Belgium). Thus, even though agriculture is strictly related to the food industry, there are different evolutions; indeed, in some cases the EMS trend of the two sectors analyzed goes in the same direction, whereas in other cases the trends are different, outlining a high case specificity.
2015 International Food and Agribusiness Management Association (IFAMA). All rights reserved
54
Carraresi and Banterle Volume 18 Issue 2, 2015
The smaller countries experienced differentiated dynamics. In particular, Austria and Sweden benefited from the EU enlargement, increasing export specialization in both agriculture and the food industry, although they suffered like most of the EU countries, during the economic crisis, especially in the food industry. Denmark and the United Kingdom experienced a negative trend until 2008 but were able to recover during the economic crisis. It is noteworthy that the majority of the small countries increased their RCA in both sectors just after the EU enlargement. Agriculture for the small countries shows different dynamics compared to those seen in the big countries. Indeed, there are high growth rates over the entire period analyzed. In the first and the second sub-period, five out of eight countries show an upward trend, and in the third sub-period, six out of eight countries made gains in competitiveness. Thus, while the food industry was the most expanding sector in the group of big countries, an opposite dynamic occurred in small countries showing high growth rates in agriculture, confirming the hypothesis that the two sectors have independent evolutions. Admission into the EU constituted big EMS expansion opportunities for the CEECs, in both sectors. As Bojnec and Fertő (2012) also assert, during the economic crisis, their growth rates experienced a slowdown. Indeed, they found strongly increasing competitiveness indices, with some small exceptions (Cyprus and Malta), in line with the previous literature (Török and Jámbor 2013). Some CEECs, like Poland, highly increased their exports, especially in the food sector. The EU accession has enabled revival investments into the food industry, and food producers have been able to compete with competitors from old member states. Even though the EMS remains low in respect to other countries, the increasing trend of indices demonstrate that these countries have profited by the integration and have been able to well interpret the needs of European consumers and translate them into cheaper food products (Mroczek and Szczepaniak 2012). Specialization in agriculture and the food industry is very important to the CEECs. Even as dimensions of these sectors are limited, they still play a relevant role in the global economy of the country. Obviously, as seen in other countries, the economic crisis softened their specialization path. Generally, CEECs have gained in competitive performance, even as trade flows into Western countries are sometimes hampered by non-tariff barriers (e.g. standards, consumer protection, public health) (Juhász and Wagner 2013). Nevertheless, we should be careful with the assessments on CEECs data, due to their very small absolute values, a little variation of EMS and/or RCA produce significant effects at a percentage level. Focusing on the specific case of Italy, we underline that their competitive position in the EU market could be further enhanced by exploiting the opportunities connected to traditional and specialty products (which represent the strengths of the sector) and though introducing innovations in distribution channels. The limitations of this study are related to the difficulty in highlighting the determinants of competitiveness starting with the trade indices. Thus, analyzing the determinants of country competitiveness could be an interesting topic for future investigation. Further research will be oriented towards better understanding the factors affecting competitive performance of agriculture and the food industry in different countries and perhaps exploring the variables
2015 International Food and Agribusiness Management Association (IFAMA). All rights reserved
55
Carraresi and Banterle Volume 18 Issue 2, 2015
connected to food product quality with trade indices, or investigating the relationship between some socio-economic indices and trade. Conclusion Our analysis highlights four main results. First, in the EU, a strong concentration of intra-trade flows is revealed both in agriculture and the food industry. Only six countries play a relevant role in trading: four of them are included among those countries with the highest GDP (Germany, France, Italy, Spain), and the other two are traditionally export-oriented countries (the Netherlands and Belgium). The United Kingdom is included in the group of small countries as it has a small market share in agri-food export within the EU. Second, a relationship seems to exist between the competitive performance and (i) the country export specialization or (ii) the general export-orientation of the country. Indeed, in some cases good performance during the period analyzed seems to be linked with the export specialization in the sectors analyzed (agriculture and food industry) though this relationship needs an in-depth assessment. In the case of Germany, the opposite is true, good competitive performance is connected to the strong export-orientation of this country, namely the whole trade system pulls the sectorial competitive performance. Third, our analysis inferred that although agriculture and the food industry are well inter-connected sectors, their export trends follow different dynamics, at the time convergent or divergent. Therefore, it is not possible to highlight a general dynamic or identify which sector is pushing or pulling the other one. Thus, we could say that a high case specificity is revealed, and the hypothesis of an independent trend seems to prevail. Fourth, the CEECs played a peculiar role in the period examined. Even though they cover marginal roles in the intra-EU agri-food trade, the analysis showed that they had good competitive performance connected with the EU enlargement, especially for what concerns agriculture. This positive trend decreased during the period characterized by the crisis, but in many cases we noticed positive evolutions. Concerning the managerial impications, it is worth noting that the outlined trends at a sector level reflect the competitive performance of firms in different countries. Therefore, good sectorial results were derived from well-performing firms that profited by market opportunities resulting from the EU enlargement (Adams et al. 2006). This is the case for Germany, the Netherlands, Austria, Sweden and, partially, Italy. Firms operating in agri-food activities have been less affected by the economic crisis in the later period of years analyzed than those in other industries due to the anti-cyclical nature of the food sector. Firms from the most competitive countries were able to identify and fully take advantage of the opportunities existing in the EU market during this period. Thus, a firm’s capability to act in international markets is becoming more and more important, just as it is for small businesses to achieve successful results.
2015 International Food and Agribusiness Management Association (IFAMA). All rights reserved
56
Carraresi and Banterle Volume 18 Issue 2, 2015
Consequently, even small and medium-sized enterprises, which are the backbone of the European agri-food sector4, should be aware of the great potential existing in export activities that can lead to satisfying economic performance, increased market share, external turnover, and a brand for domestic agri-food products abroad. Thus, they should not be afraid to investigate and development regular export activities into foreign markets. However, as noted in previous literature (Gellynck et al. 2012; Banterle et al. 2011), good market orientation and marketing capabilities are necessary to fully understand the needs of destination countries and foreign consumers. Investments made in marketing and communication activities (market research, consumer surveys, trade fairs, etc.) help reduce the risk of failure and develop essential skills needed to succeed in exporting. Continuous innovation is essential to keeping agri-food firms competitive in domestic and international markets. The agri-food sector has traditionally made low investments in R&D. Greater investment can lead to a higher competitive performance, innovative product lines which differ from the competitors and meet consumer needs. Thus, national or internationally funded research projects can provide one source to finance for start-up projects or through collaboration with universities or research centers. Governments and policy-makers also play a pivotal role in supporting agri-food firms in export activities. They should develop national export policies as well as promote export activity by local producers. For example, building local networks of traditional agri-food producers can be a successful way to export a bundle of products under a common “umbrella label”, that is easily identifiable to foreign consumers and also promotes not only a single product from a single company, but the country as a whole. Concerning the Italian case, firm internationalization should be supported and facilitated through several policy interventions that can help particularly SMEs. For example, tax reduction for foreign direct investments and market research, better knowledge of export managers about Italian foods’ quality attributes, better promotion of Italian food culture through appropriated campaigns, and building firm networks focused on exports could be successful tools to enhance the presence of Italian food firms in international markets (De Castro 2013). Acknowledgments The paper was carried out within the research project “Improving the enabling environment and public awareness for innovation in the South-East-European food sector through transnational collaboration” (CAPINFOOD), which is a project financed by ERDF in the frame of the South East Europe Programme. Application ID: SEE/B/0027/1.3/X. The information in this document reflects only the authors’ views, and the Community is not liable for any use that may be made of the information contained therein. Preliminary results of the paper were presented at the 7th International European Forum on System Dynamics and Innovation in Food Networks, Igls-Innsbruck, Austria, 18-22 February, 2013. The authors thank the anonymous referees for their useful comments.
4 Eurostat database, http://epp.eurostat.ec.europa.eu/portal/page/portal/statistics/search_database
2015 International Food and Agribusiness Management Association (IFAMA). All rights reserved
57
Carraresi and Banterle Volume 18 Issue 2, 2015
References Adams, F.G., B. Gangnes, and Y. Shachmurove 2006. Why is China so competitive? Measuring
and explaining China’s competitiveness. The World Economy 29(2): 95-122. Albulescu C. 2011. Economic and financial integration of CEECs: the impact of financial
instability. AUCO Czech Economic Review 5: 27-45. Antimiani, A., A. Carbone, V. Costantini, and R. Henke 2012. Agri-food exports in the enlarged
European Union. Agricultural Economics – Czech 58(8): 354-366. Balassa, B. 1965. Trade Liberalization and ‘Revealed’ Comparative Advantage. Manchester
School of Economic and Social Studies 33: 99-124. Ball, E., J.P. Butault, C. San Juan and R. Mora 2010. Productivity and international
competitiveness of agriculture in the European Union and the United States. Agricultural Economics 41: 611-627.
Banse, M., M. Gorton, J. Hartel, G. Hughes, J. Köckler, T. Möllman and W. Münch 1999. The
evolution of competitiveness in Hungarian agriculture: From transition to accession. MOCT-MOST 9: 307-318.
Banterle, A. and L. Carraresi 2007. Competitive performance analysis and European Union
trade: The case of the prepared swine meat sector. Food Economics 4(3): 159-172. Banterle, A., A. Cavaliere, L. Carraresi and S. Stranieri 2011. Innovativeness in food small
business: What is its relationship with marketing? Agricultural Economics – AGRICECON 57(10): 474–483.
Baudchon, H. 2013. France: in search of lost competitiveness. Conjoncture February 2013: 9-19. Bavorova, M. 2003. Influence of policy measures on the competitiveness of the sugar industry in
the Czech Republic. Agricultural Economics – Czech 49(6): 266-274. Boehlje, M., M. Roucan-Kane, and S. Bröring 2011. Future agribusiness challenges: Strategic
uncertainty, innovation and structural change. International Food and Agribusiness Management Review 14(5): 53-82.
Bojnec, S. and I. Fertő 2009. Agro-food trade competitiveness of Central European and Balkan
countries. Food Policy 34: 417-425. Bojnec, S. and I. Fertő 2012. Complementarities of trade advantage and trade competitiveness
measures. Applied Economics 44: 399-408.
2015 International Food and Agribusiness Management Association (IFAMA). All rights reserved
58
Carraresi and Banterle Volume 18 Issue 2, 2015
Bojnec, S. and I. Fertő 2014. Agri-Food Export Competitiveness in European Union Countries. Journal of Common Market Studies. Forthcoming. Early view at: http://onlinelibrary.wiley.com/doi/10.1111/jcms.12215/abstract;jsessionid=50AFCA2177339A4AD8469037187548F9.f02t03?deniedAccessCustomisedMessage=&userIsAuthenticated=false.
Brümmer, B, T. Glauben and G. Thijssen 2002. Decomposition of productivity growth using
distance functions: The case of dairy farms in three European countries. American Journal of Agricultural Economics 84(3): 628-644.
Butault, J. and V. Réquillart 2012. French agriculture and the food industry: in search of lost
competitiveness. INRA Sciences Sociales - Research in Economics and Rural Sociology (4-5). INRA, France.
Caetano, J., A. Galego, C. Vieira and I. Vieira 2004. The Eastward Enlargement Effects on
Trade and FDI. In Eurozone Enlargement – Exploring Uncharted Waters, edited by M. Bolle, 47-66. Berliner Wissenschafts-Verlag, Berlin, June.
Davidova, S., M. Gorton, B. Iraizoz and T. Ratinger 2003. Variations in farm performance in
transitional economies: Evidence from the Czech Republic. Journal of Agricultural Economics 54(2): 227-24.
De Castro, P. 2013. Le politiche che favoriscono la crescita internazionale dei prodotti italiani.
Presentation at Cibus Global Forum 2013 ‘World food trends, the Italian way’, Parma (Italy), 16-17 May 2013. http://www.cibusglobalforum.com/lang/it/programma-e-relatori/
Dietrich, D., T. Knedlik and A. Lindner 2011. Central and Eastern European countries in the
global financial crisis: a typical twin crisis? Post-Communist Economies 23(4): 415-432. Drescher, K. and O. Maurer 1999. Competitiveness of the European dairy industries.
Agribusiness 15(2): 163-177. European Commission. 2013. European Research Area Progress Report 2013. Online:
http://ec.europa.eu/research/era/era-progress-2013.htm European Commission 2009. Report on the Competitiveness of the European Agro-Food
Industry. Enterprise and Industry Directorate General, Food Industry Unit. On line: http://ec.europa.eu/enterprise/sectors/food/files/high_level_group_2008/documents_hlg/final_report_hlg_17_03_09_en.pdf
Fischer, C. and S. Schornberg 2007. Assessing the competitiveness situation of EU food and
drink manufacturing industries: An index-based approach. Agribusiness 23(4): 473-495. Fogarasi, J. and L. Latruffe 2009. Farm Performance and Support in Central and Western
Europe: A Comparison of Hungary and France. Working Paper SMART-LERECO No. 09-07, Rennes, France.
2015 International Food and Agribusiness Management Association (IFAMA). All rights reserved
59
Carraresi and Banterle Volume 18 Issue 2, 2015
Food Drink Europe 2014. Data & Trends of the European Food and Drink Industry 2013-2014. On line at http://www.fooddrinkeurope.eu/S=0/publication/data-trends-of-the-european-food-and-drink-industry-2013-2014/
Furtan, W. and J. Sauer 2008. Determinants of food industry performance: Survey data and
regressions for Denmark. Journal of Agricultural Economics 59(3): 555-573. Gallagher, P., G. Schamel, H. Shapouri and H. Brubaker 2006. The international competitiveness
of the U.S. corn-ethanol industry: A comparison with sugar-ethanol processing in Brazil. Agribusiness 22(1): 109-134.
Gellynck, X., A. Banterle, B. Kühne, L. Carraresi and S. Stranieri 2012. Market orientation and
marketing management of traditional food producers in the EU. British Food Journal 114(4): 481–499
Gorton, M. and S. Davidova 2001. The international competitiveness of CEEC agriculture.
World Economy 24(2): 185-200. Gorton, M., S. Davidova, T. Ratinger 2000. The competitiveness of agriculture in Bulgaria and
the Czech Republic vis-à-vis the European Union. Comparative Economic Studies 42(1): 59-86.
Harling, K. 2008. Competing in a Mature Market: The case of Super AM Food Markets.
International Food and Agribusiness Management Review 11(4): 105-126. Havrila, I. and P. Gunawardana 2003. Analysing comparative advantage and competitiveness: an
application to Australia’s textile and clothing industries. Australian Economic Paper 42(1):103-117.
Hermans, C.M.L., I.R. Geijzendorffer, F. Ewert, M.J. Metzger, P.H. Vereijken, G.B. Woltjer,
and A. Verhagen 2010. Exploring the future of European crop production in a liberalised market, with specific consideration of climate change and the regional competitiveness. Ecological Modelling 221: 2177-2187.
INEA 2013. Il commercio con l’estero dei prodotti agroalimentari 2012. INEA, Roma, Italy. Juhász, A. and H. Wagner 2013. An analysis of Hungarian agri-food export competitiveness.
Studies in Agricultural Economics, 11x: 150-156. Lall, S. 2001. Competitiveness Indices and Developing Countries: An Economic Evaluation of
the Global Competitiveness Report. World Development 29(9): 1501-1525. Latruffe, L. 2010. Competitiveness, Productivity and Efficiency in the Agricultural and Agri-
Food Sectors. OECD Food, Agriculture and Fisheries Papers (30). OECD Publishing.
2015 International Food and Agribusiness Management Association (IFAMA). All rights reserved
60
Carraresi and Banterle Volume 18 Issue 2, 2015
Liefert, W. 2002. Comparative (dis?) advantage in Russian agriculture. American Journal of Agricultural Economics 84(3): 762-767.
Mayer, M. J. and G. I. P. Ottaviano 2008. Market size, trade, and productivity. Review of
Economic Studies 75: 295-316. Mroczek R. and I. Szczepaniak 2012. Development trends and competitiveness of Polish food
industry. In Institute of Agricultural and Food Economics, Competitiveness of Food Economy in the Conditions of Globalization and European Integration (2012). Multiannual Program Reports 2011-2014. Available at SSRN: http://ssrn.com/abstract= 2471504.
Mulder, N., A. Vialou, B. David, M. Rodriguez and M. Castilho 2004. La Compétitivité de
l’Agriculture et des Industries Agroalimentaires dans le Mercosur et l’Union Européenne dans une Perspective de Libéralisation Commerciale. Working Paper n. 2004/19, Centre d’Etudes Prospectives et d’Informations Internationales (CEPII), Paris, France.
Niemi, J. and E. Huan-Niemi 2007. EU-China Agricultural Trade in Relation to China’s WTO
Membership. International Food and Agribusiness Management Review 10(3): 41-62. Piazolo, D. 1996. Trade integration between eastern and Western Europe: Politics follows the
market. Kiel Working Paper, No. 745. Porter, M. 1990. The Competitive Advantage of Nations. MacMillan, London, UK. Qineti, A., M. Rajcaniova and E. Matejkova 2009. The competitiveness and comparative
advantage of the Slovak and the EU agri-food trade with Russia and Ukraine. Agricultural Economics – Czech 55(8): 375-383.
Rademakers, M.F.L. 2012. VION Food Group: New Challenges. International Food and
Agribusiness Management Review 15(2): 153-170. Rojec, M. and M. Ferjančič 2006. Overview of export performance of ‘New Europe’:
Theoretical underpinnings and empirical evidence. Proceedings of The Second Lancut Economic Forum on ‘New Europe’ “Competitiveness of New Europe: Trade Performance and Its Underpinnings.” April 2006.
Sarker R. and S. Ratnasena 2014. Revealed Comparative Advantage and Half-a-Century
Competitiveness of Canadian Agriculture: A Case Study of Wheat, Beef, and Pork Sectors. Canadian Journal of Agricultural Economics 62(4): 519–544.
Siggel, E. 2006. International Competitiveness and Comparative Advantage: A Survey and a
Proposal for Measurement. Journal of Industry, Competition and Trade 6: 137-159. Török, Á. and A. Jámbor 2013. Agri-food trade of the New Member States since the EU
accession. Agricultural Economics – Czech 3: 101-112.
2015 International Food and Agribusiness Management Association (IFAMA). All rights reserved
61
Carraresi and Banterle Volume 18 Issue 2, 2015
Traill, B. 1998. Structural changes in the European food industry: consequences for competitiveness. In Competitiveness in the food industry, edited by B. Traill and E. Pitts, 35-57. Blackie Academic & Professional, London, UK.
Van Rooyen J., D. Esterhuizen, and L. Stroebel 2011. Analyzing the competitive performance of
the South African wine industry. International Food and Agribusiness Management Review 14(4): 179-200.
Wijnands J.H.M., H.J. Bremmers, B.M.J. Van der Meulen, and K.J. Poppe 2008. An economic
and legal assessment of the EU food industry’s competitiveness. Agribusiness 24(4): 417- 439.
Wubben E.F.M. and G.N. Isakhanyan 2013. The Wicked Problem of Promoting Sustainability by
Means of Enhanced Biomass Utilization. International Food and Agribusiness Management Review 16 (Special Issue A): 45-50.
Yom Din G. 2013. Performance and profit sensitivity to risk: a practical evaluation of the agro-
industrial projects developed by Israeli companies for the CIS and Eastern European countries. Agricultural and Food Economics 1(3): 1-23.
Zaghini A. 2005. Evolution of trade patterns in the new EU member states. Economic of
Transition 13(4): 629-658.
2015 International Food and Agribusiness Management Association (IFAMA). All rights reserved
62
International Food and Agribusiness Management Review Volume 18 Issue 2, 2015
Uncovering Success Attributes for Direct Farmers’ Markets and
Agri-Tourism in the Mid-Atlantic Region of the United States
Benjamin Onyangoa, Ramu Govindasamyb, and Clydette Michelle Alsup-Egbersc
a Associate Professor, W. H. Darr School of Agriculture, Missouri State University, 901 South National Avenue, Springfield, Missouri, 65897,USA
b Professor, Department of Agricultural, Food and Resource Economics, Cook Office Bldg., Rm. 115, Rutgers,
The State University of New Jersey,55 Dudley Rd., New Brunswick, New Jersey, 08901-8520, USA
c Associate Professor, W. H. Darr School of Agriculture, Missouri State University, 901 South National Avenue, Springfield, Missouri, 65897, USA
Abstract Farmers’ markets and agri-tourism operations play significant roles in many rural economies; however, they tend to be underused which threatens their viability. Results from factor, cluster and regression analyses show that bundling of farmers’ markets activities will spur diverse and steady patronage beyond what the growers earn from their traditional fresh produce and value added products. Additionally, farmers’ markets and agri-tourism operators can use customer profiling to improve their marketing efforts in a competitive environment. The regression results show that a number of socio-economic variables are associated with the patronage experience. Keywords: farmers’ markets, agri-tourism, factor analysis, product bundling, consumer profiling, market segmentation
Corresponding author: Tel: + 1. 417.836.4262
Email: B. Onyango: [email protected] R. Govindasamy: [email protected] C.M. Alsup-Egbers:[email protected]
2015 International Food and Agribusiness Management Association (IFAMA). All rights reserved
63
Onyango, Govindasamy and Alsup-Egbers Volume 18 Issue 2, 2015
Introduction As federal farm support programs become increasingly untenable, farmers are being encouraged to innovatively address farming risks and rely less on government support. Direct farmer to consumer markets are among alternatives used in many farming communities. Farmers’ markets, defined by the USDA as a multi-stall market at which farmer-producers sell agricultural products directly to the general public at a central or fixed location, particularly fresh fruit and vegetables but also meat products, dairy products, and/or grains (USDA Food and Nutrition Service), are fast growing in popularity because they can be profitable for producers while offering consumers a wide array of farm products at affordable prices. The number of farmers’ markets rose to 8,144 in 2014, up from 3,706 in 2004 and 1,755 in 1994 (USDA’s Agricultural Marketing Service). Also included in such markets are pick-your-own (PYO), on-farm markets, roadside stands and community supported agriculture (CSA). Advantages of these markets include buffering farm incomes, providing marketing avenues and addressing price volatilities beyond what futures markets or any government support programs can do. Major challenges confronting many of farmer-to-consumer market operations are capacity underutilization and a narrow consumer base. Farmer-to-consumer market operators may need additional activities to attract a more diverse customer base beyond fresh produce buyers. For example, Martinez et al. (2010) identifies capacity constraints among issues affecting performance of local food systems including farmers’ markets. This may be more of an issue for seasonal markets than year -round operations. A study by Ragland and Tropp (2009) found that about 88% of the farmers’ markets operate seasonally. Seasonal operations tend to have fewer vendors which results in less revenue for those markets. Ragland and Tropp’s findings also show that year-round markets had more than three times the sales of markets operating for six months or less per year. To increase viability, Martinez et al. (2010) suggests that facilities explore bundling of farm entrepreneurial activities with direct farm sales strategies. While these market alternatives provide opportunities to sell locally grown produce directly to consumers, some researchers view them as a practical rural development strategy. Various farmers’ market economic impact studies demonstrate that the markets are good for local economies, farmers and consumers (Conner et al. 2010; Che, Veeck and Veeck 2005; Das and Rainey 2010). The markets provide growers with extra income, since many farmers must work full-time either off the farm or outside the local area to support their families. Farmers’ markets, by selling directly to consumers, also provide more profit for growers by displacing brokers or other middlemen. The benefits extend to consumers as well, by providing a broader choice of fresh produce and value added products (Keeling-Bond, Thilmany, and Bond 2009). Communities in which these businesses operate gain from more money spent in the local economy, creating spending, re-spending, and higher multiplier effects (Darnton 2012). Retail spending by consumers promotes local business development and expansion. Additionally, the USDA and other government agencies are recognizing farmers-to-consumer markets are a better vehicle to promote affordable and healthier living by increasing consumption of fruits and vegetables. While many benefits are associated with farmers’ markets and agri-tourism activities, operators need to devise ways to attract a diverse and steady customer base to overcome the issues of
2015 International Food and Agribusiness Management Association (IFAMA). All rights reserved
64
Onyango, Govindasamy and Alsup-Egbers Volume 18 Issue 2, 2015
capacity underutilization. The main objective of this study is to uncover some of the success strategies farmers’ markets/agri-tourism operators could initiate to sustain and expand capacity utilization. Specifically, (i) identify and estimate the relative importance of the factors underlying success of a farmers market/agri-tourism site; (ii) identify distinct consumer segments based on important drivers/forces for visiting direct market/agri-tourism sites; (iii) develop a profile of these distinct consumer groups; and (iv) explore the relationship between consumers’ socio-economic characteristics and patronage of farmers markets/agri-tourism sites. The information generated by this study is useful not only to farmers but also to policy makers to improve effectiveness of farmer-to-consumer market channels. It may also contribute toward developing efficient and effective business strategies. A unique contribution of this study is a better understanding of what contributes successful operation practices of farmers’ market/agri-tourism sites. Literature Small to medium-scale farmers often find farmers’ markets a predictable and cost-efficient outlet to sell a large proportion of their production. This market segment has been growing steadily over time. Findings from Hand et al. (2010) demonstrate that direct market sales account for a higher percentage of small farms’ sales than for larger farms. According to USDA’s Agricultural Marketing Service, the number of farmers’ markets rose from 1,755 in 1994 to 8,144 in 2014— more than quadruple growth. Direct farmer-to-consumer marketing amounted to $1.2 billion in current dollar sales in 2007, compared with $551 million in 1997, according to the 2007 Census of Agriculture. Farmers’ markets have been hailed as a development strategy. Hughes et al. (2008) view farmers’ markets as a means to enhance retention of local dollars. Along similar lines, Brown (2003) puts a psychological spin to the functionality of these markets, pointing out that consumers feel good by supporting small scale local agriculture, thereby helping to retain dollars in the local economy. Other studies have focused on the untapped potential of farmers’ markets and agri-tourism (Jensen et al. 2006; Jolly and Reynolds 2005), because customers are willing to pay more for products purchased from farmers’ markets and because it is an industry that can operate year-round. In Tennessee, visitors to farmers’ market or agri-tourism sites spend an average of $15, while in California about 67% of the those who purchased products from farm-related tourism sites were willing to pay a price equal to or greater than what they would pay for the same or similar products in conventional outlets (Jolly and Reynolds 2005). Direct marketing and agri-tourism ventures are not only economically advantageous, but also provide social benefits to business owners and consumers (Tracy et al. 1982). A study by Das and Rainey (2010) strongly agrees that farmers’ markets and agri-tourism ventures can be complimentary in opening up new, profitable markets for farm products and services, as well as in providing travel experiences for the public. Furthermore, Che, Veeck and Veeck (2005) find that agri-tourism gives people an opportunity to better understand the hard work and skill that go into producing the food and fiber that they need.
2015 International Food and Agribusiness Management Association (IFAMA). All rights reserved
65
Onyango, Govindasamy and Alsup-Egbers Volume 18 Issue 2, 2015
While profitability and market access are significant functions of farmers’ markets and agri-tourism businesses, they need to develop strategies to attract a continuous flow of customers if their ventures are to be successful. Tracy et al. (1982) found that patronizing farmers’ markets and agri-tourism sites is driven by attributes such as superior quality and freshness of produce coming directly from farms compared to produce offered by wholesale and retail markets. Other studies overwhelmingly see farmers’ markets as a better mechanism for rural revitalization and development (Henderson and Linstrom 1982; Linstrom 1978; Govindasamy and Nayga 1996). The studies point out that direct interaction with consumers leads to relationships and community building, and the relationships are seen as a critical success factor in a business where customer satisfaction is highly valued. The interaction enhances overall quality of life, especially for urban consumers, by simultaneously offering recreational outlets, generating income and employment in the area, preserving agricultural lands and open spaces, and contributing to community development. Additionally, such interaction allows consumers to question farmers freely about pesticide use and production methods to ensure that the product is “chemical-free” (Gale 1997). Some studies isolate success factors specific to agri-tourism. Brown and Reeder (2007) and Ryan, DeBord and McClellan (2006) have shown that agri-tourism is partly driven by such factors as location (region), flow of visitors, and proximity to urban areas (shorter travel distances). The businesses should target households with higher education, higher family income, relatively younger members, and more family members (Carpio, Wohlgenant and Boonsaeng, 2008). A Colorado study on agri-tourism finds that income level, urban influence, and promotions via tourism offices and magazines positively influenced travel and related expenditures (Gascoigne, Sullins and McFadden, 2008). Their study further finds that travelers from higher income and Caucasian households were more likely to visit agri-tourism sites than people with lower income and non-white households. Agri-tourism operators should understand that the socioeconomic factors are constantly evolving as the U.S. population ages and becomes more affluent and diverse, but this should provide opportunities for entrepreneurial farmers to respond to consumers’ changing food preferences and eating patterns (Ballenger and Blaylock 2013). In addressing capacity underuse, Brown and Reeder (2007) suggest joint ventures of farmers’ markets and agri-tourism, since the recreational nature of agri-tourism, including corn mazes, hay rides and food festivals, can make up for the lack of business at farmers’ markets during the off-season. Data and Methods An internet survey of consumers residing in Delaware, New Jersey and Pennsylvania was conducted from June 21-29, 2010 to capture consumer purchasing behavior and other characteristics related to visiting agri-tourism operations and shopping at direct (farmer-to-consumer) market outlets in the Northeast. The survey instrument was developed using SurveyMonkey.com (Palo Alto, CA), a survey tool that allows researchers to design and implement an online survey. The survey was pre-tested on a subset of the target consumer population (n=93) to refine and clarify misleading or misunderstood questions prior to full deployment of the survey. Survey participants were randomly drawn from a panel of participants managed by Survey Sampling International, LLC (Shelton, CT), a provider of sampling solutions
2015 International Food and Agribusiness Management Association (IFAMA). All rights reserved
66
Onyango, Govindasamy and Alsup-Egbers Volume 18 Issue 2, 2015
for survey research. The selected panelists received a consent statement along with a link to the survey developed by researchers from Rutgers University and Pennsylvania State University. All potential participants were screened and invited to participate if they were: 1) age 18 and older, to ensure that only adults participated; 2) the primary food shopper for the household; and 3) had attended agri-tourism and direct marketing events or activities in the past. Panelists were also informed in a consent statement of their compensation, an entry into Survey Sampling International’s quarterly $25,000 sweepstakes and an instant win game play, which is standard compensation for the panelists. To begin the survey, panelists clicked on a hyperlink at the bottom of the consent statement, which then directed them to the survey welcome screen. Of the 2,594 members who registered with the panel and accessed the survey (309 from DE, 952 from NJ and 1384 from PA), 1,134 met the criteria and began the questionnaire. Of those, (133 from DE, 424 from NJ and 577 from PA), 993 completed the 15-minute survey (122 from DE, 364 from NJ and 507 from PA). Panelists were asked to quantify the amount of produce they purchased at direct marketing outlets, what type of produce they bought, the number of visits per month, and the amount of dollars spent during visits to each of the targeted farmer-to-consumer direct market outlets and agri-tourism operations. In addition, panelists responded to demographic questions (age, gender, 2009 annual gross household income and household size). When the surveys were completed, participants were directed to a thank you page. The study analysis is based on responses to 17 questions relating to factors, motivations, and reasons for visiting an agri-tourism site or farmers’ market. Respondents were asked to rate on a scale of 1 through 7 the factors/motivations/reasons for their visit, with a rating of 1 indicating that the factor was not at all important, a rating of 7 indicating that the factor was extremely important, and with an average score of 3.5 denoting an indifferent or neutral response. Two sets of questions using the same Likert scale focused on site attributes and motivating factors for visiting a farmers’ market or agri-tourism site. Respondents were asked, “How important are the following factors/attributes/reasons in your decision to visit an agri-tourism site for an activity or event/factors/attributes including hay rides, wine tasting, agricultural festival/fairs, produce purchases, availability of picnic tables, and other related farmers’ markets and agri-tourism activities?” Principal components factor analysis (PCA) was used to reduce the 17 questions exploring consumer motivations for visiting a farmers’ market or an agri-tourism site to a smaller set of factors. A standard latent root equal to one and a Scree test were used to establish how many factors to retain, followed by a confirmatory analysis to ensure internal reliability of the factors. Next, a two-stage cluster analysis was employed to identify clusters of respondents with similar motivations for visiting a direct market/agri-tourism site. ANOVA tests were applied to examine inter-cluster heterogeneity. Finally, a regression analysis was applied on the standardized factor scores obtained from the principal component analysis to explore the relationship between the identified dimensions and the socioeconomic attributes of the consumers. The selection of the analytical methods used is based on the variable measures; in this study all were ordinal. However, in the presence of continuous and ordinal variables, alternative methods are used. All 17 variables used in the analysis were ordinal making factor analysis the logical analytical method to identify factors explaining the pattern of correlations within a set of observed variables. Additionally, the factor analysis reduces constructs represented by broad variables to a manageable number of interpretable dimensions. This step was followed by clustering; a
2015 International Food and Agribusiness Management Association (IFAMA). All rights reserved
67
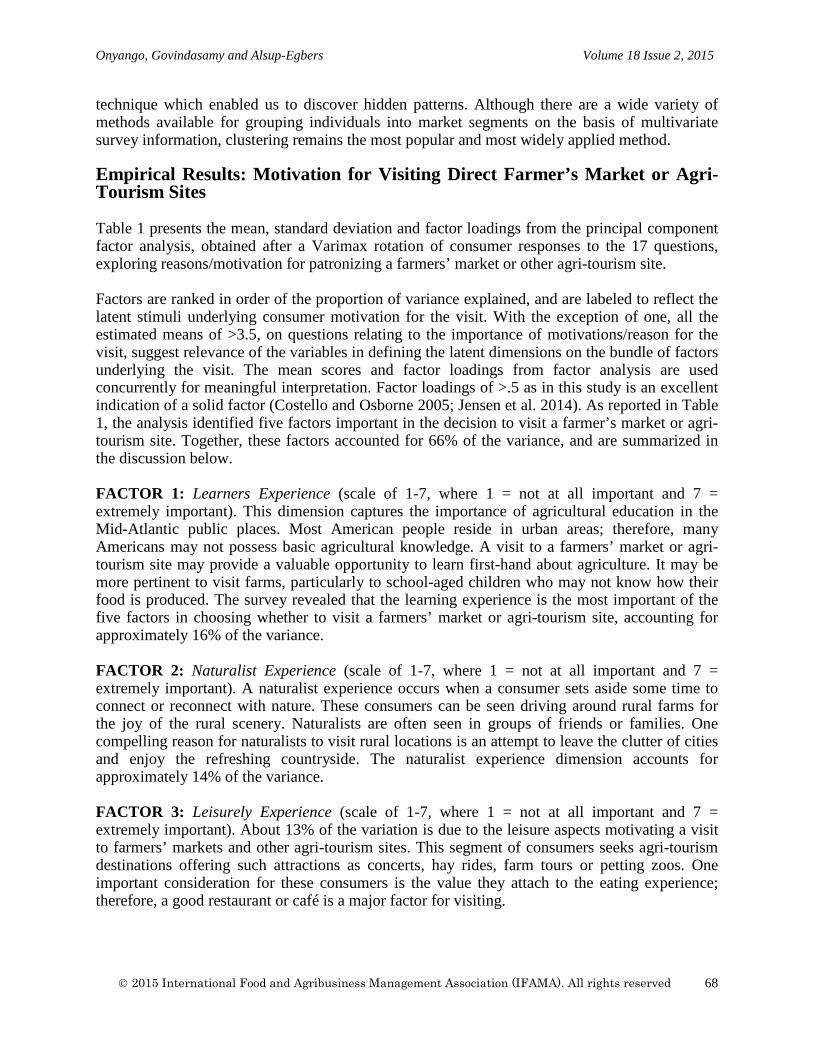
Onyango, Govindasamy and Alsup-Egbers Volume 18 Issue 2, 2015
technique which enabled us to discover hidden patterns. Although there are a wide variety of methods available for grouping individuals into market segments on the basis of multivariate survey information, clustering remains the most popular and most widely applied method. Empirical Results: Motivation for Visiting Direct Farmer’s Market or Agri-Tourism Sites Table 1 presents the mean, standard deviation and factor loadings from the principal component factor analysis, obtained after a Varimax rotation of consumer responses to the 17 questions, exploring reasons/motivation for patronizing a farmers’ market or other agri-tourism site. Factors are ranked in order of the proportion of variance explained, and are labeled to reflect the latent stimuli underlying consumer motivation for the visit. With the exception of one, all the estimated means of >3.5, on questions relating to the importance of motivations/reason for the visit, suggest relevance of the variables in defining the latent dimensions on the bundle of factors underlying the visit. The mean scores and factor loadings from factor analysis are used concurrently for meaningful interpretation. Factor loadings of >.5 as in this study is an excellent indication of a solid factor (Costello and Osborne 2005; Jensen et al. 2014). As reported in Table 1, the analysis identified five factors important in the decision to visit a farmer’s market or agri-tourism site. Together, these factors accounted for 66% of the variance, and are summarized in the discussion below. FACTOR 1: Learners Experience (scale of 1-7, where 1 = not at all important and 7 = extremely important). This dimension captures the importance of agricultural education in the Mid-Atlantic public places. Most American people reside in urban areas; therefore, many Americans may not possess basic agricultural knowledge. A visit to a farmers’ market or agri-tourism site may provide a valuable opportunity to learn first-hand about agriculture. It may be more pertinent to visit farms, particularly to school-aged children who may not know how their food is produced. The survey revealed that the learning experience is the most important of the five factors in choosing whether to visit a farmers’ market or agri-tourism site, accounting for approximately 16% of the variance. FACTOR 2: Naturalist Experience (scale of 1-7, where 1 = not at all important and 7 = extremely important). A naturalist experience occurs when a consumer sets aside some time to connect or reconnect with nature. These consumers can be seen driving around rural farms for the joy of the rural scenery. Naturalists are often seen in groups of friends or families. One compelling reason for naturalists to visit rural locations is an attempt to leave the clutter of cities and enjoy the refreshing countryside. The naturalist experience dimension accounts for approximately 14% of the variance. FACTOR 3: Leisurely Experience (scale of 1-7, where 1 = not at all important and 7 = extremely important). About 13% of the variation is due to the leisure aspects motivating a visit to farmers’ markets and other agri-tourism sites. This segment of consumers seeks agri-tourism destinations offering such attractions as concerts, hay rides, farm tours or petting zoos. One important consideration for these consumers is the value they attach to the eating experience; therefore, a good restaurant or café is a major factor for visiting.
2015 International Food and Agribusiness Management Association (IFAMA). All rights reserved
68
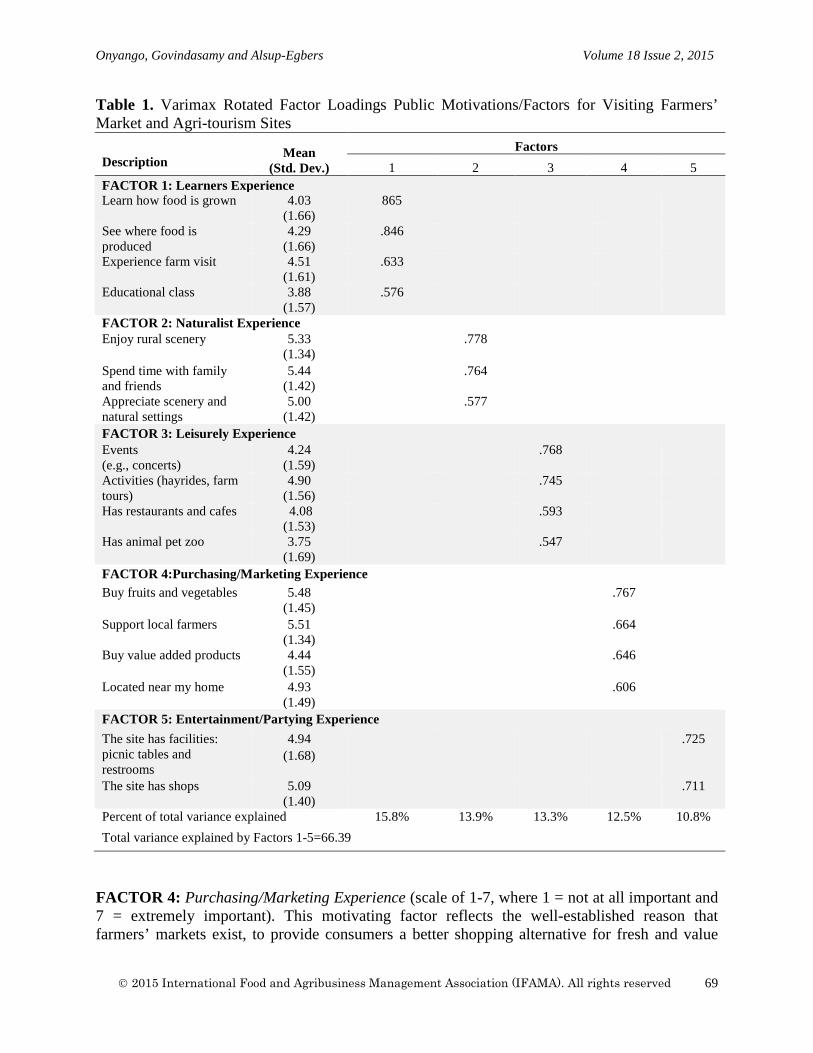
Onyango, Govindasamy and Alsup-Egbers Volume 18 Issue 2, 2015
Table 1. Varimax Rotated Factor Loadings Public Motivations/Factors for Visiting Farmers’ Market and Agri-tourism Sites Description
Mean (Std. Dev.)
Factors 1 2 3 4 5
FACTOR 1: Learners Experience Learn how food is grown 4.03
(1.66) 865
See where food is produced
4.29 (1.66)
.846
Experience farm visit 4.51 (1.61)
.633
Educational class 3.88 (1.57)
.576
FACTOR 2: Naturalist Experience Enjoy rural scenery 5.33
(1.34) .778
Spend time with family and friends
5.44 (1.42)
.764
Appreciate scenery and natural settings
5.00 (1.42)
.577
FACTOR 3: Leisurely Experience Events (e.g., concerts)
4.24 (1.59)
.768
Activities (hayrides, farm tours)
4.90 (1.56)
.745
Has restaurants and cafes 4.08 (1.53)
.593
Has animal pet zoo 3.75 (1.69)
.547
FACTOR 4:Purchasing/Marketing Experience Buy fruits and vegetables 5.48
(1.45) .767
Support local farmers 5.51 (1.34)
.664
Buy value added products 4.44 (1.55)
.646
Located near my home 4.93 (1.49)
.606
FACTOR 5: Entertainment/Partying Experience The site has facilities: picnic tables and restrooms
4.94 (1.68)
.725
The site has shops 5.09 (1.40)
.711
Percent of total variance explained 15.8% 13.9% 13.3% 12.5% 10.8% Total variance explained by Factors 1-5=66.39
FACTOR 4: Purchasing/Marketing Experience (scale of 1-7, where 1 = not at all important and 7 = extremely important). This motivating factor reflects the well-established reason that farmers’ markets exist, to provide consumers a better shopping alternative for fresh and value
2015 International Food and Agribusiness Management Association (IFAMA). All rights reserved
69
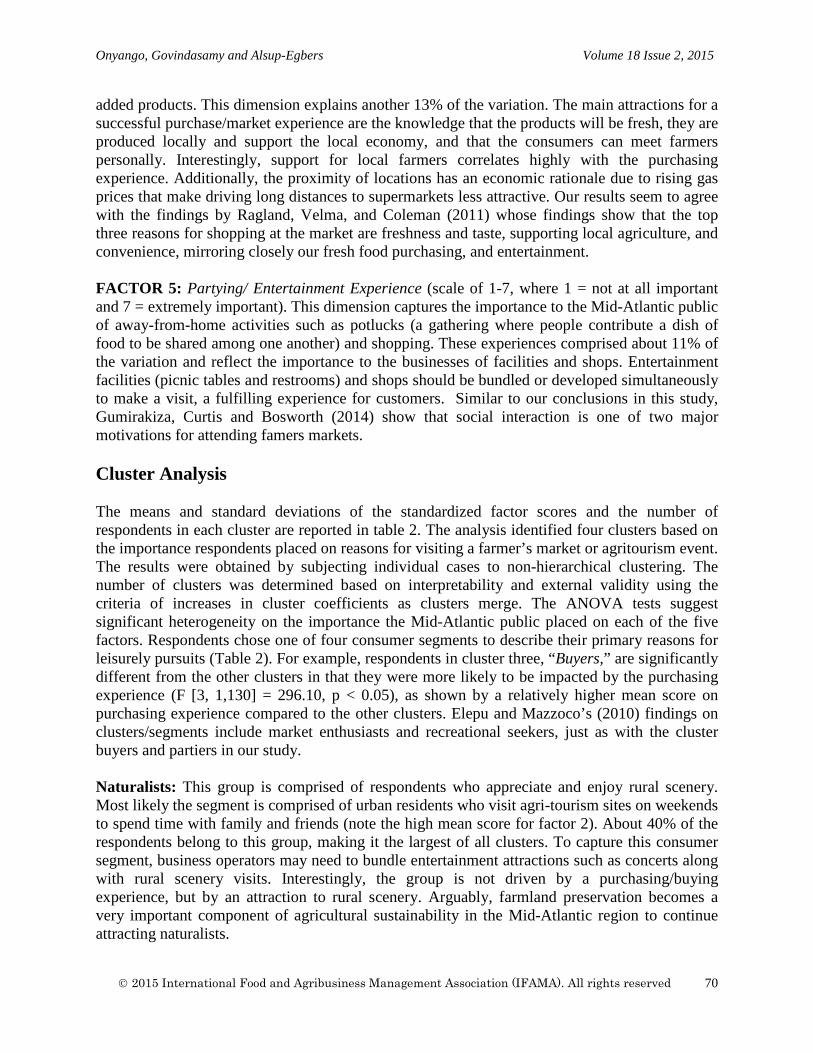
Onyango, Govindasamy and Alsup-Egbers Volume 18 Issue 2, 2015
added products. This dimension explains another 13% of the variation. The main attractions for a successful purchase/market experience are the knowledge that the products will be fresh, they are produced locally and support the local economy, and that the consumers can meet farmers personally. Interestingly, support for local farmers correlates highly with the purchasing experience. Additionally, the proximity of locations has an economic rationale due to rising gas prices that make driving long distances to supermarkets less attractive. Our results seem to agree with the findings by Ragland, Velma, and Coleman (2011) whose findings show that the top three reasons for shopping at the market are freshness and taste, supporting local agriculture, and convenience, mirroring closely our fresh food purchasing, and entertainment. FACTOR 5: Partying/ Entertainment Experience (scale of 1-7, where 1 = not at all important and 7 = extremely important). This dimension captures the importance to the Mid-Atlantic public of away-from-home activities such as potlucks (a gathering where people contribute a dish of food to be shared among one another) and shopping. These experiences comprised about 11% of the variation and reflect the importance to the businesses of facilities and shops. Entertainment facilities (picnic tables and restrooms) and shops should be bundled or developed simultaneously to make a visit, a fulfilling experience for customers. Similar to our conclusions in this study, Gumirakiza, Curtis and Bosworth (2014) show that social interaction is one of two major motivations for attending famers markets. Cluster Analysis The means and standard deviations of the standardized factor scores and the number of respondents in each cluster are reported in table 2. The analysis identified four clusters based on the importance respondents placed on reasons for visiting a farmer’s market or agritourism event. The results were obtained by subjecting individual cases to non-hierarchical clustering. The number of clusters was determined based on interpretability and external validity using the criteria of increases in cluster coefficients as clusters merge. The ANOVA tests suggest significant heterogeneity on the importance the Mid-Atlantic public placed on each of the five factors. Respondents chose one of four consumer segments to describe their primary reasons for leisurely pursuits (Table 2). For example, respondents in cluster three, “Buyers,” are significantly different from the other clusters in that they were more likely to be impacted by the purchasing experience (F [3, 1,130] = 296.10, p < 0.05), as shown by a relatively higher mean score on purchasing experience compared to the other clusters. Elepu and Mazzoco’s (2010) findings on clusters/segments include market enthusiasts and recreational seekers, just as with the cluster buyers and partiers in our study. Naturalists: This group is comprised of respondents who appreciate and enjoy rural scenery. Most likely the segment is comprised of urban residents who visit agri-tourism sites on weekends to spend time with family and friends (note the high mean score for factor 2). About 40% of the respondents belong to this group, making it the largest of all clusters. To capture this consumer segment, business operators may need to bundle entertainment attractions such as concerts along with rural scenery visits. Interestingly, the group is not driven by a purchasing/buying experience, but by an attraction to rural scenery. Arguably, farmland preservation becomes a very important component of agricultural sustainability in the Mid-Atlantic region to continue attracting naturalists.
2015 International Food and Agribusiness Management Association (IFAMA). All rights reserved
70
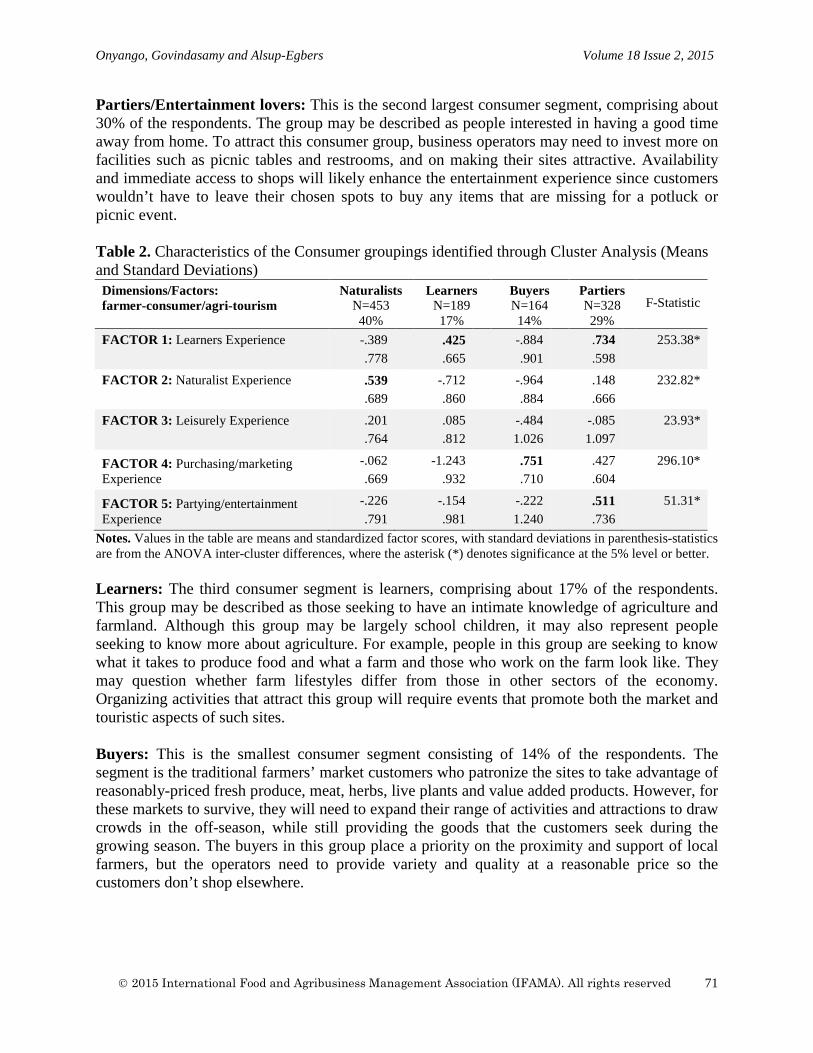
Onyango, Govindasamy and Alsup-Egbers Volume 18 Issue 2, 2015
Partiers/Entertainment lovers: This is the second largest consumer segment, comprising about 30% of the respondents. The group may be described as people interested in having a good time away from home. To attract this consumer group, business operators may need to invest more on facilities such as picnic tables and restrooms, and on making their sites attractive. Availability and immediate access to shops will likely enhance the entertainment experience since customers wouldn’t have to leave their chosen spots to buy any items that are missing for a potluck or picnic event. Table 2. Characteristics of the Consumer groupings identified through Cluster Analysis (Means and Standard Deviations) Dimensions/Factors: farmer-consumer/agri-tourism
Naturalists N=453 40%
Learners N=189 17%
Buyers N=164 14%
Partiers N=328 29%
F-Statistic
FACTOR 1: Learners Experience
-.389 .778
.425
.665 -.884 .901
.734
.598 253.38*
FACTOR 2: Naturalist Experience
.539
.689 -.712 .860
-.964 .884
.148
.666 232.82*
FACTOR 3: Leisurely Experience
.201
.764 .085 .812
-.484 1.026
-.085 1.097
23.93*
FACTOR 4: Purchasing/marketing Experience
-.062 .669
-1.243 .932
.751
.710 .427 .604
296.10*
FACTOR 5: Partying/entertainment Experience
-.226 .791
-.154 .981
-.222 1.240
.511
.736 51.31*
Notes. Values in the table are means and standardized factor scores, with standard deviations in parenthesis-statistics are from the ANOVA inter-cluster differences, where the asterisk (*) denotes significance at the 5% level or better. Learners: The third consumer segment is learners, comprising about 17% of the respondents. This group may be described as those seeking to have an intimate knowledge of agriculture and farmland. Although this group may be largely school children, it may also represent people seeking to know more about agriculture. For example, people in this group are seeking to know what it takes to produce food and what a farm and those who work on the farm look like. They may question whether farm lifestyles differ from those in other sectors of the economy. Organizing activities that attract this group will require events that promote both the market and touristic aspects of such sites. Buyers: This is the smallest consumer segment consisting of 14% of the respondents. The segment is the traditional farmers’ market customers who patronize the sites to take advantage of reasonably-priced fresh produce, meat, herbs, live plants and value added products. However, for these markets to survive, they will need to expand their range of activities and attractions to draw crowds in the off-season, while still providing the goods that the customers seek during the growing season. The buyers in this group place a priority on the proximity and support of local farmers, but the operators need to provide variety and quality at a reasonable price so the customers don’t shop elsewhere.
2015 International Food and Agribusiness Management Association (IFAMA). All rights reserved
71
Onyango, Govindasamy and Alsup-Egbers Volume 18 Issue 2, 2015
Explaining Factors Underlying Visits to Farmers’ Markets and Agri-Tourism Sites Multiple regressions were carried out on the five factors identified in the principal factor analysis. The regression analysis identified and estimated the relationships between socioeconomic variables and patronage of direct farmers’ markets and agri-tourism sites. The regression results provide operators of farmers’ markets and agri-tourism sites segmentation information to develop promotional strategies to sustain their businesses. Table 3 presents the socioeconomic variables used in the regression analysis and their relevant statistics. The dependent variables in the regression analysis are the standardized factor scores that were obtained from the principal component analysis. As observed from the regression results reported in Table 4, the adjusted R2 ranged between 0.011 and 0.050 and the F-statistic was significant across all the models, signifying better model performance. Results on significant factors impacting the five dimensions on visiting direct farmers’ markets and agri-tourism sites are summarized below. Learners Experience: General interest in agriculture and farming in particular was the most important motivation for the Mid-Atlantic population to visit farmers’ markets and agri-tourism sites. Variables that positively impacted the learning experience related to urban residences compared to rural, number of children 17 years of age and below in a family, and adult youths between the ages of 25 to 35 years compared to those who are 35 years and older. Ethnicity had a negative impact on the learning experience. The ethnicity finding may be explained by the predominance of Caucasians in agriculture in general. Naturalist Experience: The major attraction defining a naturalist experience was interest in rural scenery and farming. Variables on the number of children 17 years of age and below in a family and Caucasian compared to other races were positively related to the naturalist experience. On the other hand, youths 20 years and younger and males tended to perceive the naturalist experience negatively. Leisurely Experience: The public motivation for patronizing farmers’ markets and agri-tourism sites was the activities offered, including events such as concerts, hay rides and farm tours. As expected, variables that positively impacted the leisure experience related to the number of children 17 years of age and below in a family, the age of adult youths and being employed compared to retired. Purchasing/Marketing Experience: The purchasing experience may be affected by a consumer’s cost-to-benefit comparison on prices, and product attributes such as quality, freshness and variety offered by farmers’ markets compared to supermarkets and other retail outlets. As expected, students and males viewed the buying experience negatively. Females will be more likely to buy groceries at farmers’ markets. Just as in this study, Elepu and Mazzocco (2010) found that more females than men shop at farmers’ markets. Entertainment/Eat away from home/Partying/Experience: The major consideration to attract these customers is the presence of facilities to make entertainment, partying and eating out successful. People who were non-Caucasians, adult youths between the ages of 25 to 35 years and those who were employed perceived the partying experience negatively. Young adults may
2015 International Food and Agribusiness Management Association (IFAMA). All rights reserved
72
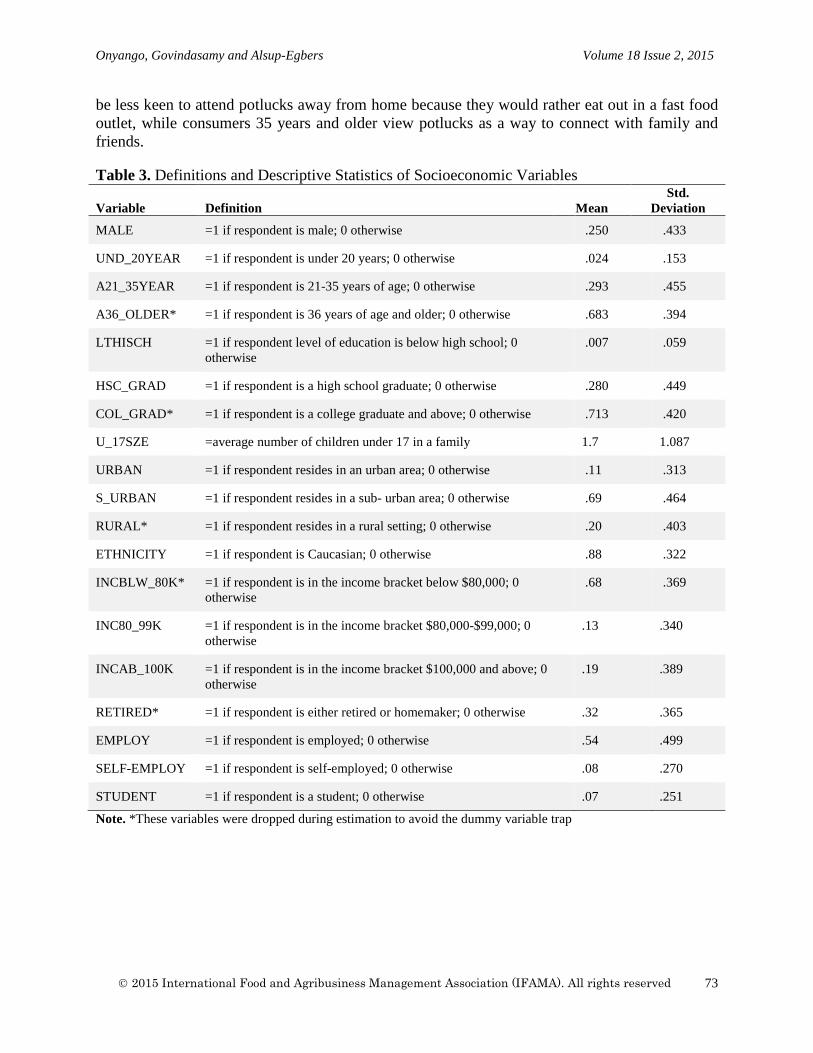
Onyango, Govindasamy and Alsup-Egbers Volume 18 Issue 2, 2015
be less keen to attend potlucks away from home because they would rather eat out in a fast food outlet, while consumers 35 years and older view potlucks as a way to connect with family and friends. Table 3. Definitions and Descriptive Statistics of Socioeconomic Variables Variable Definition Mean
Std. Deviation
MALE =1 if respondent is male; 0 otherwise .250 .433
UND_20YEAR =1 if respondent is under 20 years; 0 otherwise .024 .153
A21_35YEAR =1 if respondent is 21-35 years of age; 0 otherwise .293 .455
A36_OLDER* =1 if respondent is 36 years of age and older; 0 otherwise .683 .394
LTHISCH =1 if respondent level of education is below high school; 0 otherwise
.007 .059
HSC_GRAD =1 if respondent is a high school graduate; 0 otherwise .280 .449
COL_GRAD* =1 if respondent is a college graduate and above; 0 otherwise .713 .420
U_17SZE =average number of children under 17 in a family 1.7 1.087
URBAN =1 if respondent resides in an urban area; 0 otherwise .11 .313
S_URBAN =1 if respondent resides in a sub- urban area; 0 otherwise .69 .464
RURAL* =1 if respondent resides in a rural setting; 0 otherwise .20 .403
ETHNICITY =1 if respondent is Caucasian; 0 otherwise .88 .322
INCBLW_80K* =1 if respondent is in the income bracket below $80,000; 0 otherwise
.68 .369
INC80_99K =1 if respondent is in the income bracket $80,000-$99,000; 0 otherwise
.13 .340
INCAB_100K =1 if respondent is in the income bracket $100,000 and above; 0 otherwise
.19 .389
RETIRED* =1 if respondent is either retired or homemaker; 0 otherwise .32 .365
EMPLOY =1 if respondent is employed; 0 otherwise .54 .499
SELF-EMPLOY =1 if respondent is self-employed; 0 otherwise .08 .270
STUDENT =1 if respondent is a student; 0 otherwise .07 .251
Note. *These variables were dropped during estimation to avoid the dummy variable trap
2015 International Food and Agribusiness Management Association (IFAMA). All rights reserved
73
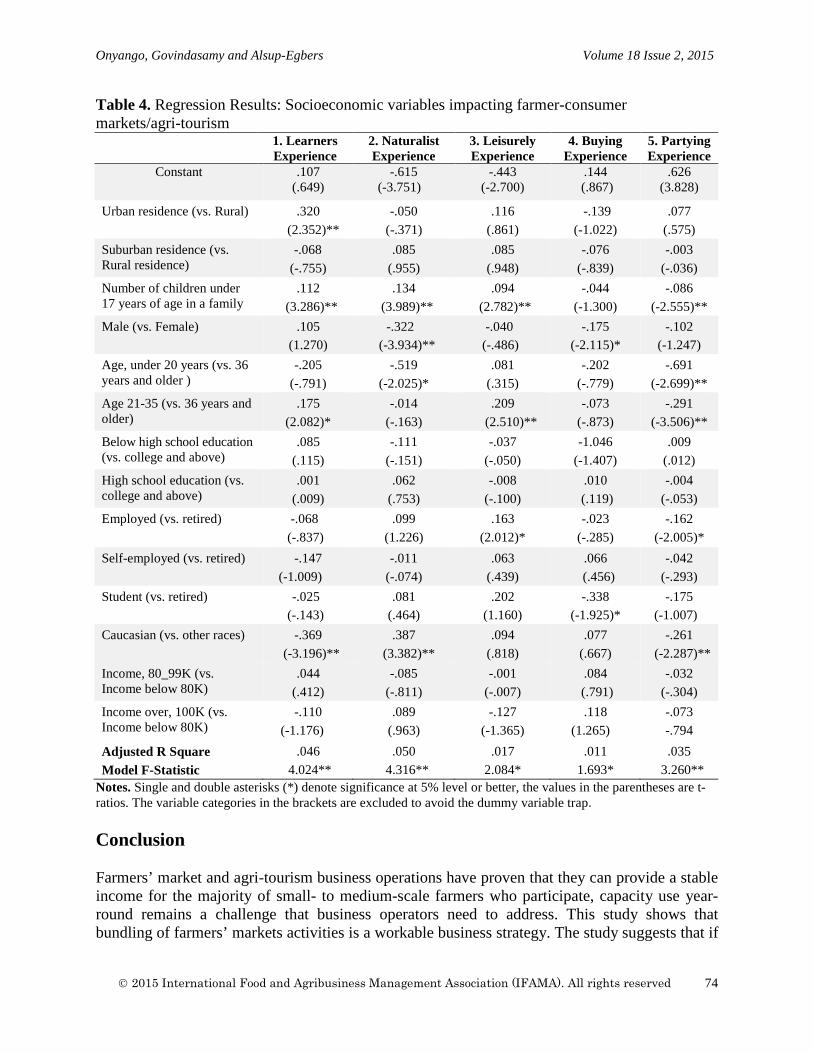
Onyango, Govindasamy and Alsup-Egbers Volume 18 Issue 2, 2015
Table 4. Regression Results: Socioeconomic variables impacting farmer-consumer markets/agri-tourism
1. Learners Experience
2. Naturalist Experience
3. Leisurely Experience
4. Buying Experience
5. Partying Experience
Constant .107 (.649)
-.615 (-3.751)
-.443 (-2.700)
.144 (.867)
.626 (3.828)
Urban residence (vs. Rural) .320 (2.352)**
-.050 (-.371)
.116 (.861)
-.139 (-1.022)
.077 (.575)
Suburban residence (vs. Rural residence)
-.068 (-.755)
.085 (.955)
.085 (.948)
-.076 (-.839)
-.003 (-.036)
Number of children under 17 years of age in a family
.112 (3.286)**
.134 (3.989)**
.094 (2.782)**
-.044 (-1.300)
-.086 (-2.555)**
Male (vs. Female)
.105 (1.270)
-.322 (-3.934)**
-.040 (-.486)
-.175 (-2.115)*
-.102 (-1.247)
Age, under 20 years (vs. 36 years and older )
-.205 (-.791)
-.519 (-2.025)*
.081 (.315)
-.202 (-.779)
-.691 (-2.699)**
Age 21-35 (vs. 36 years and older)
.175 (2.082)*
-.014 (-.163)
.209 (2.510)**
-.073 (-.873)
-.291 (-3.506)**
Below high school education (vs. college and above)
.085 (.115)
-.111 (-.151)
-.037 (-.050)
-1.046 (-1.407)
.009 (.012)
High school education (vs. college and above)
.001 (.009)
.062 (.753)
-.008 (-.100)
.010 (.119)
-.004 (-.053)
Employed (vs. retired)
-.068 (-.837)
.099 (1.226)
.163 (2.012)*
-.023 (-.285)
-.162 (-2.005)*
Self-employed (vs. retired) -.147 (-1.009)
-.011 (-.074)
.063 (.439)
.066 (.456)
-.042 (-.293)
Student (vs. retired)
-.025 (-.143)
.081 (.464)
.202 (1.160)
-.338 (-1.925)*
-.175 (-1.007)
Caucasian (vs. other races) -.369 (-3.196)**
.387 (3.382)**
.094 (.818)
.077 (.667)
-.261 (-2.287)**
Income, 80_99K (vs. Income below 80K)
.044 (.412)
-.085 (-.811)
-.001 (-.007)
.084 (.791)
-.032 (-.304)
Income over, 100K (vs. Income below 80K)
-.110 (-1.176)
.089 (.963)
-.127 (-1.365)
.118 (1.265)
-.073 -.794
Adjusted R Square .046 .050 .017 .011 .035 Model F-Statistic 4.024** 4.316** 2.084* 1.693* 3.260**
Notes. Single and double asterisks (*) denote significance at 5% level or better, the values in the parentheses are t-ratios. The variable categories in the brackets are excluded to avoid the dummy variable trap. Conclusion Farmers’ market and agri-tourism business operations have proven that they can provide a stable income for the majority of small- to medium-scale farmers who participate, capacity use year-round remains a challenge that business operators need to address. This study shows that bundling of farmers’ markets activities is a workable business strategy. The study suggests that if
2015 International Food and Agribusiness Management Association (IFAMA). All rights reserved
74
Onyango, Govindasamy and Alsup-Egbers Volume 18 Issue 2, 2015
bundling is implemented, it will spur diverse and steady patronage beyond the sale of traditional fresh produce and value-added products. Patronage to agri-tourism sites and farmers’ markets may be broken down into five distinct experiences: learning, naturalist, purchasing, leisurely and entertainment experiences. Operators can use this information to capitalize on in their business strategy. Information from a cluster analysis yielded four market segments: those with a strong affection for rural scenery, those interested in knowing more about agriculture, consumers who visit just to buy farmers’ produce and value-added products, and a group of consumers who visit just to connect with others and have fun. Customer profiling provides valuable information that farmers’ markets and agri-tourism business operators could use to be more successful, because it reveals who their customers are and what it takes to attract them. The regression results show that a number of socioeconomic variables are related with the patronage experience. This study finds that there is potential to generate activity year -round by bundling activities to tap a wider market beyond traditional fresh produce buyers. Future research should focus on barriers to creating year-round operations and what are the necessary investments to sustain them. Investment requirements may be beyond the reach of individual operators, so perhaps partnerships with local authorities would be a strategy to stimulate rural economies. References
Ballenger, N. and J. Blaylock. 2013. Consumer-driven agriculture: Changing U.S. demographics influence eating habits. Amber Waves http://www.ers.usda.gov/ Amberwaves/April03/Features/ConsumerDrivenAg.htm [accessed July 2014].
Brown, C. 2003. Consumer preferences for locally produced food: A study in Southeast
Missouri. American Journal of Alternative Agriculture 18:213-224. Brown, D. M. and R.J. Reeder. 2007. Farm-based recreation: A statistical profile.
Economic Research Report, No.53. United States Department of Agriculture. Che, D., A. Veeck and G. Veeck, 2005. Sustaining production and strengthening the
agritourism product: linkages among Michigan agritourism destinations. Agriculture and Human Values 22:225-234.
Carpio, C.E., M. K. Wohlgenant, and T. Boonsaeng. 2008. The Demand for
Agritourism in the United States. Journal of Agricultural and Resource Economics 33(2):254–269.
Costello, A, B., and J. Osborne. 2005. Best practices in exploratory factor analysis: Four
recommendations for getting the most from your analysis. Practical Assessment Research & Evaluation 10(7):1-9. Available online: http://pareonline.net/getvn.asp?v=10&n=7 [accessed February 2015].
2015 International Food and Agribusiness Management Association (IFAMA). All rights reserved
75
Onyango, Govindasamy and Alsup-Egbers Volume 18 Issue 2, 2015
Conner, D., K. Colasanti, R.B. Ross and S. B. Smalley. 2010. Locally grown foods and farmers markets: Consumer attitudes and behaviors. Sustainability 2:742-756.
Darnton, J. 2012. Farmers markets act as gathering space and local economic engine.
Michigan State University Extension. http://msue.anr.msu.edu/news/farmers_markets_ act_as_gathering_space_and_local_economic_engine. [accessed July, 2014].
Das, B. R. and D.V. Rainey. 2010. Agritourism in the Arkansas delta byways:
Assessing the Economic Impacts. International Journal of Tourism Research 12(3):265–280.
Elepu, G. and M. Mazzocco. 2010. Consumer Segments in Urban and Suburban Farmers
Markets. International Food and Agribusiness Management Review 13(2):1-15. Gale, F., 1997. Direct farm marketing as a rural development tool. Rural Development
Perspectives 12:19–25. Gascoigne, W., M. Sullins and D. T. McFadden. 2008. Agritourism in the West:
Exploring the Behavior of Colorado Farm and Ranch Visitors. Western Economics Forum 7(2):12-24.
Govindasamy, R. and R. M. Nayga. 1996. Characteristics of Farmer to Consumer Direct Market
Customers: An Overview Journal of Extension. 34(4). Gumirakiza, J. D., K. R. Curtis, and R. Bosworth. 2014. Who Attends Farmers’ Markets
and Why? Understanding Consumers and their Motivations. International Food and Agribusiness Management Review 17(2):65-82.
Hand, M. et al. 2010. Local Food Systems: Concepts, Impacts, and Issues. Economic
Research Report No. 97, United States Department of Agriculture.
Henderson, P.L. and H.R. Linstrom. 1982. Farmer to consumer direct marketing: Selected states.
1979-80, Statistical Bulletin No. 681, ERS-USDA. Hughes, D.W., C. Brown, S. Miller, and T. McConnell. 2008. Evaluating the economic impact of
farmers’ markets using an opportunity cost framework. Journal of Agricultural and Applied Economics 40(1):253–265.
Jolly, D. A., and K. A. Reynolds. 2005. Consumer Demand for Agricultural and On-farm Nature
Tourism. UC Small Farm Center Research Brief. Davis, CA. sfp.ucdavis.edu/files/143466.pdf
2015 International Food and Agribusiness Management Association (IFAMA). All rights reserved
76
Onyango, Govindasamy and Alsup-Egbers Volume 18 Issue 2, 2015
Jensen, K. L., C. Lindborg, B.C. English, and R. J. Menard. 2006. Visitors to Tennessee agritourism attractions: Demographics, preferences, expenditures, & projected economic impacts. http://web.utk.edu/~aimag/pubs/research%20report%20visitors%20surveys3.pdf [accessed July, 2014].
Jensen, K. L., M. B. Leffew, R. J. Menard, and B. C. English. 2014. Analysis of Factors
Influencing Agritourism Businesses Perceptions about Expansion. Journal of Food Distribution Research 42(2):118-132.
Keeling-Bond, J., D. Thilmany-McFadden, and C. Bond. 2009. What influences consumer choice of fresh produce purchase location? Journal of Agricultural and Applied Economics 41(1):61–74.
Linstrom, H.R. 1978. Farmer to Consumer Marketing. ESCS-01: Economics, Statistics, and Cooperative Service, U.S. Department of Agriculture. Martinez, S., M.S. Hand, M. Da Pra, S. Pollack, K. Ralston, T. Smith, S. Vogel, S. Clark, L.
Lohr, S. A. Low, and C. Newman. 2010. Local Food Systems: Concepts, impacts, and issues. ERR-97, U.S. Department of Agriculture, Economic Research Service.
Ragland, E., L. Velma and C. Carlos. 2011. Results of dot survey: USDA Outdoor Farmers
Market, Washington, DC. U.S. Dept. of Agriculture, Agricultural Marketing Service. Ragland, E. and D. Tropp. 2009. USDA national farmers market manager survey.
2006. U.S. Department of Agriculture, Agricultural Marketing Service http://dx.doi.org/10.9752/MS037.05-2009> [accessed February 2015].
Ryan, S., K. DeBord, and K. McClellan. 2006. Agritourism in Pennsylvania: An industry
assessment. The Center for Rural Pennsylvania. Available at http://www.ruralpa.org/ agritourism2006.pdf [accessed July 2014].
Tracy, M.H, Dhillon, P.S. and Varner, M.C., 1982. Economic comparison of direct marketing
alternatives for fresh vegetables in New Jersey. New Jersey Agricultural Experiment Station P-02551-1-82, Rutgers University.
United States Department of Agriculture, 2014. Farmers markets and local food marketing,
national count of farmers market directory listing graph: 1994-2014. USDA Agricultural Marketing Service. http://www.ams.usda.gov/AMSv1.0/ams.fetchTemplateData. dotemplate=TemplateS&leftNav=WholesaleandFarmersMarkets&page=WFMFarmersMarketGrowth&description=Farmers+Market+Growth html [accessed July 2014].
United States Department of Agriculture, 2014. What is a farmers’ market? USDA Food and
Nutrition Service. http://www.fns.usda.gov/ebt/what-farmers-market html [accessed July 2014].
2015 International Food and Agribusiness Management Association (IFAMA). All rights reserved
77

Onyango, Govindasamy and Alsup-Egbers Volume 18 Issue 2, 2015
2015 International Food and Agribusiness Management Association (IFAMA). All rights reserved
78
International Food and Agribusiness Management Review Volume 18 Issue 2, 2015
Farmers’ Willingness to Pay for a Porcine Reproductive and
Respiratory Syndrome (PRRS) Vaccine in Thua Thien Hue Province, Vietnam
Haifeng Zhang a, Hiroichi Konob, Satoko Kubotac and Jun Wang d
a Postdoctoral Fellow, Guangdong Academy of Decision Science, Sun Yat-sen University, No.135 Xingangxi Road, Guangzhou Guangdong, 510275, China
b Associate Professor, Department of Animal and Food Hygiene, Obihiro University of Agriculture and Veterinary
Medicine, Inada-cho, Obihiro, Hokkaido 080-8555, Japan
c Assistant Professor, Department of Animal and Food Hygiene, Obihiro University of Agriculture and Veterinary Medicine, Inada-cho, Obihiro, Hokkaido 080-8555, Japan
d Professor, Guangdong Academy of Decision Science, Sun Yat-sen University, No.135 Xingangxi Road,
Guangzhou Guangdong, 510275, China
Abstract Vietnam is a major pork producing country, but the livelihood of pig farmers is threatened by the pig disease Porcine reproductive and respiratory syndrome (PRRS). Although vaccination is the most practical method of choice for PRRS control, the vaccination percentage is very low in Vietnam. To help inform PRRS vaccine development and policy, our research employed the choice experiment method to assess pig farmers’ attitudes toward and willingness to pay (WTP) for a PRRS vaccine. The results found a high positive WTP value for the PRRS vaccination program in Vietnam. This study provides insight into the possibility of increasing the PRRS vaccination percentages. Keywords: pork disease, willingness to pay, vaccine, Vietnam
Corresponding author: Tel: + 81.155. 49. 5452
Email: H. Kono: [email protected] H. Zhang: [email protected]
2015 International Food and Agribusiness Management Association (IFAMA). All rights reserved
79
Zhang et al. Volume 18 Issue 2, 2015
Introduction Porcine reproductive and respiratory syndrome (PRRS) is a highly contagious, economically devastating disease in pig production. Since 2006, China’s pig-farming sector has been damaged by PRRS, resulting in huge economic losses in the Chinese pig industry (An et al. 2010). This disease quickly spread from China to Vietnam during the Beijing Olympic Games in 2008 (Zhang and Kono 2012). Total deaths of PRRS-infected pigs exceeded 300,000, and 26 of 60 provinces were affected during 2008 (Zhang et al. 2014). PRRS has already become an endemic pig disease in Vietnam (OIE 2015). Vietnam is a major pork producing country in Asia, producing 3.2 million tons in 2013 (FAOSTAT 2015). Pig production is of great importance in Vietnam, and accounts for 75.45% of total livestock production (FAOSTAT 2015). Approximately 80% of pig production is small-scale, and pig production is the major source of income for those small-scale farms (Lemke et al. 2008). Therefore, PRRS outbreaks severely damage the livelihood of pig farmers (Zhang and Kono 2012). To control PRRS in Vietnam, a stamping out (SO; culling all infected pigs) control strategy was applied in Vietnam during the outbreak period, and the government provided a culling subsidy to encourage pig farmers to cull infected pigs. Zhang et al. (2013b) clarified that the current SO strategy is epidemiologically effective and economically efficient. However, an epidemiological and economic modeling study by Zhang et al. (2014) demonstrated that SO combined with vaccination is more economically efficient than SO alone. The primary problem of PRRS vaccination in Vietnam is that the vaccination percentage1on farms is very low. Only a small portion of large commercial pig farms apply the PRRS vaccine. Furthermore, the PRRS vaccine is available only as a costly imported vaccine (it costs 40,000 Vietnamese dongs (VND) per dose; 1 U.S. dollar = 21,090 VND), and that vaccine was developed from a cultured PRRS virus in China. Unfortunately, the efficacy of “Made in China” vaccine is limited, so a government project for the development of a PRRS vaccine is being carried out in Vietnam.2 In addition, another problem with PRRS vaccination is that, although certification of classical swine fever (CSF) and foot-and-mouth disease (FMD) vaccination are currently required to sell pigs in Vietnam, no certification of PRRS vaccination is required to sell pigs. Furthermore, the government provides a culling subsidy for all culled pigs, but PRRS vaccination is not a condition for the subsidy. Therefore, there is no incentive for farmers to adopt PRRS vaccination. To successfully disseminate PRRS vaccination in Vietnam, it is essential to investigate the pig farmers’ preferences for key attributes in the design of a PRRS vaccination program. However, to the best of our knowledge, there has been no such study to date. The purpose of the present study was to use field research to assess the pig farmers’ preferences for PRRS vaccination in Vietnam using a choice experiment (CE) approach, and clarify the incentives for farmers to
1The vaccination percentage in this study is % of farms. 2Personal communication with Nguyen Van Hung (Director of Thua Thien Hue Department of Animal Health, Vietnam), during the field survey of this study between February 25th and March 4th, 2013.
2015 International Food and Agribusiness Management Association (IFAMA). All rights reserved
80
Zhang et al. Volume 18 Issue 2, 2015
vaccinate their pigs. The findings of this study will help to inform vaccine policy for disseminating PRRS vaccination in Vietnam. Material and Methods In 2008, there were 1,077 PRRS outbreaks in Vietnam, infecting 300,906 pigs (Zhang and Kono 2012). The number of outbreaks decreased in 2009, but became widespread again in 2010. PRRS outbreaks were severe in the North Central Coast area of Vietnam in 2008. Thua Thien Hue (Hue) Province is located in the North Central Coast area (Figure 1), and the government-directed system for animal disease control in Hue Province is considered to be outstanding in Vietnam (Zhang et al. 2013b). Therefore, we selected Hue Province as our study area.3
Figure 1. Location of Hue Province Source. Veterinary office in Hue Province A survey was conducted in villages by staff members of the Hue University of Agriculture and Forestry to collect data using an interview-based questionnaire between February 25th and March 4th, 2013. To clarify the difference in preferences for PRRS vaccination between PRRS-affected farmers (the PRRS infections occurred on their farms in 2008) and non-affected farmers, a total of 101 households were surveyed, of which 50 households had been infected by PRRS, and 51 households had not. Samples were selected randomly from a “farm list” provided by a local
3 Southeast Asia has a high pig density, and PRRS outbreaks occurred primarily in this area. Hue Province has a high pig density and PRRS was severe in this province. Hue province is located in the North Central Coast area, and this province is the only province in Vietnam where central slaughter houses have been controlled by government successfully, and all livestock is slaughtered in these centers. Many governmental officers from other provinces or other countries also visited Hue Province for educational purposes. The governmental direction system for animal disease control in Hue Province is considered to be outstanding in Vietnam. After the 2008 PRRS outbreak, the Hue government enhanced animal disease surveillance system in this area, and no further PRRS infection was officially reported (Zhang et al. 2013b). For these reasons, we chose Hue as our study area.
2015 International Food and Agribusiness Management Association (IFAMA). All rights reserved
81
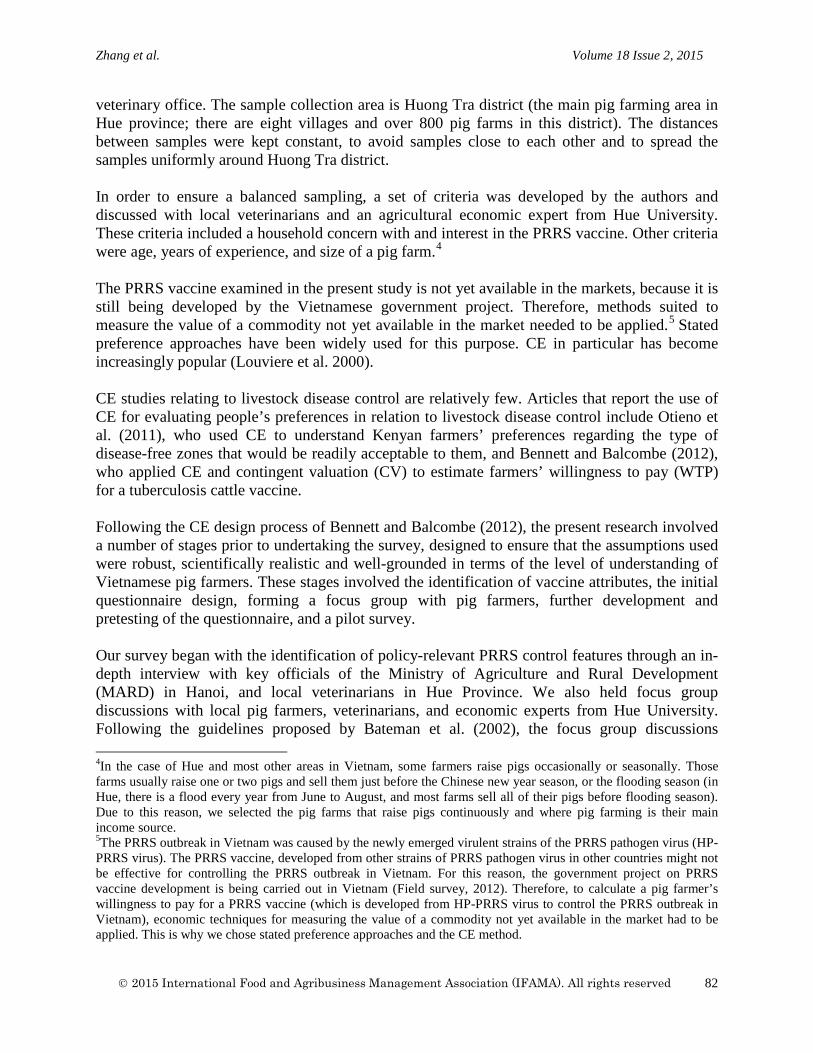
Zhang et al. Volume 18 Issue 2, 2015
veterinary office. The sample collection area is Huong Tra district (the main pig farming area in Hue province; there are eight villages and over 800 pig farms in this district). The distances between samples were kept constant, to avoid samples close to each other and to spread the samples uniformly around Huong Tra district. In order to ensure a balanced sampling, a set of criteria was developed by the authors and discussed with local veterinarians and an agricultural economic expert from Hue University. These criteria included a household concern with and interest in the PRRS vaccine. Other criteria were age, years of experience, and size of a pig farm.4 The PRRS vaccine examined in the present study is not yet available in the markets, because it is still being developed by the Vietnamese government project. Therefore, methods suited to measure the value of a commodity not yet available in the market needed to be applied.5 Stated preference approaches have been widely used for this purpose. CE in particular has become increasingly popular (Louviere et al. 2000). CE studies relating to livestock disease control are relatively few. Articles that report the use of CE for evaluating people’s preferences in relation to livestock disease control include Otieno et al. (2011), who used CE to understand Kenyan farmers’ preferences regarding the type of disease-free zones that would be readily acceptable to them, and Bennett and Balcombe (2012), who applied CE and contingent valuation (CV) to estimate farmers’ willingness to pay (WTP) for a tuberculosis cattle vaccine. Following the CE design process of Bennett and Balcombe (2012), the present research involved a number of stages prior to undertaking the survey, designed to ensure that the assumptions used were robust, scientifically realistic and well-grounded in terms of the level of understanding of Vietnamese pig farmers. These stages involved the identification of vaccine attributes, the initial questionnaire design, forming a focus group with pig farmers, further development and pretesting of the questionnaire, and a pilot survey. Our survey began with the identification of policy-relevant PRRS control features through an in-depth interview with key officials of the Ministry of Agriculture and Rural Development (MARD) in Hanoi, and local veterinarians in Hue Province. We also held focus group discussions with local pig farmers, veterinarians, and economic experts from Hue University. Following the guidelines proposed by Bateman et al. (2002), the focus group discussions
4In the case of Hue and most other areas in Vietnam, some farmers raise pigs occasionally or seasonally. Those farms usually raise one or two pigs and sell them just before the Chinese new year season, or the flooding season (in Hue, there is a flood every year from June to August, and most farms sell all of their pigs before flooding season). Due to this reason, we selected the pig farms that raise pigs continuously and where pig farming is their main income source. 5The PRRS outbreak in Vietnam was caused by the newly emerged virulent strains of the PRRS pathogen virus (HP-PRRS virus). The PRRS vaccine, developed from other strains of PRRS pathogen virus in other countries might not be effective for controlling the PRRS outbreak in Vietnam. For this reason, the government project on PRRS vaccine development is being carried out in Vietnam (Field survey, 2012). Therefore, to calculate a pig farmer’s willingness to pay for a PRRS vaccine (which is developed from HP-PRRS virus to control the PRRS outbreak in Vietnam), economic techniques for measuring the value of a commodity not yet available in the market had to be applied. This is why we chose stated preference approaches and the CE method.
2015 International Food and Agribusiness Management Association (IFAMA). All rights reserved
82
Zhang et al. Volume 18 Issue 2, 2015
included four small-scale pig farmers recruited from Huong Tra District, Hue Province, where there was a severe PRRS outbreak in 2008, two veterinarians from the Huong Tra District Veterinary Office, two economic experts from Hue University, and the director of the Animal Health Department of Hue Province. The focus group discussions were also used to explore important attributes that were identified and their inclusion in the CE. Following pre-testing of the questionnaire, three pilot surveys were undertaken before the main survey was commenced in order to test the survey method.6 Three attributes were ultimately selected for the CE design:
1. Vaccine administration (if the pigs are vaccinated, the farmer obtains a PRRS-vaccinated certification);
2. Culling subsidy (if a PRRS infection occurs on the farms, then the government provides compensation for those farms to cull infected pigs) 7; and
3. The Price of vaccine (if pig farmers want to vaccinate their pigs, they have to pay the cost of the vaccine itself and the veterinary service charge) .8
Table 1. Attributes and levels for CE Attribute Unit Levels Vaccine administration Dummy Adopt=1, Not Adopt=0 Culling subsidy % 25, 50, 75, 100 Price of vaccine (VND) 30,000, 40,000, 50,000 The attribute of vaccine administration had 2 levels, the attribute of culling subsidy had 4 levels, and the attribute of price had 3 levels, generating 24 full-profile choice cards for respondents to fill out (Table 1). From these, 12 unrealistic choices were deleted (for example, the combination of ‘non-acceptance of vaccine administration’ with ‘price of vaccine and culling subsidy’). Because the total numbers of attributes and the choices generated are relatively small, we used all of the choices to create six CE questions in one questionnaire. The respondents were then presented with the full set of six pair choices (totaling 12 individual profiles choice cards, an example of one pair of choices appears in Table 2). Following Bennett and Balcombe (2012), for each question, the choice ③ is fixed and is always “No vaccination” and “Compensation 0%”). Prior to answering the survey, the respondents were provided with an explanation of the
6The first pretest survey was conducted in September, 2012. The farmers were confused when answering the original questionnaire, e.g., they believed that vaccinated pigs must have certification, and did not understand why there was an alternative under which vaccinated pigs were not required to have certification. We also found it very difficult to explain the CE question if the attributes were more than four. The second pretest survey was conducted in March, 2013, and the CE design was again modified slightly. The final pretest survey was conducted just before the main survey began. 7According to Ministry of Agriculture and Rural Development (MARD) regulation No. 80/2008/QD-BNN, in 2008, PRRS-infected farms were paid a subsidy of 25,000VND per kg of infected pig, which was approximately 70% of the market value of pigs at that time. Based on this information, we set the attribute of “Compensation” at four levels: 25%, 50%, 75% and 100%. 8According to an interview with the director of the Animal Health Department of Hue Province, the government permitted PRRS vaccines made by Guangdong Dahuanong Animal Health Product Co. Ltd., in China. The vaccine costs 40,000 VND per dose, including the veterinary service charge. Based on this information, we set the attribute of “Price of vaccine” at three levels: 30,000, 40,000 and 50,000 VND per dose per pig.
2015 International Food and Agribusiness Management Association (IFAMA). All rights reserved
83
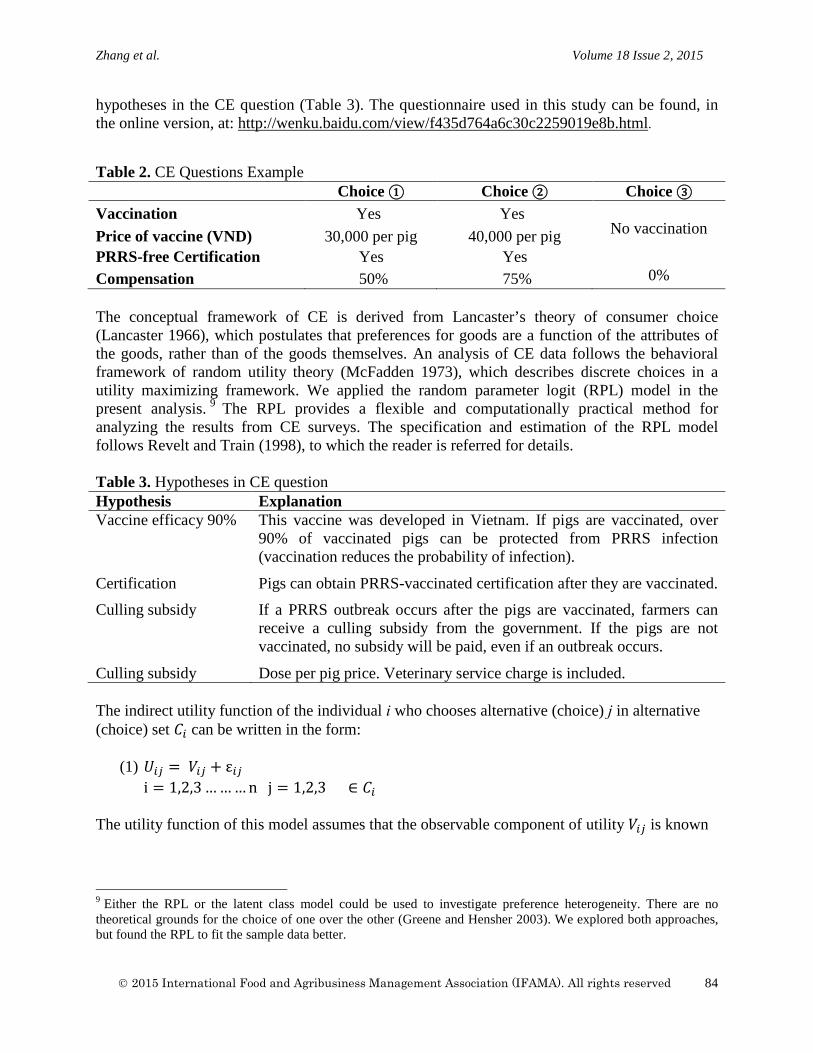
Zhang et al. Volume 18 Issue 2, 2015
hypotheses in the CE question (Table 3). The questionnaire used in this study can be found, in the online version, at: http://wenku.baidu.com/view/f435d764a6c30c2259019e8b.html. Table 2. CE Questions Example Choice ① Choice ② Choice ③ Vaccination Yes Yes
No vaccination Price of vaccine (VND) 30,000 per pig 40,000 per pig PRRS-free Certification Yes Yes Compensation 50% 75% 0% The conceptual framework of CE is derived from Lancaster’s theory of consumer choice (Lancaster 1966), which postulates that preferences for goods are a function of the attributes of the goods, rather than of the goods themselves. An analysis of CE data follows the behavioral framework of random utility theory (McFadden 1973), which describes discrete choices in a utility maximizing framework. We applied the random parameter logit (RPL) model in the present analysis. 9 The RPL provides a flexible and computationally practical method for analyzing the results from CE surveys. The specification and estimation of the RPL model follows Revelt and Train (1998), to which the reader is referred for details. Table 3. Hypotheses in CE question Hypothesis Explanation Vaccine efficacy 90% This vaccine was developed in Vietnam. If pigs are vaccinated, over
90% of vaccinated pigs can be protected from PRRS infection (vaccination reduces the probability of infection).
Certification Pigs can obtain PRRS-vaccinated certification after they are vaccinated.
Culling subsidy If a PRRS outbreak occurs after the pigs are vaccinated, farmers can receive a culling subsidy from the government. If the pigs are not vaccinated, no subsidy will be paid, even if an outbreak occurs.
Culling subsidy Dose per pig price. Veterinary service charge is included. The indirect utility function of the individual і who chooses alternative (choice) ј in alternative (choice) set 𝐶𝐶𝑖𝑖 can be written in the form:
(1) 𝑈𝑈𝑖𝑖𝑖𝑖 = 𝑉𝑉𝑖𝑖𝑖𝑖 + ε𝑖𝑖𝑖𝑖
i = 1,2,3 … … … n j = 1,2,3 ∈ 𝐶𝐶𝑖𝑖 The utility function of this model assumes that the observable component of utility 𝑉𝑉𝑖𝑖𝑖𝑖 is known
9 Either the RPL or the latent class model could be used to investigate preference heterogeneity. There are no theoretical grounds for the choice of one over the other (Greene and Hensher 2003). We explored both approaches, but found the RPL to fit the sample data better.
2015 International Food and Agribusiness Management Association (IFAMA). All rights reserved
84
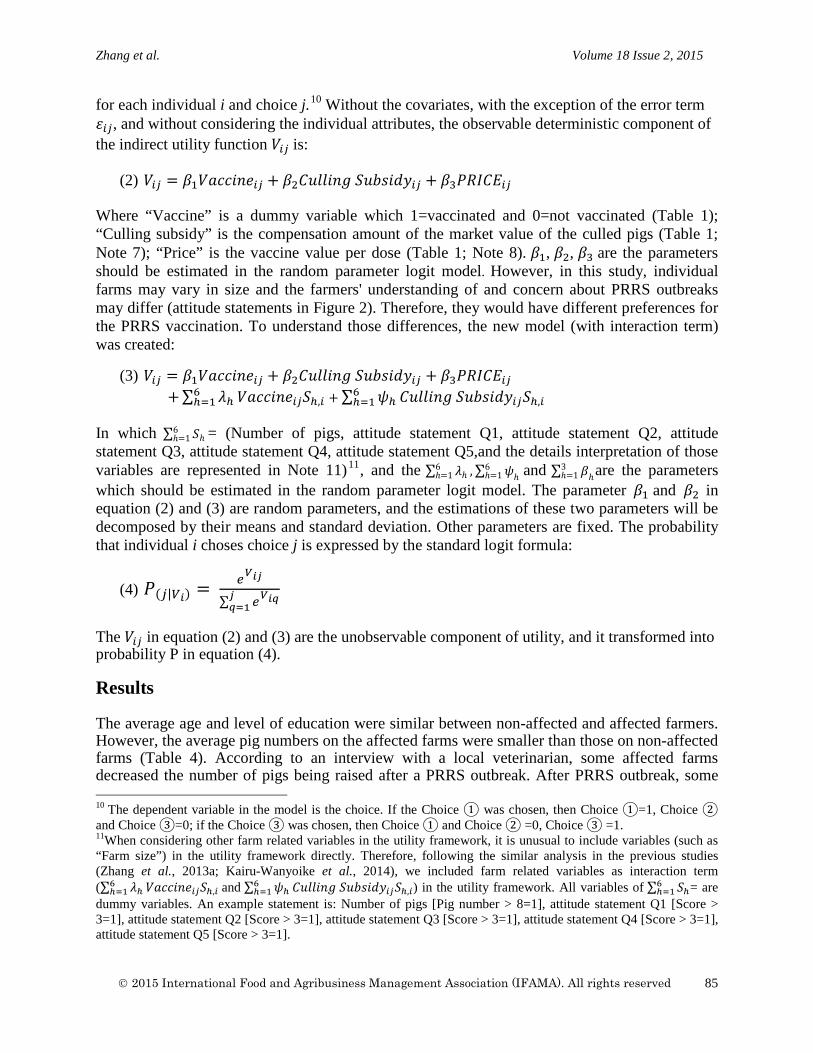
Zhang et al. Volume 18 Issue 2, 2015
for each individual i and choice j.10 Without the covariates, with the exception of the error term 𝜀𝜀𝑖𝑖𝑖𝑖, and without considering the individual attributes, the observable deterministic component of the indirect utility function 𝑉𝑉𝑖𝑖𝑖𝑖 is:
(2) 𝑉𝑉𝑖𝑖𝑖𝑖 = 𝛽𝛽1𝑉𝑉𝑉𝑉𝑉𝑉𝑉𝑉𝑉𝑉𝑉𝑉𝑉𝑉𝑖𝑖𝑖𝑖 + 𝛽𝛽2𝐶𝐶𝐶𝐶𝐶𝐶𝐶𝐶𝑉𝑉𝑉𝑉𝐶𝐶 𝑆𝑆𝐶𝐶𝑆𝑆𝑆𝑆𝑉𝑉𝑆𝑆𝑆𝑆𝑖𝑖𝑖𝑖 + 𝛽𝛽3𝑃𝑃𝑃𝑃𝑃𝑃𝐶𝐶𝑃𝑃𝑖𝑖𝑖𝑖
Where “Vaccine” is a dummy variable which 1=vaccinated and 0=not vaccinated (Table 1); “Culling subsidy” is the compensation amount of the market value of the culled pigs (Table 1; Note 7); “Price” is the vaccine value per dose (Table 1; Note 8). 𝛽𝛽1, 𝛽𝛽2, 𝛽𝛽3 are the parameters should be estimated in the random parameter logit model. However, in this study, individual farms may vary in size and the farmers' understanding of and concern about PRRS outbreaks may differ (attitude statements in Figure 2). Therefore, they would have different preferences for the PRRS vaccination. To understand those differences, the new model (with interaction term) was created:
(3) 𝑉𝑉𝑖𝑖𝑖𝑖 = 𝛽𝛽1𝑉𝑉𝑉𝑉𝑉𝑉𝑉𝑉𝑉𝑉𝑉𝑉𝑉𝑉𝑖𝑖𝑖𝑖 + 𝛽𝛽2𝐶𝐶𝐶𝐶𝐶𝐶𝐶𝐶𝑉𝑉𝑉𝑉𝐶𝐶 𝑆𝑆𝐶𝐶𝑆𝑆𝑆𝑆𝑉𝑉𝑆𝑆𝑆𝑆𝑖𝑖𝑖𝑖 + 𝛽𝛽3𝑃𝑃𝑃𝑃𝑃𝑃𝐶𝐶𝑃𝑃𝑖𝑖𝑖𝑖 +∑ 𝜆𝜆ℎ6
ℎ=1 𝑉𝑉𝑉𝑉𝑉𝑉𝑉𝑉𝑉𝑉𝑉𝑉𝑉𝑉𝑖𝑖𝑖𝑖𝑆𝑆ℎ,𝑖𝑖 + ∑ 𝜓𝜓ℎ6ℎ=1 𝐶𝐶𝐶𝐶𝐶𝐶𝐶𝐶𝑉𝑉𝑉𝑉𝐶𝐶 𝑆𝑆𝐶𝐶𝑆𝑆𝑆𝑆𝑉𝑉𝑆𝑆𝑆𝑆𝑖𝑖𝑖𝑖𝑆𝑆ℎ,𝑖𝑖
In which ∑ 𝑆𝑆ℎ6
ℎ=1 = (Number of pigs, attitude statement Q1, attitude statement Q2, attitude statement Q3, attitude statement Q4, attitude statement Q5,and the details interpretation of those variables are represented in Note 11)11, and the ∑ 𝜆𝜆ℎ6
ℎ=1 ,∑ 𝜓𝜓ℎ6ℎ=1 and ∑ 𝛽𝛽ℎ
3ℎ=1 are the parameters
which should be estimated in the random parameter logit model. The parameter 𝛽𝛽1 and 𝛽𝛽2 in equation (2) and (3) are random parameters, and the estimations of these two parameters will be decomposed by their means and standard deviation. Other parameters are fixed. The probability that individual i choses choice j is expressed by the standard logit formula:
(4) 𝑃𝑃(𝑖𝑖|𝑉𝑉𝑖𝑖) = 𝑒𝑒𝑉𝑉𝑖𝑖𝑖𝑖
∑ 𝑒𝑒𝑉𝑉𝑖𝑖𝑖𝑖𝑖𝑖𝑖𝑖=1
The 𝑉𝑉𝑖𝑖𝑖𝑖 in equation (2) and (3) are the unobservable component of utility, and it transformed into probability P in equation (4). Results The average age and level of education were similar between non-affected and affected farmers. However, the average pig numbers on the affected farms were smaller than those on non-affected farms (Table 4). According to an interview with a local veterinarian, some affected farms decreased the number of pigs being raised after a PRRS outbreak. After PRRS outbreak, some
10 The dependent variable in the model is the choice. If the Choice ① was chosen, then Choice ①=1, Choice ② and Choice ③=0; if the Choice ③ was chosen, then Choice ① and Choice ② =0, Choice ③ =1. 11When considering other farm related variables in the utility framework, it is unusual to include variables (such as “Farm size”) in the utility framework directly. Therefore, following the similar analysis in the previous studies (Zhang et al., 2013a; Kairu-Wanyoike et al., 2014), we included farm related variables as interaction term (∑ 𝜆𝜆ℎ6
ℎ=1 𝑉𝑉𝑉𝑉𝑉𝑉𝑉𝑉𝑉𝑉𝑉𝑉𝑉𝑉𝑖𝑖𝑖𝑖𝑆𝑆ℎ,𝑖𝑖 and ∑ 𝜓𝜓ℎ6ℎ=1 𝐶𝐶𝐶𝐶𝐶𝐶𝐶𝐶𝑉𝑉𝑉𝑉𝐶𝐶 𝑆𝑆𝐶𝐶𝑆𝑆𝑆𝑆𝑉𝑉𝑆𝑆𝑆𝑆𝑖𝑖𝑖𝑖𝑆𝑆ℎ,𝑖𝑖) in the utility framework. All variables of ∑ 𝑆𝑆ℎ6
ℎ=1 = are dummy variables. An example statement is: Number of pigs [Pig number > 8=1], attitude statement Q1 [Score > 3=1], attitude statement Q2 [Score > 3=1], attitude statement Q3 [Score > 3=1], attitude statement Q4 [Score > 3=1], attitude statement Q5 [Score > 3=1].
2015 International Food and Agribusiness Management Association (IFAMA). All rights reserved
85
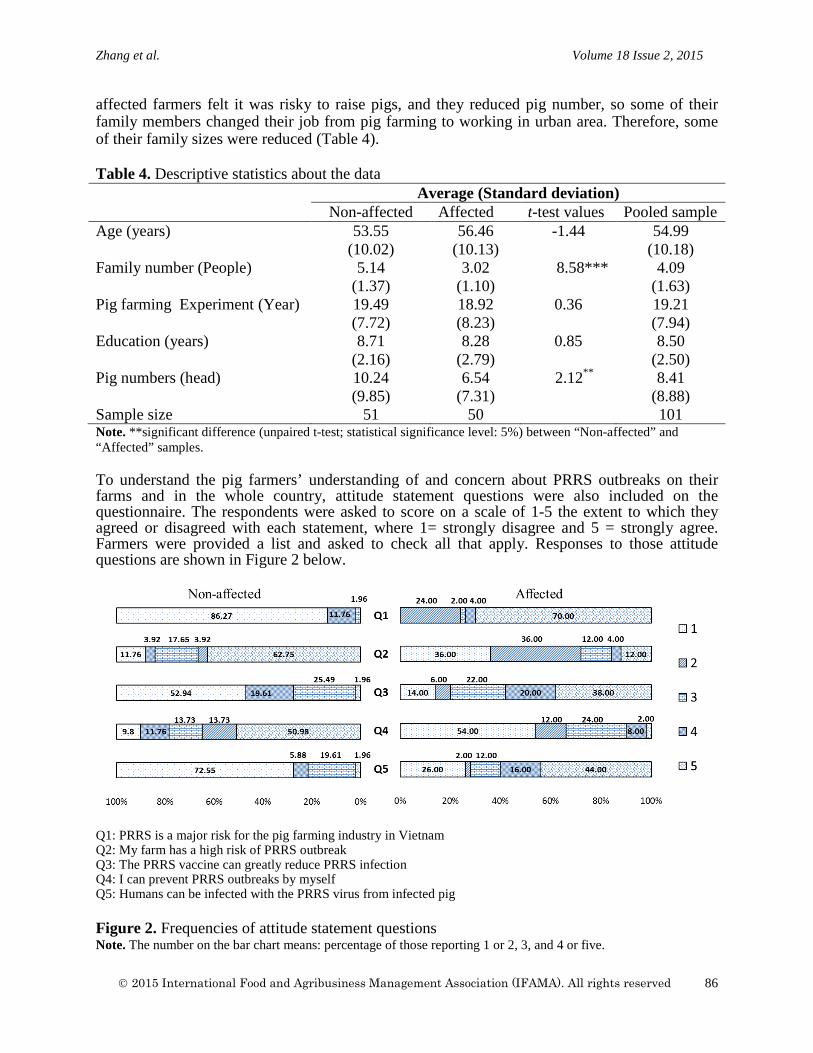
Zhang et al. Volume 18 Issue 2, 2015
affected farmers felt it was risky to raise pigs, and they reduced pig number, so some of their family members changed their job from pig farming to working in urban area. Therefore, some of their family sizes were reduced (Table 4). Table 4. Descriptive statistics about the data Average (Standard deviation) Non-affected Affected t-test values Pooled sample Age (years) 53.55 56.46 -1.44 54.99 (10.02) (10.13) (10.18) Family number (People) 5.14 3.02 8.58*** 4.09 (1.37) (1.10) (1.63) Pig farming Experiment (Year) 19.49 18.92 0.36 19.21 (7.72) (8.23) (7.94) Education (years) 8.71 8.28 0.85 8.50 (2.16) (2.79) (2.50) Pig numbers (head) 10.24 6.54 2.12** 8.41 (9.85) (7.31) (8.88) Sample size 51 50 101 Note. **significant difference (unpaired t-test; statistical significance level: 5%) between “Non-affected” and “Affected” samples. To understand the pig farmers’ understanding of and concern about PRRS outbreaks on their farms and in the whole country, attitude statement questions were also included on the questionnaire. The respondents were asked to score on a scale of 1-5 the extent to which they agreed or disagreed with each statement, where 1= strongly disagree and 5 = strongly agree. Farmers were provided a list and asked to check all that apply. Responses to those attitude questions are shown in Figure 2 below.
Q1: PRRS is a major risk for the pig farming industry in Vietnam Q2: My farm has a high risk of PRRS outbreak Q3: The PRRS vaccine can greatly reduce PRRS infection Q4: I can prevent PRRS outbreaks by myself Q5: Humans can be infected with the PRRS virus from infected pig
Figure 2. Frequencies of attitude statement questions Note. The number on the bar chart means: percentage of those reporting 1 or 2, 3, and 4 or five.
2015 International Food and Agribusiness Management Association (IFAMA). All rights reserved
86
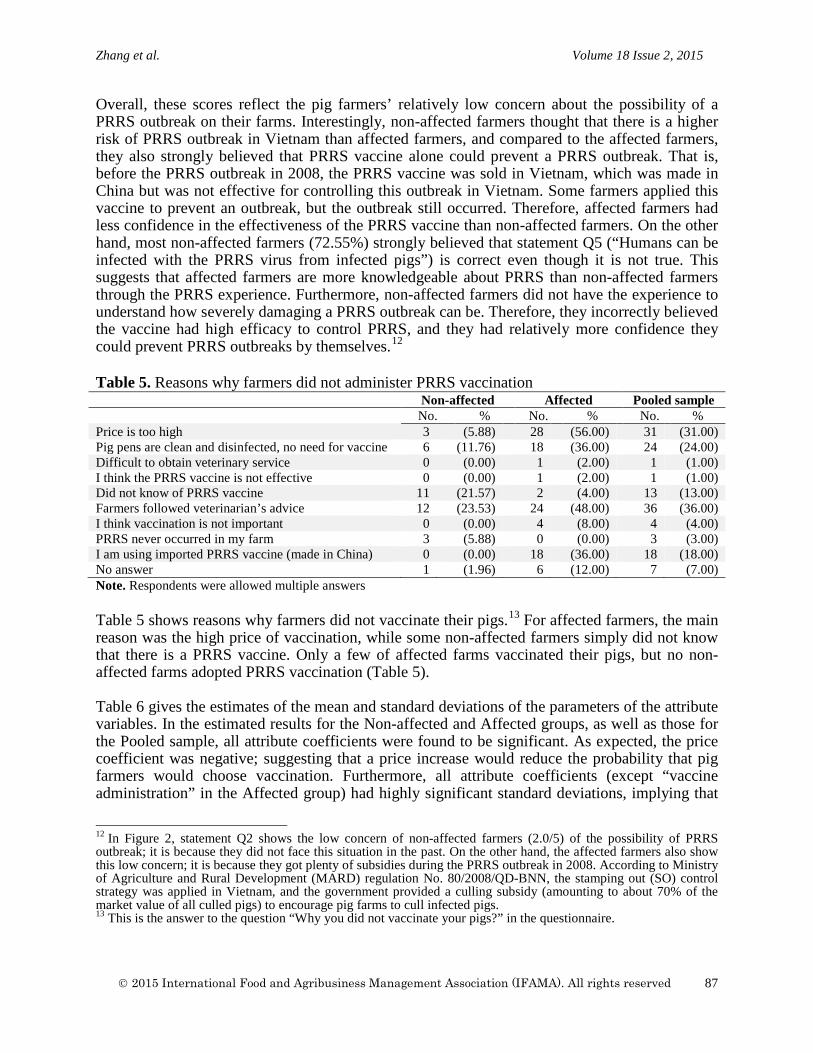
Zhang et al. Volume 18 Issue 2, 2015
Overall, these scores reflect the pig farmers’ relatively low concern about the possibility of a PRRS outbreak on their farms. Interestingly, non-affected farmers thought that there is a higher risk of PRRS outbreak in Vietnam than affected farmers, and compared to the affected farmers, they also strongly believed that PRRS vaccine alone could prevent a PRRS outbreak. That is, before the PRRS outbreak in 2008, the PRRS vaccine was sold in Vietnam, which was made in China but was not effective for controlling this outbreak in Vietnam. Some farmers applied this vaccine to prevent an outbreak, but the outbreak still occurred. Therefore, affected farmers had less confidence in the effectiveness of the PRRS vaccine than non-affected farmers. On the other hand, most non-affected farmers (72.55%) strongly believed that statement Q5 (“Humans can be infected with the PRRS virus from infected pigs”) is correct even though it is not true. This suggests that affected farmers are more knowledgeable about PRRS than non-affected farmers through the PRRS experience. Furthermore, non-affected farmers did not have the experience to understand how severely damaging a PRRS outbreak can be. Therefore, they incorrectly believed the vaccine had high efficacy to control PRRS, and they had relatively more confidence they could prevent PRRS outbreaks by themselves.12 Table 5. Reasons why farmers did not administer PRRS vaccination Non-affected Affected Pooled sample No. % No. % No. % Price is too high 3 (5.88) 28 (56.00) 31 (31.00) Pig pens are clean and disinfected, no need for vaccine 6 (11.76) 18 (36.00) 24 (24.00) Difficult to obtain veterinary service 0 (0.00) 1 (2.00) 1 (1.00) I think the PRRS vaccine is not effective 0 (0.00) 1 (2.00) 1 (1.00) Did not know of PRRS vaccine 11 (21.57) 2 (4.00) 13 (13.00) Farmers followed veterinarian’s advice 12 (23.53) 24 (48.00) 36 (36.00) I think vaccination is not important 0 (0.00) 4 (8.00) 4 (4.00) PRRS never occurred in my farm 3 (5.88) 0 (0.00) 3 (3.00) I am using imported PRRS vaccine (made in China) 0 (0.00) 18 (36.00) 18 (18.00) No answer 1 (1.96) 6 (12.00) 7 (7.00) Note. Respondents were allowed multiple answers Table 5 shows reasons why farmers did not vaccinate their pigs.13 For affected farmers, the main reason was the high price of vaccination, while some non-affected farmers simply did not know that there is a PRRS vaccine. Only a few of affected farms vaccinated their pigs, but no non-affected farms adopted PRRS vaccination (Table 5). Table 6 gives the estimates of the mean and standard deviations of the parameters of the attribute variables. In the estimated results for the Non-affected and Affected groups, as well as those for the Pooled sample, all attribute coefficients were found to be significant. As expected, the price coefficient was negative; suggesting that a price increase would reduce the probability that pig farmers would choose vaccination. Furthermore, all attribute coefficients (except “vaccine administration” in the Affected group) had highly significant standard deviations, implying that
12 In Figure 2, statement Q2 shows the low concern of non-affected farmers (2.0/5) of the possibility of PRRS outbreak; it is because they did not face this situation in the past. On the other hand, the affected farmers also show this low concern; it is because they got plenty of subsidies during the PRRS outbreak in 2008. According to Ministry of Agriculture and Rural Development (MARD) regulation No. 80/2008/QD-BNN, the stamping out (SO) control strategy was applied in Vietnam, and the government provided a culling subsidy (amounting to about 70% of the market value of all culled pigs) to encourage pig farms to cull infected pigs. 13 This is the answer to the question “Why you did not vaccinate your pigs?” in the questionnaire.
2015 International Food and Agribusiness Management Association (IFAMA). All rights reserved
87
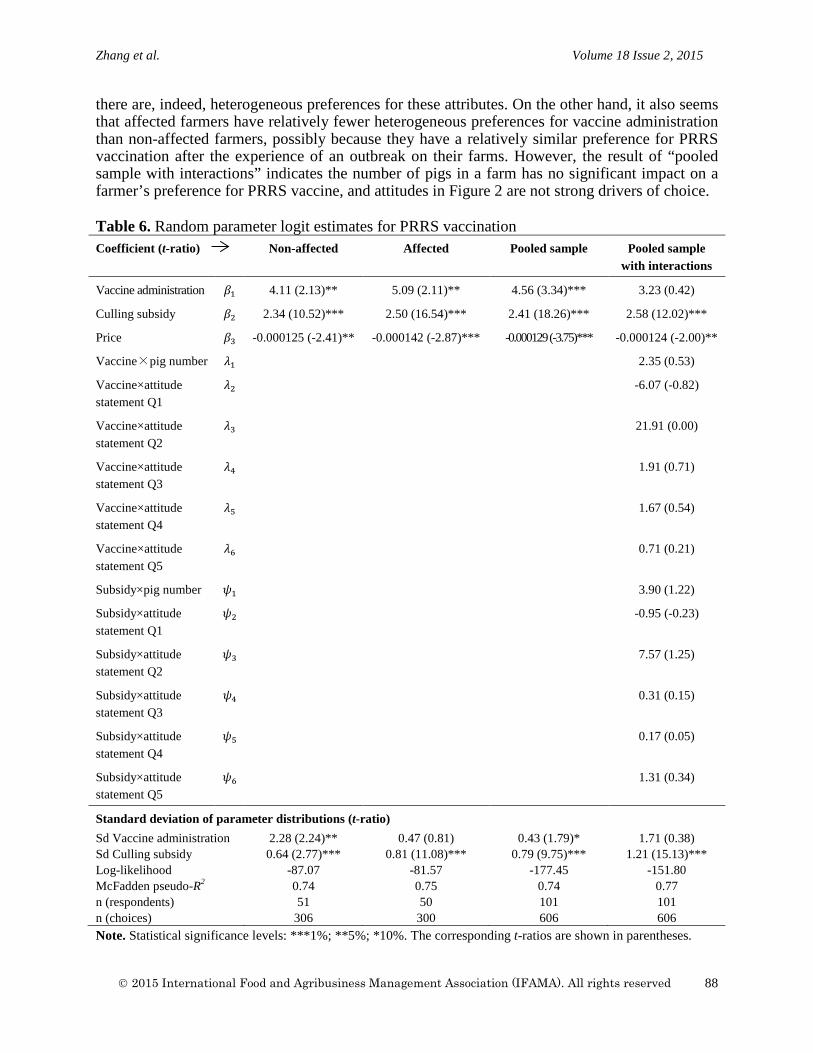
Zhang et al. Volume 18 Issue 2, 2015
there are, indeed, heterogeneous preferences for these attributes. On the other hand, it also seems that affected farmers have relatively fewer heterogeneous preferences for vaccine administration than non-affected farmers, possibly because they have a relatively similar preference for PRRS vaccination after the experience of an outbreak on their farms. However, the result of “pooled sample with interactions” indicates the number of pigs in a farm has no significant impact on a farmer’s preference for PRRS vaccine, and attitudes in Figure 2 are not strong drivers of choice. Table 6. Random parameter logit estimates for PRRS vaccination Coefficient (t-ratio) Non-affected Affected Pooled sample Pooled sample
with interactions
Vaccine administration 𝛽𝛽1 4.11 (2.13)** 5.09 (2.11)** 4.56 (3.34)*** 3.23 (0.42)
Culling subsidy 𝛽𝛽2 2.34 (10.52)*** 2.50 (16.54)*** 2.41 (18.26)*** 2.58 (12.02)***
Price 𝛽𝛽3 -0.000125 (-2.41)** -0.000142 (-2.87)*** -0.000129 (-3.75)*** -0.000124 (-2.00)**
Vaccine×pig number 𝜆𝜆1 2.35 (0.53)
Vaccine×attitude statement Q1
𝜆𝜆2 -6.07 (-0.82)
Vaccine×attitude statement Q2
𝜆𝜆3 21.91 (0.00)
Vaccine×attitude statement Q3
𝜆𝜆4 1.91 (0.71)
Vaccine×attitude statement Q4
𝜆𝜆5 1.67 (0.54)
Vaccine×attitude statement Q5
𝜆𝜆6 0.71 (0.21)
Subsidy×pig number 𝜓𝜓1 3.90 (1.22)
Subsidy×attitude statement Q1
𝜓𝜓2 -0.95 (-0.23)
Subsidy×attitude statement Q2
𝜓𝜓3 7.57 (1.25)
Subsidy×attitude statement Q3
𝜓𝜓4 0.31 (0.15)
Subsidy×attitude statement Q4
𝜓𝜓5 0.17 (0.05)
Subsidy×attitude statement Q5
𝜓𝜓6 1.31 (0.34)
Standard deviation of parameter distributions (t-ratio) Sd Vaccine administration 2.28 (2.24)** 0.47 (0.81) 0.43 (1.79)* 1.71 (0.38) Sd Culling subsidy 0.64 (2.77)*** 0.81 (11.08)*** 0.79 (9.75)*** 1.21 (15.13)*** Log-likelihood -87.07 -81.57 -177.45 -151.80 McFadden pseudo-R2 0.74 0.75 0.74 0.77 n (respondents) 51 50 101 101 n (choices) 306 300 606 606 Note. Statistical significance levels: ***1%; **5%; *10%. The corresponding t-ratios are shown in parentheses.
2015 International Food and Agribusiness Management Association (IFAMA). All rights reserved
88
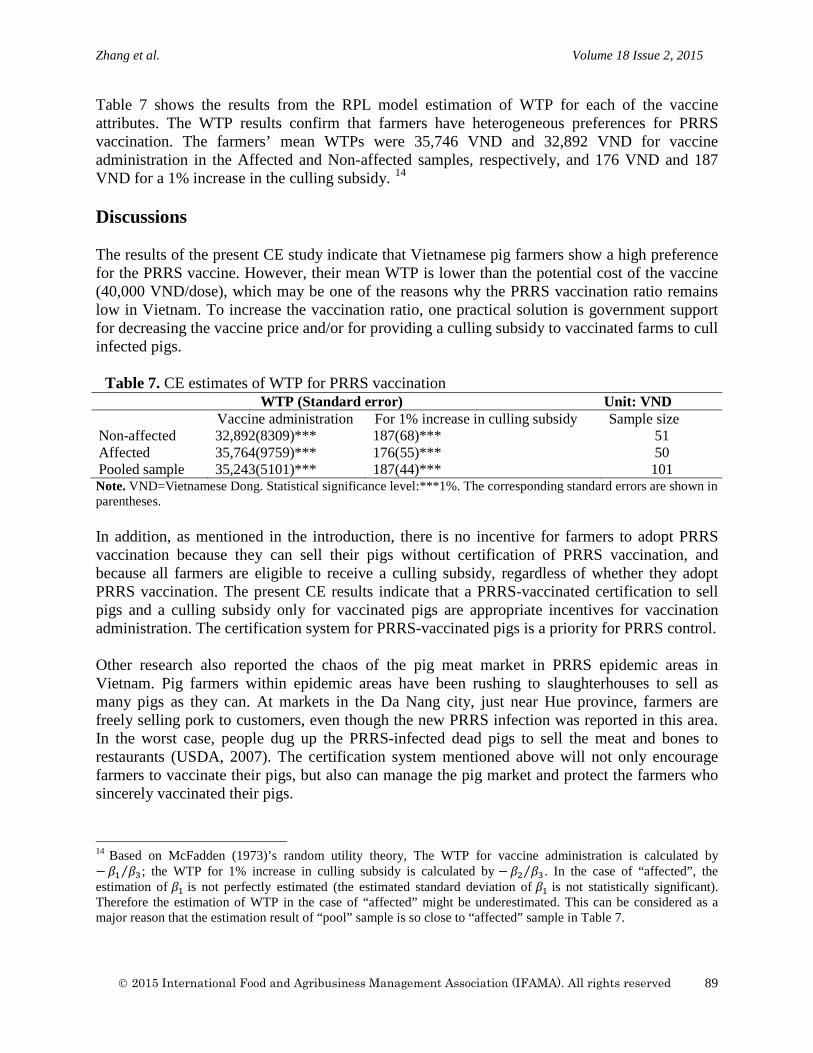
Zhang et al. Volume 18 Issue 2, 2015
Table 7 shows the results from the RPL model estimation of WTP for each of the vaccine attributes. The WTP results confirm that farmers have heterogeneous preferences for PRRS vaccination. The farmers’ mean WTPs were 35,746 VND and 32,892 VND for vaccine administration in the Affected and Non-affected samples, respectively, and 176 VND and 187 VND for a 1% increase in the culling subsidy. 14
Discussions The results of the present CE study indicate that Vietnamese pig farmers show a high preference for the PRRS vaccine. However, their mean WTP is lower than the potential cost of the vaccine (40,000 VND/dose), which may be one of the reasons why the PRRS vaccination ratio remains low in Vietnam. To increase the vaccination ratio, one practical solution is government support for decreasing the vaccine price and/or for providing a culling subsidy to vaccinated farms to cull infected pigs.
Table 7. CE estimates of WTP for PRRS vaccination WTP (Standard error) Unit: VND Vaccine administration For 1% increase in culling subsidy Sample size Non-affected 32,892(8309)*** 187(68)*** 51 Affected 35,764(9759)*** 176(55)*** 50 Pooled sample 35,243(5101)*** 187(44)*** 101 Note. VND=Vietnamese Dong. Statistical significance level:***1%. The corresponding standard errors are shown in parentheses. In addition, as mentioned in the introduction, there is no incentive for farmers to adopt PRRS vaccination because they can sell their pigs without certification of PRRS vaccination, and because all farmers are eligible to receive a culling subsidy, regardless of whether they adopt PRRS vaccination. The present CE results indicate that a PRRS-vaccinated certification to sell pigs and a culling subsidy only for vaccinated pigs are appropriate incentives for vaccination administration. The certification system for PRRS-vaccinated pigs is a priority for PRRS control. Other research also reported the chaos of the pig meat market in PRRS epidemic areas in Vietnam. Pig farmers within epidemic areas have been rushing to slaughterhouses to sell as many pigs as they can. At markets in the Da Nang city, just near Hue province, farmers are freely selling pork to customers, even though the new PRRS infection was reported in this area. In the worst case, people dug up the PRRS-infected dead pigs to sell the meat and bones to restaurants (USDA, 2007). The certification system mentioned above will not only encourage farmers to vaccinate their pigs, but also can manage the pig market and protect the farmers who sincerely vaccinated their pigs.
14 Based on McFadden (1973)’s random utility theory, The WTP for vaccine administration is calculated by −𝛽𝛽1 𝛽𝛽3⁄ ; the WTP for 1% increase in culling subsidy is calculated by −𝛽𝛽2 𝛽𝛽3⁄ . In the case of “affected”, the estimation of 𝛽𝛽1 is not perfectly estimated (the estimated standard deviation of 𝛽𝛽1 is not statistically significant). Therefore the estimation of WTP in the case of “affected” might be underestimated. This can be considered as a major reason that the estimation result of “pool” sample is so close to “affected” sample in Table 7.
2015 International Food and Agribusiness Management Association (IFAMA). All rights reserved
89
Zhang et al. Volume 18 Issue 2, 2015
The CE results also show a relatively high WTP for a 1% increase in the culling subsidy. Pig farmers agree that PRRS is a terrible disease, and they want to minimize their losses if an outbreak occurs after vaccination. Therefore, they set a high value on the culling subsidy paid by the government if infection occurs even after vaccination. To disseminate the PRRS vaccination most efficiently, affected farmers and people who run relatively larger farms should be the first target for selling PRRS vaccine. The present results indicate that affected farmers show a much higher WTP for the PRRS vaccine and, due to their PRRS experience, are eager to administer the potentially highly effective PRRS vaccine. On the other hand, non-affected farmers value the culling subsidy more, and are more likely to avoid the uncertainty of PRRS infection after vaccination. 15 There is a close relationship between the poverty level and the pig production in Vietnam (Zhang and Kono 2013), because pig farms in Vietnam are usually small and might not be able to afford to vaccinate their pigs. Therefore, the PRRS vaccine may target relatively larger farms for selling their product. According to our discussion with key individuals from Hanoi University of Agriculture, the cost of a vaccine produced in Vietnam may be higher than that of the imported vaccine if the production quantity is small. Strong government support is needed to increase quantity and to decrease the unit cost. A similar study by Kairu-Wanyoike et al. (2013) indicated Kenyan dairy farmers prefer the bovine pleuropneumonia vaccine, which is vaccinated by the government. The extension study Kairu-Wanyoike et al. (2014) also indicated that farmers’ WTP for bovine pleuropneumonia vaccination is higher than the market price, and abundant government compensation (subsidy) has to be provided to help farmers purchase vaccine. In the case of U.K. (Bennett and Balcombe, 2012), farmers preferred insurance combined with tuberculosis cattle vaccine, for recovering the financial loss from bovine tuberculosis if the disease occurred after they vaccinated their cattle. On the other hand, unlike Kenya and U.K., in the case of PRRS in Vietnam, PRRS is a highly contagious disease with a high mortality rate, and the government budget for animal disease control is limited, so the government support only for culling subsidy is appropriate in Vietnam. To encourage vaccine producers to develop and produce a more effective deterrent to PRRS in Vietnam, only the certification we mention above is not sufficient. In addition, if the government can provide the culling subsidy only for the farms with the certification (who vaccinated their pigs), more farms would be likely to buy this vaccine. This will help vaccine producers develop an effective vaccine for the PRRS outbreak in Vietnam. Additionally, most farmers either did not know that a PRRS vaccine exists or did not think they needed the vaccine. Furthermore, Vietnamese farmers tend to follow the advice of local veterinarians, most of whom do not have sufficient knowledge to encourage PRRS control (Table 5). Therefore, more explanation of PRRS vaccination to farmers by local veterinarians is
15 According to the data shown in Figure 2 and Table 5, although non-affected farmers have relatively less knowledge about PRRS, they feel that PRRS is a big threat to the entire pig industry, but is less of a threat to their farms. This can be considered to be one of the reasons why some non-affected farmers were unfamiliar with the PRRS vaccine and why none of them adopted it (Table 5).
2015 International Food and Agribusiness Management Association (IFAMA). All rights reserved
90
Zhang et al. Volume 18 Issue 2, 2015
needed. To accomplish this, greater government attention is essential. To help disseminate the vaccine, as suggested by the results shown in Figure 2, we recommend a training seminar with an explanation of the PRRS vaccine, government support for vaccination, and instruction on the disease. Another problem of PRRS vaccine diffusion in Vietnam is that the performance of veterinary services is restricted by poor existing infrastructure or a lack of infrastructure in some underdeveloped areas. For example, the attenuated live vaccine must be kept chilled, which may be difficult or costly where infrastructure is limited. Further research is necessary to design an appropriate PRRS vaccination program, and to determine the costs and benefits of PRRS vaccination in Vietnam. Such research might also provide insight into the social impact of a PRRS vaccination program on pig production in Vietnam. Acknowledgements The authors would like to thank the very substantial contributions of the editors and two anonymous referees in improving the paper. This work was supported by China Agriculture Research System (CARS-36). Lastly, the significant contribution of the Dr. Huiwu GUO and Ms.Yingxin GUO (Guangdong Academy of Decision Science, Sun Yat-sen University), is gratefully appreciated. References An, T., Z. Tian, Y. Xiao, R. Li, J. Peng and T. Wei. 2010. Origin of highly pathogenic porcine
reproductive and respiratory syndrome virus, China. Letter 16: 365-367. Bateman, I.J., R.T. Carson, M. Hanemann, N. Hanley, T. Hett, M. Jones-Lee, G. Loomes, E.
Ozdemiroglu, D.W. Pearce, R. Sugden, and J. Swanson. 2002. Economic valuation with stated preference techniques: a manual. Edward Elgar, Cheltenham.
Bennett, R. and K. Balcombe. 2012. Farmers’ willingness to pay for a tuberculosis cattle
vaccine. Journal of Agricultural Economics 63: 408-424. FAOSTAT (Statistics Division of Food and Agriculture Organization). 2015. Production Data of
Livestock Primary. http://faostat3.fao.org/download/ [accessed March 1, 2015]. Greene, W.H. and D. A. Hensher. 2003. A latent class model for discrete choice analysis:
contrasts with mixed logit. Transportation Research Part B 37: 681-698. Kairu-Wanyoike, S.W., S. Kaitibie, N.M. Taylor, G. K. Gitau, C. Heffernan, C. Schnier, H.
Kiara, E. Taracha, and D. McKeever. 2013. Exploring farmer preferences for contagious bovine pleuropneumonia vaccination: A case study of Narok District of Kenya. Preventive Veterinary Medicine 110: 356-369.
2015 International Food and Agribusiness Management Association (IFAMA). All rights reserved
91
Zhang et al. Volume 18 Issue 2, 2015
Kairu-Wanyoike, S.W., S. Kaitibie, C. Heffernan, N.M. Taylor, G. K. Gitau, H. Kiara and D. McKeever. 2014. Willingness to pay for contagious bovine pleuropneumonia vaccination in Narok South District of Kenya. Preventive Veterinary Medicine 115:130-142.
Lancaster, K. 1966. A new approach to consumer theory. Journal of Political Economy 74: 132-
157. Lemke, U., M. Mergenthaler, R. Rössler, L. Huyen, P. Herold, B. Kaufmann, and A.
ValleZárate. 2008. Pig production in Vietnam – a review. CAB Reviews: Perspectives in Agriculture, Veterinary Science, Nutrition and Natural Resources 23:1-15.
Louviere, J., D. A. Hensher, and J. Swait. 2000. Stated choice methods: analysis and application.
Cambridge University Press, Cambridge. McFadden, D. 1973. Conditional logit analysis of qualitative choice behavior. In: Frontiers in
Econometrics, (Ed.): Zarembke, P. Academic Press, New York. 447-470. OIE (World Organization for Animal Health). 2015. World Animal Health Information Database
Interface. http://www.oie.int/wahis_2/public/wahid.php/ [accessed March 1, 2015]. Otieno, D.J., E. Ruto, and L. Hubbard. 2011. Cattle farmers’ preferences for disease-free zones
in Kenya: an application of the choice experiment method. Journal of Agricultural Economics.62: 207-224.
Revelt, D. and K. Train. 1998. Mixed logit with repeated choices: households’ choices of
appliance efficiency level. The Review of Economics and Statistics 80: 647-657. United States Department of Agriculture (USDA). 2007. Emerging disease notice- porcine
reproductive and respiratory syndrome (PRRS) in Vietnam and China. Info Sheet, August 2007, Animal and Plant Health Inspection Service.
Zhang, H. and H. Kono. 2012. Economic impacts of porcine respective and respiratory syndrome
(PRRS) outbreak in Vietnam pig production. Tropical Agricultural Research 23:152-159. Zhang, H., H. Kono, and S. Kubota. 2013a. Evaluation of the target market for HACCP certified
pork in China and potential effects on the pork industry. The Frontiers of Agricultural Economics 17(1):13-19.
Zhang, H., H. Kono, S. Kubota, N.T.M. Hoa, and N.V. Hung. 2013b. Epidemiologic and
economic analysis of porcine HP-PRRS outbreak control in Vietnam. Journal of Agricultural Development Studies 23:31- 42.
Zhang, H., H. Kono, H. Makita, and S. Kubota. 2014. An integrated epidemiological-economic
analysis of HP-PRRS control strategies in Vietnam. Japanese Journal of Rural Economics16: 57-64.
2015 International Food and Agribusiness Management Association (IFAMA). All rights reserved
92
International Food and Agribusiness Management Review Volume 18 Issue 2, 2015
Millennials Leaning In: Can Women in Agribusiness Benefit from
Technology and Social Collaboration in Higher Education?
Xiaowei Caia, Lindsey Higginsb, and Marianne McGarry Wolf c
a Associate Professor, Agribusiness Department, California Polytechnic State University, San Luis Obispo, California, 93407,USA
b Assistant Professor, Agribusiness Department, California Polytechnic State University,
San Luis Obispo, California, 93407, USA
c Professor, Wine and Viticulture Department, California Polytechnic State University, San Luis Obispo, California, 93407,USA
Abstract A gender gap exists in both pay differences and leadership roles. Higher education plays a role in preparing the next generation to close this gender gap. The tools employed in higher education have been shown to impact student confidence and confidence going into their careers. As a means to identifying differences in the impact of a web-based course discussion between male and female students, a survey of 408 Agribusiness students was conducted. Compared with males, the online course discussion had more impact on female students in terms of their knowledge of current events, interest in the course topics, and confidence going into the job interviews. In addition, female students attributed the web-based discussion to improved written communication skills. Use of social technology with current content could potentially empower the female students to enhance learning and gain confidence. Keywords: agribusiness students, social media, online discussion, gender, women
Corresponding author: Tel: + 1. 805.756.5011
Email: X. Cai: [email protected] L. Higgins: [email protected] M. McGarry Wolf: [email protected]
2015 International Food and Agribusiness Management Association (IFAMA). All rights reserved
93
Cai, Higgins, and McGarry Wolf Volume 18 Issue 2, 2015
Introduction Women account for nearly half of the labor force in the US but earn less than men for each hour worked (Pew 2014). In 1964, women earned $0.59 for every dollar paid to men (US Census Bureau 2012). Over time, the difference between male and female wages has narrowed. This narrowing of the wage gap is often attributed to women’s educational achievements, participation in the labor force, and presence in lucrative occupations (Pew 2014). Today, as women enter the workforce there is a decent chance of parity in wages. However, men’s wages increase at a rate faster than women’s, leading to full-time working women earning, on average, just 77% of what their male counterparts earn (US Census Bureau 2012). To make up the wage difference, women would have to work an extra 60 days each year to make what men do. Education is one factor that is often used to explain differential earnings. However, a study conducted among the alumni of an Agribusiness department at a US university found that a gender gap exists for their alumni, suggesting that education is not the only explanatory factor. In that particular study, females earned 19% less than males that graduated from the same program (Qenani-Petrela and Wolf 2007). Women outnumber men in higher education degrees obtained, yet the differences in wage are still apparent (National Center for Education Statistics 2012). Blau and Kahn (2007) found that education can ease wage disparity by up to 7%, but that educational attainment and job characteristics do not fully explain the wage gap. One contributing factor to the gender gap is that women are less likely to ask for a raise and to engage in negotiations (Bohnet and Greig 2007). Unlike the wage gap, the power gap between genders has remained relatively unchanged in the last 20 years and women are continually underrepresented in business leadership positions (Catalyst 2010, Catalyst 2009, Foust-Cummings and Pomeroy 2008, Eagly and Carli 2007). In 2014, women held CEO positions in just 24 of the Fortune 500 companies (Catalyst 2014). Research suggests that compared to men, women are less self-assured, are less likely to speak, are less likely to promote their accomplishments, and are more likely to be dismissive in regard to praise received (Sandberg 2013; Voyles and Williams 2004). Women are less likely to engage in interruptive behavior during conversations, a trait often attributed to perceived confidence (Zimmerman and West 1975, Case 1988, Craig and Pitts 1990). Ely (1995) found that more than half of women in male-dominated firms were unlikely to question their firm’s negative views of women and internalize the firm’s depiction of women as depictions of themselves. Millennials are those born, roughly speaking, in the 1980s and 1990s. As Millennial women progress through their careers, they will likely be met with wages that diverge further and further from their male counterparts (Pew 2014). However, relative to prior generations, Millennial women recognize this gap and are more likely to indicate that changes still need to be made about equality in the workplace (Pew 2014). Sheryl Sandberg’s bestselling book “Lean In: Women, Work, and the Will to Lead” has sparked the “Lean In Era” and created a renewed interest and emphasis on gender equality in the workplace (Pew 2014). More than 75% of the global workforce will be made up of Millennials by 2025, creating an opportunity for Millennials to shape the gender disparity in the workforce as they “Lean In” through their careers (Winograd and Hais 2014).
2015 International Food and Agribusiness Management Association (IFAMA). All rights reserved
94
Cai, Higgins, and McGarry Wolf Volume 18 Issue 2, 2015
Pew Research (2014) suggests that Millennials appear to be particularly interested in narrowing the gender disparities in the workforce. Higher education plays an important role in preparing students for their careers and providing skill sets that will allow them to succeed professionally. Individual confidence and assertiveness are often used to explain the gender leadership gaps in business (Pesonen, Tienari, and Vanhala 2009, Babcock and Laschever 2003). Heath, Flynn, and Holt (2014) suggest that preparation is a key to overcoming the tendency of women to hold back in business meetings. Questions still remain regarding the role of higher education in preparing students (male and female) with the skills necessary for career success. The objective of this research is to examine if the use of one higher education instruction tool has an impact on females’ confidence within the classroom environment and their confidence going into a job interview. The psychology literature suggests a relationship between confidence during higher education and positive interview outcomes (Steffy and Shaw 1989). Perhaps, if confidence can be created such that female students are more self-assured in the classroom, perhaps the foundation obtained during the educational experience will then carryover into obtaining positive outcomes from job interviews. Confidence among employees is further shown to be positively related to occupational prestige and income, thus elevating the importance of building confidence in our students, even if we cannot directly connect confidence in the classroom to confidence in a later career (Kammeyer-Mueller, Judge, and Piccolo 2007). In this research, the objective was isolated to the use of a web-based discussion board to discuss current events that related to course concepts. Through online, social discussion outside of the classroom, female students can gain experience in voicing their opinions. Will this experience translate into enhanced learning and improved confidence going into job interviews? Literature Review While gender differences are apparent in business, they are also apparent in the higher education classroom (Kaenzig, Hyatt, and Anderson 2007, Gallos 1993). Higher education tends to reward characteristics typically associated with masculinity, including assertiveness, individualism, boldness, and competitiveness (Burke 2013, Sadker and Sadker 1986, Brooks 1982). Male students are more likely to participate in class discussion (Brazelton 1998). In addition, classroom success may be different between genders. Particularly in the case of economics education, gender has been one of the most commonly studied student characteristics, with research suggesting that female students are less likely to develop the same level of economic understanding as male students (Brasfield, McCoy, and Milkman 2013). The benefits of discussion as an educational tool have a long history of supporting research and are thought to improve communication skills, cooperative learning, critical thinking, and overall learning (Dallimore, Hertenstein, and Platt 2008; Prince 2004; Bender 2003). In particular, discussion plays an important role in Agribusiness capstone courses (Hall et al. 2003). With the availability of free and subscription-based web discussion tools designed for education, web-based discussions serve a valuable way to extend the discussion outside of class meetings (Hamann, Pollock, and Wilson 2012, Pettijohn and Pettijohn 2007). Web-based discussions provide an opportunity for students that are hesitant to speak-up in a classroom to build confidence. Ware (2004) demonstrated the value of online discussion boards in building the
2015 International Food and Agribusiness Management Association (IFAMA). All rights reserved
95
Cai, Higgins, and McGarry Wolf Volume 18 Issue 2, 2015
confidence of English as a Second Language (ESL) students and Skinner (2010) demonstrated their value in the adjustment of international students to British university life. Further evidence suggests that women can build confidence through communication in women-only online communities that will better prepare them for communication in mixed-gender online communities (King 2000). Social media use by college students has been a source of significant research in recent years. However, fewer studies focus on the use of social media as a classroom tool and, even fewer, on differences in outcomes from educational uses of social media based on gender. Nevertheless, online social interaction has been shown to have a valuable role in the educational process (Alrahmi, Othman, and Musa 2014, So and Brush 2008). Gender differences carry over into the online environment. Bostock and Wu (2005) found gender differences in the online discussion behavior of students in a large online course. Female students posted to the online discussion board more frequently and were more likely to indicate a preference for the online discussion environment. Through coding of 700 online messages, Guiller and Durndell (2006) found that female students were more likely to make online comments that were in agreement with a fellow student, while male students were more likely to disagree and pose an alternative view. Female students prefer online discussion formats as they provide, to a certain extent, anonymity (Sullivan 2002). It has been well documented that gender communication differences are similar in an online environment to a face-to-face environment (Guiller and Durndell 2006, Herring 2003, Sussman and Tyson 2000). However, there is little research to show how having this more comfortable environment for discussion affects face-to-face communication, especially for women. Peck (2012) showed some crossover between online and face-to-face interactions and attributed it to an improved sense of community through an online discussion tool. Although the research wasn’t focused on communication specifically, Stricker, Weibel, and Wissmath (2006) found that students that voluntarily participated in a virtual learning environment to supplement class material, showed improved classroom performance. Similar research confirms the value of supplemental online course environments on student success (Francis and Shannon 2013, Mogus, Djurdjevic, and Suvak 2012). Recent research among 232 Agribusiness students revealed that using a social media platform that delivers relevant current content and seamlessly encourages conversations about the content increased engagement among students (Cai, Higgins, and Wolf 2013). Students reported learning from classmates’ comments, a better understanding of theoretical principles, improved critical thinking and improved written communication skills (Cai, Higgins, and Wolf 2013). Student interest in social media newsgroups is further confirmed through research by Clawson, Deen, and Oxley (2002). Data and Methods Five Agribusiness courses at a large university in the Western US were selected for this research. These courses include agricultural economics, food and fiber marketing, marketing research, marketing planning, and branded wine marketing. They were selected as a convenience sample,
2015 International Food and Agribusiness Management Association (IFAMA). All rights reserved
96
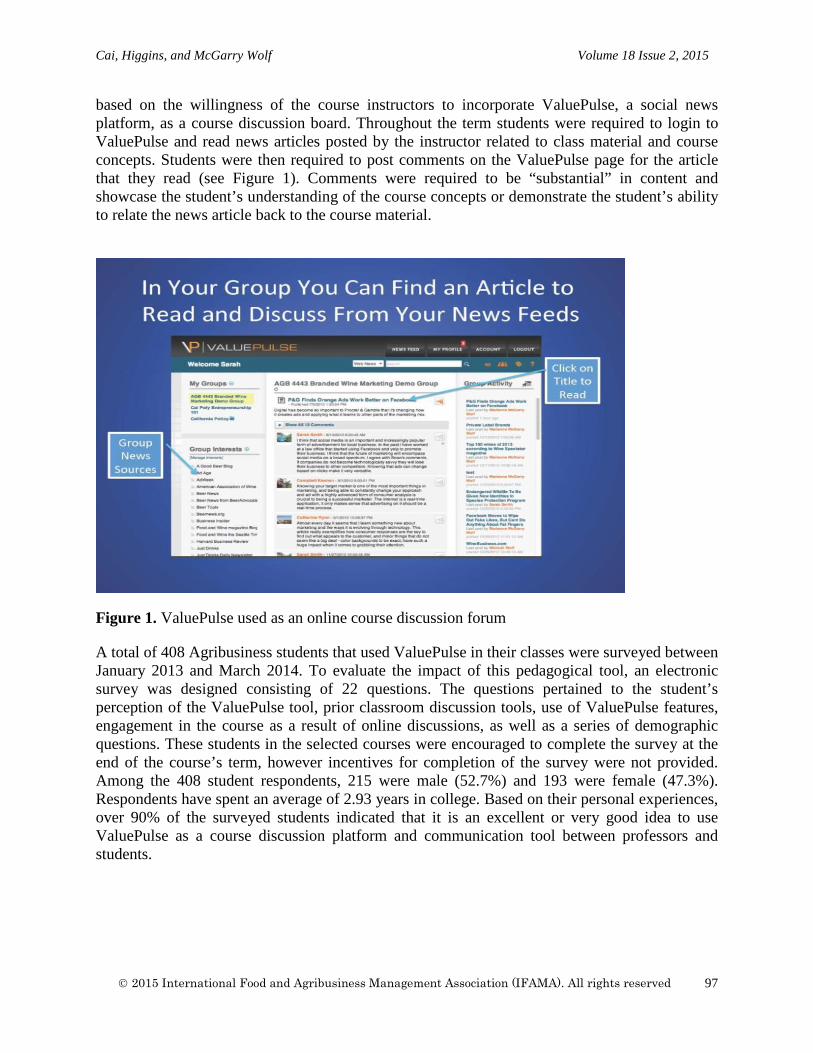
Cai, Higgins, and McGarry Wolf Volume 18 Issue 2, 2015
based on the willingness of the course instructors to incorporate ValuePulse, a social news platform, as a course discussion board. Throughout the term students were required to login to ValuePulse and read news articles posted by the instructor related to class material and course concepts. Students were then required to post comments on the ValuePulse page for the article that they read (see Figure 1). Comments were required to be “substantial” in content and showcase the student’s understanding of the course concepts or demonstrate the student’s ability to relate the news article back to the course material.
Figure 1. ValuePulse used as an online course discussion forum
A total of 408 Agribusiness students that used ValuePulse in their classes were surveyed between January 2013 and March 2014. To evaluate the impact of this pedagogical tool, an electronic survey was designed consisting of 22 questions. The questions pertained to the student’s perception of the ValuePulse tool, prior classroom discussion tools, use of ValuePulse features, engagement in the course as a result of online discussions, as well as a series of demographic questions. These students in the selected courses were encouraged to complete the survey at the end of the course’s term, however incentives for completion of the survey were not provided. Among the 408 student respondents, 215 were male (52.7%) and 193 were female (47.3%). Respondents have spent an average of 2.93 years in college. Based on their personal experiences, over 90% of the surveyed students indicated that it is an excellent or very good idea to use ValuePulse as a course discussion platform and communication tool between professors and students.
2015 International Food and Agribusiness Management Association (IFAMA). All rights reserved
97
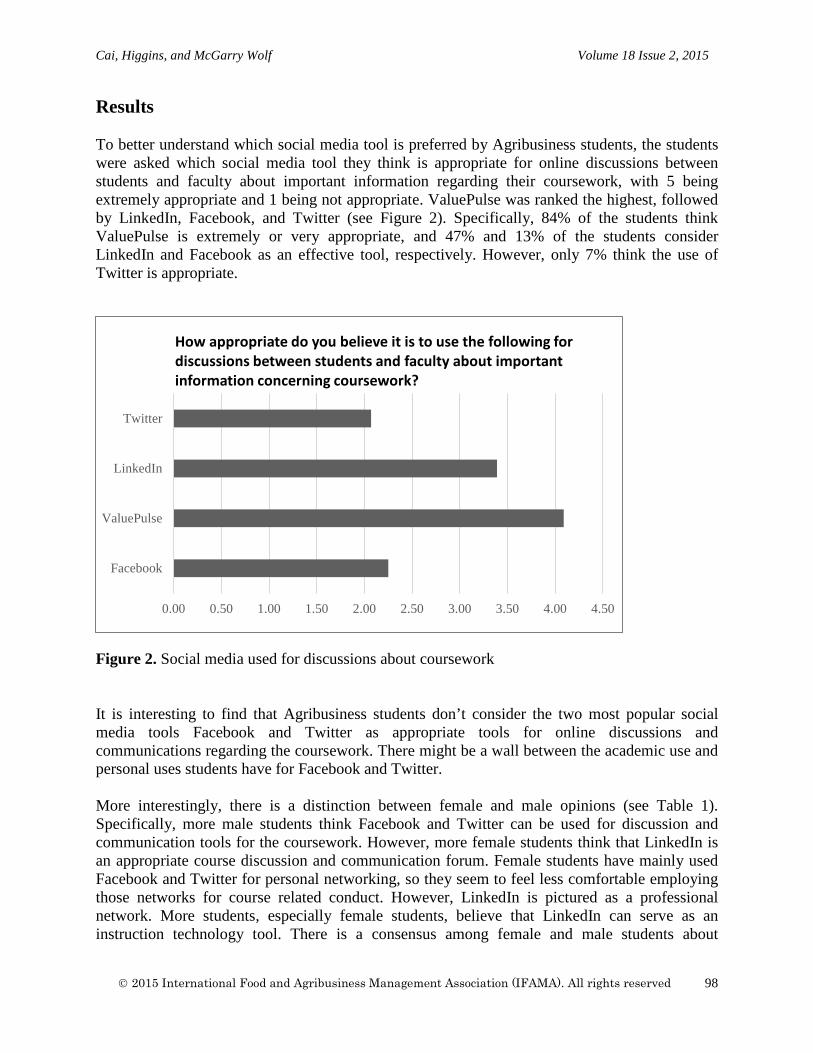
Cai, Higgins, and McGarry Wolf Volume 18 Issue 2, 2015
Results To better understand which social media tool is preferred by Agribusiness students, the students were asked which social media tool they think is appropriate for online discussions between students and faculty about important information regarding their coursework, with 5 being extremely appropriate and 1 being not appropriate. ValuePulse was ranked the highest, followed by LinkedIn, Facebook, and Twitter (see Figure 2). Specifically, 84% of the students think ValuePulse is extremely or very appropriate, and 47% and 13% of the students consider LinkedIn and Facebook as an effective tool, respectively. However, only 7% think the use of Twitter is appropriate.
Figure 2. Social media used for discussions about coursework It is interesting to find that Agribusiness students don’t consider the two most popular social media tools Facebook and Twitter as appropriate tools for online discussions and communications regarding the coursework. There might be a wall between the academic use and personal uses students have for Facebook and Twitter. More interestingly, there is a distinction between female and male opinions (see Table 1). Specifically, more male students think Facebook and Twitter can be used for discussion and communication tools for the coursework. However, more female students think that LinkedIn is an appropriate course discussion and communication forum. Female students have mainly used Facebook and Twitter for personal networking, so they seem to feel less comfortable employing those networks for course related conduct. However, LinkedIn is pictured as a professional network. More students, especially female students, believe that LinkedIn can serve as an instruction technology tool. There is a consensus among female and male students about
0.00 0.50 1.00 1.50 2.00 2.50 3.00 3.50 4.00 4.50
ValuePulse
How appropriate do you believe it is to use the following for discussions between students and faculty about important information concerning coursework?
2015 International Food and Agribusiness Management Association (IFAMA). All rights reserved
98
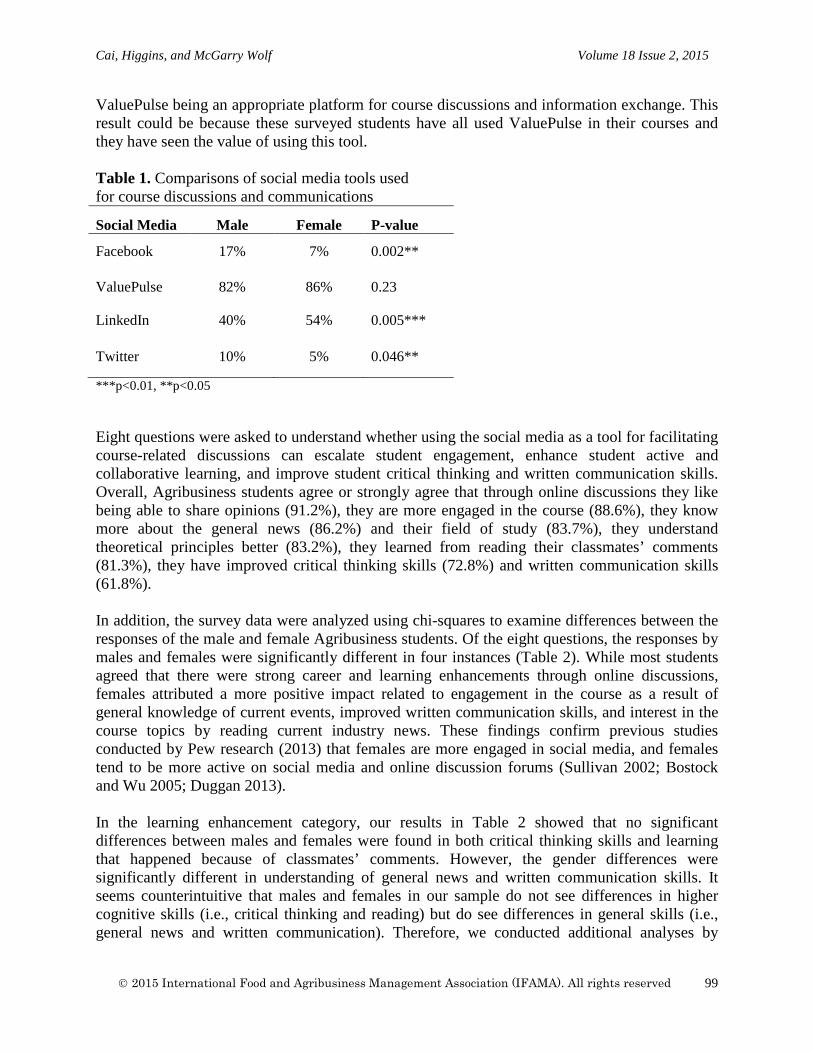
Cai, Higgins, and McGarry Wolf Volume 18 Issue 2, 2015
ValuePulse being an appropriate platform for course discussions and information exchange. This result could be because these surveyed students have all used ValuePulse in their courses and they have seen the value of using this tool. Table 1. Comparisons of social media tools used for course discussions and communications
Social Media Male Female P-value
Facebook 17% 7% 0.002**
ValuePulse 82% 86% 0.23
LinkedIn 40% 54% 0.005***
Twitter 10% 5% 0.046**
***p<0.01, **p<0.05
Eight questions were asked to understand whether using the social media as a tool for facilitating course-related discussions can escalate student engagement, enhance student active and collaborative learning, and improve student critical thinking and written communication skills. Overall, Agribusiness students agree or strongly agree that through online discussions they like being able to share opinions (91.2%), they are more engaged in the course (88.6%), they know more about the general news (86.2%) and their field of study (83.7%), they understand theoretical principles better (83.2%), they learned from reading their classmates’ comments (81.3%), they have improved critical thinking skills (72.8%) and written communication skills (61.8%). In addition, the survey data were analyzed using chi-squares to examine differences between the responses of the male and female Agribusiness students. Of the eight questions, the responses by males and females were significantly different in four instances (Table 2). While most students agreed that there were strong career and learning enhancements through online discussions, females attributed a more positive impact related to engagement in the course as a result of general knowledge of current events, improved written communication skills, and interest in the course topics by reading current industry news. These findings confirm previous studies conducted by Pew research (2013) that females are more engaged in social media, and females tend to be more active on social media and online discussion forums (Sullivan 2002; Bostock and Wu 2005; Duggan 2013). In the learning enhancement category, our results in Table 2 showed that no significant differences between males and females were found in both critical thinking skills and learning that happened because of classmates’ comments. However, the gender differences were significantly different in understanding of general news and written communication skills. It seems counterintuitive that males and females in our sample do not see differences in higher cognitive skills (i.e., critical thinking and reading) but do see differences in general skills (i.e., general news and written communication). Therefore, we conducted additional analyses by
2015 International Food and Agribusiness Management Association (IFAMA). All rights reserved
99
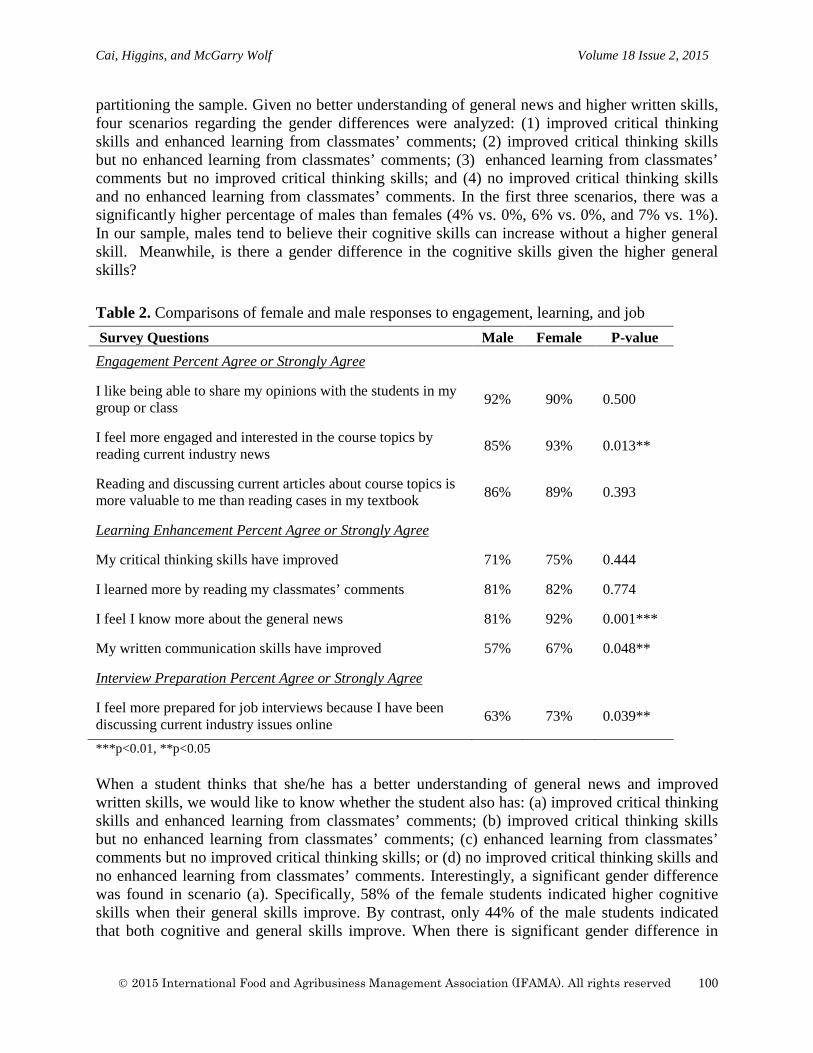
Cai, Higgins, and McGarry Wolf Volume 18 Issue 2, 2015
partitioning the sample. Given no better understanding of general news and higher written skills, four scenarios regarding the gender differences were analyzed: (1) improved critical thinking skills and enhanced learning from classmates’ comments; (2) improved critical thinking skills but no enhanced learning from classmates’ comments; (3) enhanced learning from classmates’ comments but no improved critical thinking skills; and (4) no improved critical thinking skills and no enhanced learning from classmates’ comments. In the first three scenarios, there was a significantly higher percentage of males than females (4% vs. 0%, 6% vs. 0%, and 7% vs. 1%). In our sample, males tend to believe their cognitive skills can increase without a higher general skill. Meanwhile, is there a gender difference in the cognitive skills given the higher general skills? Table 2. Comparisons of female and male responses to engagement, learning, and job
***p<0.01, **p<0.05
When a student thinks that she/he has a better understanding of general news and improved written skills, we would like to know whether the student also has: (a) improved critical thinking skills and enhanced learning from classmates’ comments; (b) improved critical thinking skills but no enhanced learning from classmates’ comments; (c) enhanced learning from classmates’ comments but no improved critical thinking skills; or (d) no improved critical thinking skills and no enhanced learning from classmates’ comments. Interestingly, a significant gender difference was found in scenario (a). Specifically, 58% of the female students indicated higher cognitive skills when their general skills improve. By contrast, only 44% of the male students indicated that both cognitive and general skills improve. When there is significant gender difference in
Survey Questions Male Female P-value Engagement Percent Agree or Strongly Agree
I like being able to share my opinions with the students in my group or class 92% 90% 0.500
I feel more engaged and interested in the course topics by reading current industry news 85% 93% 0.013**
Reading and discussing current articles about course topics is more valuable to me than reading cases in my textbook 86% 89% 0.393
Learning Enhancement Percent Agree or Strongly Agree
My critical thinking skills have improved 71% 75% 0.444
I learned more by reading my classmates’ comments 81% 82% 0.774
I feel I know more about the general news 81% 92% 0.001***
My written communication skills have improved 57% 67% 0.048**
Interview Preparation Percent Agree or Strongly Agree
I feel more prepared for job interviews because I have been discussing current industry issues online 63% 73% 0.039**
2015 International Food and Agribusiness Management Association (IFAMA). All rights reserved
100
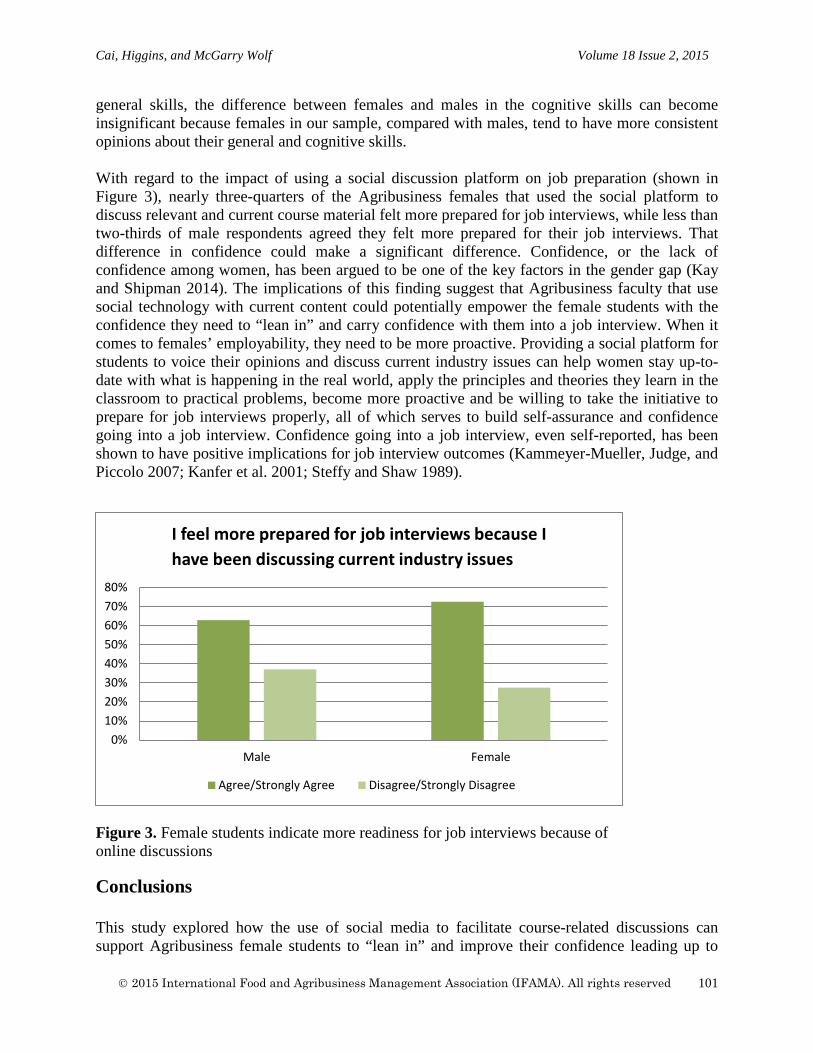
Cai, Higgins, and McGarry Wolf Volume 18 Issue 2, 2015
general skills, the difference between females and males in the cognitive skills can become insignificant because females in our sample, compared with males, tend to have more consistent opinions about their general and cognitive skills. With regard to the impact of using a social discussion platform on job preparation (shown in Figure 3), nearly three-quarters of the Agribusiness females that used the social platform to discuss relevant and current course material felt more prepared for job interviews, while less than two-thirds of male respondents agreed they felt more prepared for their job interviews. That difference in confidence could make a significant difference. Confidence, or the lack of confidence among women, has been argued to be one of the key factors in the gender gap (Kay and Shipman 2014). The implications of this finding suggest that Agribusiness faculty that use social technology with current content could potentially empower the female students with the confidence they need to “lean in” and carry confidence with them into a job interview. When it comes to females’ employability, they need to be more proactive. Providing a social platform for students to voice their opinions and discuss current industry issues can help women stay up-to-date with what is happening in the real world, apply the principles and theories they learn in the classroom to practical problems, become more proactive and be willing to take the initiative to prepare for job interviews properly, all of which serves to build self-assurance and confidence going into a job interview. Confidence going into a job interview, even self-reported, has been shown to have positive implications for job interview outcomes (Kammeyer-Mueller, Judge, and Piccolo 2007; Kanfer et al. 2001; Steffy and Shaw 1989).
Figure 3. Female students indicate more readiness for job interviews because of online discussions Conclusions This study explored how the use of social media to facilitate course-related discussions can support Agribusiness female students to “lean in” and improve their confidence leading up to
0%10%20%30%40%50%60%70%80%
Male Female
I feel more prepared for job interviews because I have been discussing current industry issues
Agree/Strongly Agree Disagree/Strongly Disagree
2015 International Food and Agribusiness Management Association (IFAMA). All rights reserved
101
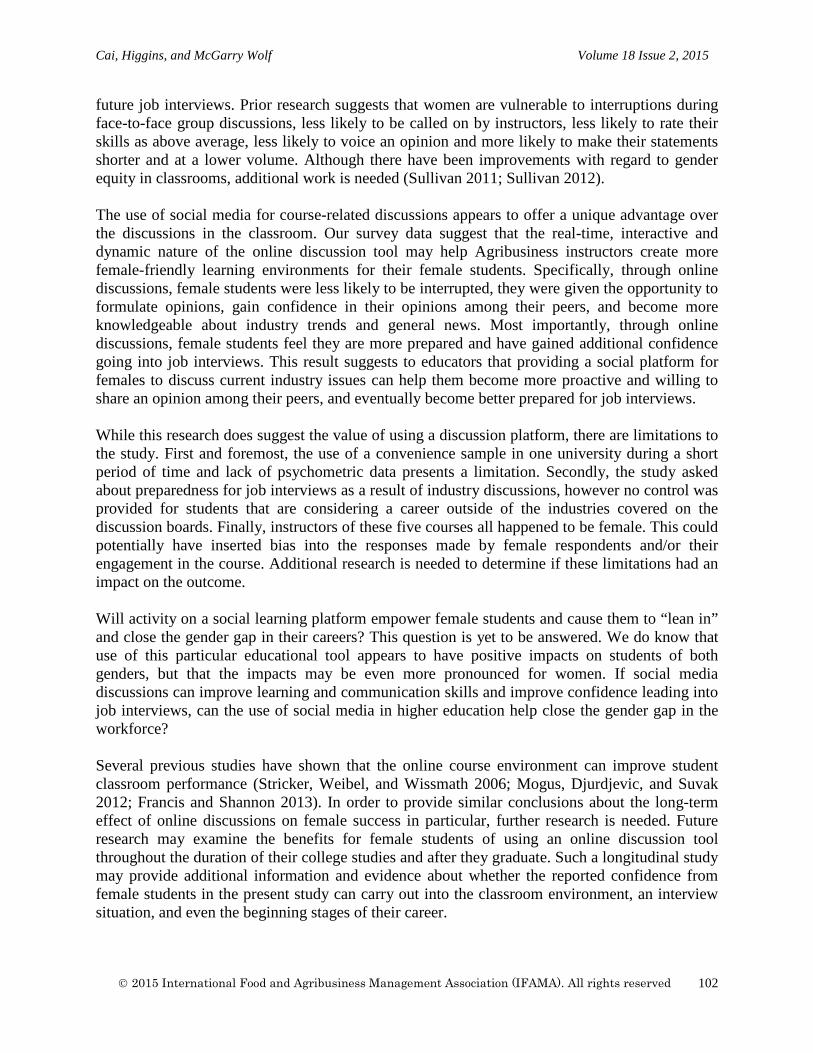
Cai, Higgins, and McGarry Wolf Volume 18 Issue 2, 2015
future job interviews. Prior research suggests that women are vulnerable to interruptions during face-to-face group discussions, less likely to be called on by instructors, less likely to rate their skills as above average, less likely to voice an opinion and more likely to make their statements shorter and at a lower volume. Although there have been improvements with regard to gender equity in classrooms, additional work is needed (Sullivan 2011; Sullivan 2012). The use of social media for course-related discussions appears to offer a unique advantage over the discussions in the classroom. Our survey data suggest that the real-time, interactive and dynamic nature of the online discussion tool may help Agribusiness instructors create more female-friendly learning environments for their female students. Specifically, through online discussions, female students were less likely to be interrupted, they were given the opportunity to formulate opinions, gain confidence in their opinions among their peers, and become more knowledgeable about industry trends and general news. Most importantly, through online discussions, female students feel they are more prepared and have gained additional confidence going into job interviews. This result suggests to educators that providing a social platform for females to discuss current industry issues can help them become more proactive and willing to share an opinion among their peers, and eventually become better prepared for job interviews. While this research does suggest the value of using a discussion platform, there are limitations to the study. First and foremost, the use of a convenience sample in one university during a short period of time and lack of psychometric data presents a limitation. Secondly, the study asked about preparedness for job interviews as a result of industry discussions, however no control was provided for students that are considering a career outside of the industries covered on the discussion boards. Finally, instructors of these five courses all happened to be female. This could potentially have inserted bias into the responses made by female respondents and/or their engagement in the course. Additional research is needed to determine if these limitations had an impact on the outcome. Will activity on a social learning platform empower female students and cause them to “lean in” and close the gender gap in their careers? This question is yet to be answered. We do know that use of this particular educational tool appears to have positive impacts on students of both genders, but that the impacts may be even more pronounced for women. If social media discussions can improve learning and communication skills and improve confidence leading into job interviews, can the use of social media in higher education help close the gender gap in the workforce? Several previous studies have shown that the online course environment can improve student classroom performance (Stricker, Weibel, and Wissmath 2006; Mogus, Djurdjevic, and Suvak 2012; Francis and Shannon 2013). In order to provide similar conclusions about the long-term effect of online discussions on female success in particular, further research is needed. Future research may examine the benefits for female students of using an online discussion tool throughout the duration of their college studies and after they graduate. Such a longitudinal study may provide additional information and evidence about whether the reported confidence from female students in the present study can carry out into the classroom environment, an interview situation, and even the beginning stages of their career.
2015 International Food and Agribusiness Management Association (IFAMA). All rights reserved
102

Cai, Higgins, and McGarry Wolf Volume 18 Issue 2, 2015
References Alrahmi, W. M., M. S. Othman, and M. A. Musa. 2014. The Improvement of Students’
Academic Performance by Using Social Media through Collaborative Learning in Malaysian Higher Education. Asian Social Science 10(8): 210-221.
Babcock, L. and S. Laschever. 2003. Women’s Don’t Ask: Negotiation and the Gender
Divide. Princeton, NJ: Princeton University Press. Bender, T. 2003. Discussion-Based Online Teaching to Enhance Student Learning. Sterling, VA:
Stylus. Blau, F. D. and L. M. Kahn. 2007. The Gender Pay Gap: Have Women Gone as Far as They
Can? Academy of Management Perceptions. February 2007. 7-23. Bostock, S. and L. Wu. 2005. Gender in Student Online Discussions. Innovations in Education
and Teaching International 42(1): 73-85. Bohnet, I. and F. Greig. 2007. Gender Matters in Workplace Decisions. Negotiation 10 (6): 4-6. Brasfield, D. W., J. P. McCoy, and M. I. Milkman. 2013. Gender, Measurement Choice and
Student Achievement in Introductory Economics. Journal of Economics and Economic Education Research 14(3): 73-88.
Brazelton, J. 1998. Are Male Accounting Students Favored? Practical Accountant 31(11): 10. Brooks, V. R. 1982. Sex Differences in Student Dominance Behavior in Female and Male
Professors’ Classrooms. Sex Roles 8(7): 683-690. Burke, P. J. 2013. Formations of Masculinity and Higher Education Pedagogies. Culture, Society
and Masculinities 5(2): 109-126. Cai, X., L. Higgins, and M. M. Wolf. 2013. Using a Social News and Discussion Forum to
Engage Students in Agricultural Economics and Marketing. Poster presented at the AAEA and CAES Joint Annual Meeting, Washington, DC, August. http://ageconsearch .umn.edu/ bitstream/ 149987/2/AAEA%20poster%202192.pdf [accessed July 20, 2014]
Case, S. S. 1988. Cultural Differences not Deficiencies: An Analysis of Managerial Women’s
Language. In Women’s careers: Pathways and Pitfalls, edited by S. Rose & L. Larwood 41-63. New York: Praeger.
Catalyst. 2009. Catalyst Census: Fortune 500 Women Executive Officers and Top Earners. New
York, Catalyst. Catalyst. 2010. Women in Management in the United States: 1950-Present. New York, Catalyst.
2015 International Food and Agribusiness Management Association (IFAMA). All rights reserved
103
Cai, Higgins, and McGarry Wolf Volume 18 Issue 2, 2015
Catalyst. 2014. Women CEOs of the Fortune 1000. New York, Catalyst. Clawson, R., R. Deen, and Z. Oxley. 2002. Online Discussions across Three Universities:
Student Participation and Pedagogy. Political Science & Politics 35(4): 713-718.
Craig, D., and M. K. Pitts. 1990. The Dynamics of Dominance in Tutorial Discussions. Linguistics 28: 125-138.
Dallimore, E. J., J. H. Hertenstein, and M. B. Platt. 2008. Using Discussion Pedagogy to
Enhance Oral and Written Communication Skills. College Teaching 56(3): 163–172. Duggan, M. 2013. It’s a Woman’s (Social Media) World. Pew Research Center. September 12.
http://www.pewresearch.org/fact-tank/2013/09/12/its-a-womans-social-media-world/ [accessed July 20, 2014]
Eagly, A.H. and L.L. Carli. 2007. Through the Labyrinth: The Truth about How Women Become
Leaders. Harvard Business School Press, Boston, MA. Kaenzig, R., E. Hyatt, and S. Anderson. 2007. Gender Differences in College of Business
Educational Experiences. Journal of Education for Business 83(2): 95-100. Ely, R. 1995. The Power in Demography: Women’s Social Constructions of Gender Identity at
Work. The Academy of Management Journal 38(3): 589-634. Foust-Cummings, H. and E. Pomeroy. 2008. Catalyst Member Benchmarking Report. New
York, Catalyst. Francis, R. and S. Shannon. 2013. Engaging with Blended Learning to Improve Students’
Learning Outcomes. European Journal of Engineering Education 38(4): 359-369. Francis, B., B. Read, L. Melling, and J. Robson. 2003. University Lecturers' Perceptions of
Gender and Undergraduate Writing. British Journal of Sociology of Education 24(3): 357-373.
Gallos, J. 1993. Women’s Experiences and Ways of Knowing: Implications for Teaching and
Learning in the Organizational Behavior Classroom. Journal of Management Education 17(1): 7-26.
Garside, C. 1996. Look Who’s Talking: A Comparison of Lecture and Group Discussion
Teaching Strategies in Developing Critical Thinking Skills. Communication Education 45(3): 212–227.
Guiller, J. and A. Durndell. 2006. I Totally Agree with You’: Gender Interactions in Educational
Online Discussion Groups. Journal of Computer Assisted Learning 22: 368–381.
2015 International Food and Agribusiness Management Association (IFAMA). All rights reserved
104
Cai, Higgins, and McGarry Wolf Volume 18 Issue 2, 2015
Hall, C., G. Fairchild, G. Baker, T. Taylor, and K. Litzenberg. 2003. Agribusiness Capstone Courses Design: Objectives and Strategies. International Food and Agribusiness Management Review 6(4): 47-62.
Hamann, K., P. Pollock, and B. Wilson. 2012. Assessing Student Perceptions of the Benefits of
Discussions in Small-Group, Large-Class, and Online Learning Contexts. College Teaching 60: 65-75.
Heath, K., J. Flynn, and M. Holt. 2014. Managing Yourself: Women, Find your Voice. Harvard
Business Review. Herring S. C. 2003. Gender and Power in Online Communication. In The Handbook of Language
and Gender, edited by J. Holmes and M. Meyerhoff, 202-228. Blackwell, Oxford. Kanfer, R., C. Wanberg, and T. Kantrowitz. 2001. Job Search and Employment: A Personality-
Motivational Analysis and Meta-Analytic Review. Journal of Applied Psychology 86: 837-855.
Kammeyer-Mueller, J., T. Judge, and R. Piccolo. 2007. Self-Esteem and Extrinsic Career
Success: Test of a Dynamic Model. Applied Psychology 57(2): 204-224. Kay, K. and C. Shipman. 2014. The Confidence Code: The Science and Art of Self-Assurance—
What Women Should Know. Harper Collins Publishers, New York. King, L. 2000. Gender Issues in Online Communities. Computer Professionals for Social
Responsibility Newsletter 18(1). Mogus, A. M., I. Djurdjevic, and N. Suvak. 2012. The Impact of Student Activity in Virtual
Learning Environment on Their Final Mark. Active Learning in Higher Education 13: 177-189.
National Center for Education Statistics. 2012. Digest of Education Statistics. US Department of
Education, Washington, D.C. Peck, J. 2012. Keeping It Social: Engaging Students Online and in Class. Asian Social Science
8(14): 81-90. Pesonen, S., J. Tienari, and S. Vanhala. 2009. The Boardroom Gender Paradox. Gender in
Management: An International Journal 24(5): 327 – 345. Pettijohn, T. and T. Pettijohn. 2007. Required Discussion Web Pages in Psychology Courses and
Student Outcomes. Journal of Instructional Psychology 34(4): 256-263.
2015 International Food and Agribusiness Management Association (IFAMA). All rights reserved
105
Cai, Higgins, and McGarry Wolf Volume 18 Issue 2, 2015
Pew Research Center. 2013. On Pay Gap, Millennial Women Near Parity-For Now, Despite Gains, Many See Roadblocks Ahead. Pew Research Social & Demographic Trends, December. http://www.pewsocialtrends.org/2013/12/11/on-pay-gapmillennial-women-near-parity-for-now/ [accessed June 30, 2014]
Prince, M. 2004. Does Active Learning Work? A Review of the Research. Journal of
Engineering Education 93(3): 223-232. Qenani-Petrela, E. and M. M. Wolf. 2007. Different Earnings of Agricultural Graduates New
Evidence from the Agribusiness Industry. International Food and Agribusiness Management Review 10(2): 49-66.
Sadker, M., and D. Sadker. 1986. Sexism in the Classroom: From Grade School to Graduate School. The Phi Delta Kappan 67(7): 512-515.
Sandberg, S. 2013. Lean In: Women, Work, and the Will to Lead. Knopf Doubleday Publishing
Group, New York. Skinner, B. 2010. Online Discussion: Can it Help International Students Ease into British
University Life? Journal of Studies in International Education 14(4): 335-354. So, H. J. and T. Brush. 2008. Student Perceptions of Collaborative Learning, Social Presence and
Satisfaction in a Blended Learning Environment: Relationships and Critical Factors. Computers and Education 51(1): 318-336.
Steffy, B., K. Shaw, and A. Noe. 1989. Antecedents and Consequences of Job Search Behaviors.
Journal of Vocational Behavior 35(3): 254-269. Stricker, D., D. Weibel, and B. Wissmath. 2011. Efficient Learning Using a Virtual Learning
Environment in a University Class. Computers and Education 56(2): 495-504. Sullivan, P. 2001. Gender Differences and the Online Classroom: Male and Female College
Students Evaluate Their Experiences. Community College Journal of Research and Practice 25: 805-818.
Sullivan, P. 2002. It’s Easier to Be Yourself When You Are Invisible: Female College Students
Discuss Their Online Classroom Experiences. Innovative Higher Education 37(2): 129-144.
Sussman, N. and D. Tyson. 2000. Sex and Power: Gender Differences in Computer-Mediated
Interactions. Computers in Human Behavior 16: 381-394. U.S. Census Bureau. 2012. Historical Income Tables: People. Washington, D.C.
2015 International Food and Agribusiness Management Association (IFAMA). All rights reserved
106
Cai, Higgins, and McGarry Wolf Volume 18 Issue 2, 2015
Voyles, M. and A. Williams. 2004. Gender Differences in Attributions and Behavior in a Technology Classroom. Journal of Computers in Mathematics and Science Teaching 23(3): 233-256.
Ware, P. 2004. Confidence and Competition Online: ESL Student Perspectives on Web-Based
Discussions in the Classroom. Computers and Composition 21(4): 451-468. Winograd M. and M. Hais. 2014. How Millennials Could Upend Wall Street and Corporate
America. Brookings Institute. Zimmerman, D. H. and C. West. 1975. Sex Roles, Interruptions, and Silences in Conversations.
In Language and gender: Differences in dominance, edited by B. Thorne & N. Henley, 105-129. Rowley, MA: Newbury.
2015 International Food and Agribusiness Management Association (IFAMA). All rights reserved
107

Cai, Higgins, and McGarry Wolf Volume 18 Issue 2, 2015
2015 International Food and Agribusiness Management Association (IFAMA). All rights reserved
108
International Food and Agribusiness Management Review Volume 18 Issue 2, 2015
Exploring the Role of Farmers in Short Food Supply Chains:
The Case of Italy
Luigi Mastronardia, Davide Marinob, Aurora Cavalloc, and Agostino Giannellid
a Assistant Professor, Department of Biosciences and Territory, University of Molise, Contrada Fonte Lappone, 86090, Pesche (IS), Italy
bAssociate Professor, Department of Biosciences and Territory, University of Molise,
Contrada Fonte Lappone, 86090, Pesche (IS), Italy
c Research Fellow, Department of Biosciences and Territory, University of Molise, Contrada Fonte Lappone, 86090, Pesche (IS), Italy
d Research Fellow, Department of Biosciences and Territory, University of Molise,
Contrada Fonte Lappone, 86090, Pesche (IS), Italy
Abstract The aim of this paper is to explore the role of farmers in Italy who are involved in Short Food Supply Chains (SFSCs), paying particular attention to sustainability in terms of its social, economic and environmental dimensions. Research is based upon a set of indicators linked to structural and economic aspects, and also to issues relating to employment. ANOVA and MANOVA models are used to highlight farm behaviors within SFSCs about sustainability. The analysis identified the complex nature of the relationships between farms involved in various short food supply chain schemes regarding the sustainability. While the social dimension is highly important in the case of farmers’ markets and multi-chain farms, the environmental dimension is more significant for solidarity purchasing groups and farms selling directly. The economic dimension has a key role in each of the different types. Apart from these considerations, SFSCs have a fundamental place in promoting and achieving sustainability at local level. Keywords: short food supply chains, sustainability, indicators, farmers, Italy.
Corresponding author: Tel: + 39.0874404139 Email: A. Cavallo: [email protected]
L. Mastronardi: [email protected] D. Marino: [email protected] A. Giannelli: [email protected]
2015 International Food and Agribusiness Management Association (IFAMA). All rights reserved
109
Mastronardi et al. Volume 18 Issue 2, 2015
Introduction The paper focuses on the role played by farmers in Italy who are involved in Short Food Supply Chains (SFSCs), looking in particular at social, economic and environmental aspects and at differences between the markets. A primary aim of the paper is to make a comparison between the sustainability-related performances of farms taking part in various SFSCs initiatives, in order to identify the elements that define them. Interest in the topic of the sustainability of farming involved in SFSCs is justified by the fact that they deal with some of the most topical issues within the debate on food and, particularly, the food paradox question; the problem regarding the relationship between global change, availability of natural resources and farm production; the economic and social conflicts that emerge between various players within food chains; and the issue of interaction between cities, as places of consumption, and the countryside, as places of production. An additional factor in Italy is the recent and fast-growing expansion of SFSCs, and, despite channeling only a negligible percentage of the food products sold; they are the subjects of a lively and political scientific debate, with an increasingly knowledgeable public opinion (Marino and Franco 2012; Marino et al. 2012). In this context, the comparative analysis of the sustainability performance of companies is useful for two reasons. The first reason is that SFSCs provide a very articulate scenery where co-exist different marketing patterns. Every SFSC has its own pattern where the social relation of exchange, as well as economic ones, and the attention on environmental issues looks different, because various are the purposes of people involved. The second reason is that comparative analysis of farms sustainability is a relevant issue for policy-makers who are going to boost the spread of these trade patterns in agricultural products, and to enhance their positive effects at local level and on the communities. Conceptually, a SFSC can be defined as an agro-food supply chain where there are only a few intermediaries between producer and consumer and/or a short distance, geographically, between the two (Parker 2005). In agricultural markets, SFSCs are, therefore, an alternative to traditional supply chains (Aubry et al. 2008) which refer, instead, to the itinerary followed by a product within the food farming system and concerns the set of agents (businesses and public administrations), the operations that contribute to the creation and transfer of the product to its final stage of use and the relative connected flows (Malassis and Ghersi 1995), where the main players are often wholesale dealers. Literature on the subject highlights that this approach to the agro-food supply chain is based on new metrics, no longer involving mass production, but sustainable development (Morgan and Morley 2002). Indeed, “Alternative Agro-Food Networks” were so named following the refusal of food chain players to accept and adopt the defining elements of traditional supply chains, such as excessive productivity, standardization and industrial organization (Higgings et al. 2008), placing instead a greater emphasis on other aspects, such as quality, origin and the “naturality” of agro-food production (Renting et al. 2003). In this paper, we refer to the concept of sustainability defined by the World Commission on Environment and Development (1987), which takes into account the interrelation between social,
2015 International Food and Agribusiness Management Association (IFAMA). All rights reserved
110
Mastronardi et al. Volume 18 Issue 2, 2015
environmental and economic issues. The short supply chain touches each of these three aspects of sustainability since it can “re-connect” agriculture to consumers (Curry 2002) whether socially, through dialogue and the sharing of information between the parties involved, or economically and environmentally, where agricultural resources are managed with a view of obtaining profits and maintaining public goods, respectively. Studies on the effect of SFSCs on producers have primarily looked at farmers’ markets, highlighting the various associated social, economic and environmental implications. There is, however, a large amount of literature on the subject. Some studies examine the benefits of SFSCs for agricultural businesses, especially the small farms squeezed between large industries supplying raw materials, on the one side, and the world of wholesale dealers on the other, for whom selling products directly to the end user is both a sensible and a profitable solution (Christensen 1984; Singh et al. 1991; Govindasamy et al. 1998; Brown and Miller 2008). Other works concentrate on the implications of short supply lines established at a local level for consumers, who can, therefore, access fresh, high quality produce at, on balance, relatively low prices, while at the same time re-establishing social relationships with farmers and, in general, with the entire rural world (La Trobe 2001; Lyon et al. 2009). Finally, another aspect often cited in literature, especially in studies adopting a governance-related perspective, is the positive impact of SFSCs on the environment (Murdoch and Miele 1999; DEFRA 2005). Another factor is that, at least in the European Union, public policies concerning the agricultural sector seem to have taken up the challenge of adopting a new perspective for agriculture and food production (Ilbery and Maye 2005). Public policies of the last two decades support a new agricultural model that aspires towards multi-functional, diversified activity (EC 1999 2005). This means that farms must turn towards other functions apart from those typical of food production, for example, by developing ecological, cultural and social services (Henke 2004) while, at the same time, farms are encouraged to introduce economically viable diversification initiatives and agro-environmental measures, and to shift the product processing and sales phases to a local level (Banks and Marsden 2000; Gardini and Lazzarin 2007; Cicatiello and Franco 2008), so that agriculture can actively contribute towards rural development wherever it has a place (EC 1988). This situation is symptomatic of the new European approach towards rural development policies, where planned initiatives are to be extended to all rural-based players, including those not linked directly to agriculture, with a view to establishing an integrated approach throughout the territory (Lowe et al. 2002). From an environmental point of view, farms that adopt forms of SFSCs tend to implement more sustainable production methods, which in turn have a positive impact on biodiversity, the landscape and the natural resources of the territory (Battershill and Gilg 1998; Cicatiello and Franco 2012). The necessity of diversifying production to meet the consumers’ demand for variety has pushed farmers towards the most diverse farming practices, with the result that they do not specialize in one or two products, but offer, instead, a wide range of different goods. This often leads to rediscovering traditional vegetables, ancient fruit cultivations and dairy products made from the milk of indigenous breeds. The reorganization of production systems can also cover the decision to introduce production methods with lower environmental impact, such as organic farming or integrated agriculture (Bullock 2000). A SFSC, being based on the relationship between farmer and consumer at a local level, can greatly reduce the distance that food has to travel from where it is produced to where it is consumed, and, therefore, limit
2015 International Food and Agribusiness Management Association (IFAMA). All rights reserved
111
Mastronardi et al. Volume 18 Issue 2, 2015
external negative factors linked to its transport, such as CO2 emissions, air pollution, traffic, accidents and noise pollution (DEFRA 2005). Looking at social reasons, local markets generate a net profit in terms of employment (Bullock 2000). SFSCs present young farmers with the opportunity of developing their activity, while pensioners can earn additional income by taking up farming (Hilchey et al. 1995). In addition, the expansion of sales-related initiatives may require employing workers outside the family to cover the increased need for labor, creating further employment opportunities for people living in rural areas, and promoting in this way a virtuous circle that benefits everyone in the territory (Marino et al. 2013). Local markets, where relationships are easily made on a personal level and are linked to this shared space (Lyson and Green 1999; Hinrichs 2000), provide the ideal opportunity for exchanging information and opinions about production techniques, the specific characteristics of a product and, more in general, countryside knowledge (Renting et al. 2003). Following these considerations, we could even interpret the spreading of new supply chain forms as a political tool, used to back the will of certain public administrations of retaining agriculture and farming in the areas surrounding towns instead of transforming previously farmed land into urban areas (Aubry et al. 2008). Economically, farmers taking part in SFSCs can make a significant profit (Brown 2002). They have a direct input on price, which can be determined in a totally autonomous way (Cicatiello and Franco 2008). This allows farmers to regain control over decisions about what to produce (Hinrichs 2000), and so escape from the vicious circle typical of traditional markets. This also means that they can avoid the so-called squeeze on agriculture (Van der Ploeg 2006), namely, the situation whereby farmers are pressed on the one side by their suppliers and on the other by the wholesalers to whom they sell their products, so that they gradually lose their decision-making autonomy. Producers taking part in SFSCs have enhanced entrepreneurial skills in aspects such as customer relationships, marketing and business self-confidence (Feenstra et al. 2003). A further economic advantage is that of immediate financial gain (Vaupel 1989). Through SFSCs, farmers can sell their products during periods of the year when offer exceeds demand (Hardesty and Leff 2009), while, at the same time, continuing to use traditional marketing channels. In this way, placing products without creating a surplus allows farmers to sell their produce for more than they would have obtained from a wholesaler, while consumers can pay less than normal retail prices (Tropp 2008). This literature review of the influence of SFSCs over producers has highlighted many aspects relating to sustainability and this determined the choice of variables and indicators that were used in our analysis (Battershill and Gilg 1998; Ilbery and Maye 2005; DEFRA 2005; Aubry et al. 2008). In this context, the first contribution of our paper is to highlight the Italian situation regarding SFSCs. This is important in economic terms, not least for the major role they can play in promoting and spreading the principles of sustainability that are at their core, and as a consequence expanding our knowledge and helping to outline a framework to be used when defining any legislation to regulate and promote these complex realities. A second contribution is
2015 International Food and Agribusiness Management Association (IFAMA). All rights reserved
112
Mastronardi et al. Volume 18 Issue 2, 2015
to initiate a thought process about which indicators can be used to evaluate the sustainability of these supply chains. Methods The data used were gathered by means of a direct survey. The first phase of the research involved identifying the variables to be used for evaluating SFSCs and their impact on the territory, in terms of both farming and communities. Focus groups were employed to identify the territorial cases (cities), types of SFSCs and farms. Two focus groups were set up, the first involving the supply chain stakeholders and the second scholars and academics. The survey took in consumers, producers and possible organizers, and included face-to-face, in-depth and mail-based interviews. Regarding the interviews conducted with farmers, in order to ensure that it was possible to compare data that had emerged from different forms of short supply chain, we prepared a questionnaire organized into a number of phases. First, we carried out a survey to identify the knowledge acquired from previous surveys, derived in part from the joint experience of the research group in organizing and managing similar surveys. Keeping in mind the objectives of the survey, we then organized the sections of the questionnaire as follows: a) a first series of questions about the “story” and the reasons linking producers to the short supply chain about which they were being interviewed; b) a second series of questions about their perception of the social, environmental and economic effects resulting from their involvement in that specific short supply chain; c) a final section going into further detail about their farm and its operations, asking information about the farmers themselves and the structure of their farm. The final version of the questionnaire containing 11 questions is the result of complex fine-tuning work to the previous versions that were tested on the focus groups to ensure their functionality. The direct survey involved 226 producers1, selected according to territorial distribution and to the typology of short chain (Table 1). The sampling was random. Of these, 203 were sent to the producers directly, while the others were compiled electronically using the NRN INEA program.2 In Italy, there are now 270.497 farms that sell directly to consumers, representing 26% of the total number of farms (up from 22.1% in 2007, and 5% more than in 2000), with 1.367 Farmers’ Markets, which increased by 44% over the past two years and 890 Solidarity-Based Purchasing Groups (Marino and Cicatiello 2012).
Among the different types of supply chain, the largest category is represented by Farmers’ Markets (FMs) with 137 producers being surveyed, followed by Solidarity Purchasing Groups (SPGs) (37 farmers) and by the category of Farms Selling Directly (FSD) (30 farmers). A decidedly smaller number of producers were detected for the Box Schemes (BS) and Community Supported Agriculture (CSA) categories (8 and 4 units, respectively). In addition, there is a special category defined as Multi-Chain Farms (MCFs) (10 farms), which identifies producers participating indistinctly in several markets.
1The survey was carried out within the framework of a project financed by the Italian Ministry of Agriculture, Food and Forestry, and coordinated by CURSA, the Inter-university Consortium for Socio-economic Research. 2 The NRN INEA programme is Italy’s contribution to the larger European project (the European Network for Rural Development ENRD), which studies and integrates all activities linked to the development of rural areas in the period between 2007 and 2013.
2015 International Food and Agribusiness Management Association (IFAMA). All rights reserved
113
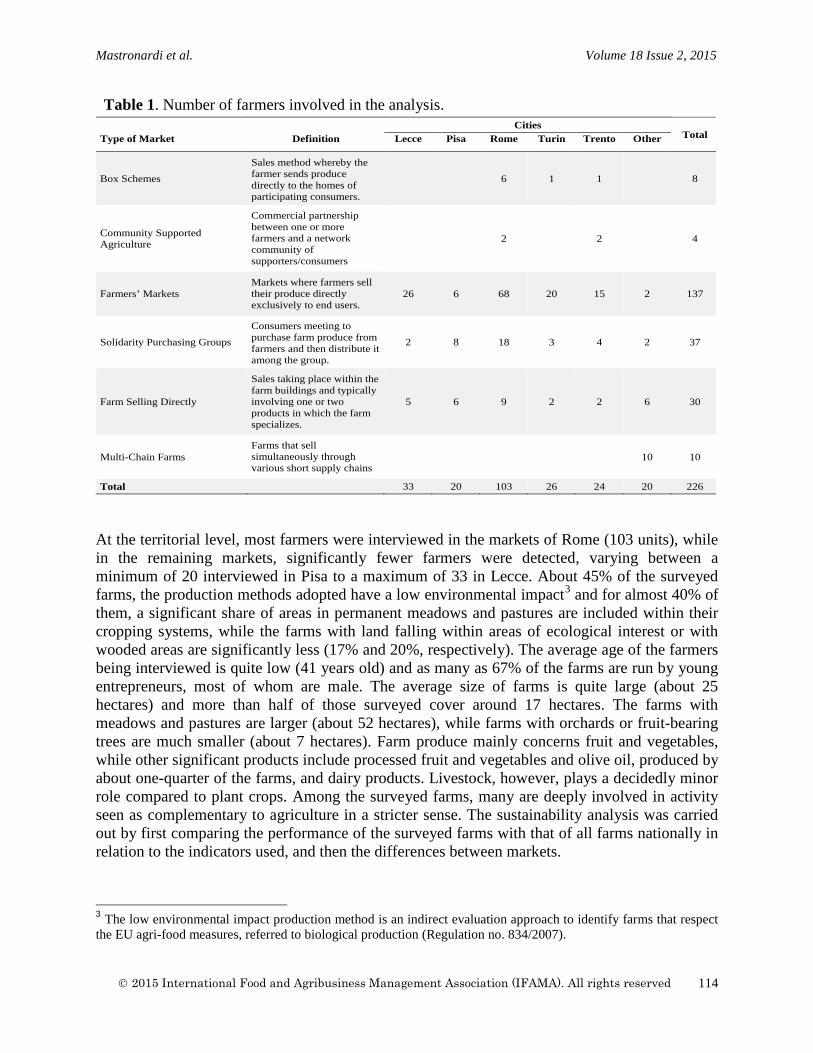
Mastronardi et al. Volume 18 Issue 2, 2015
Table 1. Number of farmers involved in the analysis.
At the territorial level, most farmers were interviewed in the markets of Rome (103 units), while in the remaining markets, significantly fewer farmers were detected, varying between a minimum of 20 interviewed in Pisa to a maximum of 33 in Lecce. About 45% of the surveyed farms, the production methods adopted have a low environmental impact3 and for almost 40% of them, a significant share of areas in permanent meadows and pastures are included within their cropping systems, while the farms with land falling within areas of ecological interest or with wooded areas are significantly less (17% and 20%, respectively). The average age of the farmers being interviewed is quite low (41 years old) and as many as 67% of the farms are run by young entrepreneurs, most of whom are male. The average size of farms is quite large (about 25 hectares) and more than half of those surveyed cover around 17 hectares. The farms with meadows and pastures are larger (about 52 hectares), while farms with orchards or fruit-bearing trees are much smaller (about 7 hectares). Farm produce mainly concerns fruit and vegetables, while other significant products include processed fruit and vegetables and olive oil, produced by about one-quarter of the farms, and dairy products. Livestock, however, plays a decidedly minor role compared to plant crops. Among the surveyed farms, many are deeply involved in activity seen as complementary to agriculture in a stricter sense. The sustainability analysis was carried out by first comparing the performance of the surveyed farms with that of all farms nationally in relation to the indicators used, and then the differences between markets.
3 The low environmental impact production method is an indirect evaluation approach to identify farms that respect the EU agri-food measures, referred to biological production (Regulation no. 834/2007).
Cities Total
Type of Market Definition Lecce Pisa Rome Turin Trento Other
Box Schemes
Sales method whereby the farmer sends produce directly to the homes of participating consumers.
6 1 1 8
Community Supported Agriculture
Commercial partnership between one or more farmers and a network community of supporters/consumers
2 2 4
Farmers’ Markets
Markets where farmers sell their produce directly exclusively to end users.
26 6 68 20 15 2 137
Solidarity Purchasing Groups
Consumers meeting to purchase farm produce from farmers and then distribute it among the group.
2 8 18 3 4 2 37
Farm Selling Directly
Sales taking place within the farm buildings and typically involving one or two products in which the farm specializes.
5 6 9 2 2 6 30
Multi-Chain Farms
Farms that sell simultaneously through various short supply chains
10 10
Total 33 20 103 26 24 20 226
2015 International Food and Agribusiness Management Association (IFAMA). All rights reserved
114
Mastronardi et al. Volume 18 Issue 2, 2015
The research is based upon a set of indicators relating to structural, employment and economic aspects. Despite not considering all the issues included within the definition of sustainability, this set of indicators should include a combination of the three spheres of sustainability. According to the United Nations Department of Policy Coordination and Sustainable Development UN DPSCD (1996), environmental sustainability is the capacity of retaining the quality and capability of reproduction of natural resources; social sustainability is the capacity of ensuring equally distributed human comfort (in relation to class and gender); and economic sustainability is the capacity of generating income and employment to support the population. The indicators chosen for the study are those most frequently used in studies on sustainability. The many attempts to measure sustainable development can be classified into four types (Zezza 2013): 1) Set of dashboard indicators; 2) Composite indices; 3) “Corrected” GDP measures; 4) Indices concentrating of measuring over-consumption of resources. The indicators used in the paper are dashboard indicators and were chosen by adopting as main references the most frequently cited examples in the literature on short supply chains in terms of the environmental, social and economic impact (Battershill and Gilg 1998; Ilbery and Maye 2005; DEFRA 2005; Aubry et al. 2008; Marino et al. 2013). During the literature review phase, several hundred indicators relating to the themes of analysis outlined previously were initially taken into consideration. These were subsequently analysed and classified, until a manageable set of indicators was obtained. The environmental themes were associated with the natural resources to be assessed in terms of sustainability. The general objective of this group of indicators was above all to evaluate the availability and use of a natural resource, linking this to farming activity. Environmental sustainability takes into account the way farmland is cultivated, farmland falling within protected areas and distance from city centres. In terms of social sustainability, we considered the impact that the production system has on the life of people and their organization. The starting point was the farm and therefore the farmer and the farmer’s family, then extending the field of observation to aspects linked to sustainability in order to identify and, as far as possible, measure, the impact on the various social players. The indicators used to measure the social sustainability of SFSCs focus on employment and, in particular, they look at the number of young employees, female workers and entrepreneurs, family workers, employees with disabilities and pensioners. The sustainable behaviour of agricultural entrepreneurs can be evaluated through the group of economic indicators, verifying, on the one hand, that short supply chains entail a different pathway of development for the farm and, on the other, that the ensuing value is not simply ethical but also economic. Economic sustainability is given by several indicators, which refer to standard output4 (standard output vegetables, standard output olive trees and grapevines, standard output fruit-bearing trees, etc.), multiplied by the use of farmland. 4 Standard output is the economic principle at the basis of the European classification of farms, and is known as the Community typology for farms. The purpose of the Community typology is to provide a classification format to analyse farms within the Community in terms of economic criteria and to make a comparison between farms belonging to different classes and between the economic results achieved over time and in different member States and their regions.
2015 International Food and Agribusiness Management Association (IFAMA). All rights reserved
115
Mastronardi et al. Volume 18 Issue 2, 2015
The analytical system first examined the specific characteristics of the surveyed farms in comparison to all Italian farms, followed by a comparison between farms within the short supply chain. The methodology made use of ANOVA and MANOVA models/CVA (Canonical Variable Analysis). The Analysis of Variance (ANOVA) is a statistical inferential type procedure used to evaluate the differences between two or more groups by comparing the variability within the groups (Variance Within) with the external variability or with the variability between groups (Variance Between). In the study at issue, the ANOVA was mainly used to evaluate differences within groups or between the specific variables of each group, while the multivariate version (MANOVA) was used to evaluate differences between groups, investigating the relations between variables and groups. The scatter-plot CVA was used to represent the elements of each group on the main components plane, highlighting the associations between the distribution of the groups in space and the orientation of the variables with regard to the main axes. This made it possible to explain the differences observed between groups in the MANOVA analysis, highlighting the correlations with the most important variables according to the weight (cumulative variance) of the axis, ignoring the non-significant associations. To avoid the analysis being affected by the non-uniform distribution of the respondents, the least representative chains in terms of farms, specifically Box Schemes and CSA, were merged into a single category called BS-CSA, meaning that the statistical significance of the elaboration is increased. The comparison between the two levels of analysis (multivariate and group level) then was both the inspiration and the basis for explaining the farmers’ participation in short chains according to the aspects being examined (environmental, social and economic). The ANOVA and MANOVA models were used to highlight the differences between farms within the short supply chain; however, the lack of a statistical basis of comparison meant that it was not possible to use the same method to compare the characteristics of the farms being surveyed with all farms nationally. Farmers and Sustainability Before illustrating the differences between the environmental, social and economic performance of farms participating in SFSCs, it makes sense to try and understand whether there are differences between the farms surveyed and the universe of farms at a national level5, in the light of the indicators used. Useful information could emerge about the specific aspects of the farms being surveyed, in relation to the topic being covered. First, a key issue is that the indicators used for the analysis of sustainability record higher values for the surveyed farms compared to the equivalent values recorded for the farms at national level.
5 The information relating to national farms has been extracted from the 6th General Census of Italian Agriculture by ISTAT (2010).
2015 International Food and Agribusiness Management Association (IFAMA). All rights reserved
116
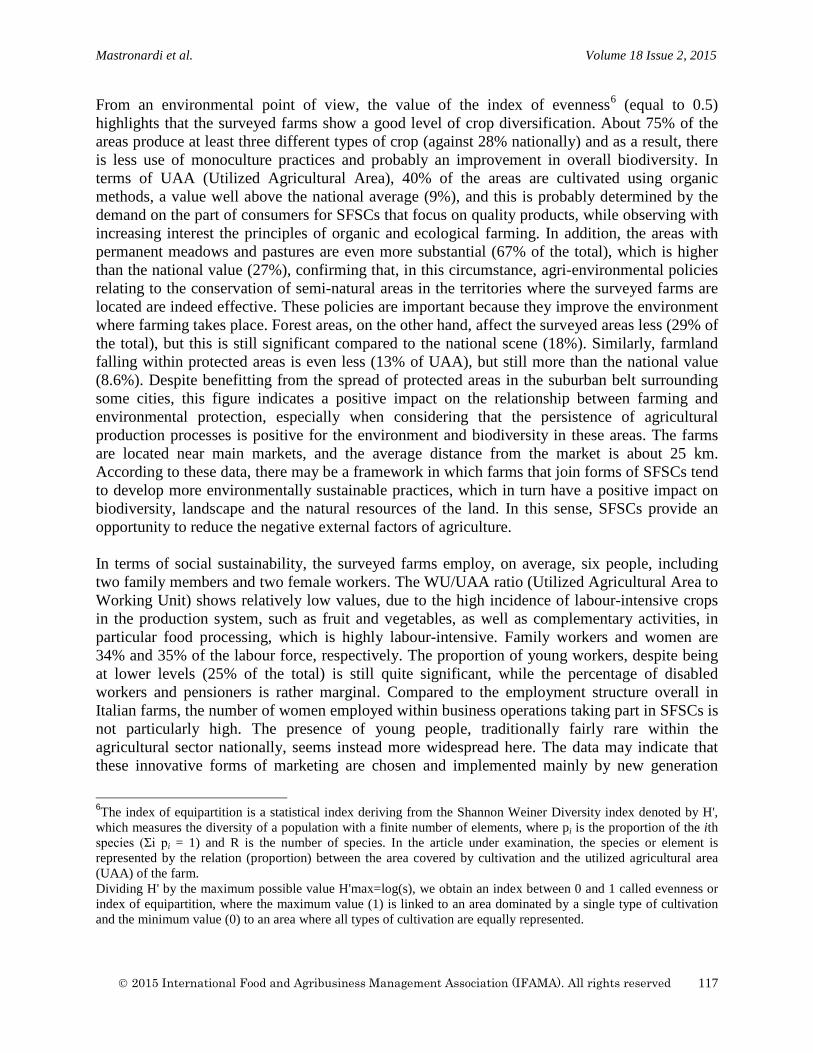
Mastronardi et al. Volume 18 Issue 2, 2015
From an environmental point of view, the value of the index of evenness6 (equal to 0.5) highlights that the surveyed farms show a good level of crop diversification. About 75% of the areas produce at least three different types of crop (against 28% nationally) and as a result, there is less use of monoculture practices and probably an improvement in overall biodiversity. In terms of UAA (Utilized Agricultural Area), 40% of the areas are cultivated using organic methods, a value well above the national average (9%), and this is probably determined by the demand on the part of consumers for SFSCs that focus on quality products, while observing with increasing interest the principles of organic and ecological farming. In addition, the areas with permanent meadows and pastures are even more substantial (67% of the total), which is higher than the national value (27%), confirming that, in this circumstance, agri-environmental policies relating to the conservation of semi-natural areas in the territories where the surveyed farms are located are indeed effective. These policies are important because they improve the environment where farming takes place. Forest areas, on the other hand, affect the surveyed areas less (29% of the total), but this is still significant compared to the national scene (18%). Similarly, farmland falling within protected areas is even less (13% of UAA), but still more than the national value (8.6%). Despite benefitting from the spread of protected areas in the suburban belt surrounding some cities, this figure indicates a positive impact on the relationship between farming and environmental protection, especially when considering that the persistence of agricultural production processes is positive for the environment and biodiversity in these areas. The farms are located near main markets, and the average distance from the market is about 25 km. According to these data, there may be a framework in which farms that join forms of SFSCs tend to develop more environmentally sustainable practices, which in turn have a positive impact on biodiversity, landscape and the natural resources of the land. In this sense, SFSCs provide an opportunity to reduce the negative external factors of agriculture. In terms of social sustainability, the surveyed farms employ, on average, six people, including two family members and two female workers. The WU/UAA ratio (Utilized Agricultural Area to Working Unit) shows relatively low values, due to the high incidence of labour-intensive crops in the production system, such as fruit and vegetables, as well as complementary activities, in particular food processing, which is highly labour-intensive. Family workers and women are 34% and 35% of the labour force, respectively. The proportion of young workers, despite being at lower levels (25% of the total) is still quite significant, while the percentage of disabled workers and pensioners is rather marginal. Compared to the employment structure overall in Italian farms, the number of women employed within business operations taking part in SFSCs is not particularly high. The presence of young people, traditionally fairly rare within the agricultural sector nationally, seems instead more widespread here. The data may indicate that these innovative forms of marketing are chosen and implemented mainly by new generation
6The index of equipartition is a statistical index deriving from the Shannon Weiner Diversity index denoted by H', which measures the diversity of a population with a finite number of elements, where pi is the proportion of the ith species (Σi pi = 1) and R is the number of species. In the article under examination, the species or element is represented by the relation (proportion) between the area covered by cultivation and the utilized agricultural area (UAA) of the farm. Dividing H' by the maximum possible value H'max=log(s), we obtain an index between 0 and 1 called evenness or index of equipartition, where the maximum value (1) is linked to an area dominated by a single type of cultivation and the minimum value (0) to an area where all types of cultivation are equally represented.
2015 International Food and Agribusiness Management Association (IFAMA). All rights reserved
117
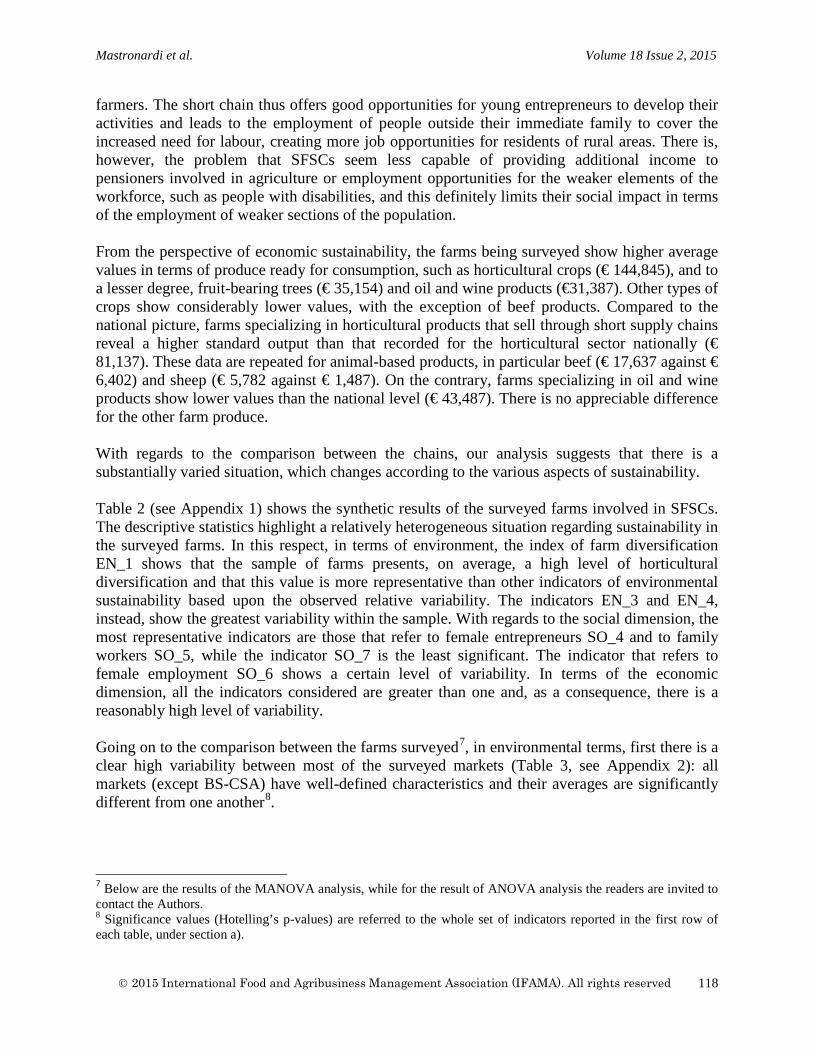
Mastronardi et al. Volume 18 Issue 2, 2015
farmers. The short chain thus offers good opportunities for young entrepreneurs to develop their activities and leads to the employment of people outside their immediate family to cover the increased need for labour, creating more job opportunities for residents of rural areas. There is, however, the problem that SFSCs seem less capable of providing additional income to pensioners involved in agriculture or employment opportunities for the weaker elements of the workforce, such as people with disabilities, and this definitely limits their social impact in terms of the employment of weaker sections of the population. From the perspective of economic sustainability, the farms being surveyed show higher average values in terms of produce ready for consumption, such as horticultural crops (€ 144,845), and to a lesser degree, fruit-bearing trees (€ 35,154) and oil and wine products (€31,387). Other types of crops show considerably lower values, with the exception of beef products. Compared to the national picture, farms specializing in horticultural products that sell through short supply chains reveal a higher standard output than that recorded for the horticultural sector nationally (€ 81,137). These data are repeated for animal-based products, in particular beef (€ 17,637 against € 6,402) and sheep (€ 5,782 against € 1,487). On the contrary, farms specializing in oil and wine products show lower values than the national level (€ 43,487). There is no appreciable difference for the other farm produce. With regards to the comparison between the chains, our analysis suggests that there is a substantially varied situation, which changes according to the various aspects of sustainability. Table 2 (see Appendix 1) shows the synthetic results of the surveyed farms involved in SFSCs. The descriptive statistics highlight a relatively heterogeneous situation regarding sustainability in the surveyed farms. In this respect, in terms of environment, the index of farm diversification EN_1 shows that the sample of farms presents, on average, a high level of horticultural diversification and that this value is more representative than other indicators of environmental sustainability based upon the observed relative variability. The indicators EN_3 and EN_4, instead, show the greatest variability within the sample. With regards to the social dimension, the most representative indicators are those that refer to female entrepreneurs SO_4 and to family workers SO_5, while the indicator SO_7 is the least significant. The indicator that refers to female employment SO_6 shows a certain level of variability. In terms of the economic dimension, all the indicators considered are greater than one and, as a consequence, there is a reasonably high level of variability. Going on to the comparison between the farms surveyed7, in environmental terms, first there is a clear high variability between most of the surveyed markets (Table 3, see Appendix 2): all markets (except BS-CSA) have well-defined characteristics and their averages are significantly different from one another8.
7 Below are the results of the MANOVA analysis, while for the result of ANOVA analysis the readers are invited to contact the Authors. 8 Significance values (Hotelling’s p-values) are referred to the whole set of indicators reported in the first row of each table, under section a).
2015 International Food and Agribusiness Management Association (IFAMA). All rights reserved
118
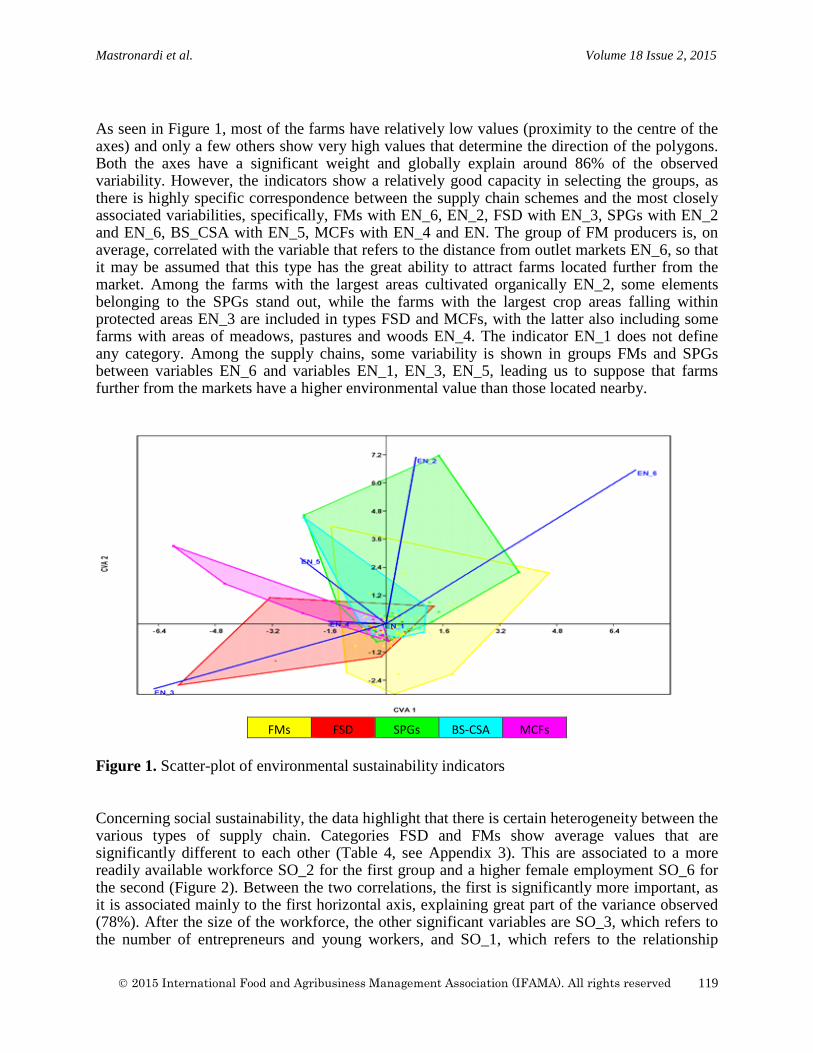
Mastronardi et al. Volume 18 Issue 2, 2015
As seen in Figure 1, most of the farms have relatively low values (proximity to the centre of the axes) and only a few others show very high values that determine the direction of the polygons. Both the axes have a significant weight and globally explain around 86% of the observed variability. However, the indicators show a relatively good capacity in selecting the groups, as there is highly specific correspondence between the supply chain schemes and the most closely associated variabilities, specifically, FMs with EN_6, EN_2, FSD with EN_3, SPGs with EN_2 and EN_6, BS_CSA with EN_5, MCFs with EN_4 and EN. The group of FM producers is, on average, correlated with the variable that refers to the distance from outlet markets EN_6, so that it may be assumed that this type has the great ability to attract farms located further from the market. Among the farms with the largest areas cultivated organically EN_2, some elements belonging to the SPGs stand out, while the farms with the largest crop areas falling within protected areas EN_3 are included in types FSD and MCFs, with the latter also including some farms with areas of meadows, pastures and woods EN_4. The indicator EN_1 does not define any category. Among the supply chains, some variability is shown in groups FMs and SPGs between variables EN_6 and variables EN_1, EN_3, EN_5, leading us to suppose that farms further from the markets have a higher environmental value than those located nearby.
FMs FSD SPGs BS-CSA MCFs
Figure 1. Scatter-plot of environmental sustainability indicators Concerning social sustainability, the data highlight that there is certain heterogeneity between the various types of supply chain. Categories FSD and FMs show average values that are significantly different to each other (Table 4, see Appendix 3). This are associated to a more readily available workforce SO_2 for the first group and a higher female employment SO_6 for the second (Figure 2). Between the two correlations, the first is significantly more important, as it is associated mainly to the first horizontal axis, explaining great part of the variance observed (78%). After the size of the workforce, the other significant variables are SO_3, which refers to the number of entrepreneurs and young workers, and SO_1, which refers to the relationship
2015 International Food and Agribusiness Management Association (IFAMA). All rights reserved
119
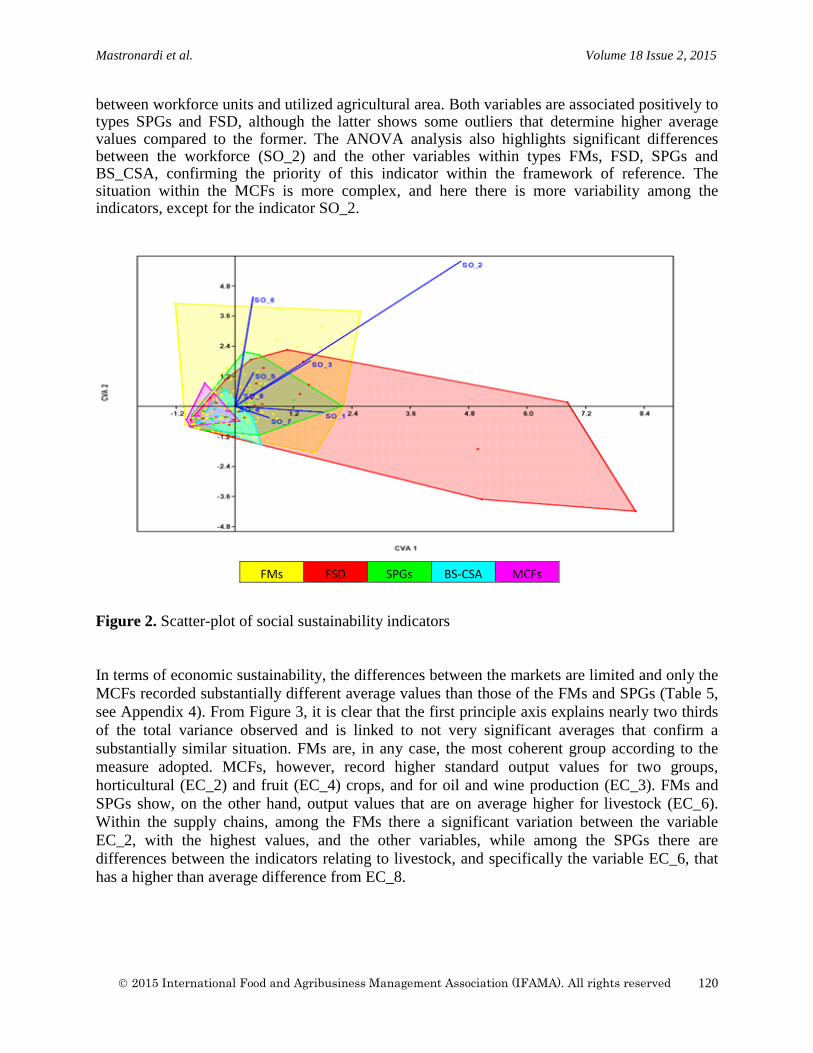
Mastronardi et al. Volume 18 Issue 2, 2015
between workforce units and utilized agricultural area. Both variables are associated positively to types SPGs and FSD, although the latter shows some outliers that determine higher average values compared to the former. The ANOVA analysis also highlights significant differences between the workforce (SO_2) and the other variables within types FMs, FSD, SPGs and BS_CSA, confirming the priority of this indicator within the framework of reference. The situation within the MCFs is more complex, and here there is more variability among the indicators, except for the indicator SO_2.
Figure 2. Scatter-plot of social sustainability indicators In terms of economic sustainability, the differences between the markets are limited and only the MCFs recorded substantially different average values than those of the FMs and SPGs (Table 5, see Appendix 4). From Figure 3, it is clear that the first principle axis explains nearly two thirds of the total variance observed and is linked to not very significant averages that confirm a substantially similar situation. FMs are, in any case, the most coherent group according to the measure adopted. MCFs, however, record higher standard output values for two groups, horticultural (EC_2) and fruit (EC_4) crops, and for oil and wine production (EC_3). FMs and SPGs show, on the other hand, output values that are on average higher for livestock (EC_6). Within the supply chains, among the FMs there a significant variation between the variable EC_2, with the highest values, and the other variables, while among the SPGs there are differences between the indicators relating to livestock, and specifically the variable EC_6, that has a higher than average difference from EC_8.
FMs FSD SPGs BS-CSA MCFs
2015 International Food and Agribusiness Management Association (IFAMA). All rights reserved
120
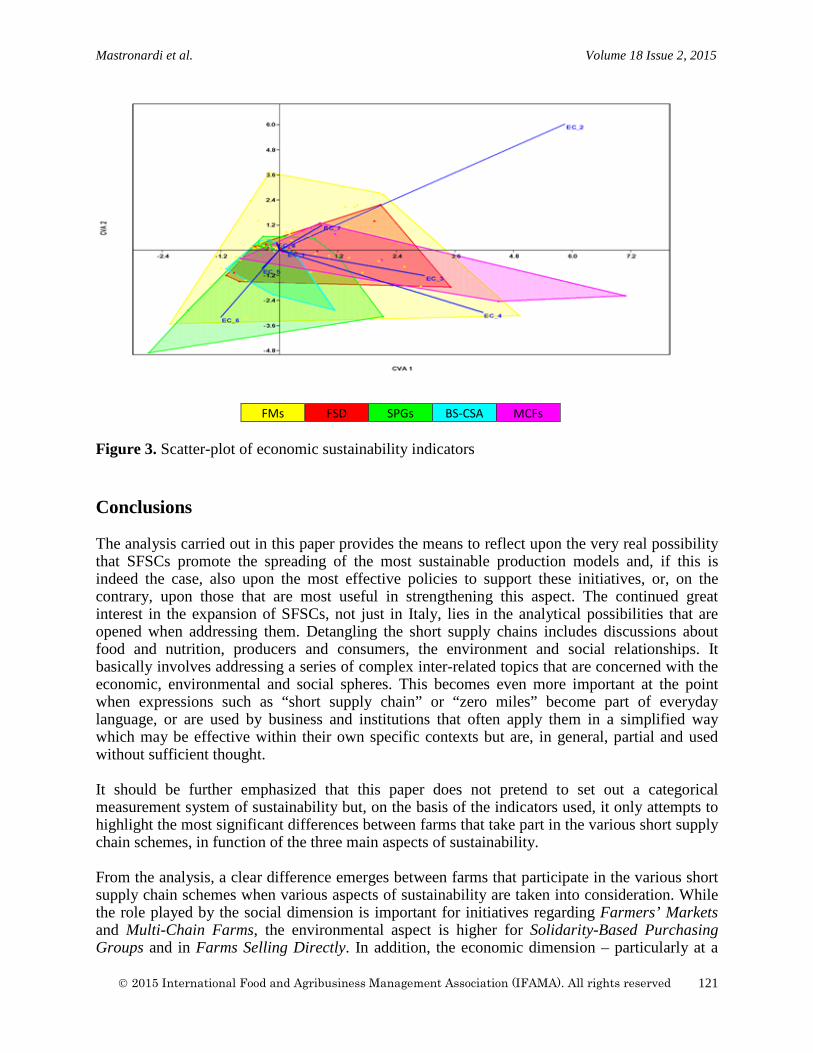
Mastronardi et al. Volume 18 Issue 2, 2015
Figure 3. Scatter-plot of economic sustainability indicators
Conclusions The analysis carried out in this paper provides the means to reflect upon the very real possibility that SFSCs promote the spreading of the most sustainable production models and, if this is indeed the case, also upon the most effective policies to support these initiatives, or, on the contrary, upon those that are most useful in strengthening this aspect. The continued great interest in the expansion of SFSCs, not just in Italy, lies in the analytical possibilities that are opened when addressing them. Detangling the short supply chains includes discussions about food and nutrition, producers and consumers, the environment and social relationships. It basically involves addressing a series of complex inter-related topics that are concerned with the economic, environmental and social spheres. This becomes even more important at the point when expressions such as “short supply chain” or “zero miles” become part of everyday language, or are used by business and institutions that often apply them in a simplified way which may be effective within their own specific contexts but are, in general, partial and used without sufficient thought. It should be further emphasized that this paper does not pretend to set out a categorical measurement system of sustainability but, on the basis of the indicators used, it only attempts to highlight the most significant differences between farms that take part in the various short supply chain schemes, in function of the three main aspects of sustainability. From the analysis, a clear difference emerges between farms that participate in the various short supply chain schemes when various aspects of sustainability are taken into consideration. While the role played by the social dimension is important for initiatives regarding Farmers’ Markets and Multi-Chain Farms, the environmental aspect is higher for Solidarity-Based Purchasing Groups and in Farms Selling Directly. In addition, the economic dimension – particularly at a
FMs FSD SPGs BS-CSA MCFs
2015 International Food and Agribusiness Management Association (IFAMA). All rights reserved
121
Mastronardi et al. Volume 18 Issue 2, 2015
farm level – plays a key role in each of the different typologies. SPG farmers in particular show a clear preference for almost all the dimensions of sustainability, placing special attention on the size of the areas cultivated using organic production methods, the intensity of the work, the presence of young farmers and a young workforce and income from livestock. FM farms are defined by the number of family workers and, to a lesser extent, by a slight economic vitality, as shown by the income from the livestock sector. Farms with direct sales pay more attention to the environmental aspects relating to the amount of farmland falling within protected areas and to employment. MCF farms are defined, from an environmental point of view, by the farmland falling within protected areas, as well as by the presence of meadows, pastures and woods. From an economic point, these farms stand out for the value of their fruit and vegetable production and for that of their oil and wine. Nevertheless, SFSCs are fundamental in promoting and achieving sustainability at a local level. In wishing to point out the limits of this study, first, it was not possible to carry out a rigorous comparative analysis at the provincial level, as there was no statistical data available to make a comparison with the data gathered in our survey. It was not possible to use our indicators to measure sustainability through a points system and it was also not possible to understand whether the farms surveyed can be considered sustainable or not under the three aspects of sustainability. We also still seek to understand whether participating in a short supply chain scheme is a key factor of sustainability, but this could be assessed by making a comparison between the performance of farms operating with short supply chains and those selling through traditional channels. References Aubry, C., L. Kebir and C. Pasquier. 2008. The (re) conquest of local food supply function by
agriculture in the Ile de France region. Proceedings of 2nd International Working Conference for social scientists “Sustainable Consumption and alternative agri-food systems”, May 27th to 30th 2008 Arlon. http://www.suscons.ulg.ac.be.
Banks, J. and T. Marsden. 2000. Integrating agro-environmental policy, farming system and rural
development. Tir Cymen in Wales. Sociologia Ruralis 40: 466-480. Battershill, M.R.J, and A.W. Gilg. 1998. Traditional low intensity farming: evidence of the role
of Vente Directe in supporting such farms in Northwest France, and some Implications for conservation policy. Journal of Rural Studies 14(4): 475 -486.
Brown, C., and S. Miller. 2008. The impacts of local market: a review of research on farmers’
market and community supported agriculture (CSA). American Journal of Agricultural Economics 90(5): 1298-1302.
Brown, A. 2002. FMS Research 1940-2000: an Inventory and Review. American Journal of
Alternative Agriculture 17(4): 167-176. Bullock, S. 2000. The economic benefits of farmers’ market. London, Published by Friends of
the Earth Trust, London.
2015 International Food and Agribusiness Management Association (IFAMA). All rights reserved
122
Mastronardi et al. Volume 18 Issue 2, 2015
Christensen, R. 1984. Economics for small scale food producers. Cooperative Extension Service, Amherst.
Cicatiello, C., and S. Franco 2012. Filiere corte e sostenibilità: una rassegna degli impatti
ambientali, sociali ed economici, QA 3: 47-65. Cicatiello, C., and S. Franco. 2008. La vendita diretta: produttori, consumatori e collettività.
Agriregionieuropa 4 (14). Curry, D. 2002. Farming and Food, a Sustainable Future. Report of the Policy Commission on
the Future of Farming and Food, London. DEFRA. 2005. The validity of food miles as an indicator of sustainable development. Final
report for the Department of Environment, Food and Rural Affairs, issue 7, London. EC. 2005. Regulation n.1698/05 on support for rural development by EAFRD. Regulation of the
European Commission OJ L 277 21/10/2005. EC. 1999. Regulation n.1257/99 on support for rural development from EAGGF and amending
and repealing certain regulations. Regulation of the European Commission, OJ L 160 26/06/1999.
EC. 1988. The future of rural society. Communication from the European Commission,
COM/88/501. Eurostat. 2011. Sustainable development in the European Union - 2011 monitoring report on the
EU sustainable development strategy. http://epp.eurostat.ec.europa.eu (Accessed February 13, 2013).
Feenstra, G., C. Lewis, C. Hinrichs, G. Gillespie, and D. Hilchey 2003. Entrepreneurial
outcomes and enterprise size in US retail farmers’ market. American Journal of Alternative Agriculture 18(1): 46-55.
Franco, S., and D. Marino, ed. 2012. Il mercato della Filiera corta. I farmers’ market come
luogo di incontro di produttori e consumatori. Gruppo 2013. Working Paper No. 19. Govindasamy, R., M. Zurbriggen, J. Italia, A. Adelaja, P. Nitzsche, and R. Van Vranken. 1998.
Farmers’ Market. Consumer Trends, Preferences, and Characteristics. New Jersey Agriculture Experiment Station. Cook College, Rutgers, New Brunswick.
Hardesty, S.D., and P. Leff. 2009. Determining Marketing Costs and Returns in Alternative
Marketing Channels. Renewable Agriculture and Food Systems 25(1): 24-34. Henke, R. 2004. Verso il riconoscimento di una agricoltura multifunzionale. Roma, INEA. Gardini, C., and C. Lazzarin. 2007. La vendita diretta in Italia. Agriregionieuropa 3(8).
2015 International Food and Agribusiness Management Association (IFAMA). All rights reserved
123
Mastronardi et al. Volume 18 Issue 2, 2015
Higgins, V., J. Dibden, and C. Cocklin. 2008. Building alternative food networks: certification, embeddedness and agri-environmental governance. Journal of Rural Studies 24(1): 15-27. Hilchey, D., T. Lyson, and G. Gillespie. 1995. Farmers’ markets and rural economic development:
entrepreneurship, small business, incubation and job creation in the rural northeast. Ithaca, NY, USA: Publication for Farming Alternatives Program, Department of Rural Sociology. Cornell University.
Hinrichs, C.C. 2000. Embeddedness and local food systems: notes on two types of direct
agricultural market. Journal of Rural Studies, 16(3): 295-333. Ilbery, B., and D. Maye. 2005. Food Supply Chains and Sustainability: Evidence from Specialist
Food Producers in the Scottish/English Borders. Land Use Policy 22(4): 331-344. La Trobe, H. 2001. Farmers’ market: consuming local rural produce. International Journal of
Consumer Studies 25(3): 181-192. Lowe, P., H. Buller, and N. Ward. 2002. Setting the next agenda? British and French approaches
to the second pillar of CAP. Journal of Rural Studies 18(1): 1-17. Lyon, P., V. Collie, E.B. Kvarnbrink, and A. Colquhoun. 2009. Shopping at the farmers’ market:
consumers and their perspectives. Journal of Foodservice 20(1): 21-30. Lyson, T. A., and J. Green. 1999. The agricultural market scape: a framework for sustaining
agriculture and communities in the northeast. Journal of Sustainable Agriculture 15(2/3): 133-150.
Malassis, L., and G. Ghersi. 1995. Introduzione all’economia agroalimentare. Bologna: Il
Mulino. Marino, D., L. Mastronardi, S. Franco, D. De Gregorio, C. Cicatiello, and B. Pancino. 2013.
Farmers’ Markets, Producer and Consumer Behaviour: Analysis of Interactions with the Metrics of Sustainability. Proceedings from 7th International European Forum: System Dynamics and Innovation in Food Networks. February 18-22, 2013, Innsbruck, Austria.
Marino D., and C. Cicatiello, eds. 2012. I farmers’ market. La mano visibile del mercato.
Milano: Franco Angeli. Morgan, K., and A. Morley 2002. Relocalising the food chain: the role of creative public
procurement. Cardiff: Published by The Regeneration Institute. Murdoch, J., and M. Miele 1999. Back to nature: changing worlds of production in the food
sector. Sociologia Ruralis 39(4): 465-483. Parker, G. 2005. Sustainable food? Teikei, cooperatives and food citizenship in Japan and UK.
Working Papers in Real Estate & Planning No.11.
2015 International Food and Agribusiness Management Association (IFAMA). All rights reserved
124
Mastronardi et al. Volume 18 Issue 2, 2015
Renting, H., T.K. Marsden, and J. Banks. 2003. Understanding Alternative Food Networks: Exploring the Role of Short Food Supply Chains in Rural Development. Environment and Planning 35(3): 393-411.
Shannon, C.E. 1948. A mathematical theory of communication. The Bell System Technical
Journal, 27: 379-423 and 623-656. Singh, S.P., B.N. Hiremath, and S.L. Comer 1991. Direct marketing of fresh produce and the
concept of small farmers. Journal International Food and Agribusiness Marketing 2(3/4): 97-120.
Tropp, D. 2008. The growing role of local food market: discussion. American Journal of
Agricultural Economics 90(5): 1289-1295. Van der Ploeg, J.D. 2006. Oltre la modernizzazione. Soveria Mannelli: Rubbettino. UN DPSCD. 1996. Indicators of sustainable development: framework and methodologies,
Division for Sustainable Development. Department for Policy Co-ordination and Sustainable Development, New York.
Vaupel, S. 1989. The Farmers of Farmers’ Markets. California Agriculture 43(1): 28-30. WCED. 1987. Our Common Future. Report of the World Commission on Environment and
Development. United Nations. http://conspect.nl/pdf/Our_Common_ Future [Accessed February 12, 2014].
Zezza, A. 2013. Misurare lo sviluppo sostenibile. In Misurare la sostenibilità dell’agricoltura
biologica, edited by C. Abitabile, and A. Arzeni, 65-86. Roma: INEA.
2015 International Food and Agribusiness Management Association (IFAMA). All rights reserved
125
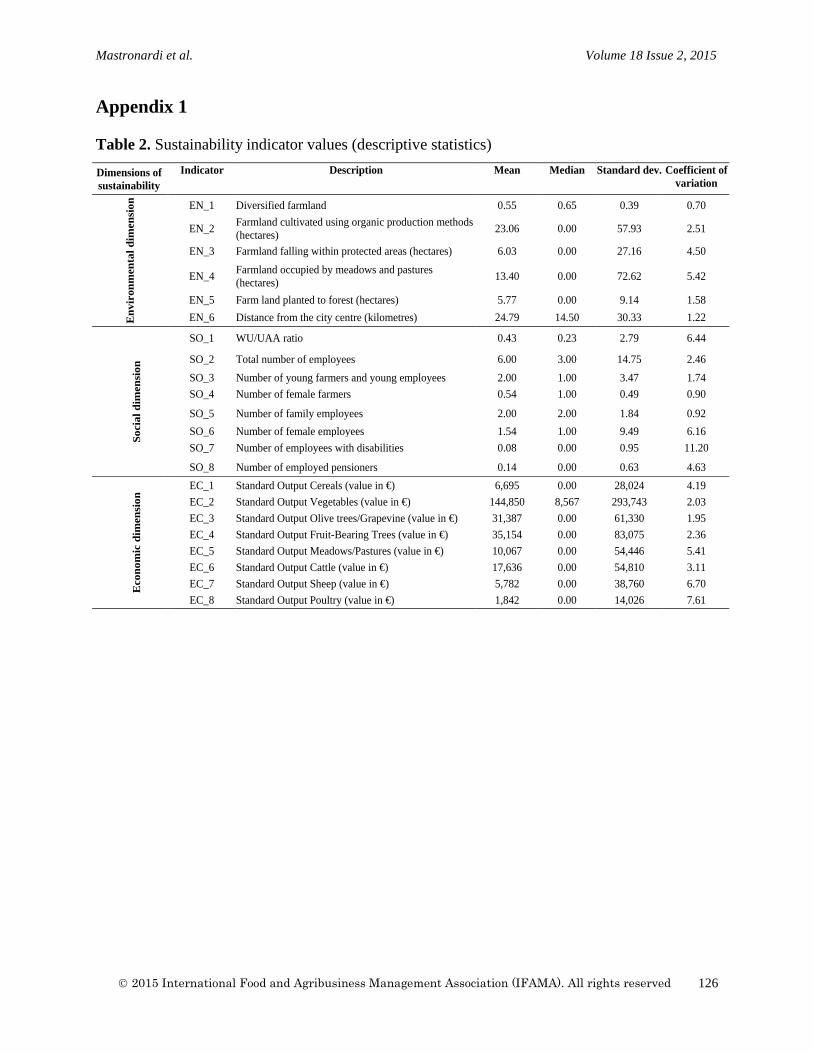
Mastronardi et al. Volume 18 Issue 2, 2015
Appendix 1 Table 2. Sustainability indicator values (descriptive statistics)
Dimensions of sustainability
Indicator Description Mean Median Standard dev. Coefficient of variation
Env
iron
men
tal d
imen
sion
EN_1 Diversified farmland 0.55 0.65 0.39 0.70
EN_2 Farmland cultivated using organic production methods (hectares) 23.06 0.00 57.93 2.51
EN_3 Farmland falling within protected areas (hectares) 6.03 0.00 27.16 4.50
EN_4 Farmland occupied by meadows and pastures (hectares) 13.40 0.00 72.62 5.42
EN_5 Farm land planted to forest (hectares) 5.77 0.00 9.14 1.58 EN_6 Distance from the city centre (kilometres) 24.79 14.50 30.33 1.22
So
cial
dim
ensi
on
SO_1 WU/UAA ratio 0.43 0.23 2.79 6.44
SO_2 Total number of employees 6.00 3.00 14.75 2.46 SO_3 Number of young farmers and young employees 2.00 1.00 3.47 1.74 SO_4 Number of female farmers 0.54 1.00 0.49 0.90
SO_5 Number of family employees 2.00 2.00 1.84 0.92 SO_6 Number of female employees 1.54 1.00 9.49 6.16 SO_7 Number of employees with disabilities 0.08 0.00 0.95 11.20
SO_8 Number of employed pensioners 0.14 0.00 0.63 4.63
E
cono
mic
dim
ensi
on EC_1 Standard Output Cereals (value in €) 6,695 0.00 28,024 4.19
EC_2 Standard Output Vegetables (value in €) 144,850 8,567 293,743 2.03 EC_3 Standard Output Olive trees/Grapevine (value in €) 31,387 0.00 61,330 1.95 EC_4 Standard Output Fruit-Bearing Trees (value in €) 35,154 0.00 83,075 2.36 EC_5 Standard Output Meadows/Pastures (value in €) 10,067 0.00 54,446 5.41 EC_6 Standard Output Cattle (value in €) 17,636 0.00 54,810 3.11 EC_7 Standard Output Sheep (value in €) 5,782 0.00 38,760 6.70 EC_8 Standard Output Poultry (value in €) 1,842 0.00 14,026 7.61
2015 International Food and Agribusiness Management Association (IFAMA). All rights reserved
126
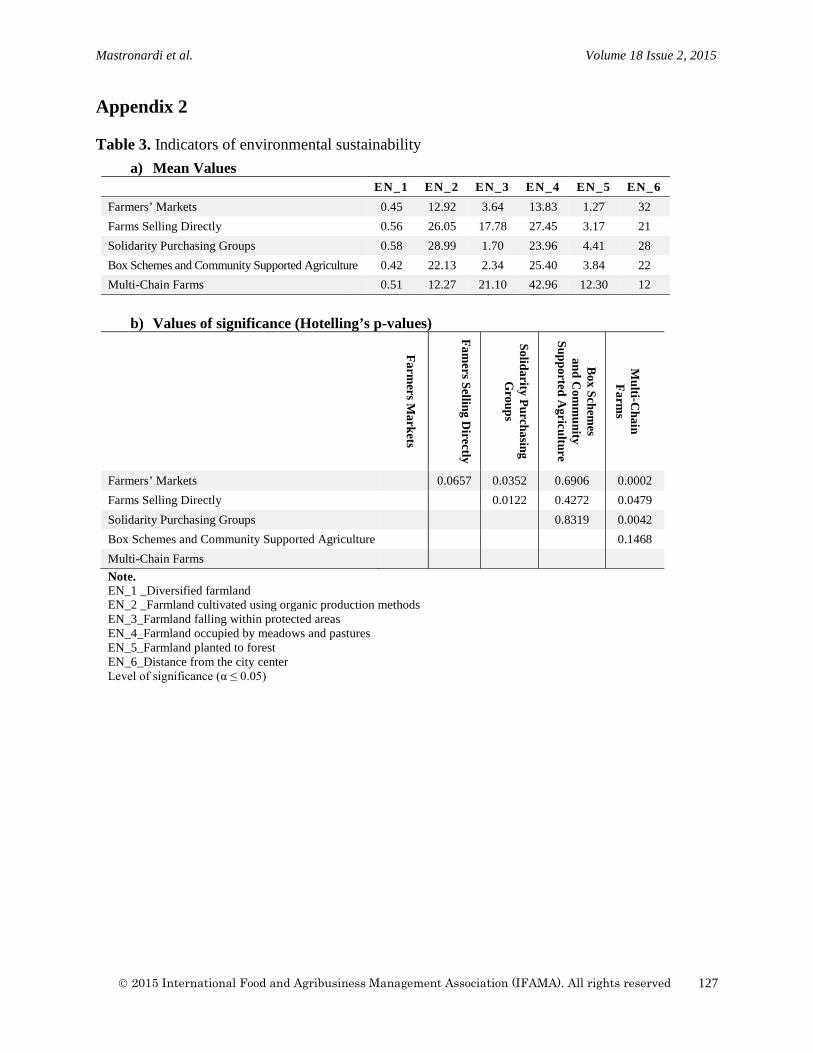
Mastronardi et al. Volume 18 Issue 2, 2015
Appendix 2 Table 3. Indicators of environmental sustainability
a) Mean Values
b) Values of significance (Hotelling’s p-values)
Note. EN_1 _Diversified farmland EN_2 _Farmland cultivated using organic production methods EN_3_Farmland falling within protected areas EN_4_Farmland occupied by meadows and pastures EN_5_Farmland planted to forest EN_6_Distance from the city center Level of significance (α ≤ 0.05)
EN_1 EN_2 EN_3 EN_4 EN_5 EN_6 Farmers’ Markets 0.45 12.92 3.64 13.83 1.27 32 Farms Selling Directly 0.56 26.05 17.78 27.45 3.17 21 Solidarity Purchasing Groups 0.58 28.99 1.70 23.96 4.41 28 Box Schemes and Community Supported Agriculture 0.42 22.13 2.34 25.40 3.84 22 Multi-Chain Farms 0.51 12.27 21.10 42.96 12.30 12
Farmers M
arkets
Famers Selling D
irectly
Solidarity Purchasing G
roups
Box Schemes
and Com
munity
Supported Agriculture
M
ulti-Chain
Farms
Farmers’ Markets 0.0657 0.0352 0.6906 0.0002 Farms Selling Directly 0.0122 0.4272 0.0479 Solidarity Purchasing Groups 0.8319 0.0042 Box Schemes and Community Supported Agriculture 0.1468 Multi-Chain Farms
2015 International Food and Agribusiness Management Association (IFAMA). All rights reserved
127
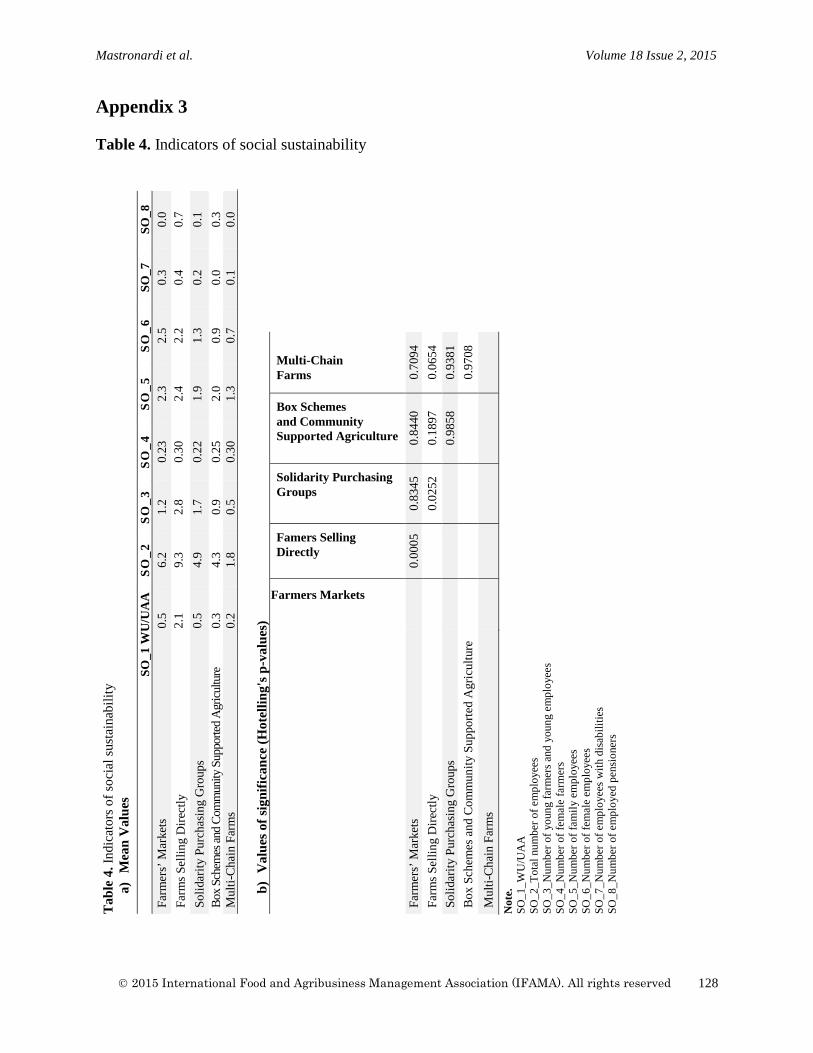
Mastronardi et al. Volume 18 Issue 2, 2015
Appendix 3 Table 4. Indicators of social sustainability
2015 International Food and Agribusiness Management Association (IFAMA). All rights reserved
128
Tab
le 4
. Ind
icat
ors o
f soc
ial s
usta
inab
ility
a)
Mea
n V
alue
s
b) V
alue
s of s
igni
fican
ce (H
otel
ling'
s p-v
alue
s)
Not
e.
SO_1
_WU
/UA
A
SO_2
_Tot
al n
umbe
r of e
mpl
oyee
s SO
_3_N
umbe
r of y
oung
farm
ers a
nd y
oung
em
ploy
ees
SO_4
_Num
ber o
f fem
ale
farm
ers
SO_5
_Num
ber o
f fam
ily e
mpl
oyee
s SO
_6_N
umbe
r of f
emal
e em
ploy
ees
SO_7
_Num
ber o
f em
ploy
ees w
ith d
isab
ilitie
s SO
_8_N
umbe
r of e
mpl
oyed
pen
sion
ers
SO_1
WU
/UA
A
SO_2
SO
_3
SO_4
SO
_5
SO_6
SO
_7
SO_8
Fa
rmer
s’ M
arke
ts 0.
5 6.
2 1.
2 0.
23
2.3
2.5
0.3
0.0
Farm
s Sel
ling
Dire
ctly
2.
1 9.
3 2.
8 0.
30
2.4
2.2
0.4
0.7
Solid
arity
Pur
chas
ing
Gro
ups
0.5
4.9
1.7
0.22
1.
9 1.
3 0.
2 0.
1 Bo
x Sc
hem
es an
d Co
mm
unity
Sup
porte
d A
gricu
lture
0.
3 4.
3 0.
9 0.
25
2.0
0.9
0.0
0.3
Mul
ti-C
hain
Far
ms
0.2
1.8
0.5
0.30
1.
3 0.
7 0.
1 0.
0
Farmers Markets
Famers Selling Directly
Solidarity Purchasing Groups
Box Schemes and Community Supported Agriculture
Multi-Chain Farms
Farm
ers’
Mar
kets
0.
0005
0.
8345
0.
8440
0.
7094
Fa
rms S
ellin
g D
irect
ly
0.02
52
0.18
97
0.06
54
Solid
arity
Pur
chas
ing
Gro
ups
0.
9858
0.
9381
B
ox S
chem
es a
nd C
omm
unity
Sup
porte
d A
gric
ultu
re
0.97
08
Mul
ti-C
hain
Far
ms
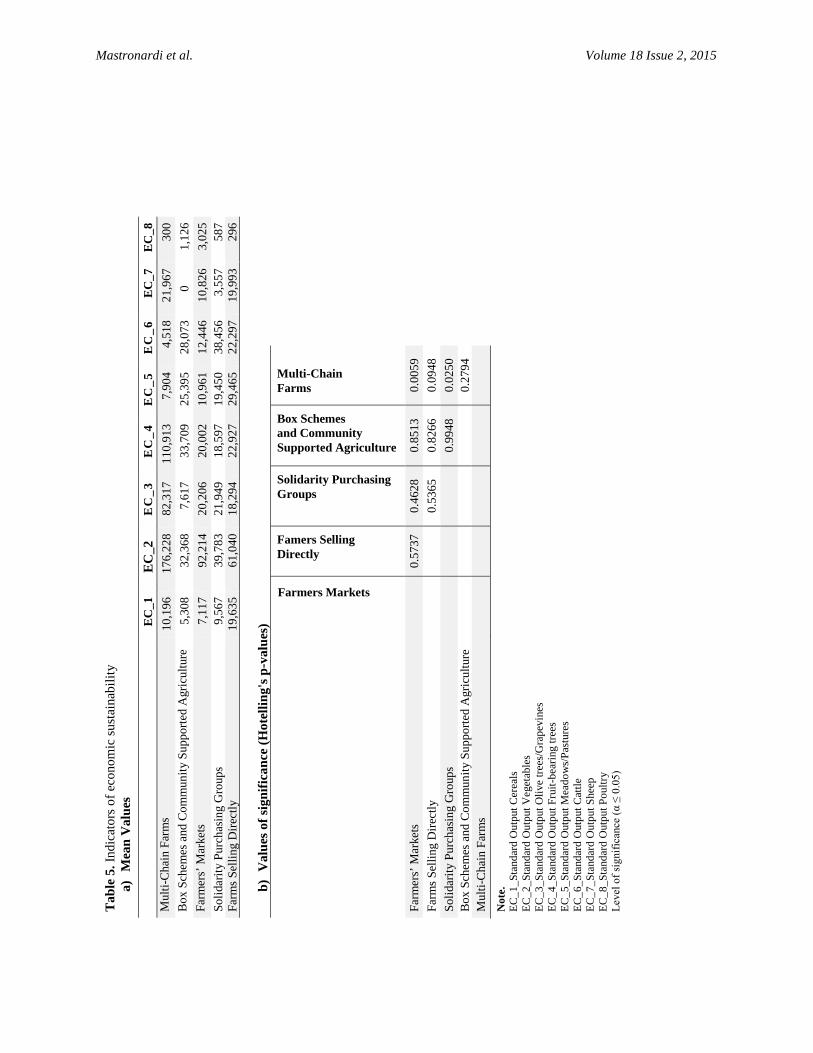
Mastronardi et al. Volume 18 Issue 2, 2015
Appendix 4 Table 5. Indicators of economic sustainability
2015 International Food and Agribusiness Management Association (IFAMA). All rights reserved
129
Tab
le 5
. Ind
icat
ors o
f eco
nom
ic su
stai
nabi
lity
a) M
ean
Val
ues
b) V
alue
s of s
igni
fican
ce (H
otel
ling'
s p-v
alue
s)
N
ote.
EC
_1_S
tand
ard
Out
put C
erea
ls
EC
_2_S
tand
ard
Out
put V
eget
able
s
EC_3
_Sta
ndar
d O
utpu
t Oliv
e tre
es/G
rape
vine
s
EC_4
_Sta
ndar
d O
utpu
t Fru
it-be
arin
g tre
es
EC
_5_S
tand
ard
Out
put M
eado
ws/
Past
ures
EC_6
_Sta
ndar
d O
utpu
t Cat
tle
EC
_7_S
tand
ard
Out
put S
heep
EC_8
_Sta
ndar
d O
utpu
t Pou
ltry
Leve
l of s
igni
fican
ce (α
≤ 0
.05)
E
C_1
E
C_2
E
C_3
E
C_4
E
C_5
E
C_6
E
C_7
E
C_8
M
ulti-
Cha
in F
arm
s 10
,196
17
6,22
8 82
,317
11
0,91
3 7,
904
4,51
8 21
,967
30
0 B
ox S
chem
es a
nd C
omm
unity
Sup
porte
d A
gric
ultu
re
5,30
8 32
,368
7,
617
33,7
09
25,3
95
28,0
73
0 1,
126
Farm
ers’
Mar
kets
7,11
7 92
,214
20
,206
20
,002
10
,961
12
,446
10
,826
3,
025
Solid
arity
Pur
chas
ing
Gro
ups
9,56
7 39
,783
21
,949
18
,597
19
,450
38
,456
3,
557
587
Farm
s Sel
ling
Dire
ctly
19
,635
61
,040
18
,294
22
,927
29
,465
22
,297
19
,993
29
6
Farmers Markets
Famers Selling Directly
Solidarity Purchasing Groups
Box Schemes and Community Supported Agriculture
Multi-Chain Farms
Farm
ers’
Mar
kets
0.
5737
0.
4628
0.
8513
0.
0059
Fa
rms S
ellin
g D
irect
ly
0.53
65
0.82
66
0.09
48
Solid
arity
Pur
chas
ing
Gro
ups
0.
9948
0.
0250
B
ox S
chem
es a
nd C
omm
unity
Sup
porte
d A
gric
ultu
re
0.27
94
Mul
ti-C
hain
Far
ms

Mastronardi et al. Volume 18 Issue 2, 2015
2015 International Food and Agribusiness Management Association (IFAMA). All rights reserved
130
International Food and Agribusiness Management Review Volume 18 Issue 2, 2015
Innovation in the Canadian Food Processing Industry: Evidence from the Workplace and Employee Survey
Sean Cahilla, Tabitha Richb, and Brian Cozzarinc
a Senior Economist, Agriculture and Agri-Food Canada, Research & Analysis Directorate, Strategic Policy Branch Tower 7-4, 1341 Baseline Road, Ottawa, Ontario, K1A 0C5, Canada
b Unit Head, Public Sector Statistics, Macroeconomic Accounts Branch, Statistics Canada, 100 Tunney's Pasture
Driveway, Ottawa, Ontario K1A 0T6 Canada
c Associate Professor, Department of Management Sciences, Faculty of Engineering, University of Waterloo 200 University Avenue West, Waterloo, Ontario, Canada N2L 3G1, Canada
Abstract The objective of this paper was to examine the link between innovation and profit in the Canadian food processing industry and other Canadian manufacturing industries using firm-level data. We conduct non-parametric tests using a panel of 723 manufacturing firms over eight years (N=5,784). The main finding is that profitability is higher for food processing innovators vs. non-innovators, but product-process innovators have greater profit and profit-margins than firms that have product-only or process-only innovation. Thus, a “one size fits all” policy that simply promotes innovation in manufacturing is not suitable for food processing, where firms that innovate in both product and process spheres is what really matters. Keywords: innovation, product; process, food processing, profit
Corresponding author: Tel: + 1.519.888.4587-33291
Email: B. Cozzarin: [email protected] S. Cahill: [email protected] T. Rich: [email protected]
2015 International Food and Agribusiness Management Association (IFAMA). All rights reserved
131
Cahill, Rich and Cozzarin Volume 18 Issue 2, 2015
Introduction The idea that innovating firms are more profitable than non-innovating firms has strong intuitive appeal, yet empirical evidence of this relationship is mixed (Geroski, Machin, and Van Reenen 1993; Cefis and Ciccarelli 2005; Baldwin and Sabourin 2001; Cozzarin 2004). Instead, it is a hypothesis that underpins models of innovation and government programs that aim to stimulate innovation. If innovation does not lead to greater profitability, costly policies and programs may not achieve their objectives. Similarly, analytical frameworks that are based on the assumption that innovation leads to greater profit will be less relevant if this relationship does not hold. In this paper we concern ourselves with the performance of the Canadian agri-food sector. The sector is of major importance, since in 2011, food and beverage production (NAICS 311 and 312) accounted for 1.68% of Canada’s national GDP, and 15.93% of total manufacturing GDP (Statistics Canada 2015). Only transportation and equipment manufacturing (NAICS 336) had double-digit importance to manufacturing GDP at 13.32% (and 1.41% in terms of national GDP). Our firm-level data from the Workplace and Employee Survey (WES) asked four questions regarding four different types regarding innovation. These yes/no (binary) questions asked whether the firm had introduced: (i) new products or services; (ii) improved products or services; (iii) had new processes; and/or (iv) improved processes over the past year. The primary objective of this paper is to examine the linkages between innovation and profit in the Canadian food processing industry and other Canadian manufacturing industries.1 The analysis uses test statistics to determine whether hypotheses concerning innovation and profit are supported by the data. The central hypothesis is that profit (profit-margin) for innovating firms is different from (greater than) the profit of non-innovating firms. While our main industry of interest is food processing, we included 17 other manufacturing industries. The other industries included will serve as a benchmark for the agri-food sector which is often characterized as not being very innovative. Related questions about innovation have received considerable attention. These pertain to the choice that firms make between product and process innovation. The second hypothesis tested is that process innovation is more profitable than product innovation. This test is based on an interpretation of the literature, which identifies productivity growth as one potential source of increased profit arising from innovation. The third hypothesis is that a combination of process and product innovation leads to greater profitability than a process or product innovation alone. This test addresses the issue of complementarity, where the combination of the two types of innovation achieve a more effective outcome than if each is introduced independently of the other.
1 Although our paper deals specifically with innovation and profit, a reviewer has correctly pointed out that there is substantial literature on the persistence of profitability and innovation. There are a number of notable studies such as (Cefis 2003; Cefis and Orsenigo 2001; P. A. Geroski and Machin 1993; Geroski, Machin, and Van Reenen 1993; Gschwandtner 2005; Hawawini, Subramanian, and Verdin 2003; Roberts 1999; Roberts 2001; Slade 2004; Teece 1986).
2015 International Food and Agribusiness Management Association (IFAMA). All rights reserved
132
Cahill, Rich and Cozzarin Volume 18 Issue 2, 2015
These tests are useful because they offer a systematic way to examine the impact of innovation on profit. If the tests confirm the intuitive notions, most of all that innovation is profitable, this will reinforce a widely held opinion. Alternatively, if the tests do not support this notion, then there are opportunities for analysis that allow for a wider range of outcomes from innovation. Either outcome could, therefore, lead to a richer understanding of the consequences of firm-level innovation decisions. The outline of the paper is as follows. Theories underlying the hypothesis tests, previous related empirical research, and more formal statements of the tests are discussed in the next section. A description of the WES data and, particularly, the linked data set, is given next. The section also presents tables summarizing the profitability and innovation data by industry. The hypothesis test results and discussion follow. The last section summarizes the findings and provides some concluding comments. Theory, Previous Empirical Research, and Hypotheses The central hypothesis described in the Introduction demands explanation since it seems unlikely that firms would innovate if they knew that this would not lead to a growth in profit. The outcome of an innovation, however, is uncertain, so the firm cannot know in advance what the effect of an innovation will be on profitability. Since the introduction of an innovation typically involves an investment of some sort, models of investment under uncertainty are useful for developing an understanding of the innovation decision. These models posit that the firm will choose the level of investment that maximizes the expected net present value of current and future profit, where uncertainty typically relates only to future prices (Stevens 1974, Craine 1975). Profit and Innovation Although we do not use an economic model of investment under uncertainty in our analysis per se, we instead use the ideas conceptually. Consider first, the firm that makes an innovation investment. It is possible to think of two optimization calculations, one with and one without the innovation investment. For simplicity, suppose that a firm’s decision to make the investment is based simply on a comparison between the expected net present value of a production plan with the innovation and the expected net present value of an alternative plan that does not include the innovation. This is essentially financial cost-benefit analysis under uncertainty (Graham 1981) There are two types of uncertainty in this framework. The first type is with respect to prices of output and input, while the second type is with respect to the “success” of the innovation, either in its usefulness within the firm (a process) or in market sales (a product). The firm’s decision will also depend, in part, on its risk preferences. If the firm (i.e. its owner) is risk averse, it will make more conservative decisions than if it is risk-neutral. Irrespective of the issues surrounding uncertainty, the decision to invest in the innovation must be based on ex-ante information. The ex-post profit for the innovating firm cannot be accurately compared with the profit that would have been earned without the innovation. This would require a counter-factual experiment that, even if it were conducted, could only provide
2015 International Food and Agribusiness Management Association (IFAMA). All rights reserved
133
Cahill, Rich and Cozzarin Volume 18 Issue 2, 2015
hypothetical information (i.e. an estimate of “what might have been”) regarding the success of the innovation. Consider now the firm that doesn’t innovate. For simplicity, suppose that this firm is identical in every regard to the innovating firm except that it has different expectations and/or risk preferences. For this firm, the expected net present value of a production plan without the innovation is higher than the expected net present value of a plan that incorporates the innovation. As a result, it will decide not to invest. This firm, too, would have difficulty determining the size of the contribution that the innovation might have made since it would also require a counter-factual experiment. The preceding line of argument suggests that the relationship between innovation and profit must be tested, but that the test cannot be made with data for one firm alone since this requires a counterfactual experiment. If, however, a sufficiently large sample is used, it should be possible to measure significant differences between the two types of firms. This leads to a more specific statement, namely:
H1: Profit for innovators will be significantly different from non-innovators. Empirical Literature Related to H1 While there is not a large literature on the subject, there have been several studies that have tested H1 or variants of it with firm-level data. Recently authors (Geroski, Machin, and Van Reenen 1993) used data for 721 U.K. manufacturing firms, including 72 firms in the food, drink, and tobacco industry. They found a positive long-run effect of innovation on profit margins across all firms together, but a negative effect for the food, drink and tobacco industry and two other industries. Other authors (Cefis and Ciccarelli 2005) sought whether differences in profitability come from innovations themselves or merely from innovative firms having greater competency in business. They divide their sample between innovators and non-innovators, and base their tests on differences in distributions between the two groups. They find a statistically significant difference between the two groups, with innovators being the more profitable of the two. They conclude that innovation seems to have contributed to the observed profit differentials. There has been previous work that tests the profit-innovation relationship for Canadian manufacturing but nothing specifically for the Canadian food processing industry. In terms of all manufacturing industries, researchers at Statistics Canada assess the impact of technology adoption on profitability (Baldwin and Sabourin 2001). Using the 1998 Survey of Advanced Technology and the Annual Survey of Manufacturers (excluding the food industry), firms are grouped according to whether they are higher or lower than median growth in performance. The differences between the two groups are compared, and plants with the highest growth in profitability are shown to also have higher rates of technology growth. Another Statistics Canada study used data for growing small-sized and medium-sized firms to test several hypotheses related to innovation (Baldwin and Johnson 1995). The authors test for a
2015 International Food and Agribusiness Management Association (IFAMA). All rights reserved
134
Cahill, Rich and Cozzarin Volume 18 Issue 2, 2015
significant difference between “general profitability” for innovative and non-innovative firms. They find the difference to be positive, but not significant. No distinction is made between the firms in terms of industry, and so no results are generated that are specific to the Canadian food processing industry. More recently firm-level data from the 1999 Survey of Innovation linked with data from the Annual Survey of Manufacturing and Logging was used to test the profitability-innovation nexus (Cozzarin 2004). This data, which includes data for firms in most Canadian manufacturing industries including food processing, is used to measure the relationship between innovation and value-added. The estimated coefficients for innovation, which are common across all firms, are positive but have high standard errors. This result suggests that, as in Baldwin and Johnson (1995), innovators seem to have had higher profit than non-innovators on average, but that the levels of profit are not significantly different. Another author tests the hypothesis that innovation is positively associated with revenue growth using WES data for 1999 and 2000 (Thornhill 2006). The estimated coefficient on innovation is positive and significant. No specific results for the Canadian food processing industry are reported. The various studies cited here seem to offer a mixed set of results, with some finding clear support for the link between innovation and profitability and others finding only limited support. These latter studies instead report a positive but statistically insignificant relationship between innovation and profitability. This evidence suggests that the relationship between innovation and profitability is not certain and that its statistical significance should be tested. Profit and Type of Innovation Where firms do innovate, the question is no longer whether innovators are more profitable than non-innovators, but rather whether certain types of innovation are more profitable than others. One general area of interest in this regard has been in the choice between process and product innovation, with emphasis varying between purely theoretical, applied, and atheoretical approaches. On the theoretical side, there have been a number of contributions. For example, Cohen and Klepper (1996) look at different ways that process and product R&D can affect profitability. In their model, process R&D is assumed to generate increased profit from reductions in average cost. Product R&D, however, is posited to affect product attributes and quality but not cost, so that higher profit comes about from higher prices. The model suggests that the share of process over product R&D increases with firm size. Petsas and Giannikos (2005) use a differentiated product framework to examine the process-product issue. In their model, firms choose an optimal mix of process and product innovation, and this mix depends on firm size. The marginal product of each type of innovation differs, as in the Klepper and Cohen framework, because the level of output affects returns from process but not product R&D. The Petsas and Giannikos model shows that, for a firm that produces several products, product innovation will be more profitable than process innovation up to a threshold number of products, beyond which process innovation will have a larger incremental effect on profit. Capitanio, Coppola, and Pascucci (2010) estimate a nested logit model to measure the relative importance of various explanatory variables in the choice of process or product innovation.
2015 International Food and Agribusiness Management Association (IFAMA). All rights reserved
135
Cahill, Rich and Cozzarin Volume 18 Issue 2, 2015
They look at innovation in food processing specifically. They argue that the food industry has specific innovation patterns, where firms introduce process innovation more often that product innovation and where the latter tend to be incremental. Their study is primarily concerned with the factors leading to the choice of one over the other type of innovation, but their observations regarding the higher frequency of process innovation suggests that these are the more profitable type for food processors. Bertschek (1995) offers a theoretical framework that incorporates the effects of foreign direct investment on innovation. Cost is affected by both process and product innovation while output price is affected only by product innovation. Bertschek estimates this model using a probit procedure. By design, this approach only offers information about the significance of explanatory variables in determining whether product or process innovation is performed. It is not possible, with this type of model, to estimate the effects of the two types of innovation on profit. Rouvinen (2002) develops a theoretical model that infers relative profitability from the choice that has been made between product and process innovation. The estimation procedure is bivariate probit – this allows for some complementarity but more importantly, is consistent with most of the empirical research in this field in measuring the determinants of the choice of innovation, rather than the impact of the choice of innovation on the level of profitability. Rosenkranz (2003) provides a purely theoretical approach to the decision between process and product innovation. This model provides ambiguous results, showing that there are a variety of factors that affect a firm’s choice between the two types of innovation. Each decision is dependent on firm-specific parameters, so the model does not offer information about the possible outcome of the actual choice that is made. Hall, Lotti, and Mairesse (2009) estimate a model that uses predicted probabilities of process and product innovation as explanatory variables in an estimated productivity equation. Their estimates show, for a specification that excludes capital, that process innovation has a significant positive effect on productivity and that this effect is larger than the impact of product innovation, which is also positive. The relative contribution of process and product innovation is reversed when capital is included in the equation, but both still have a positive impact on productivity. From the foregoing, we conclude that the literature does not offer clear guidance regarding the relative impact of process and product innovation on profitability. The common assumption is that process innovation will be cost-reducing (productivity-improving) and that product innovation will tend to raise cost, if anything. This is tested here as:
H2: (a) there will be a significant difference between profitability for product-only innovators and process-only innovators and (b) firms introducing process only innovation will have greater profitability than product-only innovators.
2015 International Food and Agribusiness Management Association (IFAMA). All rights reserved
136
Cahill, Rich and Cozzarin Volume 18 Issue 2, 2015
Empirical Literature Related to H2 There is little in the way of previous empirical work that has involved a test of this hypothesis. Of the studies cited above, none examine the effect of process and product innovation on profit directly; instead attempts are made to identify the factors that drive the choice between the two types of innovation, where the latter is usually treated as a binary variable. There is limited evidence for Canadian manufacturing of the factors leading to the decision of process or product innovation as well as the impact of each type of innovation on profit. Baldwin and Sabourin (1999) estimate logit equations to explain different types of innovation in terms of plant, firm and industry characteristics for a sample of Canadian food processing firms. These results do not, however, give any insight into the relative profitability of the choices made. Therrien and Hanel (2009) offer evidence of the impact of processing and product innovation on labor productivity but no direct evidence of the impact on profitability. They use data from the 2005 Survey of Innovation and linked to Annual Survey of Manufactures and Logging data. Their estimates show the counterintuitive results that process innovation lowers labor productivity. Profit and Complementarity A related issue is whether the two types of innovation are complementary, i.e. whether profitability of innovation is higher if firms introduce both process and product at the same time. There is some theoretical and empirical support for this notion. For example, Mantovani (2006) uses a model that shares some features of both Cohen and Klepper’s and Petsas and Giannikos’ models in showing how the marginal profitability of two innovations together might exceed that of doing them separately. Kraft (1990) argues that there are obvious reasons why the two types of innovation might not be independent of each other, for example, where a new process is needed to produce a new product. While not offering a strong theoretical framework, Kraft’s estimates, using a probit model, indicate that product innovation has an impact on the adoption of a process innovation but that the reverse does not hold. It is possible that product innovation will be more profitable if it is accompanied by process innovation, where the latter should be cost-reducing and, therefore, offset some of the (assumed) cost-increasing effects of product innovation referred to in the literature. Similarly, process innovation may be more profitable if it is accompanied by product innovation, providing any increase in cost due to the introduction of new products is offset by increased revenue. So it seems reasonable to suppose that combined process and product innovation would be more profitable than either innovation alone. This leads to the third hypothesis to be tested here, namely:
H3: (a) there will be a significant difference between the profitability of product-process innovators versus product-only innovators and process-only innovators (b) firms with product-process innovation with have greater profitability than the other two types of innovators.
2015 International Food and Agribusiness Management Association (IFAMA). All rights reserved
137
Cahill, Rich and Cozzarin Volume 18 Issue 2, 2015
Empirical Literature Related to H3 As in the case of process and product innovation, there has been little work on the issue of process-product innovation complementarity in Canadian manufacturing. In terms of complementarity, Cozzarin and Percival (2006) consider firm strategies while controlling for innovation novelty (world-first, Canada-first, and firm-first) using the 1999 Survey of Innovation. Brewin, Monchuk, and Partridge (2009) appears to be the only example that examines product-process complementarity, although their paper does not address the relative profitability of the innovation types. They estimate a multivariate probit model using a sample of 1200 food processors and conclude that there are complementarities between process and product innovation, particularly when these innovations are developed in-house. The Data Statistical agencies have been conducting innovation surveys for nearly two decades (OECD 2005). Statistics Canada’s Survey of Innovation and Advanced Technology (conducted in 1993) is the first Canadian survey that collected comprehensive data on innovation activity. Since then, Statistics Canada has carried out a variety of innovation surveys, the two most recent being the Survey on the Commercialization of Innovation, 2007 and the Survey of Innovation and Business Strategy, 2009. While some innovation surveys have collected economic data (such as the value of investment in innovation), questions regarding revenue, cost of production or profit have been missing, meaning that the data are of limited value for economic analysis. We use the Workplace and Employee Survey for our analysis, and while it is not an innovation survey, it asked several questions related to innovation activity as well as questions related to input cost, revenue, hires-terminations and employee characteristics. The survey was conducted between 1999 and 2006 by Canada’s national statistical agency and, as such, is unique in offering a cross-sectional/time-series data set for analysis of manufacturing firms, including those primarily engaged in food processing. The WES followed a longitudinal, integrated approach to the collection and analysis of data on firms and their employees. These data are, therefore, well-suited for carrying out the types of hypothesis tests described in the previous section. To capture innovation activity, the WES asked firms whether they had introduced new products/services, improved products/services, new processes or improved processes. The questions were generally consistent with the OECD’s Oslo Manual, which defines a product innovation as “the introduction of a good or service that is new or significantly improved with respect to its characteristics or intended uses” (OECD 2005) and a process innovation as “the implementation of a new or significantly improved production or delivery method” (OECD 2005). Firms were also asked questions about financial information such as gross operating revenue from the sale or rental of all products and services and gross operating expenditure (payroll, non-wage expenses and the purchase of goods). Analysis by detailed industry such as food processing requires access to the micro data. Access to these data was provided by Statistics Canada’s Federal Research Data Centre in Ottawa.
2015 International Food and Agribusiness Management Association (IFAMA). All rights reserved
138
Cahill, Rich and Cozzarin Volume 18 Issue 2, 2015
Workplace data over the full eight years allows for a maximum sample size of 10,248 manufacturing firms. Linking all eight years for manufacturing industries resulted in some losses in the sample due to 2,308 workplaces being rotated out of the survey frame and 1,348 lost due to bankruptcy, merger, or acquisition. In addition, sixty workplaces were removed from the linked dataset due to anomalies. The resulting sample size was 5,784 observations over eight years or a panel of 723 firms for the manufacturing sector. It is important to note that, by using panel data, both innovating and non-innovating firms in the panel are by definition profitable (or at least break even) on average, since they survive over the whole eight years. This means that only “successful” firms are examined, where each firm’s choice to innovate or not innovate has not prevented it from staying in business. The panel dataset was constructed using a two-stage programming process in SAS. The first stage involved extracting all manufacturing firms as a subset of the data collected in each survey year using the associated North American Industry Classification System (NAICS) coding. Next, the eight sets of firms (one set for each year) were linked across time via another programming module to match a unique firm identifier across years. A backward linkage approach created a panel of firms, grouped by 3-digit NAICS industry. Profit is defined as the difference between gross operating revenue and gross operating expenditure where data for both variables is collected by two separate questions in the WES questionnaire. Profit can be interpreted either as the cost of capital services from productive capital or as the return to that capital (capital income). The latter interpretation is common, particularly in relation to the National Accounts - see, for example, Diewert, Harrison, and Schreyer (2004) and Statistics Canada (2008). This interpretation suits our analysis well, since the expected net present value of the change in profit due to the innovation investment is the return to that investment. In addition, to deal with scale effects we use a second measure—profit-margin, which is defined as (gross operating revenue – gross operating expenditure)/gross operating revenue. Profit is commonly used as a measure of firm-level profit in empirical research. For example: Schivardi et al. (2010) use profit data to estimate a profit-margin for retailers in their analysis of the impact of changes in regulations restricting store sizes; Coad, Rao, and Tamagni (2011) investigate the interaction between several variables typically used to assess the degree of firm-level growth, using gross operating revenue minus gross operating expenditure as one of these variables and referring to it as “profit”; and Du Caju, Rycx, and Tojerow (2011) use gross operating revenue minus gross operating expenditure to construct profit-per-worker as an explanatory variable in their wage equations. To summarize the data, average annual profit and profit-margin for each industry was calculated for 1999-2006. The averages are depicted in Table 1. In spite of the importance of the food processing industry in terms of its share of the manufacturing sector’s GDP and employment, average profit of $1,211,222 was lower than the median of $1,574,374 across all manufacturing industries. In terms of profit-margin food processing is in the top seven industries, while the beverage and tobacco product industry is in the top two industries.
2015 International Food and Agribusiness Management Association (IFAMA). All rights reserved
139
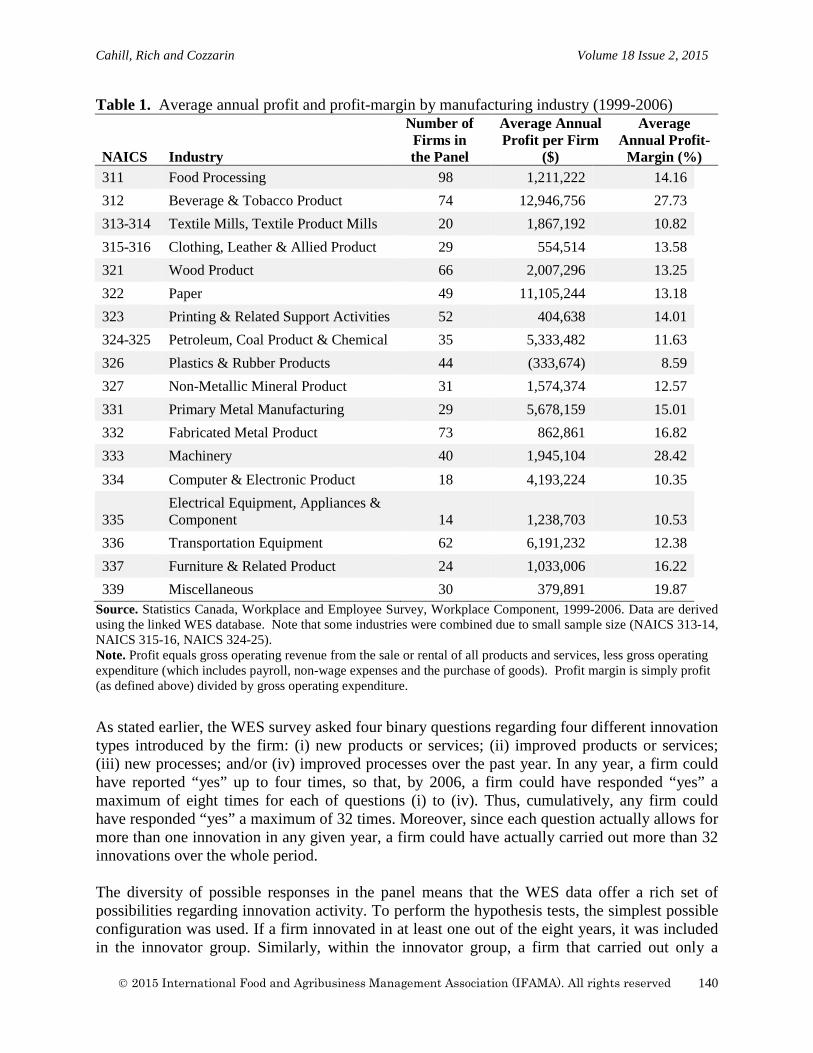
Cahill, Rich and Cozzarin Volume 18 Issue 2, 2015
Table 1. Average annual profit and profit-margin by manufacturing industry (1999-2006)
NAICS Industry
Number of Firms in the Panel
Average Annual Profit per Firm
($)
Average Annual Profit-
Margin (%) 311 Food Processing 98 1,211,222 14.16 312 Beverage & Tobacco Product 74 12,946,756 27.73 313-314 Textile Mills, Textile Product Mills 20 1,867,192 10.82 315-316 Clothing, Leather & Allied Product 29 554,514 13.58 321 Wood Product 66 2,007,296 13.25 322 Paper 49 11,105,244 13.18 323 Printing & Related Support Activities 52 404,638 14.01 324-325 Petroleum, Coal Product & Chemical 35 5,333,482 11.63 326 Plastics & Rubber Products 44 (333,674) 8.59 327 Non-Metallic Mineral Product 31 1,574,374 12.57 331 Primary Metal Manufacturing 29 5,678,159 15.01 332 Fabricated Metal Product 73 862,861 16.82 333 Machinery 40 1,945,104 28.42 334 Computer & Electronic Product 18 4,193,224 10.35
335 Electrical Equipment, Appliances & Component 14 1,238,703 10.53
336 Transportation Equipment 62 6,191,232 12.38 337 Furniture & Related Product 24 1,033,006 16.22 339 Miscellaneous 30 379,891 19.87
Source. Statistics Canada, Workplace and Employee Survey, Workplace Component, 1999-2006. Data are derived using the linked WES database. Note that some industries were combined due to small sample size (NAICS 313-14, NAICS 315-16, NAICS 324-25). Note. Profit equals gross operating revenue from the sale or rental of all products and services, less gross operating expenditure (which includes payroll, non-wage expenses and the purchase of goods). Profit margin is simply profit (as defined above) divided by gross operating expenditure.
As stated earlier, the WES survey asked four binary questions regarding four different innovation types introduced by the firm: (i) new products or services; (ii) improved products or services; (iii) new processes; and/or (iv) improved processes over the past year. In any year, a firm could have reported “yes” up to four times, so that, by 2006, a firm could have responded “yes” a maximum of eight times for each of questions (i) to (iv). Thus, cumulatively, any firm could have responded “yes” a maximum of 32 times. Moreover, since each question actually allows for more than one innovation in any given year, a firm could have actually carried out more than 32 innovations over the whole period. The diversity of possible responses in the panel means that the WES data offer a rich set of possibilities regarding innovation activity. To perform the hypothesis tests, the simplest possible configuration was used. If a firm innovated in at least one out of the eight years, it was included in the innovator group. Similarly, within the innovator group, a firm that carried out only a
2015 International Food and Agribusiness Management Association (IFAMA). All rights reserved
140
Cahill, Rich and Cozzarin Volume 18 Issue 2, 2015
process innovation in one or more years was included in the set of firms identified as process innovators, etc. Table 2 summarized the data in terms of innovation type. The second column gives the proportion of total firms in each industry panel that fit into one of three categories of innovation between 1999 and 2006–these are the “innovator” firms. A firm in the “process innovation” category introduced, in at least one of these years, a new process, an improved process or both, but did not introduce a new or improved product in any year. Similarly, a firm in the “product innovation” category introduced, in at least one year, a new product, an improved product or both, but did not introduce a process innovation in any year. A firm in the “both product and process innovation” category introduced, in at least one year, a new and/or improved process and in the same year or some other year, introduced a new and/or improved product as well. For food processing, 60% of firms introduced at least one innovation over this period. The “any innovation” rate for the food processing panel was higher than the median rate across all industries, which was 53%. The three other columns in Table 2 illustrate the diversity of innovation both within and across types. The rate of product innovation for firms in the food processing industry was 20%. This is the second highest product innovation rate out of all industry panels. For process innovations, food processing firms were below the median of 5%. The food processing industry introduced both product and process innovation (new and/or improved) at the median rate (36%); this is higher than the rate for process or product innovation alone and was the most common case for all but one industry as well. What the data show is that, with only one exception, a higher proportion of firms in the industry panels introduced product-only innovations than process-only innovations. For some industries, including food processing, the difference was quite large, with the proportion of firms introducing product-only innovations several times higher than those introducing process innovations only. For the food processing industry panel, the former was almost nine times higher than the latter. The data also show that, with only one exception, the proportion of firms that introduced both product and process innovation was several times higher than the proportion introducing one or the other type alone. For the food processing industry panel, the proportion introducing both types of innovation was almost twice as high as that for one or the other alone.
2015 International Food and Agribusiness Management Association (IFAMA). All rights reserved
141
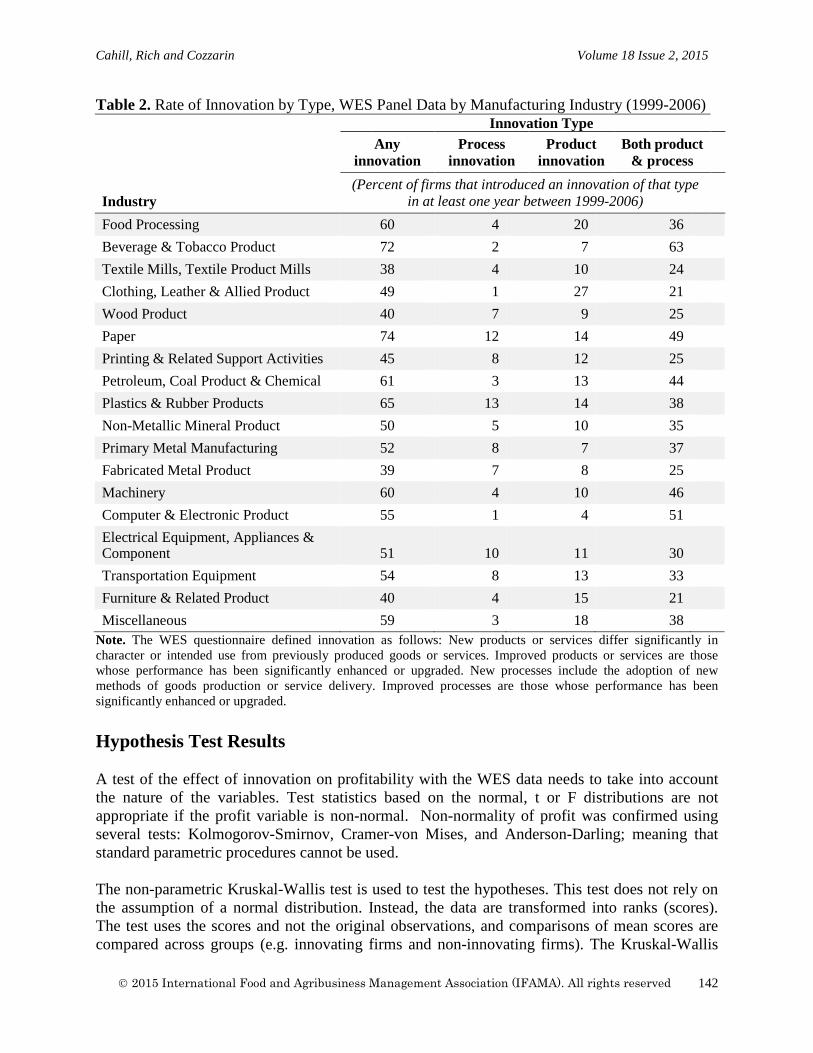
Cahill, Rich and Cozzarin Volume 18 Issue 2, 2015
Table 2. Rate of Innovation by Type, WES Panel Data by Manufacturing Industry (1999-2006)
Innovation Type
Any innovation
Process innovation
Product innovation
Both product & process
Industry (Percent of firms that introduced an innovation of that type
in at least one year between 1999-2006)
Food Processing 60 4 20 36 Beverage & Tobacco Product 72 2 7 63 Textile Mills, Textile Product Mills 38 4 10 24 Clothing, Leather & Allied Product 49 1 27 21 Wood Product 40 7 9 25 Paper 74 12 14 49 Printing & Related Support Activities 45 8 12 25 Petroleum, Coal Product & Chemical 61 3 13 44 Plastics & Rubber Products 65 13 14 38 Non-Metallic Mineral Product 50 5 10 35 Primary Metal Manufacturing 52 8 7 37 Fabricated Metal Product 39 7 8 25 Machinery 60 4 10 46 Computer & Electronic Product 55 1 4 51 Electrical Equipment, Appliances & Component 51 10 11 30
Transportation Equipment 54 8 13 33 Furniture & Related Product 40 4 15 21 Miscellaneous 59 3 18 38
Note. The WES questionnaire defined innovation as follows: New products or services differ significantly in character or intended use from previously produced goods or services. Improved products or services are those whose performance has been significantly enhanced or upgraded. New processes include the adoption of new methods of goods production or service delivery. Improved processes are those whose performance has been significantly enhanced or upgraded. Hypothesis Test Results A test of the effect of innovation on profitability with the WES data needs to take into account the nature of the variables. Test statistics based on the normal, t or F distributions are not appropriate if the profit variable is non-normal. Non-normality of profit was confirmed using several tests: Kolmogorov-Smirnov, Cramer-von Mises, and Anderson-Darling; meaning that standard parametric procedures cannot be used. The non-parametric Kruskal-Wallis test is used to test the hypotheses. This test does not rely on the assumption of a normal distribution. Instead, the data are transformed into ranks (scores). The test uses the scores and not the original observations, and comparisons of mean scores are compared across groups (e.g. innovating firms and non-innovating firms). The Kruskal-Wallis
2015 International Food and Agribusiness Management Association (IFAMA). All rights reserved
142
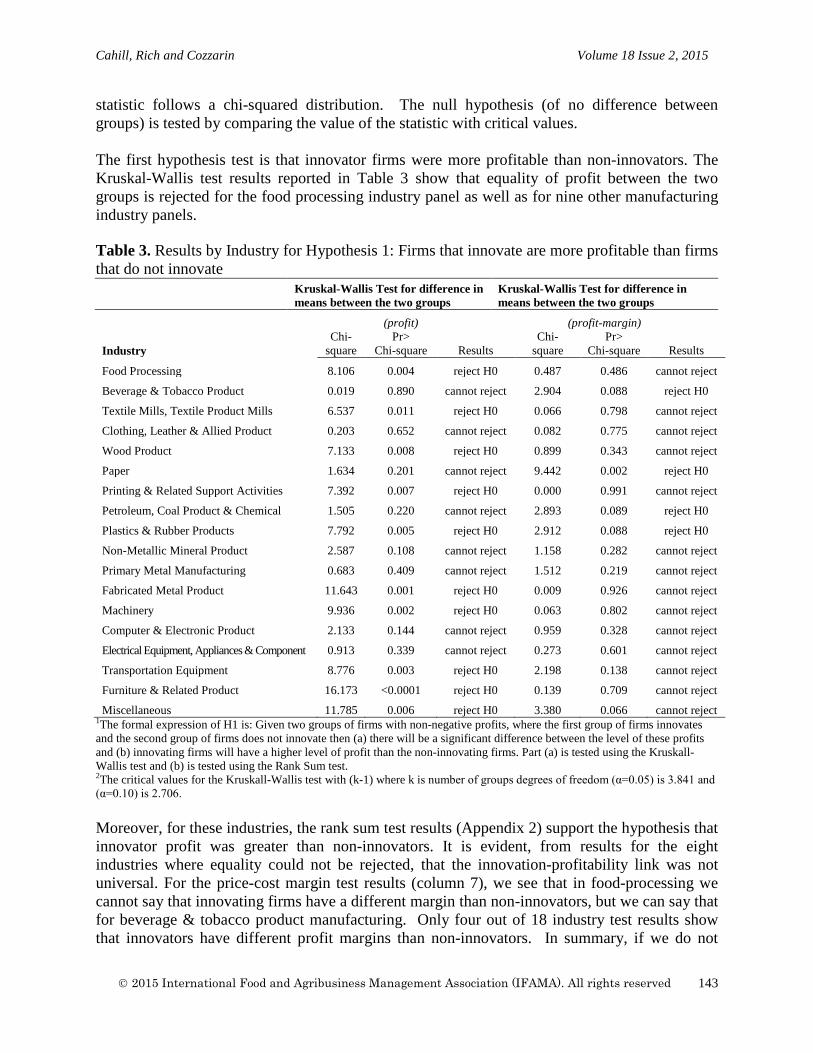
Cahill, Rich and Cozzarin Volume 18 Issue 2, 2015
statistic follows a chi-squared distribution. The null hypothesis (of no difference between groups) is tested by comparing the value of the statistic with critical values. The first hypothesis test is that innovator firms were more profitable than non-innovators. The Kruskal-Wallis test results reported in Table 3 show that equality of profit between the two groups is rejected for the food processing industry panel as well as for nine other manufacturing industry panels. Table 3. Results by Industry for Hypothesis 1: Firms that innovate are more profitable than firms that do not innovate
Kruskal-Wallis Test for difference in means between the two groups
Kruskal-Wallis Test for difference in means between the two groups
(profit) (profit-margin)
Industry Chi-
square Pr>
Chi-square Results Chi-
square Pr>
Chi-square Results
Food Processing 8.106 0.004 reject H0 0.487 0.486 cannot reject
Beverage & Tobacco Product 0.019 0.890 cannot reject 2.904 0.088 reject H0
Textile Mills, Textile Product Mills 6.537 0.011 reject H0 0.066 0.798 cannot reject
Clothing, Leather & Allied Product 0.203 0.652 cannot reject 0.082 0.775 cannot reject
Wood Product 7.133 0.008 reject H0 0.899 0.343 cannot reject
Paper 1.634 0.201 cannot reject 9.442 0.002 reject H0
Printing & Related Support Activities 7.392 0.007 reject H0 0.000 0.991 cannot reject
Petroleum, Coal Product & Chemical 1.505 0.220 cannot reject 2.893 0.089 reject H0
Plastics & Rubber Products 7.792 0.005 reject H0 2.912 0.088 reject H0
Non-Metallic Mineral Product 2.587 0.108 cannot reject 1.158 0.282 cannot reject
Primary Metal Manufacturing 0.683 0.409 cannot reject 1.512 0.219 cannot reject
Fabricated Metal Product 11.643 0.001 reject H0 0.009 0.926 cannot reject
Machinery 9.936 0.002 reject H0 0.063 0.802 cannot reject
Computer & Electronic Product 2.133 0.144 cannot reject 0.959 0.328 cannot reject
Electrical Equipment, Appliances & Component 0.913 0.339 cannot reject 0.273 0.601 cannot reject
Transportation Equipment 8.776 0.003 reject H0 2.198 0.138 cannot reject
Furniture & Related Product 16.173 <0.0001 reject H0 0.139 0.709 cannot reject
Miscellaneous 11.785 0.006 reject H0 3.380 0.066 cannot reject 1The formal expression of H1 is: Given two groups of firms with non-negative profits, where the first group of firms innovates and the second group of firms does not innovate then (a) there will be a significant difference between the level of these profits and (b) innovating firms will have a higher level of profit than the non-innovating firms. Part (a) is tested using the Kruskall-Wallis test and (b) is tested using the Rank Sum test. 2The critical values for the Kruskall-Wallis test with (k-1) where k is number of groups degrees of freedom (α=0.05) is 3.841 and (α=0.10) is 2.706. Moreover, for these industries, the rank sum test results (Appendix 2) support the hypothesis that innovator profit was greater than non-innovators. It is evident, from results for the eight industries where equality could not be rejected, that the innovation-profitability link was not universal. For the price-cost margin test results (column 7), we see that in food-processing we cannot say that innovating firms have a different margin than non-innovators, but we can say that for beverage & tobacco product manufacturing. Only four out of 18 industry test results show that innovators have different profit margins than non-innovators. In summary, if we do not
2015 International Food and Agribusiness Management Association (IFAMA). All rights reserved
143
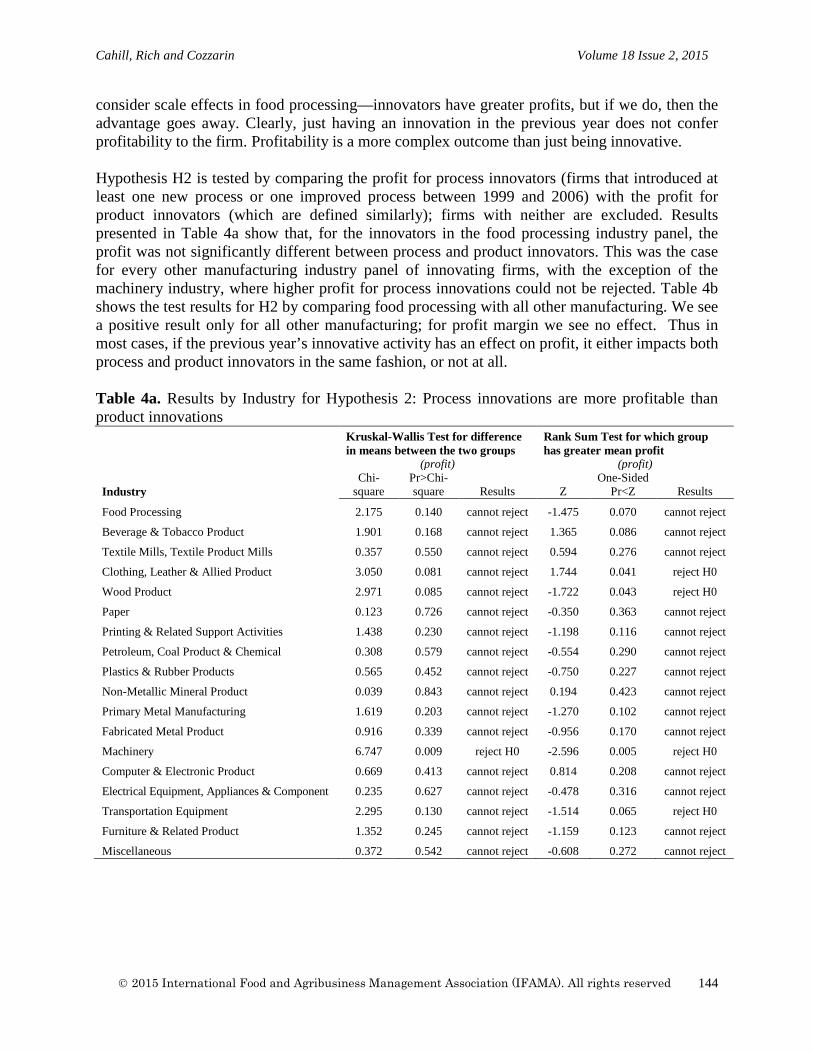
Cahill, Rich and Cozzarin Volume 18 Issue 2, 2015
consider scale effects in food processing—innovators have greater profits, but if we do, then the advantage goes away. Clearly, just having an innovation in the previous year does not confer profitability to the firm. Profitability is a more complex outcome than just being innovative. Hypothesis H2 is tested by comparing the profit for process innovators (firms that introduced at least one new process or one improved process between 1999 and 2006) with the profit for product innovators (which are defined similarly); firms with neither are excluded. Results presented in Table 4a show that, for the innovators in the food processing industry panel, the profit was not significantly different between process and product innovators. This was the case for every other manufacturing industry panel of innovating firms, with the exception of the machinery industry, where higher profit for process innovations could not be rejected. Table 4b shows the test results for H2 by comparing food processing with all other manufacturing. We see a positive result only for all other manufacturing; for profit margin we see no effect. Thus in most cases, if the previous year’s innovative activity has an effect on profit, it either impacts both process and product innovators in the same fashion, or not at all. Table 4a. Results by Industry for Hypothesis 2: Process innovations are more profitable than product innovations
Kruskal-Wallis Test for difference in means between the two groups
Rank Sum Test for which group has greater mean profit
(profit) (profit)
Industry Chi-
square Pr>Chi-square Results Z
One-Sided Pr<Z Results
Food Processing 2.175 0.140 cannot reject -1.475 0.070 cannot reject
Beverage & Tobacco Product 1.901 0.168 cannot reject 1.365 0.086 cannot reject
Textile Mills, Textile Product Mills 0.357 0.550 cannot reject 0.594 0.276 cannot reject
Clothing, Leather & Allied Product 3.050 0.081 cannot reject 1.744 0.041 reject H0
Wood Product 2.971 0.085 cannot reject -1.722 0.043 reject H0
Paper 0.123 0.726 cannot reject -0.350 0.363 cannot reject
Printing & Related Support Activities 1.438 0.230 cannot reject -1.198 0.116 cannot reject
Petroleum, Coal Product & Chemical 0.308 0.579 cannot reject -0.554 0.290 cannot reject
Plastics & Rubber Products 0.565 0.452 cannot reject -0.750 0.227 cannot reject
Non-Metallic Mineral Product 0.039 0.843 cannot reject 0.194 0.423 cannot reject
Primary Metal Manufacturing 1.619 0.203 cannot reject -1.270 0.102 cannot reject
Fabricated Metal Product 0.916 0.339 cannot reject -0.956 0.170 cannot reject
Machinery 6.747 0.009 reject H0 -2.596 0.005 reject H0
Computer & Electronic Product 0.669 0.413 cannot reject 0.814 0.208 cannot reject
Electrical Equipment, Appliances & Component 0.235 0.627 cannot reject -0.478 0.316 cannot reject
Transportation Equipment 2.295 0.130 cannot reject -1.514 0.065 reject H0
Furniture & Related Product 1.352 0.245 cannot reject -1.159 0.123 cannot reject
Miscellaneous 0.372 0.542 cannot reject -0.608 0.272 cannot reject
2015 International Food and Agribusiness Management Association (IFAMA). All rights reserved
144
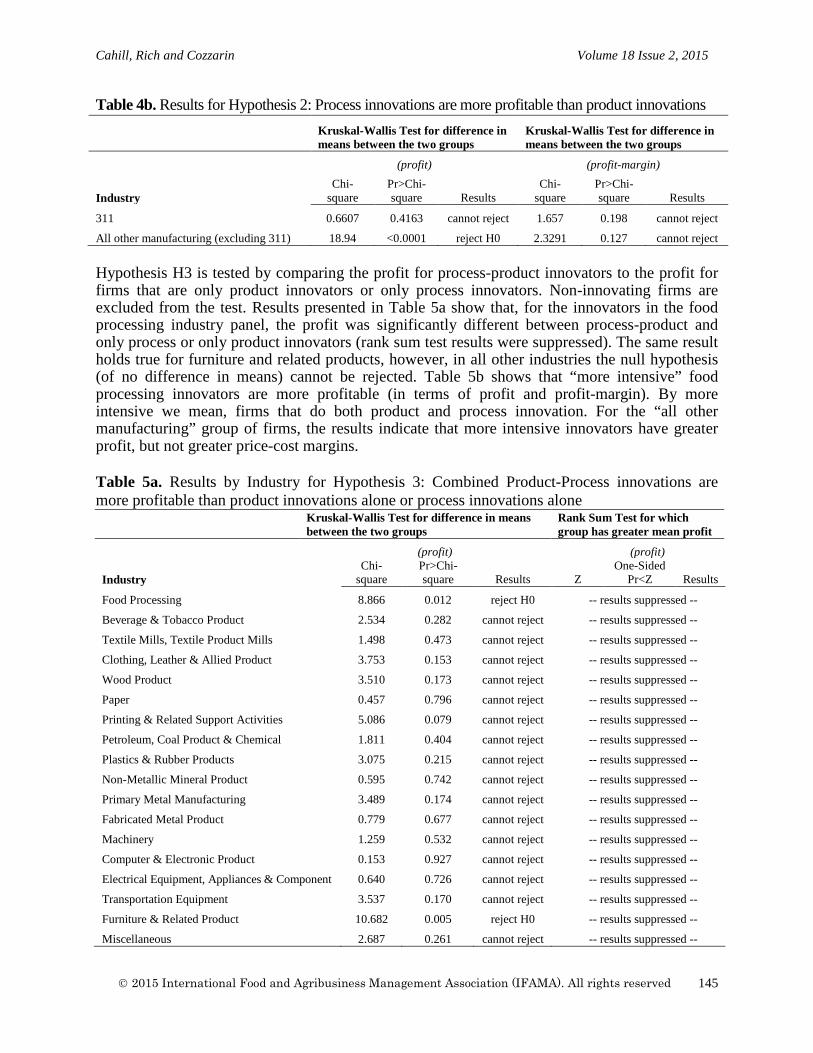
Cahill, Rich and Cozzarin Volume 18 Issue 2, 2015
Table 4b. Results for Hypothesis 2: Process innovations are more profitable than product innovations
Hypothesis H3 is tested by comparing the profit for process-product innovators to the profit for firms that are only product innovators or only process innovators. Non-innovating firms are excluded from the test. Results presented in Table 5a show that, for the innovators in the food processing industry panel, the profit was significantly different between process-product and only process or only product innovators (rank sum test results were suppressed). The same result holds true for furniture and related products, however, in all other industries the null hypothesis (of no difference in means) cannot be rejected. Table 5b shows that “more intensive” food processing innovators are more profitable (in terms of profit and profit-margin). By more intensive we mean, firms that do both product and process innovation. For the “all other manufacturing” group of firms, the results indicate that more intensive innovators have greater profit, but not greater price-cost margins. Table 5a. Results by Industry for Hypothesis 3: Combined Product-Process innovations are more profitable than product innovations alone or process innovations alone
Kruskal-Wallis Test for difference in means between the two groups
Rank Sum Test for which group has greater mean profit
(profit) (profit)
Industry Chi-
square Pr>Chi-square Results Z
One-Sided Pr<Z Results
Food Processing 8.866 0.012 reject H0 -- results suppressed --
Beverage & Tobacco Product 2.534 0.282 cannot reject -- results suppressed --
Textile Mills, Textile Product Mills 1.498 0.473 cannot reject -- results suppressed --
Clothing, Leather & Allied Product 3.753 0.153 cannot reject -- results suppressed --
Wood Product 3.510 0.173 cannot reject -- results suppressed --
Paper 0.457 0.796 cannot reject -- results suppressed --
Printing & Related Support Activities 5.086 0.079 cannot reject -- results suppressed --
Petroleum, Coal Product & Chemical 1.811 0.404 cannot reject -- results suppressed --
Plastics & Rubber Products 3.075 0.215 cannot reject -- results suppressed --
Non-Metallic Mineral Product 0.595 0.742 cannot reject -- results suppressed --
Primary Metal Manufacturing 3.489 0.174 cannot reject -- results suppressed --
Fabricated Metal Product 0.779 0.677 cannot reject -- results suppressed --
Machinery 1.259 0.532 cannot reject -- results suppressed --
Computer & Electronic Product 0.153 0.927 cannot reject -- results suppressed --
Electrical Equipment, Appliances & Component 0.640 0.726 cannot reject -- results suppressed --
Transportation Equipment 3.537 0.170 cannot reject -- results suppressed --
Furniture & Related Product 10.682 0.005 reject H0 -- results suppressed --
Miscellaneous 2.687 0.261 cannot reject -- results suppressed --
Kruskal-Wallis Test for difference in means between the two groups
Kruskal-Wallis Test for difference in means between the two groups
(profit) (profit-margin)
Industry Chi-
square Pr>Chi-square Results
Chi-square
Pr>Chi-square Results
311 0.6607 0.4163 cannot reject 1.657 0.198 cannot reject
All other manufacturing (excluding 311) 18.94 <0.0001 reject H0 2.3291 0.127 cannot reject
2015 International Food and Agribusiness Management Association (IFAMA). All rights reserved
145
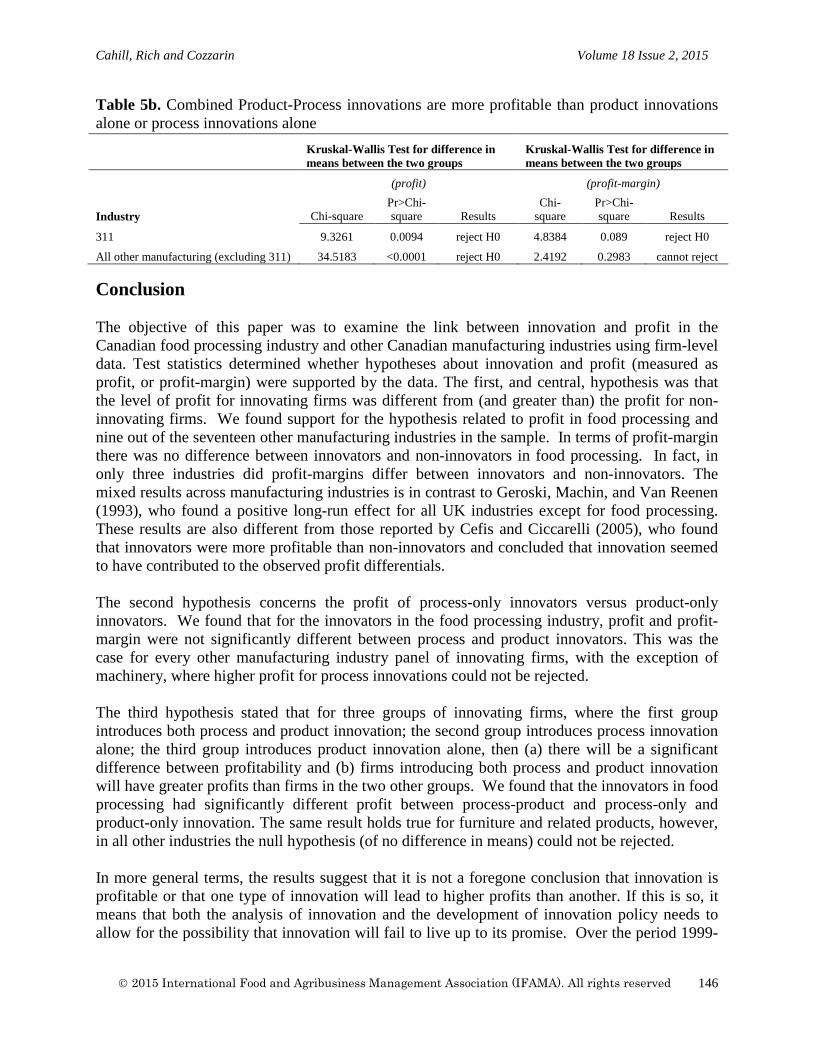
Cahill, Rich and Cozzarin Volume 18 Issue 2, 2015
Table 5b. Combined Product-Process innovations are more profitable than product innovations alone or process innovations alone
Conclusion The objective of this paper was to examine the link between innovation and profit in the Canadian food processing industry and other Canadian manufacturing industries using firm-level data. Test statistics determined whether hypotheses about innovation and profit (measured as profit, or profit-margin) were supported by the data. The first, and central, hypothesis was that the level of profit for innovating firms was different from (and greater than) the profit for non-innovating firms. We found support for the hypothesis related to profit in food processing and nine out of the seventeen other manufacturing industries in the sample. In terms of profit-margin there was no difference between innovators and non-innovators in food processing. In fact, in only three industries did profit-margins differ between innovators and non-innovators. The mixed results across manufacturing industries is in contrast to Geroski, Machin, and Van Reenen (1993), who found a positive long-run effect for all UK industries except for food processing. These results are also different from those reported by Cefis and Ciccarelli (2005), who found that innovators were more profitable than non-innovators and concluded that innovation seemed to have contributed to the observed profit differentials. The second hypothesis concerns the profit of process-only innovators versus product-only innovators. We found that for the innovators in the food processing industry, profit and profit-margin were not significantly different between process and product innovators. This was the case for every other manufacturing industry panel of innovating firms, with the exception of machinery, where higher profit for process innovations could not be rejected. The third hypothesis stated that for three groups of innovating firms, where the first group introduces both process and product innovation; the second group introduces process innovation alone; the third group introduces product innovation alone, then (a) there will be a significant difference between profitability and (b) firms introducing both process and product innovation will have greater profits than firms in the two other groups. We found that the innovators in food processing had significantly different profit between process-product and process-only and product-only innovation. The same result holds true for furniture and related products, however, in all other industries the null hypothesis (of no difference in means) could not be rejected. In more general terms, the results suggest that it is not a foregone conclusion that innovation is profitable or that one type of innovation will lead to higher profits than another. If this is so, it means that both the analysis of innovation and the development of innovation policy needs to allow for the possibility that innovation will fail to live up to its promise. Over the period 1999-
Kruskal-Wallis Test for difference in means between the two groups
Kruskal-Wallis Test for difference in means between the two groups
(profit) (profit-margin)
Industry Chi-square Pr>Chi-square Results
Chi-square
Pr>Chi-square Results
311 9.3261 0.0094 reject H0 4.8384 0.089 reject H0
All other manufacturing (excluding 311) 34.5183 <0.0001 reject H0 2.4192 0.2983 cannot reject
2015 International Food and Agribusiness Management Association (IFAMA). All rights reserved
146
Cahill, Rich and Cozzarin Volume 18 Issue 2, 2015
2006 the Canadian food processing industry had a rather high rate of innovation (60%) relative to lower performing industries. Low performing industries include: textile mills (38% of firms report an innovation), fabricated metal (39%), wood product (40%), furniture (40%), printing (45%), clothing (49%), non-metallic minerals (50%), electrical equipment (51%), primary metal (52%), transport equipment (54%), computer and electronic (55%) and miscellaneous (59%). Another way to look at innovation is that of the 18 NAICS industries in this study, food processing ranked 5th. This finding alone should dispel the myth that food manufacturing is a lackluster innovator. However, the main finding of the paper is that profitability is higher for food processing innovators vs. non-innovators and that product-process innovators have greater profit and profit-margins than firms that have product-only or process-only innovation. Relative to the remaining manufacturing industries in the sample, we see that nine out of 17 industries demonstrated that profit was greater for innovators vs. non-innovators; for the case of profit-margin, the results fell to only four out of 17 industries. Only 3 out of 17 other industries had greater profit for process-only innovators vs. product-only innovators (profit-margin results had zero out of 17). Perhaps the most telling result was that none of the 17 remaining industries showed that product-process innovators had greater profits and profit-margins than product-only or process-only firms. Thus, firms that innovate in both product and process domains in food processing are more profitable. We should note that this does not mean that firm have to have simultaneous product-process innovation, but instead that they undertake both types. So rather than government promoting an agri-food policy simply to “innovate”, this unique result warrants further investigation. References Baldwin, John R., and Joanne Johnson. 1995. Business Strategies in Innovative and Non-
Innovative Firms in Canada. Statistics Canada 11F0019MPF No.73. Ottawa. Baldwin, John R., and David Sabourin. 1999. Innovative Activity in Canadian Food Processing
Establishments: The Importance of Engineering Practices. Statistics Canada, 11F0019MPE No. 101. Ottawa. doi:10.1504/IJTM.2000.002877.
———. 2001. Impact of the Adoption of Advanced Information and Communication
Technologies on Firm Performance in the Canadian Manufacturing Sector. Ottawa.
———. 2004. The Effect of Changing Technology Use on Plant Performance in the Canadian Manufacturing Sector Economic Analysis (EA) Research Paper Series The Effect of Changing Technology Use on Plant Performance in the Canadian Manufacturing Sector. ISSN: 1703-0404. Vol. 1. Statistics Canada, 11F0027MIE No. 020. Ottawa. http://ssrn.com/abstract=1384592.
Bertschek, I. 1995. Product and Process Innovation as a Response to Increasing Imports and
Foreign Direct Investment. The Journal of Industrial Economics 43 (4): 341–57.
2015 International Food and Agribusiness Management Association (IFAMA). All rights reserved
147
Cahill, Rich and Cozzarin Volume 18 Issue 2, 2015
Brewin, Derek G., Daniel C. Monchuk, and Mark D. Partridge. 2009. Examining the Adoption of Product and Process Innovations in the Canadian Food Processing Industry. Canadian Journal of Agricultural Economics 57: 75–97. doi:10.1111/j.1744-7976.2008.01139.x.
Capitanio, Fabian, Adele Coppola, and Stefano Pascucci. 2010. Product and Process Innovation
in the Italian Food Industry. Agribusiness 26 (4): 503–18. doi:10.1002/agr.20239. Cefis, Elena. 2003. Is There Persistence in Innovative Activities? International Journal of
Industrial Organization 21: 489–515. doi:10.1016/S0167-7187(02)00090-5. Cefis, Elena, and Matteo Ciccarelli. 2005. Profit Differentials and Innovation. Economics of
Innovation and New Technology 14 (1-2): 43–61. doi:10.1080/1043859042000232160. Cefis, Elena, and Luigi Orsenigo. 2001. The Persistence of Innovative Activities: A Cross-
Countries and Cross-Sectors Comparative Analysis. Research Policy 30: 1139–58. doi:10.1016/S0048-7333(00)00139-6.
Coad, Alex, Rekha Rao, and Federico Tamagni. 2011. Growth Processes of Italian
Manufacturing Firms. LEM Working Paper Series. Pisa. doi:10.1016/j.strueco.2010.09.001. Cohen, Wesley M, and Steven Klepper. 1996. Firm Size and the Nature of Innovation within
Industries: The Case of Process and Product R&D. The Review of Economics and Statistics 78 (2): 232–43. doi:10.2307/2109925.
Cozzarin, Brian P. 2004. Innovation Quality and Manufacturing Firms’ Performance in Canada.
Economics of Innovation and New Technology 13 (3): 199–216. doi:10.1080/10438590410001628378.
Cozzarin, Brian P., and Jennifer C. Percival. 2006. Complementarities between Organisational
Strategies and Innovation. Economics of Innovation and New Technology 15 (3): 195–217. doi:10.1080/10438590500222691.
Craine, R. 1975. Investment, Adjustment Costs and Uncertainty. International Economic Review
16 (3): 648–61. Diewert, E., A. Harrison, and P. Schreyer. 2004. Cost of Capital Services in the Production
Account. Fourth Ottawa Productivity Workshop, Ottawa.
Du Caju, Philip, François Rycx, and Ilan Tojerow. 2011. Inter-Industry Wage Differentials: How Much Does Rent Sharing Matter? No. 180. Working Paper National Bank of Belgium. Brussels. doi:10.1111/j.1467-9957.2010.02173.x.
Geroski, P. A., and S. Machin. 1993. Innovation, Profitability and Growth over the Business
Cycle. Empirica 20: 35–50. doi:10.1007/BF01384139.
2015 International Food and Agribusiness Management Association (IFAMA). All rights reserved
148
Cahill, Rich and Cozzarin Volume 18 Issue 2, 2015
Geroski, P.A., S. Machin, and J. Van Reenen. 1993. The Profitability of Innovating Firms. RAND Journal of Economics 24: 198–211. doi:10.2307/2555757.
Graham, Daniel A. 1981. Cost-Benefit Analysis under Uncertainty. The American Economic
Review 71 (4): 715–25. Gschwandtner, Adelina. 2005. Profit Persistence in the ‘very’ Long Run: Evidence from
Survivors and Exiters. Applied Economics 37: 793–806. doi:10.1080/0003684042000337406.
Hall, Bronwyn H., Francesca Lotti, and Jacques Mairesse. 2009. Innovation and Productivity in
SMEs: Empirical Evidence for Italy. Small Business Economics 33: 13–33. doi:10.1007/s11187-009-9184-8.
Hawawini, Gabriel, Venkat Subramanian, and Paul Verdin. 2003. Is Performance Driven by
Industry - or Firm-Specific Factors? A New Look at the Evidence. Strategic Management Journal 24: 1–16. doi:10.1002/smj.278.
Kraft, Kornelius. 1990. Are Product and Process Innovations Independent of Each Other?
Applied Economics 22 (8): 1029–38. doi:10.1080/00036849000000132. Mantovani, Andrea. 2006. Complementarity between Product and Process Innovation in a
Monopoly Setting. Economics of Innovation and New Technology 15 (3): 219–34. doi:10.1080/10438590500197315.
OECD. 2005. Oslo Manual, 3rd Edition. Paris. Petsas, Iordanis, and Christos Giannikos. 2005. Process versus Product Innovation in
Multiproduct Firms. International Journal of Business and Economics 4 (3): 231–48. Roberts, Peter W. 1999. Product innovation, product–market competition and persistent
profitability in the U.S. pharmaceutical industry. Strategic Management Journal 20 (7): 655–70.
———. 2001. “Innovation and Firm-Level Persistent Profitability: A Schumpeterian
Framework.” Managerial and Decision Economics 22 (4-5): 239–50. doi:10.1002/mde.1018. Rosenkranz, Stephanie. 2003. Simultaneous Choice of Process and Product Innovation When
Consumers Have a Preference for Product Variety. Journal of Economic Behavior and Organization 50: 183–201. doi:10.1016/S0167-2681(02)00047-1.
Rouvinen, Petri. 2002. Characteristics of Product and Process Innovators: Some Evidence from
the Finnish Innovation Survey. Applied Economics Letters 9: 575–80. doi:10.1080/13504850110108102.
2015 International Food and Agribusiness Management Association (IFAMA). All rights reserved
149
Cahill, Rich and Cozzarin Volume 18 Issue 2, 2015
Schivardi, Fabiano, Eliana Viviano, Alberto Alesina, David Card, Luigi Guiso, Francesco Lippi, Francesca Lotti, Marcello Pagnini, and Mark Roberts. 2010. Entry Barriers in Retail Trade. No. 3. CeLEG Working Paper Series. Rome. http://www.luiss.edu/celeg.
Slade, Margaret E. 2004. Competing Models of Firm Profitability. International Journal of
Industrial Organization 22: 289–308. doi:10.1016/j.ijindorg.2003.12.001. Statistics Canada. 2008. Guide to the Income and Expenditure Accounts. Catalogue No. 13-017-
X. ISSN: 1715-7145. Ottawa. ———. 2015. CANSIM Table 379-00291, Gross Domestic Product (GDP) at Basic Prices, by
North American Industry Classification System (NAICS), Annual (dollars X 1,000,000).” http://www5.statcan.gc.ca/cansim/a26?lang=eng&retrLang=eng&id=3790031&paSer=&pattern=&stByVal=1&p1=1&p2=31&tabMode=dataTable&csid=.
Stevens, Guy V. G. 1974. On the Impact of Uncertainty on the Investment of the Neoclassical
Firm. American Economic Review 64 (3): 319–36. Teece, David J. 1986. Profiting from Technological Innovation: Implications for Integration,
Collaboration, Licensing and Public Policy. Research Policy 15: 285–305. doi:10.1016/0048-7333(93)90063-N.
Therrien, Pierre, and Petr Hanel. 2009. Innovation and Establishments’ Productivity in Canada:
Results from the 2005 Survey of Innovation. Cahier de recherche 09-16, Groupe de Recherche en Économie et Développement International.
Thornhill, Stewart. 2006. Knowledge, Innovation and Firm Performance in High- and Low-
Technology Regimes. Journal of Business Venturing 21: 687–703. doi:10.1016/j.jbusvent.2005.06.001. 0.2"
2015 International Food and Agribusiness Management Association (IFAMA). All rights reserved
150
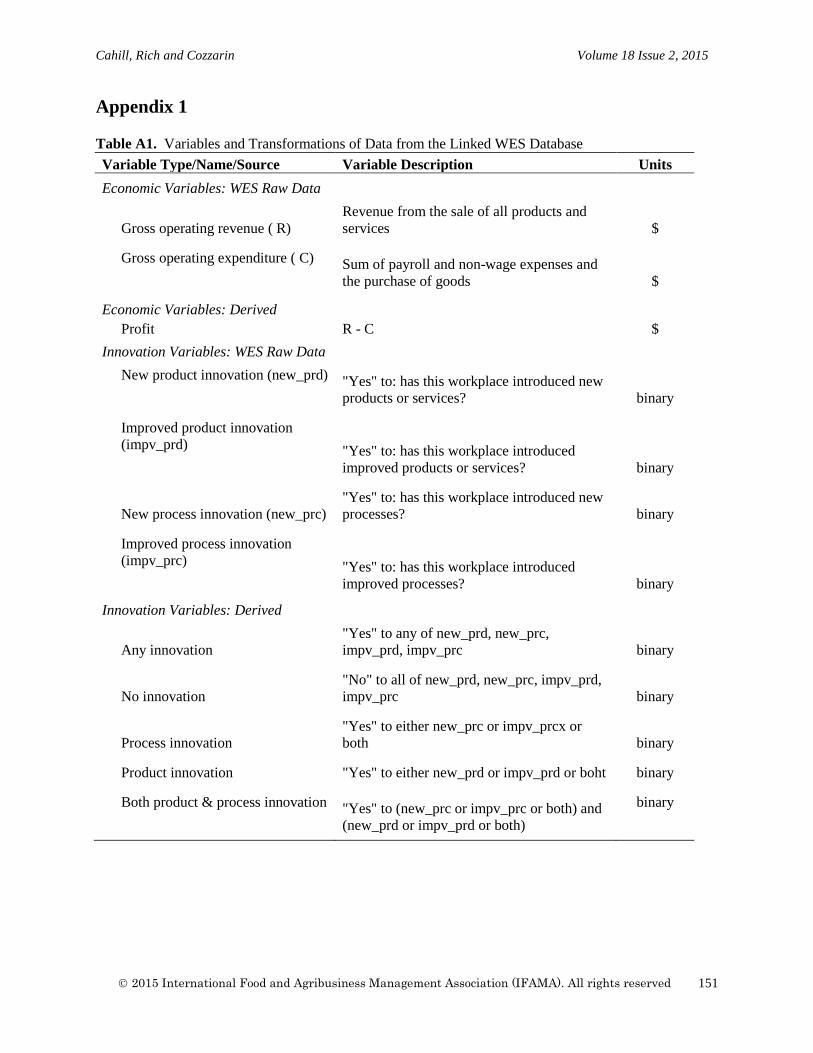
Cahill, Rich and Cozzarin Volume 18 Issue 2, 2015
Appendix 1 Table A1. Variables and Transformations of Data from the Linked WES Database Variable Type/Name/Source Variable Description Units Economic Variables: WES Raw Data
Gross operating revenue ( R)
Revenue from the sale of all products and services $
Gross operating expenditure ( C)
Sum of payroll and non-wage expenses and the purchase of goods $
Economic Variables: Derived Profit R - C $
Innovation Variables: WES Raw Data New product innovation (new_prd)
"Yes" to: has this workplace introduced new products or services? binary
Improved product innovation (impv_prd)
"Yes" to: has this workplace introduced improved products or services? binary
New process innovation (new_prc) "Yes" to: has this workplace introduced new processes? binary
Improved process innovation (impv_prc)
"Yes" to: has this workplace introduced improved processes? binary
Innovation Variables: Derived
Any innovation "Yes" to any of new_prd, new_prc, impv_prd, impv_prc binary
No innovation "No" to all of new_prd, new_prc, impv_prd, impv_prc binary
Process innovation "Yes" to either new_prc or impv_prcx or both binary
Product innovation "Yes" to either new_prd or impv_prd or boht binary
Both product & process innovation
"Yes" to (new_prc or impv_prc or both) and (new_prd or impv_prd or both)
binary
2015 International Food and Agribusiness Management Association (IFAMA). All rights reserved
151
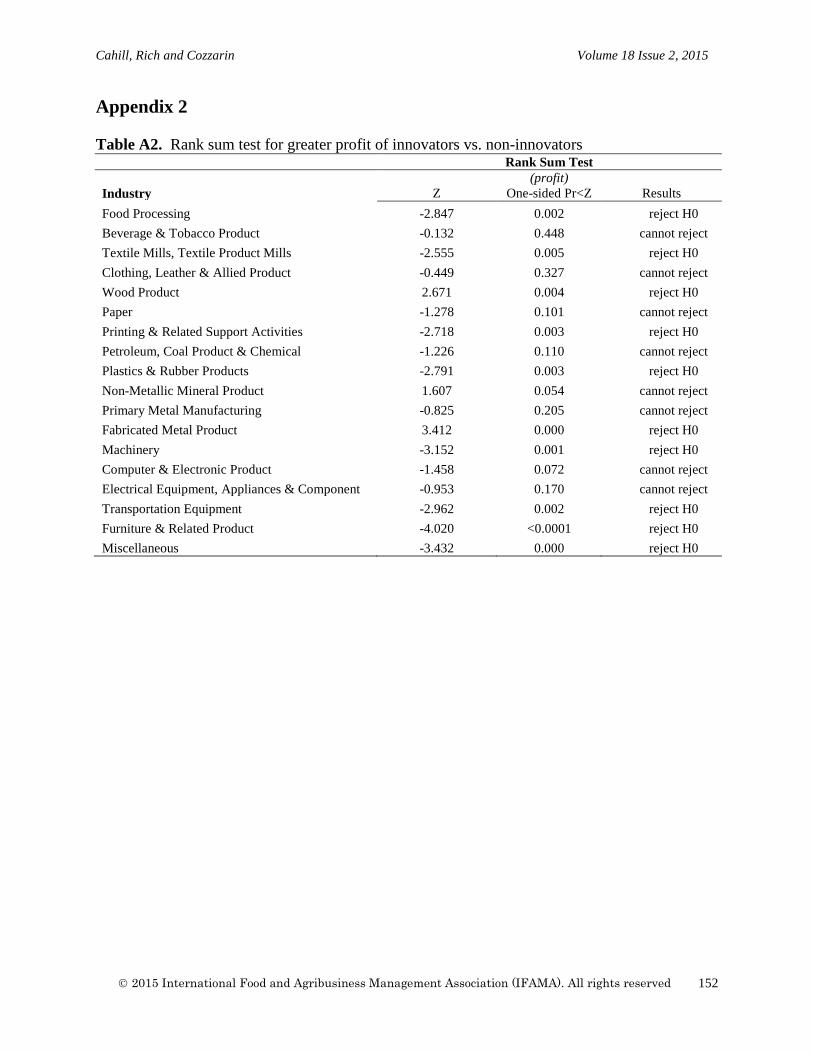
Cahill, Rich and Cozzarin Volume 18 Issue 2, 2015
Appendix 2 Table A2. Rank sum test for greater profit of innovators vs. non-innovators
Rank Sum Test
(profit)
Industry Z One-sided Pr<Z Results Food Processing -2.847 0.002 reject H0 Beverage & Tobacco Product -0.132 0.448 cannot reject Textile Mills, Textile Product Mills -2.555 0.005 reject H0 Clothing, Leather & Allied Product -0.449 0.327 cannot reject Wood Product 2.671 0.004 reject H0 Paper -1.278 0.101 cannot reject Printing & Related Support Activities -2.718 0.003 reject H0 Petroleum, Coal Product & Chemical -1.226 0.110 cannot reject Plastics & Rubber Products -2.791 0.003 reject H0 Non-Metallic Mineral Product 1.607 0.054 cannot reject Primary Metal Manufacturing -0.825 0.205 cannot reject Fabricated Metal Product 3.412 0.000 reject H0 Machinery -3.152 0.001 reject H0 Computer & Electronic Product -1.458 0.072 cannot reject Electrical Equipment, Appliances & Component -0.953 0.170 cannot reject Transportation Equipment -2.962 0.002 reject H0 Furniture & Related Product -4.020 <0.0001 reject H0 Miscellaneous -3.432 0.000 reject H0
2015 International Food and Agribusiness Management Association (IFAMA). All rights reserved
152
International Food and Agribusiness Management Review Volume 18 Issue 2, 2015
The Integrated Management of Food Processing Waste:
The Use of the Full Cost Method for Planning and Pricing Mediterranean Citrus By-Products
Daniele Vergaminia, David Cumingb, and Davide Viaggic
a Ph.D. Candidate, Department of Agricultural Sciences, University of Bologna, Viale Fanin 50 Bologna, Italy
b Contributor, Department of Agricultural Sciences, University of Bologna, Viale Fanin 50 Bologna, Italy
c Professor, Department of Agricultural Sciences, University of Bologna, Viale Fanin 50 Bologna, Italy
Abstract This paper provides a methodology for the computation of the full cost of several citrus by-products and attempts to analyze, through a simulation model, the decision making process of a citrus firm seeking to upgrade citrus waste (CW) to several by-products. The results show the importance of using the full cost in the management of resources. Economic sustainability can be achieved by an increase in production efficiency, improving existing technologies and the ability to reuse waste. Yet a large amount of investment is still required, which only large firms can support, at least in the short-term. Keywords: food industry by-products, full cost accounting, citrus by-products.
Corresponding author: Tel: +39.051.20 9 6112 Email: D. Vergamini: [email protected]
D. Cuming: [email protected] D. Viaggi: [email protected]
2015 International Food and Agribusiness Management Association (IFAMA). All rights reserved
153
Vergamini, Cuming and Viaggi Volume 18 Issue 2, 2015
Introduction Since the mid-1980s, the world production and consumption of citrus has grown rapidly. According to FAOstat (2010), the estimated production in 2010 was around 124 million metric tons, of which more than two-thirds is concentrated in China, Brazil, Mediterranean countries, the United States and India. It is an extremely competitive market, where the Mediterranean citrus producers account for about 20% of world citrus production and about 60% of world fresh citrus trade (FAOSTAT 2010). Moreover, in the Mediterranean basin, the three most important varieties of citrus, from an economic perspective (oranges, mandarins, and lemons), are prevalent, constituting a valuable reservoir of genetic resources for breeding and commercial purposes (Lacirignola and D’Onghia 2009). Despite their importance, in recent decades the major (traditional) Mediterranean fruit producers have gradually been losing their competitive edge in the realm of fresh citrus fruits and processed citrus products, both from foreign and domestic markets (Bredenberg 2004, Baldi 2011). On one hand this loss can be attributed primarily to the increase in labor costs (Bredenberg 2004) in traditional producer countries (i.e. Spain, Italy, USA), along with the progress of emerging countries (i.e. China, India, Mexico, Brazil) characterised, on the contrary, by low-cost workforces. Low labor cost sourcing is a necessary condition to maintain a competitive advantage in the fresh products market. This is arguably the most important factor considering that citrus fruits, mainly oranges and small citrus fruits (tangerines, clementines, and mandarins), are in most cases handpicked. On the other hand, there has been a change in consumer trends, particularly in the increased focus on quality and value-added products, but the required continuous investments in technology, production capacity, and high standards are lacking in most cases. Moreover, changes in lifestyle and especially in consumption (e.g. increased nutritional standards in developed countries, the expansion in world trade of high-value food products, and the evolution of consumer preferences toward smaller, easy-peeler and seedless fruits) have led to a change in the targets of fruit and vegetable producers, and in particular citrus producers. According to a United States Department of Agriculture (USDA) report on the world citrus market and trade (2014) the major citrus producing countries use most of their citrus production for processed products, resulting in a in a reduction in the availability of citrus on the fresh fruit market, which was previously the natural outlet for traditional producers. In Florida, despite a decline in production, 95 percent of oranges are still used for the preparation of juice. In Brazil, one of the world’s largest citrus producers, two-thirds of orange production is used for processing. Together Florida and Brazil account for 90 percent of the orange juice produced in the world. In China, where the domestic market for orange juice is growing, more fruit is used for processing and in the European Union (EU), where fresh orange consumption is declining, increased processing can be expected in coming years (USDA 2014). Changes in production have been taking place alongside the development of numerous technological advances in processing, storage and packaging. These improvements have allowed for an increase in the range of citrus produced, product convenience, and the healthfulness and
2015 International Food and Agribusiness Management Association (IFAMA). All rights reserved
154
Vergamini, Cuming and Viaggi Volume 18 Issue 2, 2015
quality of citrus fruit juices. Moreover, these changes have contributed to a rise in production costs and often a decrease in the availability of raw materials (Laufenberg et al. 2003). The scarcity of raw materials, as a result of the above-mentioned increases in processing, has resulted in a significant recourse to imports, contributing to increases in processing costs and decreased advantages compared to rival countries where fresh product is more plentiful. In the globalized market, since crop size affects the amount of fruit reaching the processing industry, a reduction in crop size, or difficulties in expanding production, can cause a loss of competitive advantage. In some traditional EU citrus producing countries, difficulties have been encountered in attempts to expand production compared with emerging ones, hence the increases in imports. Mediterranean citrus companies need to sell all of the products and by-products obtainable from the fruit at a competitive price to assure their continued activity as citrus producers and processors (Bredenberg 2004). Accordingly, they must focus on recovering, recycling and upgrading by-products to obtain higher value and useful products (Laufenberg et al. 2003). This can also contribute to the reduction and indeed prevention of the pollution caused by the generation of large volumes of waste, both solids, and liquids, produced by the citrus processing industries. There has been a noteworthy increase in the number of studies and research in the field of food and by-product recovery (i.e. see following section). The European Commission-funded 7th Framework project NAMASTE (New advances in the integrated management of food processing waste in India and Europe: use of sustainable technologies for the exploitation of by-products into new foods and feeds, Joint European Commission & Department of Biotechnology (DBT)-India call: KBBE-2009-2-7-02: Valorisation of by-products in food processing) was directly focused on this innovative field. The objective of the project was to develop new processes for the integrated conversion of citrus by-products into new high-value products or raw materials for the food and feed industry. With this objective, different procedures were assayed and a final single multipurpose process providing alternative routes was implemented through the research activities. The peel, pulp and other citrus waste used for the production of the project by-products were obtained from European fruit juice companies acting as industrial partners in the project. Accordingly, the CW in question was not derived from either packinghouse eliminations or directly from groves, but rather from fruit juice processing waste. The innovative character of NAMASTE lies in three protocols developed to obtain citrus by-products, namely citrus fiber, and polyphenolic extract, high pressure homogenization (HPH) paste and clouding agent, from citrus peel, pulp, segment membranes (citrus waste) obtained from the project’s industrial partners. The project, and our research, focused on these three by-products alone that were selected according to the NAMASTE project selection criteria, namely: exploitability for the market; the possibility to obtain a sufficient quantity of products to perform consumer tests; and food-grade certification of the processing equipment to perform consumer tests with the products produced. Furthermore, considering the seasonality of the processing and the limited time available for the project partners to perform extractions, studies, and consumer tests within the NAMASTE timeframe, only the above-referenced products were selected.
2015 International Food and Agribusiness Management Association (IFAMA). All rights reserved
155
Vergamini, Cuming and Viaggi Volume 18 Issue 2, 2015
If these new technologies are considered from the perspective of a citrus firm, the choice to invest or not in the recovery of waste to obtain high value products calls for an economic evaluation of the full cost of the by-products in question. In performing this evaluation, the amount of waste produced can be considered as an additional capacity resource, where the costs of its management and uses must be accounted for to derive the profitability of the new products. Thus, the full costing facilitates the planning capacity and pricing decision process (Balakrishnan and Sivaramakrishnan 2002). The purpose of this paper is to develop and test a product-mix model to solve the capacity planning problem of a citrus processor who seeks to bio-convert citrus waste into the above-mentioned by-products. The model is a mathematical programming model that integrates full cost data of citrus by-products (citrus fiber and clouding agent), maximizing the firm’s profit for each optimal product mix level. The allocation of the capacity resource and the price configurations obtained through the application of this methodology may have the potential for the management of medium-sized food processing companies. As there is no application of the full cost method (FCM) in the literature regarding the upgrade of vegetable residues for the production of multifunctional food ingredients in fruit juice and bakery goods, the paper constitutes a primer for future research aimed at developing an assessment of the economic sustainability of such innovative technologies. The remainder of the study is organized as follows. The next section provides the background literature on citrus by-product recovery processing. Section 3 describes the methodology adopted, followed in section 4 by the results of a case study and in section 5 by a discussion. Concluding remarks are provided in section 6. Challenges Faced by the Citrus Industry Of the vast amount of worldwide citrus production, only one-third is processed (Marín et al. 2005). The fruits processed are mainly oranges, followed by lemons and grapefruits. The principal target of the food industry is juice, but other products include: marmalade, mandarin segments, and flavonoids and essential oils produced respectively by the canning and chemical industries (Izquierdo and Sendra 2003). As related by Cohn and Cohn (1997) and Braddock (1999), the amount of residue obtained from the fruits accounts for half of the whole fruit mass. Consequently, the food industry produces large volumes of solid and liquid wastes. According to Laufenberg et al. (2003), Mamma et al. (2008) CW have historically been dried and used as raw materials for pectin extraction or used without treatment for the production of animal feed or fertilizers. In recent years, however, the increasing costs associated with the storage and transportation of CW and the lower prices obtained from feed markets have resulted in the declining interest on the part of industry for these uses. At the same time, the necessity to prevent environmental pollution, and the need to conserve energy and raw-materials, has grown and new methods and policies for waste recovery and bioconversion for more useful, high-value, products are being introduced (Martin 1998, Laufenberg et al. 2003). Numerous multifunctional ingredients are being developed from citrus by-products and CW, notably: peel oil, oil and water-phase essences, pulp sacs, and Limonene.
2015 International Food and Agribusiness Management Association (IFAMA). All rights reserved
156
Vergamini, Cuming and Viaggi Volume 18 Issue 2, 2015
Creating a secondary use for CW through the upgrading of citrus by-products can be considered a strategic element in the reduction of waste and the optimization of the use of existing resources. Accordingly, the manufacturing industry must consider the potential economic and ecological benefits of green production methods (Laufenberg et al. 2003). The objective must be strategic management to increase product quality and safety, efficiency, and environmental aspects through the development of bio-innovations. Yet strategic management of this kind is not without challenges. This objective could be met by different approaches, which vary from the optimization of production processes to closed-loop production designs and the bio-conversion of CW into high-value products for the energy, food and bio-chemical industries. Several research groups have been working on the development of multifunctional ingredients from citrus by-products and CW. Laufenberg et al. (2003) provide a list of innovative products obtainable from the upgrade of CW. These products include: dietary fibers, which constitute an excellent source of flavors, dyes and antioxidants, or as ingredients for the beverage and bread industries, as well as bioadsorbents, pectin, phytochemicals, gelling and stabilizer agents (Henn and Kunz 1996). Streenath et al. (1995) analyze the utilization of citrus by-products as a clouding agent, to influence the texture (enriching or adjusting the cloudy appearance) and viscosity of beverages. The organoleptic and chemical properties of CW offer a myriad uses for healthy and functional drinks and selected fruit juices (Laufenberg et al. 2003). Furthermore, CW could be used through enzymatic, cellulolytic, or pectinolytic hydrolysis or microbial conversion to obtain liquid biofuel (Widmer and Montanari 1995, Grohmann and Bothast 1994). Following Pourbafrani et al. (2010), Wilkins et al. (2007), Stewart et al. (2005), Gunaseelan (2004) and Mizuki et al. (1990), CW containing different carbohydrate polymers can be used for the production of biogas and ethanol. With a research target mainly focused on the exploitability for beverages, food and feed industries, evaluating the real possibilities of bringing research products to the market, the NAMASTE-EU project can be placed in this broad, and growing, body of literature. Hence, the by-products and protocols resulting from the project were analyzed through an environmental and economic assessment, providing an evaluation of the industrial relevance (Fava et al. 2013). Methodology The FCM was selected from management accounting theory for the computation of citrus by-product production costs. The FCM is based on the allocation of the costs of shared capacity resources to cost objects such as products (Balakrishnan et al. 2012). The full cost configurations obtained through the application of this costing system made it possible to achieve theoretically optimal product mix decisions using decision rules that simplify the capacity-planning and product-pricing problems. Dewan and Magee (1993) argue that the value of accounting allocations lie in the ability to deconstruct complex problems through simple decision rules that can be informationally demanding for small firms. In this paper, the role of cost allocation in influencing managerial decisions of a citrus processing firm is examined through a simple one-period model of a firm that bio-converts product waste into new by-products. This approach takes its cue from the comprehensive literature review
2015 International Food and Agribusiness Management Association (IFAMA). All rights reserved
157
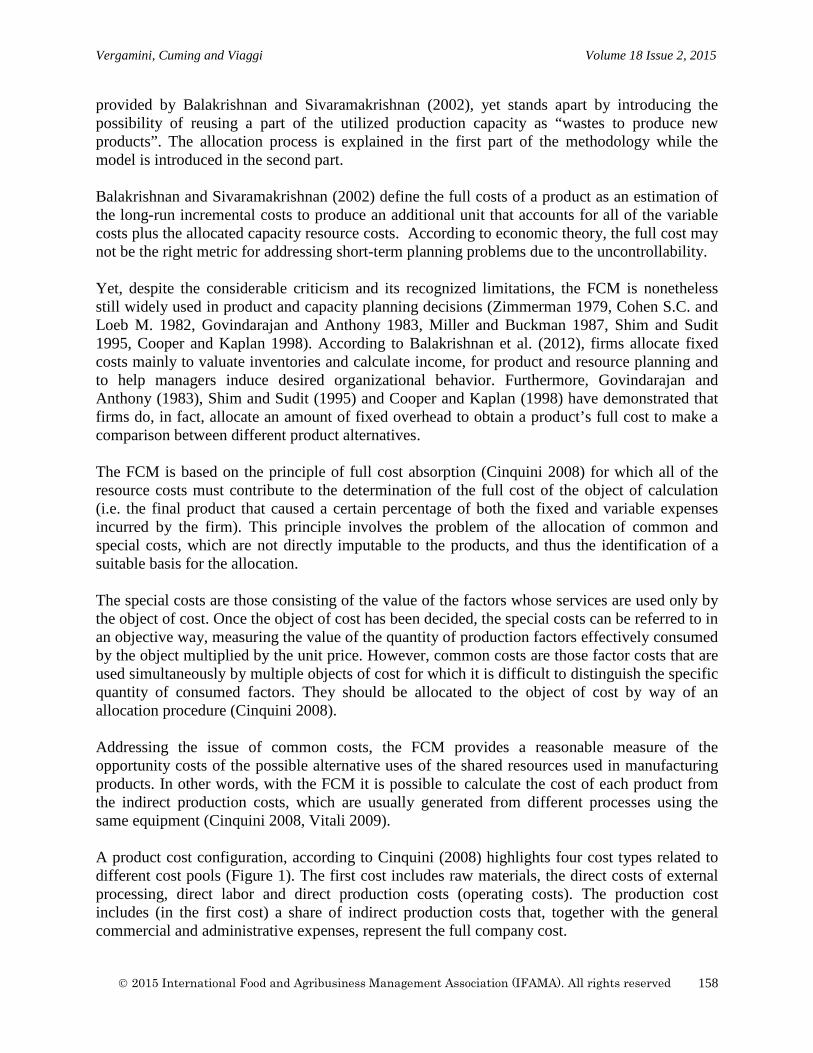
Vergamini, Cuming and Viaggi Volume 18 Issue 2, 2015
provided by Balakrishnan and Sivaramakrishnan (2002), yet stands apart by introducing the possibility of reusing a part of the utilized production capacity as “wastes to produce new products”. The allocation process is explained in the first part of the methodology while the model is introduced in the second part. Balakrishnan and Sivaramakrishnan (2002) define the full costs of a product as an estimation of the long-run incremental costs to produce an additional unit that accounts for all of the variable costs plus the allocated capacity resource costs. According to economic theory, the full cost may not be the right metric for addressing short-term planning problems due to the uncontrollability. Yet, despite the considerable criticism and its recognized limitations, the FCM is nonetheless still widely used in product and capacity planning decisions (Zimmerman 1979, Cohen S.C. and Loeb M. 1982, Govindarajan and Anthony 1983, Miller and Buckman 1987, Shim and Sudit 1995, Cooper and Kaplan 1998). According to Balakrishnan et al. (2012), firms allocate fixed costs mainly to valuate inventories and calculate income, for product and resource planning and to help managers induce desired organizational behavior. Furthermore, Govindarajan and Anthony (1983), Shim and Sudit (1995) and Cooper and Kaplan (1998) have demonstrated that firms do, in fact, allocate an amount of fixed overhead to obtain a product’s full cost to make a comparison between different product alternatives. The FCM is based on the principle of full cost absorption (Cinquini 2008) for which all of the resource costs must contribute to the determination of the full cost of the object of calculation (i.e. the final product that caused a certain percentage of both the fixed and variable expenses incurred by the firm). This principle involves the problem of the allocation of common and special costs, which are not directly imputable to the products, and thus the identification of a suitable basis for the allocation. The special costs are those consisting of the value of the factors whose services are used only by the object of cost. Once the object of cost has been decided, the special costs can be referred to in an objective way, measuring the value of the quantity of production factors effectively consumed by the object multiplied by the unit price. However, common costs are those factor costs that are used simultaneously by multiple objects of cost for which it is difficult to distinguish the specific quantity of consumed factors. They should be allocated to the object of cost by way of an allocation procedure (Cinquini 2008). Addressing the issue of common costs, the FCM provides a reasonable measure of the opportunity costs of the possible alternative uses of the shared resources used in manufacturing products. In other words, with the FCM it is possible to calculate the cost of each product from the indirect production costs, which are usually generated from different processes using the same equipment (Cinquini 2008, Vitali 2009). A product cost configuration, according to Cinquini (2008) highlights four cost types related to different cost pools (Figure 1). The first cost includes raw materials, the direct costs of external processing, direct labor and direct production costs (operating costs). The production cost includes (in the first cost) a share of indirect production costs that, together with the general commercial and administrative expenses, represent the full company cost.
2015 International Food and Agribusiness Management Association (IFAMA). All rights reserved
158
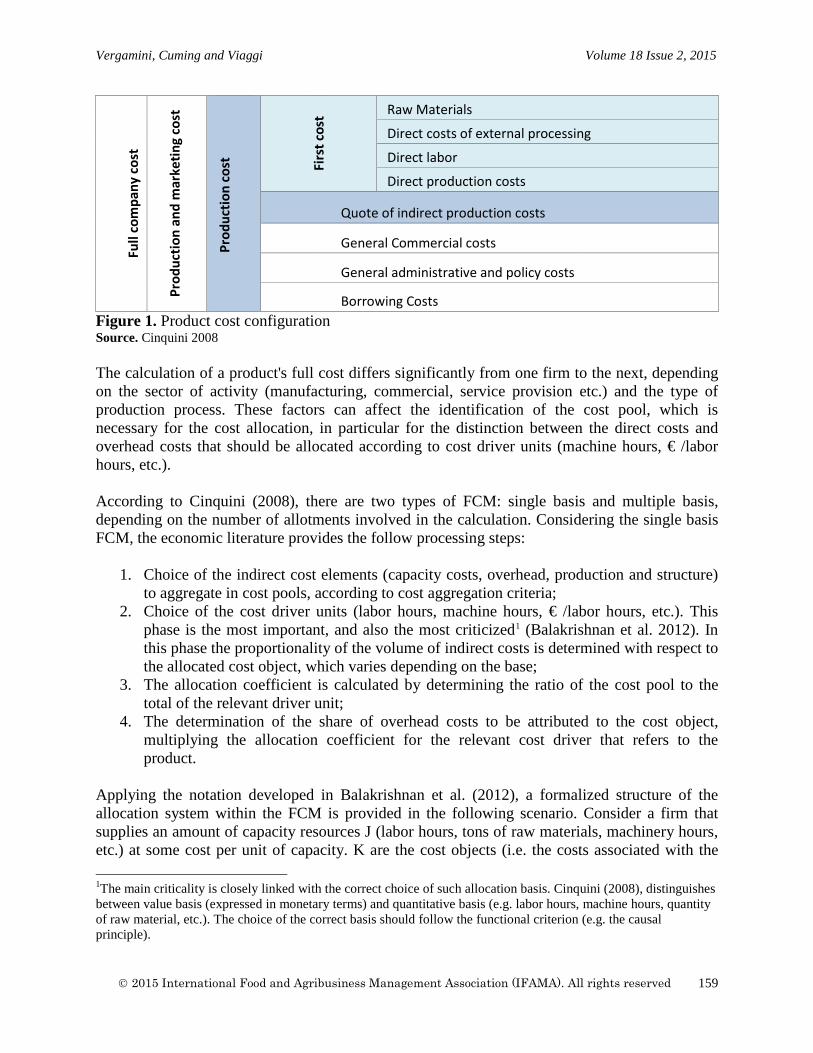
Vergamini, Cuming and Viaggi Volume 18 Issue 2, 2015
Full
com
pany
cos
t
Prod
uctio
n an
d m
arke
ting
cost
Prod
uctio
n co
st
Firs
t cos
t Raw Materials Direct costs of external processing
Direct labor Direct production costs
Quote of indirect production costs
General Commercial costs
General administrative and policy costs
Borrowing Costs Figure 1. Product cost configuration Source. Cinquini 2008 The calculation of a product's full cost differs significantly from one firm to the next, depending on the sector of activity (manufacturing, commercial, service provision etc.) and the type of production process. These factors can affect the identification of the cost pool, which is necessary for the cost allocation, in particular for the distinction between the direct costs and overhead costs that should be allocated according to cost driver units (machine hours, € /labor hours, etc.). According to Cinquini (2008), there are two types of FCM: single basis and multiple basis, depending on the number of allotments involved in the calculation. Considering the single basis FCM, the economic literature provides the follow processing steps:
1. Choice of the indirect cost elements (capacity costs, overhead, production and structure) to aggregate in cost pools, according to cost aggregation criteria;
2. Choice of the cost driver units (labor hours, machine hours, € /labor hours, etc.). This phase is the most important, and also the most criticized1 (Balakrishnan et al. 2012). In this phase the proportionality of the volume of indirect costs is determined with respect to the allocated cost object, which varies depending on the base;
3. The allocation coefficient is calculated by determining the ratio of the cost pool to the total of the relevant driver unit;
4. The determination of the share of overhead costs to be attributed to the cost object, multiplying the allocation coefficient for the relevant cost driver that refers to the product.
Applying the notation developed in Balakrishnan et al. (2012), a formalized structure of the allocation system within the FCM is provided in the following scenario. Consider a firm that supplies an amount of capacity resources J (labor hours, tons of raw materials, machinery hours, etc.) at some cost per unit of capacity. K are the cost objects (i.e. the costs associated with the
1The main criticality is closely linked with the correct choice of such allocation basis. Cinquini (2008), distinguishes between value basis (expressed in monetary terms) and quantitative basis (e.g. labor hours, machine hours, quantity of raw material, etc.). The choice of the correct basis should follow the functional criterion (e.g. the causal principle).
2015 International Food and Agribusiness Management Association (IFAMA). All rights reserved
159
Vergamini, Cuming and Viaggi Volume 18 Issue 2, 2015
products developed) and, according to Banker and Hughes (1994) and Datar and Gupta (1994), a linear production function is assumed. For j=1 to J let CCj represents the capacity resource costs associated with each resource supplied by TCC=∑ CCjj . Other costs, such as variable costs, are voluntarily excluded in the explanation due to the relative ease with which they can be assigned to the final cost object (e.g. units of product). Thereafter, L represents the different cost pools CPl (i.e. different cost aggregations). Each cost pool contains a certain proportion of resources j, according to cost aggregation criteria. CDlk defines the number of cost driver units (e.g. labor hours) that connect the consumption of cost pool l to cost object k. In an allocation problem, the selection of drivers is based on the assumption of proportionality between cost drivers and cost objects. Furthermore, to complete the cost panel and derive the production costs of each product, it is necessary to allocate the quote of indirect production costs that have been aggregated in cost pools, for each cost object k (e.g. each of the k products developed). Let φlk= CPl
∑ CDlkk , with φlk>0 represent the allocation coefficients that are obtained as the ratio of
the cost pool to the total of the relevant driver units. Then, in a FCM costing system, the costs allocated to the cost object k (e.g. the products) are COk = φlkCDlk for k=1 to K. Once the allocation process is complete, the sum of the common costs (including the indirect costs) and the special costs (direct costs) is divided by the quantity of the product generated for each process, hence defining the product’s full cost. An estimation of this kind can be useful to complete the economic analysis with an assessment of the profitability of the by-products. Given that the profitability of the by-products depends on the size of the process and the scope of the process determining the optimal quantities, a sensitivity analysis was carried out on the amounts of processed waste to take into account the possibilities and constraints for adaptation by the firm. Assuming that the firm's objective is the maximization of profits, a one-period mathematical programming model was developed to assess the optimal product-mix levels. The model considers a citrus juice processor that produces by-products from CW (e.g. citrus fibers, clouding agent etc.). The firm’s ability to use waste to produce by-products corresponds to an increase in production capacity. Following the theoretical approach of Balakrishnan et al. (2012) the processor is a "price taker" with fixed capacity in the production of the principal goods, while at the same time, the by-product market is relatively new, and the firm is monopolistic in this market. This assumption accounts for the firm’s ability to influence demand by adjusting prices based on its marginal productivity. The firm has full information on the by-product market and can estimate potential market demand. Accordingly, the firm sells what it produces (without stocking product) and set the price to minimize opportunity costs (costs associated with the use of citrus waste for by-product production). Furthermore, the ability to use wastes to produce by-products is considered to be an increase in production capacity. The firm makes N products using T resources in fixed proportion, where T=αT+(1-α)T states that the firm used a share α of the resources to obtain the juice and produces a certain amount of wastes (1-α) that is recovered and reused for the production of citrus fiber and clouding agent. Assuming linearity in the use of the capacity resource j, with j=1 to J to produce the i products, with i=1 to I, a Leontief production function is assumed.
2015 International Food and Agribusiness Management Association (IFAMA). All rights reserved
160
Vergamini, Cuming and Viaggi Volume 18 Issue 2, 2015
Following the notation provided in Balakrishnan and Sivaramakrishnan (2002), let vi be the variable cost per unit of product i, and let ki be the variable cost per unit of product i obtained from citrus waste, and let each unit of products i uses mji units of the capacity resource j. The firm can consume Sji units of resource j to produce the by-products, with Sji = (1 − α)T representing the additional resource capacity acquired from the reuse of wastes. However, the firm must pay a cost to exploit wastes, represented as θj>0 for all j. Let xi be the amount of by-products produced. Let xi=(Ai − wi)/Bi be the linear demand function for the production of by-products, where Ai, Bi > 0 states respectively the potential size of the markets and the elasticity of the demand, which has been estimated by the firm on the basis of its marginal productivity for the production of the by-products. wi = (Ai − Bixi) ≥ 0 represents the inverse demand function determined the by-product price. As a result, the model takes the following structure, given the fixed value of production capacity resources (T) and by maximizing the gross margin (GM):
Max
(1) GM=(wi − ki)xi + (Pi − vi)qT-θj
Subject to:
(2) xi ≤ ∑ mjiSiJj ∀i,
(3) wi, Pi, xi ≥ 0 ∀i.
Where:
Equation (1) is the objective function (Gross Margin). Equation (2) provides the resource feasibility constraints. At the end of the optimization process, we hypothesize a different by-product mix for each level of capacity resource used and we compute a different price level according to the different production costs and on the basis of the inverse demand function. Case Study and Results The methodology described in the previous section was implemented through a case study carried out in two steps. The first step concerns the full cost analysis of the NAMASTE technologies, while in the second step; a simulation exercise for two NAMASTE by-products was run using the results of the analysis. The model was built in GAMS, and simulates the planning and pricing problem of a citrus juice firm that seeks to recover and bio-convert citrus waste to produce citrus fibers and clouding agents. The full cost analysis of the NAMASTE by-products was focused on citrus fiber and polyphenolic extract, a high-pressure homogenization (HPH) paste and clouding agent. The innovative nature of the NAMASTE by-products lies in the protocols developed, even though some (e.g. citrus fiber and clouding agent) have been widely produced by the processing
2015 International Food and Agribusiness Management Association (IFAMA). All rights reserved
161
Vergamini, Cuming and Viaggi Volume 18 Issue 2, 2015
industries. Dietary fiber represents the indigestible polysaccharides and oligosaccharides found in fruit, vegetables, grain, and nuts. The citrus fibers can be used as matrices for flavors, dyes or antioxidants (Laufeberg et al. 2003). The soluble and insoluble dietary fibers have beneficial effects on human health and can be developed for use in bread or beverages. Furthermore, the peel cloud, also known as clouding agents (CA), can increase turbidity and provide a natural appearance of a fresh, cloudy fruit juice. The economic analysis of the NAMASTE process was carried out at an industrial level in order to compare with existing products on the market. On one hand, since the NAMASTE project was a research project, all of the relevant information and data from the protocols were acquired from laboratory results (i.e. quantity of processed by-products, raw materials, processing time and waste produced). On the other hand, several assumptions were made to scale up the products to an industrial level. For the scaling up process it is necessary to first estimate the production objectives for the three processes being analyzed, making it possible in turn to identify the size of the hypothetical processing pilot plant in terms of the amount of by-product to be processed (in tons/year). Then we made several assumptions about the required amount of labor, raw material consumption, the duration of the production processes and the machinery required for the processes. Furthermore, an exhaustive interview was carried out with the NAMASTE industrial consortium members to seek clarification and to obtain an accurate basis upon which to calculate the processing costs. Data about the annual production of the plant, the number of employees, processing time, processing phases, and equipment model numbers and brand names etc. were sought for the calculation process. In addition, while all of the relevant and available cost information was acquired from the partners, it should be noted that the collection of comprehensive data can be difficult to obtain given that industrial partners need to respect internal policies regarding the privacy of industrial data. On the basis of the information acquired, a model of a citrus processing plant exploiting the three NAMASTE protocols was developed. It was assumed that annual citrus by-product volumes were approximately 72,000 tons, to be allocated as an input into several alternative product mix hypotheses, enumerated below: a) 50% Fiber/50% Cloud; b) 50% fiber/50% Paste; c) 50% Cloud/50% Paste; d) 100% fiber; e) 100% Cloud; and f) 100% HPH Paste. The first three production hypotheses represent a combined production alternative in which only two processes are analyzed at a time. The other points involve the production of only one product at a time. Furthermore, production hypothesis A considers that a fiber fraction can also be obtained as a by-product during the production of clouding agent. In the production of approximately 36,000 tons of by-product for the manufacture of the clouding agent, about 19% (6,808 tones) were re-used for the production of fiber. In keeping with the information provided by the NAMASTE industrial partners, a continuous production process was assumed to operate 8 hours/day, 253 days/year, hence allowing for a distribution of the workload over the year. In reality, however, the citrus industry operates seasonally. Citrus products are generally processed over a 4-6 month period and during the rest of the year the plant activities are focused on either the loading or unloading of raw materials or equipment maintenance. The assumption mirrors reality whilst simplifying the cost computation as it allows for the inclusion of the production costs involved in the equipment maintenance periods and the cost of loading and unloading raw materials. Furthermore, the citrus plant
2015 International Food and Agribusiness Management Association (IFAMA). All rights reserved
162
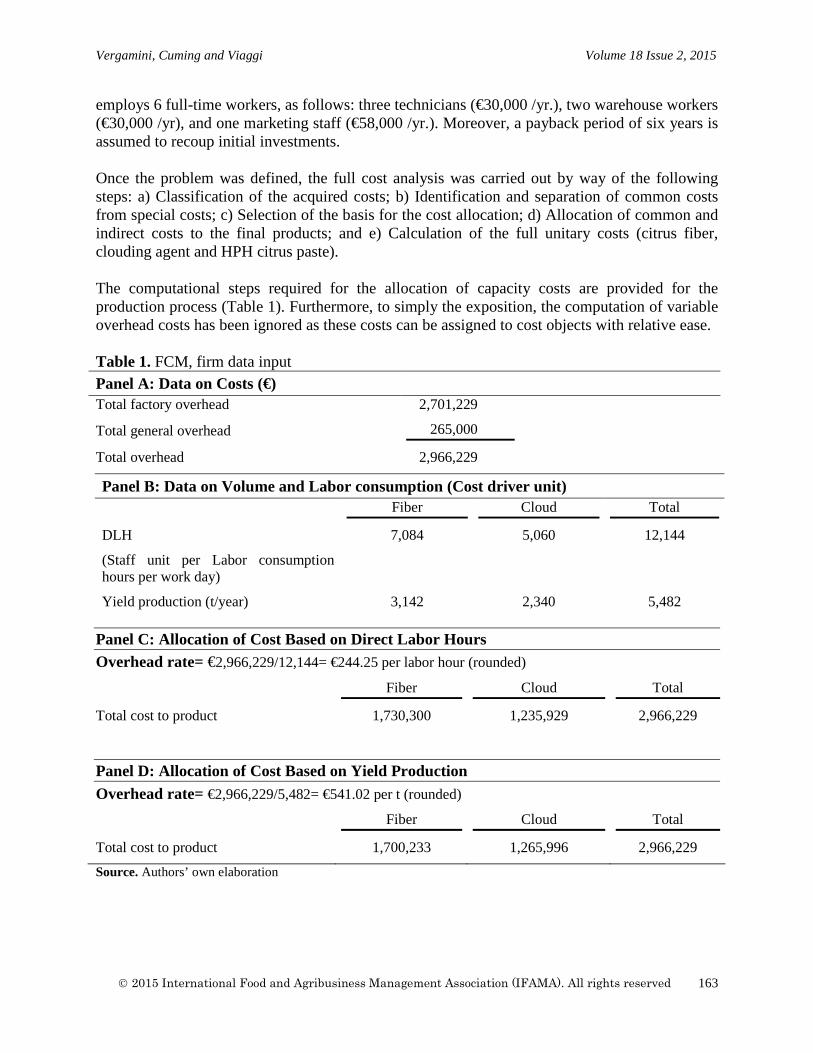
Vergamini, Cuming and Viaggi Volume 18 Issue 2, 2015
employs 6 full-time workers, as follows: three technicians (€30,000 /yr.), two warehouse workers (€30,000 /yr), and one marketing staff (€58,000 /yr.). Moreover, a payback period of six years is assumed to recoup initial investments. Once the problem was defined, the full cost analysis was carried out by way of the following steps: a) Classification of the acquired costs; b) Identification and separation of common costs from special costs; c) Selection of the basis for the cost allocation; d) Allocation of common and indirect costs to the final products; and e) Calculation of the full unitary costs (citrus fiber, clouding agent and HPH citrus paste). The computational steps required for the allocation of capacity costs are provided for the production process (Table 1). Furthermore, to simply the exposition, the computation of variable overhead costs has been ignored as these costs can be assigned to cost objects with relative ease. Table 1. FCM, firm data input Panel A: Data on Costs (€) Total factory overhead 2,701,229
Total general overhead 265,000
Total overhead 2,966,229
Panel C: Allocation of Cost Based on Direct Labor Hours Overhead rate= €2,966,229/12,144= €244.25 per labor hour (rounded)
Panel B: Data on Volume and Labor consumption (Cost driver unit) Fiber Cloud Total
DLH 7,084 5,060 12,144
(Staff unit per Labor consumption hours per work day)
Yield production (t/year) 3,142 2,340 5,482
Fiber Cloud Total
Total cost to product 1,730,300 1,235,929 2,966,229
Panel D: Allocation of Cost Based on Yield Production Overhead rate= €2,966,229/5,482= €541.02 per t (rounded)
Fiber Cloud Total
Total cost to product 1,700,233 1,265,996 2,966,229 Source. Authors’ own elaboration
2015 International Food and Agribusiness Management Association (IFAMA). All rights reserved
163
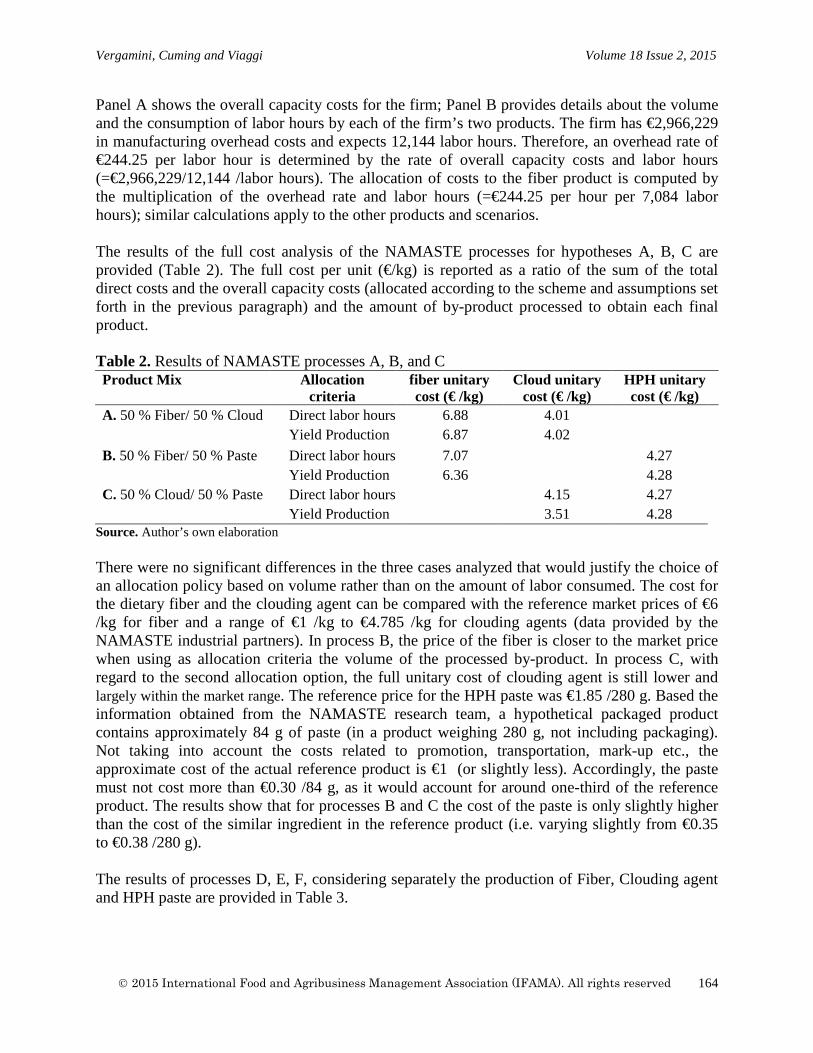
Vergamini, Cuming and Viaggi Volume 18 Issue 2, 2015
Panel A shows the overall capacity costs for the firm; Panel B provides details about the volume and the consumption of labor hours by each of the firm’s two products. The firm has €2,966,229 in manufacturing overhead costs and expects 12,144 labor hours. Therefore, an overhead rate of €244.25 per labor hour is determined by the rate of overall capacity costs and labor hours (=€2,966,229/12,144 /labor hours). The allocation of costs to the fiber product is computed by the multiplication of the overhead rate and labor hours (=€244.25 per hour per 7,084 labor hours); similar calculations apply to the other products and scenarios. The results of the full cost analysis of the NAMASTE processes for hypotheses A, B, C are provided (Table 2). The full cost per unit (€/kg) is reported as a ratio of the sum of the total direct costs and the overall capacity costs (allocated according to the scheme and assumptions set forth in the previous paragraph) and the amount of by-product processed to obtain each final product. Table 2. Results of NAMASTE processes A, B, and C Product Mix Allocation
criteria fiber unitary cost (€ /kg)
Cloud unitary cost (€ /kg)
HPH unitary cost (€ /kg)
A. 50 % Fiber/ 50 % Cloud Direct labor hours 6.88 4.01 Yield Production 6.87 4.02
B. 50 % Fiber/ 50 % Paste Direct labor hours 7.07 4.27 Yield Production 6.36 4.28
C. 50 % Cloud/ 50 % Paste Direct labor hours 4.15 4.27 Yield Production 3.51 4.28
Source. Author’s own elaboration There were no significant differences in the three cases analyzed that would justify the choice of an allocation policy based on volume rather than on the amount of labor consumed. The cost for the dietary fiber and the clouding agent can be compared with the reference market prices of €6 /kg for fiber and a range of €1 /kg to €4.785 /kg for clouding agents (data provided by the NAMASTE industrial partners). In process B, the price of the fiber is closer to the market price when using as allocation criteria the volume of the processed by-product. In process C, with regard to the second allocation option, the full unitary cost of clouding agent is still lower and largely within the market range. The reference price for the HPH paste was €1.85 /280 g. Based the information obtained from the NAMASTE research team, a hypothetical packaged product contains approximately 84 g of paste (in a product weighing 280 g, not including packaging). Not taking into account the costs related to promotion, transportation, mark-up etc., the approximate cost of the actual reference product is €1 (or slightly less). Accordingly, the paste must not cost more than €0.30 /84 g, as it would account for around one-third of the reference product. The results show that for processes B and C the cost of the paste is only slightly higher than the cost of the similar ingredient in the reference product (i.e. varying slightly from €0.35 to €0.38 /280 g). The results of processes D, E, F, considering separately the production of Fiber, Clouding agent and HPH paste are provided in Table 3.
2015 International Food and Agribusiness Management Association (IFAMA). All rights reserved
164
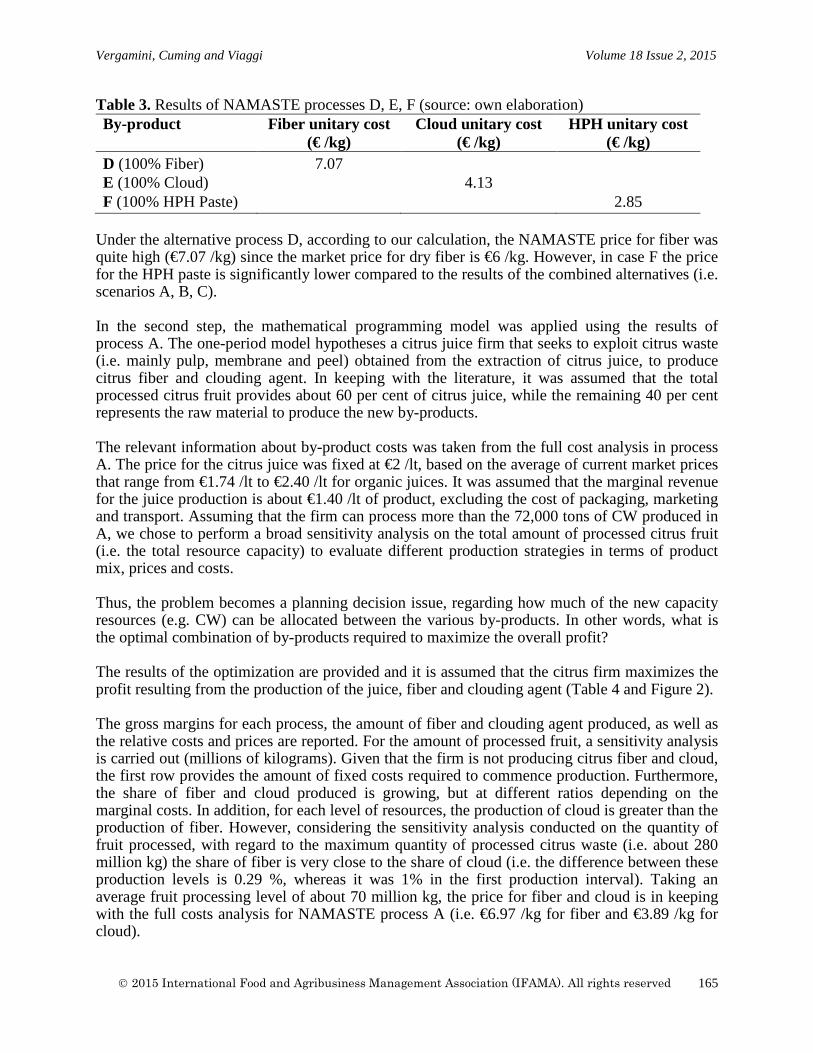
Vergamini, Cuming and Viaggi Volume 18 Issue 2, 2015
Table 3. Results of NAMASTE processes D, E, F (source: own elaboration) By-product Fiber unitary cost
(€ /kg) Cloud unitary cost
(€ /kg) HPH unitary cost
(€ /kg) D (100% Fiber) 7.07 E (100% Cloud) 4.13 F (100% HPH Paste) 2.85
Under the alternative process D, according to our calculation, the NAMASTE price for fiber was quite high (€7.07 /kg) since the market price for dry fiber is €6 /kg. However, in case F the price for the HPH paste is significantly lower compared to the results of the combined alternatives (i.e. scenarios A, B, C). In the second step, the mathematical programming model was applied using the results of process A. The one-period model hypotheses a citrus juice firm that seeks to exploit citrus waste (i.e. mainly pulp, membrane and peel) obtained from the extraction of citrus juice, to produce citrus fiber and clouding agent. In keeping with the literature, it was assumed that the total processed citrus fruit provides about 60 per cent of citrus juice, while the remaining 40 per cent represents the raw material to produce the new by-products. The relevant information about by-product costs was taken from the full cost analysis in process A. The price for the citrus juice was fixed at €2 /lt, based on the average of current market prices that range from €1.74 /lt to €2.40 /lt for organic juices. It was assumed that the marginal revenue for the juice production is about €1.40 /lt of product, excluding the cost of packaging, marketing and transport. Assuming that the firm can process more than the 72,000 tons of CW produced in A, we chose to perform a broad sensitivity analysis on the total amount of processed citrus fruit (i.e. the total resource capacity) to evaluate different production strategies in terms of product mix, prices and costs. Thus, the problem becomes a planning decision issue, regarding how much of the new capacity resources (e.g. CW) can be allocated between the various by-products. In other words, what is the optimal combination of by-products required to maximize the overall profit? The results of the optimization are provided and it is assumed that the citrus firm maximizes the profit resulting from the production of the juice, fiber and clouding agent (Table 4 and Figure 2). The gross margins for each process, the amount of fiber and clouding agent produced, as well as the relative costs and prices are reported. For the amount of processed fruit, a sensitivity analysis is carried out (millions of kilograms). Given that the firm is not producing citrus fiber and cloud, the first row provides the amount of fixed costs required to commence production. Furthermore, the share of fiber and cloud produced is growing, but at different ratios depending on the marginal costs. In addition, for each level of resources, the production of cloud is greater than the production of fiber. However, considering the sensitivity analysis conducted on the quantity of fruit processed, with regard to the maximum quantity of processed citrus waste (i.e. about 280 million kg) the share of fiber is very close to the share of cloud (i.e. the difference between these production levels is 0.29 %, whereas it was 1% in the first production interval). Taking an average fruit processing level of about 70 million kg, the price for fiber and cloud is in keeping with the full costs analysis for NAMASTE process A (i.e. €6.97 /kg for fiber and €3.89 /kg for cloud).
2015 International Food and Agribusiness Management Association (IFAMA). All rights reserved
165
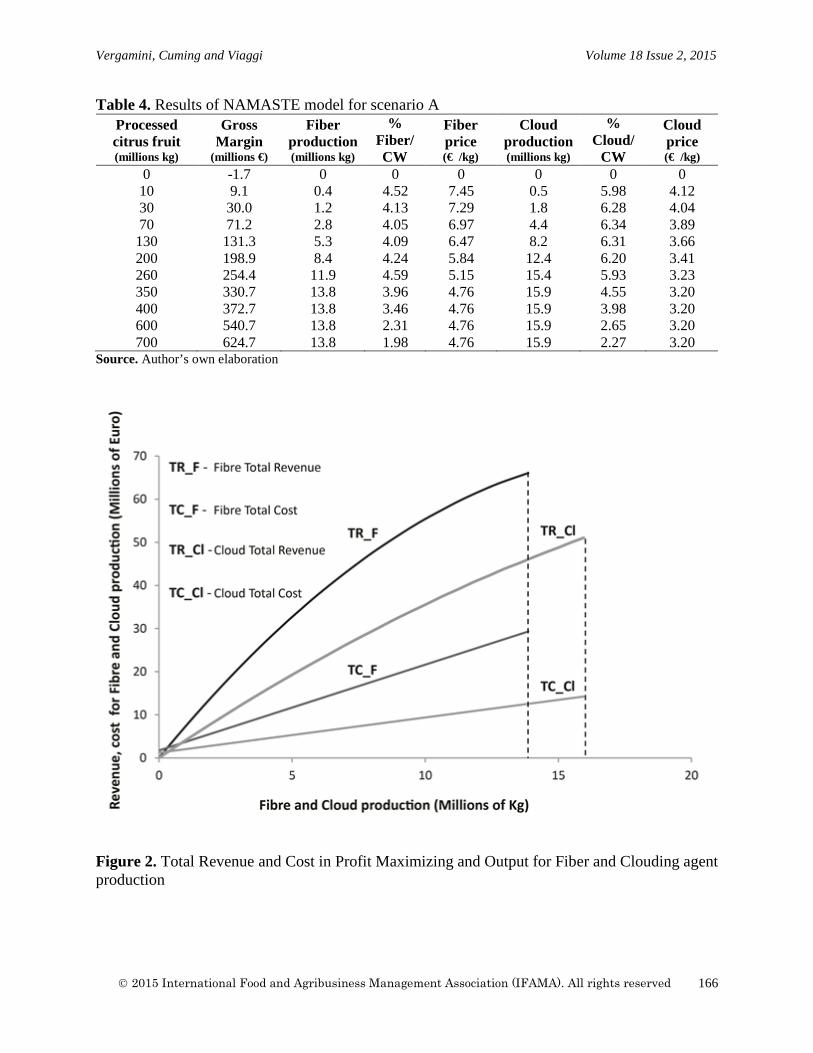
Vergamini, Cuming and Viaggi Volume 18 Issue 2, 2015
Table 4. Results of NAMASTE model for scenario A Processed citrus fruit (millions kg)
Gross Margin
(millions €)
Fiber production (millions kg)
% Fiber/CW
Fiber price (€ /kg)
Cloud production (millions kg)
% Cloud/
CW
Cloud price (€ /kg)
0 10 30 70
130 200 260 350 400 600 700
-1.7 9.1 30.0 71.2 131.3 198.9 254.4 330.7 372.7 540.7 624.7
0 0.4 1.2 2.8 5.3 8.4 11.9 13.8 13.8 13.8 13.8
0 4.52 4.13 4.05 4.09 4.24 4.59 3.96 3.46 2.31 1.98
0 7.45 7.29 6.97 6.47 5.84 5.15 4.76 4.76 4.76 4.76
0 0.5 1.8 4.4 8.2
12.4 15.4 15.9 15.9 15.9 15.9
0 5.98 6.28 6.34 6.31 6.20 5.93 4.55 3.98 2.65 2.27
0 4.12 4.04 3.89 3.66 3.41 3.23 3.20 3.20 3.20 3.20
Source. Author’s own elaboration
Figure 2. Total Revenue and Cost in Profit Maximizing and Output for Fiber and Clouding agent production
2015 International Food and Agribusiness Management Association (IFAMA). All rights reserved
166
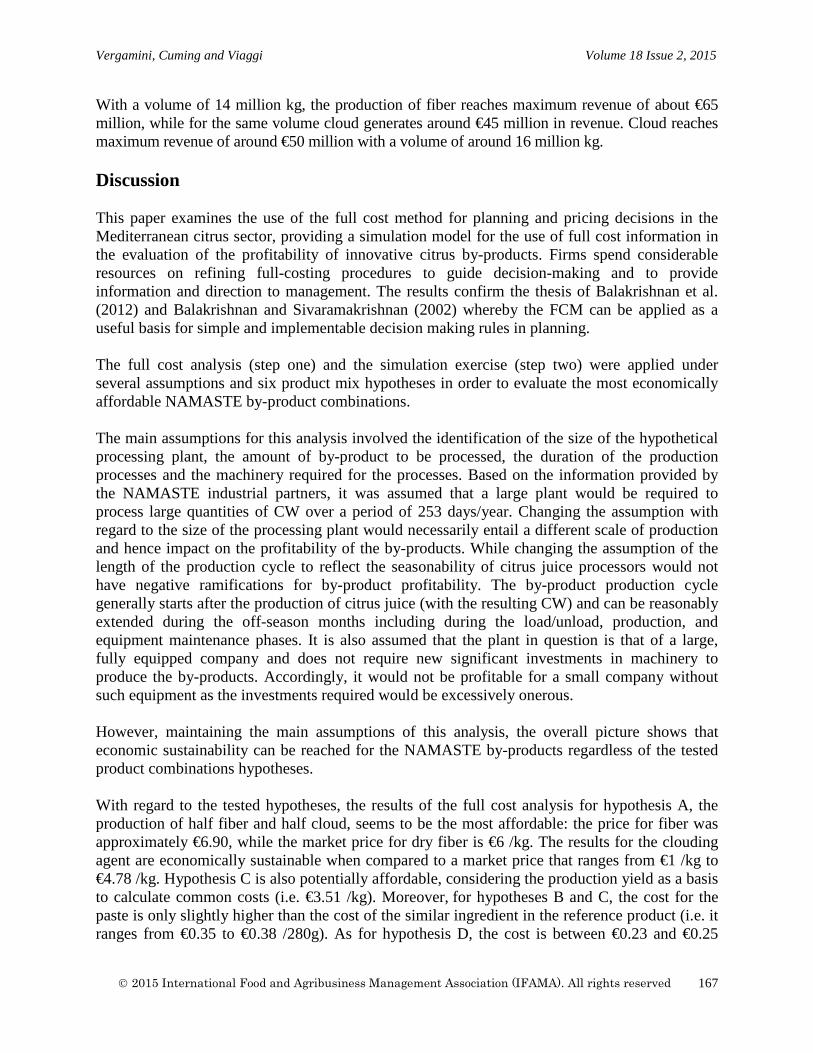
Vergamini, Cuming and Viaggi Volume 18 Issue 2, 2015
With a volume of 14 million kg, the production of fiber reaches maximum revenue of about €65 million, while for the same volume cloud generates around €45 million in revenue. Cloud reaches maximum revenue of around €50 million with a volume of around 16 million kg. Discussion This paper examines the use of the full cost method for planning and pricing decisions in the Mediterranean citrus sector, providing a simulation model for the use of full cost information in the evaluation of the profitability of innovative citrus by-products. Firms spend considerable resources on refining full-costing procedures to guide decision-making and to provide information and direction to management. The results confirm the thesis of Balakrishnan et al. (2012) and Balakrishnan and Sivaramakrishnan (2002) whereby the FCM can be applied as a useful basis for simple and implementable decision making rules in planning. The full cost analysis (step one) and the simulation exercise (step two) were applied under several assumptions and six product mix hypotheses in order to evaluate the most economically affordable NAMASTE by-product combinations. The main assumptions for this analysis involved the identification of the size of the hypothetical processing plant, the amount of by-product to be processed, the duration of the production processes and the machinery required for the processes. Based on the information provided by the NAMASTE industrial partners, it was assumed that a large plant would be required to process large quantities of CW over a period of 253 days/year. Changing the assumption with regard to the size of the processing plant would necessarily entail a different scale of production and hence impact on the profitability of the by-products. While changing the assumption of the length of the production cycle to reflect the seasonability of citrus juice processors would not have negative ramifications for by-product profitability. The by-product production cycle generally starts after the production of citrus juice (with the resulting CW) and can be reasonably extended during the off-season months including during the load/unload, production, and equipment maintenance phases. It is also assumed that the plant in question is that of a large, fully equipped company and does not require new significant investments in machinery to produce the by-products. Accordingly, it would not be profitable for a small company without such equipment as the investments required would be excessively onerous. However, maintaining the main assumptions of this analysis, the overall picture shows that economic sustainability can be reached for the NAMASTE by-products regardless of the tested product combinations hypotheses. With regard to the tested hypotheses, the results of the full cost analysis for hypothesis A, the production of half fiber and half cloud, seems to be the most affordable: the price for fiber was approximately €6.90, while the market price for dry fiber is €6 /kg. The results for the clouding agent are economically sustainable when compared to a market price that ranges from €1 /kg to €4.78 /kg. Hypothesis C is also potentially affordable, considering the production yield as a basis to calculate common costs (i.e. €3.51 /kg). Moreover, for hypotheses B and C, the cost for the paste is only slightly higher than the cost of the similar ingredient in the reference product (i.e. it ranges from €0.35 to €0.38 /280g). As for hypothesis D, the cost is between €0.23 and €0.25
2015 International Food and Agribusiness Management Association (IFAMA). All rights reserved
167
Vergamini, Cuming and Viaggi Volume 18 Issue 2, 2015
/280g and is hence a more sustainable solution for the product in question. In light of the market prices, the economic sustainability of the processes is attainable in production hypotheses A, C and F. The results obtained in the simulation exercise (step 2) confirmed the feasibility of hypothesis A. Yet these results underscore the fact that the production of small volumes yields limited margins while, according to our assumption regarding the recovery of larger quantities of waste, it is confirmed that process A is more adapted to the production capabilities of larger industrial processing plants (i.e. the industrial partners in the NAMASTE project consortium). The NAMASTE project focused only on the analysis of full costs and not on the global investment required by companies electing to process citrus waste; this latter analysis is particularly pertinent for determining the overall feasibility and profitability of the analyzed by-products and constitutes an excellent avenue for future research. The choice of the models used in this paper, while reflecting a number of plausible assumptions nonetheless remains somewhat simplified and could be improved upon in further research. The main weakness of the approach rests in the fact that the FCM requires a significant amount of often very detailed information about the technologies used, the quantities processed and the resource capacity. The management of this information is a critical point for the effective use of this method and for the value of the information it can provide. Hence, in this paper we used several assumptions to scale up laboratory results to an industrial level. These assumptions remain an approximation that can be improved upon in future research. The model can also be improved in other ways, such as through the use of multi-period decision making instead of the single period setting that was used in this paper, or considering the opportunity costs associated with the existing capacity resources. Future research could also focus on other costing systems, such as activity based costing, resource consumption accounting or Time-Driven Activity-Based Costing. Conclusion This paper focused on the use of full cost information within mathematical programming methods to test the economic feasibility of upgrading citrus waste to obtain novel types of by-products for multifunctional food ingredients in fruit juices and bakery goods. The paper uses a product-mix model to solve capacity-planning problems and to address the product-pricing decisions of a hypothetical Mediterranean citrus processor. Moreover, it highlights the relevance of accounting cost allocations through the use of optimization tools the purpose of which is to determine maximum profits and optimal product mix levels. Although the economic sustainability of the analyzed by-products is achievable, it should be stressed that further improvements in the efficiency of the developed technologies and protocols (i.e. improving the overall processing efficiency) are possible. The technologies developed in the project focused on the development of innovative ingredients for the food and feed industries. The overall efficiency of the processing technologies is still quite low; moreover, the production of fiber and cloud can be optimized through future research aimed at improving the distillation process and reducing the use of ethanol. Considering that polyphenol extracts, with a price of
2015 International Food and Agribusiness Management Association (IFAMA). All rights reserved
168
Vergamini, Cuming and Viaggi Volume 18 Issue 2, 2015
approximately €23 /kg, can constitute an additional source of revenue for the processor, any improvements in the distillation phase can contribute to the lowering of production costs and an increase in the profitability of by-products. Together with these technological improvements, additional assumptions (i.e. re-use of ethanol) and enhancements in the computation process (i.e. improving the scale up design and considering other costing systems for the activity based costing) could also refine and improve the overall results. Further development of the methods aimed at data collection, data analysis, process design and evaluation would be necessary to achieve such improvements. The discussion demonstrated the various weaknesses of the approach in its current form. Despite the limitations (mainly related to data availability), the analysis demonstrated the potential of the FCM to contribute to breaking down the complex planning and price determination problems faced by firms into simpler production problems. Future research could analyze the implications of improving the design of cost pools and the bases of cost allocations for decision-making. Accordingly, the use of full cost method information with a simulation model can improve the quality and the potential for managerial decisions to address the planning and pricing of innovative by-products in the citrus sector. Acknowledgements We acknowledge funding from the European Commission, 7th Framework Programme, through the project NAMASTE (New advances in the integrated management of food processing waste in India and Europe: use of sustainable technologies for the exploitation of by-products into new foods and feeds). This work does not necessarily reflect the views of the European Union and in no way anticipates the Commission’s future policy in this area. References Balakrishnan, R. and K. Sivaramakrishnan 2002. A critical overview of the use of full-cost data
for planning and pricing. Journal of Management Accounting Research 14: 2-31. Balakrishnan, R., E. Labro, and K. Sivaramkrishank. 2012. Product costs as decision aids: An
analysis of alternative approaches. Accounting Horizons 26(1): 1-20. Baldi, S. 2011. GAIN (Global Agricultural Information Network) Report: Italian citrus fruit
2010-2011. USDA Staff. Rome. Banker, R.D., and J.S. Hughes. 1994. Product costing and pricing. The Accounting Review 69(3):
479-494. Braddock, R.J. 1999. Handbook of Citrus By-Products and Processing Technology. New York:
John Wiley & Sons, Inc.: 117-133.
2015 International Food and Agribusiness Management Association (IFAMA). All rights reserved
169
Vergamini, Cuming and Viaggi Volume 18 Issue 2, 2015
Bredenberg, K. 2004. An overview of trends in citrus oil production in the countries bordering the Mediterranean. Paper presented at the IFEAT International Conference in Lisbon, Portugal, printed in the IFEAT Conference Proceedings. 58-76.
Cinquini, L. 2008. Strumenti per l’analisi dei costi, Vol.1, Fondamenti di cost accounting.
Torino: Giappichelli. Cohn, R., Cohn, A.L. 1997. Subproductos del procesado de las frutas. In: Procesado de frutas
edited by D. Arthey and P.R. Ashurst.288. Acribia, Zaragoza, Spain. Cohen, S. C. and M. Loeb. 1982. Public Goods, Common Inputs, and the Efficiency of Full Cost
Allocations. The Accounting Review 57(2): 336-347. Cooper, R., and R. Kaplan. 1988. Measure cost right: Make the right decision. Harvard Business
Review: 96–103. Datar, S.M., and M. Gupta, 1994. Aggregation, specification and in product costing. The
Accounting Review 69(4): 567-591. Dewan, R.M., and R.P. Magee. Product costing systems: Information, economics and
implementation. Working Paper, Northwestern University. 1993. FAOSTAT. 2010. FAO statistical division. Available in http://faostat.fao.org FAOSTAT. 2012. FAO statistical division. Available in http://faostat3.fao.org/faostat-
gateway/go/to/home/E Fava, F., Zanaroli, G., Vannini, L., Guerzoni, E., Bordoni, A., Viaggi, D., Robertson, J.,
Waldron, K., Bald, C., Esturo, A., Talens, C., Tueros, I.,Cebrián, M., Sebők, A., Kuti, T.,Broeze, J., Macias, M.,Brendle, H.G. 2013. New advances in the integrated management of food processing by-products in Europe: sustainable exploitation of fruit and cereal processing by-products with the production of new food products (NAMASTE EU). New Biotechnology 30: 647-655.
Govindarajan, V., and R. Anthony. 1983. How firms use cost data in price decisions.
Management Accounting 65: 30–36. Grohmann, K., R.G. Cameron, B.S. Buslig. 1995. Fractionation and pretreatment of orange peel
by dilute acid hydrolysis. Bioresource Technology 54: 129-141. Gunaseelan, V.N. 2004. Biochemical methane potential of fruits and vegetable solid waste
feedstock. Biomass Bioenergy 26: 389-399. Izquierdo, L., and J.M. Sendra. 2003. Citrus Fruit composition and characterization. In
Encyclopedia of food sciences and nutrition, edited by B. Caballero, L. Trugo, and P. Finglas, 6000. Oxford Academic Press.
2015 International Food and Agribusiness Management Association (IFAMA). All rights reserved
170
Vergamini, Cuming and Viaggi Volume 18 Issue 2, 2015
Laufenberg, G., K. Kunz, and M. Nystroem. 2003. Transformation of vegetable waste into value added products: (A) the upgrading concept; (B) practical implementations. Bioresource Technology 87: 167-198.
Lacirignola C., A.M. D'Onghia.2009. The Mediterranean citriculture: productions and
perspectives. In: Citrus tristeza virus and Toxoptera citricidus: a serious threat to the Mediterranean citrus industry (Options Méditerranéennes: Série B. Etudes et Recherches), edited by A.M. D'Onghia, K. Djelouah, and C.N. Roistacher. 65. Bari, CIHEAM, 13-17.
Mamma, D., E. Kourtoglou, P. Christakopoulos. 2008. Fungal multienzyme production on
industrial by-products of the citrus-processing industry. Bioresource Technology 99:2373-2383.
Marìn, F.R., C.S. Rivas, O.B. Garcìa, J. Castillo, J.A. Pérez-Alvarez. 2005. By-products from
different citrus processes as a source of customized functional fibers. Food Chemistry 100: 736-741.
Martin, A.M. (ed.) 1998. Bioconversion of waste materials to industrial products. Second ed.
Blackie Academic and Professional, London. Miller, B.L. and A.G. Buckman, 1987. Cost Allocation and Opportunity Costs. Management
Science 33(5): 626-639. Mizuki, E., T. Akao, T. Saruwatari. 1990. Inhibitory effects of citrus unshu peel on anaerobic-
digestion. Biological Wastes 33(3): 161-168. Pourbafrani, M., G. Forgàcs, I.S. Horvàth, C. Niklasson, M.J. Taherzadeh. 2010. Production of
biofuels, limonene and pectin from citrus wastes. Bioresource Technology 101: 4246-4250.
Schimmenti, E., V. Borsellino, A. Galati. 2013. Growth of citrus production among the Euro-
Mediterranean countries: political implications and empirical findings. Spanish Journal of Agricultural Research 11(3):561-577.
Shim, E., and Sudit E. 1995. How manufacturers price products. Management Accounting 76 (8):
37–39. Streenath, H.K., P.G. Crandall, R.A. Baker. 1995. Utilization of citrus by-products and wastes as
beverages clouding agents. Journal of Fermentation And Bioengineering 80(2):190-194. Stewart, D.S., W.W Widmer, K. Grohmann, M.R.Wilkins. 2005. Ethanol Production from citrus
processing Waste, US Patent Application 11/052620. USDA. 2014. United States Department of Agriculture. Available in http://www.fas.usda.gov/
data/citrus-world-markets-and-trade.
2015 International Food and Agribusiness Management Association (IFAMA). All rights reserved
171
Vergamini, Cuming and Viaggi Volume 18 Issue 2, 2015
Vitali, P.M. 2009. Strumenti per l’analisi dei costi, Vol.3, Percorsi di Management. Torino: Giappichelli.
Widmer, W., and A.M. Montanari. 1995. Citrus waste streams as a source of phytochemicals. In
107th of the Florida State Horticultural Society, 107:284-288. Orlando/Florida, USA. Wilkins, M.R., W.W. Widmer, K. Grohmann, and R.G. Cameron. 2007. Hydrolisis of grapefruit
peel waste with cellulose and pectinase enzymes. Bioresource Technology 98: 1596-1601.
Zimmerman, J. 1979. The cost and benefit of cost allocation. The Accounting Review 54(3): 502-
521.
2015 International Food and Agribusiness Management Association (IFAMA). All rights reserved
172
International Food and Agribusiness Management Review Volume 18 Issue 2, 2015
Syngenta: Changing a Global Company
Elizabeth A Yeagera, W. Scott Downeyb, and David A Widmarc
a Assistant Professor, Department of Agricultural Economics, 337A Waters Hall, Kansas State University, Manhattan, Kansas, 66502, USA
b Associate Professor, Department of Agricultural Economics, 403 West State Street, Purdue University,
West Lafayette, Indiana, 47906, USA
cResearch Associate, Department of Agricultural Economics, 403 West State Street, Purdue University, West Lafayette, Indiana, 47906, USA
Abstract Syngenta customers are facing increasing costs, price volatility and risk for their production. To help customers deal with these challenges, the company announced the integration of seed and crop protection in early 2011. The “One Syngenta” strategy had three objectives: Innovate, Integrate, and Outperform. In North America, the company’s second largest region, the company faced two challenges: the non-exclusive distributors Syngenta sells through would need to carry Syngenta’s message to farmers and the internal culture of Syngenta’s marketing organization in North America would have to shift from specialists to generalists. The specific objectives of this case are to understand the strategic change Syngenta made as it shifted from a product (seed and crop protection) focus to a crop-based focus, assess how a global business can “think like a grower” and move from a product leadership discipline to a customer intimacy discipline, and gain insights into the Syngenta employee, retailer and grower perceptions of the new strategy. Keywords: strategy, seed, crop, innovation
Corresponding author: Tel: + 1.785.532.4935 Email: E. Yeager: [email protected]
W.S. Downey: [email protected] D. Widmar: [email protected]
IFAMA Agribusiness Case 18.2
This case was prepared for class discussion rather than to illustrate either effective or ineffective handling of an agribusiness management situation. The author(s) may have disguised names and other identifying information presented in the case in order to protect confidentiality. IFAMA prohibits any form of reproduction, storage or transmittal without its written permission. To order copies or to request permission to reproduce, contact the IFAMA Business Office. Interested instructors at educational institutions may request the teaching note by contacting the Business Office of IFAMA.
2015 International Food and Agribusiness Management Association (IFAMA). All rights reserved
173
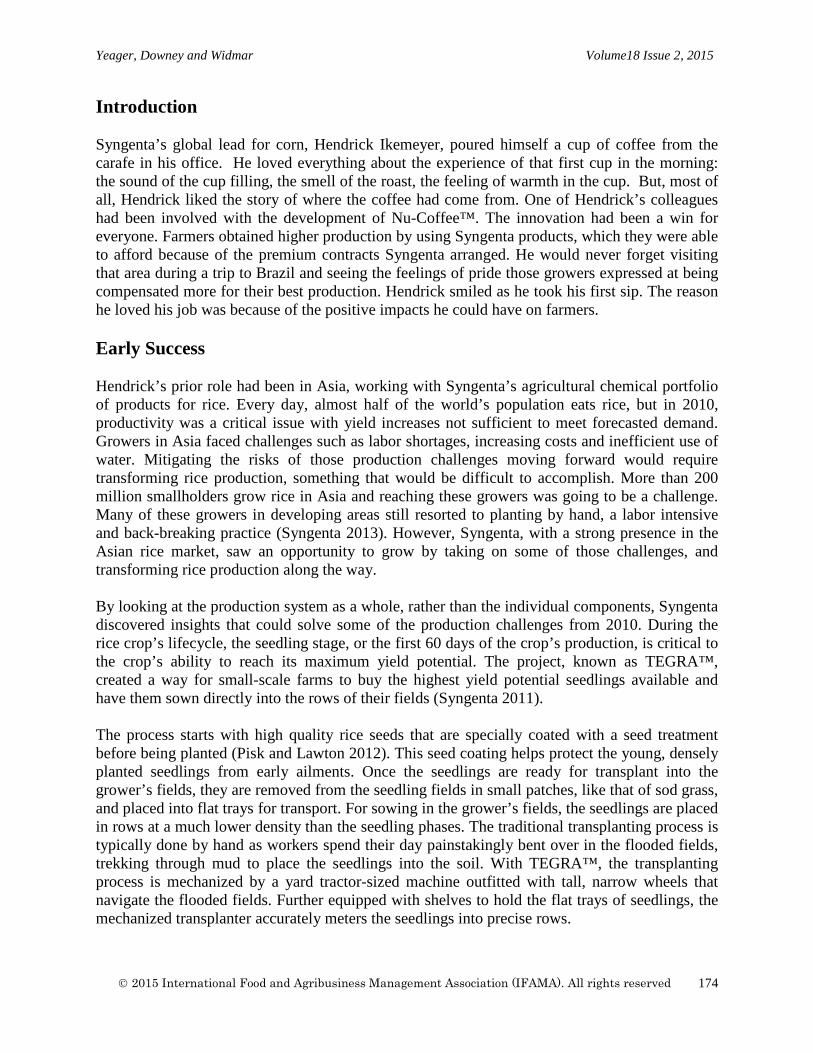
Yeager, Downey and Widmar Volume18 Issue 2, 2015
Introduction Syngenta’s global lead for corn, Hendrick Ikemeyer, poured himself a cup of coffee from the carafe in his office. He loved everything about the experience of that first cup in the morning: the sound of the cup filling, the smell of the roast, the feeling of warmth in the cup. But, most of all, Hendrick liked the story of where the coffee had come from. One of Hendrick’s colleagues had been involved with the development of Nu-Coffee™. The innovation had been a win for everyone. Farmers obtained higher production by using Syngenta products, which they were able to afford because of the premium contracts Syngenta arranged. He would never forget visiting that area during a trip to Brazil and seeing the feelings of pride those growers expressed at being compensated more for their best production. Hendrick smiled as he took his first sip. The reason he loved his job was because of the positive impacts he could have on farmers. Early Success Hendrick’s prior role had been in Asia, working with Syngenta’s agricultural chemical portfolio of products for rice. Every day, almost half of the world’s population eats rice, but in 2010, productivity was a critical issue with yield increases not sufficient to meet forecasted demand. Growers in Asia faced challenges such as labor shortages, increasing costs and inefficient use of water. Mitigating the risks of those production challenges moving forward would require transforming rice production, something that would be difficult to accomplish. More than 200 million smallholders grow rice in Asia and reaching these growers was going to be a challenge. Many of these growers in developing areas still resorted to planting by hand, a labor intensive and back-breaking practice (Syngenta 2013). However, Syngenta, with a strong presence in the Asian rice market, saw an opportunity to grow by taking on some of those challenges, and transforming rice production along the way. By looking at the production system as a whole, rather than the individual components, Syngenta discovered insights that could solve some of the production challenges from 2010. During the rice crop’s lifecycle, the seedling stage, or the first 60 days of the crop’s production, is critical to the crop’s ability to reach its maximum yield potential. The project, known as TEGRA™, created a way for small-scale farms to buy the highest yield potential seedlings available and have them sown directly into the rows of their fields (Syngenta 2011). The process starts with high quality rice seeds that are specially coated with a seed treatment before being planted (Pisk and Lawton 2012). This seed coating helps protect the young, densely planted seedlings from early ailments. Once the seedlings are ready for transplant into the grower’s fields, they are removed from the seedling fields in small patches, like that of sod grass, and placed into flat trays for transport. For sowing in the grower’s fields, the seedlings are placed in rows at a much lower density than the seedling phases. The traditional transplanting process is typically done by hand as workers spend their day painstakingly bent over in the flooded fields, trekking through mud to place the seedlings into the soil. With TEGRA™, the transplanting process is mechanized by a yard tractor-sized machine outfitted with tall, narrow wheels that navigate the flooded fields. Further equipped with shelves to hold the flat trays of seedlings, the mechanized transplanter accurately meters the seedlings into precise rows.
2015 International Food and Agribusiness Management Association (IFAMA). All rights reserved
174
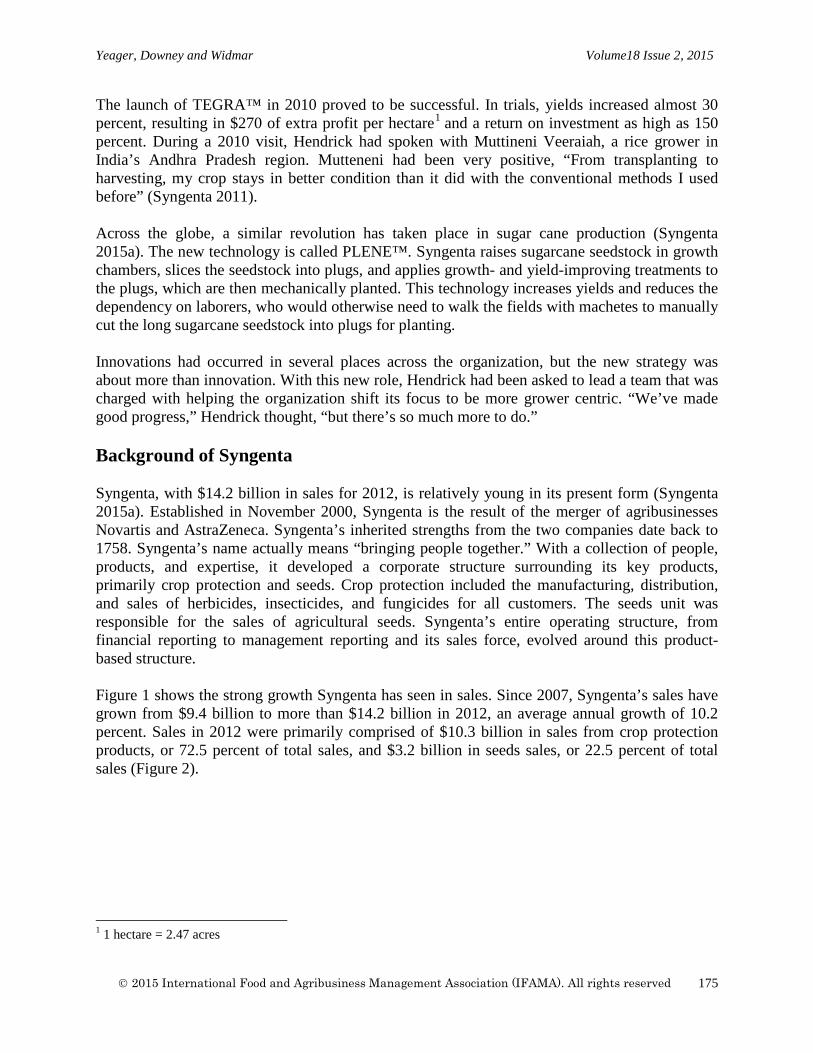
Yeager, Downey and Widmar Volume18 Issue 2, 2015
The launch of TEGRA™ in 2010 proved to be successful. In trials, yields increased almost 30 percent, resulting in $270 of extra profit per hectare1 and a return on investment as high as 150 percent. During a 2010 visit, Hendrick had spoken with Muttineni Veeraiah, a rice grower in India’s Andhra Pradesh region. Mutteneni had been very positive, “From transplanting to harvesting, my crop stays in better condition than it did with the conventional methods I used before” (Syngenta 2011). Across the globe, a similar revolution has taken place in sugar cane production (Syngenta 2015a). The new technology is called PLENE™. Syngenta raises sugarcane seedstock in growth chambers, slices the seedstock into plugs, and applies growth- and yield-improving treatments to the plugs, which are then mechanically planted. This technology increases yields and reduces the dependency on laborers, who would otherwise need to walk the fields with machetes to manually cut the long sugarcane seedstock into plugs for planting. Innovations had occurred in several places across the organization, but the new strategy was about more than innovation. With this new role, Hendrick had been asked to lead a team that was charged with helping the organization shift its focus to be more grower centric. “We’ve made good progress,” Hendrick thought, “but there’s so much more to do.” Background of Syngenta Syngenta, with $14.2 billion in sales for 2012, is relatively young in its present form (Syngenta 2015a). Established in November 2000, Syngenta is the result of the merger of agribusinesses Novartis and AstraZeneca. Syngenta’s inherited strengths from the two companies date back to 1758. Syngenta’s name actually means “bringing people together.” With a collection of people, products, and expertise, it developed a corporate structure surrounding its key products, primarily crop protection and seeds. Crop protection included the manufacturing, distribution, and sales of herbicides, insecticides, and fungicides for all customers. The seeds unit was responsible for the sales of agricultural seeds. Syngenta’s entire operating structure, from financial reporting to management reporting and its sales force, evolved around this product-based structure. Figure 1 shows the strong growth Syngenta has seen in sales. Since 2007, Syngenta’s sales have grown from $9.4 billion to more than $14.2 billion in 2012, an average annual growth of 10.2 percent. Sales in 2012 were primarily comprised of $10.3 billion in sales from crop protection products, or 72.5 percent of total sales, and $3.2 billion in seeds sales, or 22.5 percent of total sales (Figure 2).
1 1 hectare = 2.47 acres
2015 International Food and Agribusiness Management Association (IFAMA). All rights reserved
175
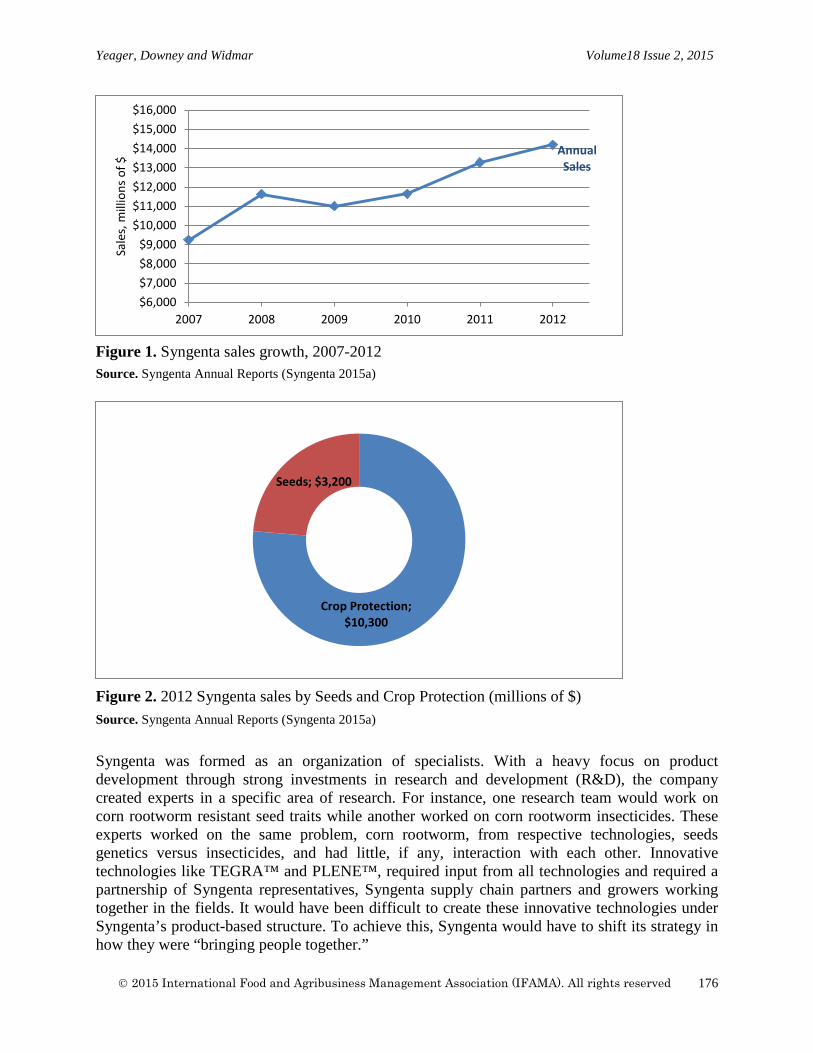
Yeager, Downey and Widmar Volume18 Issue 2, 2015
Figure 1. Syngenta sales growth, 2007-2012 Source. Syngenta Annual Reports (Syngenta 2015a)
Figure 2. 2012 Syngenta sales by Seeds and Crop Protection (millions of $) Source. Syngenta Annual Reports (Syngenta 2015a)
Syngenta was formed as an organization of specialists. With a heavy focus on product development through strong investments in research and development (R&D), the company created experts in a specific area of research. For instance, one research team would work on corn rootworm resistant seed traits while another worked on corn rootworm insecticides. These experts worked on the same problem, corn rootworm, from respective technologies, seeds genetics versus insecticides, and had little, if any, interaction with each other. Innovative technologies like TEGRA™ and PLENE™, required input from all technologies and required a partnership of Syngenta representatives, Syngenta supply chain partners and growers working together in the fields. It would have been difficult to create these innovative technologies under Syngenta’s product-based structure. To achieve this, Syngenta would have to shift its strategy in how they were “bringing people together.”
Annual Sales
$6,000$7,000$8,000$9,000
$10,000$11,000$12,000$13,000$14,000$15,000$16,000
2007 2008 2009 2010 2011 2012
Sale
s, m
illio
ns o
f $
Crop Protection; $10,300
Seeds; $3,200
2015 International Food and Agribusiness Management Association (IFAMA). All rights reserved
176
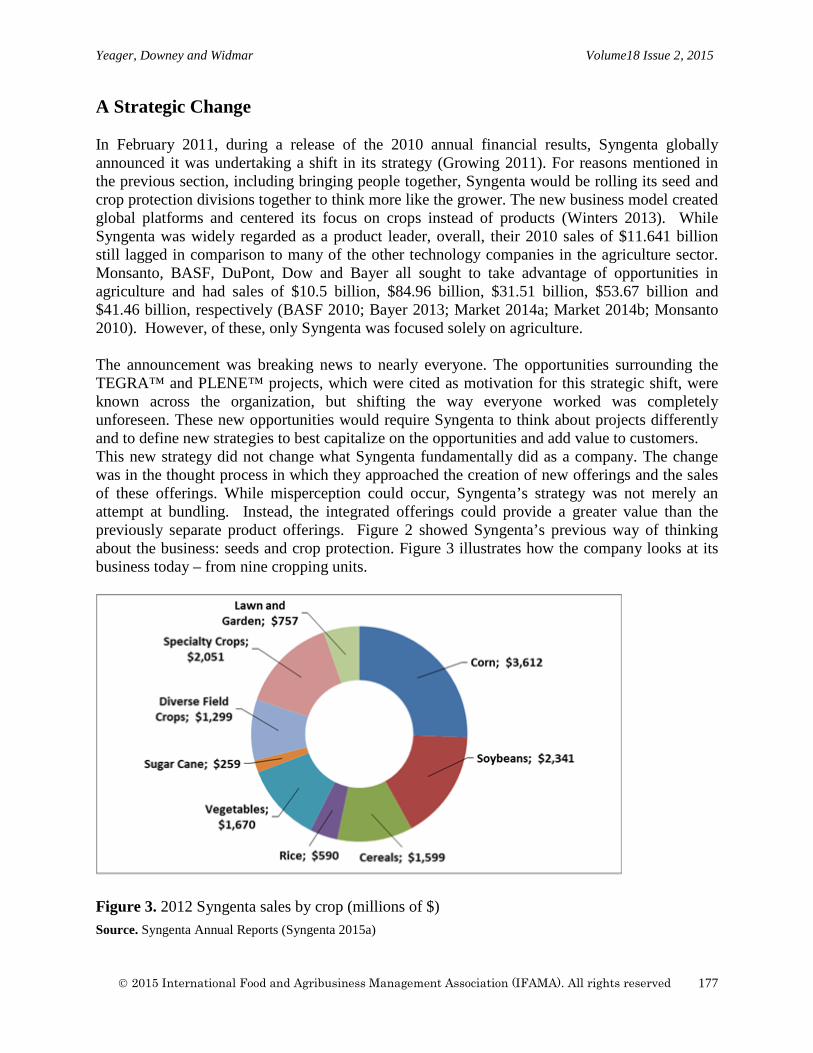
Yeager, Downey and Widmar Volume18 Issue 2, 2015
A Strategic Change In February 2011, during a release of the 2010 annual financial results, Syngenta globally announced it was undertaking a shift in its strategy (Growing 2011). For reasons mentioned in the previous section, including bringing people together, Syngenta would be rolling its seed and crop protection divisions together to think more like the grower. The new business model created global platforms and centered its focus on crops instead of products (Winters 2013). While Syngenta was widely regarded as a product leader, overall, their 2010 sales of $11.641 billion still lagged in comparison to many of the other technology companies in the agriculture sector. Monsanto, BASF, DuPont, Dow and Bayer all sought to take advantage of opportunities in agriculture and had sales of $10.5 billion, $84.96 billion, $31.51 billion, $53.67 billion and $41.46 billion, respectively (BASF 2010; Bayer 2013; Market 2014a; Market 2014b; Monsanto 2010). However, of these, only Syngenta was focused solely on agriculture. The announcement was breaking news to nearly everyone. The opportunities surrounding the TEGRA™ and PLENE™ projects, which were cited as motivation for this strategic shift, were known across the organization, but shifting the way everyone worked was completely unforeseen. These new opportunities would require Syngenta to think about projects differently and to define new strategies to best capitalize on the opportunities and add value to customers. This new strategy did not change what Syngenta fundamentally did as a company. The change was in the thought process in which they approached the creation of new offerings and the sales of these offerings. While misperception could occur, Syngenta’s strategy was not merely an attempt at bundling. Instead, the integrated offerings could provide a greater value than the previously separate product offerings. Figure 2 showed Syngenta’s previous way of thinking about the business: seeds and crop protection. Figure 3 illustrates how the company looks at its business today – from nine cropping units.
Figure 3. 2012 Syngenta sales by crop (millions of $) Source. Syngenta Annual Reports (Syngenta 2015a)
2015 International Food and Agribusiness Management Association (IFAMA). All rights reserved
177
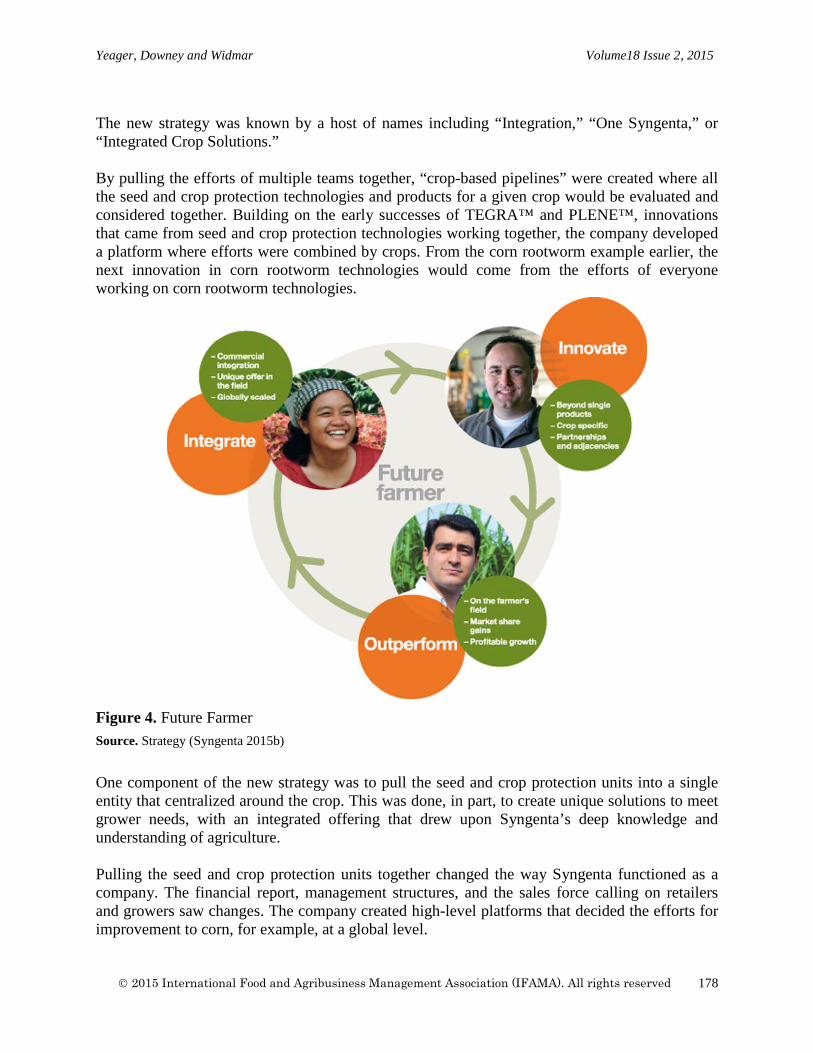
Yeager, Downey and Widmar Volume18 Issue 2, 2015
The new strategy was known by a host of names including “Integration,” “One Syngenta,” or “Integrated Crop Solutions.” By pulling the efforts of multiple teams together, “crop-based pipelines” were created where all the seed and crop protection technologies and products for a given crop would be evaluated and considered together. Building on the early successes of TEGRA™ and PLENE™, innovations that came from seed and crop protection technologies working together, the company developed a platform where efforts were combined by crops. From the corn rootworm example earlier, the next innovation in corn rootworm technologies would come from the efforts of everyone working on corn rootworm technologies.
Figure 4. Future Farmer
Source. Strategy (Syngenta 2015b)
One component of the new strategy was to pull the seed and crop protection units into a single entity that centralized around the crop. This was done, in part, to create unique solutions to meet grower needs, with an integrated offering that drew upon Syngenta’s deep knowledge and understanding of agriculture. Pulling the seed and crop protection units together changed the way Syngenta functioned as a company. The financial report, management structures, and the sales force calling on retailers and growers saw changes. The company created high-level platforms that decided the efforts for improvement to corn, for example, at a global level.
2015 International Food and Agribusiness Management Association (IFAMA). All rights reserved
178
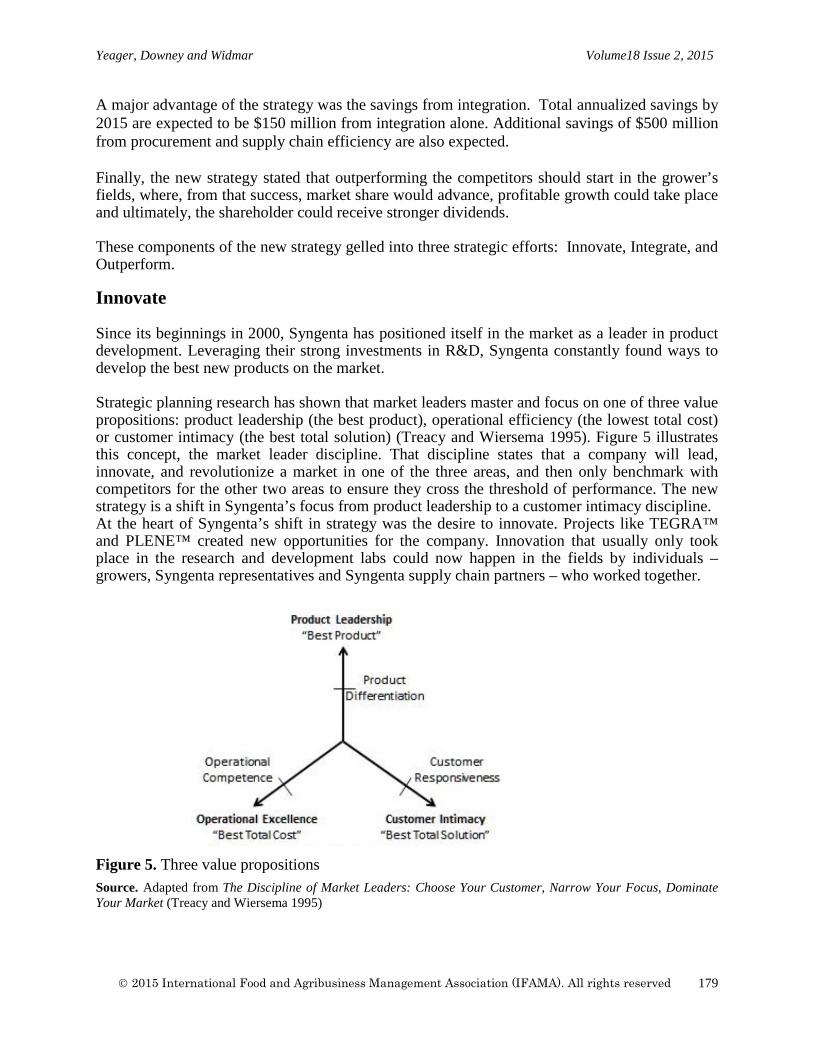
Yeager, Downey and Widmar Volume18 Issue 2, 2015
A major advantage of the strategy was the savings from integration. Total annualized savings by 2015 are expected to be $150 million from integration alone. Additional savings of $500 million from procurement and supply chain efficiency are also expected. Finally, the new strategy stated that outperforming the competitors should start in the grower’s fields, where, from that success, market share would advance, profitable growth could take place and ultimately, the shareholder could receive stronger dividends. These components of the new strategy gelled into three strategic efforts: Innovate, Integrate, and Outperform. Innovate Since its beginnings in 2000, Syngenta has positioned itself in the market as a leader in product development. Leveraging their strong investments in R&D, Syngenta constantly found ways to develop the best new products on the market. Strategic planning research has shown that market leaders master and focus on one of three value propositions: product leadership (the best product), operational efficiency (the lowest total cost) or customer intimacy (the best total solution) (Treacy and Wiersema 1995). Figure 5 illustrates this concept, the market leader discipline. That discipline states that a company will lead, innovate, and revolutionize a market in one of the three areas, and then only benchmark with competitors for the other two areas to ensure they cross the threshold of performance. The new strategy is a shift in Syngenta’s focus from product leadership to a customer intimacy discipline. At the heart of Syngenta’s shift in strategy was the desire to innovate. Projects like TEGRA™ and PLENE™ created new opportunities for the company. Innovation that usually only took place in the research and development labs could now happen in the fields by individuals – growers, Syngenta representatives and Syngenta supply chain partners – who worked together.
Figure 5. Three value propositions
Source. Adapted from The Discipline of Market Leaders: Choose Your Customer, Narrow Your Focus, Dominate Your Market (Treacy and Wiersema 1995)
2015 International Food and Agribusiness Management Association (IFAMA). All rights reserved
179
Yeager, Downey and Widmar Volume18 Issue 2, 2015
Traditional R&D projects are extremely costly, have uncertain outcomes and take years of investment. New innovations, such as TEGRA™, took existing products and offerings (the rice genetics and seedling crop protection technologies) and packaged them into a single offering (high-yield-potential seedlings sown into the grower’s fields). These offerings, often referred to as “Solutions,” create value because they can be sold at a price greater than the sum of the product components, increase growers’ yields and create sales to new customers. Integrate On the surface, the motivation for pulling the seeds and crop protection units together is straightforward. Rather than selling a product for a grower’s problem, the integrated strategy will now position Syngenta and its representatives to work with the grower to find the right products across all Syngenta offerings. Previously, if a grower was having problems with corn rootworm, for example, a conversation with a seed representative would have focused on seed products, while the same conversation with a crop protection representative would have focused around crop protection products. Now, with the integrated strategy, the grower’s conversation with a Syngenta representative will include all the possible products Syngenta has to help with the problem, from both the seed and crop protection portfolios, thus changing the “employee” from a seed or crop protection specialist to a production specialist. This represents a challenge for the internal marketing of the company and a shift in company culture. In North America, Syngenta’s second-largest region (only narrowly trailing the “Europe, Africa and Middle East” region in sales), integration is somewhat more complex, because of the important role of the supply chain. In a system where a grower’s and agricultural retailer’s seed and crop protection representatives were historically two different subject-matter experts, they are now one person who is supported by the Syngenta network of agronomists. This change was critical as Syngenta wanted to turn the tide and move questions from “What product should I use?” to “How can I grow more bushels, and how can I do it better?” In a market where Syngenta focused on providing the best products (a product-leadership position), the focus is now shifting to a strategy closer to the farmer: the company is trying to think more like the grower. Traditionally, the focus has been on external marketing to the grower; however, in order to change the company’s culture, internal marketing became a primary focus following the 2011 announcement. How do you get more than 27,000 employees to develop new expertise while still using their existing knowledge of the company and its product lines? Syngenta realized they needed more generalists, a better understanding of customer needs and innovative approaches in harnessing and compiling this information to a customer-value-added solution. There was also the realization that the company needed to be more proactive in envisioning the customer 20 years from now. How will the world change, and will there be demand for commodity-driven products that can be offered at low costs or specialized high-value products? One of the first challenges was motivating the employees who come in direct contact with customers and getting everyone to work as a team. Many of the seed and crop protection representatives had to learn about all the product offerings and become a general sales representative or transition into a role as a specialist supporting the representatives. Changing the
2015 International Food and Agribusiness Management Association (IFAMA). All rights reserved
180
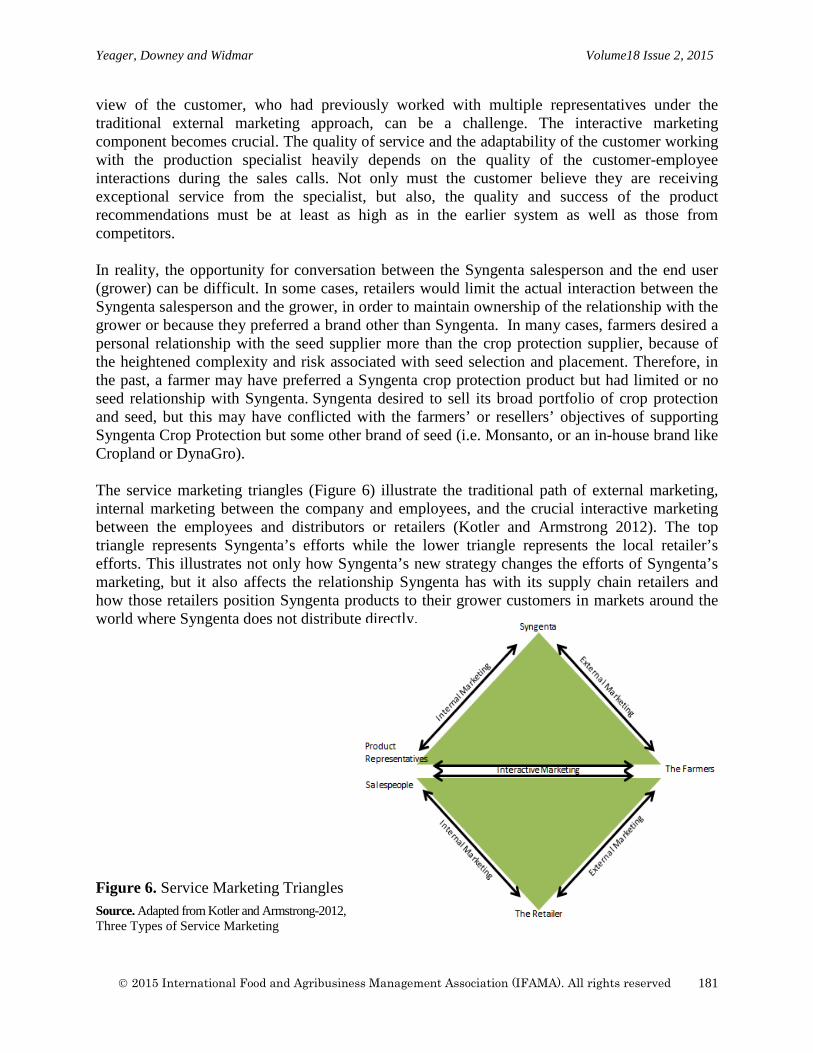
Yeager, Downey and Widmar Volume18 Issue 2, 2015
view of the customer, who had previously worked with multiple representatives under the traditional external marketing approach, can be a challenge. The interactive marketing component becomes crucial. The quality of service and the adaptability of the customer working with the production specialist heavily depends on the quality of the customer-employee interactions during the sales calls. Not only must the customer believe they are receiving exceptional service from the specialist, but also, the quality and success of the product recommendations must be at least as high as in the earlier system as well as those from competitors. In reality, the opportunity for conversation between the Syngenta salesperson and the end user (grower) can be difficult. In some cases, retailers would limit the actual interaction between the Syngenta salesperson and the grower, in order to maintain ownership of the relationship with the grower or because they preferred a brand other than Syngenta. In many cases, farmers desired a personal relationship with the seed supplier more than the crop protection supplier, because of the heightened complexity and risk associated with seed selection and placement. Therefore, in the past, a farmer may have preferred a Syngenta crop protection product but had limited or no seed relationship with Syngenta. Syngenta desired to sell its broad portfolio of crop protection and seed, but this may have conflicted with the farmers’ or resellers’ objectives of supporting Syngenta Crop Protection but some other brand of seed (i.e. Monsanto, or an in-house brand like Cropland or DynaGro). The service marketing triangles (Figure 6) illustrate the traditional path of external marketing, internal marketing between the company and employees, and the crucial interactive marketing between the employees and distributors or retailers (Kotler and Armstrong 2012). The top triangle represents Syngenta’s efforts while the lower triangle represents the local retailer’s efforts. This illustrates not only how Syngenta’s new strategy changes the efforts of Syngenta’s marketing, but it also affects the relationship Syngenta has with its supply chain retailers and how those retailers position Syngenta products to their grower customers in markets around the world where Syngenta does not distribute directly.
Figure 6. Service Marketing Triangles
Source. Adapted from Kotler and Armstrong-2012, Three Types of Service Marketing
2015 International Food and Agribusiness Management Association (IFAMA). All rights reserved
181
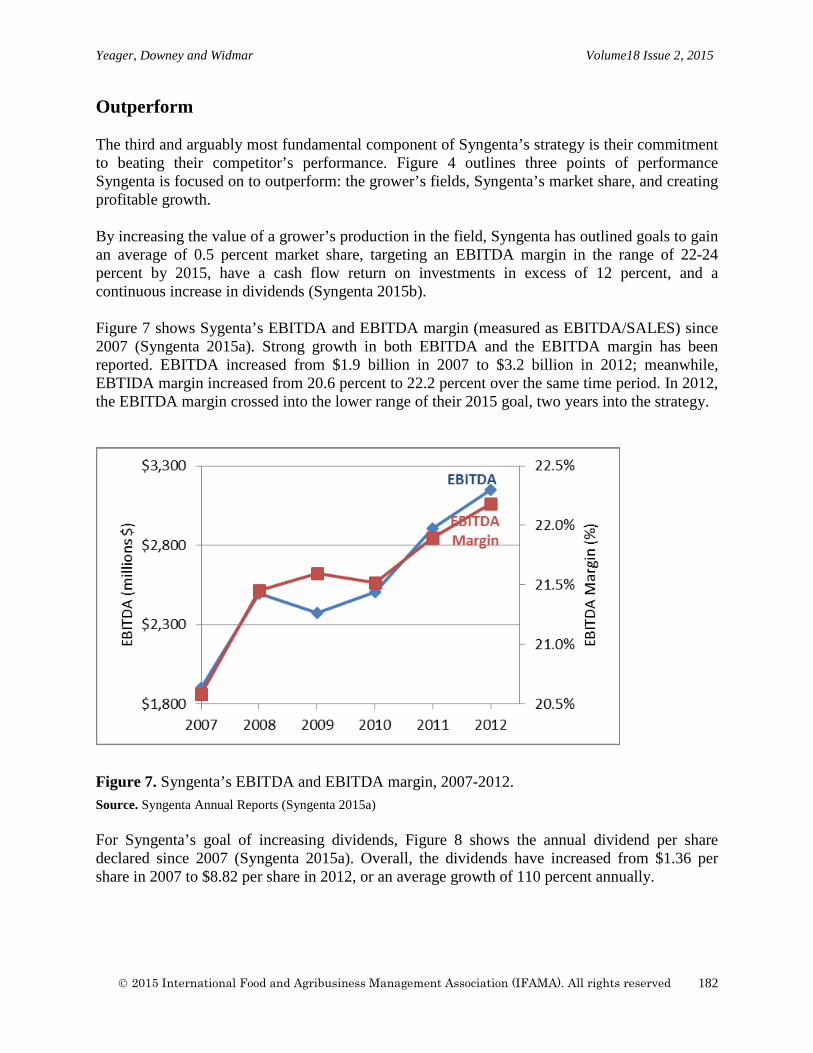
Yeager, Downey and Widmar Volume18 Issue 2, 2015
Outperform The third and arguably most fundamental component of Syngenta’s strategy is their commitment to beating their competitor’s performance. Figure 4 outlines three points of performance Syngenta is focused on to outperform: the grower’s fields, Syngenta’s market share, and creating profitable growth. By increasing the value of a grower’s production in the field, Syngenta has outlined goals to gain an average of 0.5 percent market share, targeting an EBITDA margin in the range of 22-24 percent by 2015, have a cash flow return on investments in excess of 12 percent, and a continuous increase in dividends (Syngenta 2015b). Figure 7 shows Sygenta’s EBITDA and EBITDA margin (measured as EBITDA/SALES) since 2007 (Syngenta 2015a). Strong growth in both EBITDA and the EBITDA margin has been reported. EBITDA increased from $1.9 billion in 2007 to $3.2 billion in 2012; meanwhile, EBTIDA margin increased from 20.6 percent to 22.2 percent over the same time period. In 2012, the EBITDA margin crossed into the lower range of their 2015 goal, two years into the strategy.
Figure 7. Syngenta’s EBITDA and EBITDA margin, 2007-2012.
Source. Syngenta Annual Reports (Syngenta 2015a) For Syngenta’s goal of increasing dividends, Figure 8 shows the annual dividend per share declared since 2007 (Syngenta 2015a). Overall, the dividends have increased from $1.36 per share in 2007 to $8.82 per share in 2012, or an average growth of 110 percent annually.
2015 International Food and Agribusiness Management Association (IFAMA). All rights reserved
182
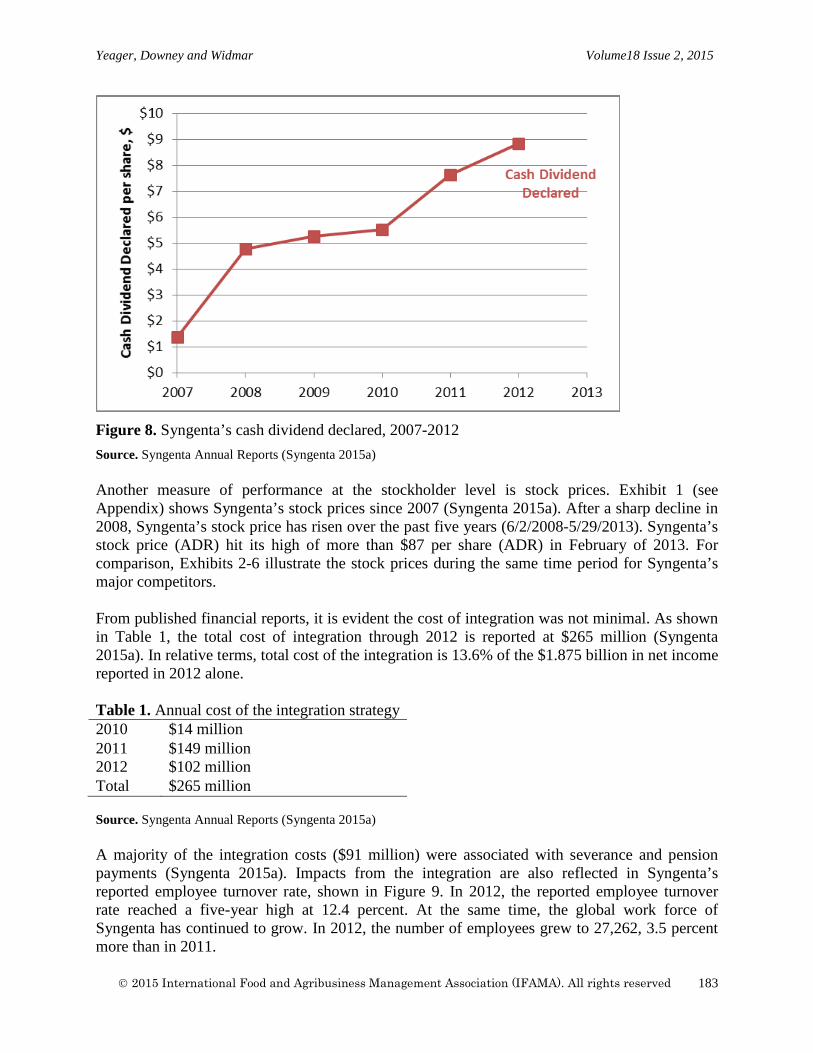
Yeager, Downey and Widmar Volume18 Issue 2, 2015
Figure 8. Syngenta’s cash dividend declared, 2007-2012 Source. Syngenta Annual Reports (Syngenta 2015a) Another measure of performance at the stockholder level is stock prices. Exhibit 1 (see Appendix) shows Syngenta’s stock prices since 2007 (Syngenta 2015a). After a sharp decline in 2008, Syngenta’s stock price has risen over the past five years (6/2/2008-5/29/2013). Syngenta’s stock price (ADR) hit its high of more than $87 per share (ADR) in February of 2013. For comparison, Exhibits 2-6 illustrate the stock prices during the same time period for Syngenta’s major competitors. From published financial reports, it is evident the cost of integration was not minimal. As shown in Table 1, the total cost of integration through 2012 is reported at $265 million (Syngenta 2015a). In relative terms, total cost of the integration is 13.6% of the $1.875 billion in net income reported in 2012 alone. Table 1. Annual cost of the integration strategy 2010 $14 million 2011 $149 million 2012 $102 million Total $265 million Source. Syngenta Annual Reports (Syngenta 2015a) A majority of the integration costs ($91 million) were associated with severance and pension payments (Syngenta 2015a). Impacts from the integration are also reflected in Syngenta’s reported employee turnover rate, shown in Figure 9. In 2012, the reported employee turnover rate reached a five-year high at 12.4 percent. At the same time, the global work force of Syngenta has continued to grow. In 2012, the number of employees grew to 27,262, 3.5 percent more than in 2011.
2015 International Food and Agribusiness Management Association (IFAMA). All rights reserved
183
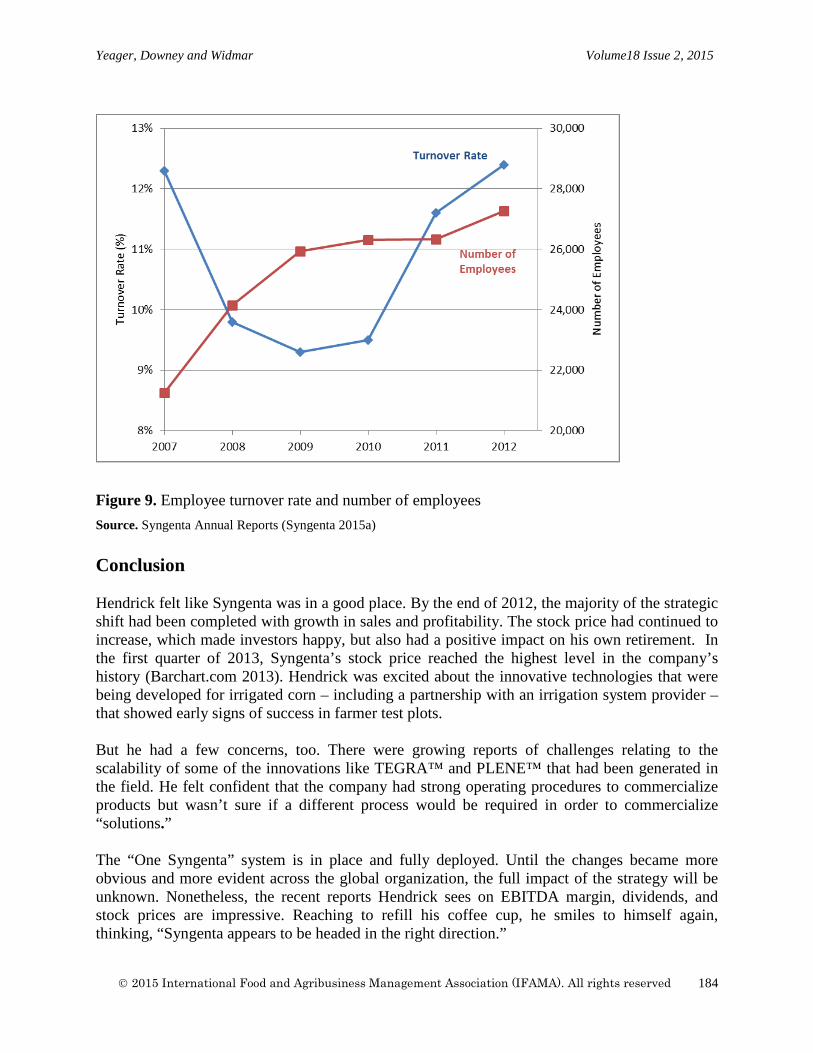
Yeager, Downey and Widmar Volume18 Issue 2, 2015
Figure 9. Employee turnover rate and number of employees Source. Syngenta Annual Reports (Syngenta 2015a) Conclusion Hendrick felt like Syngenta was in a good place. By the end of 2012, the majority of the strategic shift had been completed with growth in sales and profitability. The stock price had continued to increase, which made investors happy, but also had a positive impact on his own retirement. In the first quarter of 2013, Syngenta’s stock price reached the highest level in the company’s history (Barchart.com 2013). Hendrick was excited about the innovative technologies that were being developed for irrigated corn – including a partnership with an irrigation system provider – that showed early signs of success in farmer test plots. But he had a few concerns, too. There were growing reports of challenges relating to the scalability of some of the innovations like TEGRA™ and PLENE™ that had been generated in the field. He felt confident that the company had strong operating procedures to commercialize products but wasn’t sure if a different process would be required in order to commercialize “solutions.” The “One Syngenta” system is in place and fully deployed. Until the changes became more obvious and more evident across the global organization, the full impact of the strategy will be unknown. Nonetheless, the recent reports Hendrick sees on EBITDA margin, dividends, and stock prices are impressive. Reaching to refill his coffee cup, he smiles to himself again, thinking, “Syngenta appears to be headed in the right direction.”
2015 International Food and Agribusiness Management Association (IFAMA). All rights reserved
184
Yeager, Downey and Widmar Volume18 Issue 2, 2015
Critical Thinking Points
1. Do you think the Solutions Syngenta is putting together, such as PLENE™ and TEGRA™, will be successful in the marketplace?
a. In general, how could Syngenta make Solutions more attractive to the customer? b. What competitive responses would you anticipate?
2. How can Syngenta increase acceptance and build customer trust to ensure their strategy is
sustainable in the long run? If Syngenta does this correctly, does this make them a market leader?
3. Given the large differences in agronomic practices, crops and regulations around the world, can a global company be grower-centric?
4. By changing the “employee” from a seed or crop protection specialist to a production generalist, Syngenta is trying to change the interactive marketing component. What risks does Syngenta face here?
5. How do financial markets and stockholder opinions influence the implementation of this strategy? What contingencies should Syngenta’s leadership plan for?
References BASF. 2010. Sales and Earnings.
http://report.basf.com/2010/en/managementsanalysis/businessreview/salesandearnings.html?cat=m [accessed April 10, 2015].
Barchart.com. 2013. Five Year Weekly OHLC Charts.
http://www.barchart.com/interactive_charts/stocks/ [accessed April 10, 2015]. Bayer AG. 2013. Bayer Annual Report 2010. http://www.annualreport2010.bayer.com/en/bayer-
annual-report-2010.pdfx [accessed April 9, 2015]. Growing Produce. 2011. Syngenta to Merge Seeds, Crop Protection.
http://www.growingproduce.com/article/7127/syngenta-to-merge-seeds-crop-protection [accessed April 10, 2015].
Kotler, Phillip, and Gary Armstrong. 2012. Principles of Marketing, 14th Edition. Upper Saddle
River, NJ: Prentice Hall. Market Watch. 2014a. Annual Financials for Dow Chemical Co.
http://www.marketwatch.com/investing/stock/DOW/financials [accessed April 8, 2015].
2015 International Food and Agribusiness Management Association (IFAMA). All rights reserved
185
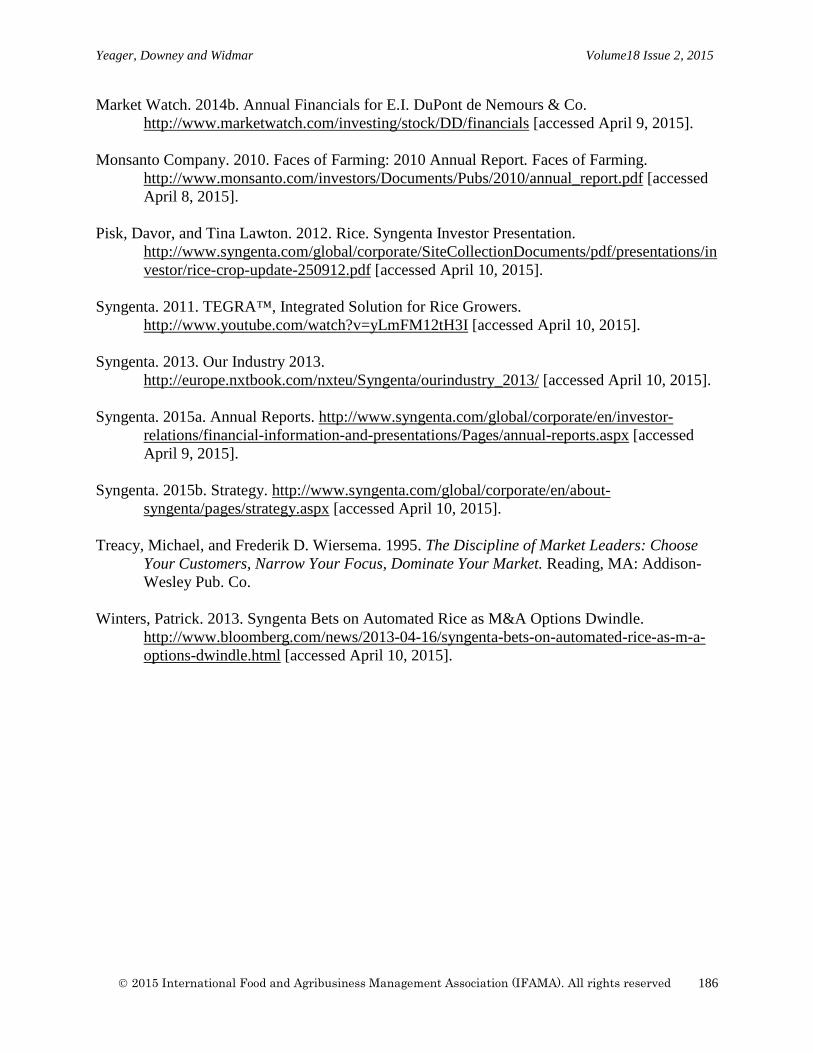
Yeager, Downey and Widmar Volume18 Issue 2, 2015
Market Watch. 2014b. Annual Financials for E.I. DuPont de Nemours & Co. http://www.marketwatch.com/investing/stock/DD/financials [accessed April 9, 2015].
Monsanto Company. 2010. Faces of Farming: 2010 Annual Report. Faces of Farming.
http://www.monsanto.com/investors/Documents/Pubs/2010/annual_report.pdf [accessed April 8, 2015].
Pisk, Davor, and Tina Lawton. 2012. Rice. Syngenta Investor Presentation.
http://www.syngenta.com/global/corporate/SiteCollectionDocuments/pdf/presentations/investor/rice-crop-update-250912.pdf [accessed April 10, 2015].
Syngenta. 2011. TEGRA™, Integrated Solution for Rice Growers.
http://www.youtube.com/watch?v=yLmFM12tH3I [accessed April 10, 2015]. Syngenta. 2013. Our Industry 2013.
http://europe.nxtbook.com/nxteu/Syngenta/ourindustry_2013/ [accessed April 10, 2015]. Syngenta. 2015a. Annual Reports. http://www.syngenta.com/global/corporate/en/investor-
relations/financial-information-and-presentations/Pages/annual-reports.aspx [accessed April 9, 2015].
Syngenta. 2015b. Strategy. http://www.syngenta.com/global/corporate/en/about-
syngenta/pages/strategy.aspx [accessed April 10, 2015]. Treacy, Michael, and Frederik D. Wiersema. 1995. The Discipline of Market Leaders: Choose
Your Customers, Narrow Your Focus, Dominate Your Market. Reading, MA: Addison-Wesley Pub. Co.
Winters, Patrick. 2013. Syngenta Bets on Automated Rice as M&A Options Dwindle.
http://www.bloomberg.com/news/2013-04-16/syngenta-bets-on-automated-rice-as-m-a-options-dwindle.html [accessed April 10, 2015].
2015 International Food and Agribusiness Management Association (IFAMA). All rights reserved
186
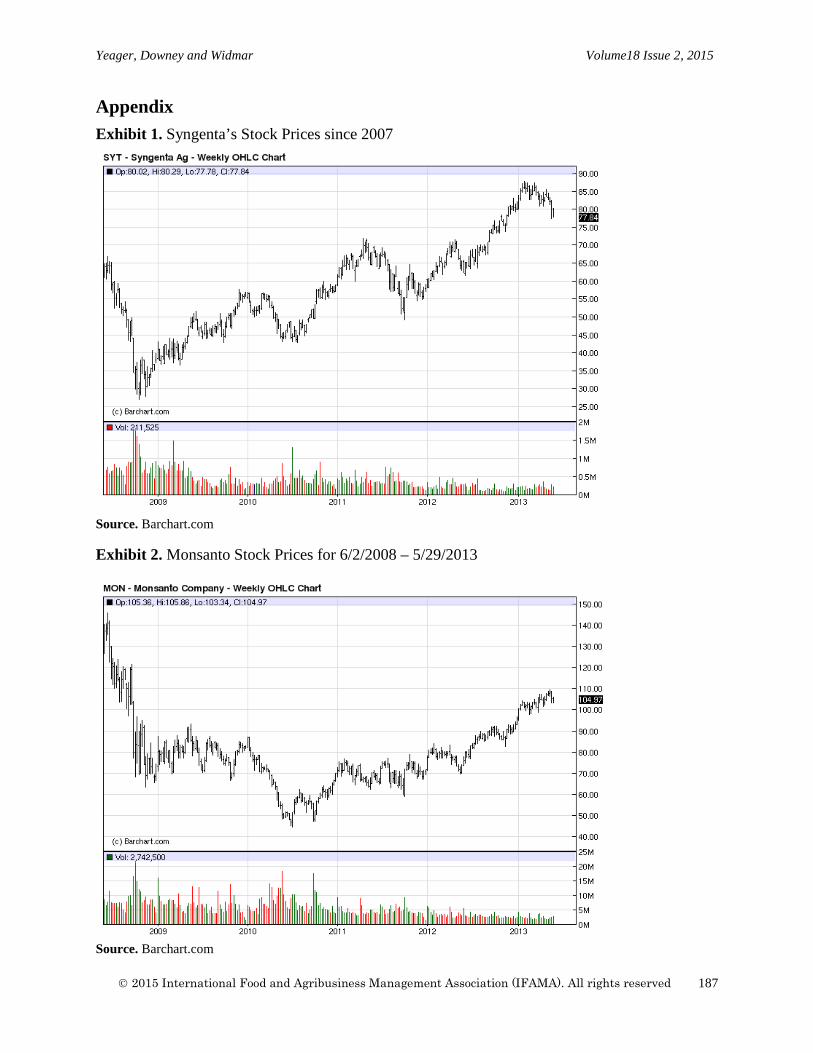
Yeager, Downey and Widmar Volume18 Issue 2, 2015
Appendix Exhibit 1. Syngenta’s Stock Prices since 2007
Source. Barchart.com Exhibit 2. Monsanto Stock Prices for 6/2/2008 – 5/29/2013
Source. Barchart.com
2015 International Food and Agribusiness Management Association (IFAMA). All rights reserved
187
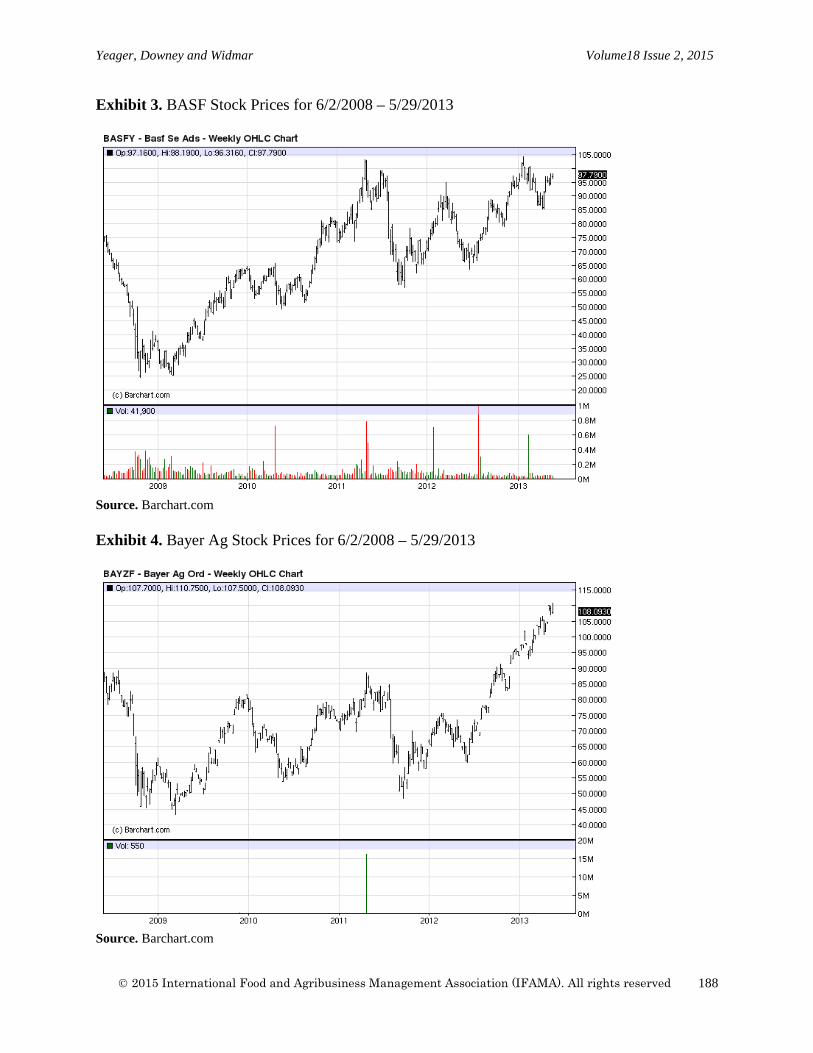
Yeager, Downey and Widmar Volume18 Issue 2, 2015
Exhibit 3. BASF Stock Prices for 6/2/2008 – 5/29/2013
Source. Barchart.com Exhibit 4. Bayer Ag Stock Prices for 6/2/2008 – 5/29/2013
Source. Barchart.com
2015 International Food and Agribusiness Management Association (IFAMA). All rights reserved
188
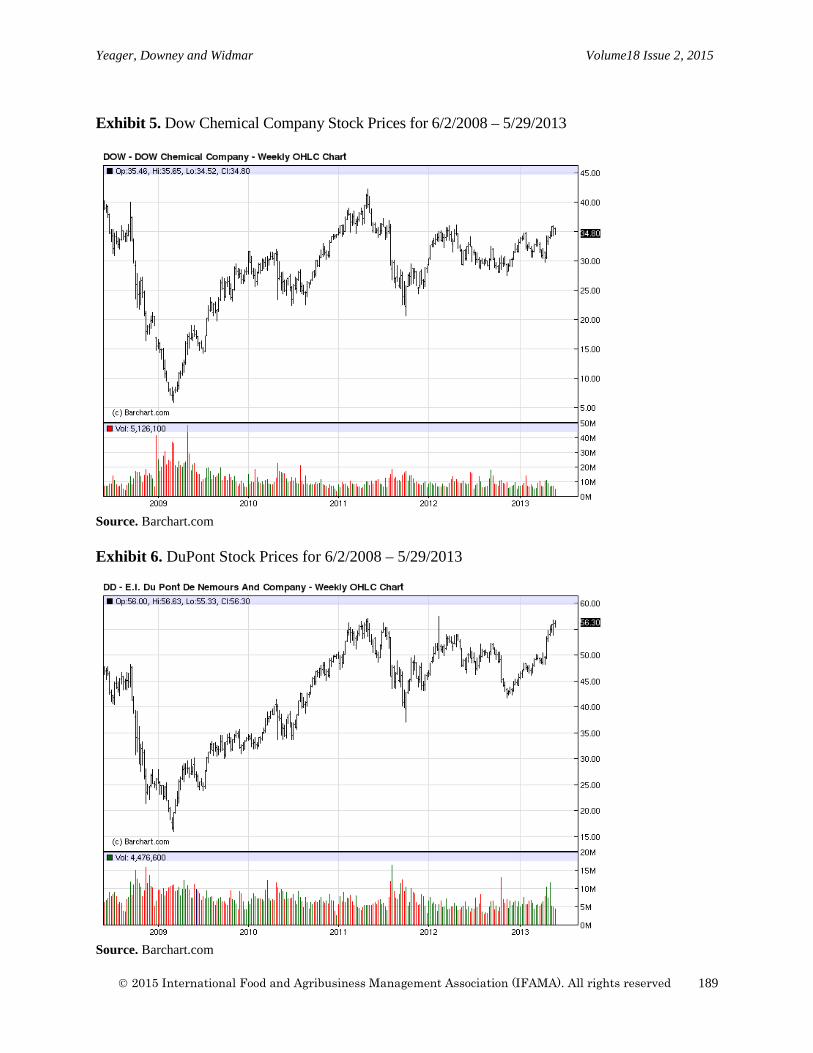
Yeager, Downey and Widmar Volume18 Issue 2, 2015
Exhibit 5. Dow Chemical Company Stock Prices for 6/2/2008 – 5/29/2013
Source. Barchart.com Exhibit 6. DuPont Stock Prices for 6/2/2008 – 5/29/2013
Source. Barchart.com
2015 International Food and Agribusiness Management Association (IFAMA). All rights reserved
189

IFAMA Business Office • 1010 Vermont Ave., Suite 201• Washington DC, 20005, USA
Tel: 1-202-429-1610 • Fax: 1-202-530-0659 • E-mail: [email protected] • Web: http://www.ifama.org
The IFAMR (ISSN #: 1559-2448)