Embed Size (px)
Citation preview
volume 11 · number 4 · winter 2016 · issn 1854-4231

managementissn 1854-4231 www.mng.fm-kp.si
editor
Štefan Bojnec, University of Primorska,Slovenia, [email protected]
executive editor
Klemen Kavcic, University of Primorska,Slovenia, [email protected]
associate editors
Imre Ferto, Corvinus University of Budapest,Hungary, [email protected]
Josu Takala, University of Vaasa, Finland,[email protected]
managing and production editor
Alen Ježovnik, University of Primorska,Slovenia, [email protected]
editorial board
Josef C. Brada, Arizona State University,usa, [email protected]
Birgit Burböck, FH Joanneum, Austria,[email protected]
Andrzej Cieslik, University of Warsaw,Poland, [email protected]
Liesbeth Dries, University of Wageningen,The Netherlands, [email protected]
Henryk Gurgul, agh University of Scienceand Technology, Poland,[email protected]
Timotej Jagric, University of Maribor,Slovenia, [email protected]
Ladislav Kabat, Pan-European University,Slovakia, [email protected]
Pekka Kess, University of Oulu, Finland,[email protected]
Masaaki Kuboniwa, HitotsubashiUniversity, Japan, [email protected]
Mirna Leko-Šimic, Josip Juraj StrossmayerUniversity of Osijek, Croatia, [email protected]
Zbigniew Pastuszak, MariaCurie-Skłodowska University, Poland,[email protected]
Katarzyna Piorkowska, Wroclaw Universityof Economics, Poland,[email protected]
Najla Podrug, University of Zagreb, Croatia,[email protected]
Cezar Scarlat, University Politehnica ofBucharest, Romania,[email protected]
Hazbo Skoko, Charles Sturt University,Australia, [email protected]
Marinko Škare, Juraj Dobrila University ofPula, Croatia, [email protected]
Janez Šušteršic, International School ofSocial and Business Studies, Slovenia,[email protected]
Milan Vodopivec, University of Primorska,Slovenia, [email protected]
aims and scope
The journal Management integrates prac-titioners’, behavioural and legal aspects ofmanagement. It is dedicated to publishingarticles on activities and issues within or-ganisations, their structure and resources.It advocates the freedom of thought andcreativity and promotes the ethics in deci-sion-making and moral responsibility.
indexing and abstracting
Management is indexed/listed in ibz,doaj, Erih Plus, EconPapers,Cabell’s, and ebsco.
submissions
The manuscripts should be submitted ase-mail attachment to the editorial office [email protected]. Detailed guide for authorsand publishing ethics statement are avail-able at www.mng.fm-kp.si.
editorial office
University of PrimorskaFaculty of ManagementCankarjeva 5, 6101 Koper, [email protected] · www.mng.fm-kp.si
published by
University of Primorska PressTitov trg 4, 6000 Koper, [email protected] · www.hippocampus.si
Revija Management je namenjena mednarod-ni znanstveni javnosti; izhaja v anglešcini spovzetki v slovenšcini. Izid revije je financnopodprla Javna agencija za raziskovalnodejavnost Republike Slovenije iz sredstevdržavnega proracuna iz naslova razpisa zasofinanciranje izdajanja domacih znanstvenihperiodicnih publikacij.
volume 11 (2016) number 4 issn 1854-4231
271 The Effect of Work Stress and Copingon Organizational Justice: An Empirical Investigationof Turkish Telecommunicationsand Banking IndustriesTutku Seçkin-Çelik and Ayse Çoban
289 How Does Millennials’ Perception on TheirEmployers Affect Their Work Ethic?A Study in Hong KongTsun-Lok Kwong
309 Academia-Industry Nexus ManagementSergej Gricar and Barbara Rodica
327 The Readiness of the European Union to Embracethe Fourth Industrial RevolutionÉva Kuruczleki, Anita Pelle, Renáta Laczi,and Boglárka Fekete
349 Evidence on Economic Growth and FinancialDevelopment in MontenegroMilena Lipovina-Božovic and Julija Cerovic Smolovic
367 Abstracts in Slovene


The Effect of Work Stress andCoping on Organizational Justice:An Empirical Investigationof Turkish Telecommunicationsand Banking Industries
tutku seçkin-çelik
Istanbul Medeniyet University, [email protected]
ayse çoban
Istanbul Medeniyet University, [email protected]
The aim of this paper is to investigate the role of coping mech-anisms and work stress on employees’ perceptions of organiza-tional justice. A survey of 211 white-collar employees in the bank-ing and telecommunications industries was taken. Multiple re-gression analyses were performed in order to understand the ef-fect of coping mechanisms and work stress on organizational jus-tice. The results showed that overall perception of justice is af-fected negatively by work stress and positively by coping mecha-nisms, except emotion-focused coping. However, sub-dimensionsof organizational justice showed distinctive relationship patterns.Thus, it was concluded both individual and organizational deter-minants play a role in employees’ perceptions of organizationaljustice.
Key words: organizational justice, work stress, coping,telecommunication, banking
Introduction
The issue of justice is important in the organizational context, aswell as in daily life. Employees compare their wage, benefits, howthey are treated, and how much they receive information. It is impor-tant for organizations to be seen as just by their employees, becauseseveral studies found significant negative relationships between per-ceptions of injustice on the part of employees and work related out-comes. Organizational justice is related with job performance (Aryeeet al. 2015; Cropanzano, Prehar, and Chen 2002; Rupp and Cropan-zano 2002), job satisfaction and turnover intentions (Akram et al.2015; Alexander and Ruderman, 1987), organizational commitment
management 11 (4): 271–287 271
Tutku Seçkin-Çelik and Ayse Çoban
(De Cremer et al. 2004; Liden et al. 2003; Tepper 2000); counterpro-ductive work behaviours (Fox, Spector, and Miles 2001; Jawahar andStone 2015), trust (Colquitt and Rodel 2011; Katou 2013) and orga-nizational citizenship behaviour (Liden et al. 2003; Moorman 1991;Rupp and Cropanzano 2002). These studies showed that organiza-tional justice is an important matter which organizations must man-age effectively. However, employees’ comparisons contain their indi-vidual judgments, in other words their perceptions. The decision ofthe fairness of an organization depends on a highly subjective expe-rience.
Employees who are facing the same sort of unfair practices mightappraise these situations in different ways. As Greenberg (2001, 246)suggested, ‘Justice might always be a potential concern, but that po-tential will materialize only sometimes’. An unfair distribution ortreatment might still be considered fair depending on certain envi-ronmental and individual characteristics. Justice considerations are‘influenced by outcomes one receives from the organization, orga-nizational practices and procedures, and characteristics of the per-ceiver’ (Cohen-Charash and Spector 2001, 282). Since it is a percep-tual attribution, individuals’ personal characteristics play an impor-tant role in the process of evaluating fairness in the workplace. Forexample, the study by Wanberg, Bunce, and Gavin (1999) showedthat employees who have high scores in negative affectivity are morelikely to perceive their organization and organizational practices asbeing unfair compared to individuals with a low negative affectiv-ity score. Besides the level of stress employees produce and strate-gies to deal with it, stress also depends upon their personal charac-teristics. Again, positive and negative affectivity alters individuals’responses against stressful situations, and their strain levels (Foga-rty et al. 1999). Also, big five personality traits are related to differ-ent coping mechanisms in varied levels (Connor-Smith and Flachs-bart 2007). Personality dimensions of extroversion and neuroticismare highly effective in explaining the stress levels of individuals(Fontana and Abouseri 1993). Emotional intelligence, in addition tobeing a highly personality-related construct, is also a good predic-tor of distress and avoidance (emotion-focused) coping mechanism(Matthews et al. 2006).
Investigating specific personality differences on organizationaljustice is not the main aim of the research; however, one should ac-cept that the justice issue is highly perceptual and subjective. There-fore, stress levels and coping mechanisms, which depend highlyupon one’s personality, should not be underestimated while deter-
272 management · volume 11
The Effect of Work Stress and Coping on Organizational Justice
mining organizational justice perceptions. In order to broaden theunderstanding of differences in perceptions of organizational jus-tice, work stress and coping mechanisms that are chosen to dealwith stressful situations at work are considered here. A quick lit-erature review on work stress, organizational justice, and copingmechanisms will be mentioned briefly. Then, the results of the re-search performed on 211 employees from the telecommunicationsand banking industries will be provided.
Literature Review
work stress
Psychological stress is defined as ‘a relationship between the per-son and the environment that is appraised by taxing or exceed-ing his or her resources and endangering his or her well being’(Lazarus and Folkman 1984, 21). When it comes to work stress, defi-nitions also follow the Person-Environment Fit as well. For example,Cooper and Marshall (1976, 11) conceptualizes work stress as ‘a neg-ative environmental factor or stressors (e.g. work overload, role con-flict/ambiguity, poor working conditions) associated with a particularjob’. Besides Blau (1981, 280) states, ‘where either an environmental(job) demand exceeds a person’s response capability, or the person’scapabilities exceed the environmental demand, the resulting misfitrepresents stress’. It is clear from these conceptualizations that workstress requires an employee to feel a misfit between her capabilities,resources, or demands and the expectations from the work environ-ment.
Work stressors that create an unfit for the employee can be clas-sified into several dimensions. Stressors might be intrinsic to the job(e.g., poor physical working conditions, work overload, time pres-sures). They might be related to the role in the organization (e.g., roleambiguity, role conflict), related to career development (e.g., overpromotion, under promotion, lack of job security), related to rela-tionships at work (e.g., poor relations with the boss, subordinates orcolleagues, difficulties in delegating responsibility), and/or related toorganizational structure and climate (e.g. little or no participation indecision-making, office politics) (Cooper and Marshall 1976).
coping mechanisms
Individuals’ judgment about the person-environment relationshipfit depends on their cognitive appraisal processes. Primary ap-praisal includes judgments about whether an encounter is irrele-vant, benign-positive, or stressful. If an individual decides that a
number 4 · winter 2016 273
Tutku Seçkin-Çelik and Ayse Çoban
situation is stressful, then in the secondary appraisal they evaluatethe process and decide which coping options are available. Thus,coping is defined as ‘constantly changing cognitive and behaviouralefforts to manage specific external and/or internal demands thatare appraised as taxing or exceeding the resources of the person’(Lazarus and Folkman 1984, 141). Nevertheless, some individualscannot simply adapt their attitudes and behaviours in accordancewith the environmental demands, while others are able to do so(Cooper and Marshall 1976).
Coping mechanisms or strategies can be classified as problem-focused coping, emotion-focused coping, and social support-seekingcoping mechanisms. Problem-focused coping refers to the ‘attemptsto alter or manage the situation’, while emotion-focused copingrefers to ‘attempts to reduce or manage emotional distress’ (Latack1986, 377). On the other hand, ‘attempts to obtain advice or expressemotions’ are identified as coping by seeking social support (Litman2006, 274).
organizational justice
The literature on organizational justice was primarily concernedwith fairness of resource distribution, referred to later as distributivejustice. Adams’ (1963) equity theory can be shown as the basis fordistributive justice, and carries with it the main assumption that in-equity results from the inconsistencies between the inputs and out-comes of one person relative to another. Thus, whenever a personfeels that his/her inputs and outcomes are not congruent with thereference person’s inputs and outputs, inequity exists (Adams 1963).Later work that focused on the appropriateness of resource alloca-tion processes, or the justice of the processes that lead to decisionoutcomes, pointed out procedural justice (Colquitt 2001; Cropan-zano, Bowen, and Gilliland 2007).
However, as time passed it became clear that it is not only the dis-tribution of outcomes or decision-making processes that influenceperceptions of fairness (Bies 2001). People are also influenced bythe interpersonal treatment they receive from others. A third formof justice, interactional justice, was coined by Bies and Moag (1986)and defined as ‘people’s concerns about the quality of interpersonaltreatment they receive during the enactment of organizational pro-cedures’. In recent years, interactional justice perception has startedto be evaluated in two sub-dimensions as interpersonal and interac-tional justice. Interpersonal justice is defined as ‘the degree to whichpeople are treated with politeness, dignity, and respect by authori-
274 management · volume 11
The Effect of Work Stress and Coping on Organizational Justice
ties or third parties involved in executing procedures or determiningoutcomes’, while informational justice ‘focuses on the explanationsprovided to people that convey information about what procedureswere used in a certain way or why outcomes were distributed in acertain fashion’ (Colquitt et al. 2001, 427).
the effect of work stress and coping on justice
perceptions
Adams (1963) proposed that inequity carries a stress mechanism andthis idea has been supported by further studies showing that injus-tice perception produces stress and stress related health problemsvia directly influence strain, and via mediating or moderating thestress and strain relationship (e.g., Elovainio, Kivimaki, and Vahtera2002; Judge and Colquitt 2004; Tepper 2000; 2001; Zohar 1995). Orga-nizational justice dimensions have significant relationships betweenpsychological distress and stress symptoms of depression, anxietyand emotional exhaustion (Tepper 2000; 2001). There are also otherapproaches to justice and stress relationship such that organiza-tional justice perceptions are considered as an additional source ofstress. Role justice concept and proposing justice as a work stressorwhile examining its relationship with counterproductive work be-haviours are examples of this view (Fox, Spector, and Miles 2001;Zohar 1995). Contrary to the common conceptualization in the litera-ture, this paper views work stress as an antecedent of organizationaljustice perception. In other words, several work related stressors ef-fect employees’ perceptions of organizational justice.
As for work stress and coping mechanisms, studies showed thatchosen coping strategies create differences in individuals’ stresslevels. Peng et al. (2012) found that emotion-focused coping has asignificant relationship with psychological distress, while problem-focused and social support-seeking coping styles do not. Snow et al.(2003) have found similar results with emotion-focused coping andnegative psychological outcomes. It was generally the result thatproblem-focused coping is positively related to employee wellbeing,while emotion-focused coping is negatively related (Tsaur and Tang2012; Sunny-Hu and Cheng 2010). Also, these coping strategies havebuffering and moderating effects on the relationship between workstress and wellbeing (Tsaur and Tang 2012). Moreover, social sup-port from co-workers and supervisors can reduce the stress levelsof employees and help them use active coping strategies more (Blau1981; Snow et al. 2003). Previous studies have shown that work stressand coping mechanisms are closely related to the organizational jus-
number 4 · winter 2016 275

Tutku Seçkin-Çelik and Ayse Çoban
tice perceptions of the employees. However, previous models on thetopic have proposed a reverse relationship: organizational justice af-fects work stress. In this paper, it is thought that injustice practices atwork are insufficient to explain work stress. Some stressors relatedto work might highly affect organizational justice perceptions, yetwhile studying work stress, as an aggregate construct, it is difficultto distinguish the unique effect of organizational justice perceptionsamong lots of work stressors that are highly interweaving. It is notasserted here that organizational justice can’t be a predictor of workstress; rather it is more meaningful for organizational justice to bea consequence of work stress. Employees who are more stressedmight be more alerted for unjust situations. Stressful situations andindividual characteristics/attitudes might be more affective on theformation of justice perceptions in a highly complex work environ-ment. Thus, the following hypotheses are proposed in this study:
h1 Overall justice perception will be affected by work stress andcoping mechanisms more specifically justice will be affected neg-atively by work stress and positively by coping mechanisms.
h2 Procedural justice perception will be affected negatively by workstress and positively by coping mechanisms.
h3 Distributive justice perception will be affected negatively bywork stress and positively by coping mechanisms.
h4 Informational justice perception will be affected negatively bywork stress and positively by coping mechanisms.
h5 Interpersonal justice perception will be affected negatively bywork stress and positively by coping mechanisms.
Method
The analyses were based on the data collected from 211 participantsworking in banking and telecommunications industries. All itemsused in this study were taken from previously used and validatedscales. They were independently translated, and then back trans-lated by bilinguals. Differences between the original and the trans-lated version were assessed, and some items were changed. To fur-ther determine the validity of scales, explanatory factor analyses andreliability analyses were carried out. While testing the proposed hy-potheses, regression analyses were applied. According to collinear-ity statistics, tolerance and vif, multicollinearity is not a concern af-fecting the proposed models. The findings will be presented in thefollowing sections.
276 management · volume 11
The Effect of Work Stress and Coping on Organizational Justice
sample
211 employees from different institutions in the banking and tele-communications industries participated in the study. Banking em-ployees were considered due to the findings of previous studiesshowing the industry as highly stressful and competitive (e.g., Khat-tak et al. 2011; Michailidis and Georgiou 2005). The telecommu-nications industry was also chosen due to major restructuring at-tempts after privatization and liberalization of the industry in recentyears in Turkey. After these privatization processes, there has beenhuge amount of ambiguity regarding job security and organizationalchange. Thus, employees from two industries that are highly inse-cure and competitive were selected for inclusion in the sample.
In order to collect data, the convenience sampling method wasused. People who wanted to participate in the study were sent a linkto the online survey. According to the frequency statistics, the de-mographic profile of the participants is as follows, in approximatenumbers. In terms of age, 6% of the respondents were below 25, 48%were 25–9, 30% were 30–4, 7% were 35–9, and 10% were 40 and above.In addition, 53% of the respondents were female, while 47% of themwere male.
The education level of our sample was high; 86% of the respon-dents had a bachelor’s or master’s degree. 39% of them worked inbanking, 61% worked in telecommunications industry. In terms ofthe experience in the industry, 9% had less than 1 year of experi-ence, 31% had 1 to 3 years of experience, 24% had 3 to 5 years ofexperience, and 36% had more than 5 years of work experience intheir industries.
measures
Organizational justice. Colquitt’s (2001) justice scale was used in thisstudy. Respondents were asked to rate about their ideas for the out-comes, procedures and interpersonal relations and information ac-quisitions in their workplaces on a 5-point Likert scale. The reliabil-ity of the overall scale had a 0.91 Cronbach’s alpha value, and fol-lowing Schmitt’s (1996) suggestions, the sub-dimensions were alsofound to be satisfactory as well (procedural justice: α= 0.85; distribu-tive justice: α = 0.88; interpersonal justice: α = 0.50; informationaljustice: α= 0.91).
Work stress. Employees’ work stress was measured on a 16-itemscale developed by Judge, Boudreau, and Bretz (1994). Respondentswere asked to rate how much stress they produce while facing with
number 4 · winter 2016 277
Tutku Seçkin-Çelik and Ayse Çoban
certain conditions in a 5-point Likert scale. The Cronbach’s alphavalue for this scale was 0.82.
Coping scale. In order to measure different coping styles of indi-viduals, Sahin and Durak’s (1995) adopted Turkish scale was usedat first. However, after conducting a pilot study among 50 researchassistants at a public university, it was found that most of the itemsof the scale needed to be deleted in order to increase the reliabil-ity value. As a result of this situation, Folkman et al.’s (1986) Waysof Coping Scale was translated to Turkish, abridged, and adapted.It was factor analysed and reduced to three dimensions includingproblem-focused, emotion-focused and social support-seeking cop-ing mechanisms. In our version, there were 17 items at first but oneof the items in emotion-focused coping was deleted because it low-ered the reliability of the overall scale. All of the sub-dimensions hadsatisfactory reliability values (α= 0.81; α= 0.78; α= 0.78 respectively).
The measures used in this study were taken from highly acceptedquestionnaires in the literature. Thus, validity and reliability of thesemeasures were tested several times proving construct and contentvalidity. Besides, as mentioned before, internal validity and reliabil-ity of proposed variables were found to be satisfactory.
Results
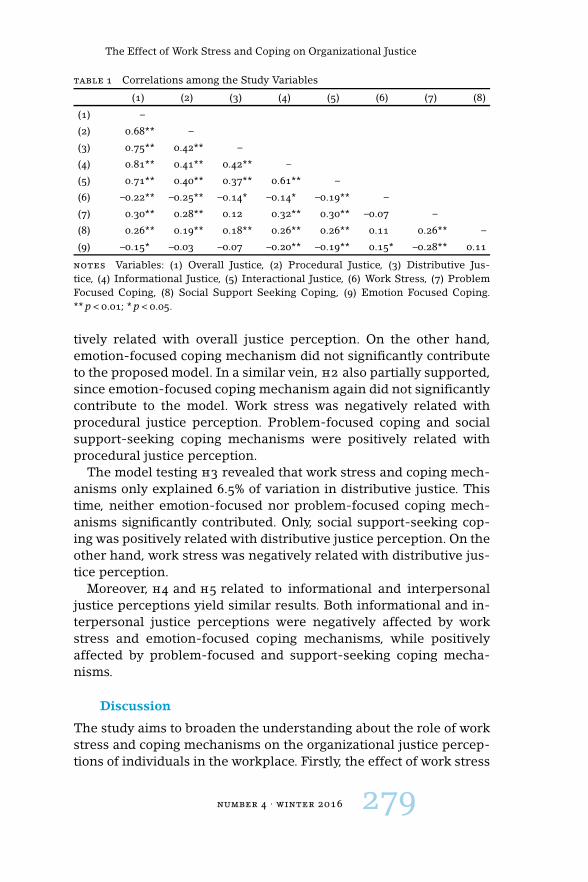
Correlations among the study variables can be seen in table 1. Con-sistent with the previous research and expectations, work stress issignificantly and negatively related with overall justice and sub-dimensions of justice. Problem-focused coping mechanism is notsignificantly related with distributive justice; and emotion-focusedcoping mechanism is not significantly related with procedural anddistributive justice dimensions. Moreover, problem-focused and so-cial support-seeking coping mechanisms are positively related withorganizational justice perceptions; while emotion-focused copingmechanism is negatively related. This preliminary analysis indicatedthat work stress and coping mechanisms are significantly relatedwith justice perceptions of the employees.
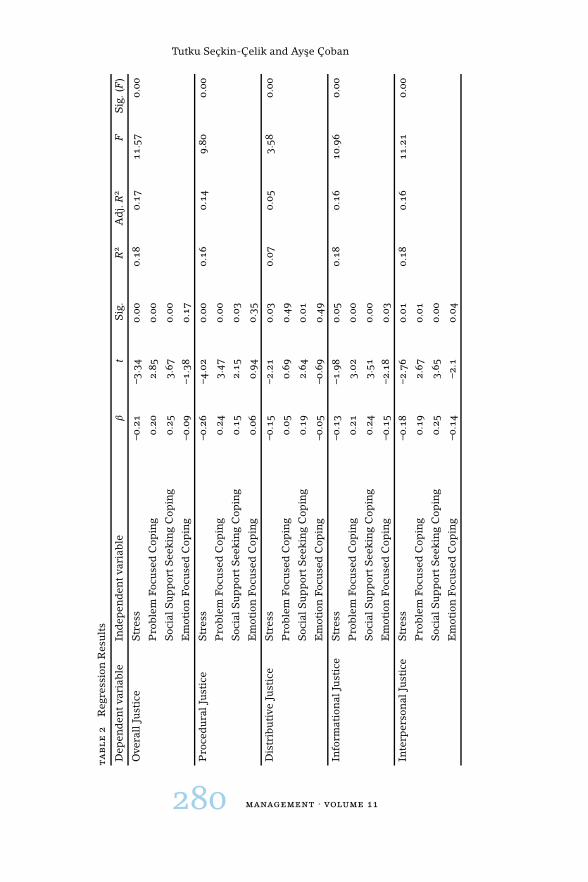
In order to test the hypotheses, Multiple Linear Regression wasemployed. Detailed results of the regression analyses can be foundin table 2. h1 was partially supported. Work stress and coping mech-anisms explained 18.3% of the variation in overall justice percep-tions, however adjusted R2 stayed in 17% showing that some of thevariables did not contribute much to the model. Work stress wasnegatively related with overall justice perception. Problem-focusedcoping and social support-seeking coping mechanisms were posi-
278 management · volume 11
The Effect of Work Stress and Coping on Organizational Justice
table 1 Correlations among the Study Variables
(1) (2) (3) (4) (5) (6) (7) (8)
(1) –
(2) 0.68** –
(3) 0.75** 0.42** –
(4) 0.81** 0.41** 0.42** –
(5) 0.71** 0.40** 0.37** 0.61** –
(6) –0.22** –0.25** –0.14* –0.14* –0.19** –
(7) 0.30** 0.28** 0.12 0.32** 0.30** –0.07 –
(8) 0.26** 0.19** 0.18** 0.26** 0.26** 0.11 0.26** –
(9) –0.15* –0.03 –0.07 –0.20** –0.19** 0.15* –0.28** 0.11
notes Variables: (1) Overall Justice, (2) Procedural Justice, (3) Distributive Jus-tice, (4) Informational Justice, (5) Interactional Justice, (6) Work Stress, (7) ProblemFocused Coping, (8) Social Support Seeking Coping, (9) Emotion Focused Coping.** p< 0.01; * p< 0.05.
tively related with overall justice perception. On the other hand,emotion-focused coping mechanism did not significantly contributeto the proposed model. In a similar vein, h2 also partially supported,since emotion-focused coping mechanism again did not significantlycontribute to the model. Work stress was negatively related withprocedural justice perception. Problem-focused coping and socialsupport-seeking coping mechanisms were positively related withprocedural justice perception.
The model testing h3 revealed that work stress and coping mech-anisms only explained 6.5% of variation in distributive justice. Thistime, neither emotion-focused nor problem-focused coping mech-anisms significantly contributed. Only, social support-seeking cop-ing was positively related with distributive justice perception. On theother hand, work stress was negatively related with distributive jus-tice perception.
Moreover, h4 and h5 related to informational and interpersonaljustice perceptions yield similar results. Both informational and in-terpersonal justice perceptions were negatively affected by workstress and emotion-focused coping mechanisms, while positivelyaffected by problem-focused and support-seeking coping mecha-nisms.
Discussion
The study aims to broaden the understanding about the role of workstress and coping mechanisms on the organizational justice percep-tions of individuals in the workplace. Firstly, the effect of work stress
number 4 · winter 2016 279
Tutku Seçkin-Çelik and Ayse Çoban
ta
ble
2R
egre
ssio
nR
esu
lts
Dep
end
ent
vari
able
Ind
epen
den
tva
riab
leβ
tS
ig.
R2
Ad
j.R
2F
Sig
.(F
)
Ove
rall
Just
ice
Str
ess
–0.2
1–3
.34
0.00
0.18
0.17
11.5
70.
00
Pro
ble
mFo
cuse
dC
opin
g0.
202.
850.
00
Soc
ialS
up
por
tS
eeki
ng
Cop
ing
0.25
3.67
0.00
Em
otio
nFo
cuse
dC
opin
g–0
.09
–1.3
80.
17
Pro
ced
ura
lJu
stic
eS
tres
s–0
.26
–4.0
20.
000.
160.
149.
800.
00
Pro
ble
mFo
cuse
dC
opin
g0.
243.
470.
00
Soc
ialS
up
por
tS
eeki
ng
Cop
ing
0.15
2.15
0.03
Em
otio
nFo
cuse
dC
opin
g0.
060.
940.
35
Dis
trib
uti
veJu
stic
eS
tres
s–0
.15
–2.2
10.
030.
070.
053.
580.
00
Pro
ble
mFo
cuse
dC
opin
g0.
050.
690.
49
Soc
ialS
up
por
tS
eeki
ng
Cop
ing
0.19
2.64
0.01
Em
otio
nFo
cuse
dC
opin
g–0
.05
–0.6
90.
49
Info
rmat
ion
alJu
stic
eS
tres
s–0
.13
–1.9
80.
050.
180.
1610
.96
0.00
Pro
ble
mFo
cuse
dC
opin
g0.
213.
020.
00
Soc
ialS
up
por
tS
eeki
ng
Cop
ing
0.24
3.51
0.00
Em
otio
nFo
cuse
dC
opin
g–0
.15
–2.1
80.
03
Inte
rper
son
alJu
stic
eS
tres
s–0
.18
–2.7
60.
010.
180.
1611
.21
0.00
Pro
ble
mFo
cuse
dC
opin
g0.
192.
670.
01
Soc
ialS
up
por
tS
eeki
ng
Cop
ing
0.25
3.65
0.00
Em
otio
nFo
cuse
dC
opin
g–0
.14
–2.1
0.04
280 management · volume 11
The Effect of Work Stress and Coping on Organizational Justice
and coping mechanisms of problem-focused, emotion-focused andsocial support-seeking on overall perceptions of justice were exam-ined. The results of the study have showed that work stress nega-tively effects overall justice perceptions of the employees. The find-ings of the current study are consistent with Zhang et al.’s (2014)study, which examined work stressors as predictors of organiza-tional justice and strain. They found that both challenge and hin-drance stressors are negatively and significantly related with orga-nizational justice perceptions. As Fujishiro and Heaney (2007) pro-posed, justice appraisals and stress appraisals can be problematicto distinguish and are highly likely to influence one another. For in-stance, ‘Once a situation has been appraised for stress, the stressappraisal itself may be appraised for justice by asking the ques-tion, “Do I deserve this much stress?”’ Therefore, work stress canalso effect the justice perception of the employees in a negative way(Fujishiro and Heaney 2007, 491). Also, problem-focused and socialsupport-seeking coping mechanisms were found to be positively re-lated with overall justice perception, while emotion-focused copingmechanism did not significantly affect justice perceptions.
Moreover, sub-dimensions of organizational justice were inves-tigated in order to examine the separate components of the workenvironment. All sub-dimensions of organizational justice were neg-atively affected by work stress. As for coping dimensions, proceduraland informational justice perceptions were found to be positively af-fected by problem-focused and social support-seeking coping mech-anisms; while emotion-focused coping mechanism was not signifi-cantly related, again. These results are partly consistent with Naka-gawa et al.’s (2014) research which postulated that problem-focusedcoping strategies have positive effects, while negative emotion-focused coping strategies have adverse effects on procedural justiceperception. Also, contrary to the current study, seeking for socialsupport as a coping strategy had no significant effect on the forma-tion of procedural and interactional justice perceptions in the samestudy (Nakagawa et al. 2014). Resulting differences for the sameconstructs might have occurred due to cultural differences betweenthe samples; even Japanese and Turkish cultures have some similarbehavioural patterns. Another study conducted on a Western samplealso provided results contradicting with this study. Lilly and Vrick’s(2013) research showed that there is no significant relationship be-tween avoidance or emotion-focused coping style and informationaland interpersonal justice perceptions, while this study found a neg-ative relationship between them.
number 4 · winter 2016 281

Tutku Seçkin-Çelik and Ayse Çoban
Since informational justice is about being informed about certainsituations in the workplace context and procedural justice is mostlyrelated with the consistency and fairness of processes (Colquitt etal. 2001), trying to find a solution for a stressful event and gettingthe needed information for this stressful event from a co-worker ormanager as a social support can be vital to consider the work en-vironment as fair. In this study, interactional justice was touchedupon along with its sub dimensions and analysed with other con-structs separately. As a consequence, the results obtained from thecurrent study suggested some different outcomes when compared toprevious studies. It is important to assess the relationship of copingstrategies and interactional justice dimensions in different organi-zational contexts, which have different levels of information flows orsupervisory styles.
Apart from these dimensions, distributive justice perception waspositively affected by social support-seeking coping mechanism,while emotion-focused and problem-focused coping mechanismswere not significantly related. Again, problem-focused and socialsupport-seeking coping mechanisms were positively related withinterpersonal justice perception; however, emotion-focused copingmechanism significantly and negatively affected this dimension. Inparallel with the underlying mechanisms of informational justiceperception, a supportive and explicative organizational context mayreinforce interpersonal interactions and relationships. According tothese results, work stress is highly effective on individuals’ justiceperceptions whatever the coping mechanism they use. Problem-focused and social support-seeking coping mechanisms were gener-ally found to positively affect the overall justice and sub-dimensionsof justice perceptions. Emotion-focused coping especially showeda different pattern in diverging sub-dimensions. Since it basicallyrefers to avoidance and ignorance of the stressful situations, it maynot be surprising that it has no significant or in some cases negativerelationships with some of the organizational justice dimensions.Avoiding from the current problems may not influence an individ-ual’s perception of organizational justice, or avoidance may make thesituation worse; but not better.
Moreover, the current study may help to provide better under-standing about the reverse relationships of work stress and organi-zational justice constructs. Studies on work stress and organizationaljustice mostly assume that justice is the antecedent of stress, whilethe reverse might as well be true. It is conceivable that arrangingvariables such as dependent and independent for strict cause-and-
282 management · volume 11

The Effect of Work Stress and Coping on Organizational Justice
effect relationships may inhibit comprehension of the overall rela-tionship network of organizational and behavioural constructs in or-ganizational behaviour literature, as similar studies have suggested(Lilly and Vrick 2013; Nakagawa et al. 2014).
The study is not without limits. In the best-case scenario, stressand coping mechanisms explain only 18% of organizational justiceperception. Thus, there are more variables than only stress and cop-ing mechanisms in explaining justice perception of employees. Workenvironment characteristics can be more elaborately examined, andadditional variables such as organizational culture/climate, ethicalconduct in the workplace, and helping behaviour in organizationalcitizenship construct might be used to better understand organiza-tional justice. Since justice is all about perceptions, emotions andaffects can be added to the model as a moderator as well, in futureresearch. Furthermore, the current research was a cross-sectionalstudy that can only project limited perceptions and behaviours ofemployees. Longitudinal studies in different samples and environ-mental contexts may be more helpful in understanding the nature ofreversed relationships among work stress, coping mechanisms andorganizational justice perceptions.
References
Adams, J. S. 1963. ‘Towards an Understanding of Inequity.’ The Journalof Abnormal and Social Psychology 67 (5): 422–36.
Akram, U., M. Hashim, M. K. Khan, A. Zia, Z. Akram, and S. Saleem.2015. ‘Impact of Organizational Justice on Job Satisfaction of Bank-ing Employees in Pakistan.’ Global Journal of Management and Busi-ness Research 15 (5): 7–15.
Alexander, S., and M. Ruderman. 1987. ‘The Role of Procedural and Dis-tributive Justice in Organizational Behaviour.’ Social Justice Research1 (2): 177–98.
Aryee, S., F. O. Walumbwa, R. Mondejar, and C. W. Chu. 2015. ‘Account-ing for the Influence of Overall Justice on Job Performance: Inte-grating Self-Determination and Social Exchange Theories.’ Journalof Management Studies 52 (2): 231–52.
Bies, R. J. 2001. ‘Interactional (In) Justice: The Sacred and the Profane.’In Advances in Organizational Justice, edited by J. Greenberg and R.Cropanzano, 89–118. Stanford, ca: Stanford University Press.
Bies, R. J., and J. F. Moag. 1986. ‘Interactional Justice: Communica-tion Criteria Fairness.’ In Research on Negotiations in Organizations,edited by R. J. Lewicki, B. H. Sheppard, and M. H. Bazerman, 43–55.Greenwich, ct: jai Press.
Blau, G. 1981. ‘An Empirical Investigation of Job Stress, Social Support,
number 4 · winter 2016 283
Tutku Seçkin-Çelik and Ayse Çoban
Service Length, and Job Strain.’ Organizational Behavior and HumanPerformance 27 (2): 279–302.
Cohen-Charash, Y., and P. E. Spector. 2001. ‘The Role of Justice in Or-ganizations: A Meta-Analysis.’ Organizational Behavior and HumanDecision Processes 86 (2): 278–321.
Colquitt, J. A. 2001. ‘On the Dimensionality of Organizational Justice: AConstruct Validation of a Measure.’ Journal of Applied Psychology 86(3): 386–400.
Colquitt, J. A., D. E. Conlon, M. J. Wesson, C. O. Porter, and K. Y. Ng. 2001.‘Justice at the Millennium: A Meta-Analytic Review of 25 Years ofOrganizational Justice Research.’ Journal of Applied Psychology 86(3): 425–45.
Colquitt, J. A., and J. B. Rodell. 2011. ‘Justice, Trust, and Trustworthi-ness: A Longitudinal Analysis Integrating Three Theoretical Per-spectives.’ Academy of Management Journal 54 (6): 1183–1206.
Connor-Smith, J. K., and C. Flachsbart. 2007. ‘Relations Between Per-sonality and Coping: A Meta-Analysis.’ Journal of Personality andSocial Psychology 93 (6): 1080–1107.
Cooper, C. L., and J. Marshall. 1976. ‘Occupational Sources of Stress: AReview of Literature Relating to Coronary Heart Disease and MentalIll Health.’ Journal of Occupational Psychology 49 (1): 11–28.
Cropanzano, R., D. E. Bowen, and S. W. Gilliland. 2007. ‘The Manage-ment of Organizational Justice.’ The Academy of Management Per-spectives 21 (4): 34–48.
Cropanzano, R., C. A. Prehar, and P. Y. Chen. 2002. ‘Using Social Ex-change Theory to Distinguish Procedural from Interactional Justice.’Group & Organization Management 27 (3): 324–51.
De Boer, E. M., A. B. Bakker, J. E. Syroit, and W. B. Schaufeli. 2002. ‘Un-fairness at Work as a Predictor of Absenteeism.’ Journal of Organi-zational Behavior 23 (2): 181–97.
De Cremer, D., D. Van Knippenberg, M. Van Dijke, and A. E. Bos. 2004.‘How Self-Relevant is Fair Treatment? Social Self-Esteem Moder-ates Interactional Justice Effects.’ Social Justice Research 17 (4): 407–19.
Elovainio, M., M. Kivimaki, and J. Vahtera. 2002. ‘Organizational Jus-tice: Evidence of a New Psychosocial Predictor of Health.’ AmericanJournal of Public Health 92 (1): 105–8.
Fogarty, G. J., M. A. Machin, M. J. Albion, L. F. Sutherland, G. I. Lalor, andS. Revitt. 1999. ‘Predicting Occupational Strain and Job Satisfaction:The Role of Stress, Coping, Personality, and Affectivity Variables.’Journal of Vocational Behavior 54 (3): 429–52.
Folkman, S., R. S. Lazarus, C. Dunkel-Schetter, A. DeLongis, and R.J. Gruen. 1986. ‘Dynamics of a Stressful Encounter: Cognitive Ap-praisal, Coping, and Encounter Outcomes.’ Journal of Personalityand Social Psychology 50 (5): 992–1003.
284 management · volume 11
The Effect of Work Stress and Coping on Organizational Justice
Fontana, D., and R. Abouserie. 1993. ‘Stress Levels, Gender and Person-ality Factors in Teachers.’ British Journal of Educational Psychology63 (2): 261–70.
Fox, S., P. E. Spector, and D. Miles. 2001. ‘Counterproductive Work Be-havior (cwb) in Response to Job Stressors and Organizational Jus-tice: Some Mediator and Moderator Tests for Autonomy and Emo-tions.’ Journal of Vocational Behavior 59 (3): 291–309.
Fujishiro, K., and C. A. Heaney. 2007. ‘Justice at Work, Job Stress, andEmployee Health.’ Health Education & Behavior 20 (10): 1–18.
Greenberg, J. 2001. ‘The Seven Loose Can(n)ons of Organizational Jus-tice.’ In Advances in Organizational Justice, edited by J. Greenbergand R. Cropanzano, 245–71. Stanford, ca: Stanford University Press.
Jawahar, I. M., and T. H. Stone. 2015. ‘Do Career Satisfaction and Sup-port Mediate the Effects of Justice on Organizational Citizenship Be-haviour and Counterproductive Work Behaviour?’ Canadian Journalof Administrative Sciences. doi:10.1002/cjas.1350
Judge, T. A., J. W. Boudreau, and R. D. Bretz. 1994. ‘Job and Life Attitudesof Male Executives.’ Journal of Applied Psychology 79 (5): 767–82.
Judge, T. A., and J. A. Colquitt. 2004. ‘Organizational Justice and Stress:The Mediating Role of Work-Family Conflict.’ Journal of AppliedPsychology 89 (3): 395–404.
Katou, A. A. 2013. ‘Justice, Trust and Employee Reactions: An EmpiricalExamination of the hrm System.’ Management Research Review 36(7): 674–99.
Khattak, J. K., M. A. Khan, A. U. Haq, M. Arif, and A. A. Minhas. 2011.‘Occupational Stress and Burnout in Pakistan’s Banking Sector.’African Journal of Business Management 5 (3): 810–17.
Latack, J. C. 1986. ‘Coping with Job Stress: Measures and Future Direc-tions for Scale Development.’ Journal of Applied Psychology 71 (3):377–85.
Lazarus, R. S., and S. Folkman. 1984. Stress, Appraisal, and Coping. NewYork: Springer.
Liden, R. C., S. J. Wayne, M. L. Kraimer, and R. T. Sparrowe. 2003. ‘TheDual Commitments of Contingent Workers: An Examination of Con-tingents’ Commitment to the Agency and the Organization.’ Journalof Organizational Behavior 24 (5): 609–25.
Lilly, J. D., and M. Vrick. 2013. ‘Coping Mechanisms as Antecedents ofJustice and Organization Citizenship Behaviors: A Multi-Focal Per-spective of the Social Exchange Relationship.’ Current Psychology 32(2): 150–67.
Litman, J. A. 2006. ‘The cope Inventory: Dimensionality and Relation-ships with Approach- and Avoidance-Motives and Positive andNegative Traits.’ Personality and Individual Differences 41 (2): 273–84.
Matthews, G., A. K. Emo, G. Funke, M. Zeidner, R. D. Roberts, P. T. Costa
number 4 · winter 2016 285

Tutku Seçkin-Çelik and Ayse Çoban
Jr., and R. Schulze. 2006. ‘Emotional Intelligence, Personality, andTask-Induced Stress.’ Journal of Experimental Psychology: Applied12 (2): 96–107.
Michailidis, M., and Y. Georgiou. 2005. ‘Employee Occupational Stressin Banking.’ Work 24 (2): 123–37.
Moorman, R. H. 1991. ‘Relationship between Organizational Justice andOrganizational Citizenship Behaviors: Do Fairness Perceptions In-fluence Employee Citizenship?’ Journal of Applied Psychology 76 (6):845–55.
Nakagawa, Y., A. Inoue, N. Kawakami, K. Tsuno, K. Tomioka, M. Nakan-ishi, K. Mafune, and H. Hiro. 2014. ‘Effect Modification by CopingStrategies on the Association of Organizational Justice with Psycho-logical Distress in Japanese Workers.’ Journal of Occupational Health56 (2): 111–23.
Peng, A. C., L. T. Riolli, J. Schaubroeck, and E. S. Spain. 2012. ‘A Moder-ated Mediation Test of Personality, Coping, and Health Among De-ployed Soldiers.’ Journal of Organizational Behavior 33 (4): 512–30.
Rupp, D. E., and R. Cropanzano. 2002. ‘The Mediating Effects of SocialExchange Relationships in Predicting Workplace Outcomes fromMultifoci Organizational Justice.’ Organizational Behavior and Hu-man Decision Processes 89 (1): 925–46.
Schmitt, N. 1996. ‘Uses and Abuses of Coefficient Alpha.’ PsychologicalAssessment 8 (4): 350–53.
Snow, D. L., S. C. Swan, C. Raghavan, C. M. Connell, and I. Klein. 2003.‘The Relationship of Work Stressors, Coping and Social Supportto Psychological Symptoms among Female Secretarial Employees.’Work & Stress 17 (3): 241–63.
Sunny-Hu, H. H., and C. W. Cheng. 2010. ‘Job Stress, Coping Strategies,and Burnout among Hotel Industry Supervisors in Taiwan.’ The In-ternational Journal of Human Resource Management 21 (8): 1337–50.
Sahin, N. H., and A. Durak. 1995. ‘Stresle Basaçıkma Tarzları Ölçegi:Üniversite Ögrencileri için Uyarlanması.’ Turkish Journal of Psychol-ogy 10 (34): 56–73.
Tepper, B. J. 2000. ‘Consequences of Abusive Supervision.’ Academy ofManagement Journal 43 (2): 178–90.
. 2001. ‘Health Consequence of Organizational Injustice: Tests ofMain and Interactive Effects.’ Organizational Behavior and HumanDecision Processes 86 (2): 197–215.
Tsaur, S. H., and Y. Y. Tang. 2012. ‘Job Stress and Well-Being of FemaleEmployees in Hospitality: The Role of Regulatory Leisure CopingStyles.’ International Journal of Hospitality Management 31 (4): 1038–44.
Wanberg, C. R., L. W. Bunce, and M. B. Gavin. 1999. ‘Perceived Fairnessof Layoffs among Individuals Who Have Been Laid off: A Longitu-dinal Study.’ Personnel Psychology 52 (1): 59–84.
286 management · volume 11
The Effect of Work Stress and Coping on Organizational Justice
Zhang, Y., J. A. LePine, B. R. Buckman, and F. Wei. 2014. ‘It’s Not Fair . . .Or Is It? The Role of Justice and Leadership in Explaining WorkStressor-Job Performance Relationships.’ Academy of ManagementJournal 57 (3): 675–97.
Zohar, D. 1995. ‘The Justice Perspective of Job Stress.’ Journal of Orga-nizational Behavior 16 (5): 487–95.
This paper is published under the terms of the Attribution-NonCommercial-NoDerivatives 4.0 International (cc by-nc-nd 4.0)License (http://creativecommons.org/licenses/by-nc-nd/4.0/).
number 4 · winter 2016 287

How Does Millennials’ Perceptionon Their Employers Affect TheirWork Ethic? A Study in Hong Kong
tsun-lok kwong
University of Management and Technology, United [email protected]
Work ethic of millennial employees has raised considerable atten-tion in Hong Kong. Current article examined how the millenni-als’ perception on their employers would have an effect on theirown work ethic. A survey study of 212 millennial respondentsshowed that the millennials in general perceived their employ-ers positively and embraced good work ethic. Two variables – per-ception and work ethic – are significantly related. The study alsorevealed that millennials in Hong Kong hold peculiar interpre-tations of work and leisure, and of work and success. It was sug-gested that parenting, educational system, and modern workingenvironments might have caused these interpretations.
Key words: millennial, work ethic, perception, psychologicalcontract, Hong Kong
Introduction
In 2013, there were twelve local market studies conducted by non-academic consultancy firms in Hong Kong to study the employees.Five of them were related to work ethic and behaviors of the mil-lennial employees. Similar researches among the local academia inHong Kong have been rather deprived in the recent decade. Thoughit is generally recognized that the millennials, making up about30 percent of the labor force in Hong Kong (Census and StatisticsDepartment 2013), are better educated, more creative and possessgreater potentials, they are also often negatively labelled and openlycriticized by market studies in the social media in the recent years forbeing tardy, utilitarian and self-centered (cpd Alliance 2013). Thesestudies, having gathered responses primarily from managers andemployers, had largely neglected the views and perspectives of themillennials, and had reported conclusions that are mostly one-sided.Studies that gather the perspectives of the millennial generation canthus provide a more balanced evaluation of the millennial workforceand enhance our understanding of the possible antecedents towardsthe values and beliefs they hold at work.
management 11 (4): 289–308 289
Tsun-Lok Kwong
This study therefore aims to gather the perspectives of the millen-nial generation to examine (1) the general work ethic of the millen-nials in Hong Kong and extend to adopt an exploratory approach tostudy (2) the relationship between their perception on their employ-ers and their work ethic.
Work Ethic
Work ethic is a terminology used generally to describe the set of be-liefs, values, and attitudes that an individual assumes during work(Meriac, Woehr, and Banister 2010). It is a reflection of an individ-ual’s dedication and commitment to work, and one’s willingness toexercise effort over and above the threshold standards required andexpected by a job (McMurray and Scott 2013). This terminology wasoriginally created by post-reformation scholars who promoted indi-vidualism among society and discredited the welfare state (Miller,Woehr, and Hudspeth 2001). The scholars believed that individu-als should be fully accountable for their well-beings in life and itis through hard work that any one individual could better his or herstandard of living.
As the ‘work ethic’ terminology develops and evolves, its interpre-tation gradually collides with Max Weber’s work about ‘ProtestantEthic’ (McMurray and Scott 2013). Making reference to the rational-ization laid down by Weber, the ability to work and gain returns wasconsidered to be an act of satisfying God’s will and fulfilling the la-bor desired by God. The ethic in work resembles a kind of callingfrom the above and that individuals should work systematically andcontinuously to maximize the benefits of their labor and thus theglory to God (Miller, Woehr, and Hudspeth 2001). Weber’s constructof Protestant Work Ethic (pwe) was theorized formally basing on re-ligious faith and duty, holding onto beliefs and personal principlesin the dimensions on centrality of work, self-reliance, hard work,leisure avoidance, morality, delay of gratification, and time utiliza-tion.
Nowadays, the modern understanding of work ethic does not con-fine to any single culture or religion (Geren 2011). Occupationalwork ethic covers a wide range of aspects and is culturally developedfrom a combination of the employees’ family, religious, and ethnicbeliefs and values (Petty and Hill 2005). According to Anca (2012),the concept of work ethic today ‘stresses the importance of skills,discipline, challenge, autonomy, quality of work produced,’ and posi-tive work ethic aims to increase employees’ productivity through theachievement of an optimal efficiency, mentality and position.
290 management · volume 11
How Does Millennials’ Perception on Their Employers Affect . . .
Perception on Employers
Among the organizational behaviorists, the debate as to whetherwork values and beliefs are affected by structure – which signifiesrecurring patterns that limit the available variations – or by agency –which considers individuals’ ability to think and act independently tocomplicate structures – is still ongoing (Heugens and Lander 2009).Agency theorists tend to believe that the way individuals make senseof the environment can influence the individuals’ beliefs and values(Ivancevich, Konopaske, and Matteson 2007). Therefore, an individ-ual’s perception – or one’s cognition in meaningful interpretations ofthe environment – may influence their beliefs and values.
According to McShane and Von Glinow (2010), employees’ per-ceptions of their employer and the working environment can greatlymanipulate their work attitudes and beliefs. Over three decades ago,James Hayes (1977), the then president of the American Manage-ment Association, had already noted that organizational conditionsand leadership play an important role in shaping the attitudes ofthe employees. The perception of the working environment they areintroduced to when the employees report for duty on the first daywould influence their willingness to extend themselves to ethical be-haviors at work. This includes the consistency of the work ethic dis-played by the leaders and the consistency of the working conditionwith what they have been told or promised for.
While literatures have frequently rested upon the social exchangeconcept whereby individuals’ voluntary actions are motivated by thereturns expected, motivational concepts like the equity theory devel-oped by John Stacy Adams (1963) also appeared to be applicable toexplain the employees’ expectation for reasonable and ethical treat-ments by the employers and the organization before they display thesimilar level of desired work ethic at work. In more recent studies,psychological contract breach has often been named as the mediat-ing factor for poor workplace ethical outcomes (Suazo 2009). As il-lustrated, the perceived organizational injustice at workplace woulddestroy the psychological contract between employees and the em-ployer, and undermine the mutual trust and reciprocal exchange re-lationship between the two parties. This would lead to employees’retaliation in the form of holding on to less desirable work ethic atwork.
Zribi and Souaï (2013) studied 340 Tunisian employees and arguedthat psychological contract break occurs from employees’ negativeevaluation of the fairness of the reciprocal expectations and obliga-
number 4 · winter 2016 291

Tsun-Lok Kwong
tions between employees and employers. The contract breaks whenincreasingly injustice organizational practices permitted by the em-ployers have increased the frequency of deviant behaviors amongthe employees. Similarly, the study of Liu and Berry (2013) arguedthat organizational injustice can promote unethical workplace be-haviors such as time theft. The relationship between perceived in-justice and time theft is mediated by the morality and the equity sen-sitivity of the employees. Employees when perceived to be treatedunfairly would be more likely to distort their moral judgments andengage in unethical behaviors. The perceived exchange relationshipbetween the employers and the employees can consequently be usedto predict the ethical positions of employees after subjecting to dif-ferent treatments by the employers. Weaker feeling of attachment,lower sense of responsibility, and more deviant behaviors were ob-served in organizations where workers perceived their treatment bythe employers and the organizations as substandard, unjust and un-reasonable.
The Millennial Generation
In many Western countries, academic research has been activelyconducted on the millennial generation and has reported that themillennials possess distinctive characteristics in their values, expec-tations, and behaviors at work (Costanza et al. 2012).
In terms of the perceptual aspects of millennials on their expec-tations of the organizations and their careers, studies agreed thatthe millenials place a significant interest in work-life balance (DeHauw and De Vos 2010), but findings revealed that these youngeremployees are willing to lower their expectations in less optimisticeconomic environment. The millennials, however, continue to expecthighly on job content, training and development, and fair rewardsin times of recession, especially in the availability of opportunitiesfor personal career development in the organizations. Violation ofthese high expectations can lead to the perception of a psycholog-ical contract breach that may result in devastating outcomes in theemployees’ commitment, performance, and retention.
In terms of work ethic and work attitude across employees ofdifferent generations, small statistical differences are observed be-tween generations when they are at the same age (Deal, Altman, andRogelberg 2010). Some of these small differences include the slightlylower work centrality and slightly higher job satisfaction among mil-lennial generation, but there is certainly no difference significantenough to be reported as a profound discovery (Kowske, Rasch, and
292 management · volume 11
How Does Millennials’ Perception on Their Employers Affect . . .
Wiley 2010). In general, the millennial employees possess weakerwork ethic, believing that work is not so much the central elementof life, placing greater value in leisure, demanding more freedomand work-life balance than previous generations (Twenge 2010). Themillennial employees are more satisfied with their organizations andtheir jobs than older generations when valued and provided with op-portunities.
As reported by Hershatter and Epstein (2010), the millennial em-ployees appear to possess the following distinctive characteristics.Firstly, millennials prefer supportive environment that assures themwith acknowledgement, reward, and career progression when theyhave made accomplishments. Secondly, millenials prefer clear struc-tures. Thirdly, millennials place strong values on work-life balanceand are likely to make career decisions which strike balances be-tween job stability and healthy personal and professional life. Fi-nally, milleninals have strong affiliation needs to the employers anddesire personal relationships with supervisors. Overall, the millen-nials are more happy than other generations to confine themselvesto existing organizational infrastructures, to work with technologies,and to collaborate and engage with people around them. However,the millennials also have strong needs to be valued, taken care of,and appreciated. The millennials can be remarkably loyal when or-ganizations can provide individualized attention, supportive culture,and equitable framework to acknowledge and reward their efforts.
Based on review on literatures related to work ethic, perception onemployers, and characteristics of millennials in the Western coun-tries, this study positioned itself to examine the general work ethicof the millennials in Hong Kong and extend to investigate the rela-tionship between their perception on their employers and their workethic from an exploratory perspective.
Method
sampling and data collection procedures
A survey strategy has been adopted for this study to collect the nec-essary data from convenience samples. In this study, the millennialgeneration has been defined as those individuals who were born inthe 1980s (also known as the ‘post-80s’ in Hong Kong) and the 1990s(the ‘post-90s’), equating to individuals who are between 15 and 34years of age inclusive in the year of 2014.
150 invitation emails were sent to students, alumni, and staff ofsecondary and tertiary education institutions who age between 15
number 4 · winter 2016 293
Tsun-Lok Kwong
and 34 inclusive and were conveniently accessible by the researcherthrough networking platforms and alumni systems of institutions.These individuals were given clear instructions to read the introduc-tion and the ethical statements attached in the email before click-ing on the hyperlink to the questionnaire. Therefore, respondentsto the questionnaire were fully aware of the voluntary basis of theirparticipation, and that information collected in the survey exercisewould be kept confidential from third parties. Upon completion oftheir questionnaire, respondents were urged to invite more friendsof theirs who age between 15 and 34 inclusive to participate in thestudy.
To prevent possibility of repeated entries by the same individual,the respondents’ ip address were recorded as they completed thequestionnaires. Responses from the same ip address were barred.Although there was still possibility that a respondent repeatedly ac-cessed and completed the questionnaire on multiple electronic de-vices, the chances of such action were low since no financial incen-tives were given to the respondents on completing the questionnaire– not to mention an additional one.
By the closure of the survey exercise, a total of 226 web-basedelectronic questionnaires were completed. Out of the 226 completedquestionnaires, 8 respondents do not possess any current or priorwork experience and 6 respondents fell outside the age range of 15–34, and therefore these 14 responses have been excluded from thesample data set. In the end, 212 responses were usable for researchdata analysis.
instruments
Questionnaires were distributed to the respondents to collect theirself-evaluated work ethic and their perceptions on their employerstogether with other demographic information. The questionnaire isdesigned with standardized questions to solicit easily quantifiableanswers. Most respondents should be able to complete the question-naires within 15 minutes.
For measurement of the respondents’ work ethic, the 19-itemProtestant Work Ethic (pwe) scale (Mirels and Garrett 1971) wasadopted in this study because the pwe scale has been used by manyother related studies in the last decade (Dunn 2013). In additional tothe 19 items from the pwe scale, three more items were re-wordedfrom the list of employees’ duties described by Crane and Matten(2007), namely duty to comply with labor contact, duty to complywith the law, and duty to respect the employer’s property, to measure
294 management · volume 11
How Does Millennials’ Perception on Their Employers Affect . . .
the sense of moral duties and work obligations held by the respon-dents. In total, there were 22 items measured on work ethic in myquestionnaire based on the Likert scale between 1 and 7. Low scoreswould mean lower work ethic possessed by respondents wherebyhigh scores would mean higher work ethic possessed by respon-dents. The internal reliability of the scale was 0.828.
For measurement of the respondents’ perception on their employ-ers, the measuring items are obtained from the list of employees’rights from Crane and Matten (2007) and re-worded to ask for re-spondents’ view on how far do they think their employers have ful-filled their employees’ rights through organizational practices in thecurrent study. The list of employees’ rights include right to freedomfrom discrimination, right to privacy, right to process, right to partic-ipation and association, right to healthy and safe working conditions,right to air pay, right to freedom of conscience and speech, and rightto work. The items are measured with the Likert scale between 1 and7. The internal reliability of the scale was 0.890.
Results
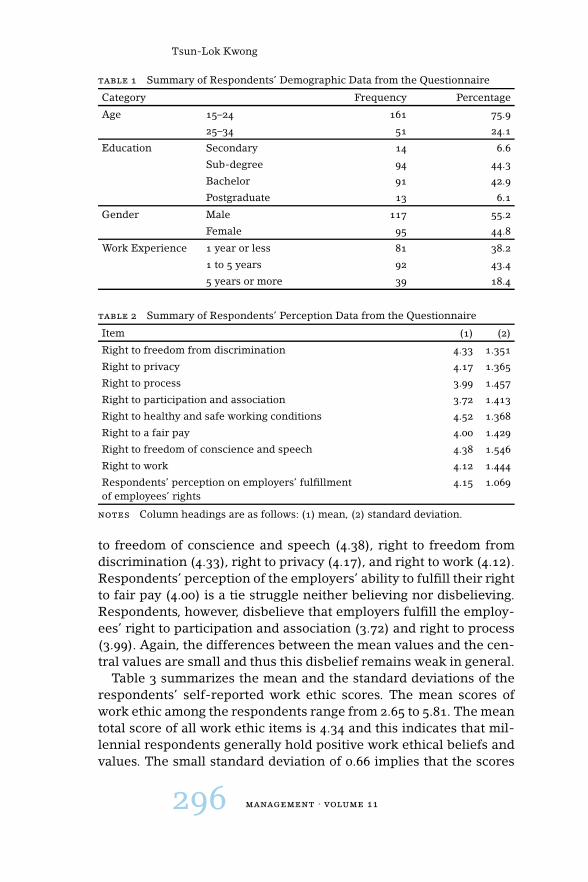
Table 1 summarizes that distribution of the demographics of the re-spondents. There was a disproportionate distribution of respondentswho were born in the 1980s and the 1990s. There were more re-spondents who were born in the 1990s in this study. This outcomewas an expected outcome and limitation of convenience sampling,and it was acceptable in this exploratory mini-scale study. The otherdemographics relating to gender, educational attainment, and workexperience have shown fair and reasonable distribution among therespondents.
Table 2 summarizes the mean and the standard deviations of therespondents’ perceptions on employers’ ethic. On a Likert scale be-tween 1 and 7, the average scores for employees’ perception on em-ployers’ ethic range from 1.00 to 6.63, and the mean of the averagescore is 4.15. This shows that the post-80 and post-90 employees arelikely to perceive their employers in the positive manner and be-lieve that their employers have fulfilled employees’ rights in theirworkplace. The close gap between the mean total score (4.15) andthe central value of the score (4.00) implies that the employees’ pos-itive belief on employers’ ethic – though inclined to be optimistic –remains weak among the millennial respondents.
Looking at the scores corresponding to the different employees’rights, respondents believe that their employers are ethically fulfill-ing their right to healthy and safe working conditions (4.52), right
number 4 · winter 2016 295
Tsun-Lok Kwong
table 1 Summary of Respondents’ Demographic Data from the Questionnaire
Category Frequency Percentage
Age 15–24 161 75.9
25–34 51 24.1
Education Secondary 14 6.6
Sub-degree 94 44.3
Bachelor 91 42.9
Postgraduate 13 6.1
Gender Male 117 55.2
Female 95 44.8
Work Experience 1 year or less 81 38.2
1 to 5 years 92 43.4
5 years or more 39 18.4
table 2 Summary of Respondents’ Perception Data from the Questionnaire
Item (1) (2)
Right to freedom from discrimination 4.33 1.351
Right to privacy 4.17 1.365
Right to process 3.99 1.457
Right to participation and association 3.72 1.413
Right to healthy and safe working conditions 4.52 1.368
Right to a fair pay 4.00 1.429
Right to freedom of conscience and speech 4.38 1.546
Right to work 4.12 1.444
Respondents’ perception on employers’ fulfillmentof employees’ rights
4.15 1.069
notes Column headings are as follows: (1) mean, (2) standard deviation.
to freedom of conscience and speech (4.38), right to freedom fromdiscrimination (4.33), right to privacy (4.17), and right to work (4.12).Respondents’ perception of the employers’ ability to fulfill their rightto fair pay (4.00) is a tie struggle neither believing nor disbelieving.Respondents, however, disbelieve that employers fulfill the employ-ees’ right to participation and association (3.72) and right to process(3.99). Again, the differences between the mean values and the cen-tral values are small and thus this disbelief remains weak in general.
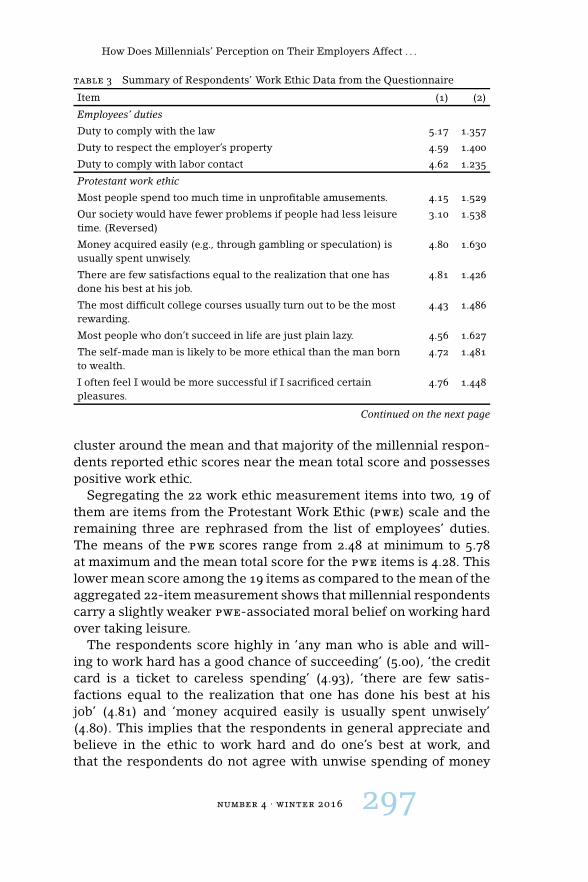
Table 3 summarizes the mean and the standard deviations of therespondents’ self-reported work ethic scores. The mean scores ofwork ethic among the respondents range from 2.65 to 5.81. The meantotal score of all work ethic items is 4.34 and this indicates that mil-lennial respondents generally hold positive work ethical beliefs andvalues. The small standard deviation of 0.66 implies that the scores
296 management · volume 11
How Does Millennials’ Perception on Their Employers Affect . . .
table 3 Summary of Respondents’ Work Ethic Data from the Questionnaire
Item (1) (2)
Employees’ duties
Duty to comply with the law 5.17 1.357
Duty to respect the employer’s property 4.59 1.400
Duty to comply with labor contact 4.62 1.235
Protestant work ethic
Most people spend too much time in unprofitable amusements. 4.15 1.529
Our society would have fewer problems if people had less leisuretime. (Reversed)
3.10 1.538
Money acquired easily (e.g., through gambling or speculation) isusually spent unwisely.
4.80 1.630
There are few satisfactions equal to the realization that one hasdone his best at his job.
4.81 1.426
The most difficult college courses usually turn out to be the mostrewarding.
4.43 1.486
Most people who don’t succeed in life are just plain lazy. 4.56 1.627
The self-made man is likely to be more ethical than the man bornto wealth.
4.72 1.481
I often feel I would be more successful if I sacrificed certainpleasures.
4.76 1.448
Continued on the next page
cluster around the mean and that majority of the millennial respon-dents reported ethic scores near the mean total score and possessespositive work ethic.
Segregating the 22 work ethic measurement items into two, 19 ofthem are items from the Protestant Work Ethic (pwe) scale and theremaining three are rephrased from the list of employees’ duties.The means of the pwe scores range from 2.48 at minimum to 5.78at maximum and the mean total score for the pwe items is 4.28. Thislower mean score among the 19 items as compared to the mean of theaggregated 22-item measurement shows that millennial respondentscarry a slightly weaker pwe-associated moral belief on working hardover taking leisure.
The respondents score highly in ‘any man who is able and will-ing to work hard has a good chance of succeeding’ (5.00), ‘the creditcard is a ticket to careless spending’ (4.93), ‘there are few satis-factions equal to the realization that one has done his best at hisjob’ (4.81) and ‘money acquired easily is usually spent unwisely’(4.80). This implies that the respondents in general appreciate andbelieve in the ethic to work hard and do one’s best at work, andthat the respondents do not agree with unwise spending of money
number 4 · winter 2016 297
Tsun-Lok Kwong
table 3 Continued from the previous page
Item (1) (2)
People should have more leisure time to spend in relaxation.(Reversed)
3.61 1.630
Any man who is able and willing to work hard has a good chance ofsucceeding.
5.00 1.473
People who fail at a job have usually not tried hard enough. 4.00 1.431
Life would have very little meaning if we never had to suffer. 4.61 1.493
Hard work offers little guarantee of success. 3.75 1.367
The credit card is a ticket to careless spending. 4.93 1.541
Life would be more meaningful if we had more leisure time.(Reversed)
3.73 1.398
The man who can approach an unpleasant task with enthusiasm isthe man who gets ahead.
4.15 1.336
If one works hard enough he is likely to make a good life forhimself.
4.43 1.431
I feel uneasy when there is little work for me to do. 4.08 1.480
A distaste for hard work usually reflects a weakness of character. 4.34 1.359
Respondents’ agreement to their own duties at work 4.79 1.008
Respondents’ Protestant work ethic score 4.28 0.659
Respondents’ aggregated work ethic score 4.34 0.662
notes Column headings are as follows: (1) mean, (2) standard deviation.
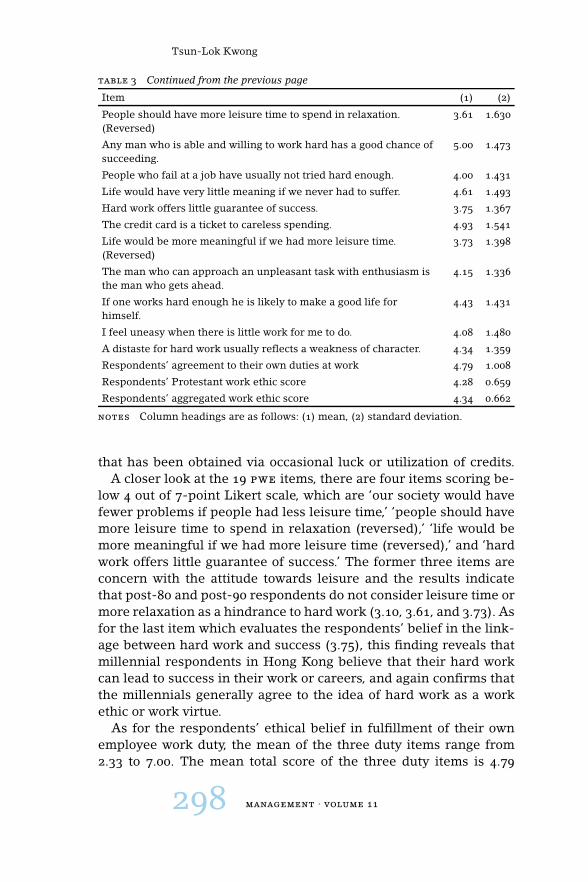
that has been obtained via occasional luck or utilization of credits.A closer look at the 19 pwe items, there are four items scoring be-
low 4 out of 7-point Likert scale, which are ‘our society would havefewer problems if people had less leisure time,’ ‘people should havemore leisure time to spend in relaxation (reversed),’ ‘life would bemore meaningful if we had more leisure time (reversed),’ and ‘hardwork offers little guarantee of success.’ The former three items areconcern with the attitude towards leisure and the results indicatethat post-80 and post-90 respondents do not consider leisure time ormore relaxation as a hindrance to hard work (3.10, 3.61, and 3.73). Asfor the last item which evaluates the respondents’ belief in the link-age between hard work and success (3.75), this finding reveals thatmillennial respondents in Hong Kong believe that their hard workcan lead to success in their work or careers, and again confirms thatthe millennials generally agree to the idea of hard work as a workethic or work virtue.
As for the respondents’ ethical belief in fulfillment of their ownemployee work duty, the mean of the three duty items range from2.33 to 7.00. The mean total score of the three duty items is 4.79
298 management · volume 11
How Does Millennials’ Perception on Their Employers Affect . . .
table 4 Cross-Tab Analysis by Perception Groups
(1) (2) (3) (4)
Positive (above 4) 5.17 4.56 4.63
Negative (below 4) 4.30 3.91 3.95
Relative difference (%) 18.60 15.38 15.78
notes Column headings are as follows: (1) respondents’ perception on employers’fulfillment of employees’ rights, (2) respondents’ agreement to their own duties atwork, (3) respondents’ Protestant work ethic score, (4) respondents’ aggregated workethic score. The neutral group with perception mean equals to 4 has been omittedin this table. Relative difference is calculated by dividing the difference of the twomeans by the average of the two means. Relative difference = (m1−m2)/((m1+m2)/2).
which is higher than the mean total score of all 22 work ethic items.This shows that millennial respondents generally accept that it istheir duties to comply with the law (5.17), comply with the labor con-tract (4.62), and respect the employers’ property (4.59) at workplace.But when comparing the mean total duty score (4.79) and the meantotal pwe score (4.28), these millennial respondents more recognizetheir rightful duties at work and less recognize with the pwe thatworking hard should be placed over taking leisure.
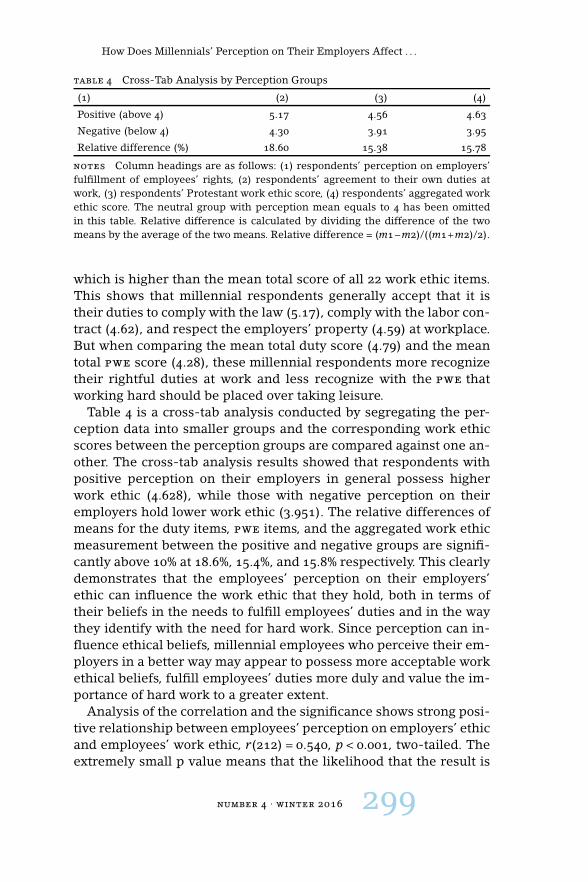
Table 4 is a cross-tab analysis conducted by segregating the per-ception data into smaller groups and the corresponding work ethicscores between the perception groups are compared against one an-other. The cross-tab analysis results showed that respondents withpositive perception on their employers in general possess higherwork ethic (4.628), while those with negative perception on theiremployers hold lower work ethic (3.951). The relative differences ofmeans for the duty items, pwe items, and the aggregated work ethicmeasurement between the positive and negative groups are signifi-cantly above 10% at 18.6%, 15.4%, and 15.8% respectively. This clearlydemonstrates that the employees’ perception on their employers’ethic can influence the work ethic that they hold, both in terms oftheir beliefs in the needs to fulfill employees’ duties and in the waythey identify with the need for hard work. Since perception can in-fluence ethical beliefs, millennial employees who perceive their em-ployers in a better way may appear to possess more acceptable workethical beliefs, fulfill employees’ duties more duly and value the im-portance of hard work to a greater extent.
Analysis of the correlation and the significance shows strong posi-tive relationship between employees’ perception on employers’ ethicand employees’ work ethic, r(212) = 0.540, p < 0.001, two-tailed. Theextremely small p value means that the likelihood that the result is
number 4 · winter 2016 299

Tsun-Lok Kwong
table 5 Correlation Analysis between Perception and Work Ethic
Pearson Correlation EmDuties pwe WorkEthic
0.535** 0.506** 0.540**
Regression B Beta Sig
0.334 0.540 0.000**
notes ** Correlation is significant at the 0.01 level (2-tailed).
due to chance is very low. In other words, the relationship betweenthese two variables is very likely to exist. Simple regression analysiswas further conducted to investigate how well employees’ percep-tion on employers predicts the employees’ work ethic. The resultswere statistically significant F(1,210)= 86.23, p< 0.001. The adjustedR squared value was 0.288 and this indicates that 28.8% of the vari-ance in employees’ work ethic was explained by employees’ percep-tion on their employers. Accordingly, the regression analysis furtherconfirms the direction of the relationship in which employees’ per-ception on their employers is statistically a significant predictor foremployees’ work ethic.
From the descriptive analysis and the results of the correlation andregression analysis, millennial respondents in the current study gen-erally carry positive perception on their employers, believing thattheir employers have fulfilled ethical obligations at work to protectemployees’ rights at workplace. Majority of the millennial respon-dents also possess positive work ethic. Furthermore, the millennialemployees’ perception on employers appears to be related to theirwork ethic.
Discussion
This study aimed to examine the general perception of the millennialemployees on their employers and the millennial employees’ workethic in the Hong Kong context, and further extend to investigate therelationship between their perception on their employers and theirwork ethic from an exploratory perspective. Indeed, the millennialrespondents in the current study do not see themselves as negativelyas described by the market studies or the social media. Results fromthe descriptive analysis in the current study agreed with the litera-ture that the millennials do have distinctive characteristics in theirvalues, expectations, and behaviors at work.
millennial employees’ perception on their employers
Millennial employees were found to have a generally positive per-ception on their employers. They consider their employers to be
300 management · volume 11
How Does Millennials’ Perception on Their Employers Affect . . .
ethical in fulfilling the employers’ obligations to safeguard the dif-ferent employees’ rights at work. These millennial employees arenot antagonistic towards their employers, most of whom are fromolder generations. They do not have many grunts and complaintsagainst their employers. Many post-80 and post-90 employees seetheir employers as ethical individuals and are able to appreciate theemployers’ effort in ensuring the provision of healthy and safe work-ing conditions, freedom of conscience and speech, freedom from dis-crimination, privacy, and fair recruitment and selection proceduresat work.
Certainly, the genuine acknowledgement by the millennial em-ployees on their employers’ effort in fulfilling employees’ rightscould be a reason for the positive perception results obtained inthe current study. Another possible reason could be due to a cul-tural disposition in an Asian society. Individuals in Asian societyusually possess higher agreeableness trait (Allik and McCrae 2004),associating with personality characteristics of being kind, sympa-thetic, considerate, warm, helpful, pleasant, trustful, cooperative,and agreeable (Saucier 1994). Socializing activities in Asian nationstherefore favor subservience, humility, and preservation of harmo-nious relationships between people (Hamid 1994). The millennialgeneration having brought up by the previous generations in theAsian society, resided in the Asian cultural environment, and culti-vated by educators of the previous generations under Asian valuesmay have been shaped to possess the agreeableness characteris-tic. Throughout the growth of the millennials, they may have beenencouraged to develop and maintain close relationships with peers,seniors and superiors at home and in school (Hershatter and Epstein2010). They are thus more willingness to show kindness, coopera-tiveness, and acceptance to their peers, seniors and supervisors atwork.
The positive perception of the millennial respondents on theiremployers may therefore be a result of the millennials being moreagreeable and willing to accept organizational practices that are nottoo bad after all. Even though some employers may not have fullysatisfied the millennial employees’ demand for a symbiotic relation-ship, these millennial employees may still hold a positive and con-genial feeling towards the employers because they are more agree-able. They prefer to perceive the organization under more optimisticand friendly lens so that they can enjoy a more harmonious workingenvironment and supportive interpersonal relationships with theiremployers.
number 4 · winter 2016 301

Tsun-Lok Kwong
millennial employees’ work ethic: work and leisure
Millennial respondents in the current study in general possess goodwork ethic, believing that it is important to work hard and fulfill theirduties as employees. This opposes to the connation among the soci-ety as described in the background of the dissertation that millennialemployees possess weak work ethic (cpd Alliance 2013).
However, when time is concerned, millennial employees tendto hold a significantly different ethical belief in which they valueleisure at a similar level to work. Millennial respondents appear tohold looser interpretation to the concept of work and leisure. Ac-cordingly, the leisure work values do not only limit to non-officehour rest time or vacation time, but also extend to work perspec-tive in seeking for allowance to work at a slower pace under lessrestricted duration and environment (Twenge 2010). The currentresearch found that millennial employees do not consider takingleisure time as obstructing or opposing to working hard. In contrastto the Protestant Work Ethics in which hard work and less leisure ispreferred, the post-80 and post-90 employees appear to view workand leisure more on par. They do not think that leisure and work aremutually exclusive and they do not believe that leisure is a hindranceto work. In fact, they are more inclined to consider both leisure andwork can co-exist and that taking reasonable leisure does not nec-essarily equate to second-placing the importance of hard work. Inother words, these millennial employees simply take a more bal-anced view on work and rest.
The millennial respondents’ mentality for more leisure and bal-anced work-life is in conjunction with the findings from other over-sea studies that the millennial generation places greater empha-sis on work-life balance and would value leisure more comparedto people from earlier generations (Deal, Altman, and Rogelberg,2010; Kowske, Rasch, and Wiley 2010). As Hershatter and Epstein(2010) argued, this mentality may be developed from social learningas the millennials observed throughout their growth when their par-ents prioritized corporate success over work-life balance and sac-rificed their time spent with the family, leaving many of the youngmillennial kids in childcare or at home most of the time with theirhousehold assistants. Having those unfavorable past experiences,the millennials believe stronger in the need for more balanced andflexible working arrangement so that they can spend more valuablemoments with their family members and friends which constituteimportant aspects of their lives.
302 management · volume 11
How Does Millennials’ Perception on Their Employers Affect . . .
Of course, managers and employers might argue that the millen-nials are less hard-working. However, literatures suggested that thedifferent work ethical beliefs on work and leisure may have been re-sulted from contextual reasons. With the immersion of digital andinformation technology in the current era, the border between pro-fessional and personal life becomes less concrete (Hershatter andEpstein 2010). The segregation between work and leisure becomesmore ill-defined because employees may be required to attend toemails or instant messages during non-office hours. Even thoughthe official working hours have not increased significantly over gen-erations, mobile and digital technologies enable employers to reachtheir employees almost anytime and anywhere (Deal, Altman, andRogelberg 2010). The situation is even worse in Hong Kong becausethe average annual working hours for employees in Hong Kong havetopped the world at 2,606 hours per year as described in the Pricesand Earnings 2015 report (Union Bank of Switzerland 2015). Thisis equivalent to employees working nearly 50 hours per week, 10hours per day assuming a 5-day work week. Employees feel ‘as ifthey are never off the clock.’ In order to achieve the balance in workand leisure, it is therefore not surprising to find millennial employ-ees adopting similar mentality and morality in their actual work be-haviors within organizations.
Referring back to the questionnaire findings, the millennial re-spondents believe that ‘people should have more leisure time tospend in relaxation’ and ‘life would be more meaningful if we hadmore leisure time.’ They do not agree that ‘our society would havefewer problems if people had less leisure time.’ Ultimately, these mil-lennials displayed the work ethic in observable behaviors possibly inthe form of taking more breaks and rests than acceptable and day-dreaming at work. Thus, it is not surprising to see managers and em-ployers, looking at the millennial generation under their own lens,complained about the millennial employees for being tardy, utilitar-ian and self-centered, and lacking discipline and sense of responsi-bility (cpd Alliance 2013).
millennial employees’ work ethic: work and success
From the current study, the millennial respondents believe that hardwork can lead to success, but are contradictorily disbelieving in theiremployers in the provision of right to process (3.99) for job promo-tion and progression. The millennial employees doubt that employ-ers have given sufficient career advancement opportunities to thosewho work hard and put in much effort at work.
number 4 · winter 2016 303
Tsun-Lok Kwong
Overseas studies have noted that the millennial generation hashigher expectations for career advancement than previous genera-tions (Deal, Altman, and Rogelberg, 2010; Kowske, Rasch, and Wi-ley 2010). Having brought up under an education system packedwith frequent assessments and quantifiable feedback (i.e. marks orgrades), the millennial employees lack self-confidence and securitywhen they do not receive similar assessment and feedback mecha-nism in the working environment. Among the Asian organizations,the feedback could be more qualitative in nature where modestand conservative comments are provided instead of the numbers,grades, or ranks desired by the millennial generation. The inabilityto clearly evaluate their own performance against the organizationalstandards and against other colleagues creates confusion and frus-tration among millennial employees who desire to know how andwhere they stand in the department or in the whole organization.
These millennials thus demand for clear instructions and feed-back to their working tasks, and more transparent structures andsystems within the organization to measure and reward performance(Hershatter and Epstein 2010). They wish to know if they are goodenough for consideration on promotions. It is likely that because ofthe conflicting between the perception on employers and their workethic among the millennials on the idea of hard work and progres-sion, the millennials are constantly looking for very well-defined ex-pectations and criteria for performance and promotions. Therefore,highly structured systems and clearly defined outlines can serve toease the millennials’ sense of insecurity in grasping success throughhard work, and enhance retention of talented millennials within theorganizations.
relationship between millennial employees’ perception
and work ethic
Results confirmed strong relationship between the millennial em-ployees’ perception of their employers and the millennial employ-ees’ own work ethic. These two variables are of similar construct– the former one is the respondents’ perception on the employers’fulfillment of responsibilities which is a form of evaluation of theemployers’ ethic, while the latter is the respondents’ self-reportedwork ethic. Their relationship may be explained by the equity the-ory (Adams 1963), which looks at the perceived fairness in a socialexchange. The work ethic of employees may be viewed as a recipro-cal return of the employers’ ethic.
As Zribi and Souaï (2013) illustrated, the sense of equity or the
304 management · volume 11

How Does Millennials’ Perception on Their Employers Affect . . .
psychological contract between employers and employees is devel-oped in a way that reciprocal relationship is pursued by the twoparties to balance the expectations and obligations of one another.When employers are expected to remunerate the employees, the em-ployees are obligated to perform. Vice versa, when employees areexpected to protect the organizational interest, the employers areobligated to protect the employees’ interest. De Hauw and De Vos(2010) also noted that millennials are in general more understandingto the employers and less focused on the contract breach when theorganizations are open and honest, for example to explain their po-sitions of limited resources and to discuss other less costly arrange-ments to satisfy the employees’ professional developmental needs.
When the employees believe that the employers are work ethical,the employees are then more willing to adopt similar level of workethic to uphold the fair relationship in the social exchange. This maybe a convincing explanation as to why the millennial employees’ per-ception of their employers’ ethic can be used to predict the millen-nial employees’ own work ethic.
Limitations and Future Research
Given the scale and the nature of this research study, there are sev-eral limitations to be recognized. Firstly, this study utilizes the chain-referral sampling technique which is a non-probability sampling ap-proach. The information collected is therefore subjected to question-able generalizability and challenges to external validity (Saunders,Lewis, and Adrian Thornhill 2009). Readers should be cautionedwhen trying to generalize the findings of this research to the largerpopulation of the millennial group in Hong Kong. Despite so, the re-searcher has put in substantial effort in ensuring that the sampleconsists of respondents who have worked in a broad range of indus-try with different educational backgrounds to increase the variationsin the sample. Secondly, the small sample size of 212 compared to thelarge sample population of over 1.4 million individuals belonging tothe millennial group in Hong Kong, the number of participants ofthe study is suboptimal, or even too small a percentage of the totalsample population. This again raises concerns on the external va-lidity of the reported findings in terms of the generalizability of theconclusion made. Thirdly, the use of questionnaire as a method ofdata collection may constitute to biasness. For any self-report study,the participants may exaggerate or under-report certain responsesin the questionnaires due to various biasness such as positive skew,central tendency, social desirability, primacy and recency, and others.
number 4 · winter 2016 305
Tsun-Lok Kwong
This may create another construct validity concern. Finally, the useof questionnaire surveyed at a particular point of time has limitedthe information collected to a specific static instance of time. Infor-mation collected may differ at a different instance but there is noway to account for those differences when only static field study isconducted.
With these limitations, future research can attempt to use a largersample with probability sampling. This can provide more accu-rate and solid verifications to the findings in the current study, andstrengthen the generalizability of the results. Additionally, qualita-tive components may be explored and integrated in future studiesto provide greater insights to the rationales of the phenomena andrelationships observed in the current study. Future studies can alsoencompass a larger duration of time to conduct longitudinal studieson the millennial generation to examine if work ethic will changeas they age. Generational studies can also be conducted in whichcomparisons are drawn from employees of different generations toinspect if any generational differences exist among the workers inHong Kong or in Asian societies.
References
Adams, J. Stacey. 1963. ‘Towards an Understanding of Inequality.’ Jour-nal of Abnormal and Normal Social Psychology 67:422–36.
Allik, J., and R. R. McCrae. 2004. ‘Toward a Geography of Personal-ity Traits: Patterns of Profiles across 36 Cultures.’ Journal of Cross-Cultural Psychology 35 (1): 13–28.
Anca, P. 2012. ‘Work Ethics in Romanian Companies (I) – Empirical Ev-idences.’ Annals of the University of Oradea, Economic Science Series21 (1): 568–74.
Census and Statistics Department. 2013. ‘Quarterly Report on GeneralHousehold Survey.’ http://www.statistics.gov.hk/pub/B10500012013QQ03B0100.pdf
Costanza, D. P., J. M. Badger, R. L. Fraser, J. B. Severt, and P. A. Gade.2012. ‘Generational Differences in Work-Related Attitudes: A Meta-Analysis.’ Journal of Business and Psychology 27:375–94.
cpd Alliance. 2013. ‘Work Attributes and Preferences of Generation Y.’Continuing Professional Development Alliance, 26 May 26. http://www.cpdalliance.org.hk/PublishWebSite/cpda2/gallery/ac2f38a8-41f3-4661-8b09-a1d0f1f7f849.pdf
Crane, A., and D. Matten. 2007. Business Ethics: Managing CorporateCitizenship and Sustainability in the Age of Globalization. 2nd ed. Ox-ford: Oxford University Press.
De Hauw, S., and A. De Vos. 2010. ‘Millennials’ Career Perspective andPsychological Contract Expectations: Does the Recession Lead to
306 management · volume 11
How Does Millennials’ Perception on Their Employers Affect . . .
Lowered Expectations?’ Journal of Business and Psychology 25 (2):293–302.
Deal, J. J., D. G. Altman, and S. G. Rogelberg. 2010. ‘Millennials at Work:What We Know and What We Need to Do (If Anything).’ Journal ofBusiness and Psychology 25 (2): 191–99.
Dunn, A. 2013. ‘Only Fools? Reconsidering the Relationship betweenCommitment to the Work Ethic and Educational Attainment.’ Jour-nal of Education and Work 26 (1): 1–20.
Geren, B. 2011. ‘The Work Ethic: Is It Universal?’ Journal of Interna-tional Business and Cultural Studies 5:1–9.
Hamid, P. N. 1994. ‘Assertiveness and Personality Dimensions in Chi-nese Students.’ Psychological Reports 75:127–30.
Hayes, J. L. 1977. ‘Leadership and the Work Ethic.’ Management Review66 (12): 2–3.
Hershatter, A., and M. Epstein. 2010. ‘Millennials and the World ofWork: An Organization and Management Perspective.’ Journal ofBusiness and Psychology 25 (2): 211–23.
Heugens, P. P. M. A. R., and M. W. Lander. 2009. ‘Structure! Agency!(And Other Quarrels): A Meta-Analysis of Institutional Theories ofOrganization.’ Academy of Management Journal 52 (1): 61–85.
Ivancevich, J. M., R. Konopaske, and M. T. Matteson. 2007. Organiza-tional Behavior and Management. New YorK: McGraw-Hill/Irwin.
Kowske, B. J., R. Rasch, and J. Wiley. 2010. ‘Millennials’ (Lack of) Atti-tude Problem: An Empirical Examination of Generational Effects onWork Attitudes.’ Journal of Business and Psychology 25 (2): 265–79.
Liu, Y., and C. M. Berry. 2013. ‘Identity, Moral, and Equity Perspec-tives on the Relationship Between Experienced Injustice and TimeTheft.’ Journal of Business Ethics 118 (1): 73–83.
McMurray, A., and D. Scott. 2013. ‘Work Values Ethic, gnp Per Capitaand Country of Birth Relationships.’ Journal of Business Ethics116:655–66.
McShane, S., and M. A. Von Glinow. 2010. Organizational Behavior. NewYork: McGraw-Hill/Irwin.
Meriac, J. P., D. J. Woehr, and C. Banister. 2010. ‘Generational Differencesin Work Ethic: An Examination of Measurement Equivalence AcrossThree Cohorts.’ Journal of Business Psychology 25: 315–24.
Miller, M. J., D. J. Woehr, and N. Hudspeth. 2001. ‘The Meaning andMeasurement of Work Ethic: Construction and Initial Validation of aMultidimensional Inventory.’ Journal of Vocational Behavior 59:1–39.
Mirels, H., and J. Garrett. 1971. ‘The Protestant Ethic as a PersonalityVariable.’ Journal of Consulting and Clinical Psychology 36 (1): 40–4.
Petty, G. C., and R. B. Hill. 2005. ‘Work Ethic Characteristics: Per-ceived Work Ethics of Supervisors and Workers.’ Journal of Indus-trial Teacher Education 42 (2): 5–20.
number 4 · winter 2016 307
Tsun-Lok Kwong
Saucier, G. 1994. ‘Mini-Makers: A Brief Version of Goldberg’s UnipolarBig-Five Markers.’ Journal of Personality Assessment 63 (3): 506–16.
Saunders, M., P. Lewis, and A. Thornhill. 2009. Research Methods forBusiness Students. 5th ed. Harlow: Pearson Education.
Suazo, M. M. 2009. ‘The Mediating Role of Psychological Contract Vio-lation on the Relations between Psychological Contract Breach andWork-Related Attitudes and Behaviors.’ Journal of Managerial Psy-chology 24 (2): 136–60.
Twenge, J. M. 2010. ‘A Review of the Empirical Evidence on Genera-tional Differences in Work Attitudes.’ Journal of Business and Psy-chology 25 (2): 201–10.
Union Bank of Switzerland. 2015. Prices and Earnings 2015. https://www.ubs.com/microsites/prices-earnings/edition-2015.html
Zribi, H., and S. Souaï. 2013. ‘Deviant Behaviors in Response to Organi-zational Injustice: Mediator Test for Psychological Contract Breach-The Case of Tunisia.’ Journal of Business Studies Quarterly 4 (4): 1–25.
This paper is published under the terms of the Attribution-NonCommercial-NoDerivatives 4.0 International (cc by-nc-nd 4.0)License (http://creativecommons.org/licenses/by-nc-nd/4.0/).
308 management · volume 11

Academia-Industry NexusManagement
sergej gricar
Faculty of Business, Management and Informatics, [email protected]
barbara rodica
Faculty of Business, Management and Informatics, [email protected]
The aim of this study is to discuss the importance of co-operationand separation between academia and industry. The academia-industry partnership is a feasible factor that affects innovationswith students’ transition to the job market. The empirical mate-rial was collected and analysed on the basis of data gathered bySlovene Human Resources Development and Scholarship Fund.The data applies to several academic-industry network projectsfounded by the aforementioned organisation. The case study ofthe survey outlines four project cases conducted by Faculty ofBusiness, Management and Informatics. The results reveal exer-cises to exchange expertise and experience, helping the industryto become more competitive whilst offering students better em-ployability and career prospects.
Key words: academia, industry, innovation, case study
Introduction
To look ahead, to be farsighted, to be creative, to win, to solve prob-lems, to be efficient - all this concepts are in close relation to thecool society in which we live (Srica 2016). Consumers are moreaware of the new possible means of acquiring goods. Nowadays,transactions can be completed almost instantly using an internet ap-plication. Consequentially, companies are aware that it is necessaryto develop relevant services that are adapted to the modern con-sumer. Firms have to be able to offer unique contents in comparisonto their competitors. Due to different implementations, they repre-sent an added and compelling value (Rudy and Johnson 2016). Withthe development of the four projects, we wanted to incorporate thecontemporary characteristics of modern society, the nexus betweenacademia and industry (Bartunek and Rynes 2014). This study fol-lows previous studies on the academic and practitioner relationshipof Bartunek and Rynes (2014). Business research often bears little
management 11 (4): 309–326 309
Sergej Gricar and Barbara Rodica
resemblance to business practice. Although this academic-industrygap is widely recognized and frequently lamented, there is little de-bate about how it can traverse (Bansal et al. 2012; McInerney 2015;Bartunek and Rynes 2014). But the topic is more than relevant atpresent times.
Moreover, an effective collaboration between academics and com-panies is essential for nexus in management (Bansal et al. 2012). Pri-marily, it can motivate a research theme relevant to trade. Secondly, itencourages implementation of fact-findings (Bartunek 2014). How-ever, conducting collaborative research is not always easy.
Modern higher education initiate spectrum of competences to thestudents. The competences students can achieve during their stud-ies. In this article we introduce four projects that students are in-volved with in order to achieve relevant job market competences(Gnanlet and Khanin 2015). The objective of the paper is to intro-duce the partners that they are involved with in academia-industrynexus (Bansal et al. 2012). We present the case study (Slaughter,Archerd, and Campbell 2004) of academia-industry partnership inSlovenia.
To the best of our knowledge, there has not been any previouspublication that focuses on this topic for Slovenia. Additionally, thereis scarce debate about this topic (Bansal et al. 2012). Moreover, wediscuss the benefits, working conditions, time dimensions (Bartunekand Rynes 2014), project methods and results of the four projectsconducted by the Faculty of Business, Management and Informatic(fbmi). The foundation partner involved is the Slovene Human Re-sources Development and Scholarships Fund (shrdsf).
This article provides an academia-industry nexus managementbased on a literature review (Mawdsley and Somaya 2016). The casestudy (Bartunek and Rynes 2014; Bhaskar 2008; Heinonen 2015) withstudents, business executives and the academicians involved (Mülleret al. 2013) hand out. Much of the research deals with the business’sperspective. Usage of the third sector and non-profit managementmethods are a relatively new field of research (Schiller and Almon-Bar 2013), but not included in recent research yet.
The paper is structured as follows: in the next section (sectiontwo), we review literature on academia-industry partnerships to de-rive similarities and differences. In section three, we describe ourmethodological approach before (in section four) we analyse anddiscuss current trends based on empirical insights. The paper con-cludes by providing implications and suggestions for future research(section five).
310 management · volume 11
Academia-Industry Nexus Management
Literature Overview
Higher education institutions are going through turbulent times (Eu-ropean Commission 2014). Hitherto have the expectations of theirpotential contributions (Selsky and Parker 2005), conceptualization(Molly, Ployhart, and Wright 2011), teaching methods and syllabus(Cabantous and Gond 2014; Myers, Hill, and Harwood 2005) been sohigh. Simultaneously, doubts concerning the quality and executionof higher education institutions have never been so critically eval-uated or universal (European Commission 2014; Lee 2014). Threedifferent approaches would be required to study academia manage-ment (Bansal et al. 2012; Bartunek and Rynes 2014; Mawdsley andSomaya 2016; Selsky and Parker 2005).
Firstly, students and academicians can achieve independently, e.g.from internationalization (Biloslavo and Panjek 2011) and mobility(Mawdsley and Somaya 2016; Flander 2011) in academia. In a recentstudy, Gricar and Neary (2016) introduced prospects of student andstaff mobility and the consequences of internationalization basedon semi-structured interviews. The results demonstrated slight nu-ances between student and staff perspectives. The new paradigmin the European Union (eu) is that students who went abroad willbe employable and suitable to become employers in Europe (Li andLowe 2016). Alternatively, students studying at higher education in-stitutions in their home country will gain lower skills and may beforced to search for jobs without the specified skills. Differences arealso evident between languages and cultural determinates whichgenerate the ability to understand the path to broader thinking(Gricar and Neary 2016).
Secondly, academicians should be inter-sectorial mobile (Choi andTang 2016). As modern science fundamentally requires team effort,inter-sectorial collaboration (Selsky and Parker 2005) should be re-warded as stated by the European Commission (2006). Internal aca-demic and career appraisal systems, as well as performance indi-cators, are essential to encourage researcher mobility, claim experts(Mawdsley and Somaya 2016). Good grades now mean better careerprospects later on. Collaboration can also be one of the criteria takeninto account when appraising institutions and academicians. Prizesand awards are another way of repaying the more upwardly-mobilescientists in cases of individual excellence (European Commission2006).
Incentives for better working and salary conditions should be pro-vided through inter-sectorial (also related to international) mobility
number 4 · winter 2016 311
Sergej Gricar and Barbara Rodica
through internal academic appraisal systems. However, inter-sectormobility should not be enforced (Selsky and Parker 2005). Criteriafor appraising inter-sectorial mobility should be linked to the ben-efit of the host institution, the researchers’ group, or the individ-ual academicians. Examples of criteria are: co-publications with thebusiness executive partner (publications are important for industryreputation), list of contacts, launching of cooperation projects, com-mercialisation, and start-up or spin-off experience even for failures(Lee 2014).
Thirdly, we shall discuss academia-industry (management) nexus(McInerney 2015). Recent literature concerning this nexus (Bansalet al. 2012; Bartunek and Rynes 2014; Mendoza 2014) starts with abrief overview of the historical developments leading to the knowl-edge economy. Subsequently, this section offers a critical review ofthe literature primarily published on academia-industry manage-ment nexus. European higher education institutions have developedinto a complex academic environment in which individuals and or-ganisations increasingly compete for material, human and symbolicresources (Mendoza 2014; Lee 2014).
Mendoza (2014) investigates industry-academia linkages with par-ticular attention on conceptualizations for future investigations.Higher education struggles to balance its public mission with marketpressures to remain competitive. Whilst competition spurs institu-tions towards efficiencies, too much drives assignment out of theirdecision making (Bartunek and Rynes 2014; Slaughter, Archerd, andCampbell 2004).
The boosters argue that academia-industry management nexusare useful to transfer academic research to society and aid academiaby having a socially relevant impact (Roessner et al. 2013; Philipset al. 2015). Boosters worry that such nexus dwindle basic academicwork, knowledge for the purpose of knowledge, as well as free in-terpretation (lay out) of findings (Slaughter, Archerd, and Campbell2004). In our recent study we have adopted intermediate positionsaround notations of complementarity and differentiated boundariessupported in the literature by Szelenyi and Bresonis (2014). Thereare surveys to explain how knowledge from the investigation flowsamong and between project managers and project managementoffice members (academicians), using a mixed-method approach(Müller et al. 2013).
The academia-industry nexus is one of the most captivating, pro-ductive, and important networks in business discovery and devel-opment, albeit not always harmonious (Molly, Ployhart, and Wright
312 management · volume 11
Academia-Industry Nexus Management
2011). The latter is an example from the natural sciences (Sanchez-Serrano 2011). The impact of academic findings has governed everyaspect of business development, from the initial identification oftargets to the understanding of economic and knowledge pathwaysof students, academicians and business executives. Consequen-tially it may be surprising that despite the great productivity of theacademia-industry relationship, interaction between academia andindustry in recent years has been under attack (Sanchez-Serrano2011; Bansal et al. 2012). The authors explore these important issuesas part of this paper and launch a case study to improve this andfollowing nexus. Since the middle- to late-1800s, business has hadan extremely close nexus with academia (Sanchez-Serrano 2011).
Without the chemical, physiological, and biological academic dis-coveries that have taken place in Europe throughout the 18th and19th century, the pharmaceutical industry would never have comeinto existence. In times of service, there is need for co-productiveacademia-industry nexus in the service economy for innovations andfor higher gross domestic product (gdp). The latter appertain evencolossally for developed and East European countries (Mihók et al.2015).
Slovenia should take a path of Western counties (Mihók et al.2015) whilst launching the benefits for innovations and higher gdp
(Juselius 2009). Since the industry’s early years, when universities inFrance, Britain, and particularly Germany (followed by universitiesin the United States) provided the industry with a massive prosperityof expertise and innovation that were translated by an industry intoproducts and more recently into services. The impact of academicdiscoveries has enormous influence on new products and services(Sanchez-Serrano 2011).
Scientific collaborations between academia and industry have along history in the United States and in other countries, reportedHaller (2014). The ethical pitfalls of scientists and their patents deal-ing directly with industry stimulated much public discussion as stud-ied by Haller (2014). This evolution is discussed, and recent devel-opments with models of possible productive collaboration and rulesare engaged.
Other authors also analyse aspects of nexuses with academia.Kamitani et al. (2013) analyses government-industry-academia col-laborations in Japan from the view point of compatibility and mo-tivating factors to collaborate among partners. The strategic moti-vation is not directly related to government-industry-academia col-laboration outcomes, but rather the leadership of government that
number 4 · winter 2016 313
Sergej Gricar and Barbara Rodica
is essential towards the results. Saguy’s (2013) percept to academia-industry nexus is innovation. A review of the literature (Misterekand Lewicka 2014; Saguy 2013) demonstrates that innovation maybe defined in various ways. This is including its narrow technologi-cal aspect and wider capture considering organizational and processchanges in companies. Innovation is the application of a new: idea,invention, technology, model, or process to a product or service thatsatisfies a specific consumer need and can be replicated at an eco-nomical cost (Heinonen 2015). Innovation creates value and plays avital role in growth and social well-being (Saguy 2013). Innovationcontributes to economic growth (Karasek and Dermol 2015).
The motivation of our research comes through the four projectsmade in academia-industry nexus management over the past twoyears, e.g. 2014 and 2015 (see http://pkp2.altervista.org). Projectswere formed at the fbmi. The organization was a project carrier. Thepurpose of the paper is to induct increasing academia-industry col-laboration into economy and management (McInerney 2015). Thefirst objective of the paper is to present an overview of the literature.The second is to provide a case study of recent academia-industrynexus.
Methodology and Data Collection
Mounting economic coerce, environmental provocations, diminish-ing resources, the exponentially accelerating pace of science andknowledge development, and the proliferation of open innovationcall for a resume estimation of academia-industry relationships.Fundamental research as the sole power of academia is not ex-tensively sustainable. Time is precious, it is our responsibility toprovide leadership, conviction, to encourage and embark upon thisjourney to stimulate efforts and institutionalize innovation (Haller2014; Saguy 2013).
An explanatory case study was conducted to understand the com-prehension flows between academia members (students, academi-cians) and business executives. The underlying philosophical stand-point is critical realism (Lawson et al. 1998, Bhaskar 2008) wherebyan underlying objective reality is assumed through the mechanics ofproject structures, giving rise to events of management These in turnencourage to the subjective reality of experiences, such as knowl-edge exchange within the project management community (Mülleret al. 2013).
An embedded case study approach design with a multiple unitof analysis was used for this study (Yin 2009). A sequential mixed
314 management · volume 11
Academia-Industry Nexus Management
method approach (Teddlie and Tashakkori 2010) primarily allowedfor a qualitative study to understand the organization of projectsand its structures, processes, roles, and responsibilities, especiallyin terms of the project management community; Secondly, for sub-sequent developments of findings across an entire study. A socialnetwork is hereby defined as a specific set of links amongst set per-sons, with the additional property that the characteristics of theselinkages as a whole may be used to interpret the social behaviour ofthe persons involved (Müller et al. 2013).
Data collection was conducted through a created case study data-base. The roles of written databases are case study notes, documents,tabular materials and narratives. All the documents are made avail-able upon request. All documents are saved in the cloud.
Academicians of the following higher education institution wereinvolved: fbmi. Students of the following higher education institu-tions were involved: fbmi, Novo Mesto, Faculty of Health Sciences ofNovo Mesto, Faculty of Information studies in Novo Mesto, Facultyof Economics in Ljubljana and Podgorica, Faculty of Business andManagement Sciences of Novo Mesto, and Faculty of Chemistry andChemical Technology in Ljubljana. Associated business executiveswere: Repa system solutions - retail sale per mail, Gašper Repanšek,Vigros - wholesale and retail, Idearna - advertising agency, and Stor,Dorian Savic, involved in the sale. The funder of the projects wasshrdsf.
Empirical Insights
Academics seek data for publication and funding to support theirresearch (Frieske et al. 2015). Given the nature of the phenomenon,our empirical research mainly relies upon a qualitative exploratoryresearch approach based on project work and document analysis.
The Europe 2020 strategy is focused on the eu capacity to createmillions of new jobs to replace those lost in the past economic down-turn. European Commission provides future standards of living. Thequality of live will depend on the innovation ability of products, ser-vices, business and social process (Saguy 2013).
case study
The businesses for this case study are small and medium sized enter-prises (sme) of development and manufacturing services with head-quarters in Slovenia. Recently, Repa.si, Stor, Vigros and Idearna un-dertook a position by adding a project to the creative path towardspractical knowledge (pkp) (Gricar, Rodica, and Bojnec 2016) to their
number 4 · winter 2016 315

Sergej Gricar and Barbara Rodica
table 1 Number of Project Collaborated Academia-Industry in 2014/2015 Overallin Slovenia
Number of projects 2014 2015
Slovenia fbmi Slovenia fbmi
Applied to the tender 312 2 598 5
Grant received 211 1 246 4
notes Adapted from Javni sklad Republike Slovenije za razvoj kadrov in štipendije(2016).
business process. They have had been elaborateness by business ex-ecutives. The academia institution for this case study is fbmi.
This shift towards objectification of academia-industry nexus wasidentified in the case study also as project management. pkp projectmanagement is a well-established and recognized discipline withinfbmi, Repa.si, Stor, Vigros and Idearna. The majority of managersare highly experienced, complete with professional project manage-ment certification which is granted internally. pkp project manage-ment is well structured and formalized within this institution.
An assignment of pkp project managers to projects is contingentupon the project type, scope and importance of the projects. pkp
project managers are appointed from the ranks of academicians,academic managers and business owners, unit managers or tech-nical experts. pkp project managers are consulted from the studentbody when it comes to performance evaluations of the pkp project.
The majority of projects are shorter than one year and are of theoperational service type, such as internet sites, sandwich manage-ment, cost calculator and new regulations. There are eight individ-uals within the institutions, each located in different units. Collec-tively they form a (virtual) corporate, led by a pkp manager who re-ports to the president of the project applicant and to the fundingorganisation. Elaborateness were functional in 2014 and 2015, ac-companied by almost 35 students in four different pkp projects.
The academician pkp mission was to facilitate, organize, and man-age the pkp project as a way of doing work. This virtual corporatepkp consists of four sub-units. Each sub-unit consists of pkp projectmanagers (academicians, business executives) and students. Eachsub-unit has a student leader (imitator). The first group is namedDevelopment of a Mobile Application for Ordering a Service and aRecipe/Standard for a Sandwich with a Mobile Application (Sand-wich). The second nomenclature is the calculation of transportationcosts for sme (TransCost). The third nomenclature is an e-guide forallergens under the new regulation (e_pa). The fourth nomenclature
316 management · volume 11
Academia-Industry Nexus Management
is an application for recognizing the essence of herbs (h4u). Theaforementioned nomenclatures were also the titles of the projectsfunded by shrdsf. In table 1 we present the projects. Firstly, theones applied to the open tender. Secondly, the true projects that havebeen in progress in Slovenia and at the fbmi. We can see that at thesecond tender in 2015 we were the prizewinner by 80%, whereras theoverall Slovenian success was 41%.
definition of practices
The definition of practices includes the development of methods,processes and techniques. We have used three methodological ap-proaches in the pkp project assignment. We have studied scientificand expert literature that covers the theoretical knowledge regardingthe nature of the pkp project. Based on this study of the literature,we have defined the activities of the project. The project assignmenthas been performed with different methods distinctive of interdis-ciplinary and multidisciplinary projects (Molly, Ployhart and Wright2011).
This is executed according to the testing and weighing of ideas, thepresentation of results, their meaning and implications in the pkp
projects regarding the studied service and its problems. Althoughthe stress focuses on the methodological steps, the core of the projectassignment is the applicative transfer of knowledge amongst theeconomy, the students and the higher education institution withinthe set activities of the pkp projects.
The set activities were carried out with several methods thatare typical of scientific research and professional work. In the pkp
projects fields, we used methods of: mechanical and thermal treat-ment of foods, methods of food safety, planting, herbs recognisingand production of primary foods. When defining the computer pro-gramming and programming language that we used: the workingmethods in the computer room, modelling, computer-aided plan-ning and the basic and advanced methods for working with files.The project also includes the scientific methods of sensory analy-sis, the survey method, the comparison method and the method ofdescribing and summarising. For the quantitative definition of thepkp project assignments, we have also incorporated the methods ofdescriptive statistics.
authorizing and validating of projects
The findings of an academia-industry collaboration in Finland (Po-hjola, Puusa and Iskanius 2015) indicate that although the experi-
number 4 · winter 2016 317

Sergej Gricar and Barbara Rodica
ences of working in collaboration were mainly positive, the forumwas not designed to be company oriented. Instead, the higher ed-ucation institutions and the research organisations were the mostbeneficial. While higher education institutions engage in discussionsat an abstract level, companies value more concrete tasks and mea-surable results. We also noticed that companies, unlike higher ed-ucation institution, do not have the mechanisms to take advantageof the knowledge and utilise it to enhance their dynamic capability(Bartunek and Rynes 2014; Pohjola, Puusa and Iskanius 2015).
The pkp classifies projects as first class. This categorization is acomposite of several measures of project scope, complexity and theimportance of academia-industry nexus (Gricar, Rodica, and Bojnec2016). Such examples include the academicians actively directingthe students towards achieving the set objectives of each project.
Secondly, the academicians direct students towards the purpose ofeach project. Thirdly, the business executives actively participate inthe implementation process of the project. Fourthly, the business ex-ecutives introduce the students with the virtual work and sale – ad-vantages, disadvantages, opportunities and competences. Fifth, thebusiness executives actively introduce the students with the work-ing process and guide them towards the parts of each project thatare connected to the research in the project. Sixth, the students de-velop the project and form it together with the managers. Seventh,the students keep a progress timeline/report on the project and ofthe status of the project in the time when the project implementa-tion is in progress. Eighth, the students acquaint themselves withvirtual organisation and availability in the market. Ninth, the stu-dents prepare the final report alongside the academicians. This re-port contains information regarding who, when and how they havecontributed to the realisation of each project. Tenth, the business ex-ecutives and pkp manager prepare the final report on the performedproject and give an opinion about the status of the project for furtherwork. Eleventh, in the final phase of each project the working men-tor evaluates whether the process is capable of competing on themarket. The working mentor also specifies the intellectual propertyamongst the students and the company.
brief overview of the academia-industry nexus
management in slovenia
The mission of higher education institutions includes teaching, re-search and community service. This mission would inform gradu-ates with up to date knowledge, carry out applied and basic re-
318 management · volume 11

Academia-Industry Nexus Management
table 2 Brief Overview of a Case Study of Academia-Industry Nexus Management
pkp projects Duration Companies No. of students
Sandwich 6 months (2014) Repa.si 5
TransCost 6 months (2015) Vigros, Idearna 7
e_pa 6 months (2015) Repa.si, Stor 10
h4u 6 months (2015) Vigros, Idearna 10
notes pkp – path towards practical knowledge.
search for worldwide assist and finally serve the local/global com-munity (Hanieh et al. 2015). Hanieh, et al. (2015) have shown aweak academia-industry cooperation in Palestine. They concludethat European experience of industry-academia partnership can bethe base for developing similar programs and activities for Palestineand other developing countries. The brief overview of the Slove-nian case study is tailored in table 2. In order to close the gap be-tween academia and industry it is suggested to implement a syl-labus improvement by including sustainability concepts and improv-ing teaching methods (Gricar and Neary 2016).
Signing academia – industry nexus agreements is considered asthe first step in building industry – academia partnership, but it isnot sufficient as far. These nexus agreements have to emphasizethe social equity, economic prosperity, environmental protection andglobal control, whilst solving the industrial technical and logistic ob-stacles. Cooperation may include carrying out scientific research ac-tivities and applying the results of these academicians to solve realproblems within industry. The current partnership situation at thefbmi in Slovenia is presented as a case study in table 2.
The project Sandwich presented a unique chance to develop oneof the business ideas in the field of natural science. The preliminaryplanning of the project was formulated by students and was basedon searching for ideas and brainstorming development possibilitiesand the later upgrade of the product. Whilst developing the idea, wewere connected and working alongside the Slovene company repa.The web page of the project is http://pkpsandwich.weebly.com/.
The purpose of the User’s Guide manual of the project ‘TransCost’is to explain the usage of application and steps that have to be un-dertaken for the successful calculation of transportation costs. Thesteps in the guide are explained in order as they correlate with theapplication. These stages are numbered from 1 up to the last step ina single tab. You will be able to see and use two specific cells thatrequire a numeric or verbal input. Regardless of the type of input,
number 4 · winter 2016 319
Sergej Gricar and Barbara Rodica
each cell will directly perform an act within the application or in-directly within the chosen tab. Certain cells in excel are locked andare not meant to be used or modified by the user. Because the busi-ness needs the application for transport cost calculation we workedwith Slovenian companies Vigros and Idearna. The web page of theproject is http://transcost.altervista.org/.
The project ‘e_pa’ presented a unique chance to develop one ofthe company’s business needs in the field of natural sciences. Theresult of the academia-industry cooperation is a modern step to theallergens. The information given to the customers should be clearlystated in the restaurants, shops, and everywhere the customer couldpurchase non-packed food. The print of the allergens from the Excelsheets is user friendly and easy to manage by employees. Whilst de-veloping the need, we were connected and working with the Slovenecompany Repa.si. The project is unique in its development of inter-disciplinary and multidisciplinary in the fields of numerous exper-tise. This nexus included gaining various types of knowledge in fieldssuch as: food technology, cooking, computer programming, internetuse, econometrics, market research and computer networking. Webpage of the project is http://alergeni.altervista.org/.
The sole purpose of the h4u web page is to provide useful in-formation for daily use to each person. We presented in one placemost of the illness symptoms and its natural solutions. The essenceof herbs are studied for the relevant information’s posted on theweb page. Students have been working with the industry to pre-pare a user friendly web page. Nexus of academia-industry has beenevaluated as part of this project. The web page of the project ishttp://zelisca.info/.
We identified communication channels for reporting and commu-nicating about the tasks related to the project (European Commision2012). We assessed the progress made on the tasks we were assignedon a weekly basis. Moreover, we agreed to publish our work on theCloud storage based solution, Google Drive. The latter is convenientas it enables the modification of documents that are used regularly.Everybody involved had full access to a Google Drive pkp group andits files. Managers were monitoring the students’ progress on theproject with internal Google Drive files. An additional advantage ofhaving managers was the broad knowledge of inter/multidisciplineareas that they offer. During the project, we paid specific attentionto how we could communicate more with the public, as well as withpotential stakeholders also emphasized by the European Commis-sion (2012).
320 management · volume 11
Academia-Industry Nexus Management
The Statements and Discussion
There are several implications to the society from the pkp projects.This is most essential with regards to fashionable forces affectingdialogue process associated with academic-industry nexus. As wehave indicated, these nexuses are not separate from managementforces. The shdrsf is one important example which makes shdrsf
recent movement away from Slovene Research Agency. The latterbased almost entirely on scholarly impact to research excellence. Onthe other hand shdrsf make formation that explicitly includes theimpact of the research on practice as a way of assessing scholarlyoutputs. The Slovene government is playing a role in the ongoingacademic-industry nexus.
In other words, this is a time when the proposed new system suf-fers from a set of internal contradictions regarding dimensions ofacademic-industry nexus are particularly important. Thus, it pro-vides an exceptionally good opportunity for academicians to reflecton the rigidity we are undergoing in this domain of economics andmanagement and consider what we need to do to keep going the ap-propriate degree of undergoing as opposed to trying to resolve thegap in academia-industry nexus gap. The statements of some peopleinvolved in the present academia-industry nexus management, cansummarize the case study findings.
‘The man who moved a mountain was the one who began by carry-ing away small stones.’ This old Chinese proverb from philosopher,Confucius, served as a guidance throughout the business idea and issimultaneously my life motto. If we wish to see something magnifi-cent and stable, our start must first be made of small steps. The latterrelates to either the final goal of achieving business, or personal am-bitions, wrote by a student.
The project pkp is an awesome idea! All work following the formaleducation is practical and students need more prior knowledge ofpractical work. Above all, the project team required team work, co-ordination, the sharing of ideas and the gaining of new experiences.As a sole trader, I find these kind of projects invaluable because theyinspire new perspectives on life and business that the academia cangain, as well as new trends that exists amongst youth. I am satisfiedwith the execution of the project which has exceeded my expecta-tions. In addition, ‘I am pleased with how much the students wereinvolved in the project and their enthusiasm,’ wrote the owner of thecompany.
I observed the progress of the project with great enthusiasm, in
number 4 · winter 2016 321
Sergej Gricar and Barbara Rodica
particular how the team had approached potential problems: withinitiative, innovation, dedication and hard work from academic andbusiness executors. The project consisted of practical experiences,specific competences, knowledge and skills that are essential in to-day’s competitive market place. Evidence of this latter statement canbe seen courtesy of the two members of our team who found employ-ment directly after this project. There will soon be a third, pend-ing another member’s completion of formal education. Connectingformal education with the economy through this kind of project iswarmly welcomed and I hope that this is only the start of somethinggreater to come wrote a person of the project applicant.
Since the beginning of participation in the pkp projects, I haveenthusiastically introduced and involved my staff and the head-quarters. The new ‘TransCost’ application of cost calculator and h4u
essence web page of herbs has been recognized as a tool of com-pany work. Therefore, the business decided at the beginning of thepkp project to actively participate. Consequently, through the activeparticipation in the pkp project, ‘TransCost,’ we have again delvedinto the cost of transport. Previously, it was ‘over the thumb.’ Forour conclusion, we manage to correlate new business partnershipssaid second of the business executors involved. The state is suitablefor cross-sector partnerships as an effective mechanism for privateenvironmental governance, mentioned and measured empirically byHahn and Pinkse (2014).
The first Slovenian study on academia-industry nexus topic. Onebenefit of our approach may be in opening up the debate about theacademia-industry nexus management beyond groups of academicsto include industry more entirely.
Conclusion
The foregoing study sheds light on facing industry and academianexus management in Slovenia. The contents are summarized bythe gap existing between the two mentioned sectors in economy andmanagers. A brief study for the situation of higher education institu-tions and related obstacles has been discussed, showing some dataand an overview of the teaching/learning techniques. The status ofindustry has also been discussed, showing data and the activity thatneed to be undertaken. Some references and experiences from othercountries have been illustrated here for comparison purposes.
The future perspectives of academia-industry nexus management,the analysed case study has been introduced. In this co-fundedmodel, the awareness and market needs feedback is used to create
322 management · volume 11
Academia-Industry Nexus Management
modern techniques capable of nexuses the two sectors to each other.Three sides have been included in the nexus – business executorsand academicians. The latter consists of students and teachers orresearchers.
Finally, this academia-industry nexus management can have theopportunity to see day light if it is applied on two tracks. The firstis based on syllabus development, whilst the second track is basedon making modern structural economic policy and innovative qualitymanagement strategy.
References
Bansal, P., S. Bertels, T. Ewart, P. MacConnachie, and J. O’Brien. 2012.‘Bridging the Research-Practice Gap.’ Academy of Management Per-spectives 26 (1): 73–92.
Bartunek, J. M. 2014. ‘Academic-Practitioner Relationship: What ntl
Started and What Scholarship Keeps Developing.’ Journal of AppliedBehavioral Science 50 (4): 401–22.
Bartunek, J. M., and S. L. Rynes. 2014. ‘Academics and Practitioners areAlike and Unlike: The Paradoxes of Academic-Practitioner Rela-tionship.’ Journal of Management 40 (5): 1181–201.
Bhaskar, Roy. 2008. A Realist Theory of Science. London: Routledge.
Biloslavo, R., and A. Panjek. 2011. ‘Strategy of Internationalisation:Knowledge and Practices of the University of Primorska.’ In Paths toInternationalisation: Higher Education Policies, Trends and Strategiesin Europe and Slovenia, edited by K. Miklavcic, 162–80. Ljubljana:cmepius.
Cabantous, L., and J.-P. Gond. 2014. ‘The Resistible Rise of BayesianThinking in Management: Historical Lessons from Decision Analy-sis.’ Journal of Management 41 (2): 441–70.
Choi, P. L., and S. Y. Fan Tang. 2016. ‘Cross-Border Higher Educationfor Identity Investment: Cases of Malaysian and Indonesian EthnicChinese Students in Hong Kong.’ In Internationalization of HigherEducation, edited by Y. Cheong Cheng, A. Chi Cheung and S. WingNg, 151–70. Singapore: Springer.
European Commission. 2006. Mobility of Researchers between Academiaand Industry: 12 Practical Recommendations. Brussels: EuropeanCommission.
. 2012. Communicating eu Research and Innovation: A Guide forProject Participants. Luxembourg: Publications Office of the Euro-pean Union.
. 2014. The Erasmus Impact Study: Effects of Mobility on the Skillsand Employability of Students and the Internationalisation of HigherEducation Institutions. Luxembourg: Publications Office of the Eu-ropean Union.
number 4 · winter 2016 323
Sergej Gricar and Barbara Rodica
Flander, A. 2011. ‘Is a Mobile Student Also a More Employable Stu-dent? Research on Employers Perceptions of Academic Mobility.’ InPaths to Internationalisation: Higher Education Policies, Trends andStrategies in Europe and Slovenia, edited by K. Miklavcic, 86–120.Ljubljana: cmepius.
Frieske, S., B. Widenmayer, O. Gassmann, and T. Schildhauer. 2015.‘Opening Science: Towards an Agenda of Open Science in Academiaand Industry.’ The Journal of Technology Transfer 40 (4): 581–601.
Gnanlet, A., and D. Khanin. 2015. ‘Helping Learners Recognize, Di-agnose, and Unravel Incompetence Traps to Achieve SynergisticExploration-Exploitation in Classroom.’ Journal of Management Ed-ucation 39 (6): 684–712.
Gricar, S., and G. Neary. 2016. ‘Consequences of Mobility: The New eu
Paradigm.’ Journal of Economic and Business Sciences 3 (1–2): 18–32.Gricar, S., B. Rodica, and Š. Bojnec. 2016. Sandwich Management. Koper:
University of Prirmorska Press.Hahn, T., and J. Pinkse. 2014. ‘Private Environmental Governance
through Cross-Sector Partnerships Tensions between Competitionand Effectiveness.’ Organization Environment 27 (2): 140–60.
Haller, J. A. 2014. ‘Strengthened Ties between Industry and Academiaare Historical, Productive, and Crucial.’ Survey of Ophthalmology 59(3): 348–53.
Hanieh, A. A., S. Abdelall, P. Krajnik, and A. Hasan. 2015. ‘Industry-Academia Partnership for Sustainable Development in Palestine.’Paper presented at the 12th Global Conference on Sustainable Man-ufacturing, Johor Bahru, 22–24 September.
Heinonen, T. 2015 ‘Management of Innovation in Academia: A CaseStudy in Tampere.’ Journal of Technology Management & Innovation10 (2): 198–210.
Juselius, K. 2009. The Cointegrated var Model: Practice and EmpiricalOverview. Oxford: Oxford University Press.
Kamitani, K., S. Ishida, T. Natori, and T. Nishimura. 2013. ‘Interorgan-isational Relationship among Government, Industry and Academiain the Japanese Public Water Services: Compatibility and Motivationin Interorganisational Settings.’ International Journal of Business andSystems Research 7 (4): 339–56.
Karasek, A., and V. Dermol. 2015. ‘The Creative Class in Poland and ItsImpact on Innovations in Polish Regions.’ Management 10 (4): 299–314.
Lawson, T., A. Collier, R. Bhaskar, M. Archer, and A. Norrie. 1998. Criti-cal Realism: Essential Readings. New York: Routledge.
Lee, W.-I. 2014. ‘Technology Management Strategy for Activating theIndustry-Academia Cooperation.’ Journal of the Korea Academia-Industrial Cooperation Society 15 (1): 211–19.
Li, Z., and J. Lowe. 2016. ‘Mobile Student to Mobile Worker: The Role of
324 management · volume 11
Academia-Industry Nexus Management
Universities in the “War for Talent.”’ British Journal of Sociology ofEducation 37 (1): 11–29.
Mawdsley, J. K., and D. Somaya. 2016. ‘Employee Mobility and Organi-zational Outcomes: An Integrative Conceptual Framework and Re-search Agenda.’ Journal of Management 42 (1): 85–113.
McInerney, P.-B. 2015. ‘Walking a Fine Line: How Organizations Re-spond to the Institutional Pluralism of Intersectoral Collaboration.’Social Currents 2 (3): 280–301.
Mendoza, P. 2014. ‘Industry-Academia Linkages: Lessons from Empiri-cal Studies and Recommendations for Future Inquiry.’ In Higher Ed-ucation: Handbook of Theory and Research, edited by M. B. Paulsen,469–523. New York: Springer.
Mihók, B., E. Kovács, B. Balázs, G. Pataki, A. Ambrus, D. Bartha, Z.Czirák, et al. 2015. ‘Bridging the Research-Practice Gap: Conserva-tion Research Priorities in a Central and Eastern European Country.’Journal for Nature Conservation 28 (11): 133–48.
Misterek, W., and B. Lewicka. 2014. ‘Perception of Innovativeness inCompanies and Business Environment Institutions.’ Management 9(2): 83-94.
Molly, J. C., R. E. Ployhart, and P. M. Wright. 2011. ‘The Myth of “the”Micro-Macro Divide: Bridging System-Level and Disciplinary Di-vides.’ Journal of Management 37 (2): 581–609.
Müller, R., J. Glückler, M. Aubry, and J. Shao. 2013. ‘Project ManagementKnowledge Flows in Networks of Project Managers and ProjectManagement Offices: A Case Study in the Pharmaceutical Indus-try.’ Project Management Journal 44 (2): 4–19.
Myers, D., M. Hill, and S. Harwood. 2005. ‘Cross-Cultural Learningand Study Abroad: Transforming Pedagogical Outcomes.’ LandscapeJournal 24 (2): 172–87.
Philips, W., H. Lee, A. Ghobadian, N. O’Regan, and P. James. 2015. ‘So-cial Innovation and Social Entrepreneurship: A Systematic Review.’Group Organization Management 40 (3): 428–61.
Pohjola, I., A. Puusa, and P. Iskanius. 2015. ‘Potential of Communityof Practice in Promoting Academia-Industry Collaboration: A CaseStudy.’ In International Conference on Intellectual Capital and Knowl-edge Management and Organisational Learning, 206–12. KidmoreEnd: Academic Conferences International Limited.
Roessner, D., J. Bond, S. Okubo, and M. Planting. 2013. ‘The EconomicImpact of Licensed Commercialized Inventions Originating in Uni-versity Research.’ Research Policy 42 (1): 23–34.
Rudy, B. C., and A. F. Johnson. 2016. ‘Performance, Aspirations, and Mar-ket versus Nonmarket Investments.’ Journal of Management 42 (4):936–59.
Saguy, S. I. 2013. ‘Academia-Industry Interaction in Innovation: Para-digm Shifts and Avenues for the Future.’ In Advances in Food Pro-
number 4 · winter 2016 325
Sergej Gricar and Barbara Rodica
cess Engineering Research and Applications, edited by S. Yanniotis,P. Taoukis, N. G. Stoforos and V. T. Karathanos, 645–56. New York:Springer.
Sanchez-Serrano, I. 2011. ‘The Academia-Industry Relationship.’ In TheWorld’s Health Care Crisis: From the Laboratory Bench to the Pa-tient’S Bedside, edited by I. Sanchez-Serrano, 135–48. Amsterdam:Elsevier.
Schiller, R. S, and M. Almon-Bar. 2013. ‘Revisiting Collaborations be-tween Non Profits and Businesses: An npo-Centric View and Ty-pology.’ Nonprofit and Voluntary Sector 42 (5): 942–62.
Selsky, J. W., and B. Parker. 2005. ‘Cross-Sector Partnership to AddressSocial Issues: Challenges to Theory and Practice.’ Journal of Man-agement 31 (6): 849–73.
Javni sklad Republike Slovenije za razvoj kadrov in štipendije. 2016. ‘Pokreativni poti do prakticnega znanja.’ Powerpoint slides, Javni skladRepublike Slovenije za razvoj kadrov in štipendije, Ljubljana.
Slaughter, S., C. J. Archerd, and T. I. D. Campbell. 2004. ‘Boundariesand Quandaries: How Professors Negotiate Market Relations.’ TheReview of Higher Education 28 (1): 129–65.
Srica, V. 2016. Creativity and Innovation Management: A Storytelling Ap-proach. Seattle, wa: Amazon Digital Services.
Szelenyi, K., and K. Bresonis. 2014. ‘The Public Good and AcademicCapitalism: Science and Engineering Doctoral Students and Facultyon the Boundary of Knowledge Regimes.’ The Journal of Higher Ed-ucation 85 (1): 126–53.
Teddlie, C., and A. Tashakkori. 2010. ‘Overview of Contemporary Is-sues in Mixed Methods Research.’ In Sage Handbook of Mixed Meth-ods in Social and Behavioral Research, edited by T. Charles and A.Tashakkori, 1–41. Thousand Oaks: Sage.
Yin, R. K. 2009. Case Study Research: Design and Methods. 4th ed. Thou-sand Oaks, ca: Sage.
This paper is published under the terms of the Attribution-NonCommercial-NoDerivatives 4.0 International (cc by-nc-nd 4.0)License (http://creativecommons.org/licenses/by-nc-nd/4.0/).
326 management · volume 11
The Readiness of the EuropeanUnion to Embrace the FourthIndustrial Revolution
éva kuruczleki
University of Szeged, [email protected]
anita pelle
University of Szeged, [email protected]
renáta laczi
University of Szeged, [email protected]
boglárka fekete
University of Szeged, [email protected]
Knowledge has become a crucial factor of production in the de-veloped economies and, as humans are the carriers and utilisersof knowledge, skilled human resource is gaining similarly largerelevance. These advancements are elements of the substantialchanges that characterise the fourth industrial revolution – a phe-nomenon worth studying in detail. The European Union has beenexplicitly concerned about the shift to the knowledge economysince the Lisbon Summit of 2000. More than one and a half decadeslater the eu’s readiness to embrace the knowledge-driven fourthindustrial revolution can be examined. We undertake that by cre-ating an index based on various related data.
Key words: 4th industrial revolution, knowledge-based economy,human capital, European Union
Introduction
Change has always been an immanent feature of the economy. How-ever, in our times, changes occur at a pace faster than ever, and areeven accelerating. Also, many of the changes are disruptive. Sim-ilarly, knowledge has in fact been a factor in doing business for-ever. According to Dosi (2012), ‘economic theory is intrinsically aboutknowledge-based economies’ (p. 167), while Saviotti (2012) claimsthat we can only identify the roots of today’s knowledge-based so-ciety ‘in the second half of the nineteenth century with the advent
management 11 (4): 327–347 327
Éva Kuruczleki, Anita Pelle, Renáta Laczi, and Boglárka Fekete
of the modern university system and with the institutionalization ofindustrial r&d’ (p. 211). Even so, knowledge has usually not beenstudied directly in economic theory but along connecting phenom-ena such as innovation (Saviotti 2012). In contemporary economics,Lundvall (1992) stated as early as in the beginning of the ninetiesthat, in the economy as a whole, knowledge was the most importantresource, and learning the most important process.
So, in our times, the role of knowledge is widening more than everbefore, its importance is growing larger than before, and its creation,management and sharing is gradually but decisively transforming.This transformation is where the substantial roles of change andknowledge meet, both in economic theory, and in every-day busi-ness life. How have we gotten to this point, and where is Europein this process now? The first industrial revolution took place inEurope though it originates in England, not from continental Eu-rope. Since the second industrial revolution, though, the role of themain initiator has been taken over by the United States of Amer-ica (usa). However, even in the usa technological advancement isposing huge challenges to maintaining employment levels (Martus2015). The question how Europe, the European Union (eu) is (or isnot) prepared to embrace or even master the changes occurring inthe framework of the fourth industrial revolution can be asked. Ourstudy addresses this question in the first place.
In order to be able to find answers to our own query, in our studywe first take an overview of the phenomena often referred to by theumbrella expression of ‘the fourth industrial revolution’. In our anal-ysis, we pay special attention to two areas crucial for businesses tosucceed in this new era: knowledge and human capital. We are inter-ested in seeing how their nature and relevance as inputs to businesssuccess have altered with technological advancement, and how theycan be developed and maintained by firms to remain competitive inthis dynamic environment.
Afterwards, we change focus, from theory to analysis. In particular,we turn our attention to the economy of the eu as the specific sub-ject of our investigation, i.e. how European integration as a whole is(or is not) reacting to the changes underway, and how the eu mem-ber states are performing in the areas identified as inevitable in thesuccessful adoption to these changes.
As regards the eu member states, we also conduct a statisticalanalysis in order to depict a fact-based, sufficiently detailed pictureof the current state of affairs in relation to the main fields of our in-vestigation. At last, based on our analyses, we make some cautious
328 management · volume 11
The Readiness of the European Union
predictions regarding the prospects for the economy of the eu in theforeseeable future.
The Fourth Industrial Revolution
The fourth industrial revolution (also referred as industrial revolution4.0 or, in Germany in particular, Industry 4.0) is currently the subjectof debate in the economic literature as academics are trying to makereasonable projections for the future. On one hand, some argue thatthe fourth industrial revolution and future innovations in generaldo not imply such a growth potential what we have experienced inthe past, for example with the generation of power (Gordon 2014).On the contrary, other theorists claim that the impacts of the fourthindustrial revolution and the on-going digitalisation on innovationand growth will be ever stronger (Brynjolfsson and McAfee 2014).
The World Economic Forum (wef) organised its 2016 AnnualMeeting in Davos around the topic of the fourth industrial revo-lution. The director of the wef, Schwab (2016) released his bookdedicated to the topic precisely for the meeting. He takes a thoroughoverview of the ongoing and predicted changes in how we work, live,and do business, starting with the main affirmation that ‘changesare historic in terms of their size, speed and scope’ (Schwab 2016).At the same time, we have to discover that technology is not an ex-ogenous factor in the lives of individuals and businesses; quite thecontrary, it is a tool to embrace, an opportunity to grab. In particu-lar, the fourth industrial revolution is characterised by: widespreadand broadly accessible internet; smaller, cheaper and more power-ful sensors; artificial intelligence; and machine learning. The driversof the change are physical (autonomous vehicles, 3d printing, ad-vanced robots, new materials), digital (internet of things, relation-ship between things, and people connected by technologies and plat-forms), and biological (genetic sequencing and genetic engineering,synthetic biology and biological editing).
At present, technological transformation is changing practicallyevery aspects of economic and social life, including basic mecha-nisms like demand formation, capital accumulation, or employmentgeneration (Dosi 2012). And also market structures, with the appear-ance of two- or multi-sided markets, and platform economics. Two-sided markets are the ones where there are two or more, clearlydistinguishable groups of users whose demands are interdependentand therefore either or both groups produce positive externalities.At present, many industries operate as two-sided markets. In thissetting, it is a platform that ensures room for interaction among the
number 4 · winter 2016 329

Éva Kuruczleki, Anita Pelle, Renáta Laczi, and Boglárka Fekete
different groups, making it easier for them. Platforms play a distinc-tive role in reducing transaction costs.
Two-sided markets were first analysed by Rochet and Tirole (2003).Upon their classification, economic theory distinguishes four dif-ferent types of platforms (Evans 2011, 5–9): those of exchange, themedia, transaction systems, and software platforms. Nevertheless,regulation of platforms is far from advanced and is only sluggishlyfollowing markets. Regulators are still lacking new robust modelsso they are constrained to using traditional methods in the courseof their investigations, which raises the risk of false conclusions. Inparticular, traditional approximations of demand tend to underesti-mate the size of the relevant market and thus overestimate marketdistorting effects.
Under the fourth industrial revolution, firms change substantiallyas well. They are ‘no longer viewed merely as machines of trans-actional efficiency, bureaucratic order of labour exploitation. Theyare seen as repositories of competences, knowledge and creativity,as sites of invention, innovation and learning’ (Amin and Cohendet2012, 403). In fact, firms appear as a cognitive platform for interact-ing communities. Importantly, corporate culture is part of the com-mon knowledge.
We are also witnessing large communities of businesses organ-ising themselves into complete business ecosystems. These are ‘dy-namic and co-evolving communities of diverse actors who createand capture new value through both collaboration and competi-tion’ (Canning and Kelly 2015, 4). Such businesses are shaping theirown business landscape, act as collective wayfinders. They share re-sources and they work cooperatively and competitively at the sametime. Their adaptive and transformative capabilities are exceptionaland, in fact, immanent. In such business ecosystems, value cre-ation no more occurs linearly, along a value chain, but in a networkstructure called the value web. Ecosystems realise synergies, whichmakes them attractive for individual firms, be they small or large.
Knowledge and Human Capital in the FourthIndustrial Revolution
In relation to the fourth industrial revolution, there are some specificcharacteristics of knowledge as an asset or factor of production thatare worth discussing. Firstly, knowledge has many faces. And knowl-edge has been approached many ways in economic theory. In thepragmatist theory of knowledge, it arises from the method of inquirythat rests on creative hypotheses and experiences. Moreover, acquir-
330 management · volume 11
The Readiness of the European Union
ing knowledge is not an individual process but it is taking place ina collective dimension; therefore, institutions, and especially theirquality, play a role (Dutraive 2012).
Amin and Cohendet (2012) identifie the so-called knowing commu-nities which are triggered by the fast expansion and growing com-plexity of the knowledge base and the organisational challengesposed by the need to acquire and utilise knowledge within strict timelimitations. In such an environment, knowing communities act aspools of various competences that can be deployed in highly flexi-ble manners. They can be formed within traditional organisations oracross old structures. Knowing communities have no clear bound-aries but are kept together by individual passion on behalf of itsmembers and commitment to the common goal. Nevertheless, eco-nomic aspects appear among the motivations of the participants. Insuch cooperating communities, the frequency of interactions consid-erably reduces opportunistic behaviour. Belonging to the communityis experienced in the jointly undertaken process of validation andinterpretation of the common knowledge.
Kasper, Streit and Boettke (2012) also emphasise that knowledge(and skills) are spreading in the various communities of humans,‘despite the fact that each and everyone has a limited capacity, lim-ited resources and limited time to acquire and evaluate new informa-tion and to compound it to knowledge’ (p. 46). They interpret knowl-edge in an exceptionally wide sense, including knowledge on whereand what to buy, what new products to try out, rivals, close substi-tutes, product variations, production processes, organisation, com-munication and selling methods, possible exchange partners, etc.They also discuss the costs of the knowledge management processesand, even if not naming them as such, are mentioning platform-typeactors (calling them middlemen and their activities intermediation)who urge to contribute to the reduction of those costs for their busi-ness partners. In their view, in the knowledge economy, the mainfunctions of competition are: to find and test useful knowledge, todisperse that knowledge, and to control errors. Those suppliers winthe competition that are successful in lowering their and their con-sumers’ transaction costs, rather than production costs.
Dosi (2012) also claims that knowledge is a rather wide concept, itincludes, for example, ‘tacit and rather automatic skills like operat-ing a particular machine or correctly driving a car’ (pp. 171–2) andits accumulation may happen both through informal mechanism oflearning by doing and also in much more formalised processes. Ac-cording to Saviotti (2012), a way to grab the concept of knowledge in
number 4 · winter 2016 331
Éva Kuruczleki, Anita Pelle, Renáta Laczi, and Boglárka Fekete
the economic theory framework is to accept its two properties: thatknowledge is a co-creational structure, and a retrieval or interpre-tative structure. This way we are properly equipped to analyse theprocesses of knowledge creation and utilisation, even enabling our-selves to map the knowledge base of firms.
In the knowledge-based economy, many new aspects have to beconsidered by applied economic theory. If an economy is primar-ily knowledge based, its self-sustainable growth is rather likely(Dosi 2012). The web economy is a specific manifestation of theknowledge-based economy. The web economy can in fact be di-vided into four major platforms: e-commerce, online publishing,social networks, and online advertising. In comparison to regularmarkets, here new features appear and influence the market: thecritical mass (of suppliers and/or users) is more relevant, fees arecalculated in a more complex way (in fact, some user groups mayeventually enjoy some products or services free of charge) than intraditional linear markets, and there is a so-called ‘invisible engine’(Evans 2011) operating in these markets, catalysing trade.
In the knowledge-based view of the firm, rationality is bounded,knowledge has tacit elements and is distributed within and acrossfirms. Transaction costs are functions of (economically relevant)knowledge, and so is value creation and value appropriation. Knowl-edge assets are eventually owned and controlled by individual agentswho are becoming increasingly important to the firm. In this theo-retical context, the major strategic objective of creating and main-taining competitive advantage are pursued through targeting theoptimisation of these transaction costs (Foss 2005). Besides scalingeconomies there can be substantial learning economies and not onlyin relation to knowledge on the market (Church and Ware 2000) butalso regarding knowledge as an asset of good in itself.
Information, knowledge, or software are not only inputs but alsooutputs of production (i.e. they are goods). In the context of theknowledge economy, the concept of club goods is interpretable (El-sner, Torsten, and Schwardt 2014), referring to the in-between statusbetween private and public goods, i.e. when a certain group of agentshave access to them. Within this group, network goods are the onesof which the owners construct a network – in such cases, network ex-ternalities also arise. As for knowledge itself, it can be a private or apublic good but, in most of the cases, it is somewhere in-between. Inthis respect, we can identify two parallel tendencies: on one hand,there are strong incentives to provide access to knowledge, even ifit is codified knowledge. At the same time, in part connected to the
332 management · volume 11
The Readiness of the European Union
above tendency, there is also a strong push to protect intellectualproperty (Lundvall 1992).
In this environment, the main question is who bears the costsof development and in what way, and how the income realised oninvestments is distributed. Besides the usual issues of industrialorganisation (pricing, effects of scale, tying, planned obsolescenceetc.) new ones come up, including compatibility and interoperabil-ity, pirating, or open source as a business model (Elsner, Torsten,and Schwardt 2014). For economic modelling, even if network sci-ence methodology is applied, the two-sided markets where there aretwo (or more) multiple, distinct, and separable groups of actors (seeabove), bring further new challenges, especially as there presumablyexist network externalities within the groups, and for the whole of thenetwork as well.
Relevant literature identifies two models of knowledge creation(Lundvall 1992): in the sti model, there is a science – technology –innovation sequence occurring. In the other approach, the so-calleddui mode, it is the steps of doing – using – interaction that are taken.In Lundvall’s (2012) view, ‘while the output of the dui mode may be atangible new product with embodied technical knowledge – such asa numerically controlled machine tool – the outcome of the sti pro-cess may be disembodied knowledge that can be widely distributed.But the more codified form also makes it easier to protect this kind ofknowledge through intellectual property rights in the form of patentsor licenses’ (p. 307).
The term knowledge society is not unknown in academic litera-ture either, as it has already been described and expanded duringthe previous decades by notable scholars in the field, like Drucker,Mansell or Stehr (unesco 2005). Developing a knowledge societygained its momentum at the end of the last millennium as the in-formation technology started to develop at such pace that the worldhas never experienced before. Focus turned on new industries likecybernetics, biotechnology, nanotechnology etc., areas which requirean advanced level of knowledge. Soon economies recognized thathaving a highly skilled labour force is a necessary precondition ofthe establishment of a knowledge-based society. The main driver ofdeveloping the level of high-skilled labour force is sharing knowl-edge among members of the society. Higher education institutionsand private sector enterprises are those, who can contribute the mostto fostering innovation and the transition into a knowledge-basedeconomy. Knowledge is a complex phenomenon that is influencedby education, technological development, and innovation as well.
number 4 · winter 2016 333
Éva Kuruczleki, Anita Pelle, Renáta Laczi, and Boglárka Fekete
Taking into consideration the pro and contra arguments, we can besure that the current trends and changes will have a major impact onthe future of jobs and skills required on the labour market, especiallyas it is also going through a transformation (Acemoglu and Autor2010). For example, the boundaries of routine and non-routine tasksare pushed further by technology (Autor and Dorn 2013; Goos, Man-ning, and Salomons 2009). The non-routine tasks at the lower andthe higher ends of the skill scale are the ones that are not likely tobe automated. This may lead to the further polarization of the labourmarket since knowledge workers are already in more favourable po-sitions. In fact, currently the highest potential for productivity andgrowth is located in the knowledge sector (European Commission2015).
Furthermore, employment has a strong connection with educa-tional attainment. As Esping-Andersen claimed, back in 2002, ‘accel-erating the pace towards a knowledge-intensive economy impliesheavy investments in education, training and cognitive abilities.Those with low human and social capital will inevitably fall behindand find themselves marginalised in the job and career structure. Itis accordingly tantamount that educational investment be as broad-based as possible’ (Esping-Andersen 2002, 79). Lindley (2002) wasobserving that, already at that time, ‘knowledge workers and the so-cially excluded seem destined to live in different worlds’ (p. 95) andthat the best tool to fight social exclusion was education. For thisreason, we claim that education is of key importance when we talkabout knowledge, skills and human capital.
The formation of future human capital is taking place today so ed-ucation systems also have to adapt to current changes in order to beable to deliver the knowledge and skills required in the future. First,instead of the silo type approach in education, there is a need todevelop individuals with cross-functional skills encompassing bothtechnical and social analysing skills (World Economic Forum 2016).The skills required may vary across industries; however, the com-plex problem-solving ability is of growing importance in every sec-tor. Second, the issue of skill mismatches has already been identifiedin the European Union (European Commission 2016) but still it isgenerally associated with the present state of skill gaps. In our pointof view, what raises more concern is that the skills acquired or beingtaught today are not matching the skills demanded in the future.
Technology is at the same time the trigger and the enabler oftransformation in education. The new skills and competences re-quired in the labour market of the future can be developed by inte-
334 management · volume 11

The Readiness of the European Union
grating technology into education. Besides the basic digital skills,students have to acquire programming and advanced computingskills, learn how to use big data and how to utilise online learningplatforms for sharing knowledge (oecd 2016).
However, the human capital present in the labour market todayshould also be maintained. Businesses and their managements havea great responsibility in upskilling and reskilling the current labourforce by encouraging life-long learning and providing on-the-jobtraining. Maintaining human capital should be a priority for busi-nesses if they wish to survive under the fourth industrial revolution.Moreover, investment in skills and human capital is also associatedwith higher levels of competitiveness (Pelle and Laczi 2015).
The European Economy at the Verge of the FourthIndustrial Revolution
The European Council agreed in March 2000 in Lisbon that: ‘TheEuropean Union is confronted with a quantum shift resulting fromglobalisation and the challenges of a new knowledge-driven econ-omy. These changes are affecting every aspect of people’s lives andrequire a radical transformation of the European economy. TheUnion must shape these changes in a manner consistent with itsvalues and concepts of society and also with a view to the forthcom-ing enlargement.’ (European Council 2000) Accordingly, the strategicgoal was set for the 2000–2010 period, name that the eu should ‘be-come the most competitive and dynamic knowledge-based economyin the world capable of sustainable economic growth with more andbetter jobs and greater social cohesion.’ (European Council 2000)Already at the time of the Lisbon presidency of the eu in the firsthalf of year 2000, the main question was how knowledge was go-ing to shape Europe’s future and experts agreed that Europe was onthe crossroads whether to maintain a leading position in the globaleconomy or losing relevance (Rodrigues 2002).
The strategic goal of the Lisbon strategy was reaffirmed and re-newed with the adoption of the Europe 2020 strategy in March 2010(European Council 2010). According to the Europe 2020 strategy, theeu should realise smart, sustainable and inclusive growth (these arethe priorities) in the second decade of the 21st century. To this end,measurable targets were set in the fields of the three priorities. InMay 2015, the European Commission published the Digital SingleMarket strategy and set out 16 initiatives to make it happen.1 Amongthese, we can find provisions on fostering the digital business en-vironment, making e-commerce easier, modernising copyright law,
number 4 · winter 2016 335
Éva Kuruczleki, Anita Pelle, Renáta Laczi, and Boglárka Fekete
analysing online platforms, and ensuring digital privacy and cybersecurity.
To see how prepared the European Union is for the arrival ofthe fourth industrial revolution, we examined some indicators thatshow r&d and innovation-related performance, and the availabilityof skilled human capital.2 First, taking Eurostat data for gross na-tional research and development expenditures (gerd) from the year2014, we can see that German gerd is far beyond the other eu Mem-ber States (a total of 82,866 million eur). However, taking size dif-ferences into account, gerd expenditures as a total cannot be com-pared directly. Instead we took the gerd per capita values for theyear 2014 as the last available data. In this respect, the three North-ern member states are the best performers, then come five out of thesix founding member states, Italy being an exception. Western coun-tries, and also Austria and Slovenia, are in the mid-range as well.The major Southern Eurozone countries (Spain, Portugal and Italy)seem to perform slightly better than Eastern new member states butare still lagging behind their Western neighbours.
This indicates a clear distinction to be drawn between the Westernmember states and those countries that joined the eec/eu later, themajority of them being referred to as new member states. In 2014,Denmark spent 1,413 eur per inhabitant on research and develop-ment, this being the highest among the 28 member states. Denmarkis followed by fellow Northern countries Sweden and Finland, thenAustria, Luxembourg, and Germany as well, also spending morethan 1,000 eur per capita on r&d. The worst performers are Roma-nia, Bulgaria and Croatia, with a difference between them and thebest performers being more than 1200 eur per capita.
Fostering innovation and encouraging research and developmenthas been a priority of the eu since the Lisbon strategy. Connectedto the Europe 2020 strategy, a flagship initiative called InnovationUnion has been launched. As part of the five main targets of thestrategy, an overall goal of r&d spending to reach 3% of eu gdp wasset (European Commission 2016). If successful, this initiative andthe Digital Single Market agenda together are to make the desiredgoal of the eu becoming the most competitive economy of the worldfinally reached. r&d and innovation, often referred to as r&d&i, con-tribute to the functioning of a well-established knowledge-based so-ciety which in the long run could benefit not only European busi-nesses, but governments as well, and would improve living condi-tions and provide further opportunities: more jobs or better socialservices for citizens.
336 management · volume 11
The Readiness of the European Union
But still, halfway through the Europe 2020 programme, the de-sired goals have not been realised yet, and regional differences men-tioned above persist, making the core and the periphery diverge fur-ther away from each other. Western Member States seem to be ableto reach the 3% goal in r&d expenditures, and Northern countrieslike Sweden, Finland and Norway have Falready surpassed it. Still,new member states and the Southern Eurozone countries show gen-erally lower performance and, in their cases, the national target isadjusted lower as well, taken into account their circumstances andcurrent state of affairs. The fact that even the headline indicator wasset lower for the majority of the countries in the periphery indicatesthat these countries might not be able to catch up with the fast tech-nological development, not even in the future.
The number of patent applications to the European Patent Office(epo) shows one aspect of the innovative performance of a country.The latest available data for the number of patent applications permillion inhabitants is from 2013. On average, 113.27 patent appli-cations were submitted to the epo per million inhabitants; however,the divide between the core and the periphery is, again, vast. WhileSweden, as the best performer, had 301.97 patent applications permillion inhabitants, the latest joining member states, Croatia, Bul-garia and Romania all have less than 5 per million citizens. Newmember states, with Slovenia being an exception again, generallysubmitted less than 30 patent applications per million inhabitants tothe epo in 2013.
The number of r&d personnel in full-time equivalent is not a goodindicator to be compared directly either but the rate of r&d person-nel as a percentage of the active population makes data compara-ble and also shows how much effort a country puts into developinga steady base of human capital to improve its research and devel-opment performance. The same pattern as explained above can benoticed in this case as well: the ratio of r&d personnel measured infull-time equivalent as a percentage of the active population in 2014is the highest among Western and Northern countries, with Den-mark having 2.02%, followed by Finland, Luxembourg, Sweden, andthe old member states. Slovenia ranking 7th among them with 1.46%is again the exception from the new member states that have gener-ally lower rates, most of them below 1%.
Another challenge Europe is facing is the transformation towardsthe knowledge-based economy. As universities and higher educa-tion institutions drive innovation in Europe, one target within theeducation-related initiatives of the Europe 2020 strategy is that, by
number 4 · winter 2016 337

Éva Kuruczleki, Anita Pelle, Renáta Laczi, and Boglárka Fekete
2020, more than 40% of the population aged 30–4 should have a ter-tiary education degree. It is a promising fact that, by 2014, the ma-jority of the Member States were above 30%, and more than half ofthem already reached the 40% goal and have been working to reachhigher goals (Eurostat 2015). In this case, the previous pattern ofcore and periphery diverging cannot be observed: from the old mem-ber states, Italy is the one that has the lowest rate with 23.9% and isalso the last from all the eu member states. However, Germany isalso among those performing the lowest rates, far below the eu28average (37.9%) while, from the new member, states Lithuania andCyprus, both having a level above 50%, manifest that, for tertiaryeducation attainment, Eastern countries are able to perform just aswell as their Western and Northern neighbours.
Almost all the mentioned indicators show that the core and the pe-riphery of the eu are far from reaching the same development leveltowards building a well-functioning knowledge-based economy. Infact, this divergence remains an urgent problem that the eu has notbeen able to tackle so far. There are some exceptions, namely Slove-nia and the Baltic states, that have succeeded in realising conver-gence towards Western European levels: Estonia has introduced e-Residency, a transnational digital identity3 to unleash the country’sfull business potential while Slovenia has carried out serious ict in-vestments and has made huge efforts to turn the vision of the knowl-edge economy into reality (Bucar 2006; 2011). However, regional dif-ferences in the majority of the region continue to persist and, in fact,the gap between the core and the periphery has deepened even morein the aftermath of the financial crisis, now merging the group of theSouthern Eurozone countries and the Eastern new member statesinto one group: the periphery (Pelle 2015).
Data Analysis
In order to discover eu member states’ readiness for the fourth in-dustrial revolution, we introduced a new index based on Eurostatdata, called Industry 4.0 Readiness, and also carried out a clusteranalysis to reveal territorial differences among the member states. Increating the new index, we followed the methodology the World Eco-nomic Forum uses to generate new indices based on the calculationof secondary indices (World Economic Forum 2013). The calculationis carried out according to the following formula:
country value−sample minimumsample maximum−sample minimum
. (1)
338 management · volume 11
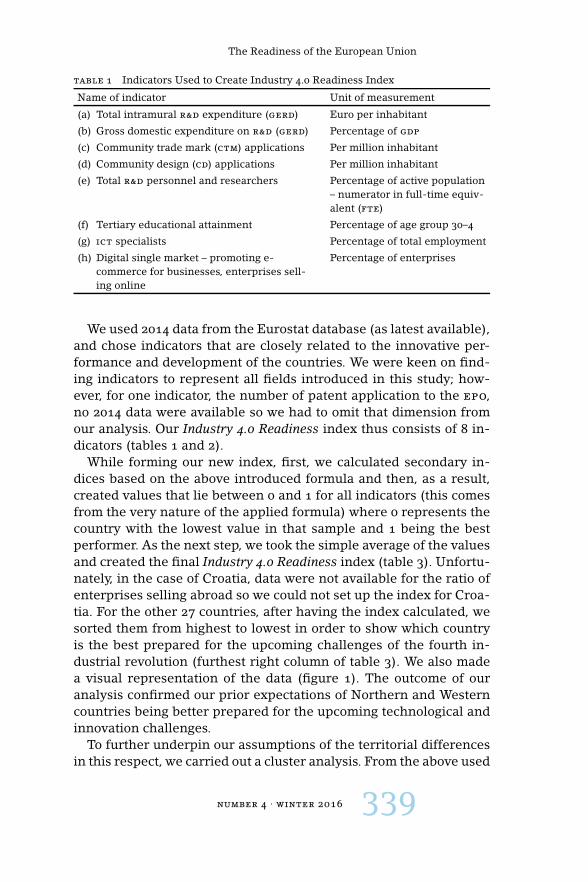
The Readiness of the European Union
table 1 Indicators Used to Create Industry 4.0 Readiness Index
Name of indicator Unit of measurement
(a) Total intramural r&d expenditure (gerd) Euro per inhabitant
(b) Gross domestic expenditure on r&d (gerd) Percentage of gdp
(c) Community trade mark (ctm) applications Per million inhabitant
(d) Community design (cd) applications Per million inhabitant
(e) Total r&d personnel and researchers Percentage of active population– numerator in full-time equiv-alent (fte)
(f) Tertiary educational attainment Percentage of age group 30–4
(g) ict specialists Percentage of total employment
(h) Digital single market – promoting e-commerce for businesses, enterprises sell-ing online
Percentage of enterprises
We used 2014 data from the Eurostat database (as latest available),and chose indicators that are closely related to the innovative per-formance and development of the countries. We were keen on find-ing indicators to represent all fields introduced in this study; how-ever, for one indicator, the number of patent application to the epo,no 2014 data were available so we had to omit that dimension fromour analysis. Our Industry 4.0 Readiness index thus consists of 8 in-dicators (tables 1 and 2).
While forming our new index, first, we calculated secondary in-dices based on the above introduced formula and then, as a result,created values that lie between 0 and 1 for all indicators (this comesfrom the very nature of the applied formula) where 0 represents thecountry with the lowest value in that sample and 1 being the bestperformer. As the next step, we took the simple average of the valuesand created the final Industry 4.0 Readiness index (table 3). Unfortu-nately, in the case of Croatia, data were not available for the ratio ofenterprises selling abroad so we could not set up the index for Croa-tia. For the other 27 countries, after having the index calculated, wesorted them from highest to lowest in order to show which countryis the best prepared for the upcoming challenges of the fourth in-dustrial revolution (furthest right column of table 3). We also madea visual representation of the data (figure 1). The outcome of ouranalysis confirmed our prior expectations of Northern and Westerncountries being better prepared for the upcoming technological andinnovation challenges.
To further underpin our assumptions of the territorial differencesin this respect, we carried out a cluster analysis. From the above used
number 4 · winter 2016 339
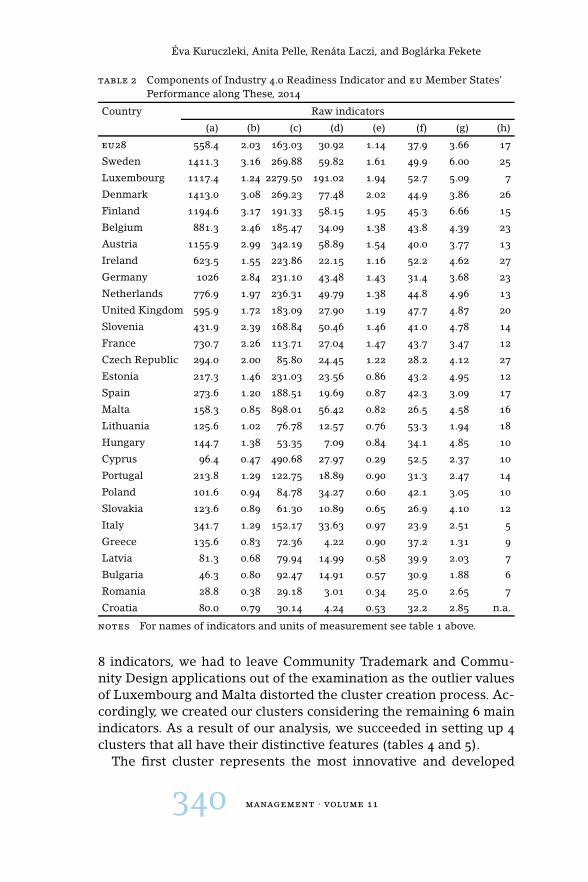
Éva Kuruczleki, Anita Pelle, Renáta Laczi, and Boglárka Fekete
table 2 Components of Industry 4.0 Readiness Indicator and eu Member States’Performance along These, 2014
Country Raw indicators
(a) (b) (c) (d) (e) (f) (g) (h)
eu28 558.4 2.03 163.03 30.92 1.14 37.9 3.66 17
Sweden 1411.3 3.16 269.88 59.82 1.61 49.9 6.00 25
Luxembourg 1117.4 1.24 2279.50 191.02 1.94 52.7 5.09 7
Denmark 1413.0 3.08 269.23 77.48 2.02 44.9 3.86 26
Finland 1194.6 3.17 191.33 58.15 1.95 45.3 6.66 15
Belgium 881.3 2.46 185.47 34.09 1.38 43.8 4.39 23
Austria 1155.9 2.99 342.19 58.89 1.54 40.0 3.77 13
Ireland 623.5 1.55 223.86 22.15 1.16 52.2 4.62 27
Germany 1026 2.84 231.10 43.48 1.43 31.4 3.68 23
Netherlands 776.9 1.97 236.31 49.79 1.38 44.8 4.96 13
United Kingdom 595.9 1.72 183.09 27.90 1.19 47.7 4.87 20
Slovenia 431.9 2.39 168.84 50.46 1.46 41.0 4.78 14
France 730.7 2.26 113.71 27.04 1.47 43.7 3.47 12
Czech Republic 294.0 2.00 85.80 24.45 1.22 28.2 4.12 27
Estonia 217.3 1.46 231.03 23.56 0.86 43.2 4.95 12
Spain 273.6 1.20 188.51 19.69 0.87 42.3 3.09 17
Malta 158.3 0.85 898.01 56.42 0.82 26.5 4.58 16
Lithuania 125.6 1.02 76.78 12.57 0.76 53.3 1.94 18
Hungary 144.7 1.38 53.35 7.09 0.84 34.1 4.85 10
Cyprus 96.4 0.47 490.68 27.97 0.29 52.5 2.37 10
Portugal 213.8 1.29 122.75 18.89 0.90 31.3 2.47 14
Poland 101.6 0.94 84.78 34.27 0.60 42.1 3.05 10
Slovakia 123.6 0.89 61.30 10.89 0.65 26.9 4.10 12
Italy 341.7 1.29 152.17 33.63 0.97 23.9 2.51 5
Greece 135.6 0.83 72.36 4.22 0.90 37.2 1.31 9
Latvia 81.3 0.68 79.94 14.99 0.58 39.9 2.03 7
Bulgaria 46.3 0.80 92.47 14.91 0.57 30.9 1.88 6
Romania 28.8 0.38 29.18 3.01 0.34 25.0 2.65 7
Croatia 80.0 0.79 30.14 4.24 0.53 32.2 2.85 n.a.
notes For names of indicators and units of measurement see table 1 above.
8 indicators, we had to leave Community Trademark and Commu-nity Design applications out of the examination as the outlier valuesof Luxembourg and Malta distorted the cluster creation process. Ac-cordingly, we created our clusters considering the remaining 6 mainindicators. As a result of our analysis, we succeeded in setting up 4clusters that all have their distinctive features (tables 4 and 5).
The first cluster represents the most innovative and developed
340 management · volume 11
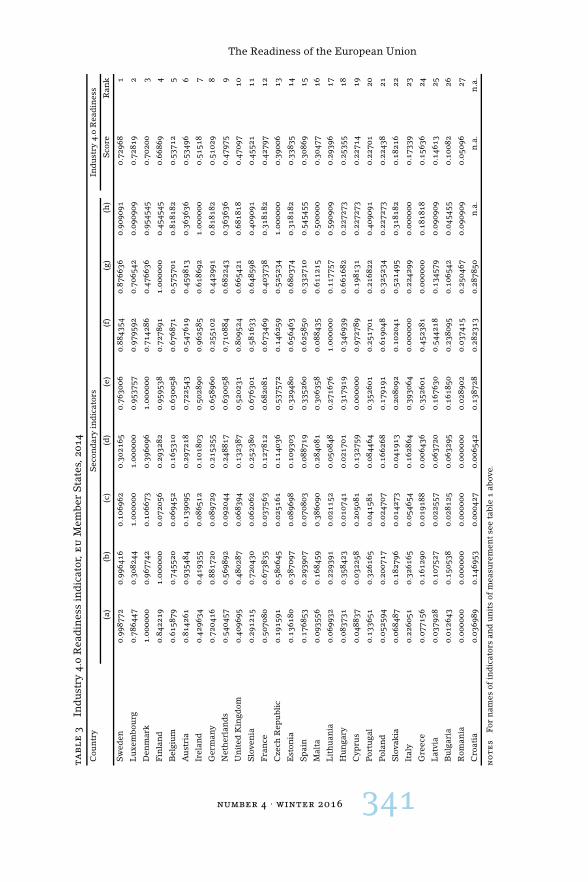
The Readiness of the European Union
ta
ble
3In
du
stry
4.0
Rea
din
ess
ind
icat
or,e
uM
emb
erS
tate
s,20
14C
oun
try
Sec
ond
ary
ind
icat
ors
Ind
ust
ry4.
0R
ead
ines
s
(a)
(b)
(c)
(d)
(e)
(f)
(g)
(h)
Sco
reR
ank
Sw
eden
0.99
8772
0.99
6416
0.10
6962
0.30
2165
0.76
3006
0.88
4354
0.87
6636
0.90
9091
0.72
968
1
Lu
xem
bou
rg0.
7864
470.
3082
441.
0000
001.
0000
000.
9537
570.
9795
920.
7065
420.
0909
090.
7281
92
Den
mar
k1.
0000
000.
9677
420.
1066
730.
3960
961.
0000
000.
7142
860.
4766
360.
9545
450.
7020
03
Fin
lan
d0.
8422
191.
0000
000.
0720
560.
2932
820.
9595
380.
7278
911.
0000
000.
4545
450.
6686
94
Bel
giu
m0.
6158
790.
7455
200.
0694
520.
1653
100.
6300
580.
6768
710.
5757
010.
8181
820.
5371
25
Au
stri
a0.
8142
610.
9354
840.
1390
950.
2972
180.
7225
430.
5476
190.
4598
130.
3636
360.
5349
66
Irel
and
0.42
9634
0.41
9355
0.08
6512
0.10
1803
0.50
2890
0.96
2585
0.61
8692
1.00
0000
0.51
518
7
Ger
man
y0.
7204
160.
8817
200.
0897
290.
2152
550.
6589
600.
2551
020.
4429
910.
8181
820.
5102
98
Net
her
lan
ds
0.54
0457
0.56
9892
0.09
2044
0.24
8817
0.63
0058
0.71
0884
0.68
2243
0.36
3636
0.47
975
9
Un
ited
Kin
gdom
0.40
9695
0.48
0287
0.06
8394
0.13
2387
0.52
0231
0.80
9524
0.66
5421
0.68
1818
0.47
097
10
Slo
ven
ia0.
2912
150.
7204
300.
0620
620.
2523
800.
6763
010.
5816
330.
6485
980.
4090
910.
4552
111
Fra
nce
0.50
7080
0.67
3835
0.03
7563
0.12
7812
0.68
2081
0.67
3469
0.40
3738
0.31
8182
0.42
797
12
Cze
chR
epu
bli
c0.
1915
910.
5806
450.
0251
610.
1140
360.
5375
720.
1462
590.
5252
341.
0000
000.
3900
613
Est
onia
0.13
6180
0.38
7097
0.08
9698
0.10
9303
0.32
9480
0.65
6463
0.68
0374
0.31
8182
0.33
835
14
Sp
ain
0.17
6853
0.29
3907
0.07
0803
0.08
8719
0.33
5260
0.62
5850
0.33
2710
0.54
5455
0.30
869
15
Mal
ta0.
0935
560.
1684
590.
3860
900.
2840
810.
3063
580.
0884
350.
6112
150.
5000
000.
3047
716
Lit
hu
ania
0.06
9932
0.22
9391
0.02
1152
0.05
0848
0.27
1676
1.00
0000
0.11
7757
0.59
0909
0.29
396
17
Hu
nga
ry0.
0837
310.
3584
230.
0107
410.
0217
010.
3179
190.
3469
390.
6616
820.
2272
730.
2535
518
Cyp
rus
0.04
8837
0.03
2258
0.20
5081
0.13
2759
0.00
0000
0.97
2789
0.19
8131
0.22
7273
0.22
714
19
Por
tuga
l0.
1336
510.
3261
650.
0415
810.
0844
640.
3526
010.
2517
010.
2168
220.
4090
910.
2270
120
Pol
and
0.05
2594
0.20
0717
0.02
4707
0.16
6268
0.17
9191
0.61
9048
0.32
5234
0.22
7273
0.22
438
21
Slo
vaki
a0.
0684
870.
1827
960.
0142
730.
0419
130.
2080
920.
1020
410.
5214
950.
3181
820.
1821
622
Ital
y0.
2260
510.
3261
650.
0546
540.
1628
640.
3930
640.
0000
000.
2242
990.
0000
000.
1733
923
Gre
ece
0.07
7156
0.16
1290
0.01
9188
0.00
6436
0.35
2601
0.45
2381
0.00
0000
0.18
1818
0.15
636
24
Lat
via
0.03
7928
0.10
7527
0.02
2557
0.06
3720
0.16
7630
0.54
4218
0.13
4579
0.09
0909
0.14
613
25
Bu
lgar
ia0.
0126
430.
1505
380.
0281
250.
0632
950.
1618
500.
2380
950.
1065
420.
0454
550.
1008
226
Rom
ania
0.00
0000
0.00
0000
0.00
0000
0.00
0000
0.02
8902
0.03
7415
0.25
0467
0.09
0909
0.05
096
27
Cro
atia
0.03
6989
0.14
6953
0.00
0427
0.00
6542
0.13
8728
0.28
2313
0.28
7850
n.a
.n
.a.
n.a
.
no
te
sFo
rn
ames
ofin
dic
ator
san
du
nit
sof
mea
sure
men
tse
eta
ble
1ab
ove.
number 4 · winter 2016 341

Éva Kuruczleki, Anita Pelle, Renáta Laczi, and Boglárka Fekete
figure 1 Industry 4.0 Readiness, eu Member States, 2014(OpenHeatMap based on authors’ calculations)
table 4 Cluster Division
Cluster Member States
1st Belgium, Denmark, Germany, Austria, Finland, Sweden
2nd Bulgaria, Estonia, Croatia, Italy, Hungary, Malta, Romania, Slovakia
3rd Czech Republic, Ireland, France, Luxembourg, Netherlands, Slovenia,United Kingdom
4th Greece, Spain, Cyprus, Latvia, Lithuania, Poland, Portugal
countries, with outstanding values in all indicators. In 2014, mem-ber states in this cluster spent on average 1180.35 Euros per inhab-itant on research and development, total r&d expenditures being ataverage 2.95% of gdp. The ratios of r&d personnel and ict special-ists are also the highest in this group, indicating that these countriesare on the best way towards a well-established and well-functioningknowledge-based economy and society. The rate of online tradingenterprises was 20.83% on average, again the highest among theclusters.
The second and the fourth clusters show similar characteristics,primarily by performing the lowest values. Nevertheless, the two
342 management · volume 11
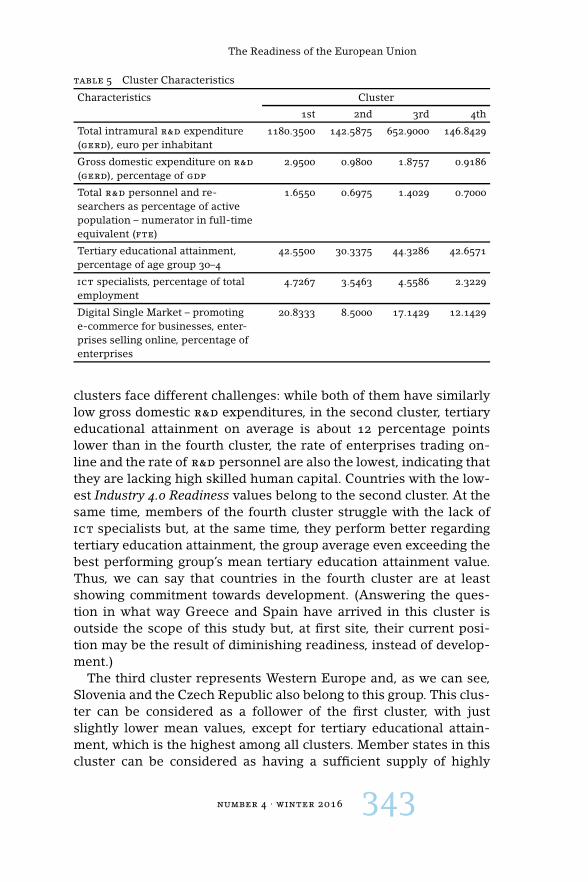
The Readiness of the European Union
table 5 Cluster Characteristics
Characteristics Cluster
1st 2nd 3rd 4th
Total intramural r&d expenditure(gerd), euro per inhabitant
1180.3500 142.5875 652.9000 146.8429
Gross domestic expenditure on r&d
(gerd), percentage of gdp
2.9500 0.9800 1.8757 0.9186
Total r&d personnel and re-searchers as percentage of activepopulation – numerator in full-timeequivalent (fte)
1.6550 0.6975 1.4029 0.7000
Tertiary educational attainment,percentage of age group 30–4
42.5500 30.3375 44.3286 42.6571
ict specialists, percentage of totalemployment
4.7267 3.5463 4.5586 2.3229
Digital Single Market – promotinge-commerce for businesses, enter-prises selling online, percentage ofenterprises
20.8333 8.5000 17.1429 12.1429
clusters face different challenges: while both of them have similarlylow gross domestic r&d expenditures, in the second cluster, tertiaryeducational attainment on average is about 12 percentage pointslower than in the fourth cluster, the rate of enterprises trading on-line and the rate of r&d personnel are also the lowest, indicating thatthey are lacking high skilled human capital. Countries with the low-est Industry 4.0 Readiness values belong to the second cluster. At thesame time, members of the fourth cluster struggle with the lack ofict specialists but, at the same time, they perform better regardingtertiary education attainment, the group average even exceeding thebest performing group’s mean tertiary education attainment value.Thus, we can say that countries in the fourth cluster are at leastshowing commitment towards development. (Answering the ques-tion in what way Greece and Spain have arrived in this cluster isoutside the scope of this study but, at first site, their current posi-tion may be the result of diminishing readiness, instead of develop-ment.)
The third cluster represents Western Europe and, as we can see,Slovenia and the Czech Republic also belong to this group. This clus-ter can be considered as a follower of the first cluster, with justslightly lower mean values, except for tertiary educational attain-ment, which is the highest among all clusters. Member states in thiscluster can be considered as having a sufficient supply of highly
number 4 · winter 2016 343
Éva Kuruczleki, Anita Pelle, Renáta Laczi, and Boglárka Fekete
skilled labour, yet do not paying as much attention to investing inresearch and development as their Northern neighbours.
To conclude the data analysis, we confirm our assumptions of theexistence of territorial differences. However, instead of a core anda periphery, we could compose four distinct clusters: the North, theWest, the East, and the South. The North and the West show similar-ities but differ slightly in the intensity in research and developmentexpenditures while the East and the South also share common fea-tures but differ in the availability of highly skilled labour force.
Conclusions
We are living in a time of substantial changes. Knowledge, technol-ogy and new business models are shaping our present and future.Adaptability, preparedness, and responsiveness are key ingredientsto success, not only at the level of individuals and businesses, butalso for countries or economic blocs as the European Union itself.
According to our analysis, the eu as a whole is performing accept-ably well to meet the challenges posed by the fourth industrial revo-lution. However, if we go to the level of individual member states,we can identify vast differences among them in this respect. OurIndustry 4.0 Readiness indicator and our cluster analysis have alsohighlighted these differences. According to the latter, the eu is di-vided into four distinctive groups of countries: a North (being themost prepared for the changes), a West, a South, and an East. Thetendencies are not showing in the direction of convergence or ho-mogeneity, implying that policy action would be needed to scale upthe periphery in order to avoid even more serious fault-lines withinthe eu.
Notes
1 See http://europa.eu/rapid/press-release_IP-15-4919_en.htm
2 All data in this section can be found at http://ec.europa.eu/eurostat/web/europe-2020-indicators/europe-2020-strategy/headline-indicators-scoreboard and at http://ec.europa.eu/eurostat/web/science-technology-innovation/data/main-tables
3 See https://e-estonia.com/e-residents/about/
References
Acemoglu, D., and D. H. Autor. 2010. ‘Skills, Tasks and Technology:Implications for Employment and Earnings.’ nber Working Paper16082, National Bureau of Economic Research, Cambridge, ma.
Amin, A., and P. Cohendet. 2012. ‘The Firm As a ‘Platform of Communi-ties’: A Contribution to the Knowledge-Based Approach of the Firm.’
344 management · volume 11
The Readiness of the European Union
In Handbook of Knowledge and Economics, edited by R. Arena, A.Festré, and N. Lazaric, 403–34. Cheltenham: Elgar.
Autor, D., and D. Dorn. 2013. ‘The Growth of Low Skill Service Jobs andthe Polarization of the U.S. Labor Market.’ American Economic Re-view 103 (5): 1553–97.
Brynjolfsson, E., and A. McAfee. 2014. The Second Machine Age: Work,Progress, and Prosperity in a Time of Brilliant Technologies. NewYork: Norton.
Bucar, M. 2006. ‘eStrategy and ict Investment in Slovenia.’ Paper pre-sented at the 19th Bled eConference, Bled, 4–7 June.
. 2011. ‘Is Knowledge Society a Vision or Illusion? The Case ofSlovenia.’ Društvena istraživanja 20 (4): 967–90.
Canning, M., and E. Kelly. 2015. Business Ecosystems Come of Age. Lon-don: Deloitte University Press.
Church, J. R., and R. Ware. 2000. Industrial Organization: A StrategicApproach. Boston, ma: McGraw-Hill.
Dosi, G. 2012. ‘A Note on Information, Knowledge and Economic The-ory.’ In Handbook of Knowledge and Economics, edited by R. Arena,A. Festré and N. Lazaric, 167–82. Cheltenham: Elgar.
Dutraive, V. 2012. ‘The Pragmatist View of Knowledge and Beliefs inInstitutional Economics: The Significance of Habits and Thought,Transactions and Institutions in the Conception of Economic Be-haviour.’ In Handbook of Knowledge and Economics, edited by R.Arena, A. Festré and N. Lazaric, 99–120. Cheltenham: Elgar.
European Commission. 2010. ‘Europe 2020: A Strategy for Smart, Sus-tainable and Inclusive Growth.’ com(2010) 2020 final, EuropeanCommission, Brussels.
. 2015. Employment and Social Developments in Europe 2014. Brus-sels: European Commission.
. 2016. Employment and Social Developments in Europe 2015. Brus-sels: European Commission.
European Council. 2000. ‘Lisbon European Council 23 and 24 March2000: Presidency Conclusions.’ http://www.europarl.europa.eu/summits/lis1_en.htm
Elsner, W., T. Heinrich, and H. Schwardt. 2014. The Microeconomicsof Complex Economies: Evolutionary, Institutional, Neoclassical, andComplexity Perspectives. Amsterdam: Elsevier.
Esping-Andersen, G. 2002. ‘A New European Social Model for theTwenty-First Century?’ In The New Knowledge Economy in Europe:A Strategy for International Competitiveness and Social Cohesion,edited by M. J. Rodrigues, 54–95. Cheltenham: Elgar.
Eurostat. 2015. Smarter, Greener, More Inclusive? Indicators to Supportthe Europe 2020 Strategy. Luxembourg: Publications Office of theEuropean Union.
number 4 · winter 2016 345
Éva Kuruczleki, Anita Pelle, Renáta Laczi, and Boglárka Fekete
Evans, D. S. 2011. Platform Economics: Essays on Multi-Sided Businesses.http://www.marketplatforms.com/wp-content/uploads/Downloads/Platform-Economics-Essays-on-Multi-Sided-Businesses.pdf
Foss, N. J. 2005. Strategy, Economic Organization, and the KnowledgeEconomy: The Coordination of Firms and Resources. Oxford: OxfordUniversity Press.
Gordon, R. J. 2014. ‘The Demise of U.S. Economic Growth: Restatement,Rebuttal, and Reflections.’ nber Working Paper 19895, National Bu-reau of Economic Research, Cambridge, ma.
Goos, M., A. Manning, and A. Salomons. 2009. ‘Job Polarization in Eu-rope.’ American Economic Review: Papers and Proceedings 99 (2): 58–63.
Kasper, W., M. E. Streit, and P. J. Boettke. 2012. Institutional Economics:Property, Competition, Policies. 2nd ed. Cheltenham: Elgar.
Lindley, R. M. 2002. ‘Knowledge-Based Economies: The European Em-ployment Debate in a New Context.’ In The New Knowledge Economyin Europe: A Strategy for International Competitiveness and Social Co-hesion, edited by M. J. Rodrigues, 95–145. Cheltenham: Elgar.
Lundvall, B.-Å. 1992. National Innovation Systems: Towards a Theory ofInnovation and Interactive Learning. London: Pinter.
. 2012. ‘One Knowledge Base or Many Knowledge Pools?’ InHandbook of Knowledge and Economics, edited by R. Arena, A. Fes-tré and N. Lazaric, 285–312. Cheltenham: Elgar.
Martus, B. 2015. ‘Should We Increase Economic Growth or Boost Em-ployment?’ Public Finance Quarterly 60 (2): 249–69.
oecd. 2016. Trends Shaping Education 2016. Paris: oecd.
Pelle, A. 2015. ‘Mind the Gap: Arguments in Favour of Judicious Con-structivism in Providing Horizon for All.’ Intereconomics 50 (1): 13–20.
Pelle, A., and R. Laczi. 2015. ‘The Human Aspects of Competitivenessin the European Union.’ In Proceedings of International Confer-ence of European Economy iv, edited by S. Radyka, 201–19. Chicago:Chicago University Press.
Rochet, J.-C., and J. Tirole. 2003. ‘Platform Competition in Two-SidedMarkets.’ Journal of the European Economic Association 1 (4): 990–1029.
Rodrigues, M. J. 2002. ‘Introduction: For a European Strategy at the Turnof the Century.’ In The New Knowledge Economy in Europe: A Strat-egy for International Competitiveness and Social Cohesion, edited byM. J. Rodrigues, 1–27. Cheltenham: Elgar.
Saviotti, P. P. 2012. ‘Towards a Theoretical Framework for the Genera-tion and Utilization of knowledge.’ Handbook of Knowledge and Eco-nomics, edited by R. Arena, A. Festré, and N. Lazaric, 211–45. Chel-tenham: Elgar.
346 management · volume 11
The Readiness of the European Union
Schwab, K. 2016. The Fourth Industrial Revolution. Geneva: World Eco-nomic Forum.
unesco. 2005. Towards Knowledge Societies. Paris: unesco.World Economic Forum. 2013. The Global Competitiveness Report 2013–
2014. Geneva: World Economic Forum.. 2016. The Future of Jobs. Geneva: World Economic Forum.
This paper is published under the terms of the Attribution-NonCommercial-NoDerivatives 4.0 International (cc by-nc-nd 4.0)License (http://creativecommons.org/licenses/by-nc-nd/4.0/).
number 4 · winter 2016 347


Evidence on Economic Growthand Financial Developmentin Montenegro
milena lipovina-božovic
University of Montenegro, [email protected]
julija cerovic smolovic
University of Montenegro, [email protected]
Macroeconomic development must be supported by a stable andefficient financial system. There are many different measures offinancial development that are suggested when the relationshipbetween growth and financial system is analyzed. In this paperwe will identify the most important indicators of the financial de-velopment in Montenegro. Due to the fact that in the last decadeMontenegrin financial market has been developing, we want tosee if that fact had an influence on the economic growth, as wellas if there is significant positive relationship between the growthand financial development. The intention of this article is to useprincipal components in order to examine correlation among in-dicators and find means or main components. This technique hasthe advantage of giving more general measures of financial devel-opment rather than individual variables for bank or stock marketdevelopment. It could be concluded that it is difficult to identifythe specific components of the financial system most associatedwith the economic growth.
Key words: economic growth, financial development, principalcomponent analysis
Introduction
Montenegrin economy is a small open euroized economy. In the lastfifteen years, particularly since its independence in 2006, Montene-gro has achieved a significant progress measured in the increaseof the gross domestic product (gdp). The major driver for this eco-nomic growth is definitely a high inflow of the foreign direct invest-ments (fdis). In terms of the share of fdis in gross domestic product,Montenegro has been a leading economy in the group of Europeaneconomies in transition in the pre-crisis period. One of the maindrivers of fdis was the process of privatization. These inflows were
management 11 (4): 349–365 349

Milena Lipovina-Božovic and Julija Cerovic Smolovic
dominantly oriented towards the service sector, especially banking,telecommunications, energy, trade and real estates. It resulted in thehigh growth of deposits and thus the development of the bankingsector, as well as on the capital market development. On one hand,as the result of the sale of property and real estate, a part of themoney was deposited in the banking system in the form of deposits.On the other hand, through the process of foreign investments, cred-ible foreign companies arrived on the Montenegrin market and be-came important clients of the banking system.
However, the global financial crisis severely hit Montenegrin econ-omy which was highly integrated into the regional and global trends.The economy is still dealing with the consequences of the collapseof the lending boom in 2008. The financial crisis influenced the de-terioration of asset quality and weakened banks ‘portfolios, finallyleading to a credit contractions. The situations showed the vulner-ability of Montenegrin banking sector. After seven years, there aresome signs of the recovery, with the acceleration of the economicactivity and a slow credit growth.
In the last years, much progress within the legal, regulatory andsupervisory frameworks has been made in the development of Mon-tenegrin financial system but further progress is nevertheless re-quired. However, during this very volatile period, the developmentof viable financial sectors was perceived to be an especially chal-lenging task. That is why we found interesting to analyze the linkagebetween measures of financial development and economic growthin Montenegro in the previous decade. When dealing with this topic,there are many opened questions. While the significant body of em-piric literature investigated the relationship between financial de-velopment and economic growth, there is still a lot of space for moreinformation especially in country specific cases, likewise in small eu-roized economies still in transition process.
One of the main tasks is to deal with the measuring of financialdevelopment. There are many different measures of financial devel-opment that have been suggested in the literature but two main onesare useful to consider: financial intermediaries and stock market de-velopment. The first are supposed to measure the level of develop-ment of financial intermediaries and the second to measure the sizeand efficiency of the stock market. As suggested by Saci and Holden(2008), the amount of foreign direct investment is important measuretoo, especially given the significance fdis have had for Montenegrineconomy.
Out of different variables we use for the measuring of financial
350 management · volume 11

Evidence on Economic Growth and Financial Development
development, we use the method of principal components analysisto extract the financial development measure expressed through theprincipal components. While individually, the variables in the papermight not seem as a perfect measure of financial development, to-gether, due to the correlation between them, they could give moreimportant information about the financial system in Montenegro.
In the second section, a selective literature review of the relation-ship between financial development and economic growth is pre-sented. We also present a brief overview of the financial develop-ment process in Montenegro in the third section. The fourth sectiongives a brief presentation of used data and methods. In the fifth sec-tion, the empirical results of the model measuring relationship be-tween extracted principal components and economic growth in Mon-tenegro are presented. The conclusions are presented in the sixthsection.
Literature Review
Ever since the beginning of the twentieth century, there have beennumerous studies of the relationship between financial developmentand economic growth. Some of the most relevant for this analysis arelisted in the next paragraphs.
For example, Shumpeter (1912) stated that financial developmentthrough innovative entrepreneurship promotes economic growth.King and Levine (1993) examined this relationship on the sample of80 countries for the period 1960–1989 and found the strong positivecorrelation between higher levels of financial development and eco-nomic growth rate. We have to emphasize that the finance-growthlink is very complex, and that it depends on the stage of economicdevelopment of the country (countries) studied (Djalilov and Piesse2011). Also, Al-Yousif (2002) concluded that the relationship be-tween financial development and economic growth differs for dif-ferent countries because each country has a different economic pol-icy and a different institutional efficiency that is important for im-plementation of this economic policy. This can be confirmed by lit-erature, so the brief overview of the studies dealing with empiricalanalysis of this link, is presented in the following paragraphs.
Several papers analyzed the relation between finance and growthin a single country. For example, Guiso, Sapienza, and Zingales(2004) found that financial development improves competition inthe economy and so impacts the economic growth. Bertrand, Schoar,and Thesmar (2007) showed that reducing the government inter-vention in banking sector promotes growth through more efficient
number 4 · winter 2016 351
Milena Lipovina-Božovic and Julija Cerovic Smolovic
resource allocation in France. Obradovic and Grbic (2015) examinedthe causal relation between the financial development and economicgrowth in Serbia, based on the quarterly data for the period 2004–2011. They found that economic growth contributes to the financialdeepening, and that there is a significant unidirectional causalitythat runs from, on one side, a positive enterprise credit to gdp anda household credit to gdp to economic growth, on the other side. Acausal relation is confirmed between the share of bank credits tonon-financial private sector in total domestic credits and economicgrowth rate.
Regarding emerging and developing countries, there are very fewresearch studies about the link between financial development andeconomic growth. Levine, Loayza and Beck (2000) found a positiveimpact of financial development on growth, and, in their large modelwith various variables, a positive and negative growth of inflation ongrowth, depending on the variable of financial development used.Koivu (2002) analyzed this relation for twenty-five transition coun-tries in the period of 1993–2000. The results showed that the fi-nancial spread and the amount of nonperforming loans in bankingsector positively influence economic growth. However, the bankingsector credit to the private sector has a negative impact on growth,which can be explained by the banking crisis in the analyzed coun-tries in 1990s. Dawson (2003) showed that financial development hadno significant impact on the economic growth, for thirteen transi-tional countries in the Central and Eastern Europe. So, in this case,the economic growth was not limited by the underdevelopment offinancial sector. Neimke (2003) explored the same link for anothertwenty-five transition countries in the period 1989–2000, using bankand stock market indicators. The results indicate that finance posi-tively affected growth through investments and better resource allo-cation. He concluded that all transition economies suffer from out-dated capital stocks. So, only the economies that have stimulated in-vestment have boarded on a positive growth path. Beside the invest-ment channel the financial sector influences the overall growth ratethrough the total factor productivity channel. The efficient financialmarkets play an important role in guiding the transition economiesinto the direction of higher growth paths and better standards of liv-ing.
On the other hand, Gillman and Harris (2004) analyzed the re-lation between financial development and growth for twenty-sevencountries in the period 1965–1995. The findings indicate that whenincluding the investment rate, the financial depth does not positively
352 management · volume 11

Evidence on Economic Growth and Financial Development
affect the growth. Financial development is not robustly significantin this model, although a negative stand-alone effect on growth werefound in some specifications. This suggests that in previous results apositive effect of financial development may have been obtained be-cause financial development is proxying the rate of return to phys-ical capital. Including this proxy through the investment rate, thelevel of financial development is found no longer important.
Mehl, Vespro, and Winkler (2005) investigated the relation be-tween the financial development and growth for nine countries inSoutheast Europe. They found that this relation is a negative one,which was explained in a way that less developed financial environ-ment did not affect the economic growth.
Saci and Holden (2008) investigated the finance-growth relationusing the annual panel data for thirty developing countries. Theyused the principal components analysis with the 10 financial de-velopment variables and five variables claimed to be important forgrowth. The results indicate that economic growth is related to ageneral measure of financial development, the stock market devel-opment and, to a lesser extent, government consumption.
Cojocaru et al. (2016) examined the finance-growth link in the for-mer Communist countries of Central and Eastern Europe and theCommonwealth of Independent States in the period of 1990–2008.They found that measures of financial market efficiency and com-petitiveness are more important than the size of the market in termsof promoting economic growth.
Financial Development in Montenegro: Background
Banking sector of Montenegro virtually collapsed during the 1990s,as the country (at the time part of Federal Republic of Yugoslavia,a federation it made with Serbia) experienced one of the biggestepisodes of hyperinflation in the world’s history, amidst the break-upof communist Yugoslavia in a war (1992–1995), which primarily af-fected other ex-Yugoslav republics. In the spring of 1999 the countryalso went through a nato bombing campaign against fr Yugoslavia,although being hit to a significantly lesser extent than Serbia.
Montenegro paved its way towards independence years before theindependence referendum was held (2006), most notably throughadoption of the Deutsche mark as the country’s co-official currencywith the Yugoslav dinar, in November 1999. Eventually, Montenegroabandoned the dinar altogether and unilaterally adopted the euroin March 2002, which since then has been the only legal tender inthe country. It is in that period (1999–2002) that the Central Bank
number 4 · winter 2016 353
Milena Lipovina-Božovic and Julija Cerovic Smolovic
of Montenegro (cbm) was established, which since then has beenmandated with the following functions: banking regulation and su-pervision (recently including a broader, financial stability mandate),foreign reserves management, fiscal agent operations, payment sys-tem operations and, last but not least, research and statistics tasks.
Montenegro’s financial system is banco-centric, as the firms arefinanced almost exclusively through banks, and the local stock ex-change basically serves for secondary trading. In general, talkingabout financial institutions, banks (currently 14) are the most impor-tant financial intermediaries in Montenegro, comprising about 90%of financial institutions’ assets. Out of them, foreign-owned banks(especially those which are subsidiaries of foreign banking groups)are the biggest, covering some 75% of total banks’ assets. The insur-ance sector grew at an average rate of 3% in the last five years. Nineof 11 insurers are foreign subsidiaries, with 95% of total premiums.The rest of the nonbanking financial systems play a very minor role.The turnover on the capital market is very low and the bond marketis very thin.
The history of modern Montenegrin banking can be divided intotwo distinct periods, 2001–2008 and 2009–2015. The first period wascharacterized by a rapid credit growth, fueled by massive amounts offdis the country was receiving (which in turn was contributing to arise of deposits in the banking sector) and additionally supported bylocal banks’ borrowings from their foreign parents. In other words,that was the period of a high loan-to-deposit ratio (up to 150%) anda high share of foreign borrowings in banks’ total liabilities (up to30%). Partially due to global financial crisis, but mostly due to un-sustainable development model of the economy and stock exchangeand real estate bubbles that formed in parallel, the tide changedin the autumn of 2008. First years of the period 2009–2015 werecharacterized by a sharp decrease in deposits, falling credit, soaringnon-performing loans, huge losses that banks suffered, and conse-quentially by necessary recapitalizations by foreign owners (includ-ing a state intervention in the case of an important domestic bank).In parallel, foreign parents started to cut the borrowings (in a pro-cess called deleveraging), which continued until this day, so that atend-2015 borrowings constituted only 7.5% of banks’ total liabilities.Deposits finally recovered to their pre-crisis levels in 2015 and atend-2015 stood at their historical maximum. Similarly, the situationfor credit growth and non-performing loans stabilized only in 2015.At the end of 2015, annual credit growth was 0.8% (positive again,after several years), credit-to-deposit ratio was 90.9%, whereas the
354 management · volume 11

Evidence on Economic Growth and Financial Development
share of non-performing loans, although significantly reduced in themeantime, was still in the range 12–13% (data from cbm).
Regarding regulatory standards, the Central Bank of Montenegrohas been following the Basel rules as quickly as possible, whereasthe latest Basel package (so-called Basel iii), i.e. its eu equivalents– capital recruitments regulation and directive (crd iv/crr), shouldbe implemented by the end of 2017, including both law and sub-regulatory acts.
Stock market in Montenegro saw similar developments as bankingsector, except that the crash that followed the peak was extremelysharp (about 80%) and turnovers fell substantially, i.e. the markethas never recovered. The stock market received enormous amountsof fdi money (especially from 2005 to 2007), but due to its shallow-ness, low levels of corporate governance in Montenegrin companiesand weak protection of minority shareholders’ rights, it proved tobe only a field for highly speculative, short-term gain investments.A bubble formed relatively quickly, and could have only survivedhad the massive fdi inflows continued. As that was not possible, thebubble eventually burst, leaving an average boom-time investor withhuge losses. Apart from that, stock market has never really servedas source of financing for companies, and ipos or offerings in gen-eral have been virtually non-existent. An exception is an offering ofgovernment bonds in March 2014, although the government other-wise has satisfied the bulk of its financing needs through so-calledeurobond offerings abroad. Weak financial reporting, undevelopedcorporate governance and weak protection of minority shareholders’rights persist as the most important factors that hinder stock marketgrowth and development even today.
Data and Methodology
In this paper we use quarterly data for 2006–2015 from Montenegro.The data is taken from the Central bank of Montenegro and NationalStatistical Office (nso). The reason why we focus here on data sam-ple from 2006 is the fact that our nso doesn’t provide data from theprevious period on the majority of the variables treated in this paper.It is mostly due to the independence in 2006. The choice of variablesrepresenting financial development indicators are chosen as origi-nally presented in Saci and Holden (2008). Since financial develop-ment is very complex concept, we used many measures of the size offinancial intermediation and of the efficiency of the financial sector.Because of the special characteristics of Montenegrin economy, es-pecially due to the euroization and therefore lack of monetary policy,
number 4 · winter 2016 355
Milena Lipovina-Božovic and Julija Cerovic Smolovic
we had to use some proxy for the data which Montenegrin Centralbank does not produce (for example, monetary aggregates).
cba – The ratio of commercial banks’ assets to all bank assets(commercial banks’ assets + cbm assets) is frequently used as ameasure that indicates an expansion of the financial sector (Levine,Loayza and Beck 2000). It represents a degree to which commercialbanks versus the central bank allocate savings (Levine, Loayza andBeck 2000; Rioja and Velv 2004; Saci and Holden 2008).
dcgdp – Domestic credit to the private sector as a percentage ofgdp is the most frequently used indicator for the level of financialservices. It is one of the main measures of financial developmentused in recent empirical studies (Shan, Morris, and Shan 2005; Zangand Kim 2007). Higher level of this ratio indicates lower transactioncosts and higher levels of financial services and therefore greaterfinancial intermediary development (Saci and Holden 2008).
dcdep – We used the ratio of domestic credit to the private sectorto the total deposits as a proxy for the efficiency of the banking sec-tor. The ratio indicates the degree of efficiency in transferring sav-ings into private investments. Higher ratio implies the more efficientbanks in allocating capital to investors (Lynch 1994).
dep – In order to proxy the measure for the overall size of thefinancial intermediary sector, we used the ratio of deposits to gdp.Liquid liabilities m3 as a percentage of gdp (m3/gdp) is used at Ri-oja and Velv (2004), Saci and Holden (2008), and Cojocaru et al.(2016). This measure indicates the level of the liquidity provided tothe economy.
hs – A structure of the financial system is important informa-tion when analyzing the development level of the financial system.Households’ savings and time deposits to households’ demand de-posits ratio are used to assess the importance of its different com-ponents. Since the households’ demand deposits reflects the func-tion of money as a means of payment, the households’ savings andtime deposits are proxy for the broad money indicator, reflecting theimportance of the savings. Hence, this indicator should give the evi-dence of the country’s level of financial development.
Stock market is one very important component of the finan-cial system in the country. Therefore, to measure its development,we used the ratio of stock market capitalization to gdp. As litera-ture suggests, stock market size is expected to positively associatewith the market ability to allocate capital and manage risk (Arestis,Demetriades, and Luitel 2001; Saci and Holden 2008).
setmc – For measuring stock market size we used the stock ex-
356 management · volume 11
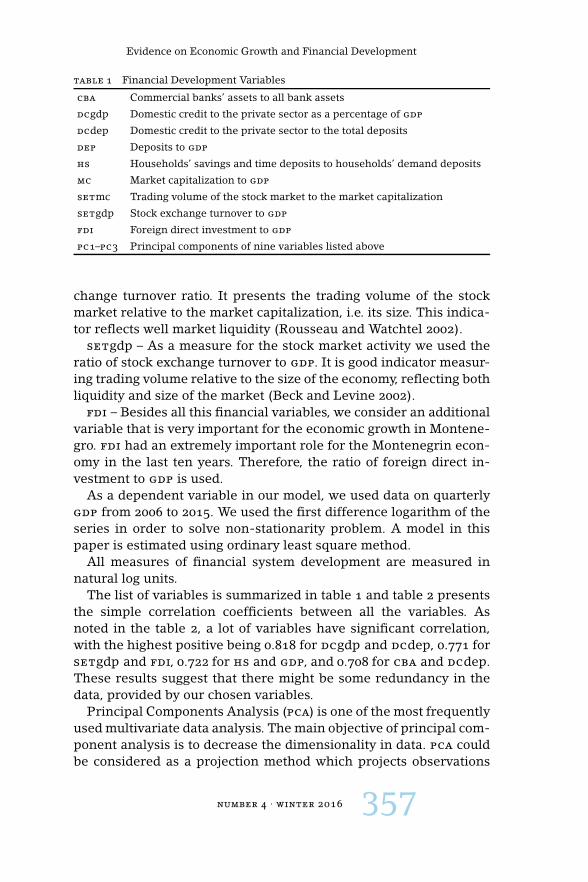
Evidence on Economic Growth and Financial Development
table 1 Financial Development Variables
cba Commercial banks’ assets to all bank assets
dcgdp Domestic credit to the private sector as a percentage of gdp
dcdep Domestic credit to the private sector to the total deposits
dep Deposits to gdp
hs Households’ savings and time deposits to households’ demand deposits
mc Market capitalization to gdp
setmc Trading volume of the stock market to the market capitalization
setgdp Stock exchange turnover to gdp
fdi Foreign direct investment to gdp
pc1–pc3 Principal components of nine variables listed above
change turnover ratio. It presents the trading volume of the stockmarket relative to the market capitalization, i.e. its size. This indica-tor reflects well market liquidity (Rousseau and Watchtel 2002).
setgdp – As a measure for the stock market activity we used theratio of stock exchange turnover to gdp. It is good indicator measur-ing trading volume relative to the size of the economy, reflecting bothliquidity and size of the market (Beck and Levine 2002).
fdi – Besides all this financial variables, we consider an additionalvariable that is very important for the economic growth in Montene-gro. fdi had an extremely important role for the Montenegrin econ-omy in the last ten years. Therefore, the ratio of foreign direct in-vestment to gdp is used.
As a dependent variable in our model, we used data on quarterlygdp from 2006 to 2015. We used the first difference logarithm of theseries in order to solve non-stationarity problem. A model in thispaper is estimated using ordinary least square method.
All measures of financial system development are measured innatural log units.
The list of variables is summarized in table 1 and table 2 presentsthe simple correlation coefficients between all the variables. Asnoted in the table 2, a lot of variables have significant correlation,with the highest positive being 0.818 for dcgdp and dcdep, 0.771 forsetgdp and fdi, 0.722 for hs and gdp, and 0.708 for cba and dcdep.These results suggest that there might be some redundancy in thedata, provided by our chosen variables.
Principal Components Analysis (pca) is one of the most frequentlyused multivariate data analysis. The main objective of principal com-ponent analysis is to decrease the dimensionality in data. pca couldbe considered as a projection method which projects observations
number 4 · winter 2016 357
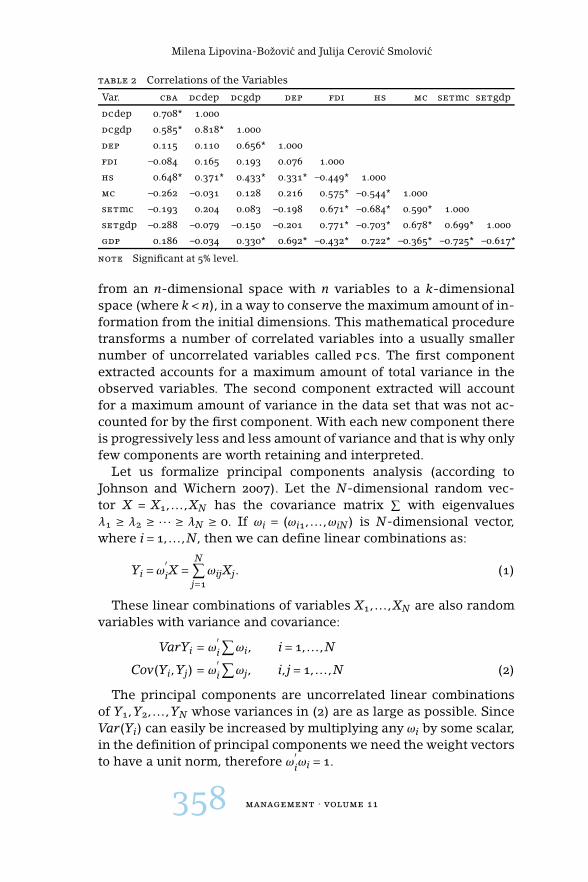
Milena Lipovina-Božovic and Julija Cerovic Smolovic
table 2 Correlations of the Variables
Var. cba dcdep dcgdp dep fdi hs mc setmc setgdp
dcdep 0.708* 1.000
dcgdp 0.585* 0.818* 1.000
dep 0.115 0.110 0.656* 1.000
fdi –0.084 0.165 0.193 0.076 1.000
hs 0.648* 0.371* 0.433* 0.331* –0.449* 1.000
mc –0.262 –0.031 0.128 0.216 0.575* –0.544* 1.000
setmc –0.193 0.204 0.083 –0.198 0.671* –0.684* 0.590* 1.000
setgdp –0.288 –0.079 –0.150 –0.201 0.771* –0.703* 0.678* 0.699* 1.000
gdp 0.186 –0.034 0.330* 0.692* –0.432* 0.722* –0.365* –0.725* –0.617*
note Significant at 5% level.
from an n-dimensional space with n variables to a k-dimensionalspace (where k<n), in a way to conserve the maximum amount of in-formation from the initial dimensions. This mathematical proceduretransforms a number of correlated variables into a usually smallernumber of uncorrelated variables called pcs. The first componentextracted accounts for a maximum amount of total variance in theobserved variables. The second component extracted will accountfor a maximum amount of variance in the data set that was not ac-counted for by the first component. With each new component thereis progressively less and less amount of variance and that is why onlyfew components are worth retaining and interpreted.
Let us formalize principal components analysis (according toJohnson and Wichern 2007). Let the N-dimensional random vec-tor X = X1, . . . ,XN has the covariance matrix
∑with eigenvalues
λ1 ≥ λ2 ≥ ·· · ≥ λN ≥ 0. If ωi = (ωi1, . . . ,ωiN) is N-dimensional vector,where i= 1, . . . ,N, then we can define linear combinations as:
Yi =ω′iX =
N∑
j=1ωijXj. (1)
These linear combinations of variables X1, . . . ,XN are also randomvariables with variance and covariance:
VarYi = ω′i
∑ωi, i= 1, . . . ,N
Cov(Yi,Yj) = ω′i
∑ωj, i, j= 1, . . . ,N (2)
The principal components are uncorrelated linear combinationsof Y1,Y2, . . . ,YN whose variances in (2) are as large as possible. SinceVar(Yi) can easily be increased by multiplying any ωi by some scalar,in the definition of principal components we need the weight vectorsto have a unit norm, therefore ω
′iωi = 1.
358 management · volume 11
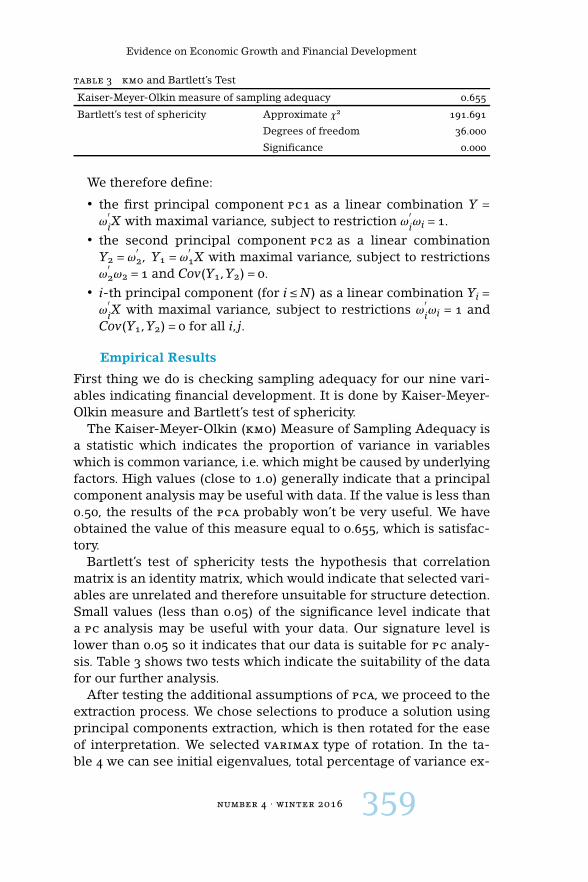
Evidence on Economic Growth and Financial Development
table 3 kmo and Bartlett’s Test
Kaiser-Meyer-Olkin measure of sampling adequacy 0.655
Bartlett’s test of sphericity Approximate χ2 191.691
Degrees of freedom 36.000
Significance 0.000
We therefore define:
• the first principal component pc1 as a linear combination Y =ω
′iX with maximal variance, subject to restriction ω
′iωi = 1.
• the second principal component pc2 as a linear combinationY2 = ω
′2, Y1 = ω
′1X with maximal variance, subject to restrictions
ω′2ω2 = 1 and Cov(Y1,Y2)= 0.
• i-th principal component (for i≤N) as a linear combination Yi =ω
′iX with maximal variance, subject to restrictions ω
′iωi = 1 and
Cov(Y1,Y2)= 0 for all i, j.
Empirical Results
First thing we do is checking sampling adequacy for our nine vari-ables indicating financial development. It is done by Kaiser-Meyer-Olkin measure and Bartlett’s test of sphericity.
The Kaiser-Meyer-Olkin (kmo) Measure of Sampling Adequacy isa statistic which indicates the proportion of variance in variableswhich is common variance, i.e. which might be caused by underlyingfactors. High values (close to 1.0) generally indicate that a principalcomponent analysis may be useful with data. If the value is less than0.50, the results of the pca probably won’t be very useful. We haveobtained the value of this measure equal to 0.655, which is satisfac-tory.
Bartlett’s test of sphericity tests the hypothesis that correlationmatrix is an identity matrix, which would indicate that selected vari-ables are unrelated and therefore unsuitable for structure detection.Small values (less than 0.05) of the significance level indicate thata pc analysis may be useful with your data. Our signature level islower than 0.05 so it indicates that our data is suitable for pc analy-sis. Table 3 shows two tests which indicate the suitability of the datafor our further analysis.
After testing the additional assumptions of pca, we proceed to theextraction process. We chose selections to produce a solution usingprincipal components extraction, which is then rotated for the easeof interpretation. We selected varimax type of rotation. In the ta-ble 4 we can see initial eigenvalues, total percentage of variance ex-
number 4 · winter 2016 359
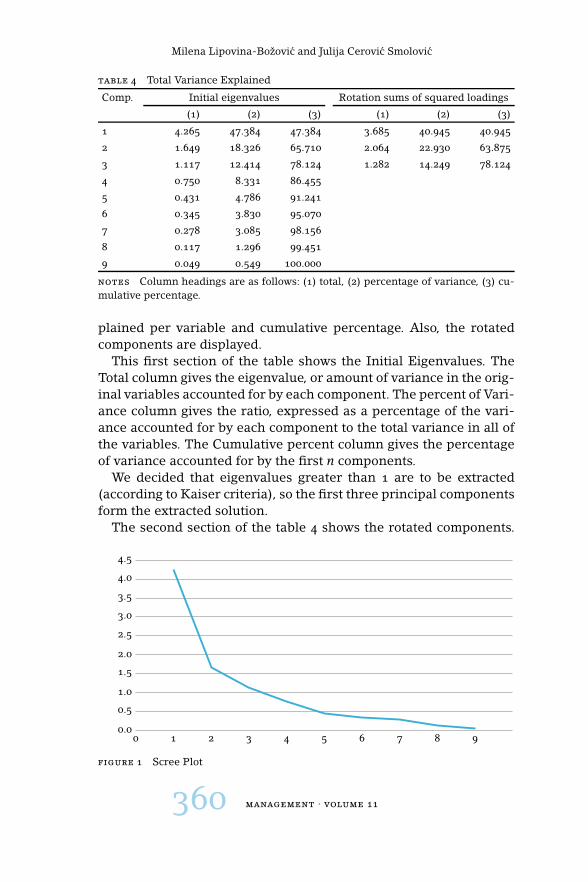
Milena Lipovina-Božovic and Julija Cerovic Smolovic
table 4 Total Variance Explained
Comp. Initial eigenvalues Rotation sums of squared loadings
(1) (2) (3) (1) (2) (3)
1 4.265 47.384 47.384 3.685 40.945 40.945
2 1.649 18.326 65.710 2.064 22.930 63.875
3 1.117 12.414 78.124 1.282 14.249 78.124
4 0.750 8.331 86.455
5 0.431 4.786 91.241
6 0.345 3.830 95.070
7 0.278 3.085 98.156
8 0.117 1.296 99.451
9 0.049 0.549 100.000
notes Column headings are as follows: (1) total, (2) percentage of variance, (3) cu-mulative percentage.
plained per variable and cumulative percentage. Also, the rotatedcomponents are displayed.
This first section of the table shows the Initial Eigenvalues. TheTotal column gives the eigenvalue, or amount of variance in the orig-inal variables accounted for by each component. The percent of Vari-ance column gives the ratio, expressed as a percentage of the vari-ance accounted for by each component to the total variance in all ofthe variables. The Cumulative percent column gives the percentageof variance accounted for by the first n components.
We decided that eigenvalues greater than 1 are to be extracted(according to Kaiser criteria), so the first three principal componentsform the extracted solution.
The second section of the table 4 shows the rotated components.
0.0
0.5
1.0
1.5
2.0
2.5
3.0
3.5
4.0
4.5
0 1 2 3 4 5 6 7 8 9
figure 1 Scree Plot
360 management · volume 11
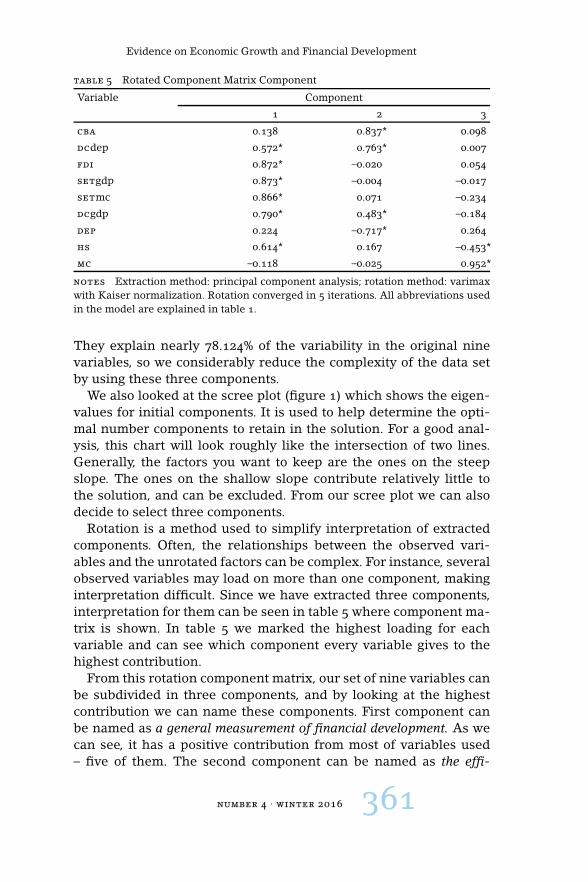
Evidence on Economic Growth and Financial Development
table 5 Rotated Component Matrix Component
Variable Component
1 2 3
cba 0.138 0.837* 0.098
dcdep 0.572* 0.763* 0.007
fdi 0.872* –0.020 0.054
setgdp 0.873* –0.004 –0.017
setmc 0.866* 0.071 –0.234
dcgdp 0.790* 0.483* –0.184
dep 0.224 –0.717* 0.264
hs 0.614* 0.167 –0.453*
mc –0.118 –0.025 0.952*
notes Extraction method: principal component analysis; rotation method: varimaxwith Kaiser normalization. Rotation converged in 5 iterations. All abbreviations usedin the model are explained in table 1.
They explain nearly 78.124% of the variability in the original ninevariables, so we considerably reduce the complexity of the data setby using these three components.
We also looked at the scree plot (figure 1) which shows the eigen-values for initial components. It is used to help determine the opti-mal number components to retain in the solution. For a good anal-ysis, this chart will look roughly like the intersection of two lines.Generally, the factors you want to keep are the ones on the steepslope. The ones on the shallow slope contribute relatively little tothe solution, and can be excluded. From our scree plot we can alsodecide to select three components.
Rotation is a method used to simplify interpretation of extractedcomponents. Often, the relationships between the observed vari-ables and the unrotated factors can be complex. For instance, severalobserved variables may load on more than one component, makinginterpretation difficult. Since we have extracted three components,interpretation for them can be seen in table 5 where component ma-trix is shown. In table 5 we marked the highest loading for eachvariable and can see which component every variable gives to thehighest contribution.
From this rotation component matrix, our set of nine variables canbe subdivided in three components, and by looking at the highestcontribution we can name these components. First component canbe named as a general measurement of financial development. As wecan see, it has a positive contribution from most of variables used– five of them. The second component can be named as the effi-
number 4 · winter 2016 361
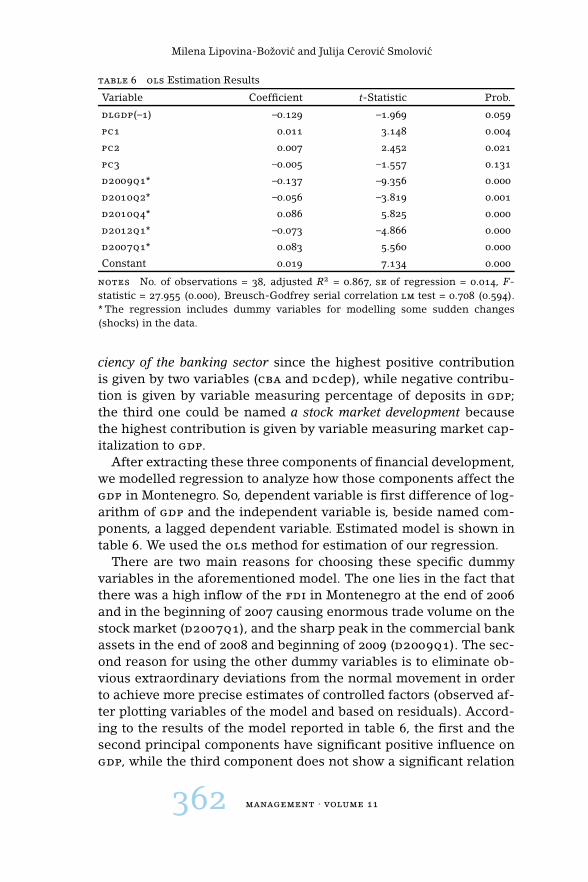
Milena Lipovina-Božovic and Julija Cerovic Smolovic
table 6 ols Estimation Results
Variable Coefficient t-Statistic Prob.
dlgdp(–1) –0.129 –1.969 0.059
pc1 0.011 3.148 0.004
pc2 0.007 2.452 0.021
pc3 –0.005 –1.557 0.131
d2009q1* –0.137 –9.356 0.000
d2010q2* –0.056 –3.819 0.001
d2010q4* 0.086 5.825 0.000
d2012q1* –0.073 –4.866 0.000
d2007q1* 0.083 5.560 0.000
Constant 0.019 7.134 0.000
notes No. of observations = 38, adjusted R2 = 0.867, se of regression = 0.014, F-statistic = 27.955 (0.000), Breusch-Godfrey serial correlation lm test = 0.708 (0.594).* The regression includes dummy variables for modelling some sudden changes(shocks) in the data.
ciency of the banking sector since the highest positive contributionis given by two variables (cba and dcdep), while negative contribu-tion is given by variable measuring percentage of deposits in gdp;the third one could be named a stock market development becausethe highest contribution is given by variable measuring market cap-italization to gdp.
After extracting these three components of financial development,we modelled regression to analyze how those components affect thegdp in Montenegro. So, dependent variable is first difference of log-arithm of gdp and the independent variable is, beside named com-ponents, a lagged dependent variable. Estimated model is shown intable 6. We used the ols method for estimation of our regression.
There are two main reasons for choosing these specific dummyvariables in the aforementioned model. The one lies in the fact thatthere was a high inflow of the fdi in Montenegro at the end of 2006and in the beginning of 2007 causing enormous trade volume on thestock market (d2007q1), and the sharp peak in the commercial bankassets in the end of 2008 and beginning of 2009 (d2009q1). The sec-ond reason for using the other dummy variables is to eliminate ob-vious extraordinary deviations from the normal movement in orderto achieve more precise estimates of controlled factors (observed af-ter plotting variables of the model and based on residuals). Accord-ing to the results of the model reported in table 6, the first and thesecond principal components have significant positive influence ongdp, while the third component does not show a significant relation
362 management · volume 11
Evidence on Economic Growth and Financial Development
to dependent variable. The results of serial correlation lm test aresatisfactory as indicated with Breusch-Godfrey test statistic.
The results presented within our model suggest that economic de-velopment measured by the first difference of natural logarithm ofgdp is positively related to general financial development and the ef-ficiency of the banking sector. Our model did not confirm the positiveinfluence of the stock market development on the economic devel-opment.
We are aware that presented results are limited since our dataset is quite poor. Namely, there are many variables that should beincluded in the model but they are not reported because they areunavailable. For example, data on quarterly real gdp growth are notpublished by Montenegrin national statistical office. Very short timeseries are also a significant obstacle for more advanced econometricmodelling. That is why we decided to employ the simplest model.
Conclusion
In this article, we empirically assess the relationship between finan-cial and economic development in Montenegro from 2006 to 2015.We found this country specific example very interesting becauseMontenegro went through various changes of financial system, start-ing from the transition processes and passing across the financialcrisis, leaving financial system very vulnerable. Since Montenegrinfinancial system is very simple and undeveloped, we wanted to iden-tify the main elements of financial development and to investigatewhich one had the most important role in stimulating economic de-velopment. We employed nine indicators representing our financialsystem and, in order to reduce the multicolinearity problem, we usedthe principal component analysis to extract few measures of the fi-nancial development.
Our results indicated that three of nine components are worth re-taining for the further analysis. The regression results show thatfinancial development has a positive effect on economic develop-ment. Economic development is found to be influenced by generalfinancial development and the efficiency of the banking sector. How-ever, our results are based on a shorter time series so the use ofmore sophisticated econometric techniques is limited for this samplespan. It would be interesting, if additional data is available, to verifyhow the relationship between financial development and economicgrowth will change especially as Montenegrin economy continuesto mature. Moreover, additional research could be done, particularlyin the light of financial development in euroized economy. How-
number 4 · winter 2016 363
Milena Lipovina-Božovic and Julija Cerovic Smolovic
ever, it is the first paper regarding this topic that actually applies toMontenegro.
References
Al-Yousif, Y. K. 2002. ‘Financial Development and Economic Growth:Another Look at the Evidence from Developing Countries.’ Reviewof Financial Economics 11:131–50.
Arestis, P., P. O. Demetriades, and K. Luitel. 2001. ‘Financial Develop-ment and Economic Growth: The Role of Stock Markets.’ Journal ofMoney, Credit and Banking 33:16–41.
Beck, T., and R. Levine. 2002. ‘Stock Markets, Banks and Growth: PanelEvidence.’ Working Paper 9082, National Bureau of Economic Re-search, Cambridge, ma.
Bertrand, M., A. S. Schoar, and D. Thesmar. 2007. ‘Banking Deregulationand Industry Structure: Evidence from French Banking Reforms of1985.’ Journal of Finance 62:597–628.
Cojocaru, E. M., S. D. Falaris, S. Hoffman, and J. B. Miller. 2016. ‘Fi-nancial System Development and Economic Growth in TransitionEconomies: New Empirical Evidence from the cee and cis Coun-tries.’ Emerging Markets Finance and Trade 52:223–36.
Dawson, P. J. 2003. ‘Financial Development and Growth in Economiesin Transition.’ Applied Economic Letters 10:833–36.
Djalilov, K., and J. Piesse. 2011. ‘Financial Development and Growth inTransition Countries: A Study of Central Asia.’ Emerging MarketsFinance & Trade 47:4–23.
Gillman, M., and M. Harris. 2004. ‘Inflation, Financial Development andGrowth in transition Countries.’ Working Paper 23, Department ofEconometrics and Business Statistics, Monash University, Victoria.
Guiso, L., P. Sapienza, and L. Zingales. 2004. ‘Does Local Financial De-velopment Matter?’ Quarterly Journal of Economics 119:929–69.
Johnson, R. A., and D. W. Wichern. 2007. Applied Multivariate StatisticalAnalysis. Upper Saddle River, nj: Pearson.
King, R. G., and R. Levine. 1993. ‘Finance and Growth: SchumpeterMight Be Right.’ Quarterly Journal of Economics 108:717–37.
Koivu, T. 2002. ‘Do Efficient Banking Sectors Accelerate EconomicGrowth in Transition Countries?’ bofit Discussion Paper 14, Bankof Finland, Helsinki.
Levine, R., N. Loayza, and T. Beck. 2000. ‘Financial Intermeditionand Growth: Causality and Causes.’ Journal of Monetary Economics46:31–77.
Lynch, D. 1994. ‘Alternative Measures of Financial Development.’ Cen-tre for Studies in Money, Banking and Finance Paper 5, MacquarieUniversity, Sydney.
Mehl, A., C. Vespro, and A. Winkler. 2005. ‘The Finnance-Growth Nexusand Financial Sector Environment: New Evidence from Southeast
364 management · volume 11
Evidence on Economic Growth and Financial Development
Europe.’ Paper presented at the conference European Economic In-tegration: Financial Development, Integration, and Stability in Cen-tral, Eastern, and South-Eastern Europe, Vienna, 14–15 November.
Neimke, M. 2003. ‘Financial Development and Economic Growth inTransition Countries.’ Working Paper 173, Institute of DevelopmentResearch and Development Policy, Ruhr University, Bochum.
Obradovic, S., and M. Grbic. 2015. ‘Causality Relationship Between Fi-nancial Intermedition by Banks and Economic Growth: Evidencefrom Serbia.’ Prague Economic Papers 24:60–72.
Rioja, F., and N. Valev. 2004. ‘Does One Size Fit All? A Reexamination ofthe Finance and Growth Relationship.’ Journal of Development Eco-nomics 74 (2): 429–47.
Rousseau, P. L., and P. Wachtel. 2002. ‘Equity Markets and Growth:Cross-Country Evidence on Timing and Outcomes, 1980–1995.’ Jour-nal of Business and Finance 24:1933–57.
Saci, K., and K. Holden. 2008. ‘Evidence on Growth and Financial De-velopment Using Principal Components.’ Applied Financial Eco-nomics 18:1549–60.
Schumpeter, J. 2012. The Theory of Economic Development. Cambridge:Harvard University Press.
Shan, J., A. Morris, and F. Sun. 2001. ‘Financial Development and Eco-nomic Growth: An Egg-Chicken Problem?’ Review of InternationalEconomics 9:443–54.
Zang, H., and Y. C. Kim. 2007. ‘Does Financial Development PrecedeGrowth? Robinson and Lucas Might Be Right.’ Applied EconomicsLetters 14:15–9.
This paper is published under the terms of the Attribution-NonCommercial-NoDerivatives 4.0 International (cc by-nc-nd 4.0)License (http://creativecommons.org/licenses/by-nc-nd/4.0/).
number 4 · winter 2016 365

Abstracts in Slovene
Ucinek delovnega stresa in spoprijemanja na organizacijskopravico: empiricna raziskava v turških telekominikacijahin bancništvuTutku Seçkin-Çelik in Ayse Çoban
Cilj pricujocega clanka je raziskati vlogo mehanizmov spoprijemanjain delovnega stresa na delavcevo zaznavanje organizacijske pravice.Raziskava je bila narejena s pomocjo vprašalnika, kjer je sodelovalo211 »belih ovratnikov« – zaposlenih v bancni in telekomunikacijski in-dustriji. Da bi razumeli ucinek mehanizmov spoprijemanja in delov-nega stresa na organizacijsko pravico, smo izvedli multiplo regresijskoanalizo. Rezultati so pokazali, da na splošno zaznavanje pravice nega-tivno vpliva delovni stres in pozitivno vplivajo mehanizmi spoprijema-nja, razen na custva osredotoceno spoprijemanje. So pa poddimenzijeorganizacijske pravice pokazale znacilne odnosne vzorce. Zato smosklenili, da pri delavcevem zaznavanju organizacijske pravice irgajovlogo tako posamezne kot organizacijske dolocilnice.
Kljucne besede: organizacijska pravica, delovni stres, spoprijemanje,telekomunikacije, bancništvoManagement 11 (4): 271–287
Kako milenijci dojemajo svoje delodajalce in kako to vplivana njihovo delovno etiko? Raziskava v Hong KonguTsun-Lok Kwong
Delovna etika zaposlenih milenijcev v Hong Kongu zbuja veliko pozor-nosti. Pricujoci clanek raziskuje, kako milenijci dojemajo svoje delo-dajalce oz. kako to vpliva na njihovo delavno etiko. Anketa, na kateroje odgovorilo 212 milenijcev, je pokazala, da milenijci na splošno svojedelodajalce dojemajo pozitivno in prisegajo na dobro delovno etiko.Dve spremenljivki - percepcija in delovna etika - sta pomembno pove-zani. Raziskava je tudi razkrila, da milenijci v Hong Kongu izkazujejonenavadne interpretacije dela in prostega casa ter dela in uspeha. Re-zultati namigujejo na to, da bi na te interpretacje lahko vplivali starši,izobraževalni sistem in sodobno delovno okolje.
Kljucne besede: milenijci, delovna etika, percepcija, psihološkapogodba, Hong KongManagement 11 (4): 289–308
Upravljanje akademsko-industrijske mrežeSergej Gricar in Barbara Rodica
Namen pricujoce študije je razpravljanje o pomembnosti sodelovanjain locevanja med akademijo in industrijo. Partnerstvo med akademijo
number 4 · winter 2016 367
Abstracts in Slovene
in industrijo je uresnicljiv dejavnik, ki vpliva na inovacije na podro-cju prehoda študentov na zaposlitveni trg. Empiricno gradivo je bilozbrano in analizirano na podlagi podatkov, ki jih je zbral Javni skladRepublike Slovenije za razvoj kadrov in štipendije. Podatki se nana-šajo na vec akademsko-industrijskih mrežnih projektov, ki jih je finan-cirala prej omenjena organizacija. Anketna študija primera zacrta štiriprimere projektov, ki jih je izvajala Fakulteta za podjetništvo, mana-gement in informatiko. Rezultati razkrijejo prizadevanja za izmenjavoznanja in izkušenj, kar bi pomagalo industriji, da postane kompetitiv-nejša, hkrati pa omogocilo študentom boljšo zaposljivost in kariernemožnosti.
Kljucne besede: akademija, industrija, inovacija, študija primeraManagement 11 (4): 309–326
Pripravljenost Evropske Unije na cetrto industrijsko revolucijoÉva Kuruczleki, Anita Pelle, Renáta Laczi in Boglárka Fekete
Znanje je v razvitih gospodarstvih postalo kljucen dejavnik produkcijerazvite ekonomije in ker so ljudje nosilci in uporabniki znanja, izku-šeni cloveški viri pridobivajo podobno velik pomen. Ti napredki so ele-menti znatnih sprememb, ki karakterizirajo cetrto industrijsko revolu-cijo - fenomen, vreden preucevanja v potankostih. Evropska unija seje eksplicitno zanimala za premik k ekonomiji znanja od lisbonskegasummita leta 2000 dalje. Vec kot desetletje in pol kasneje lahko preu-cimo pripravljenost EU, da sprejme na znanju temeljeco cetrto indu-strijsko revolucijo. Tega se lotimo z oblikovanjem indeksa, osnovanegana razlicnih povezanih podatkih.
Kljucne besede: 4. industrijska revolucija, na znanju temeljecegospodarstvo, cloveški kapital, Evropska unijaManagement 11 (4): 327–347
Dokazi o ekonomski rasti in financnem razvoju v Crni goriMilena Lipovina-Božovic in Julija Cerovic Smolovic
Makroekonomska rast mora biti podprta s stabilnim in ucinkovitim fi-nancnim sistemom. Ko analiziramo odnos med rastjo in financnim ra-zvojem, zasledimo mnoge razlicne razvojnofinancne ukrepe. V clankubomo identificirali mnoge pomembne pokazatelje financnega razvojav Crni gori. Glede na dejstvo, da se je v zadnjem desetletju crnogor-ski financni trg razvijal, želimo ugotoviti, ali je to dejstvo vplivalo nagospodarsko rast pa tudi ali obstaja pomemben pozitiven odnos medrastjo in financnim razvojem. Namen pricujocega clanka je uporabaosnovnih komponent z namenom preucitve korelacije med indikatorjiin najti sredstva oz. glavne komponente. Prednost te tehnike je prikazsplošnejših ukrepov financnega razvoja namesto individualnih spre-menljivk bancnega razvoja oz. razvoja delniškega trgov. Zakljucimo
368 management · volume 11
Abstracts in Slovene
lahko, da je težko identificirati specificne komponente financnega sis-tema, najpogosteje povezane z gospodarsko rastjo.
Kljucne besede: gospodarska rast, financni razvoj, analiza glavnihkomponentManagement 11 (4): 327–347
number 4 · winter 2016 369