Embed Size (px)
Citation preview

VOLUME 1


TABLE OF CONTENTS
1. INTRODUCTION 1
2. CAPACITY — DEMAND EQUATION 2
3. THE METHODOLOGY 5
4. THE RESULTS 8
5. ACCOMMODATING DEMAND —A MORE CO-OPERATIVE APPROACH 10
6. KEY MESSAGES 11
7. APPENDIX ACONSTRAINTS TO GROWTH ON TRAFFIC FLOW SEGMENTS A-1
8. APPENDIX BGEOGRAPHICAL ANALYSIS OF UNACCOMMODATED DEMAND B-1


1
1. IN T R O D U C T I O N
In response to concern over increasing air traffic delays in Europe, ECAC Dire c t o r sGeneral presented a paper entitled “Constraints to Gro w t h ”1 to Tr a n s p o rt Ministers at theM AT S E / 62 meeting in January 2000. The paper provided an overview of the eff e c t sarising from the task of providing sufficient capacity to cope with the growth in air traffic.
The paper made clear its underlying principle “that air transport infrastru c t u re – in thef o rm of airport and ATM provision – should be made available at a reasonable cost andq u a l i t y, in accordance with the needs of safety and sustainable development, by thoseauthorised and able to supply it, for the benefit of those who bear the costs”. It re c o g n i s e dthe imbalance between air traffic demand and ATM and airport capacity, that re m e d y i n gthis imbalance would need to take account of the wider implications and consequences ofi n c reasing capacity, and set out some ideas of what might be done to find solutions toaccommodate the growing demand for air transport. The paper identified incre a s i n gsafety concerns, the shortage of air traffic controllers, growing congestion at airports ande n v i ronmental constraints as particular areas of concern .
Ministers endorsed the paper and decided further work was re q u i red to establish theimplications and consequences – with particular re g a rd to safety; enviro n m e n t ;i n t e rmodality; cost; financing and practical matters – of continuing to increase capacity inline with forecast demand. They requested ECAC Directors General and EUROCONTROLto undertake – in co-operation with the various stakeholders – a detailed study of thesematters, giving due consideration to the re q u i rements of sustainable development, and tomake recommendations on the way forw a rd .
1 M AT S E / 6 - D P / 82 ECAC Tr a n s p o rt Ministers on the Air Tr a ffic System in Eu rope — 6th meeting3 E n l a rged for the purposes of the study to include re p resentatives from Belgium, Sweden, and the Euro p e a n
Commission in addition to the regular members from the Czech Republic, Finland, France, Germ a n y, Romania,Switzerland and the United Kingdom. ACI-Europe, AEA and IATA also participated fully in EMTO’s work.
This re p o rt by the ECAC Medium Te rm Objectives (EMTO) gro u p3 re p resents the firststep in meeting Ministers’ remit, by taking stock of the situation concerning thecapacity-demand equation and its possible evolution. The second step – which willbe the task of the Collaborative Forum of Stakeholders (see Section 5) – will be toanalyse the ability of the air transport system to cope with future demand ando v e rcome constraints to growth, and to set orientations in order to make efficient useof planned airport and ATM capacity.

2
2. CA PA C I T Y — DE M A N D EQ U AT I O N
D e m a n dAccurately forecasting demand is extremely difficult. In the past, the overall rate of traff i cg rowth has tended to match or exceed the highest forecasts: in the past 10 years, therehave been 64 million Instrument Flight Rules (IFR) flights in the ECAC area. However, thelevel of demand varies geographically. Ultimately, actual growth will be determined byhow much and where passengers want to fly. The rapid growth of low cost carr i e r s ,generally operating between less fashionable secondary airports, illustrates the type ofdevelopment that can have a significant effect on traffic levels on particular routes. Themain driver of increasing demand is economic growth: economic forecasts provide thebasis for traffic forecasts. However, the longer the forecast period, the less re l i a b l eeconomic forecasts are likely to be. And whilst the link between economic growth andt r a ffic growth is clear, the precise correlation may vary. Overall, traffic in the ECAC are ahas more than doubled in the past 10 years (see Appendix A). But it is, for example,unclear when particular market segments will reach maturity or what new markets maydevelop. According to EUROCONTROL’s modelling work for this study, the demand in theyear 2020 will reach 23 million IFR flights, and the aggregate demand over the next 20years may amount to around 317 million IFR flights.
The sustained growth in demand has led airlines to give increasing attention to how theycan maximise the effectiveness of their networks by improving linkages with other modes,p a rticularly high speed rail. Intermodality for passengers is perhaps best defined ascombining diff e rent modes of transport in a seamless travel experience. There are variousaspects: access to airports by rail – e.g the Heathrow Express; substitution, which isrealistically limited to short or medium haul journeys of up to three hours duration; andc o m p l e m e n t a r i t y, for example where schedules are co-ordinated to facilitate an outwardleg by air and the re t u rn leg by train, e.g. between London and Paris. The key drivers ofi n t e rmodality are: time, fre q u e n c y, fare stru c t u re, comfort, convenience and journ e ypurpose. At present, only seven European airports have a high speed rail link and at least28 have a reasonable rail link. So far, there are very few examples of intermodal co-operation. Most of these are limited to bilateral co-operation at a local or national level,but there are signs that things are changing, evidenced, for example, by the co-operationbetween SNCF and United Airlines.
H o w e v e r, widespread intermodality of the type where demand for airport capacity wouldencourage the diversion of short journeys to rail, leading to the freeing up of slots atcongested airports, is some way off. In order to achieve this, legal, political, re g u l a t o ryand physical barriers to pro g ress need to be identified and addre s s e d .
C a p a c i t yAs traffic levels continue to increase, the ability of the air transport system to cope with demandis becoming an ever more critical factor. In recent years the public debate has focused on thelack of airspace capacity in Europe. But for air transport, capacity cannot be defined in term sof airspace alone and the term has diff e rent meanings for the diff e rent players involved.Capacity is determined by the whole chain of events that make up the air transport system,including the need to ensure safety and to protect the environment. For the purposes of thiss t u d y, the unit used as a measure of capacity is the number of aircraft movements per hour.This was the simplest way of comparing airport and ATM capacity. However, the mechanismsbehind this simple perf o rmance indicator are of considerable complexity.
• Airline CapacityFor the airlines, ‘capacity’ is measured in Available Seat-Km (ASKs), and fort r a ffic as a whole, Available Tonne-Km (ATKs). Airlines provide capacity inresponse to a perceived market demand, as determined by their fore c a s t e r sand strategists. In an industry that has grown almost every year since 1945,

3
the trend is for capacity to increase, either through fleet expansion or thro u g hm o re intensive use of existing re s o u rc e s .
Fleet decisions may include questions of aircraft size; in a market-drivene n v i ronment, downsizing is as legitimate a strategy as the more usualtendency to replace obsolete aircraft with larger units. Euro p e a nliberalisation, bringing increased competition and the development of hub-and-spoke networks, has emphasized frequency of service and thep roliferation of feeder routes, resulting in downward pre s s u re on averagea i rcraft size. The airline industry, at best only marginally profitable, is acutelysensitive to imbalances between capacity and demand, but at the same timehas to make fleet decisions with a significant lead-time, putting a premium onaccurate forecasting and appropriate strategic choices.
• Airport CapacityThe capacity of an airport can be limited by the constraints on either air traff i cmovements or terminal passenger numbers. At diff e rent times of the day thelimiting constraint may change from one to the other aspect of the airport .Congested airports are generally co-ordinated and the function of the co-o rdinators is to limit the number of available slots to balance the most re s t r i c t i v econstraint. The maximum aircraft movement rate can be determined by manyfactors including airfield layout (runways, taxiways and stands), air traff i cc o n t rol pro c e d u res, scheduled aircraft mix, ground handling operations,m e t e o rological conditions and environmental considerations. These factors,together with the policy of individual airports on delays, will determine thec a p a c i t y. The terminal capacity can be limited by the staffing or supporti n f r a s t ru c t u re of any aspect of passenger processing. Some of these factorscan be accurately assessed, while others are difficult to quantify and aresubject to rapid change. An individual airport capacity will make specificassumptions in the process of its capacity declaration. It is important torecognise that comparisons between airports are inevitably affected by the lackof standardisation in these practices: for example, one airport may accept anaverage delay of three minutes while another may accept five minutes forsetting the number of available airport slots.
Capacity in the air in the immediate vicinity of an airport and the ability ofthe airport air traffic control system and its runway approach facilities tomanage traffic to and from the runways may also have a bearing on generala i r p o rt capacity. Capacity on the ground must match the capacity in the airand vice versa: only a coherent approach addressing all the elements ofcapacity will result in an overall improvement in airport capacity.
Airside: it is not the runway system and more generally the movement are aalone that produces figures for hourly output: safety, security, operational andeven non-operational restrictions have a direct impact on the time between ana i rcraft landing and it leaving the airport, as do airline scheduling andhandling pro c e d u res.
Landside: adequate access to the airport, facilitation and re s o u rces arere q u i red to meet demand. At a number of airports, this challenge should notbe underestimated, as certain terminal management conditions can lead tocongestion, slow processing of passengers and consequent delays.
Both passport and security controls need adequate re s o u rces to cope with thedemand, and need to be fully co-ordinated with the airport operator in ord e rto create an efficient facilitation environment while maintaining the highestlevel of security. However, it should be borne in mind that airport operatorsmay not have much control over the provision of services that are often theresponsibility of the national authorities.

4
E n v i ronmental constraints have increasingly become an integral part ofa i r p o rt capacity. In recent years, the imposition of measures such asrestrictions on operations at night and limits on annual traffic has becomem o re widespread due to growing concern from those living in the vicinity ofmany European airports. Such restrictions are fundamental when consideringhow to increase airport capacity to meet demand.
• Airspace CapacityAirspace capacity, which may be described as the quantity of aircraft that canbe accommodated in time and space, varies for the diff e rent types of airspacethat exist on an airc r a f t ’s route between its depart u re and arrival airport. Atall times, the principal re q u i rement is to maintain safe separation – horizontaland vertical – between aircraft. Factors that affect the separation distances –horizontal or vertical – include the quality, accuracy and reliability of airc r a f tequipment and facilities available to the controller – such as radar – fore ffecting separation. The provision of radar surveillance facilities may itselfbe affected by terrain or surface conditions such as water, given the curre n tlimits of ground-based air navigation infrastru c t u re. Whilst measures such asflow management can help to manage re s o u rces efficiently and incre a s ec a p a c i t y, ATM depends upon the provision of a certain level of re s o u rc e s ,p a rticularly a sufficient number of trained controllers. Capacity is alsoconstrained by the maximum number of flights a controller can handles i m u l t a n e o u s l y, which depends on airspace organisation, ATC pro c e d u re sand automated support tools available. When workload becomes excessivein a sector, capacity can be increased in the short term by splitting the sectoror re a rranging sectorisation, provided that enough working positions, trainedair traffic controllers, radio frequencies, and transponder codes are available.
The fragmentation of airspace according to national boundaries and thedesign of the route stru c t u res and the overlaid sectors into which airspace isdivided can affect capacities. In the en-route phase of flight, where theairspace is designed to accept aircraft in transit, horizontal separationdistances may vary greatly depending on the equipment and pro c e d u re savailable for effecting separation. This in turn limits the airspace capacity.The constraints of areas inside and bordering Europe are also a factor limitingthe capacities of airspaces within the ECAC area. More o v e r, all airspacecapacities may be reduced by weather conditions such as poor visibility, cloudand thunderstorms. Last but not least, in some countries more than in others,m i l i t a ry airspace re q u i rements still impose a significant airspace capacityconstraint on civil IFR traff i c .
5
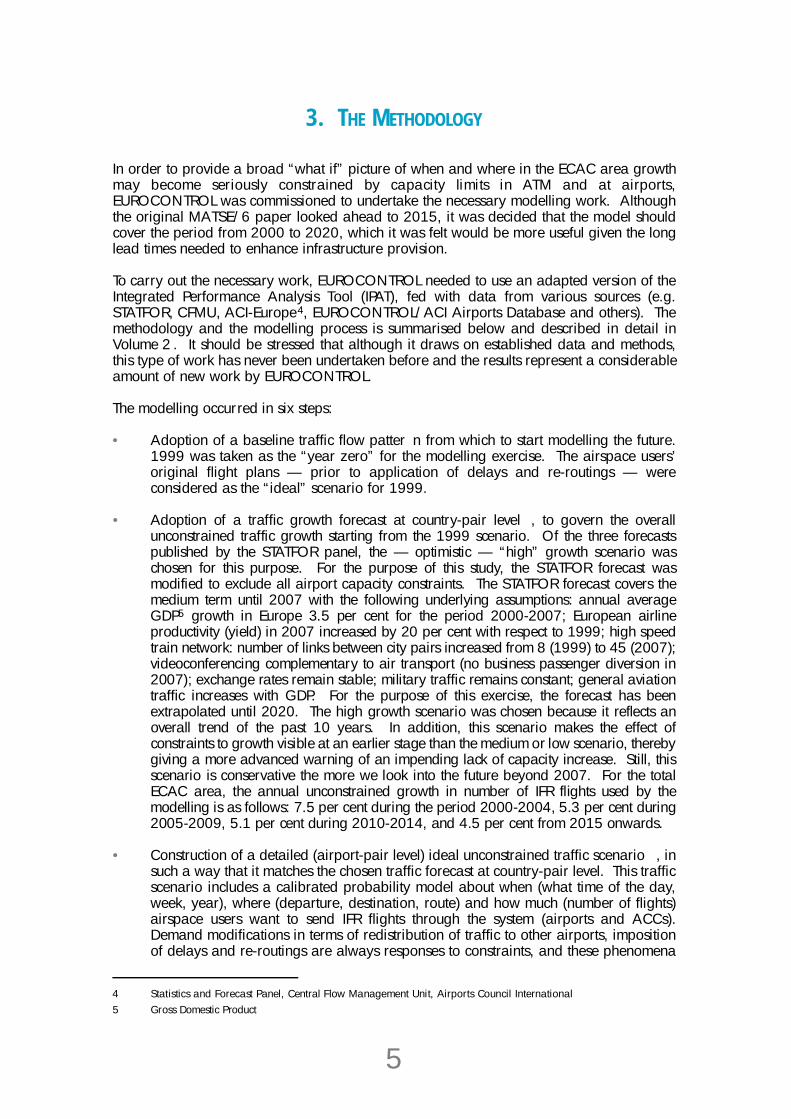
3. TH E ME T H O D O L O G Y
In order to provide a broad “what if” picture of when and where in the ECAC area growthmay become seriously constrained by capacity limits in ATM and at airport s ,EUROCONTROL was commissioned to undertake the necessary modelling work. Althoughthe original MATSE/6 paper looked ahead to 2015, it was decided that the model shouldcover the period from 2000 to 2020, which it was felt would be more useful given the longlead times needed to enhance infrastructure provision.
To carry out the necessary work, EUROCONTROL needed to use an adapted version of theIntegrated Performance Analysis Tool (IPAT), fed with data from various sources (e.g.STATFOR, CFMU, ACI-Europe4, EUROCONTROL/ACI Airports Database and others). Themethodology and the modelling process is summarised below and described in detail inVolume 2 . It should be stressed that although it draws on established data and methods,this type of work has never been undertaken before and the results represent a considerableamount of new work by EUROCONTROL.
The modelling occurred in six steps:
• Adoption of a baseline traffic flow patter n from which to start modelling the future.1999 was taken as the “year zero” for the modelling exercise. The airspace users’original flight plans — prior to application of delays and re-routings — wereconsidered as the “ideal” scenario for 1999.
• Adoption of a traffic growth forecast at country-pair level , to govern the overallunconstrained traffic growth starting from the 1999 scenario. Of the three fore c a s t spublished by the STATFOR panel, the — optimistic — “high” growth scenario waschosen for this purpose. For the purpose of this study, the STATFOR forecast wasmodified to exclude all airport capacity constraints. The STATFOR forecast covers themedium term until 2007 with the following underlying assumptions: annual averageG D P5 g rowth in Europe 3.5 per cent for the period 2000-2007; European airlinep roductivity (yield) in 2007 increased by 20 per cent with respect to 1999; high speedtrain network: number of links between city pairs increased from 8 (1999) to 45 (2007);v i d e o c o n f e rencing complementary to air transport (no business passenger diversion in2007); exchange rates remain stable; military traffic remains constant; general aviationt r a ffic increases with GDP. For the purpose of this exercise, the forecast has beenextrapolated until 2020. The high growth scenario was chosen because it reflects anoverall trend of the past 10 years. In addition, this scenario makes the effect ofconstraints to growth visible at an earlier stage than the medium or low scenario, there b ygiving a more advanced warning of an impending lack of capacity increase. Still, thisscenario is conservative the more we look into the future beyond 2007. For the totalECAC area, the annual unconstrained growth in number of IFR flights used by themodelling is as follows: 7.5 per cent during the period 2000-2004, 5.3 per cent during2005-2009, 5.1 per cent during 2010-2014, and 4.5 per cent from 2015 onward s .
• Construction of a detailed (airport-pair level) ideal unconstrained traffic scenario , insuch a way that it matches the chosen traffic forecast at country-pair level. This trafficscenario includes a calibrated probability model about when (what time of the day,week, year), where (departure, destination, route) and how much (number of flights)airspace users want to send IFR flights through the system (airports and ACCs).Demand modifications in terms of redistribution of traffic to other airports, impositionof delays and re-routings are always responses to constraints, and these phenomena
4 S t a tistics and F o recast Panel, Central Flow Management Unit, Ai r p o rts Council In t e rn a t i o n a l5 Gross Domestic Product

6
have therefore by definition been excluded from the “ideal unconstrained trafficscenario”. It has to be emphasized that this detailed scenario has to be interpreted asa “reasonable assumption” on the expansion of air traffic demand as expected anddesired by the airspace user community to maintain and develop the growth of theirbusiness, in line with current trends.
• Introduction of “constraints to growth” by means of the potentially limiting influenceof the existing, committed capacity enhancement plans of the airport operators andthe ATM service providers.
• Identification of capacity shortfalls in terms of their location, magnitude, time of dayand duration (number of days per year).
• Determination of the annual accommodated demand — the maximum number offlights that can be scheduled by airspace users under the given capacity conditions,taking all network effects into account.
The focus of the modelling has entirely been on assessing levels of “accommodated demand”,rather than “delay”, a parameter which is only meaningful when capacity shortfall is re l a t i v e l ys m a l l6. Delay level assessments are within the realm of other (short/medium term) studies andre q u i re a diff e rent modelling approach than the one used here .
The airport capacity enhancement plans used in the study are those of the Airports Databaseand those communicated to EUROCONTROL at the request of EMTO before the deadline ofNovember 2000. This data comprises hourly capacities for 107 airports, which togetherhandle approximately 85 per cent of the ECAC IFR traffic. This data describes plans withdifferent time horizons, in a few cases up to 2010. For ATM capacity, the modelling hasused hourly capacities for 64 ACCs7 . The time horizon of this data includes currentlyplanned capacity increases up to 2005.
Of course some of this information may not be the very latest, or the capacity plans of a fewindividual airports and/or ACCs may have changed since the inputs to the study werefrozen. This does not invalidate the results or imply the need to rerun the modelling.Although changes at individual unit level may have a significant impact locally, they wouldhardly affect the overall picture at ECAC level.
Rather than attempting to draw conclusions from the processing of limited traffic samples,the chosen modelling approach was based on simulating traffic densities for all of Europe in1-hour increments for complete 12-month periods. Such an approach has never been usedbefore, but was deemed necessary because past analysis has made clear there is no single“busiest time of the day and year” in Europe that is valid for all routes, ACCs and airports.They all have their own unique daily and seasonal traffic patterns, interlinked via complexnetwork effects.
The modelling was executed for five snapshot years, namely 2000, 2005, 2010, 2015 and2020. In essence, the process consisted of translating the unconstrained annual demandinto a corresponding number of departure, en-route and arrival “slots” needed during eachhour of the day, throughout the year, for each airport and ACC, taking all network effectsinto account. This demand for airport and ACC “slots” was constantly compared to thehourly airport and ACC capacities scheduled to be available in that year. The simulationkept track of how many days a year the capacity of individual airports and ACCs wasexceeded (seasonal effects), and all “excess demand” was topped off and set aside as
6 The line between delayed accommodated demand and unaccommodated demand cannot always be drawn veryclearly. This study uses the rule of thumb that all demand which exceeds capacity by more than 5 per cent should beconsidered as unaccommodated demand, i.e. flights which would not even be scheduled.
7 As per Local Conversion and Implementation Plan (LCIP), developed in co-ordination between air traffic serviceproviders and EUROCONTROL and as submitted to the EUROCONTROL Provisional Council, information dated 7November 2000.

7
“unaccommodated demand” for each airport, ACC and airport-pair traffic flow. By dividingthe annual unaccommodated demand statistic for a given hour by the number of days witha capacity shortfall during that hour, it has been possible to determine the “average” extrahourly capacity that might be necessary above existing airport and ACC capacityenhancement plans.
The model also includes annual capacity limitations for a number of airports. These mightarise from environmental constraints for example. Over time, such constraints may turn outto become a more constraining factor than the hourly capacity limits. This effect is shownby an additional line in the annual demand diagrams for (some) airports (see Volume 2 ).However, the accuracy of the available data could not be verified, and for this reason it wasdecided to deliberately exclude annual constraints from the integrated airport pairmodelling, i.e. the network effect analysis of unaccommodated demand. That network effectmodelling has been performed for the various possible hourly constraint combinations:
• No capacity constraints at all (unconstrained demand)
• All ACC constraints removed, i.e. network effect of hourly airport capacity plans only
• All airport constraints removed, i.e. network effect of hourly ACC capacity plans only
• Combined network effect of hourly airport and ACC capacity plans.
The results have been aggregated to show the total ECAC effect of hourly constraints, as wellas the effect in various traffic flow segments.
The modelling is ambitious, both geographically and in terms of the extended timeframe. Itdoes not aim to provide perfect answers in those cases where the difference betweendemand and capacity is very small. This is within the scope of other short to medium termstudies. More importantly, the results are determined by the quality of the input assumptions,and need to be treated with caution in those cases where they are highly dependent uponthe assumptions. That is true, for example, for the magnitude of the unaccommodateddemand or required additional capacity, which will vary greatly with any change to theunconstrained scenario.
The opposite is true for the “accommodated demand” modelling results, which are primarilydetermined by the capacity assumptions, and very little influenced by the choice ofunconstrained scenario. It should be emphasized, however, that the modelling only takesaccount of planned capacity enhancements up to 2005 (with the exception of a limitednumber of airports, plans of which extend to 2010) – no capacity enhancements have beenassumed unless notified. This is because it was decided that, in the absence of data, nogeneral assumptions should be made about capacity enhancements, in order to make clearthe potential scale of the problem if – an extremely unlikely scenario – no further capacityimprovements were made. In fact, the primary aim of the modelling is to provide guidanceas to which levels of further capacity improvements might be appropriate beyond currentplanning, rather than to criticize the adequacy of existing capacity plans within their timehorizon. Factors such as the use of larger aircraft and shift to regional airports could beuseful strategies to accommodate increased demand, depending on commerc i a lconsiderations. So the modelling intentionally represents a “worst case” scenario from thepoint of view of the capacity providers.
There will inevitably be arguments about the precise scenarios for individual airports andACCs, and about how quickly constraints will begin to bite. For example, in its purist sense,unaccommodated demand means flights that would be undertaken if no constraints werepresent but which cannot be made because of those constraints. However, a limited amountof this demand may, in reality, as it is already, be accommodated, albeit at the expense ofincreasing delays or extra route lengths. But there is a point at which the delay s i t u a t i o nbecomes so critical that further traffic growth can no longer be absorbed at all. The studydeals mostly with situations where the point of acceptable delay is far exceeded.

8
4. TH E RE S U LT S
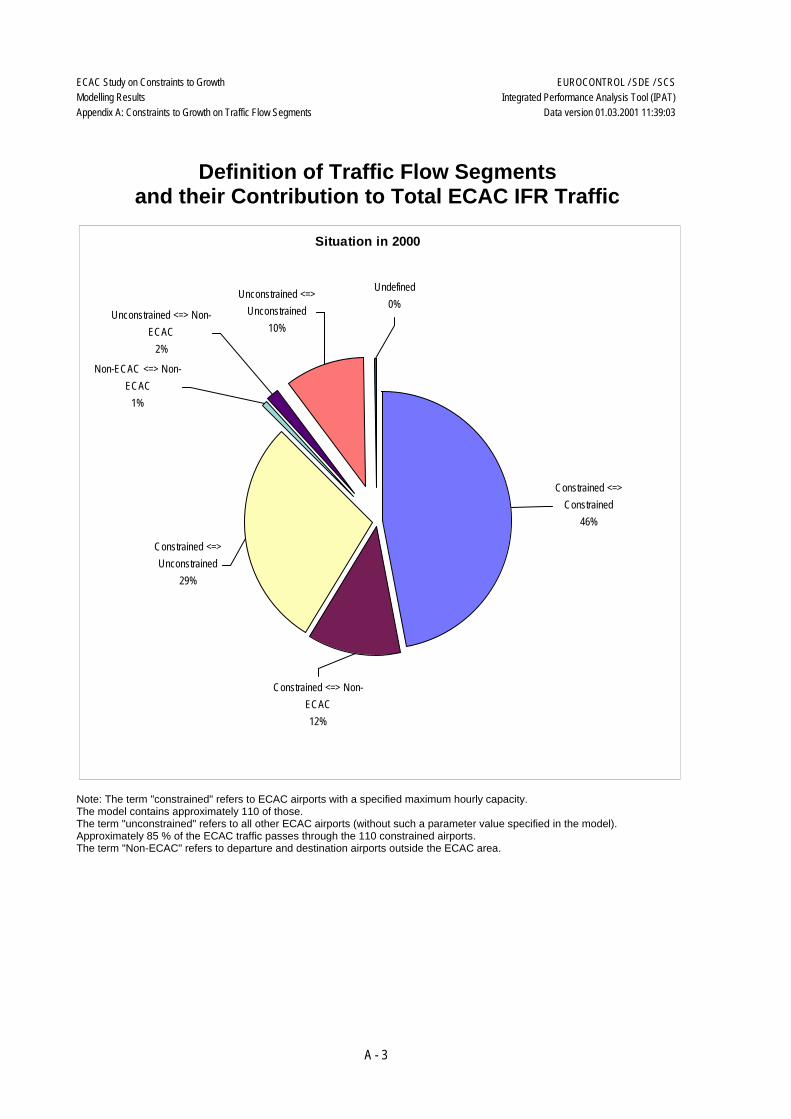
The data can be presented in a range of formats. EMTO decided the results would bestbe presented in an aggregated way in this re p o rt. A series of graphs and chart shighlighting trends that could emerge during the study period are appended. The piec h a rt on page A-3 sets out the pro p o rtions of traffic operating between various categoriesof airport in 2000. The graph and table on page A - 4 p rovide an overview of the totalannual demand for traffic flows between all airport pairs in the ECAC region. Thiso v e rview is broken down between: constrained8 ECAC airports; constrained andunconstrained ECAC airports; unconstrained ECAC airports; constrained ECAC airport sand non-ECAC airports; unconstrained ECAC airports and non-ECAC airports; and non-ECAC airports. Pages A-4 t h rough A - 1 0 p rovide detail on each of those segments. Thetable starting on p a g e B - 3 p rovides distributions – in 2005, 2010, 2015 and 2020 – ofall major airports and ACCs that theoretically fail to accommodate 3,500 or more flightsper year: only those airports/ACCs where the number of unaccommodated flights isequivalent to 5 per cent or more of the total annual number of unconstrained movementsp roduced by the model are included (which might be termed “significant”unaccommodated demand). This analysis is also included in the form of separate listingsfor ACCs (starting page B - 9) and airports (page B-12 and following).
The following table, drawn from the modelling results, provides an overview of themagnitude of the increasing gap between capacity and demand:
Year Total annual Constraint Total annual Total annual Total annual unconstrained type accommodated unaccommodated unaccommodated movements movements movements movements as a
percentage of total annual unconstrained movements
2 0 0 0 8 , 7 3 0 , 0 0 0 A i r p o rt s 8 , 6 5 2 , 0 0 0 7 8 , 0 0 0 1AT M + A i r p o rt s 8 , 6 5 2 , 0 0 0 7 8 , 0 0 0 1
2 0 0 5 1 1 , 9 9 5 , 0 0 0 A i r p o rt s 1 1 , 2 5 7 , 0 0 0 7 3 8 , 0 0 0 6AT M 1 1 , 8 8 2 , 0 0 0 1 1 3 , 0 0 0 1AT M + A i r p o rt s 1 1 , 1 9 7 , 0 0 0 7 9 8 , 0 0 0 7
2 0 1 0 1 5 , 1 5 9 , 0 0 0 A i r p o rt s 1 3 , 2 1 8 , 0 0 0 1 , 9 4 1 , 0 0 0 1 3AT M 1 4 , 1 1 2 , 0 0 0 1 , 0 4 7 , 0 0 0 7AT M + A i r p o rt s 1 2 , 8 4 0 , 0 0 0 2 , 3 1 9 , 0 0 0 1 5
2 0 1 5 1 9 , 0 4 8 , 0 0 0 A i r p o rt s 1 5 , 0 7 9 , 0 0 0 3 , 9 6 9 , 0 0 0 2 1AT M 1 5 , 6 4 9 , 0 0 0 3 , 3 9 9 , 0 0 0 1 8AT M + A i r p o rt s 1 4 , 0 8 1 , 0 0 0 4 , 9 6 7 , 0 0 0 2 6
2 0 2 0 2 3 , 3 2 4 , 0 0 0 A i r p o rt s 1 6 , 7 2 5 , 0 0 0 6 , 5 9 9 , 0 0 0 2 8AT M 1 6 , 6 2 1 , 0 0 0 6 , 7 0 3 , 0 0 0 2 9AT M + A i r p o rt s 1 4 , 8 9 7 , 0 0 0 8 , 4 2 7 , 0 0 0 3 6
8 It should be noted that here “constrained” does not necessarily mean “congested” from day one onwards. The firstyear of congestion and extent to which demand exceeds constraints varies from airport to airport .

9
In 2 0 0 0, according to the model, less than one per cent of movements are“unaccommodated”. However, this low result needs to be treated with caution because itis too close to the baseline year of 1999. In practice it seems that any theore t i c a lunaccommodated demand is currently being absorbed, mainly through increasing delays. In 2005, unaccommodated movements increase approximately tenfold but, thanks toexisting capacity plans, remain limited to around 6 per cent of the total number ofunconstrained movements, whereas the number of unaccommodated movements due toi n s u fficient ATM capacity increases to re p resent around only 1 per cent of totalunconstrained movements. This 1 per cent has the effect of further reducing the overallcapacity by around 60,000 movements, which illustrates for the first time network eff e c t s ,which become more pronounced throughout the period of the study.
In 2 0 1 0, almost two million movements would be unaccommodated by airports, which isroughly two and a half times the figure for 2005. In the same period, the number ofmovements that cannot be accommodated due to lack of ATM capacity increases almosttenfold. By 2015, the figure for movements that cannot be accommodated at airports isa round one third higher than in 2010, which corresponds to an overall unaccommodateddemand of around 20 per cent of annual unconstrained movements. In 2020,unaccommodated demand is equivalent to approximately one third of total annualunconstrained movements (28 per cent due to lack of airport capacity and around thesame figure for ATM capacity).
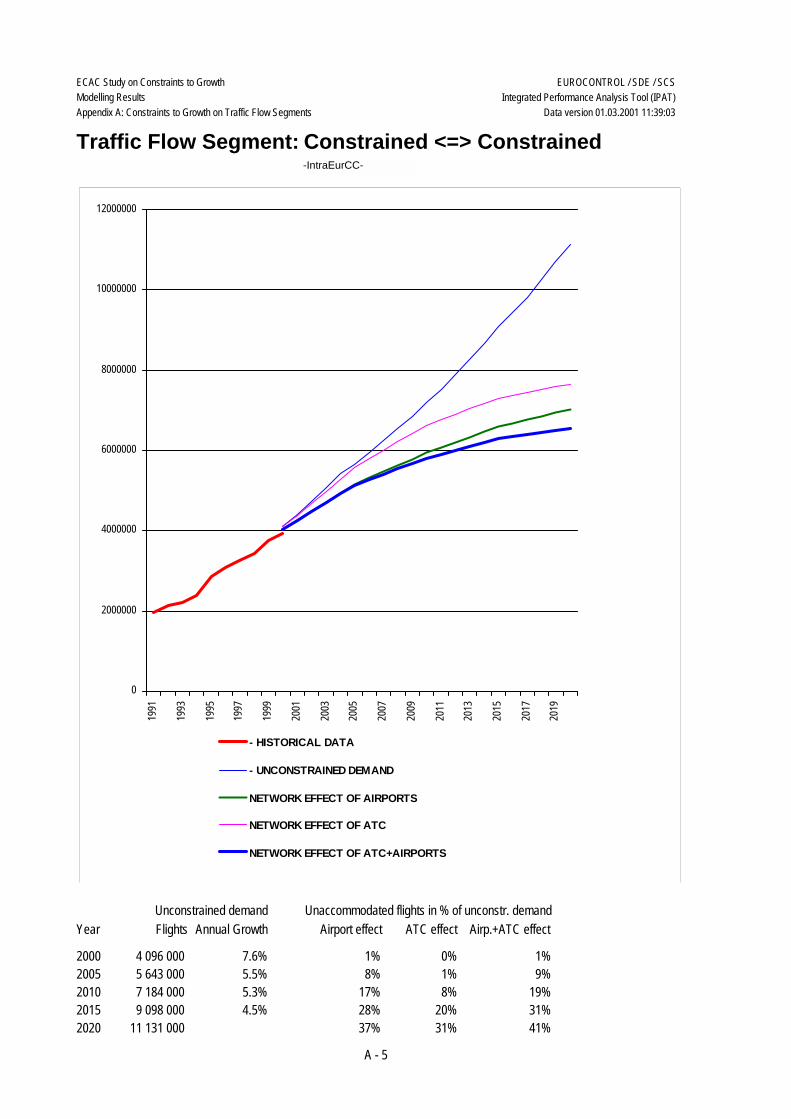
Appendix A t h rows up a number of key messages. Page A - 4 shows that by 2010unaccommodated demand resulting from the combined airport and ATM constraints withnetwork effects is 15 per cent of total unconstrained demand. This compares to 13 percent and 7 per cent respectively for airport and ATM effects taken in isolation. It can bea rgued that the scale of the problem in ATM could be even smaller because of likelytechnical advances during the period, but the overall message is clear: demand will beconstrained much more by airport capacity up until 2010 than by ATM capacity, assumingthat present capacity plans are implemented as specified. The biggest gaps betweenavailable capacity and unconstrained demand occur between constrained airports (pageA - 5), which account for around 50 per cent of total traffic (see page A - 3). The gapbetween supply and demand becomes apparent as early as 2001 for traffic betweenconstrained airports, but a similar effect is delayed, as might be expected, until 2005 fort r a ffic between constrained and unconstrained airports (page A - 6).
Appendix B shows that in 2005, 12 airports and only 1 ACC are expected to havesignificant unaccommodated demand. By 2010, this increases to 29 airports and 12ACCs, by 2015 to 46 airports and 33 ACCs, and by 2020 to 62 airports and 44 ACCs.In 2005, Heathrow and Frankfurt are the most constrained airports, unable toaccommodate approximately 25 per cent of their unconstrained demand.
By 2010, Heathrow and Frankfurt remain the most constrained airports with 40 and 39per cent unaccommodated demand, re s p e c t i v e l y, but they have been overtaken by MilanACC, in terms of total number of unaccommodated movements (around 380,000movements which re p resents around 27 per cent of the Milan ACC’s unconstrained annualmovements). By 2015, Frankfurt and Heathrow remain the most constrained airports, butin terms of total unaccommodated movements, they are behind the London and MilanACCs, which show unaccommodated annual demand of around 900,000 and 760,000movements, re s p e c t i v e l y. By 2020, 16 out of the top 20 bottlenecks, in terms of totalnumber of annual unaccommodated movements, are ACCs. In 2020, 21 per cent ofa i r p o rts and 16 per cent of ACCs that are significantly constrained, haveunaccommodated demand of over 35 per cent of their unconstrained demand.

10
5. AC C O M M O D AT I N G DE M A N D – A MO R E CO-O P E R AT I V E AP P R O A C H
EMTO recognised at an early stage in its work that the involvement of all stakeholders inthe air transport system was beneficial in terms of improving the level of mutualunderstanding between them. Industry stakeholders particularly supported the idea of am o re collaborative approach in seeking ways to accommodate demand in a sustainablew a y. It was felt that the present level of co-operation might not be sufficient to enablef u t u re challenges to be met successfully. EMTO there f o re made an early re c o m m e n d a t i o nthat ECAC Directors General should consider the usefulness of setting up a new forum, orof adapting an existing one, to increase co-operation amongst stakeholders (airport s ,airspace users, ANS providers and regulators). IATA subsequently outlined its vision ofsuch a forum – somewhere major stakeholders, re p resented at a senior level, could meetat regular intervals to strategically review the future of Europe's air transporti n f r a s t ru c t u re, taking account of environmental and inter-modal aspects. IATA pro p o s e dthat the forum should anticipate trends in transport and map out solutions at a re g i o n a llevel. Stakeholders would identify areas where action is re q u i red and ensure that issuesand solutions for implementation are being addre s s e d .
ECAC Directors General endorsed the proposal for a “Collaborative Forum ofStakeholders” at their meeting in Paris on 13/14 December 2000. The Forum will meeton 22 March 2001. Its initial membership9 is intended to be broadly re p resentative of allstakeholder interests. The Foru m ’s main task will be to consider, in the light of this re p o rt ,how the important and complex issues identified by Ministers at the MATSE/6 meetingmight be tackled. The forum is not an adjunct to meetings of Directors General, but rathera stand-alone body; its future will be for the participants to determine and to developf u rther as they wish.
9 A C I - E u rope, AEA, ATAG, EURACA/IACA, EBAA, CANSO, EUROCONTROL, European Commission, ERA andI ATA, as well as members of ECAC’s Co-ordinating Committee.

11
6. KE Y ME S S A G E S
This study reveals a number of key messages:
• As expected, the modelling reveals a growing mismatch between supply anddemand. Although the major problems become most apparent in 2020, therea re already significant problems in 2005 — the period which takes accountof the most reliable data in terms of capacity enhancement plans. In 2010,15 per cent of annual demand is unaccommodated.
• The modelling reveals that airport constraints become critical before 2005, inp a rticular due to environmental concerns. ATM is also a source of incre a s i n gconstraints, although these constraints are of a diff e rent nature.
• Network effects mean that there is little point in improving airline, airport orATM capacity in isolation. A clear strategy is needed for the integratedmanagement of the European air transport network of both en-route sectorsand airport nodes.
• Given the magnitude of this potential problem, stakeholders urgently need towork together to identify a range of strategic measures if anticipated demandis to be accommodated.


A-1
APPENDIX A
CONSTRAINTS TO GROWTH ON TRAFFIC FLOW SEGMENTS

A-2
APPENDIX AThe model covers all aerodromes involved in IFR traffic to, from, within and over the ECACarea. They have been classified into three categories:
• Constrained: this category includes 107 ECAC airports for which hourly capacity datawas made available to EUROCONTROL. With a few exceptions, this includes allairports which had more than 40,000 IFR movements in 2000, this limit roughlycorresponding to 100 movements per day. A limited number of smaller airports isalso included in this category. Constrained does not mean that these airports werealready congested in 2000. Many of them had spare capacity.
• Unconstrained : this category includes the remaining ECAC aerodromes (smallairports and airfields) with IFR traffic. There are nearly 1800 of them.
• Non-ECAC: this category comprises the approximately 900 airports outside the ECACregion, which are engaged in IFR traffic to, from and over ECAC. For the purpose ofthis study, aerodromes in Iceland have been categorised as non-ECAC.
There are approximately 150,000 traffic flows between these airports. They can begrouped (segmented) according to the combination of the category of their departure anddestination airport. Flights to or from an unknown destination, or with an air filed flight planhave been classified as “undefined”. This segment is negligible (< 1% of all traffic).
The pie chart on the next page shows these traffic flow segments, and their relativecontribution to total ECAC traffic. In the unconstrained growth scenario, these proportionsmay change somewhat in the coming 20 years, but not to the extent that the picture wouldlook significantly different.
The remainder of this Appendix provides a time line analysis of unconstrained demand andconstraints to growth per traffic flow segment:
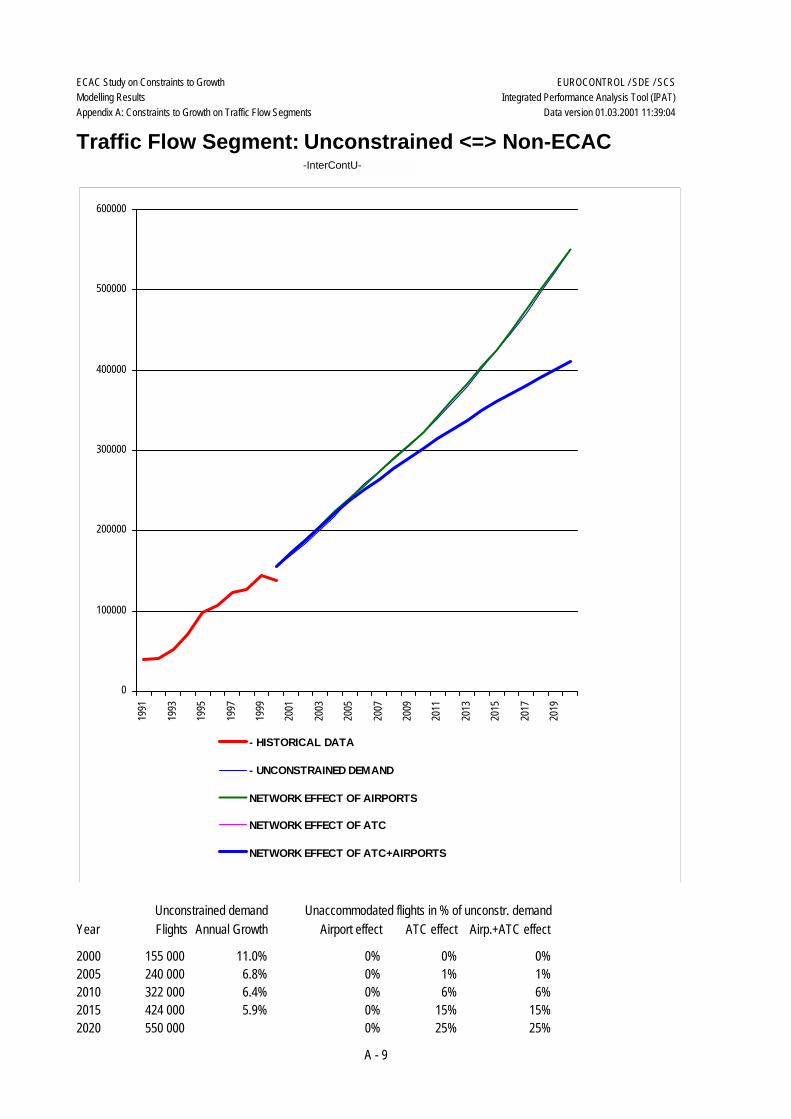
• O v e rview for all flows through ECAC, followed by the analysis per traffic flow segment:•Constrained ⇔ Constrained (intra European trunk routes)•Constrained ⇔ Unconstrained (intra European feeder routes)•Unconstrained ⇔ Unconstrained (traffic directly interconnecting small airport s / a i rfields) •Constrained ⇔ Non-ECAC (main intercontinental routes)•Unconstrained ⇔ Non-ECAC (intercontinental routes to/from small airport s / a i rf i e l d s )•Non-ECAC ⇔ Non-ECAC (ECAC overflights)
Each page contains a graph showing the growth, according to the model, in the totalnumber of movements through the ECAC region from 1991 to 2020. The vertical axisindicates the total number of annual movements. The horizontal axis indicates the year.Historical data is shown as a single thick red line running up to the latest available trafficstatistics, i.e. 2000. Starting in 2000, there are four separate lines. The thin blue lineindicates the total number of unconstrained (not limited by airport and ATM capacityconstraints) annual movements produced by the model. The thick green line indicates thetotal number of annual movements when airport constraints are applied. The thin pink lineindicates the total number of annual movements when ATM constraints are applied. Thethick blue line indicates the total number of annual movements when airport and ATMconstraints are applied together.
Below the graph there is a list with six columns. The first column indicates the year. Thesecond column contains figures for the total number of unconstrained annual movements.The third column translates this into the unconstrained demand annual growth rate. Thefourth column expresses the gap between the unconstrained demand line (thin blue) and thenetwork effects of airports line (thick green), i.e. the unaccommodated demand if airportconstraints only are applied, as a percentage of the total number of unconstrained annualmovements. The remaining columns do the same for ATM constraints and for ATM andairport constraints combined (due to network effects, the individual airport and ATM effectscannot simply be added to obtain the combined effect).
EUROCONTROL / SDE / SCSECAC Study on Constraints to GrowthModelling ResultsAppendix A: Constraints to Growth on Traffic Flow Segments
Integrated Performance Analysis Tool (IPAT)Data version 01.03.2001 11:39:03
Definition of Traffic Flow Segmentsand their Contribution to Total ECAC IFR Traffic
Situation in 2000
Undefined0%
Constrained <=> Non-ECAC12%
Constrained <=> Unconstrained
29%
Non-ECAC <=> Non-ECAC
1%
Unconstrained <=> Non-ECAC
2%
Unconstrained <=> Unconstrained
10%
Constrained <=> Constrained
46%
Note: The term "constrained" refers to ECAC airports with a specified maximum hourly capacity.The model contains approximately 110 of those.The term "unconstrained" refers to all other ECAC airports (without such a parameter value specified in the model).Approximately 85 % of the ECAC traffic passes through the 110 constrained airports.The term "Non-ECAC" refers to departure and destination airports outside the ECAC area.
A - 3

EUROCONTROL / SDE / SCSECAC Study on Constraints to GrowthModelling ResultsAppendix A: Constraints to Growth on Traffic Flow Segments
Integrated Performance Analysis Tool (IPAT)Data version 01.03.2001 11:39:03
0
5000000
10000000
15000000
20000000
25000000
1991
1993
1995
1997
1999
2001
2003
2005
2007
2009
2011
2013
2015
2017
2019
- HISTORICAL DATA
- UNCONSTRAINED DEMAND
NETWORK EFFECT OF AIRPORTS
NETWORK EFFECT OF ATC
NETWORK EFFECT OF ATC+AIRPORTS
Traffic Flow Segment: All flows through ECAC-Total-
Year Flights Airport effect ATC effect Airp.+ATC effectAnnual GrowthUnconstrained demand Unaccommodated flights in % of unconstr. demand
2000 8 730 000 1% 0% 1%7.5%2005 11 995 000 6% 1% 7%5.3%2010 15 159 000 13% 7% 15%5.1%2015 19 048 000 21% 18% 26%4.5%2020 23 324 000 28% 29% 36%
A - 4
EUROCONTROL / SDE / SCSECAC Study on Constraints to GrowthModelling ResultsAppendix A: Constraints to Growth on Traffic Flow Segments
Integrated Performance Analysis Tool (IPAT)Data version 01.03.2001 11:39:03
0
2000000
4000000
6000000
8000000
10000000
12000000
1991
1993
1995
1997
1999
2001
2003
2005
2007
2009
2011
2013
2015
2017
2019
- HISTORICAL DATA
- UNCONSTRAINED DEMAND
NETWORK EFFECT OF AIRPORTS
NETWORK EFFECT OF ATC
NETWORK EFFECT OF ATC+AIRPORTS
Traffic Flow Segment: Constrained <=> Constrained-IntraEurCC-
Year Flights Airport effect ATC effect Airp.+ATC effectAnnual GrowthUnconstrained demand Unaccommodated flights in % of unconstr. demand
2000 4 096 000 1% 0% 1%7.6%2005 5 643 000 8% 1% 9%5.5%2010 7 184 000 17% 8% 19%5.3%2015 9 098 000 28% 20% 31%4.5%2020 11 131 000 37% 31% 41%
A - 5

EUROCONTROL / SDE / SCSECAC Study on Constraints to GrowthModelling ResultsAppendix A: Constraints to Growth on Traffic Flow Segments
Integrated Performance Analysis Tool (IPAT)Data version 01.03.2001 11:39:03
0
1000000
2000000
3000000
4000000
5000000
6000000
7000000
1991
1993
1995
1997
1999
2001
2003
2005
2007
2009
2011
2013
2015
2017
2019
- HISTORICAL DATA
- UNCONSTRAINED DEMAND
NETWORK EFFECT OF AIRPORTS
NETWORK EFFECT OF ATC
NETWORK EFFECT OF ATC+AIRPORTS
Traffic Flow Segment: Constrained <=> Unconstrained-IntraEurCU-
Year Flights Airport effect ATC effect Airp.+ATC effectAnnual GrowthUnconstrained demand Unaccommodated flights in % of unconstr. demand
2000 2 518 000 1% 0% 1%7.1%2005 3 414 000 4% 1% 4%4.9%2010 4 257 000 9% 6% 12%4.8%2015 5 278 000 16% 16% 22%4.3%2020 6 423 000 23% 27% 32%
A - 6

EUROCONTROL / SDE / SCSECAC Study on Constraints to GrowthModelling ResultsAppendix A: Constraints to Growth on Traffic Flow Segments
Integrated Performance Analysis Tool (IPAT)Data version 01.03.2001 11:39:04
0
500000
1000000
1500000
2000000
2500000
1991
1993
1995
1997
1999
2001
2003
2005
2007
2009
2011
2013
2015
2017
2019
- HISTORICAL DATA
- UNCONSTRAINED DEMAND
NETWORK EFFECT OF AIRPORTS
NETWORK EFFECT OF ATC
NETWORK EFFECT OF ATC+AIRPORTS
Traffic Flow Segment: Unconstrained <=> Unconstrained-IntraEurUU-
Year Flights Airport effect ATC effect Airp.+ATC effectAnnual GrowthUnconstrained demand Unaccommodated flights in % of unconstr. demand
2000 864 000 0% 0% 0%7.1%2005 1 173 000 0% 1% 1%4.9%2010 1 460 000 0% 4% 4%4.7%2015 1 804 000 0% 11% 11%4.3%2020 2 192 000 0% 20% 20%
A - 7

EUROCONTROL / SDE / SCSECAC Study on Constraints to GrowthModelling ResultsAppendix A: Constraints to Growth on Traffic Flow Segments
Integrated Performance Analysis Tool (IPAT)Data version 01.03.2001 11:39:04
0
500000
1000000
1500000
2000000
2500000
3000000
1991
1993
1995
1997
1999
2001
2003
2005
2007
2009
2011
2013
2015
2017
2019
- HISTORICAL DATA
- UNCONSTRAINED DEMAND
NETWORK EFFECT OF AIRPORTS
NETWORK EFFECT OF ATC
NETWORK EFFECT OF ATC+AIRPORTS
Traffic Flow Segment: Constrained <=> Non-ECAC-InterContC-
Year Flights Airport effect ATC effect Airp.+ATC effectAnnual GrowthUnconstrained demand Unaccommodated flights in % of unconstr. demand
2000 1 015 000 1% 0% 1%8.0%2005 1 421 000 9% 1% 10%5.5%2010 1 811 000 18% 8% 20%5.3%2015 2 288 000 27% 20% 31%4.8%2020 2 837 000 35% 31% 41%
A - 8
EUROCONTROL / SDE / SCSECAC Study on Constraints to GrowthModelling ResultsAppendix A: Constraints to Growth on Traffic Flow Segments
Integrated Performance Analysis Tool (IPAT)Data version 01.03.2001 11:39:04
0
100000
200000
300000
400000
500000
600000
1991
1993
1995
1997
1999
2001
2003
2005
2007
2009
2011
2013
2015
2017
2019
- HISTORICAL DATA
- UNCONSTRAINED DEMAND
NETWORK EFFECT OF AIRPORTS
NETWORK EFFECT OF ATC
NETWORK EFFECT OF ATC+AIRPORTS
Traffic Flow Segment: Unconstrained <=> Non-ECAC-InterContU-
Year Flights Airport effect ATC effect Airp.+ATC effectAnnual GrowthUnconstrained demand Unaccommodated flights in % of unconstr. demand
2000 155 000 0% 0% 0%11.0%2005 240 000 0% 1% 1%6.8%2010 322 000 0% 6% 6%6.4%2015 424 000 0% 15% 15%5.9%2020 550 000 0% 25% 25%
A - 9

EUROCONTROL / SDE / SCSECAC Study on Constraints to GrowthModelling ResultsAppendix A: Constraints to Growth on Traffic Flow Segments
Integrated Performance Analysis Tool (IPAT)Data version 01.03.2001 11:39:04
0
20000
40000
60000
80000
100000
120000
140000
160000
180000
1991
1993
1995
1997
1999
2001
2003
2005
2007
2009
2011
2013
2015
2017
2019
- HISTORICAL DATA
- UNCONSTRAINED DEMAND
NETWORK EFFECT OF AIRPORTS
NETWORK EFFECT OF ATC
NETWORK EFFECT OF ATC+AIRPORTS
Traffic Flow Segment: Non-ECAC <=> Non-ECAC-Overflight-
Year Flights Airport effect ATC effect Airp.+ATC effectAnnual GrowthUnconstrained demand Unaccommodated flights in % of unconstr. demand
2000 52 000 0% 0% 0%7.9%2005 73 000 0% 1% 1%5.9%2010 95 000 0% 5% 5%6.2%2015 124 000 0% 14% 14%5.7%2020 160 000 0% 24% 24%
A - 10

B-1
APPENDIX B
GEOGRAPHICAL ANALYSIS OF UNACCOMMODATED DEMAND

B-2
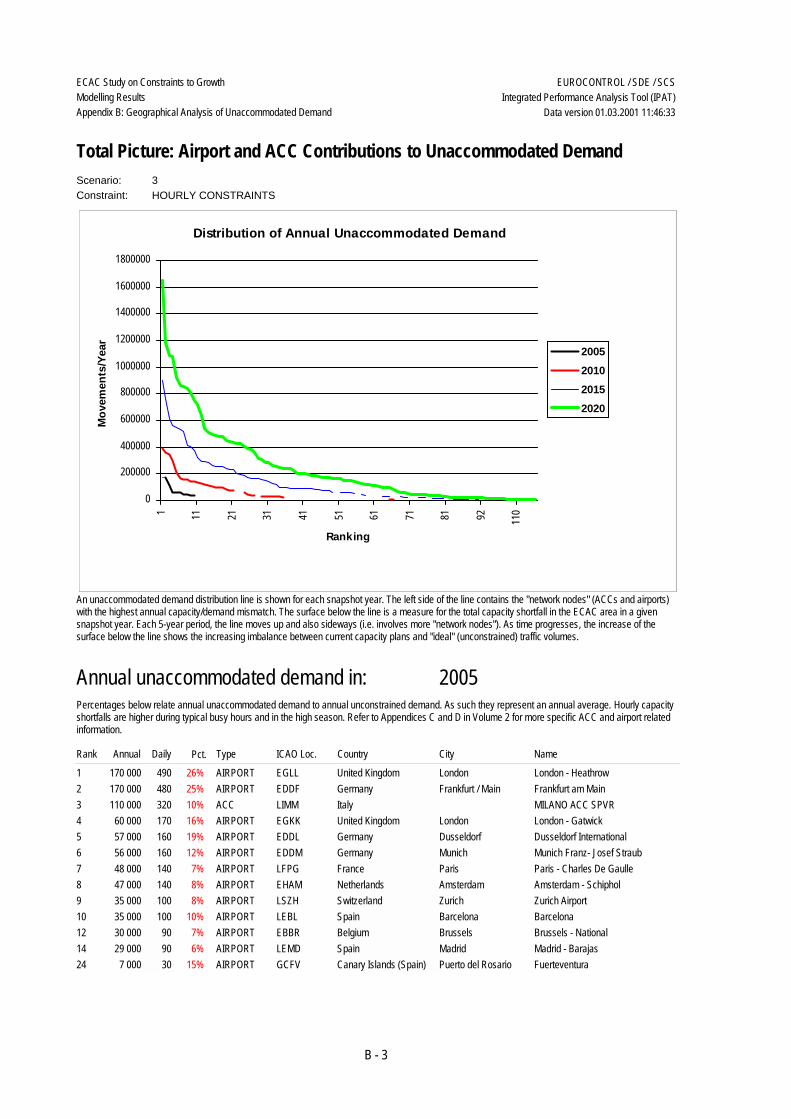
APPENDIX BThis Appendix provides a ranking of all airports and ACCs that, according to the model,theoretically fail to accommodate 3,500 or more movements per year: only thosea i r p o rts/ACCs where the number of unaccommodated flights is equivalent to 5 per centor more of the total annual number of unconstrained movements produced by the modela re included (which might be termed “significant” unaccommodated demand). The datais listed for each of the future snapshot years – 2005, 2010, 2015 and 2020.
The graph at the top of the table provides a broad pictorial summary of the lists appearingbelow it. The total number of airports/ACCs with significant unaccommodated demand inany of the given years may be deduced by looking at where the line for that year ends onthe horizontal axis. So, in 2010 for example, approximately 30 airports/ACCs havesignificant unaccommodated demand. The total number of annual unaccommodatedmovements for the top ranked airport/ACC in a given year may be deduced by looking atwhere the line for that year ends on the vertical axis. So, in 2015 for example, the topranked airport/ACC fails to accommodate around 900,000 movements per annum. Thenumber of airports/ACCs exceeding a particular number of unaccommodated movementsin a given year may be deduced by taking a figure on the vertical axis, say 200,000,reading across to the line for a particular year, and then reading down to the horizontalaxis. So, for example, in 2015, over 21 airports/ACCs exceed 200,000 unaccommodatedmovements per annum.
Below the graph are lists setting out for each of the snapshot years the airports/ACCs withsignificant unaccommodated demand. Each list has nine columns. The first column indicatesthe ranking of airports/ACCs in descending order. The top ranked airport/ACC is the onewith the highest number of unaccommodated movements per annum. The second columnshows the total annual number of unaccommodated movements. The third column breaksdown the annual total into average daily unaccommodated movements (column two valuedivided by 365). The fourth column expresses the total annual number of unaccommodatedmovements for each airport/ACC as a percentage of the total figure for unconstrainedmovements produced by the model. The fifth column indicates airport or ACC. Theremaining columns indicate the ICAO location code, country and city of location and thename of the airport or ACC.
The Appendix sections starting on pages B-9 and B-12 follow the same format, but separateout ACCs and airports, respectively.
EUROCONTROL / SDE / SCSECAC Study on Constraints to GrowthModelling ResultsAppendix B: Geographical Analysis of Unaccommodated Demand
Integrated Performance Analysis Tool (IPAT)Data version 01.03.2001 11:46:33
Scenario: 3Constraint: HOURLY CONSTRAINTS
Distribution of Annual Unaccommodated Demand
0
200000
400000
600000
800000
1000000
1200000
1400000
1600000
1800000
1 11 21 31 41 51 61 71 81 92 110
Ranking
Mov
emen
ts/Y
ear
2005201020152020
Total Picture: Airport and ACC Contributions to Unaccommodated Demand
An unaccommodated demand distribution line is shown for each snapshot year. The left side of the line contains the "network nodes" (ACCs and airports) with the highest annual capacity/demand mismatch. The surface below the line is a measure for the total capacity shortfall in the ECAC area in a given snapshot year. Each 5-year period, the line moves up and also sideways (i.e. involves more "network nodes"). As time progresses, the increase of the surface below the line shows the increasing imbalance between current capacity plans and "ideal" (unconstrained) traffic volumes.
Rank Annual Daily Type ICAO Loc. Country City NamePct.
Annual unaccommodated demand in: 2005Percentages below relate annual unaccommodated demand to annual unconstrained demand. As such they represent an annual average. Hourly capacity shortfalls are higher during typical busy hours and in the high season. Refer to Appendices C and D in Volume 2 for more specific ACC and airport related information.
1 AIRPORT170 000 EGLL United Kingdom London London - Heathrow490 26%2 AIRPORT170 000 EDDF Germany Frankfurt / Main Frankfurt am Main480 25%3 ACC110 000 LIMM Italy MILANO ACC SPVR320 10%4 AIRPORT60 000 EGKK United Kingdom London London - Gatwick170 16%5 AIRPORT57 000 EDDL Germany Dusseldorf Dusseldorf International160 19%6 AIRPORT56 000 EDDM Germany Munich Munich Franz- Josef Straub160 12%7 AIRPORT48 000 LFPG France Paris Paris - Charles De Gaulle140 7%8 AIRPORT47 000 EHAM Netherlands Amsterdam Amsterdam - Schiphol140 8%9 AIRPORT35 000 LSZH Switzerland Zurich Zurich Airport100 8%10 AIRPORT35 000 LEBL Spain Barcelona Barcelona100 10%12 AIRPORT30 000 EBBR Belgium Brussels Brussels - National90 7%14 AIRPORT29 000 LEMD Spain Madrid Madrid - Barajas90 6%24 AIRPORT7 000 GCFV Canary Islands (Spain) Puerto del Rosario Fuerteventura30 15%
B - 3

EUROCONTROL / SDE / SCSECAC Study on Constraints to GrowthModelling ResultsAppendix B: Geographical Analysis of Unaccommodated Demand
Integrated Performance Analysis Tool (IPAT)Data version 01.03.2001 11:46:34
Rank Annual Daily Type ICAO Loc. Country City NamePct.
Annual unaccommodated demand in: 2010Percentages below relate annual unaccommodated demand to annual unconstrained demand. As such they represent an annual average. Hourly capacity shortfalls are higher during typical busy hours and in the high season. Refer to Appendices C and D in Volume 2 for more specific ACC and airport related information.
1 ACC380 000 LIMM Italy MILANO ACC SPVR1 070 27%2 AIRPORT360 000 EDDF Germany Frankfurt / Main Frankfurt am Main1 000 39%3 AIRPORT340 000 EGLL United Kingdom London London - Heathrow940 40%4 ACC290 000 EGTT United Kingdom LONDON ATCC820 10%5 ACC210 000 LIRR Italy ROMA ACC SPVR590 16%6 ACC160 000 LIPP Italy PADOVA ACC SPVR460 18%7 ACC150 000 EDFF Germany FRANKFURT ACC440 9%8 AIRPORT150 000 LFPG France Paris Paris - Charles De Gaulle440 19%9 AIRPORT140 000 EGKK United Kingdom London London - Gatwick400 30%10 AIRPORT140 000 EDDL Germany Dusseldorf Dusseldorf International400 36%11 AIRPORT130 000 EDDM Germany Munich Munich Franz- Josef Straub380 22%12 ACC130 000 EDYY Netherlands MAASTRICHT UAC360 6%13 AIRPORT110 000 LSZH Switzerland Zurich Zurich Airport330 20%14 AIRPORT110 000 LEMD Spain Madrid Madrid - Barajas310 18%15 ACC100 000 LGGG Greece ATHINAI ACC290 13%16 ACC96 000 LSAZ Switzerland ZURICH ACC270 6%17 AIRPORT96 000 LEBL Spain Barcelona Barcelona270 21%18 AIRPORT94 000 EHAM Netherlands Amsterdam Amsterdam - Schiphol270 13%19 AIRPORT80 000 EBBR Belgium Brussels Brussels - National230 15%20 ACC74 000 EBBU Belgium BRUSSELS CANAC210 7%21 ACC72 000 EHAA Netherlands AMSTERDAM CONTROL200 8%24 AIRPORT60 000 LIMC Italy Milan Milan - Malpensa170 13%25 AIRPORT43 000 LOWW Austria Vienna Vienna International Airport120 11%26 ACC40 000 LGMD Greece MAKEDONIA ACC120 10%27 AIRPORT38 000 EGSS United Kingdom London London - Stansted110 13%29 AIRPORT33 000 EKCH Denmark Copenhagen Copenhagen Airport100 7%30 AIRPORT32 000 LEPA Spain Palma de Mallorca Palma de Mallorca90 9%31 AIRPORT32 000 LIRF Italy Rome Rome - Fiumicino, Leonardo da Vinci90 6%32 ACC31 000 LIBB Italy BRINDISI ACC90 8%33 AIRPORT29 000 LSGG Switzerland Geneva Geneva International90 11%34 AIRPORT26 000 EDDS Germany Stuttgart Stuttgart Airport80 10%35 AIRPORT25 000 LFPO France Paris Paris - Orly80 7%40 AIRPORT17 000 GCLP Canary Islands (Spain) Las Palmas - Gran Can Las Palmas - Gran Canaria50 8%43 AIRPORT16 000 GCFV Canary Islands (Spain) Puerto del Rosario Fuerteventura50 26%50 AIRPORT12 000 LFSB France Bale-Mulhouse Eurairport Bale-Mulhouse40 7%60 AIRPORT6 000 LGIR Greece Heraklion Nikos Kazantzakis20 6%62 AIRPORT6 000 GCRR Canary Islands (Spain) Arrecife Lanzarote-Arrecife20 6%65 AIRPORT5 000 LIRQ Italy Florence Florence Amerigo Vespucci20 7%66 AIRPORT5 000 LEIB Spain Ibiza Ibiza20 6%71 AIRPORT4 000 LEMH Spain Mahon Menorca - Mahon Airport20 8%73 AIRPORT3 000 EGAC United Kingdom Belfast Belfast City20 6%
Rank Annual Daily Type ICAO Loc. Country City NamePct.
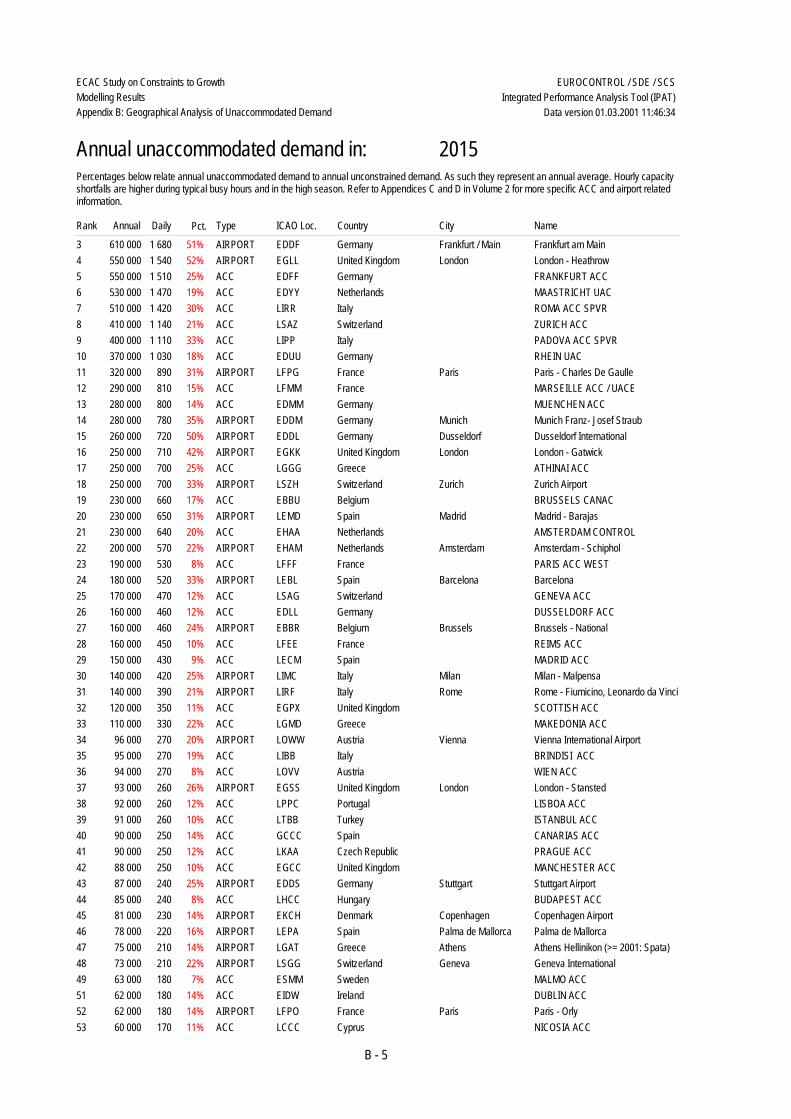
Annual unaccommodated demand in: 2015Percentages below relate annual unaccommodated demand to annual unconstrained demand. As such they represent an annual average. Hourly capacity shortfalls are higher during typical busy hours and in the high season. Refer to Appendices C and D in Volume 2 for more specific ACC and airport related information.
1 ACC900 000 EGTT United Kingdom LONDON ATCC2 480 24%2 ACC760 000 LIMM Italy MILANO ACC SPVR2 100 41%
B - 4
EUROCONTROL / SDE / SCSECAC Study on Constraints to GrowthModelling ResultsAppendix B: Geographical Analysis of Unaccommodated Demand
Integrated Performance Analysis Tool (IPAT)Data version 01.03.2001 11:46:34
Rank Annual Daily Type ICAO Loc. Country City NamePct.
Annual unaccommodated demand in: 2015Percentages below relate annual unaccommodated demand to annual unconstrained demand. As such they represent an annual average. Hourly capacity shortfalls are higher during typical busy hours and in the high season. Refer to Appendices C and D in Volume 2 for more specific ACC and airport related information.
3 AIRPORT610 000 EDDF Germany Frankfurt / Main Frankfurt am Main1 680 51%4 AIRPORT550 000 EGLL United Kingdom London London - Heathrow1 540 52%5 ACC550 000 EDFF Germany FRANKFURT ACC1 510 25%6 ACC530 000 EDYY Netherlands MAASTRICHT UAC1 470 19%7 ACC510 000 LIRR Italy ROMA ACC SPVR1 420 30%8 ACC410 000 LSAZ Switzerland ZURICH ACC1 140 21%9 ACC400 000 LIPP Italy PADOVA ACC SPVR1 110 33%10 ACC370 000 EDUU Germany RHEIN UAC1 030 18%11 AIRPORT320 000 LFPG France Paris Paris - Charles De Gaulle890 31%12 ACC290 000 LFMM France MARSEILLE ACC / UACE810 15%13 ACC280 000 EDMM Germany MUENCHEN ACC800 14%14 AIRPORT280 000 EDDM Germany Munich Munich Franz- Josef Straub780 35%15 AIRPORT260 000 EDDL Germany Dusseldorf Dusseldorf International720 50%16 AIRPORT250 000 EGKK United Kingdom London London - Gatwick710 42%17 ACC250 000 LGGG Greece ATHINAI ACC700 25%18 AIRPORT250 000 LSZH Switzerland Zurich Zurich Airport700 33%19 ACC230 000 EBBU Belgium BRUSSELS CANAC660 17%20 AIRPORT230 000 LEMD Spain Madrid Madrid - Barajas650 31%21 ACC230 000 EHAA Netherlands AMSTERDAM CONTROL640 20%22 AIRPORT200 000 EHAM Netherlands Amsterdam Amsterdam - Schiphol570 22%23 ACC190 000 LFFF France PARIS ACC WEST530 8%24 AIRPORT180 000 LEBL Spain Barcelona Barcelona520 33%25 ACC170 000 LSAG Switzerland GENEVA ACC470 12%26 ACC160 000 EDLL Germany DUSSELDORF ACC460 12%27 AIRPORT160 000 EBBR Belgium Brussels Brussels - National460 24%28 ACC160 000 LFEE France REIMS ACC450 10%29 ACC150 000 LECM Spain MADRID ACC430 9%30 AIRPORT140 000 LIMC Italy Milan Milan - Malpensa420 25%31 AIRPORT140 000 LIRF Italy Rome Rome - Fiumicino, Leonardo da Vinci390 21%32 ACC120 000 EGPX United Kingdom SCOTTISH ACC350 11%33 ACC110 000 LGMD Greece MAKEDONIA ACC330 22%34 AIRPORT96 000 LOWW Austria Vienna Vienna International Airport270 20%35 ACC95 000 LIBB Italy BRINDISI ACC270 19%36 ACC94 000 LOVV Austria WIEN ACC270 8%37 AIRPORT93 000 EGSS United Kingdom London London - Stansted260 26%38 ACC92 000 LPPC Portugal LISBOA ACC260 12%39 ACC91 000 LTBB Turkey ISTANBUL ACC260 10%40 ACC90 000 GCCC Spain CANARIAS ACC250 14%41 ACC90 000 LKAA Czech Republic PRAGUE ACC250 12%42 ACC88 000 EGCC United Kingdom MANCHESTER ACC250 10%43 AIRPORT87 000 EDDS Germany Stuttgart Stuttgart Airport240 25%44 ACC85 000 LHCC Hungary BUDAPEST ACC240 8%45 AIRPORT81 000 EKCH Denmark Copenhagen Copenhagen Airport230 14%46 AIRPORT78 000 LEPA Spain Palma de Mallorca Palma de Mallorca220 16%47 AIRPORT75 000 LGAT Greece Athens Athens Hellinikon (>= 2001: Spata)210 14%48 AIRPORT73 000 LSGG Switzerland Geneva Geneva International210 22%49 ACC63 000 ESMM Sweden MALMO ACC180 7%51 ACC62 000 EIDW Ireland DUBLIN ACC180 14%52 AIRPORT62 000 LFPO France Paris Paris - Orly180 14%53 ACC60 000 LCCC Cyprus NICOSIA ACC170 11%
B - 5

EUROCONTROL / SDE / SCSECAC Study on Constraints to GrowthModelling ResultsAppendix B: Geographical Analysis of Unaccommodated Demand
Integrated Performance Analysis Tool (IPAT)Data version 01.03.2001 11:46:34
Rank Annual Daily Type ICAO Loc. Country City NamePct.
Annual unaccommodated demand in: 2015Percentages below relate annual unaccommodated demand to annual unconstrained demand. As such they represent an annual average. Hourly capacity shortfalls are higher during typical busy hours and in the high season. Refer to Appendices C and D in Volume 2 for more specific ACC and airport related information.
54 ACC57 000 LTAA Turkey ANKARA ACC160 8%55 AIRPORT52 000 EGCC United Kingdom Manchester Manchester150 12%57 AIRPORT44 000 GCLP Canary Islands (Spain) Las Palmas - Gran Can Las Palmas - Gran Canaria130 16%58 ACC36 000 EPWW Poland ACC WARSZAWA110 7%61 AIRPORT30 000 EGPF United Kingdom Glasgow Glasgow Airport90 14%63 AIRPORT29 000 GCFV Canary Islands (Spain) Puerto del Rosario Fuerteventura90 36%64 AIRPORT29 000 LFMN France Nice Nice Cote d'Azur90 10%65 AIRPORT28 000 EDDH Germany Hamburg Hamburg-Fuhlsbuettel80 8%68 AIRPORT26 000 LFSB France Bale-Mulhouse Eurairport Bale-Mulhouse80 12%69 AIRPORT25 000 EGBB United Kingdom Birmingham Birmingham International Airport80 10%70 AIRPORT23 000 LIML Italy Milan Milan - Linate70 10%73 AIRPORT21 000 LEMG Spain Malaga Malaga60 10%74 AIRPORT20 000 GCRR Canary Islands (Spain) Arrecife Lanzarote-Arrecife60 16%75 AIRPORT19 000 LGIR Greece Heraklion Nikos Kazantzakis60 14%77 AIRPORT15 000 LGTS Greece Thessaloniki Thessaloniki Makedonia50 9%78 AIRPORT15 000 EGPH United Kingdom Edinburgh Edinburgh50 7%79 AIRPORT15 000 LPPR Portugal Porto Aeroporto Francisco Sa Carneiro50 13%80 AIRPORT13 000 LEIB Spain Ibiza Ibiza40 12%84 AIRPORT10 000 LEMH Spain Mahon Menorca - Mahon Airport30 15%85 AIRPORT9 000 EGAC United Kingdom Belfast Belfast City30 13%86 AIRPORT9 000 LIRN Italy Naples Naples International Airport30 6%87 AIRPORT8 000 LIRQ Italy Florence Florence Amerigo Vespucci30 9%88 AIRPORT7 000 LEAL Spain Alicante Alicante30 6%90 AIRPORT6 000 LGRP Greece Rhodes Diagoras20 7%91 AIRPORT5 000 LMML Malta Valleta Luqa20 6%94 AIRPORT4 000 LPFR Portugal Faro Faro Airport20 5%95 AIRPORT3 000 LFLC France Clermont-Ferrand Clermont-Ferrand/Auvergne20 6%
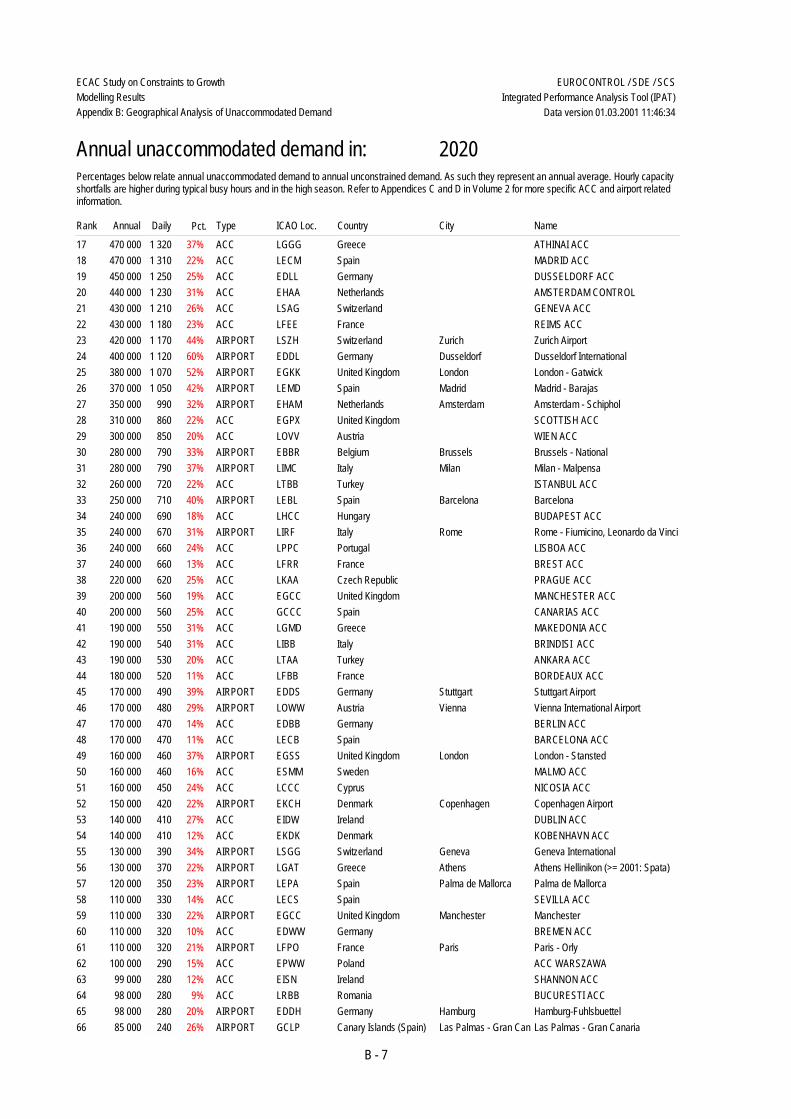
Rank Annual Daily Type ICAO Loc. Country City NamePct.
Annual unaccommodated demand in: 2020Percentages below relate annual unaccommodated demand to annual unconstrained demand. As such they represent an annual average. Hourly capacity shortfalls are higher during typical busy hours and in the high season. Refer to Appendices C and D in Volume 2 for more specific ACC and airport related information.
1 ACC1 640 000 EGTT United Kingdom LONDON ATCC4 520 35%2 ACC1 180 000 LIMM Italy MILANO ACC SPVR3 250 51%3 ACC1 080 000 EDFF Germany FRANKFURT ACC2 980 38%4 ACC1 080 000 EDYY Netherlands MAASTRICHT UAC2 970 31%5 AIRPORT920 000 EDDF Germany Frankfurt / Main Frankfurt am Main2 530 60%6 ACC860 000 LSAZ Switzerland ZURICH ACC2 380 35%7 ACC850 000 LIRR Italy ROMA ACC SPVR2 340 40%8 ACC830 000 EDUU Germany RHEIN UAC2 300 32%9 AIRPORT800 000 EGLL United Kingdom London London - Heathrow2 210 60%10 ACC750 000 EDMM Germany MUENCHEN ACC2 070 28%11 ACC720 000 LIPP Italy PADOVA ACC SPVR1 980 45%12 ACC630 000 LFMM France MARSEILLE ACC / UACE1 760 26%13 ACC530 000 LFFF France PARIS ACC WEST1 480 19%14 AIRPORT510 000 LFPG France Paris Paris - Charles De Gaulle1 410 41%15 AIRPORT490 000 EDDM Germany Munich Munich Franz- Josef Straub1 350 46%16 ACC480 000 EBBU Belgium BRUSSELS CANAC1 330 28%
B - 6
EUROCONTROL / SDE / SCSECAC Study on Constraints to GrowthModelling ResultsAppendix B: Geographical Analysis of Unaccommodated Demand
Integrated Performance Analysis Tool (IPAT)Data version 01.03.2001 11:46:34
Rank Annual Daily Type ICAO Loc. Country City NamePct.
Annual unaccommodated demand in: 2020Percentages below relate annual unaccommodated demand to annual unconstrained demand. As such they represent an annual average. Hourly capacity shortfalls are higher during typical busy hours and in the high season. Refer to Appendices C and D in Volume 2 for more specific ACC and airport related information.
17 ACC470 000 LGGG Greece ATHINAI ACC1 320 37%18 ACC470 000 LECM Spain MADRID ACC1 310 22%19 ACC450 000 EDLL Germany DUSSELDORF ACC1 250 25%20 ACC440 000 EHAA Netherlands AMSTERDAM CONTROL1 230 31%21 ACC430 000 LSAG Switzerland GENEVA ACC1 210 26%22 ACC430 000 LFEE France REIMS ACC1 180 23%23 AIRPORT420 000 LSZH Switzerland Zurich Zurich Airport1 170 44%24 AIRPORT400 000 EDDL Germany Dusseldorf Dusseldorf International1 120 60%25 AIRPORT380 000 EGKK United Kingdom London London - Gatwick1 070 52%26 AIRPORT370 000 LEMD Spain Madrid Madrid - Barajas1 050 42%27 AIRPORT350 000 EHAM Netherlands Amsterdam Amsterdam - Schiphol990 32%28 ACC310 000 EGPX United Kingdom SCOTTISH ACC860 22%29 ACC300 000 LOVV Austria WIEN ACC850 20%30 AIRPORT280 000 EBBR Belgium Brussels Brussels - National790 33%31 AIRPORT280 000 LIMC Italy Milan Milan - Malpensa790 37%32 ACC260 000 LTBB Turkey ISTANBUL ACC720 22%33 AIRPORT250 000 LEBL Spain Barcelona Barcelona710 40%34 ACC240 000 LHCC Hungary BUDAPEST ACC690 18%35 AIRPORT240 000 LIRF Italy Rome Rome - Fiumicino, Leonardo da Vinci670 31%36 ACC240 000 LPPC Portugal LISBOA ACC660 24%37 ACC240 000 LFRR France BREST ACC660 13%38 ACC220 000 LKAA Czech Republic PRAGUE ACC620 25%39 ACC200 000 EGCC United Kingdom MANCHESTER ACC560 19%40 ACC200 000 GCCC Spain CANARIAS ACC560 25%41 ACC190 000 LGMD Greece MAKEDONIA ACC550 31%42 ACC190 000 LIBB Italy BRINDISI ACC540 31%43 ACC190 000 LTAA Turkey ANKARA ACC530 20%44 ACC180 000 LFBB France BORDEAUX ACC520 11%45 AIRPORT170 000 EDDS Germany Stuttgart Stuttgart Airport490 39%46 AIRPORT170 000 LOWW Austria Vienna Vienna International Airport480 29%47 ACC170 000 EDBB Germany BERLIN ACC470 14%48 ACC170 000 LECB Spain BARCELONA ACC470 11%49 AIRPORT160 000 EGSS United Kingdom London London - Stansted460 37%50 ACC160 000 ESMM Sweden MALMO ACC460 16%51 ACC160 000 LCCC Cyprus NICOSIA ACC450 24%52 AIRPORT150 000 EKCH Denmark Copenhagen Copenhagen Airport420 22%53 ACC140 000 EIDW Ireland DUBLIN ACC410 27%54 ACC140 000 EKDK Denmark KOBENHAVN ACC410 12%55 AIRPORT130 000 LSGG Switzerland Geneva Geneva International390 34%56 AIRPORT130 000 LGAT Greece Athens Athens Hellinikon (>= 2001: Spata)370 22%57 AIRPORT120 000 LEPA Spain Palma de Mallorca Palma de Mallorca350 23%58 ACC110 000 LECS Spain SEVILLA ACC330 14%59 AIRPORT110 000 EGCC United Kingdom Manchester Manchester330 22%60 ACC110 000 EDWW Germany BREMEN ACC320 10%61 AIRPORT110 000 LFPO France Paris Paris - Orly320 21%62 ACC100 000 EPWW Poland ACC WARSZAWA290 15%63 ACC99 000 EISN Ireland SHANNON ACC280 12%64 ACC98 000 LRBB Romania BUCURESTI ACC280 9%65 AIRPORT98 000 EDDH Germany Hamburg Hamburg-Fuhlsbuettel280 20%66 AIRPORT85 000 GCLP Canary Islands (Spain) Las Palmas - Gran Can Las Palmas - Gran Canaria240 26%
B - 7

EUROCONTROL / SDE / SCSECAC Study on Constraints to GrowthModelling ResultsAppendix B: Geographical Analysis of Unaccommodated Demand
Integrated Performance Analysis Tool (IPAT)Data version 01.03.2001 11:46:34
Rank Annual Daily Type ICAO Loc. Country City NamePct.
Annual unaccommodated demand in: 2020Percentages below relate annual unaccommodated demand to annual unconstrained demand. As such they represent an annual average. Hourly capacity shortfalls are higher during typical busy hours and in the high season. Refer to Appendices C and D in Volume 2 for more specific ACC and airport related information.
67 AIRPORT63 000 EGPF United Kingdom Glasgow Glasgow Airport180 24%68 AIRPORT61 000 EGBB United Kingdom Birmingham Birmingham International Airport180 20%69 AIRPORT60 000 LFMN France Nice Nice Cote d'Azur170 17%70 AIRPORT52 000 ESSA Sweden Stockholm Stockholm - Arlanda150 9%71 AIRPORT46 000 GCFV Canary Islands (Spain) Puerto del Rosario Fuerteventura130 45%72 AIRPORT45 000 LFSB France Bale-Mulhouse Eurairport Bale-Mulhouse130 17%73 AIRPORT43 000 LEMG Spain Malaga Malaga130 17%74 AIRPORT42 000 EGPH United Kingdom Edinburgh Edinburgh120 16%75 AIRPORT42 000 LGIR Greece Heraklion Nikos Kazantzakis120 23%76 AIRPORT40 000 GCRR Canary Islands (Spain) Arrecife Lanzarote-Arrecife120 26%77 AIRPORT38 000 LPPR Portugal Porto Aeroporto Francisco Sa Carneiro110 26%78 ACC35 000 EFES Finland TAMPERE ACC100 7%79 AIRPORT34 000 LIML Italy Milan Milan - Linate100 14%80 ACC33 000 ENOS Norway OSLO ATCC100 6%81 AIRPORT27 000 LEIB Spain Ibiza Ibiza80 20%83 AIRPORT24 000 EDDN Germany Nurnberg Flughafen Nurnberg70 11%84 AIRPORT24 000 LIRN Italy Naples Naples International Airport70 13%85 AIRPORT23 000 ENGM Norway Oslo Oslo - Gardermoen70 6%86 AIRPORT23 000 EFHK Finland Helsinki Helsinki - Vantaa70 6%87 AIRPORT23 000 LIRQ Italy Florence Florence Amerigo Vespucci70 20%88 AIRPORT22 000 EDDT Germany Berlin Berlin Tegel (>= 2007: Berlin Brande70 6%89 AIRPORT21 000 LHBP Hungary Budapest Budapest Ferihegy70 9%90 AIRPORT20 000 LMML Malta Valleta Luqa60 15%91 AIRPORT19 000 LEMH Spain Mahon Menorca - Mahon Airport60 22%92 AIRPORT19 000 EGAC United Kingdom Belfast Belfast City60 21%93 AIRPORT18 000 LGTS Greece Thessaloniki Thessaloniki Makedonia60 12%94 AIRPORT18 000 LIMF Italy Turin Turin - Caselle60 11%95 AIRPORT15 000 LGRP Greece Rhodes Diagoras50 12%96 AIRPORT15 000 LEAL Spain Alicante Alicante50 10%97 AIRPORT14 000 GCTS Canary Islands (Spain) Tenerife Sur Tenerife - Reina Sofia40 7%100 AIRPORT11 000 LPFR Portugal Faro Faro Airport40 11%105 AIRPORT8 000 EDDI Germany Berlin Berlin Tempelhof30 7%107 AIRPORT8 000 LFST France Strasbourg Strasbourg Entzheim30 8%108 AIRPORT8 000 ELLX Luxembourg Luxembourg Luxembourg30 6%110 AIRPORT7 000 LGKO Greece Kos Kos Hippocratis30 18%111 AIRPORT7 000 LFLC France Clermont-Ferrand Clermont-Ferrand/Auvergne30 10%113 AIRPORT6 000 EDDC Germany Dresden Dresden20 5%114 AIRPORT6 000 EGJJ United Kingdom Jersey Jersey Airport20 6%116 AIRPORT5 000 LPFU Portugal Porto Santo Aeroporto de Funchal20 10%117 AIRPORT5 000 LGKR Greece Corfu Kerkyra - I. Kapodistrias20 8%
B - 8
EUROCONTROL / SDE / SCSECAC Study on Constraints to GrowthModelling ResultsAppendix B: Geographical Analysis of Unaccommodated Demand
Integrated Performance Analysis Tool (IPAT)Data version 01.03.2001 13:55:16
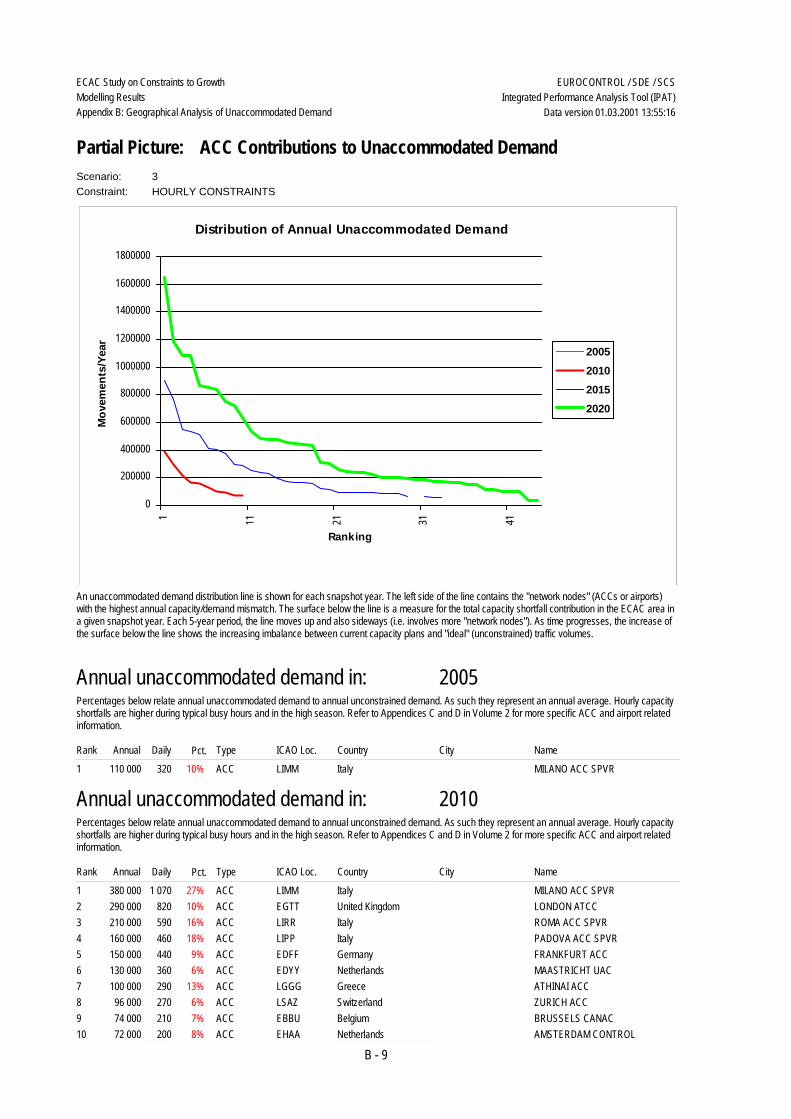
Scenario: 3Constraint: HOURLY CONSTRAINTS
Distribution of Annual Unaccommodated Demand
0
200000
400000
600000
800000
1000000
1200000
1400000
1600000
1800000
1 11 21 31 41
Ranking
Mov
emen
ts/Y
ear
2005201020152020
Partial Picture: ACC Contributions to Unaccommodated Demand
An unaccommodated demand distribution line is shown for each snapshot year. The left side of the line contains the "network nodes" (ACCs or airports) with the highest annual capacity/demand mismatch. The surface below the line is a measure for the total capacity shortfall contribution in the ECAC area in a given snapshot year. Each 5-year period, the line moves up and also sideways (i.e. involves more "network nodes"). As time progresses, the increase of the surface below the line shows the increasing imbalance between current capacity plans and "ideal" (unconstrained) traffic volumes.
Annual unaccommodated demand in: 2005
Rank Annual Daily Type ICAO Loc. Country City NamePct.
Percentages below relate annual unaccommodated demand to annual unconstrained demand. As such they represent an annual average. Hourly capacity shortfalls are higher during typical busy hours and in the high season. Refer to Appendices C and D in Volume 2 for more specific ACC and airport related information.
1 ACC110 000 LIMM Italy MILANO ACC SPVR320 10%
Annual unaccommodated demand in: 2010
Rank Annual Daily Type ICAO Loc. Country City NamePct.
Percentages below relate annual unaccommodated demand to annual unconstrained demand. As such they represent an annual average. Hourly capacity shortfalls are higher during typical busy hours and in the high season. Refer to Appendices C and D in Volume 2 for more specific ACC and airport related information.
1 ACC380 000 LIMM Italy MILANO ACC SPVR1 070 27%2 ACC290 000 EGTT United Kingdom LONDON ATCC820 10%3 ACC210 000 LIRR Italy ROMA ACC SPVR590 16%4 ACC160 000 LIPP Italy PADOVA ACC SPVR460 18%5 ACC150 000 EDFF Germany FRANKFURT ACC440 9%6 ACC130 000 EDYY Netherlands MAASTRICHT UAC360 6%7 ACC100 000 LGGG Greece ATHINAI ACC290 13%8 ACC96 000 LSAZ Switzerland ZURICH ACC270 6%9 ACC74 000 EBBU Belgium BRUSSELS CANAC210 7%10 ACC72 000 EHAA Netherlands AMSTERDAM CONTROL200 8%
B - 9

EUROCONTROL / SDE / SCSECAC Study on Constraints to GrowthModelling ResultsAppendix B: Geographical Analysis of Unaccommodated Demand
Integrated Performance Analysis Tool (IPAT)Data version 01.03.2001 13:55:16
Annual unaccommodated demand in: 2010
Rank Annual Daily Type ICAO Loc. Country City NamePct.
Percentages below relate annual unaccommodated demand to annual unconstrained demand. As such they represent an annual average. Hourly capacity shortfalls are higher during typical busy hours and in the high season. Refer to Appendices C and D in Volume 2 for more specific ACC and airport related information.
13 ACC40 000 LGMD Greece MAKEDONIA ACC120 10%15 ACC31 000 LIBB Italy BRINDISI ACC90 8%
Annual unaccommodated demand in: 2015
Rank Annual Daily Type ICAO Loc. Country City NamePct.
Percentages below relate annual unaccommodated demand to annual unconstrained demand. As such they represent an annual average. Hourly capacity shortfalls are higher during typical busy hours and in the high season. Refer to Appendices C and D in Volume 2 for more specific ACC and airport related information.
1 ACC900 000 EGTT United Kingdom LONDON ATCC2 480 24%2 ACC760 000 LIMM Italy MILANO ACC SPVR2 100 41%3 ACC550 000 EDFF Germany FRANKFURT ACC1 510 25%4 ACC530 000 EDYY Netherlands MAASTRICHT UAC1 470 19%5 ACC510 000 LIRR Italy ROMA ACC SPVR1 420 30%6 ACC410 000 LSAZ Switzerland ZURICH ACC1 140 21%7 ACC400 000 LIPP Italy PADOVA ACC SPVR1 110 33%8 ACC370 000 EDUU Germany RHEIN UAC1 030 18%9 ACC290 000 LFMM France MARSEILLE ACC / UACE810 15%10 ACC280 000 EDMM Germany MUENCHEN ACC800 14%11 ACC250 000 LGGG Greece ATHINAI ACC700 25%12 ACC230 000 EBBU Belgium BRUSSELS CANAC660 17%13 ACC230 000 EHAA Netherlands AMSTERDAM CONTROL640 20%14 ACC190 000 LFFF France PARIS ACC WEST530 8%15 ACC170 000 LSAG Switzerland GENEVA ACC470 12%16 ACC160 000 EDLL Germany DUSSELDORF ACC460 12%17 ACC160 000 LFEE France REIMS ACC450 10%18 ACC150 000 LECM Spain MADRID ACC430 9%19 ACC120 000 EGPX United Kingdom SCOTTISH ACC350 11%20 ACC110 000 LGMD Greece MAKEDONIA ACC330 22%21 ACC95 000 LIBB Italy BRINDISI ACC270 19%22 ACC94 000 LOVV Austria WIEN ACC270 8%23 ACC92 000 LPPC Portugal LISBOA ACC260 12%24 ACC91 000 LTBB Turkey ISTANBUL ACC260 10%25 ACC90 000 GCCC Spain CANARIAS ACC250 14%26 ACC90 000 LKAA Czech Republic PRAGUE ACC250 12%27 ACC88 000 EGCC United Kingdom MANCHESTER ACC250 10%28 ACC85 000 LHCC Hungary BUDAPEST ACC240 8%29 ACC63 000 ESMM Sweden MALMO ACC180 7%31 ACC62 000 EIDW Ireland DUBLIN ACC180 14%32 ACC60 000 LCCC Cyprus NICOSIA ACC170 11%33 ACC57 000 LTAA Turkey ANKARA ACC160 8%35 ACC36 000 EPWW Poland ACC WARSZAWA110 7%
Annual unaccommodated demand in: 2020
Rank Annual Daily Type ICAO Loc. Country City NamePct.
Percentages below relate annual unaccommodated demand to annual unconstrained demand. As such they represent an annual average. Hourly capacity shortfalls are higher during typical busy hours and in the high season. Refer to Appendices C and D in Volume 2 for more specific ACC and airport related information.
1 ACC1 640 000 EGTT United Kingdom LONDON ATCC4 520 35%2 ACC1 180 000 LIMM Italy MILANO ACC SPVR3 250 51%
B - 10

EUROCONTROL / SDE / SCSECAC Study on Constraints to GrowthModelling ResultsAppendix B: Geographical Analysis of Unaccommodated Demand
Integrated Performance Analysis Tool (IPAT)Data version 01.03.2001 13:55:16
Annual unaccommodated demand in: 2020
Rank Annual Daily Type ICAO Loc. Country City NamePct.
Percentages below relate annual unaccommodated demand to annual unconstrained demand. As such they represent an annual average. Hourly capacity shortfalls are higher during typical busy hours and in the high season. Refer to Appendices C and D in Volume 2 for more specific ACC and airport related information.
3 ACC1 080 000 EDFF Germany FRANKFURT ACC2 980 38%4 ACC1 080 000 EDYY Netherlands MAASTRICHT UAC2 970 31%5 ACC860 000 LSAZ Switzerland ZURICH ACC2 380 35%6 ACC850 000 LIRR Italy ROMA ACC SPVR2 340 40%7 ACC830 000 EDUU Germany RHEIN UAC2 300 32%8 ACC750 000 EDMM Germany MUENCHEN ACC2 070 28%9 ACC720 000 LIPP Italy PADOVA ACC SPVR1 980 45%10 ACC630 000 LFMM France MARSEILLE ACC / UACE1 760 26%11 ACC530 000 LFFF France PARIS ACC WEST1 480 19%12 ACC480 000 EBBU Belgium BRUSSELS CANAC1 330 28%13 ACC470 000 LGGG Greece ATHINAI ACC1 320 37%14 ACC470 000 LECM Spain MADRID ACC1 310 22%15 ACC450 000 EDLL Germany DUSSELDORF ACC1 250 25%16 ACC440 000 EHAA Netherlands AMSTERDAM CONTROL1 230 31%17 ACC430 000 LSAG Switzerland GENEVA ACC1 210 26%18 ACC430 000 LFEE France REIMS ACC1 180 23%19 ACC310 000 EGPX United Kingdom SCOTTISH ACC860 22%20 ACC300 000 LOVV Austria WIEN ACC850 20%21 ACC260 000 LTBB Turkey ISTANBUL ACC720 22%22 ACC240 000 LHCC Hungary BUDAPEST ACC690 18%23 ACC240 000 LPPC Portugal LISBOA ACC660 24%24 ACC240 000 LFRR France BREST ACC660 13%25 ACC220 000 LKAA Czech Republic PRAGUE ACC620 25%26 ACC200 000 EGCC United Kingdom MANCHESTER ACC560 19%27 ACC200 000 GCCC Spain CANARIAS ACC560 25%28 ACC190 000 LGMD Greece MAKEDONIA ACC550 31%29 ACC190 000 LIBB Italy BRINDISI ACC540 31%30 ACC190 000 LTAA Turkey ANKARA ACC530 20%31 ACC180 000 LFBB France BORDEAUX ACC520 11%32 ACC170 000 EDBB Germany BERLIN ACC470 14%33 ACC170 000 LECB Spain BARCELONA ACC470 11%34 ACC160 000 ESMM Sweden MALMO ACC460 16%35 ACC160 000 LCCC Cyprus NICOSIA ACC450 24%36 ACC140 000 EIDW Ireland DUBLIN ACC410 27%37 ACC140 000 EKDK Denmark KOBENHAVN ACC410 12%38 ACC110 000 LECS Spain SEVILLA ACC330 14%39 ACC110 000 EDWW Germany BREMEN ACC320 10%40 ACC100 000 EPWW Poland ACC WARSZAWA290 15%41 ACC99 000 EISN Ireland SHANNON ACC280 12%42 ACC98 000 LRBB Romania BUCURESTI ACC280 9%43 ACC35 000 EFES Finland TAMPERE ACC100 7%44 ACC33 000 ENOS Norway OSLO ATCC100 6%
B - 11

EUROCONTROL / SDE / SCSECAC Study on Constraints to GrowthModelling ResultsAppendix B: Geographical Analysis of Unaccommodated Demand
Integrated Performance Analysis Tool (IPAT)Data version 01.03.2001 13:55:16
Scenario: 3Constraint: HOURLY CONSTRAINTS
Distribution of Annual Unaccommodated Demand
0
100000
200000
300000
400000
500000
600000
700000
800000
900000
1000000
1 11 21 31 41 51 65Ranking
Mov
emen
ts/Y
ear
2005201020152020
Partial Picture: AIRPORT Contributions to Unaccommodated Demand
An unaccommodated demand distribution line is shown for each snapshot year. The left side of the line contains the "network nodes" (ACCs or airports) with the highest annual capacity/demand mismatch. The surface below the line is a measure for the total capacity shortfall contribution in the ECAC area in a given snapshot year. Each 5-year period, the line moves up and also sideways (i.e. involves more "network nodes"). As time progresses, the increase of the surface below the line shows the increasing imbalance between current capacity plans and "ideal" (unconstrained) traffic volumes.
Annual unaccommodated demand in: 2005
Rank Annual Daily Type ICAO Loc. Country City NamePct.
Percentages below relate annual unaccommodated demand to annual unconstrained demand. As such they represent an annual average. Hourly capacity shortfalls are higher during typical busy hours and in the high season. Refer to Appendices C and D in Volume 2 for more specific ACC and airport related information.
1 AIRPORT170 000 EGLL United Kingdom London London - Heathrow490 26%2 AIRPORT170 000 EDDF Germany Frankfurt / Main Frankfurt am Main480 25%3 AIRPORT60 000 EGKK United Kingdom London London - Gatwick170 16%4 AIRPORT57 000 EDDL Germany Dusseldorf Dusseldorf International160 19%5 AIRPORT56 000 EDDM Germany Munich Munich Franz- Josef Straub160 12%6 AIRPORT48 000 LFPG France Paris Paris - Charles De Gaulle140 7%7 AIRPORT47 000 EHAM Netherlands Amsterdam Amsterdam - Schiphol140 8%8 AIRPORT35 000 LSZH Switzerland Zurich Zurich Airport100 8%9 AIRPORT35 000 LEBL Spain Barcelona Barcelona100 10%10 AIRPORT30 000 EBBR Belgium Brussels Brussels - National90 7%11 AIRPORT29 000 LEMD Spain Madrid Madrid - Barajas90 6%17 AIRPORT7 000 GCFV Canary Islands (Spain) Puerto del Rosario Fuerteventura30 15%
B - 12

EUROCONTROL / SDE / SCSECAC Study on Constraints to GrowthModelling ResultsAppendix B: Geographical Analysis of Unaccommodated Demand
Integrated Performance Analysis Tool (IPAT)Data version 01.03.2001 13:55:16
Annual unaccommodated demand in: 2010
Rank Annual Daily Type ICAO Loc. Country City NamePct.
Percentages below relate annual unaccommodated demand to annual unconstrained demand. As such they represent an annual average. Hourly capacity shortfalls are higher during typical busy hours and in the high season. Refer to Appendices C and D in Volume 2 for more specific ACC and airport related information.
1 AIRPORT360 000 EDDF Germany Frankfurt / Main Frankfurt am Main1 000 39%2 AIRPORT340 000 EGLL United Kingdom London London - Heathrow940 40%3 AIRPORT150 000 LFPG France Paris Paris - Charles De Gaulle440 19%4 AIRPORT140 000 EGKK United Kingdom London London - Gatwick400 30%5 AIRPORT140 000 EDDL Germany Dusseldorf Dusseldorf International400 36%6 AIRPORT130 000 EDDM Germany Munich Munich Franz- Josef Straub380 22%7 AIRPORT110 000 LSZH Switzerland Zurich Zurich Airport330 20%8 AIRPORT110 000 LEMD Spain Madrid Madrid - Barajas310 18%9 AIRPORT96 000 LEBL Spain Barcelona Barcelona270 21%10 AIRPORT94 000 EHAM Netherlands Amsterdam Amsterdam - Schiphol270 13%11 AIRPORT80 000 EBBR Belgium Brussels Brussels - National230 15%12 AIRPORT60 000 LIMC Italy Milan Milan - Malpensa170 13%13 AIRPORT43 000 LOWW Austria Vienna Vienna International Airport120 11%14 AIRPORT38 000 EGSS United Kingdom London London - Stansted110 13%15 AIRPORT33 000 EKCH Denmark Copenhagen Copenhagen Airport100 7%16 AIRPORT32 000 LEPA Spain Palma de Mallorca Palma de Mallorca90 9%17 AIRPORT32 000 LIRF Italy Rome Rome - Fiumicino, Leonardo da Vinci90 6%18 AIRPORT29 000 LSGG Switzerland Geneva Geneva International90 11%19 AIRPORT26 000 EDDS Germany Stuttgart Stuttgart Airport80 10%20 AIRPORT25 000 LFPO France Paris Paris - Orly80 7%21 AIRPORT17 000 GCLP Canary Islands (Spain) Las Palmas - Gran Can Las Palmas - Gran Canaria50 8%23 AIRPORT16 000 GCFV Canary Islands (Spain) Puerto del Rosario Fuerteventura50 26%25 AIRPORT12 000 LFSB France Bale-Mulhouse Eurairport Bale-Mulhouse40 7%29 AIRPORT6 000 LGIR Greece Heraklion Nikos Kazantzakis20 6%31 AIRPORT6 000 GCRR Canary Islands (Spain) Arrecife Lanzarote-Arrecife20 6%33 AIRPORT5 000 LIRQ Italy Florence Florence Amerigo Vespucci20 7%34 AIRPORT5 000 LEIB Spain Ibiza Ibiza20 6%37 AIRPORT4 000 LEMH Spain Mahon Menorca - Mahon Airport20 8%39 AIRPORT3 000 EGAC United Kingdom Belfast Belfast City20 6%
Annual unaccommodated demand in: 2015
Rank Annual Daily Type ICAO Loc. Country City NamePct.
Percentages below relate annual unaccommodated demand to annual unconstrained demand. As such they represent an annual average. Hourly capacity shortfalls are higher during typical busy hours and in the high season. Refer to Appendices C and D in Volume 2 for more specific ACC and airport related information.
1 AIRPORT610 000 EDDF Germany Frankfurt / Main Frankfurt am Main1 680 51%2 AIRPORT550 000 EGLL United Kingdom London London - Heathrow1 540 52%3 AIRPORT320 000 LFPG France Paris Paris - Charles De Gaulle890 31%4 AIRPORT280 000 EDDM Germany Munich Munich Franz- Josef Straub780 35%5 AIRPORT260 000 EDDL Germany Dusseldorf Dusseldorf International720 50%6 AIRPORT250 000 EGKK United Kingdom London London - Gatwick710 42%7 AIRPORT250 000 LSZH Switzerland Zurich Zurich Airport700 33%8 AIRPORT230 000 LEMD Spain Madrid Madrid - Barajas650 31%9 AIRPORT200 000 EHAM Netherlands Amsterdam Amsterdam - Schiphol570 22%10 AIRPORT180 000 LEBL Spain Barcelona Barcelona520 33%11 AIRPORT160 000 EBBR Belgium Brussels Brussels - National460 24%12 AIRPORT140 000 LIMC Italy Milan Milan - Malpensa420 25%13 AIRPORT140 000 LIRF Italy Rome Rome - Fiumicino, Leonardo da Vinci390 21%14 AIRPORT96 000 LOWW Austria Vienna Vienna International Airport270 20%15 AIRPORT93 000 EGSS United Kingdom London London - Stansted260 26%
B - 13

EUROCONTROL / SDE / SCSECAC Study on Constraints to GrowthModelling ResultsAppendix B: Geographical Analysis of Unaccommodated Demand
Integrated Performance Analysis Tool (IPAT)Data version 01.03.2001 13:55:16
Annual unaccommodated demand in: 2015
Rank Annual Daily Type ICAO Loc. Country City NamePct.
Percentages below relate annual unaccommodated demand to annual unconstrained demand. As such they represent an annual average. Hourly capacity shortfalls are higher during typical busy hours and in the high season. Refer to Appendices C and D in Volume 2 for more specific ACC and airport related information.
16 AIRPORT87 000 EDDS Germany Stuttgart Stuttgart Airport240 25%17 AIRPORT81 000 EKCH Denmark Copenhagen Copenhagen Airport230 14%18 AIRPORT78 000 LEPA Spain Palma de Mallorca Palma de Mallorca220 16%19 AIRPORT75 000 LGAT Greece Athens Athens Hellinikon (>= 2001: Spata)210 14%20 AIRPORT73 000 LSGG Switzerland Geneva Geneva International210 22%21 AIRPORT62 000 LFPO France Paris Paris - Orly180 14%22 AIRPORT52 000 EGCC United Kingdom Manchester Manchester150 12%23 AIRPORT44 000 GCLP Canary Islands (Spain) Las Palmas - Gran Can Las Palmas - Gran Canaria130 16%24 AIRPORT30 000 EGPF United Kingdom Glasgow Glasgow Airport90 14%25 AIRPORT29 000 GCFV Canary Islands (Spain) Puerto del Rosario Fuerteventura90 36%26 AIRPORT29 000 LFMN France Nice Nice Cote d'Azur90 10%27 AIRPORT28 000 EDDH Germany Hamburg Hamburg-Fuhlsbuettel80 8%28 AIRPORT26 000 LFSB France Bale-Mulhouse Eurairport Bale-Mulhouse80 12%29 AIRPORT25 000 EGBB United Kingdom Birmingham Birmingham International Airport80 10%30 AIRPORT23 000 LIML Italy Milan Milan - Linate70 10%32 AIRPORT21 000 LEMG Spain Malaga Malaga60 10%33 AIRPORT20 000 GCRR Canary Islands (Spain) Arrecife Lanzarote-Arrecife60 16%34 AIRPORT19 000 LGIR Greece Heraklion Nikos Kazantzakis60 14%35 AIRPORT15 000 LGTS Greece Thessaloniki Thessaloniki Makedonia50 9%36 AIRPORT15 000 EGPH United Kingdom Edinburgh Edinburgh50 7%37 AIRPORT15 000 LPPR Portugal Porto Aeroporto Francisco Sa Carneiro50 13%38 AIRPORT13 000 LEIB Spain Ibiza Ibiza40 12%40 AIRPORT10 000 LEMH Spain Mahon Menorca - Mahon Airport30 15%41 AIRPORT9 000 EGAC United Kingdom Belfast Belfast City30 13%42 AIRPORT9 000 LIRN Italy Naples Naples International Airport30 6%43 AIRPORT8 000 LIRQ Italy Florence Florence Amerigo Vespucci30 9%44 AIRPORT7 000 LEAL Spain Alicante Alicante30 6%46 AIRPORT6 000 LGRP Greece Rhodes Diagoras20 7%47 AIRPORT5 000 LMML Malta Valleta Luqa20 6%50 AIRPORT4 000 LPFR Portugal Faro Faro Airport20 5%51 AIRPORT3 000 LFLC France Clermont-Ferrand Clermont-Ferrand/Auvergne20 6%
Annual unaccommodated demand in: 2020
Rank Annual Daily Type ICAO Loc. Country City NamePct.
Percentages below relate annual unaccommodated demand to annual unconstrained demand. As such they represent an annual average. Hourly capacity shortfalls are higher during typical busy hours and in the high season. Refer to Appendices C and D in Volume 2 for more specific ACC and airport related information.
1 AIRPORT920 000 EDDF Germany Frankfurt / Main Frankfurt am Main2 530 60%2 AIRPORT800 000 EGLL United Kingdom London London - Heathrow2 210 60%3 AIRPORT510 000 LFPG France Paris Paris - Charles De Gaulle1 410 41%4 AIRPORT490 000 EDDM Germany Munich Munich Franz- Josef Straub1 350 46%5 AIRPORT420 000 LSZH Switzerland Zurich Zurich Airport1 170 44%6 AIRPORT400 000 EDDL Germany Dusseldorf Dusseldorf International1 120 60%7 AIRPORT380 000 EGKK United Kingdom London London - Gatwick1 070 52%8 AIRPORT370 000 LEMD Spain Madrid Madrid - Barajas1 050 42%9 AIRPORT350 000 EHAM Netherlands Amsterdam Amsterdam - Schiphol990 32%10 AIRPORT280 000 EBBR Belgium Brussels Brussels - National790 33%11 AIRPORT280 000 LIMC Italy Milan Milan - Malpensa790 37%12 AIRPORT250 000 LEBL Spain Barcelona Barcelona710 40%13 AIRPORT240 000 LIRF Italy Rome Rome - Fiumicino, Leonardo da Vinci670 31%
B - 14

EUROCONTROL / SDE / SCSECAC Study on Constraints to GrowthModelling ResultsAppendix B: Geographical Analysis of Unaccommodated Demand
Integrated Performance Analysis Tool (IPAT)Data version 01.03.2001 13:55:16
Annual unaccommodated demand in: 2020
Rank Annual Daily Type ICAO Loc. Country City NamePct.
Percentages below relate annual unaccommodated demand to annual unconstrained demand. As such they represent an annual average. Hourly capacity shortfalls are higher during typical busy hours and in the high season. Refer to Appendices C and D in Volume 2 for more specific ACC and airport related information.
14 AIRPORT170 000 EDDS Germany Stuttgart Stuttgart Airport490 39%15 AIRPORT170 000 LOWW Austria Vienna Vienna International Airport480 29%16 AIRPORT160 000 EGSS United Kingdom London London - Stansted460 37%17 AIRPORT150 000 EKCH Denmark Copenhagen Copenhagen Airport420 22%18 AIRPORT130 000 LSGG Switzerland Geneva Geneva International390 34%19 AIRPORT130 000 LGAT Greece Athens Athens Hellinikon (>= 2001: Spata)370 22%20 AIRPORT120 000 LEPA Spain Palma de Mallorca Palma de Mallorca350 23%21 AIRPORT110 000 EGCC United Kingdom Manchester Manchester330 22%22 AIRPORT110 000 LFPO France Paris Paris - Orly320 21%23 AIRPORT98 000 EDDH Germany Hamburg Hamburg-Fuhlsbuettel280 20%24 AIRPORT85 000 GCLP Canary Islands (Spain) Las Palmas - Gran Can Las Palmas - Gran Canaria240 26%25 AIRPORT63 000 EGPF United Kingdom Glasgow Glasgow Airport180 24%26 AIRPORT61 000 EGBB United Kingdom Birmingham Birmingham International Airport180 20%27 AIRPORT60 000 LFMN France Nice Nice Cote d'Azur170 17%28 AIRPORT52 000 ESSA Sweden Stockholm Stockholm - Arlanda150 9%29 AIRPORT46 000 GCFV Canary Islands (Spain) Puerto del Rosario Fuerteventura130 45%30 AIRPORT45 000 LFSB France Bale-Mulhouse Eurairport Bale-Mulhouse130 17%31 AIRPORT43 000 LEMG Spain Malaga Malaga130 17%32 AIRPORT42 000 EGPH United Kingdom Edinburgh Edinburgh120 16%33 AIRPORT42 000 LGIR Greece Heraklion Nikos Kazantzakis120 23%34 AIRPORT40 000 GCRR Canary Islands (Spain) Arrecife Lanzarote-Arrecife120 26%35 AIRPORT38 000 LPPR Portugal Porto Aeroporto Francisco Sa Carneiro110 26%36 AIRPORT34 000 LIML Italy Milan Milan - Linate100 14%37 AIRPORT27 000 LEIB Spain Ibiza Ibiza80 20%38 AIRPORT24 000 EDDN Germany Nurnberg Flughafen Nurnberg70 11%39 AIRPORT24 000 LIRN Italy Naples Naples International Airport70 13%40 AIRPORT23 000 ENGM Norway Oslo Oslo - Gardermoen70 6%41 AIRPORT23 000 EFHK Finland Helsinki Helsinki - Vantaa70 6%42 AIRPORT23 000 LIRQ Italy Florence Florence Amerigo Vespucci70 20%43 AIRPORT22 000 EDDT Germany Berlin Berlin Tegel (>= 2007: Berlin Brande70 6%44 AIRPORT21 000 LHBP Hungary Budapest Budapest Ferihegy70 9%45 AIRPORT20 000 LMML Malta Valleta Luqa60 15%46 AIRPORT19 000 LEMH Spain Mahon Menorca - Mahon Airport60 22%47 AIRPORT19 000 EGAC United Kingdom Belfast Belfast City60 21%48 AIRPORT18 000 LGTS Greece Thessaloniki Thessaloniki Makedonia60 12%49 AIRPORT18 000 LIMF Italy Turin Turin - Caselle60 11%50 AIRPORT15 000 LGRP Greece Rhodes Diagoras50 12%51 AIRPORT15 000 LEAL Spain Alicante Alicante50 10%52 AIRPORT14 000 GCTS Canary Islands (Spain) Tenerife Sur Tenerife - Reina Sofia40 7%53 AIRPORT11 000 LPFR Portugal Faro Faro Airport40 11%56 AIRPORT8 000 EDDI Germany Berlin Berlin Tempelhof30 7%58 AIRPORT8 000 LFST France Strasbourg Strasbourg Entzheim30 8%59 AIRPORT8 000 ELLX Luxembourg Luxembourg Luxembourg30 6%60 AIRPORT7 000 LGKO Greece Kos Kos Hippocratis30 18%61 AIRPORT7 000 LFLC France Clermont-Ferrand Clermont-Ferrand/Auvergne30 10%63 AIRPORT6 000 EDDC Germany Dresden Dresden20 5%64 AIRPORT6 000 EGJJ United Kingdom Jersey Jersey Airport20 6%65 AIRPORT5 000 LPFU Portugal Porto Santo Aeroporto de Funchal20 10%66 AIRPORT5 000 LGKR Greece Corfu Kerkyra - I. Kapodistrias20 8%
B - 15

EUROCONTROL / SDE / SCSECAC Study on Constraints to GrowthModelling ResultsAppendix B: Geographical Analysis of Unaccommodated Demand
Integrated Performance Analysis Tool (IPAT)Data version 01.03.2001 13:55:16
Intentionally left blank
B - 16