Embed Size (px)
Citation preview
Gen. Physiol. Biophys. (1982), 1, 269—279 269
Voltammetry of Cytochrome c3
from Desulfovibrio desulfuricans (strain Norway) at the Graphite Electrode
V. BRABEC 1 , P. BIANCO 2 and J. HALADJIAN 2
1 Institute of Biophysics, Czechoslovak Academy of Sciences, Královopolská 135, 612 65 Brno, Czechoslovakia 2 Laboratoire de Chimie et Electrochimie des Complexes, Université de Provence, Place Victor Hugo, 13331 Marseille Cedex 3, France
Abstract. Interfacial reactions of cytochrome c3 at a graphite electrode were studied in a neutral medium by means of the differential pulse and cyclic voltammetry. It was found that ferricytochrome c3 yielded three cathodic peaks G, d i and Cm at potentials of —0.3 to —0.5 V (vs. Ag/AgCl reference electrode) on the voltammograms. Upon anodic polarization this protein yielded two anodic peaks Ai and An at 0.66 V and 0.89 V, respectively. It was suggested that peak G, appearing at relatively low concentrations of the protein (5 x 10~9 mol/1), corresponded to a catalytic reaction, in which some of haemins of adsorbed molecules of ferricytochrome c3 were reduced to haems; these haemins could then be regenerated by chemical oxidation of the haem residues with oxygen adsorbed at the graphite surface. The next two cathodic peaks Cu and C m apparently corresponded to diffusion-controlled reduction of haemins bound in the nonadsorbed molecules of ferricytochrome c3. Anodic peaks Ai and An were suggested to correspond to electrode reactions identical to those corresponding to peaks A! and An of cytochrome c. This means that the electrooxidation of tyrosine residues is responsible for the appearance of the anodic peak Ai, whereas peak An corresponds to an anodic reaction of haemin residues.
Key words: Electrochemistry — Cytochrome c3 — Graphite electrode
Introduction
Cytochromes c3 function as macromolecular electron carriers in the sulphate reducing bacteria of the Desulfovibrio species. These molecules (m. w . ~ 1 3 000) consist of a single polypeptide chain wrapped around a very compact core of four haems which present a relatively high degree of exposure to the solvent (Haser et al. 1979). The haems in the protein are nonequivalent (Bianco and Haladjian 1981; Der Vartanian and Le Gall 1974) and noninteracting electrochemically (Niki et al. 1979).
270 Brabec et al
From the point of view of understanding the electron transfer reactions in which cytochromes c3 participate in vivo, investigations of the interaction of these proteins with the electrodes used in voltammetric (polarographic) analysis have shown themselves to be useful. Up to recently particularly mercury electrodes have been used in these studies. Cytochromes c3 are subjected at mercury electrodes to reduction-oxidation processes which correspond to rather fast electronic exchange (Bianco et al. 1979; Bianco and Haladjian 1979; Niki et al. 1977, 1979; Sokol et al. 1980).
The use of mercury electrodes makes it possible, however, to investigate the electrode processes appearing particularly at negative potentials because of the negligible anodic potential limit of these electrodes. The interfacial processes at surfaces charged positively can be followed by electrochemical techniques in connection with solid electrodes which have a significantly more positive anodic potential limit. Of the solid electrodes, particularly those made from graphite have proved useful for the investigation of anodic processes of proteins (Brabec 1980; Brabec and Mornstein 1980; Reynaud et al. 1980). Graphite electrodes have been also used in our previous work (Brabec et al. 1982) aimed at clarifying electrochemical reactions of horse heart cytochrome c containing only one haem. The goal of this report is to describe interfacial reactions of cytochrome c3 at an impregnated graphite electrode and to compare them with those yielded under the same experimental conditions by cytochrome c.
Material and Methods
Cytochrome c3 from Desulfovibrio desulfuricans (Norway strain) was a generous gift from Dr. M. Bruschi from Laboratoire de Chimie Bactérienne du C.N.R.S., Marseille. The protein was prepared and characterized as previously described (Bruschi et al. 1977). Horse heart cytochrome c (type VI) from the Sigma chemical Co. was used without further purification. The paraffin-wax impregnated spectroscopic graphite electrode (WISGE) was prepared and used as described earlier (Brabec 1979; Brabec and Mornstein 1980). Between runs the WISGE was resurfaced by polishing the end with emery polishing paper (Feuilles Papier Abrasif Emery Polishing, CEN 4/0). The WISGE had a geometric area of 7 mm2. The supporting electrolyte for voltammetric measurements used throughout this work was phosphate buffer. It was prepared by mixing KH2P04 and K2HPO4, both at a concentration 0.1 mol/1, to obtain pH 7.0.
Differential pulse (DP) voltammograms were obtained with a PAR Model 174A Polarographic Analyzer. All DP voltammograms were obtained with a pulse amplitude of 0.025 V and at a voltage sweep rate of 0.005 V s '. The current sampling for DP voltammetry at the graphite electrode was set with the drop time control of the PAR Model 174A at 0.5 s. Cyclic voltammetry (CV) experiments were performed with a system consisting of a PAR Model 175 Universal Programmer and a PAR Model 173 Potentiostat equipped with a PAR Model 176 Converter. Voltammetric curves were recorded on a Sefram XY recorder. In this paper all current values are reported according to the setting of current sensitivity on electrochemical analyzers. Since DP voltammetric currents were measured with the PAR Model 174A set, the DP voltammetric current was ten times amplified before its measurement. Thus the DP voltammetric current values reported here are ten times higher than the real ones. A Metrohm
Electrochemistry of Cytochrome c3 271
silver-silver chloride (satd. NaCl) electrode (Ag/AgCl) was used as reference electrode. Throughout this report, all potentials are given against Ag/AgCl reference electrode. Unless otherwise stated oxygen was purged from solutions by bubbling U-grade nitrogen for 30 minutes before recording the voltammogram. The basic procedure for DP and cyclic voltammetry has been described previously (Brabec 1979; Brabec and Mornstein 1980; Brabec et al. 1982). Briefly, once the graphite electrode was inserted into the test solution contained in the electrochemical cell it was allowed to stand ca. 10 s without an applied potential. Then, unless stated otherwise, the initial potential (E) was applied for a further 120 s, after which time the voltammetric sweep was commenced. The electrochemical experiments were performed at 27°C. Other details of our measurements have been published elsewhere (Brabec 1979, 1980; Brabec and Mornstein 1980; Brabec et al. 1982).
Results
Differential pulse voltammetry
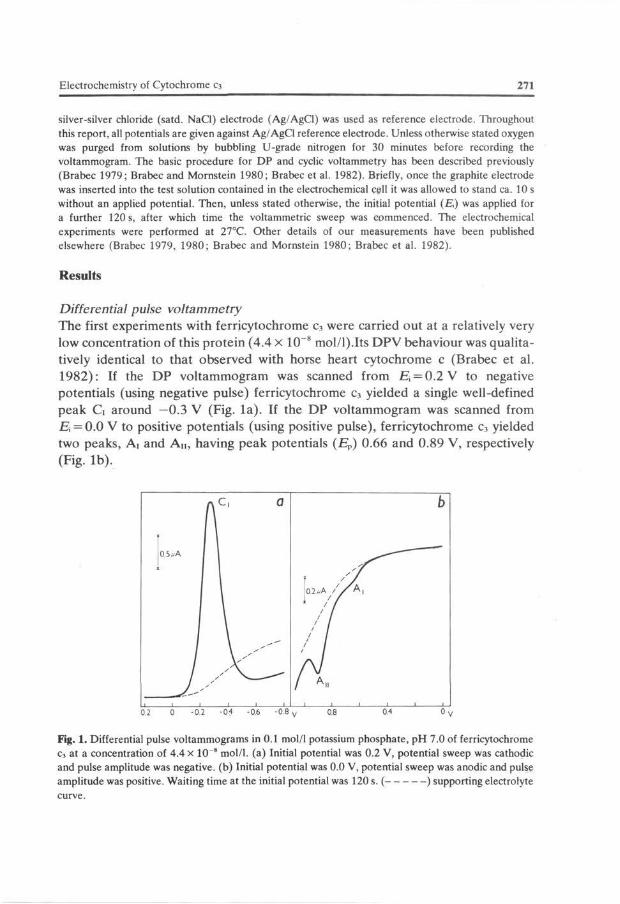
The first experiments with ferricytochrome c3 were carried out at a relatively very low concentration of this protein (4.4 x 10~8 mol/l).Its DPV behaviour was qualitatively identical to that observed with horse heart cytochrome c (Brabec et al. 1982): If the DP voltammogram was scanned from R, = 0.2 V to negative potentials (using negative pulse) ferricytochrome c3 yielded a single well-defined peak G around —0.3 V (Fig. la) . If the DP voltammogram was scanned from E = 0.0 V to positive potentials (using positive pulse), ferricytochrome c3 yielded two peaks, Ai and A n , having peak potentials (Ep) 0.66 and 0.89 V, respectively (Fig. lb) .
0 2 0 -0 2 -04 -06 -0 8 v 0.8 04 0 V
Fig. 1. Differential pulse voltammograms in 0.1 mol/1 potassium phosphate, pH 7.0 of ferricytochrome c3 at a concentration of 4.4 x 10" mol/1. (a) Initial potential was 0.2 V, potential sweep was cathodic and pulse amplitude was negative, (b) Initial potential was 0.0 V, potential sweep was anodic and pulse amplitude was positive. Waiting time at the initial potential was 120 s. ( ) supporting electrolyte curve.
272 Brabec et al.
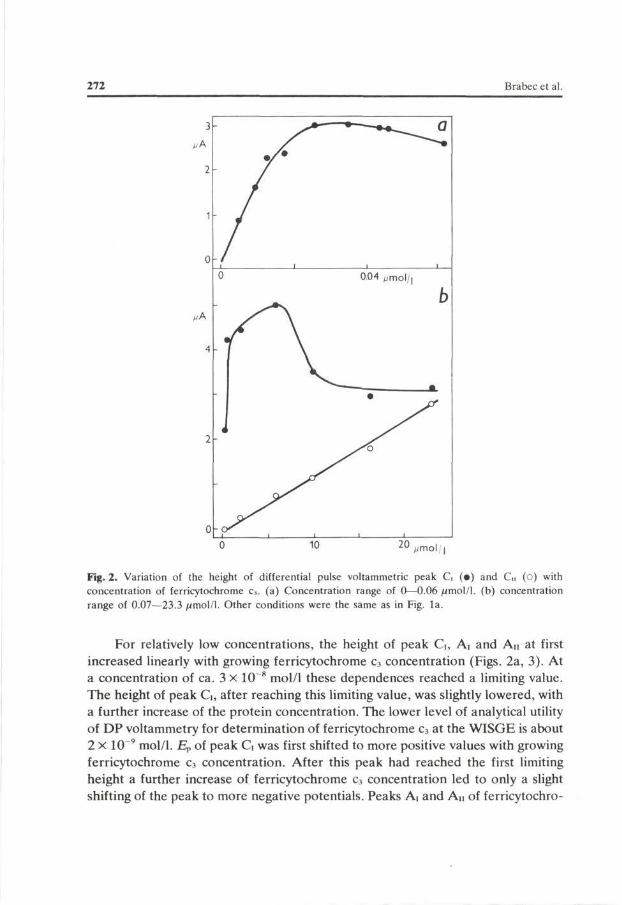
Fig. 2. Variation of the height of differential pulse voltammetric peak C, (•) and d (o) with concentration of ferricytochrome c3. (a) Concentration range of 0—0.06 /imol/1. (b) concentration range of 0.07—23.3 //mol/1. Other conditions were the same as in Fig. la.
For relatively low concentrations, the height of peak G, Ai and An at first increased linearly with growing ferricytochrome c3 concentration (Figs. 2a, 3). At a concentration of ca. 3 X 10 8 mol/1 these dependences reached a limiting value. The height of peak G, after reaching this limiting value, was slightly lowered, with a further increase of the protein concentration. The lower level of analytical utility of DP voltammetry for determination of ferricytochrome c3 at the WISGE is about 2 x 10~9 mol/1. Ep of peak G was first shifted to more positive values with growing ferricytochrome c3 concentration. After this peak had reached the first limiting height a further increase of ferricytochrome c3 concentration led to only a slight shifting of the peak to more negative potentials. Peaks Ai and An of ferricytochro-
Electrochemistry of Cytochrome c3 273
A
02
01
/ •
/ •
/ •
•
004 006 m o .
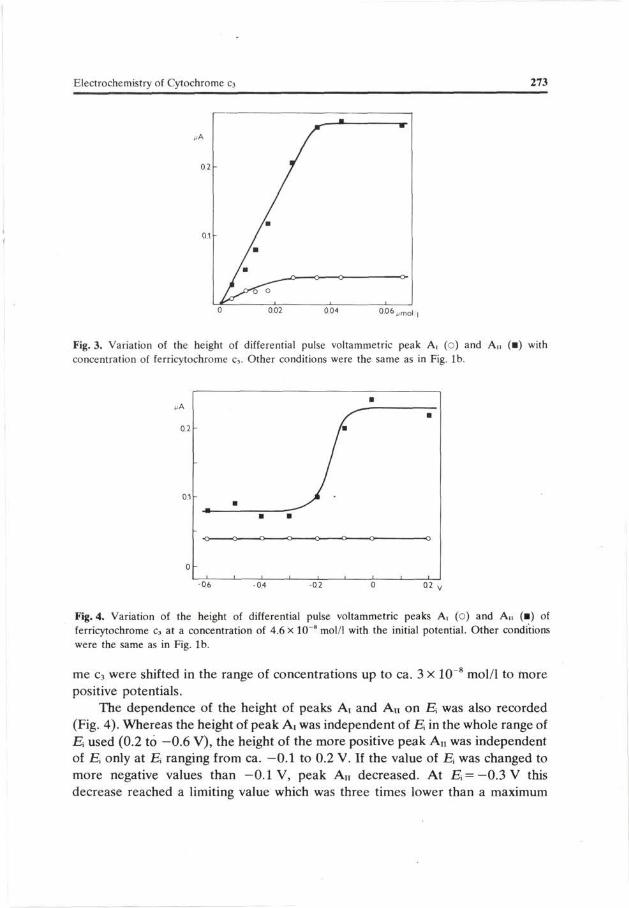
Fig. 3. Variation of the height of differential pulse voltammetric peak A, (o) and An (•) with concentration of ferricytochrome c3. Other conditions were the same as in Fig. lb.
A
02
01
0
-
'
•
I
•
'
•
1 '
/ •
1
•
I
•
1 1 06 02
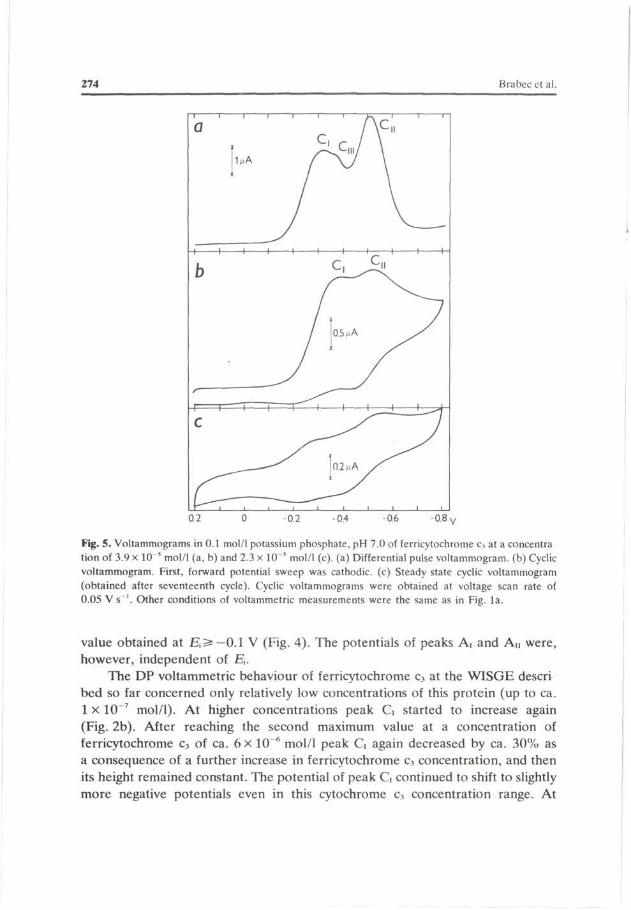
Fig. 4. Variation of the height of differential pulse voltammetric peaks A, (o) and An (•) of ferricytochrome c3 at a concentration of 4.6 x 10" mol/1 with the initial potential. Other conditions were the same as in Fig. lb.
me c3 were shifted in the range of concentrations up to ca. 3 X 10~8 mol/1 to more positive potentials.
The dependence of the height of peaks Ai and A n on E, was also recorded (Fig. 4). Whereas the height of peak Ar was independent of E in the whole range of Ei used (0.2 to —0.6 V), the height of the more positive peak A n was independent of H, only at J5 ranging from ca. —0.1 to 0.2 V. If the value of E was changed to more negative values than —0.1 V, peak An decreased. At E, = — 0.3 V this decrease reached a limiting value which was three times lower than a maximum
274 Brabec et al.
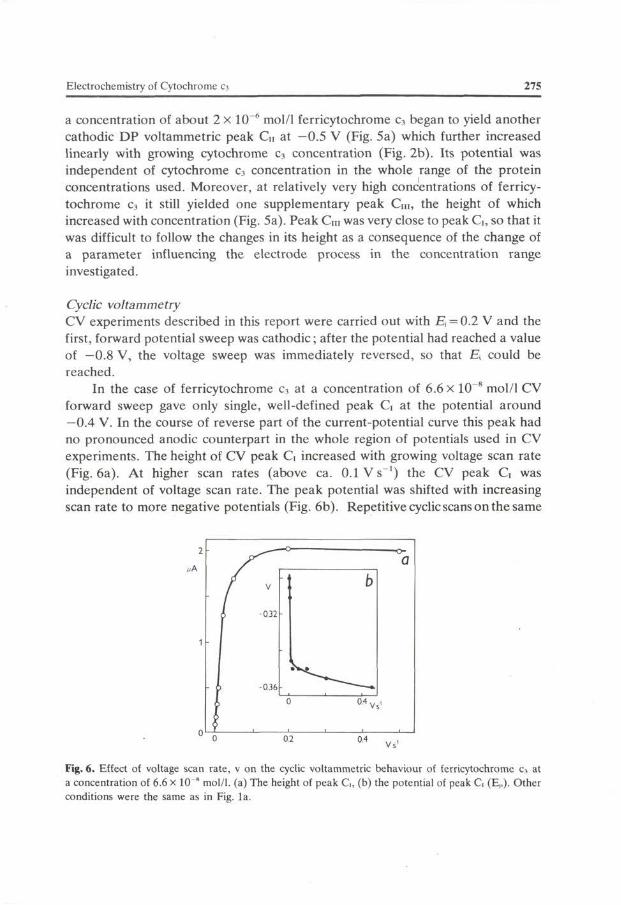
Fig. 5. Voltammograms in 0.1 mol/1 potassium phosphate, pH 7.0 of ferricytochrome c3 at a concentra tion of 3.9 x 10" mol/1 (a, b) and 2.3 x 10" mol/1 (c), (a) Differential pulse voltammogram. (b) Cyclic voltammogram. First, forward potential sweep was cathodic. (c) Steady state cyclic voltammogram (obtained after seventeenth cycle). Cyclic voltammograms were obtained at voltage scan rate of 0.05 V s '. Other conditions of voltammetric measurements were the same as in Fig. la.
value obtained at E^—0.l V (Fig. 4). The potentials of peaks Ai and An were, however, independent of E.
The DP voltammetric behaviour of ferricytochrome c3 at the WISGE descri bed so far concerned only relatively low concentrations of this protein (up to ca. 1 x 10"7 mol/1). At higher concentrations peak G started to increase again (Fig. 2b). After reaching the second maximum value at a concentration of ferricytochrome c3 of ca. 6 X 10~6 mol/1 peak G again decreased by ca. 30% as a consequence of a further increase in ferricytochrome c3 concentration, and then its height remained constant. The potential of peak G continued to shift to slightly more negative potentials even in this cytochrome c3 concentration range. At
Electrochemistry of Cytochrome c3 275
a concentration of about 2 x 10~* mol/1 ferricytochrome c3 began to yield another cathodic DP voltammetric peak Cu at —0.5 V (Fig. 5a) which further increased linearly with growing cytochrome c3 concentration (Fig. 2b). Its potential was independent of cytochrome c3 concentration in the whole range of the protein concentrations used. Moreover, at relatively very high concentrations of ferricytochrome c3 it still yielded one supplementary peak Cm, the height of which increased with concentration (Fig. 5a). Peak Cm was very close to peak G, so that it was difficult to follow the changes in its height as a consequence of the change of a parameter influencing the electrode process in the concentration range investigated.
Cyclic voltammetry CV experiments described in this report were carried out with E = 0.2 V and the first, forward potential sweep was cathodic; after the potential had reached a value of —0.8 V, the voltage sweep was immediately reversed, so that E, could be reached.
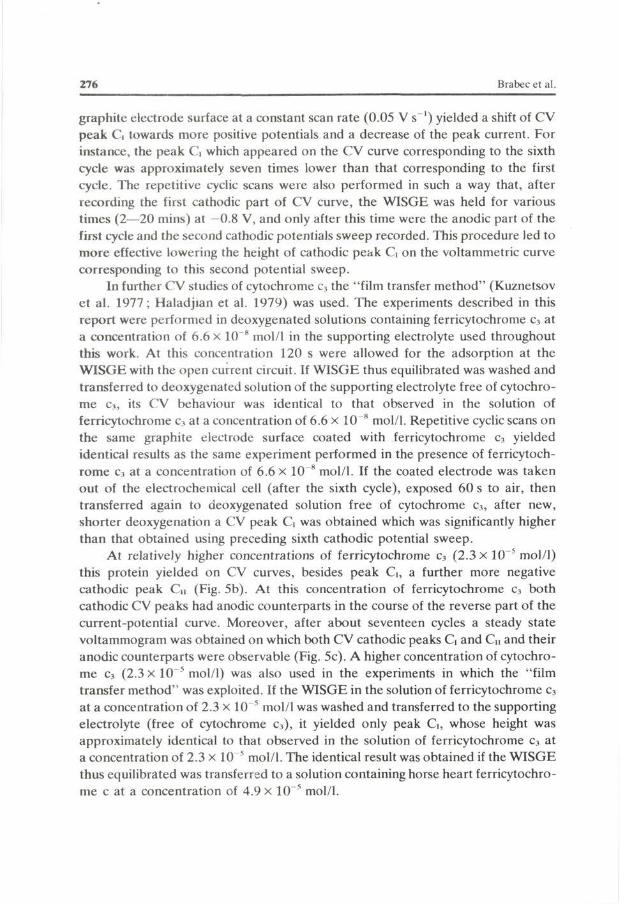
In the case of ferricytochrome c3 at a concentration of 6.6 X 10~8 mol/1 CV forward sweep gave only single, well-defined peak G at the potential around —0.4 V. In the course of reverse part of the current-potential curve this peak had no pronounced anodic counterpart in the whole region of potentials used in CV experiments. The height of CV peak G increased with growing voltage scan rate (Fig. 6a). At higher scan rates (above ca. O. IVs - 1 ) the CV peak G was independent of voltage scan rate. The peak potential was shifted with increasing scan rate to more negative potentials (Fig. 6b). Repetitive cyclic scans on the same
2
1
0 ° 02 °-4 vs1
Fig. 6. Effect of voltage scan rate, v on the cyclic voltammetric behaviour of ferricytochrome c3 at a concentration of 6.6 x 10"" mol/1. (a) The height of peak G, (b) the potential of peak G (Ep). Other conditions were the same as in Fig. la.
276 Brabec et al.
graphite electrode surface at a constant scan rate (0.05 V s 1 ) yielded a shift of CV peak G towards more positive potentials and a decrease of the peak current. For instance, the peak G which appeared on the CV curve corresponding to the sixth cycle was approximately seven times lower than that corresponding to the first cycle. The repetitive cyclic scans were also performed in such a way that, after recording the first cathodic part of CV curve, the WISGE was held for various times (2—20 mins) at —0.8 V, and only after this time were the anodic part of the first cycle and the second cathodic potentials sweep recorded. This procedure led to more effective lowering the height of cathodic peak G on the voltammetric curve corresponding to this second potential sweep.
In further CV studies of cytochrome c3 the "film transfer method" (Kuznetsov et al. 1977; Haladjian et al. 1979) was used. The experiments described in this report were performed in deoxygenated solutions containing ferricytochrome c3 at a concentration of 6.6 x 10~8 mol/1 in the supporting electrolyte used throughout this work. At this concentration 120 s were allowed for the adsorption at the WISGE with the open current circuit. If WISGE thus equilibrated was washed and transferred to deoxygenated solution of the supporting electrolyte free of cytochrome c3, its CV behaviour was identical to that observed in the solution of ferricytochrome c3 at a concentration of 6.6 x 10 8 mol/1. Repetitive cyclic scans on the same graphite electrode surface coated with ferricytochrome c3 yielded identical results as the same experiment performed in the presence of ferricytochrome c3 at a concentration of 6.6 x 10"8 mol/1. If the coated electrode was taken out of the electrochemical cell (after the sixth cycle), exposed 60 s to air, then transferred again to deoxygenated solution free of cytochrome c3, after new, shorter deoxygenation a CV peak G was obtained which was significantly higher than that obtained using preceding sixth cathodic potential sweep.
At relatively higher concentrations of ferricytochrome c3 (2.3 x 10~5 mol/1) this protein yielded on CV curves, besides peak G, a further more negative cathodic peak Cn (Fig. 5b). At this concentration of ferricytochrome c3 both cathodic CV peaks had anodic counterparts in the course of the reverse part of the current-potential curve. Moreover, after about seventeen cycles a steady state voltammogram was obtained on which both CV cathodic peaks G and Cn and their anodic counterparts were observable (Fig. 5c). A higher concentration of cytochrome c3 (2.3 X 10~5 mol/1) was also used in the experiments in which the "film transfer method" was exploited. If the WISGE in the solution of ferricytochrome c3
at a concentration of 2.3 x 10~5 mol/1 was washed and transferred to the supporting electrolyte (free of cytochrome c3), it yielded only peak G, whose height was approximately identical to that observed in the solution of ferricytochrome c3 at a concentration of 2.3 x 10"5 mol/1. The identical result was obtained if the WISGE thus equilibrated was transferred to a solution containing horse heart ferricytochrome c at a concentration of 4.9 x 10~5 mol/1.
Electrochemistry of Cytochrome c3 277
Discussion
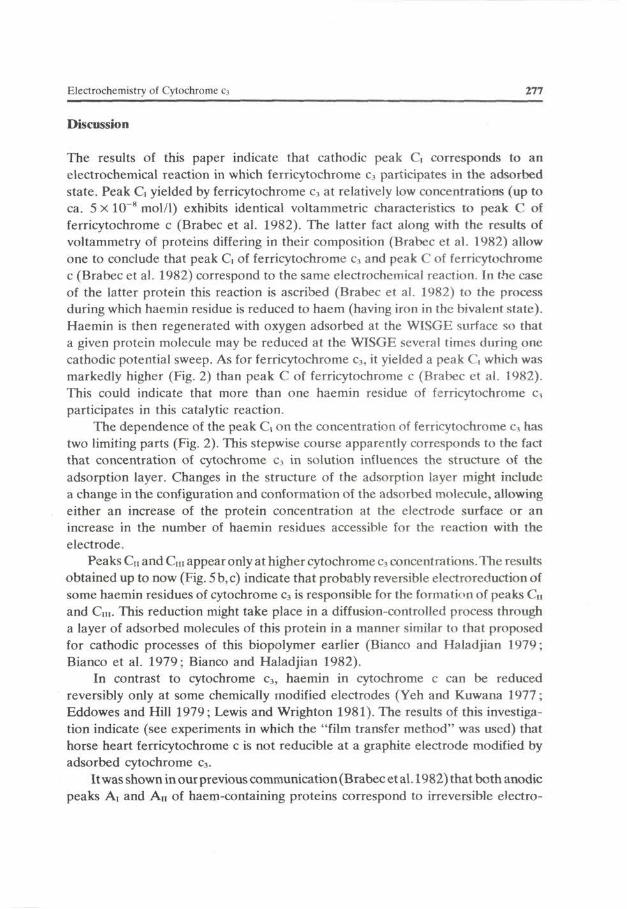
The results of this paper indicate that cathodic peak G corresponds to an electrochemical reaction in which ferricytochrome c3 participates in the adsorbed state. Peak G yielded by ferricytochrome c3 at relatively low concentrations (up to ca. 5 x 10~8 mol/1) exhibits identical voltammetric characteristics to peak C of ferricytochrome c (Brabec et al. 1982). The latter fact along with the results of voltammetry of proteins differing in their composition (Brabec et al. 1982) allow one to conclude that peak G of ferricytochrome c3 and peak C of ferricytochrome c (Brabec et al. 1982) correspond to the same electrochemical reaction. In the case of the latter protein this reaction is ascribed (Brabec et al. 1982) to the process during which haemin residue is reduced to haem (having iron in the bivalent state). Haemin is then regenerated with oxygen adsorbed at the WISGE surface so that a given protein molecule may be reduced at the WISGE several times during one cathodic potential sweep. As for ferricytochrome c3, it yielded a peak G which was markedly higher (Fig. 2) than peak C of ferricytochrome c (Brabec et al. 1982). This could indicate that more than one haemin residue of ferricytochrome c3
participates in this catalytic reaction.
The dependence of the peak G on the concentration of ferricytochrome c3 has two limiting parts (Fig. 2). This stepwise course apparently corresponds to the fact that concentration of cytochrome c3 in solution influences the structure of the adsorption layer. Changes in the structure of the adsorption layer might include a change in the configuration and conformation of the adsorbed molecule, allowing either an increase of the protein concentration at the electrode surface or an increase in the number of haemin residues accessible for the reaction with the electrode.
Peaks Cn and Cm appear only at higher cytochrome c3 concentrations. The results obtained up to now (Fig. 5b,c) indicate that probably reversible electroreduction of some haemin residues of cytochrome c3 is responsible for the formation of peaks Cn
and Cm. This reduction might take place in a diffusion-controlled process through a layer of adsorbed molecules of this protein in a manner similar to that proposed for cathodic processes of this biopolymer earlier (Bianco and Haladjian 1979; Bianco et al. 1979; Bianco and Haladjian 1982).
In contrast to cytochrome c3, haemin in cytochrome c can be reduced reversibly only at some chemically modified electrodes (Yeh and Kuwana 1977; Eddowes and Hill 1979; Lewis and Wrighton 1981). The results of this investigation indicate (see experiments in which the "film transfer method" was used) that horse heart ferricytochrome c is not reducible at a graphite electrode modified by adsorbed cytochrome c3.
It was shown in our previous communication (Brabec et al. 1982) that both anodic peaks Ai and An of haem-containing proteins correspond to irreversible electro-
278 Brabec et al.
chemical reactions of the protein adsorbed at the graphite electrode: peak Ai corresponds to the electrooxidation of tyrosine residues, whereas the more positive peak An corresponds to an electrode reaction in which haemin or haem participate. The dependence of the height of anodic peak An of ferricytochrome c3 on the initial potential (Fig. 4) had a qualitatively similar course to the same dependence obtained for ferricytochrome c (Brabec et al. 1982). In the latter case it was suggested that the reduction of ferricytochrome c at the graphite electrode charged to more negative potentials (potentials of peak C) led to a change in the conformation of the adsorbed protein. A change in the haem configuration in the electrode surface that would not be favourable to the electrode reaction responsible for the appearance of peak An might be a consequence of this conformational change. The height of peak An of ferricytochrome c3 was decreased three times if
the initial potential was changed from the value of 0—0.2 V to —0.3 0.6 V (Fig. 4). This fact might indicate that three haemins were electrooxidizable in the adsorbed molecule of cytochrome c3 at potentials of peak An if the electrode was prepolarized to 0 — 0.2 V. On the other hand, the prepolarization to —0.3— -0 .6 V (at which cytochrome c3 was apparently reduced at the graphite electrode) caused such change in adsorbed protein molecule that only one haem remained accessible for electrooxidation at potentials of peak An.
In conclusion it can be summarized that the advantage of the use of graphite electrodes in investigations of interfacial reactions of haem-containing proteins consists in the possibility of obtaining new information, particularly on properties of these compounds at a positively charged surface. This work further demonstrates that graphite electrode can easily be used in a form modified by physically adsorbed biomacromolecules. Electrodes thus modified could be exploited, for instance, in biotechnology in those cases where only a small amount of a chemically or biologically active biopolymer is available.
References
Bianco P., Fauque G., Haladjian J. (1979): Electrode reaction of cytochrome c3 from "Desulfovibrio vulgaris" Hildenborough and "Desulfovibrio desulfuricans" Norway. Bioelectrochem. Bioenerg. 6, 385—391
Bianco P., Haladjian J. (1979): Study of cytochrome c3 from Desulfovibrio vulgaris (Hildenborough) and Desulfovibrio desulfuricans (Norway) by differential pulse polarography and spectroelectro-chemical method. Biochim. Biophys. Acta 545, 86—93
Bianco P., Haladjian J. (1981): Current-potential responses for a tetrahemic protein: A method of determining the individual half wave potentials of cytochrome c3 from Desulfovibrio desulfuricans strain Norway. Electrochim. Acta 26, 1001—1004
Bianco P., Haladjian J. (1982): Electrochemical investigations of cytochrome c3 from Desulfovibrio desulfuricans Norway at solid electrodes. J. Electroanal. Chem. (in press)
Electrochemistry of Cytochrome c3 279
Brabec V. (1979): Interaction of nucleic acids with electrically charged surfaces. VI. A comparative study on the electrochemical behaviour of native and denatured DNAs at graphite electrodes. Biophys. Chem. 9, 289—297
Brabec V. (1980): Electrochemical oxidation of nucleic acids and proteins at graphite electrode. Qualitative aspects. Bioelectrochem. Bioenerg. 7, 69—82
Brabec V., Bianco P., Haladjian J. (1982): Electrochemical reactions of horse heart cytochrome c at graphite electrodes. Biophys. Chem. (in press)
Brabec V., Mornstein V. (1980): Electrochemical behaviour of proteins at graphite electrodes. I. Electrooxidation of proteins as a new probe of protein structure and reactions. Biochim. Biophys. Acta 625, 43—50
Bruschi M., Hatchikian C. E., Golovleva L. A., Le Gall J. (1977): Purification and characterization of cytochrome c3, ferredescin, and rubredoxin isolated from Desulfovibrio desulfuricans Norway. J. Bacterid. 129, 30—38.
Der Vartanian D., Le Gall J. (1974): A monomolecular electron transfer chain: structure and function of cytochrome c3. Biochim. Biophys. Acta 346, 79—99
Eddowes M. J., Hill H. A. O. (1979): Electrochemistry of horse heart cytochrome c. J. Amer. Chem. Soc. 101, 4 4 6 1 ^ 4 6 4
Haladjian J., Bianco P., Serre P. A. (1979): Role of adsorption in the electrochemical behaviour of cytochrome c at the mercury electrode. Bioelectrochem. Bioenerg. 6, 555—561
Haser R., Pierrot M., Frey M., Payan F., Astier J. P., Bruschi M., Le Gall J. (1979): Structure and sequence of the multihaem cytochrome c3. Nature 282, 806—810
Kuznetsov B. A., Shumakovich G. P., Mestechkina N. M. (1977): The reduction mechanism of cytochrome c and methemoglobin on the mercury electrode. Bioelectrochem. Bioenerg. 4, 512—521
Lewis N. S., Wrighton M. S. (1981): Electrochemical reduction of horse heart ferricytochrome c at chemically derivatized electrodes. Science 211, 944—947
Niki K., Yagi T., Inokuchi H., Kimura J. (1977): Electrode reaction of cytochrome c3 of Desulfovibrio vulgaris, Miyazaki. J. Electrochem. Soc. 124, 1889—1891
Niki K , Yagi T., Inokuchi H , Kimura K. (1979): Electrochemical behavior of cytochrome c3 of Desulfovibrio vulgaris, strain Miyazaki, on the mercury electrode. J. Amer. Chem. Soc. 101, 3335—3340
Reynaud J. A., Malfoy B., Bere A. (1980): The electrochemical oxidation of three proteins: RNase, bovine serum albumin and concavalin A at solid electrodes. Bioelectrochem. Bioenerg. 7, 595—606
Sokol W. F., Evans D. H., Niki K , Yagi T. (1980): Reversible voltammetric response for a molecule containing four non-equivalent redox sites with application to cytochrome c3 of Desulfovibrio vulgaris, strain Miyazaki. J. Electroanal. Chem. 108, 107—115
Yeh P., Kuwana T. (1977): Reversible electrode reaction of cytochrome c. Chem. Lett. 1145—1148
Received March 23, 1982 / Accepted April 30, 1982