Embed Size (px)
Citation preview
U. S. DEPARTMENT OF THE INTERIOR
U.S. GEOLOGICAL SURVEY
VOLCANIC GAS EMISSIONS AND THEIR IMPACT ON AMBIENT AIR CHARACTER AT KILAUEA VOLCANO, HAWAII
By A. J. Sutton, T. Elias, and R. Navarrete1
OPEN-FILE REPORT 94-569
Prepared in cooperation with the U.S. Department of Energy
This report is preliminary and has not been reviewed for conformity with U.S. Geological Survey editorial standards or with the North American Stratigraphic Code. Any use of trade, product, or firm names is for descriptive purposes only and does not imply endorsement by the U.S. Government. _________
1. Hawaiian Volcano Observatory, Hawaii National Park, Hawaii 96718
Abstract
Currently, gas emissions from Kilauea occur from the summit caldera, along the middle East Rift Zone (ERZ), and where lava enters the ocean. We estimate that the current ERZ eruption of Kilauea releases between 400 metric tonnes of SO2 per day, during eruptive pauses, to as much as 1850 metric tonnes per day during actively erupting periods, along with lesser amounts of other chemically and radiatively active species including H2S, HCl, and HF. In order to characterize gas emissions from Kilauea in a meaningful way for assessing environmental impact, we made a series of replicate grab-sample measurements of ambient air and precipitation at the summit of Kilauea, along its ERZ, and at coastal sites where lava enters the ocean. The grab-sampling data combined with SO2 emission rates, and continuous air quality and meteorological monitoring at the summit of Kilauea show that the effects of these emissions on ambient air character are a complex function of chemical reactivity, source geometry and effusivity, and local meteorology. For all the measurement sites, ambient concentrations of the emitted gases decrease rapidly, even at short distances from point sources. Prevailing tradewinds typically carry the gases and aerosols released to the southwest, where they are further distributed by the regional wind regime. Episodes of kona, or low speed variable winds sometimes disrupt this pattern, however, and allow the gases and their oxidation products to collect at the summit and eastern side of the island. Summit solfatara areas of Kilauea are distinguished by moderate to high ambient SO2, high H2S at one location, and low H2S at all others, and negligible HCl concentrations, as measured 1 m from degassing point-sources. Summit solfatara rain water has high sulfate and low chloride ion concentrations, and low pH. The middle ERZ degassing areas show moderate to high SO2 at 100 m away from degassing lava, and low H2S concentrations. Moderate HCl was found in ambient air. Rain water near the middle ERZ degassing areas have high sulfate, high chloride and low pH. Coastal-entry areas are characterized by high HCl in the gas plume and significant rain-out of this HCl as indicated by low rain water pH, and high rain water chloride. Sulfate in the coastal-entry rainwater is also high. Ambient SO2 and H2S are moderate to high near the coastal entry locations. Ambient air in the lower ERZ thermal and non-thermal areas shows essentially no influence from the on-going eruption, as evidenced by the absence of SO2, H2S, HCl, and the moderate rain water pH with low sulfate concentration. When the current eruption ceases, ERZ and summit gas emissions will be greatly reduced.
1
Introduction Gases and aerosols released from point sources on Kilauea volcano, from the summit caldera, along the rift zones, and at locations where lava enters the ocean, affect the air on and near the volcano (figure 1). Several fumarole (volcanic gas vent) studies that have focused on characterizing gases as they rise out of the magma (Jaggar, 1940; Greenland, 1984, 1986; Gerlach, 1980, 1986,1993) are useful for elucidating volcanic processes, and physicochemical conditions in the melt. Emission-rate studies (Stoiber and others, 1979; Casadevall and others, 1987; Andres and others, 1989) provide information on total flux of different species, typically sulfur dioxide and carbon dioxide. Neither the emission-rate studies, nor the fumarole studies directly address the question: "What are the gas concentrations on the ground outside of the volcanic vent?" The purpose of our present study is to characterize gas emissions from Kilauea volcano in a way that is meaningful for assessing environmental impact. We have done this by measuring volcanic gas concentrations near their points of origin, thereby reporting the highest volcanic gas concentrations present in the ambient air. This is done, recognizing that by diffusion, dilution, and chemical reaction, gas concentrations in places away from the volcanic degassing sources will be lower than gas concentrations measured right at the point source. We have synthesized the gas concentration data with SO2 emission rates, precipitation chemistry, and continuously monitored air quality data in order to better constrain what the volcanic emissions are and how they affect ambient air character. Volcanic gases from Kilauea are principally released from fumaroles and fissures in the summit caldera, and along the rift zones. These primary degassing zones are manifested as thermal areas and are summarized by Casadevall and Hazlett (1983). The present east rift eruption, which started in 1983, has modified the general model presented by Casadevall and Hazlett, by focusing much of the degassing activity near the Pu'u 'O'o vent and the active tube system that transports lava to the coastal entries (figure 1). For the first three years of the eruption, activity was localized at Pu'u 'O'o which produced episodic fountaining events until 1986. Continuous effusion of lava began in 1986 (episode 48), with the formation of the Kupaianaha lava pond 3 km downrift of Pu'u 'O'o. Kupaianaha ceased eruptive activity in early 1992, but the eruption has continued from vents near Pu’u ‘O’o, except for a few short pauses. Volcanic gases potentially affecting ambient air character are sulfur dioxide (SO2) hydrogen sulfide (H2S), and hydrochloric acid (HCl). Other gases of environmental concern, including hydrofluoric acid (HF), carbon monoxide (CO) and carbon dioxide (CO2) are present at concentrations too low to be of concern. The first two gases, SO2 and H2S, are released directly from the volcano (Gerlach, 1980; Greenland, 1987); the third gas, HCl, is present to a small extent in primary volcanic gas, but more
2
significantly, is produced by the interaction of hot (1100 oC) lava and sea water (Gerlach and others, 1989). The environmental fate of these gases is a function of their reactivities, the volcanic gas production rate and prevailing meteorological conditions, principally wind speed and direction.
Method of Study We characterized Kilauea's background gas emissions using a threefold approach (figure 1): 1) Ambient-air and precipitation grab-sample measurements at Kilauea’s summit, upper East Rift Zone (ERZ), middle ERZ, lower ERZ and coastal-entry sites; 2) Continuous air quality monitoring at the summit of Kilauea; 3) Intermittent SO2 emission-rate measurements at Kilauea’s summit and middle ERZ. These three methods produce distinctly different data, and are most productively used together; no single technique being adequate to define the system. Ambient-air grab-sample measurements Grab-sample measurements were carried out in order to constrain maximum concentrations of H2S, SO2, and HCl likely to be found around primary degassing areas of Kilauea. Multiple measurements, using several techniques described below, were made at each sampling site under a variety of measured meteorological conditions. Precipitation samples were collected during the time intervals between ambient air measurement site visits. Collectors for this purpose were typically 0.5 to 1.0 liter polypropylene, polycarbonate or high density polyethylene bottles, fit with 14 cm polyethylene funnels containing a glass-wool plug to filter out large debris. Samples were collected as frequently as biweekly, and as infrequently as monthly. No attempt was made to measure precipitation volume. Formaldehyde was added to the samples to prevent algal or bacterial growth and none of the samples analyzed showed evidence of such growth. Samples collected were generally clear and colorless. Only one sample, taken from the B-site on 7/27/93, was pre-filtered before analysis to remove glass wool fragments. Analytical methods for field and laboratory measurements - H2S - was determined using a thin-film resistivity analyzer (Jerome Model 631-X, Arizona Instruments, Tempe Arizona) selective for H2S, in the range 0.001 to 50 parts per million (ppm), with an accuracy of ±6 to ±8 % over the dynamic range of measurement. H2S was also determined selectively, using Drager colorimetric detector tubes (Drager, FRG) in the range 0.5 to 15 ppm. Drager tubes have an advertised precision of 5 to 10 % relative standard deviation and an accuracy of ± 25% (Lodge, 1989), these figures being influenced by levels of relative humidity.
3
SO2 - was determined instrumentally using a fuel-cell sensor (Exotox Model 70, Neotronics of North America, Gainesville GA) in the range 0.1 to 99.9 ppm, with a resolution of 0.1 ppm. SO2 was also determined by Drager tubes in three ranges, 0.1 to 3 ppm, 0.5 to 5 ppm, and 1 to 25 ppm. Cross-sensitivity to H2S in the presence of SO2 was considered when reporting measured concentrations. HCl - was determined using Drager tubes for the range 0.5 to 10 ppm. Cross-sensitivity to other mineral acids was considered. Wind velocity - was determined using a wind counter (Model 2411,Weathertronics, Sacramento, CA ) mounted 4 meters above the ground, averaged over a period of 5 minutes, with wind direction being taken directly from Brunton field compass measurement. Uncertainty in wind speed determination, ± 30 %; uncertainty in wind direction determination, ±10 degrees. Relative humidity - was determined by sling psychrometer wet bulb/dry bulb temperature measurements correlated with U.S. Weather Service relative humidity charts. Uncertainty ± 15 %. Temperature - was taken from relative humidity dry bulb. Uncertainty, ± 0.5 degree C. Barometric Pressure - was measured with an Atmospheric Instruments Research (Boulder CO) model AIR-HB-1A hand-held altimeter/barometer. Rainwater pH - was determined in the laboratory by temperature-compensated pH electrode with an Orion Model 250A ion meter, using 2-point standardization. Estimated uncertainty, ± 0.05 pH units. Rainwater Chloride - was determined using an Orion model 96-17 chloride ion selective electrode and an Orion model 250A ion meter. All rainwater samples were pretreated with hydrogen peroxide to eliminate sulfide interference. A six point standardization curve was constructed using primary standard sodium chloride solutions bracketing the concentration of samples measured. Estimated uncertainty in these measurements is ±15%. Rainwater Sulfate - was determined turbidimetrically by precipitating barium sulfate in a controlled-viscosity acidic matrix. Turbidity of the samples was measured at 400 nm on a Milton-Roy Minispec-20 according to established procedures provided with the instrument. An 8-point standardization curve was constructed using primary standard sodium sulfate solutions bracketing the
4
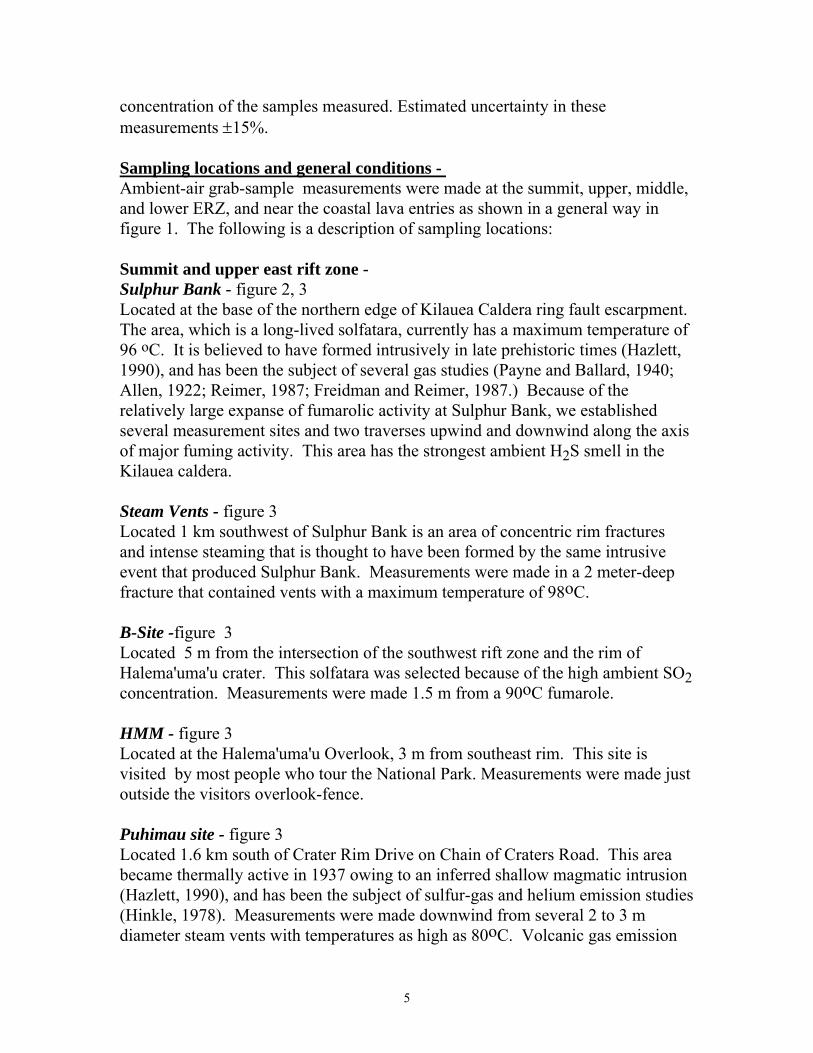
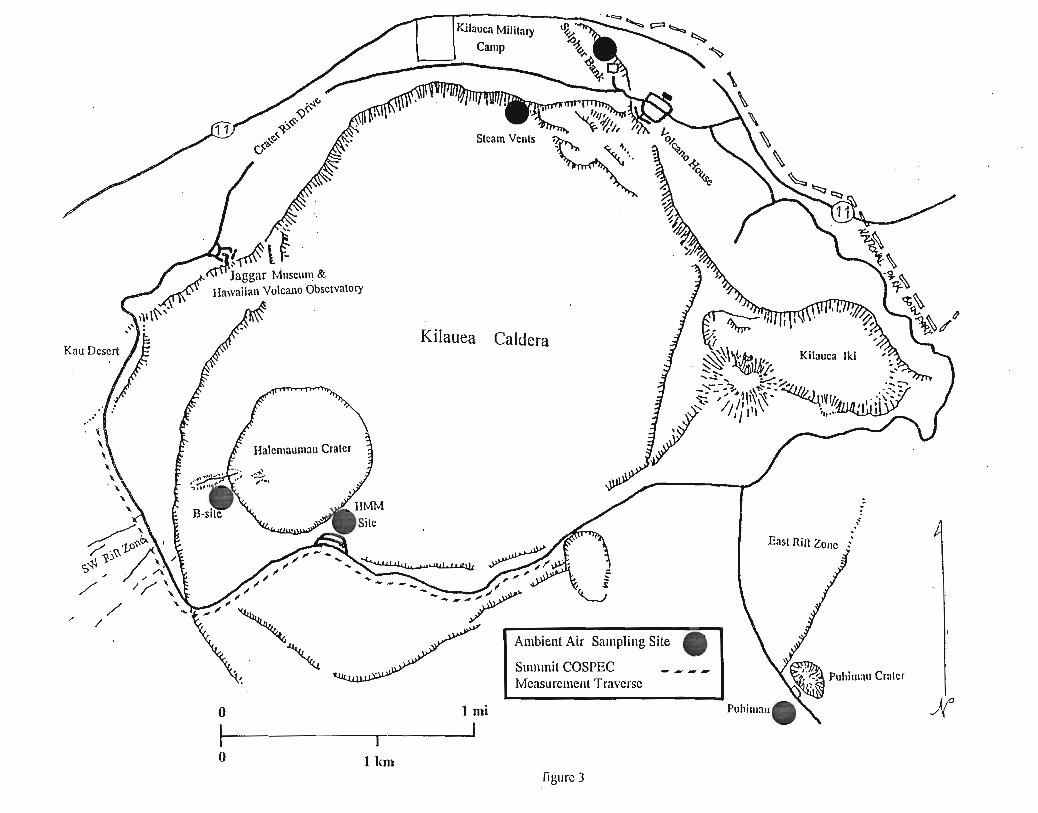
concentration of the samples measured. Estimated uncertainty in these measurements ±15%. Sampling locations and general conditions - Ambient-air grab-sample measurements were made at the summit, upper, middle, and lower ERZ, and near the coastal lava entries as shown in a general way in figure 1. The following is a description of sampling locations: Summit and upper east rift zone - Sulphur Bank - figure 2, 3 Located at the base of the northern edge of Kilauea Caldera ring fault escarpment. The area, which is a long-lived solfatara, currently has a maximum temperature of 96 oC. It is believed to have formed intrusively in late prehistoric times (Hazlett, 1990), and has been the subject of several gas studies (Payne and Ballard, 1940; Allen, 1922; Reimer, 1987; Freidman and Reimer, 1987.) Because of the relatively large expanse of fumarolic activity at Sulphur Bank, we established several measurement sites and two traverses upwind and downwind along the axis of major fuming activity. This area has the strongest ambient H2S smell in the Kilauea caldera. Steam Vents - figure 3 Located 1 km southwest of Sulphur Bank is an area of concentric rim fractures and intense steaming that is thought to have been formed by the same intrusive event that produced Sulphur Bank. Measurements were made in a 2 meter-deep fracture that contained vents with a maximum temperature of 98oC. B-Site -figure 3 Located 5 m from the intersection of the southwest rift zone and the rim of Halema'uma'u crater. This solfatara was selected because of the high ambient SO2 concentration. Measurements were made 1.5 m from a 90oC fumarole. HMM - figure 3 Located at the Halema'uma'u Overlook, 3 m from southeast rim. This site is visited by most people who tour the National Park. Measurements were made just outside the visitors overlook-fence. Puhimau site - figure 3 Located 1.6 km south of Crater Rim Drive on Chain of Craters Road. This area became thermally active in 1937 owing to an inferred shallow magmatic intrusion (Hazlett, 1990), and has been the subject of sulfur-gas and helium emission studies (Hinkle, 1978). Measurements were made downwind from several 2 to 3 m diameter steam vents with temperatures as high as 80oC. Volcanic gas emission
5
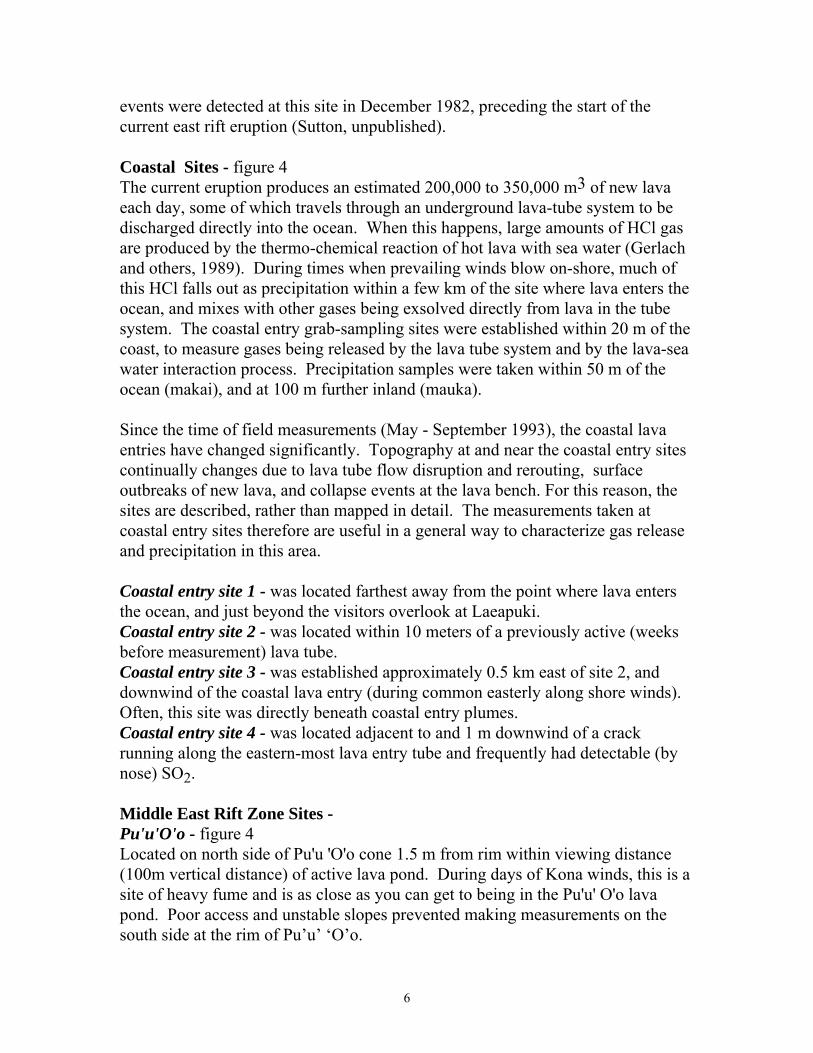
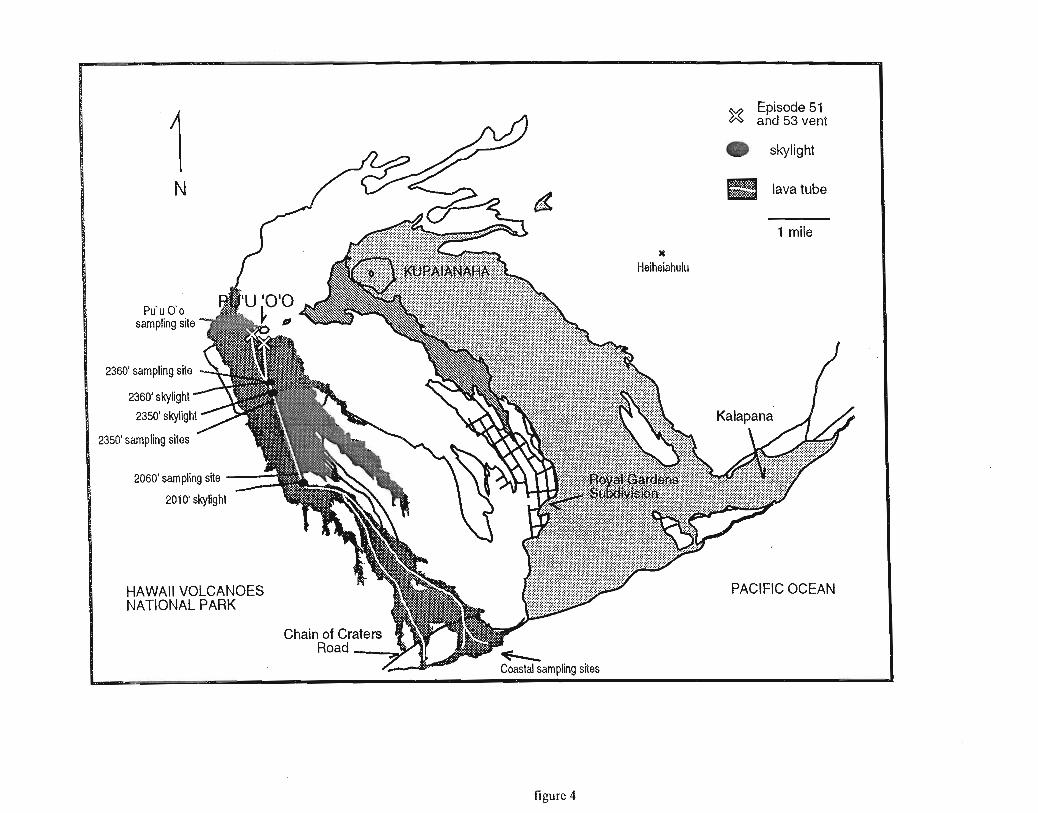
events were detected at this site in December 1982, preceding the start of the current east rift eruption (Sutton, unpublished). Coastal Sites - figure 4 The current eruption produces an estimated 200,000 to 350,000 m3 of new lava each day, some of which travels through an underground lava-tube system to be discharged directly into the ocean. When this happens, large amounts of HCl gas are produced by the thermo-chemical reaction of hot lava with sea water (Gerlach and others, 1989). During times when prevailing winds blow on-shore, much of this HCl falls out as precipitation within a few km of the site where lava enters the ocean, and mixes with other gases being exsolved directly from lava in the tube system. The coastal entry grab-sampling sites were established within 20 m of the coast, to measure gases being released by the lava tube system and by the lava-sea water interaction process. Precipitation samples were taken within 50 m of the ocean (makai), and at 100 m further inland (mauka). Since the time of field measurements (May - September 1993), the coastal lava entries have changed significantly. Topography at and near the coastal entry sites continually changes due to lava tube flow disruption and rerouting, surface outbreaks of new lava, and collapse events at the lava bench. For this reason, the sites are described, rather than mapped in detail. The measurements taken at coastal entry sites therefore are useful in a general way to characterize gas release and precipitation in this area. Coastal entry site 1 - was located farthest away from the point where lava enters the ocean, and just beyond the visitors overlook at Laeapuki. Coastal entry site 2 - was located within 10 meters of a previously active (weeks before measurement) lava tube. Coastal entry site 3 - was established approximately 0.5 km east of site 2, and downwind of the coastal lava entry (during common easterly along shore winds). Often, this site was directly beneath coastal entry plumes. Coastal entry site 4 - was located adjacent to and 1 m downwind of a crack running along the eastern-most lava entry tube and frequently had detectable (by nose) SO2. Middle East Rift Zone Sites - Pu'u'O'o - figure 4 Located on north side of Pu'u 'O'o cone 1.5 m from rim within viewing distance (100m vertical distance) of active lava pond. During days of Kona winds, this is a site of heavy fume and is as close as you can get to being in the Pu'u' O'o lava pond. Poor access and unstable slopes prevented making measurements on the south side at the rim of Pu’u’ ‘O’o.
6
2360' Sampling site- figure 4 Located 1 km south of base of Pu'u 'O'o cone directly on top of the active tube system, and 50 m north of the 2360' roofed-over skylight. This site frequently has heavy, opaque, white fume, coming from several hot (maximum temperature 325 oC) cracks on the tube. 2350' Sampling sites - (sites SKL05, SKL20, SKL70, SKL120) - figure 4 Located starting 250 m SSE from 2360' skylight. This is a series of collinear measurement sites located 5, 20, 70, and 120 meters from the largest (5 m diameter) skylight on the active tube system. No precipitation samples were collected at this site. Lower East Rift sites - Heiheiahulu - figure 4 This vegetated thermal area is the location of a series of cracks concentric to the Heiheiahulu lava shield, which is believed to have last erupted between 1730-1754 AD (Holcomb, 1987). In 1976, there was renewed thermal activity with associated weak alteration of rocks bordering the cracks. The maximum temperature we measured at these cracks was 48oC. Overlook - figure 1 Located at the intersection of the ERZ and highway 130 indicated as a "scenic overlook" on a road sign. This thermal area is characterized by a series of en echelon cracks and spatter cones that last erupted in 1955. It is an area of intense steaming and is used by local residents as an outdoor steam bath. The maximum temperature we measured was 51oC. Leilani - figure 1 Located directly across the street and downwind, during prevailing trade wind conditions, from the HGP-A well-facility on the edge of the fern forest, at the intersection of Pohoiki Road and Leilani Estates Road.
Continuous air-quality monitoring: Kilauea Summit The National Park Service (NPS) has been monitoring air quality near the summit
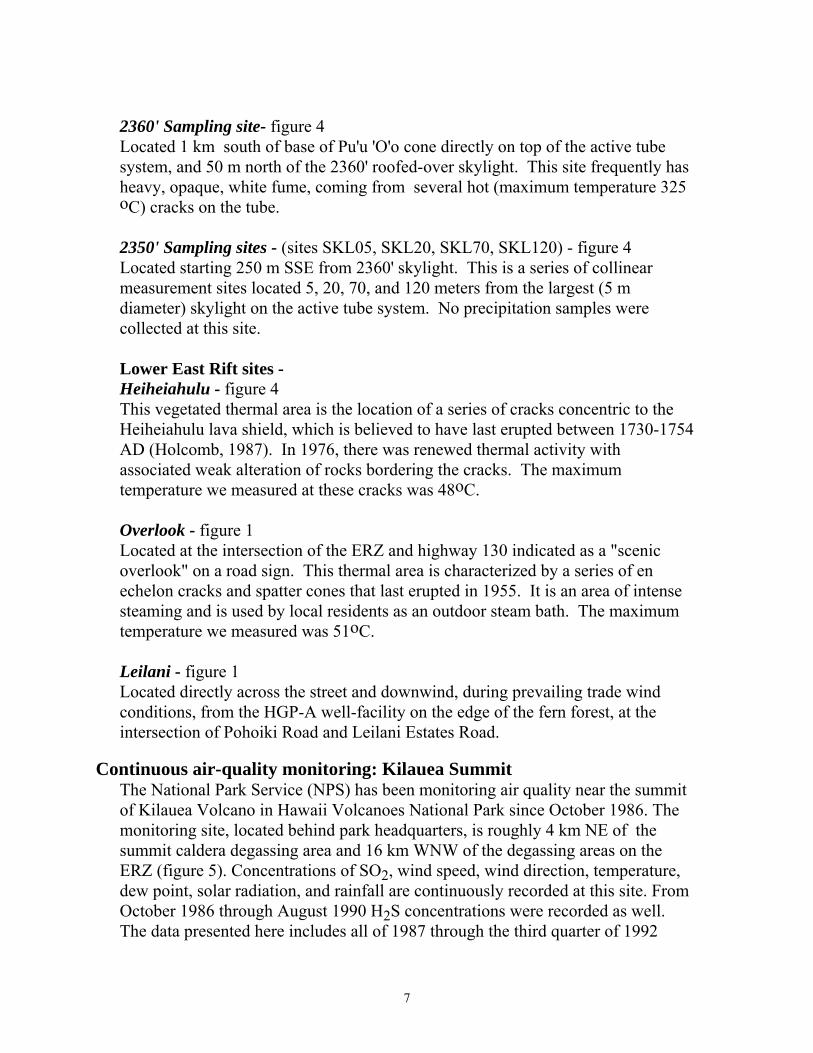
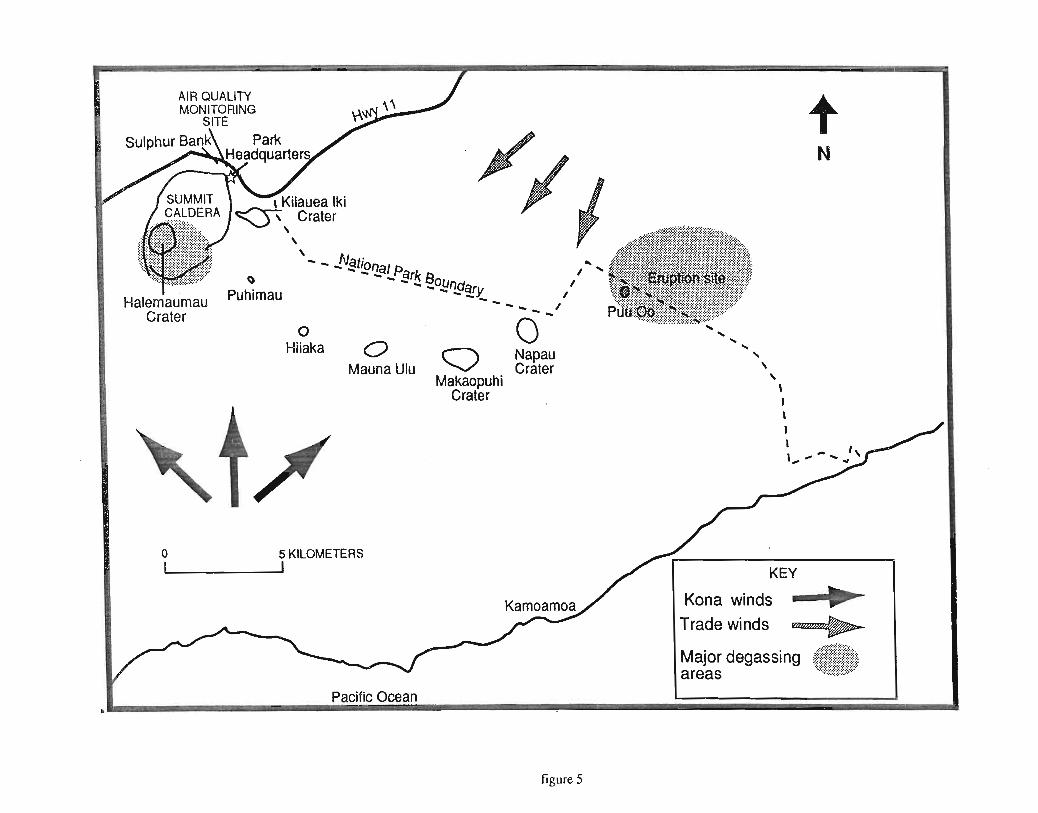
of Kilauea Volcano in Hawaii Volcanoes National Park since October 1986. The monitoring site, located behind park headquarters, is roughly 4 km NE of the summit caldera degassing area and 16 km WNW of the degassing areas on the ERZ (figure 5). Concentrations of SO2, wind speed, wind direction, temperature, dew point, solar radiation, and rainfall are continuously recorded at this site. From October 1986 through August 1990 H2S concentrations were recorded as well. The data presented here includes all of 1987 through the third quarter of 1992
7
omitting the period from September 1990 through January 1991, when all monitoring ceased briefly. From 1986 to 1990 the instrument system was configured with Meloy 285E flame photometric H2S and SO2 analyzers operating in the 0-0.5 and 0-1 ppm range respectively, with a minimum detection limit of 0.5 ppb. Since that time Monitor Labs model 8850 UV fluorescence analyzers have been used to collect SO2 data in both the 0-1 and 0-5 ppm range. Meteorological parameters are measured using Qualimetrics equipment. Wind speed and direction are determined using Micro Response wind sensors that use a potentiometer for wind direction and a light chopper for wind speed measurements. Threshold starting frequency for the anemometer is 0.5 mph. Global solar radiation is measured using a model 3120 Silicon Cell Pyranometer. Rainfall is measured with a model 6018-B tipping bucket rain gauge, temperature and dew point with a model 5320 sensor, which uses a thermistor probe and gold wire/LiCl sensor for temperature and dew point respectively. An environmentally controlled shelter houses the air-quality instruments with the ambient air intake located approximately 5 meters above the ground. Except for the tipping bucket rain gauge, the meteorological sensors are mounted on a 10 meter tower with wind speed and wind direction measured at 10 meters, and temperature and dew point at 5 meters. A rigorous Quality Assurance/Quality Control program is followed to assure that all instruments are performing within acceptable limits. The station is operated and maintained according to Prevention of Significant Deterioration (PSD) criteria although this station is not an official PSD site. A daily calibration check using a known concentration of calibration gas is performed for all gas analyzers as well as a weekly precision check (0.08 - 0.1 ppm). Semi-annual checks using a certified primary standard are carried out on all analyzers, and meteorological instrumentation performance is verified by using calibrated signal references. An independent audit of all equipment is conducted yearly. The data are reduced and validated by Aerovironment (Lakewood, Colorado), a data processing center contracted by the Air Quality division of the NPS. Intermittent sulfur dioxide emission-rate measurements Gas emission-rate measurements for SO2 are carried out routinely by the USGS at Kilauea to assess volcanic activity-state, and to support research on volcanic processes. The technique is discussed in Casadevall and others (1987), and involves making remote measurements using a correlation spectrometer (COSPEC) (Barringer Research Ltd., Canada). Scattered solar ultraviolet energy of specific wavelengths is absorbed in proportion to SO2 concentration and gas plume thickness. This absorption, with units of concentration-path length, is measured by the COSPEC and calibrated using the optical absorption of an SO2
8
gas standard in the instrument. Multiplying the concentration-path length by the plume-width and wind speed yields an SO2 emission-rate that is reported with units of metric tons/day (t/d). Ground-based summit and middle East Rift Zone measurements Ground-based COSPEC measurements at the summit are made from a vehicle driven around the crater rim at a constant speed, beneath, and at right angles to the plume's trajectory (figure 3). For summit measurements, a series of 4 to 6 traverses beneath the plume are typically made one-to-three times per week. Starting in 1984, ground-based measurements near Pu'u 'O'o, that reflect emission-rates from middle ERZ eruptive vents, were made by mounting the COSPEC on a tripod and scanning angularly up through the plume. Regular tripod-based measurements were discontinued in late 1991, owing to changes in eruptive character, and poor access to the measurement site. An alternative method of direct ERZ SO2 measurements was adopted in 1992, when we began making vehicle-based COSPEC measurements of the middle east rift degassing areas as the plume is blown across Chain of Craters road. The uncertainty in COSPEC measurements is estimated to be ± 10 to ± 30 percent. The largest contribution to this uncertainty is in the determination of wind velocity. Vehicle-based lower East Rift Zone measurements near PGV Plant On October 20 1992, before the start-up of the PGV geothermal plant, three vehicle-based COSPEC traverses were made in the lower ERZ area. Each traverse of approximately 21 km started at the intersection of highway 132 and the Pahoa-Pohoiki Road and ran east along highway 132, south on highway 137 to Pohoiki, and then west on the Pahoa-Pohoiki road to the traverse starting point, completing a roughly triangular orbit of the PGV geothermal plant (figure 1).
Results
Ambient-air grab-sample measurements- The results for our field study, involving 65 site visits and more than 1200 individual measurements are ranged and summarized below. The individual site measurements are included as two tables in Appendix A. The site summaries are grouped both geographically and by the type of degassing at the site. Concentrations are parts per million (ppm) by volume for gases and by weight for dissolved constituents.
9
Kilauea summit - solfatara sites
HMM Site
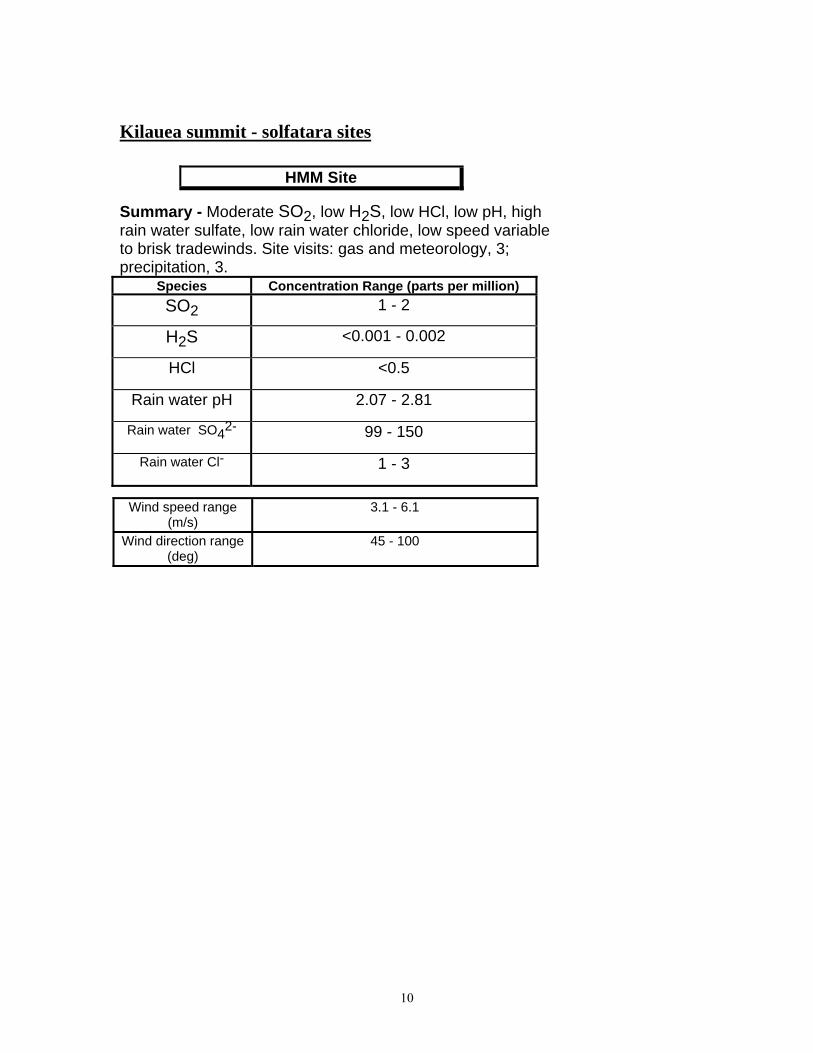
Summary - Moderate SO2, low H2S, low HCl, low pH, high rain water sulfate, low rain water chloride, low speed variable to brisk tradewinds. Site visits: gas and meteorology, 3; precipitation, 3.
Species Concentration Range (parts per million) SO2 1 - 2
H2S <0.001 - 0.002
HCl <0.5
Rain water pH 2.07 - 2.81
Rain water SO42- 99 - 150
Rain water Cl- 1 - 3
Wind speed range
(m/s) 3.1 - 6.1
Wind direction range (deg)
45 - 100
10
B - Site
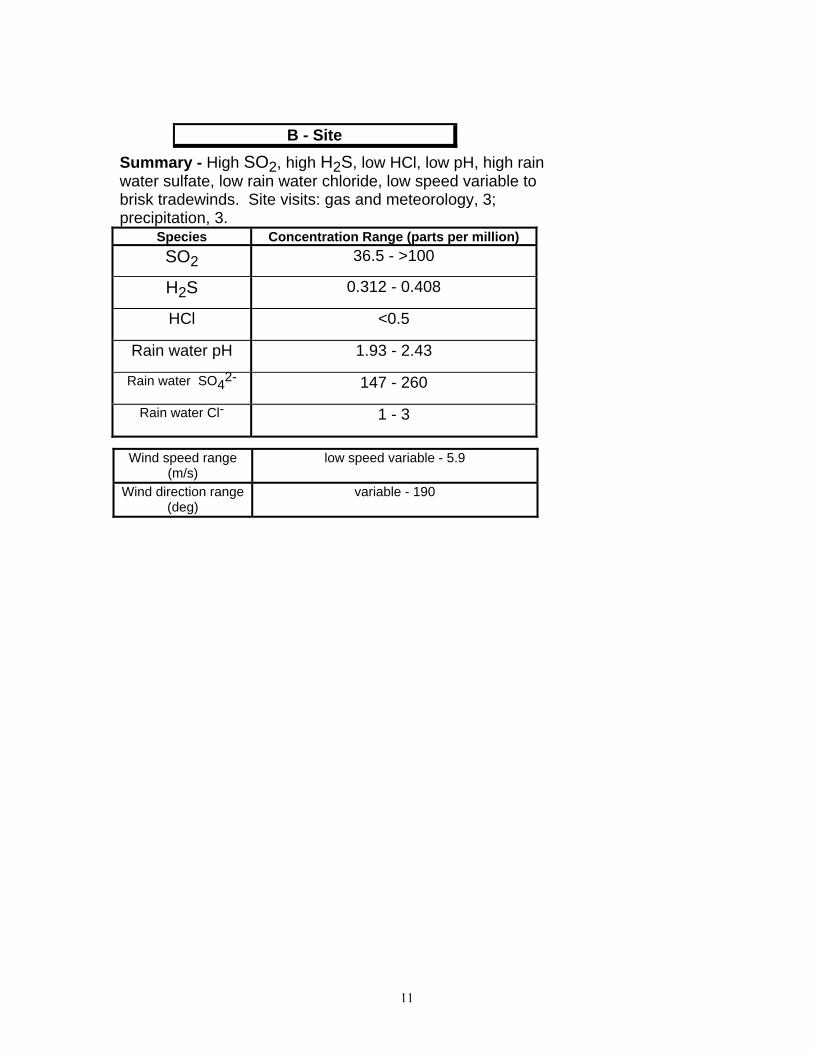
Summary - High SO2, high H2S, low HCl, low pH, high rain water sulfate, low rain water chloride, low speed variable to brisk tradewinds. Site visits: gas and meteorology, 3; precipitation, 3.
Species Concentration Range (parts per million) SO2 36.5 - >100
H2S 0.312 - 0.408
HCl <0.5
Rain water pH 1.93 - 2.43
Rain water SO42- 147 - 260
Rain water Cl- 1 - 3
Wind speed range
(m/s) low speed variable - 5.9
Wind direction range (deg)
variable - 190
11
Sulphur Bank Site
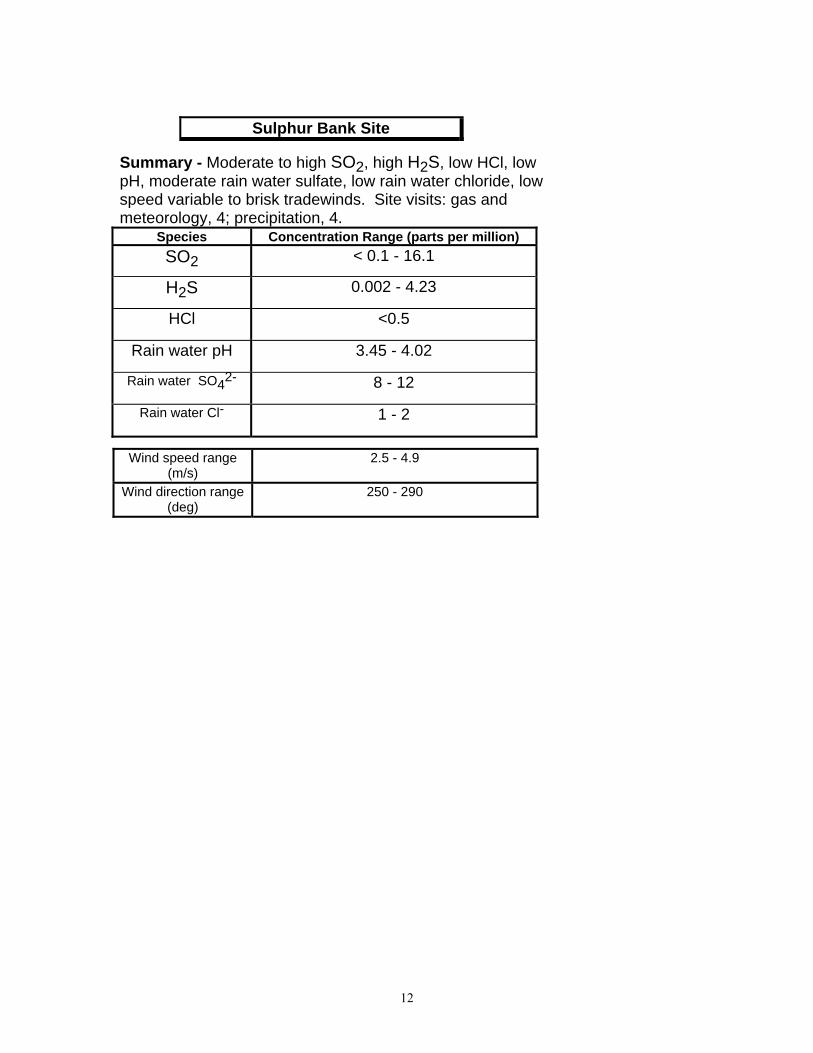
Summary - Moderate to high SO2, high H2S, low HCl, low pH, moderate rain water sulfate, low rain water chloride, low speed variable to brisk tradewinds. Site visits: gas and meteorology, 4; precipitation, 4.
Species Concentration Range (parts per million) SO2 < 0.1 - 16.1
H2S 0.002 - 4.23
HCl <0.5
Rain water pH 3.45 - 4.02
Rain water SO42- 8 - 12
Rain water Cl- 1 - 2
Wind speed range
(m/s) 2.5 - 4.9
Wind direction range (deg)
250 - 290
12
Middle East Rift sites
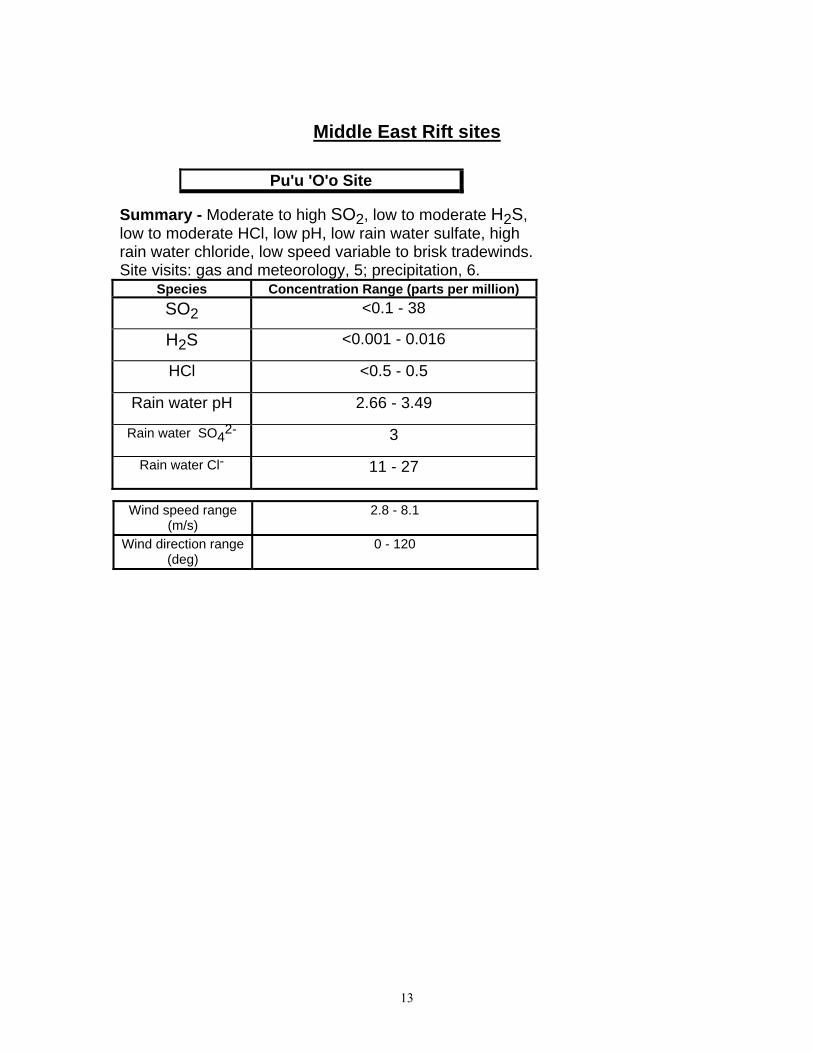
Pu'u 'O'o Site
Summary - Moderate to high SO2, low to moderate H2S, low to moderate HCl, low pH, low rain water sulfate, high rain water chloride, low speed variable to brisk tradewinds. Site visits: gas and meteorology, 5; precipitation, 6.
Species Concentration Range (parts per million) SO2 <0.1 - 38
H2S <0.001 - 0.016
HCl <0.5 - 0.5
Rain water pH 2.66 - 3.49
Rain water SO42- 3
Rain water Cl- 11 - 27
Wind speed range
(m/s) 2.8 - 8.1
Wind direction range (deg)
0 - 120
13
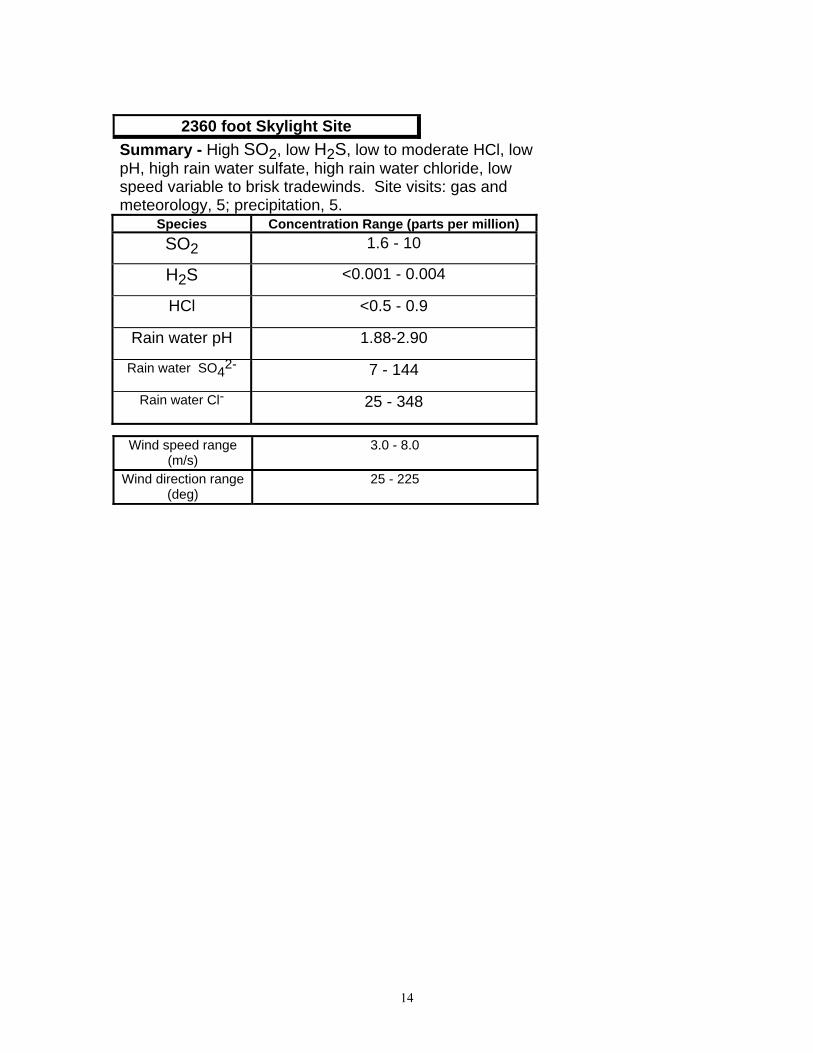
2360 foot Skylight Site
Summary - High SO2, low H2S, low to moderate HCl, low pH, high rain water sulfate, high rain water chloride, low speed variable to brisk tradewinds. Site visits: gas and meteorology, 5; precipitation, 5.
Species Concentration Range (parts per million) SO2 1.6 - 10
H2S <0.001 - 0.004
HCl <0.5 - 0.9
Rain water pH 1.88-2.90
Rain water SO42- 7 - 144
Rain water Cl- 25 - 348
Wind speed range
(m/s) 3.0 - 8.0
Wind direction range (deg)
25 - 225
14
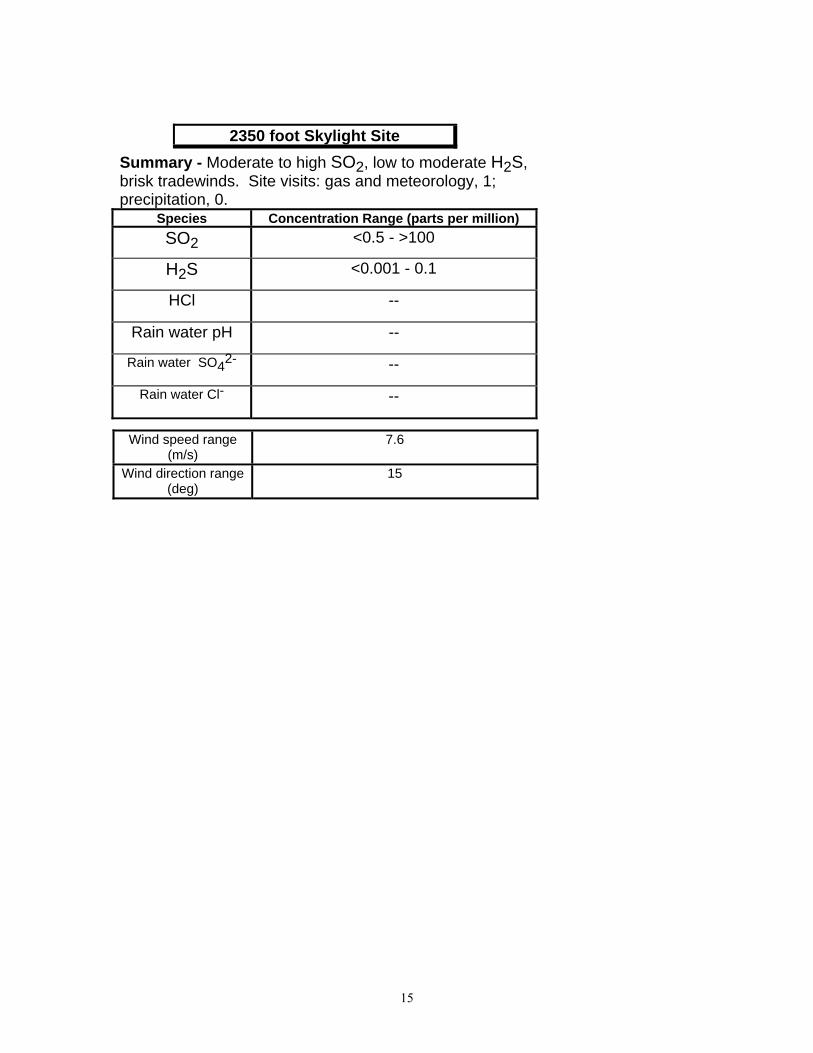
2350 foot Skylight Site Summary - Moderate to high SO2, low to moderate H2S, brisk tradewinds. Site visits: gas and meteorology, 1; precipitation, 0.
Species Concentration Range (parts per million) SO2 <0.5 - >100
H2S <0.001 - 0.1
HCl --
Rain water pH --
Rain water SO42- --
Rain water Cl- --
Wind speed range (m/s)
7.6
Wind direction range (deg)
15
15
Coastal Sites
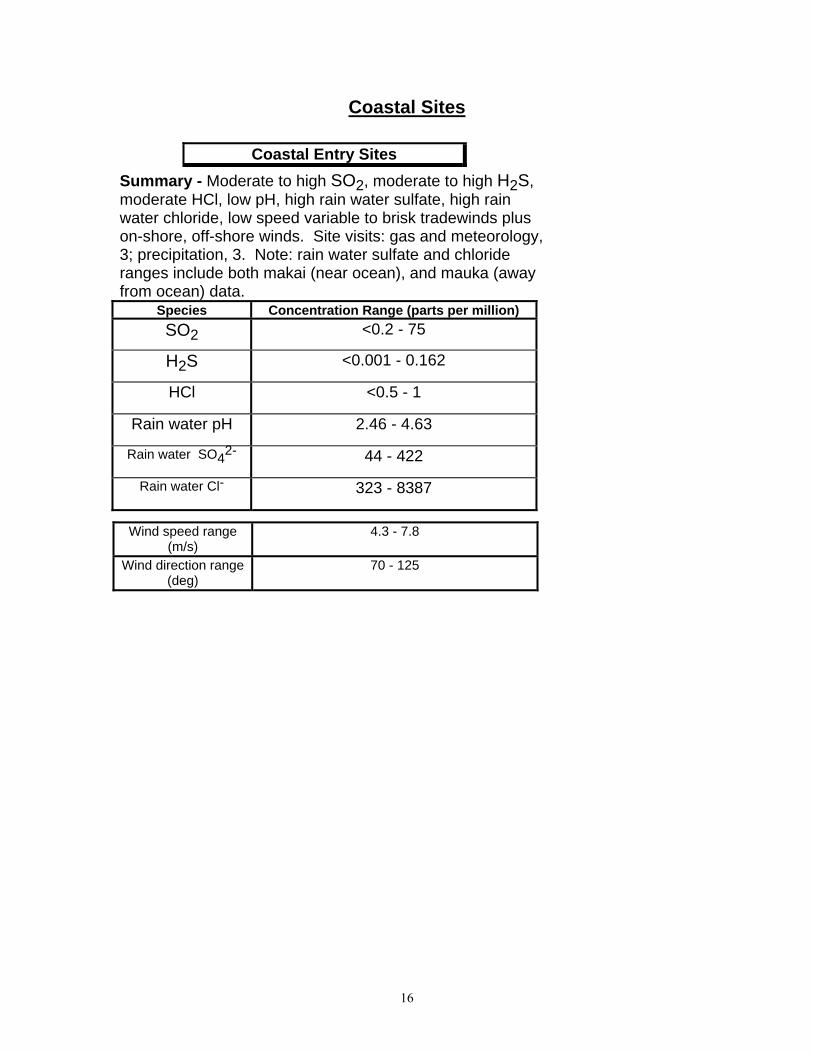
Coastal Entry Sites
Summary - Moderate to high SO2, moderate to high H2S, moderate HCl, low pH, high rain water sulfate, high rain water chloride, low speed variable to brisk tradewinds plus on-shore, off-shore winds. Site visits: gas and meteorology, 3; precipitation, 3. Note: rain water sulfate and chloride ranges include both makai (near ocean), and mauka (away from ocean) data.
Species Concentration Range (parts per million) SO2 <0.2 - 75
H2S <0.001 - 0.162
HCl <0.5 - 1
Rain water pH 2.46 - 4.63
Rain water SO42- 44 - 422
Rain water Cl- 323 - 8387
Wind speed range (m/s)
4.3 - 7.8
Wind direction range (deg)
70 - 125
16
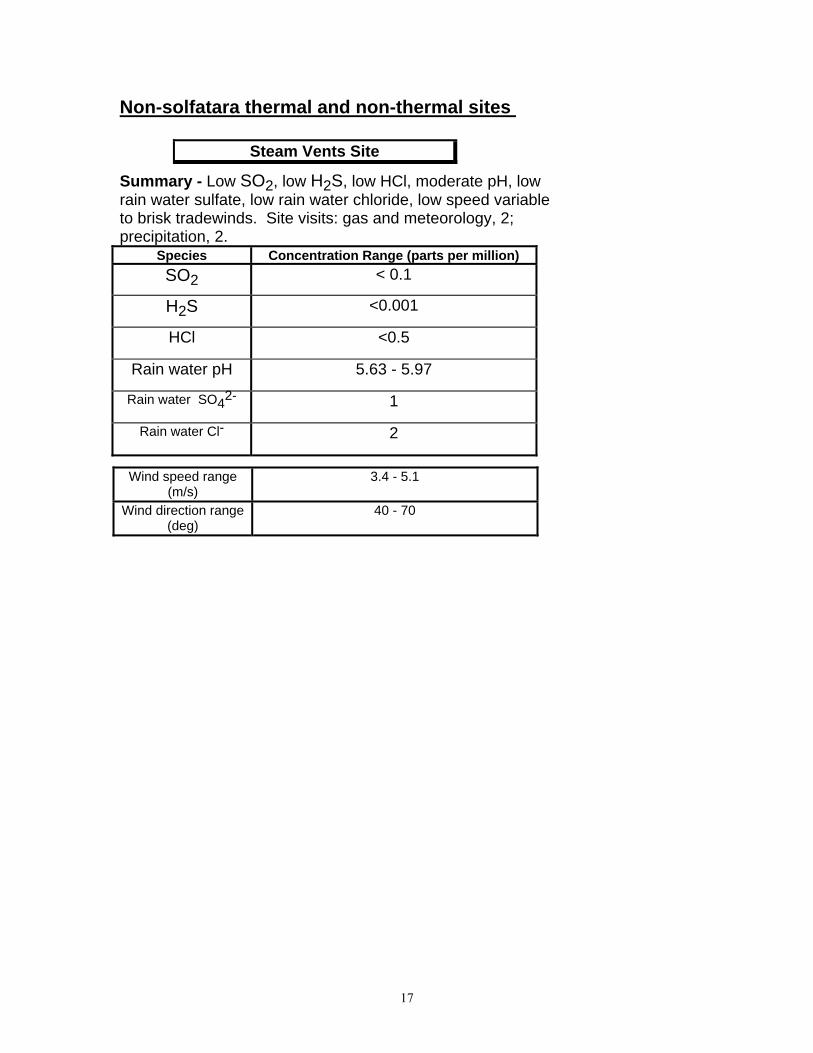
Non-solfatara thermal and non-thermal sites
Steam Vents Site Summary - Low SO2, low H2S, low HCl, moderate pH, low rain water sulfate, low rain water chloride, low speed variable to brisk tradewinds. Site visits: gas and meteorology, 2; precipitation, 2.
Species Concentration Range (parts per million) SO2 < 0.1
H2S <0.001
HCl <0.5
Rain water pH 5.63 - 5.97
Rain water SO42- 1
Rain water Cl- 2
Wind speed range
(m/s) 3.4 - 5.1
Wind direction range (deg)
40 - 70
17
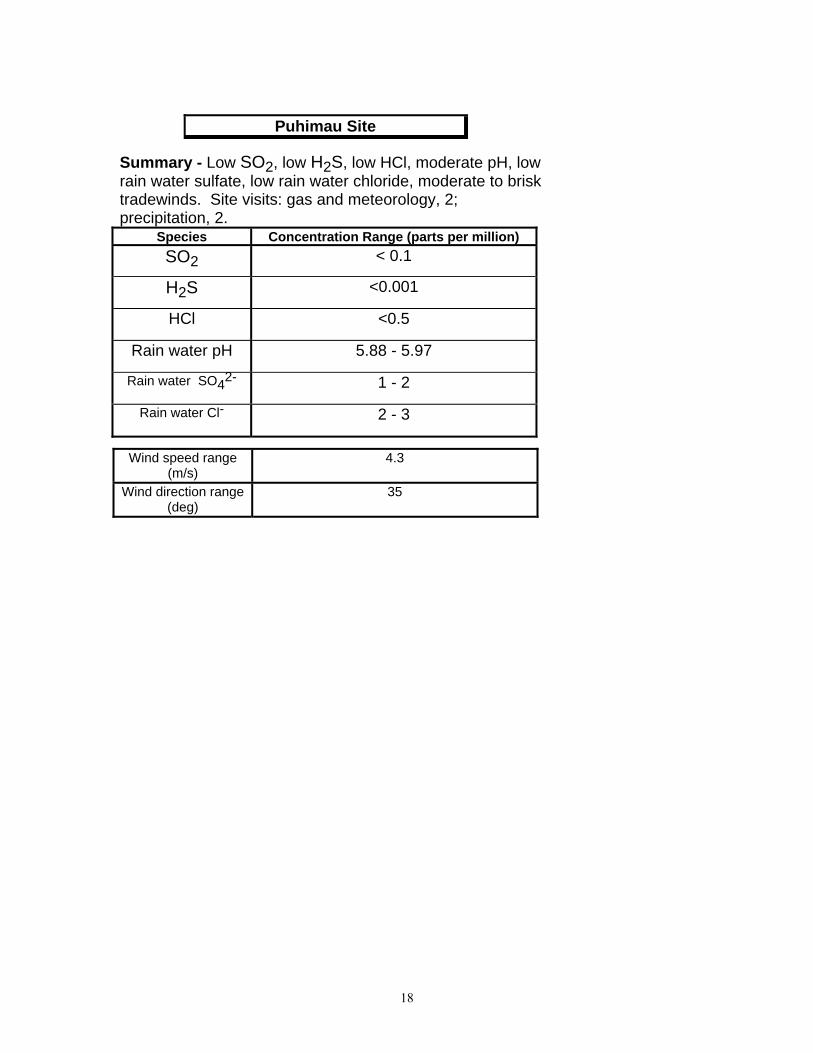
Puhimau Site
Summary - Low SO2, low H2S, low HCl, moderate pH, low rain water sulfate, low rain water chloride, moderate to brisk tradewinds. Site visits: gas and meteorology, 2; precipitation, 2.
Species Concentration Range (parts per million) SO2 < 0.1
H2S <0.001
HCl <0.5
Rain water pH 5.88 - 5.97
Rain water SO42- 1 - 2
Rain water Cl- 2 - 3
Wind speed range
(m/s) 4.3
Wind direction range (deg)
35
18
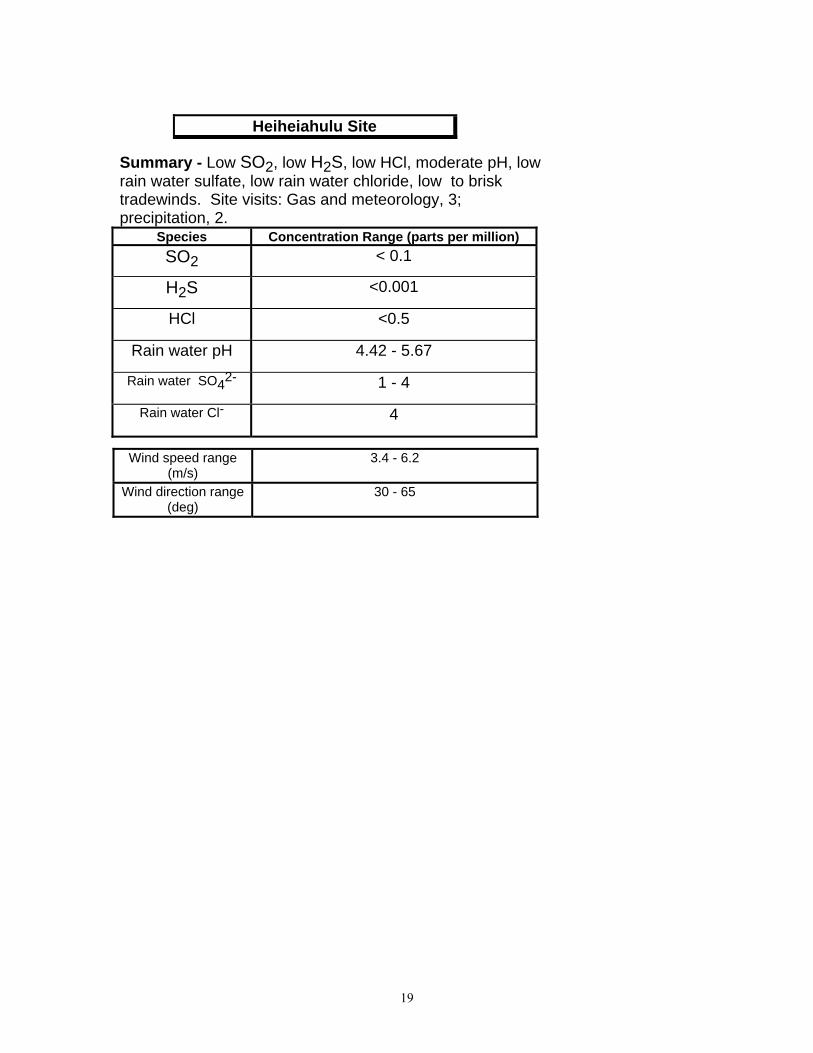
Heiheiahulu Site
Summary - Low SO2, low H2S, low HCl, moderate pH, low rain water sulfate, low rain water chloride, low to brisk tradewinds. Site visits: Gas and meteorology, 3; precipitation, 2.
Species Concentration Range (parts per million) SO2 < 0.1
H2S <0.001
HCl <0.5
Rain water pH 4.42 - 5.67
Rain water SO42- 1 - 4
Rain water Cl- 4
Wind speed range
(m/s) 3.4 - 6.2
Wind direction range (deg)
30 - 65
19
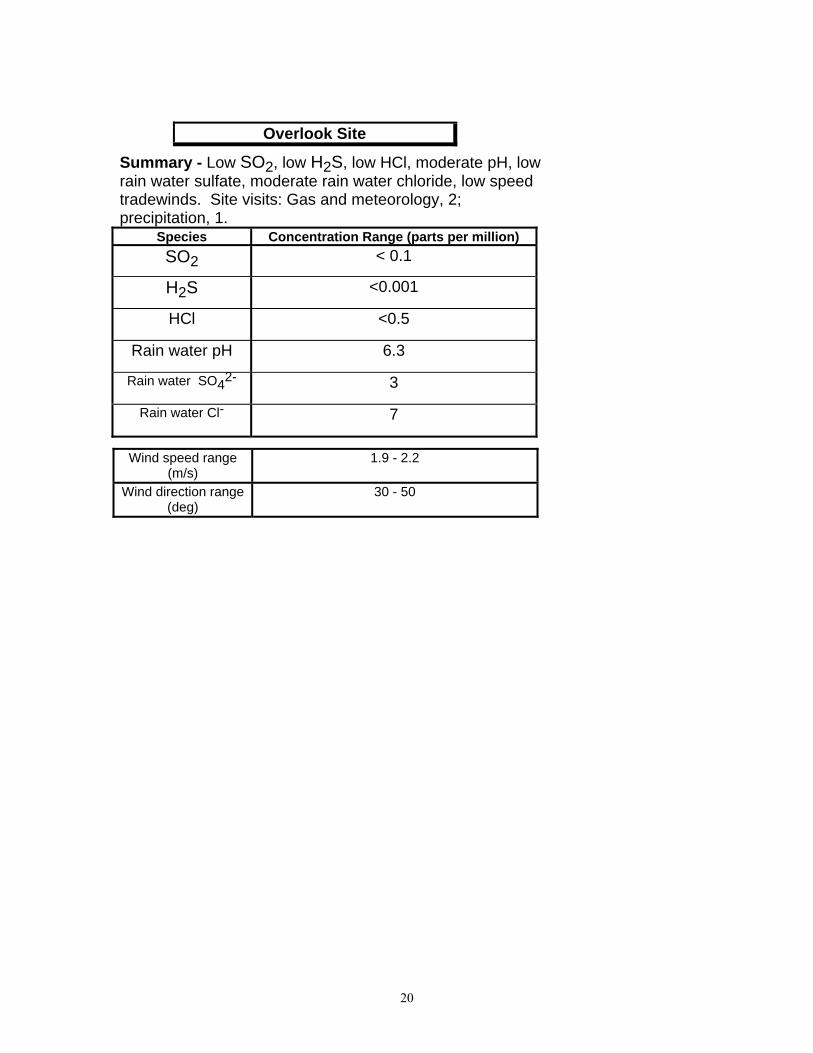
Overlook Site
Summary - Low SO2, low H2S, low HCl, moderate pH, low rain water sulfate, moderate rain water chloride, low speed tradewinds. Site visits: Gas and meteorology, 2; precipitation, 1.
Species Concentration Range (parts per million) SO2 < 0.1
H2S <0.001
HCl <0.5
Rain water pH 6.3
Rain water SO42- 3
Rain water Cl- 7
Wind speed range
(m/s) 1.9 - 2.2
Wind direction range (deg)
30 - 50
20
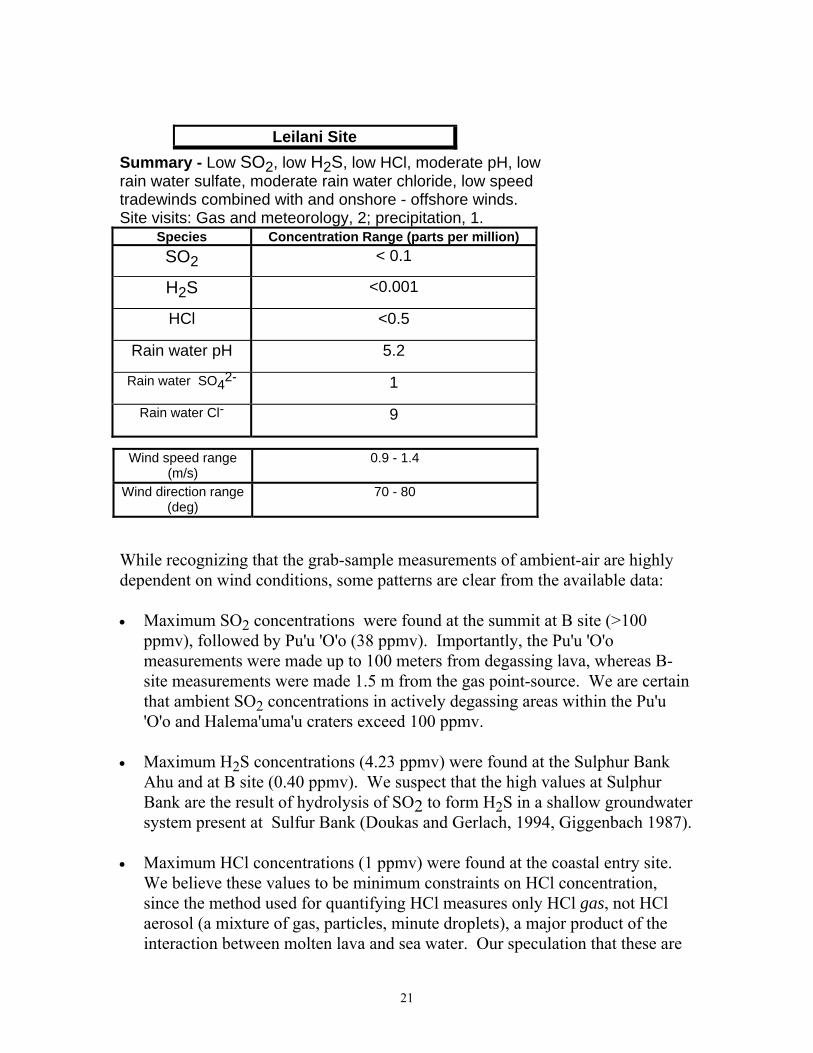
Leilani Site Summary - Low SO2, low H2S, low HCl, moderate pH, low rain water sulfate, moderate rain water chloride, low speed tradewinds combined with and onshore - offshore winds. Site visits: Gas and meteorology, 2; precipitation, 1.
Species Concentration Range (parts per million) SO2 < 0.1
H2S <0.001
HCl <0.5
Rain water pH 5.2
Rain water SO42- 1
Rain water Cl- 9
Wind speed range
(m/s) 0.9 - 1.4
Wind direction range (deg)
70 - 80
While recognizing that the grab-sample measurements of ambient-air are highly dependent on wind conditions, some patterns are clear from the available data: • Maximum SO2 concentrations were found at the summit at B site (>100
ppmv), followed by Pu'u 'O'o (38 ppmv). Importantly, the Pu'u 'O'o measurements were made up to 100 meters from degassing lava, whereas B-site measurements were made 1.5 m from the gas point-source. We are certain that ambient SO2 concentrations in actively degassing areas within the Pu'u 'O'o and Halema'uma'u craters exceed 100 ppmv.
• Maximum H2S concentrations (4.23 ppmv) were found at the Sulphur Bank
Ahu and at B site (0.40 ppmv). We suspect that the high values at Sulphur Bank are the result of hydrolysis of SO2 to form H2S in a shallow groundwater system present at Sulfur Bank (Doukas and Gerlach, 1994, Giggenbach 1987).
• Maximum HCl concentrations (1 ppmv) were found at the coastal entry site.
We believe these values to be minimum constraints on HCl concentration, since the method used for quantifying HCl measures only HCl gas, not HCl aerosol (a mixture of gas, particles, minute droplets), a major product of the interaction between molten lava and sea water. Our speculation that these are
21
minimum HCl constraints, is supported by low rain water pH values (2.46 and 2.98) obtained close to the ocean entry and by the high rain water chloride concentions in the same samples. Sea spray would also raise chloride ion concentrations but would raise pH values too, since the pH of seawater is about 7.9 (Snoeyink and Jenkins, 1980). The low rain water pH values cannot be brought about solely by the conversion of available SO2 to H2SO4 near the coastal entry sites.
• Measurements of pH near actively degassing areas showed minimum values of
1.9 near B-site and 2.07 from HMM, both located at the summit. The cause of these low pH values is likely the conversion of SO2 to sulfuric acid. This is shown by the high concentration of sulfate ion in rainwater at these sites.
• Measurements made at upper and lower ERZ sites including thermal areas,
showed essentially no influence from volcanic gas emissions. This is demonstrated by the lack of detectable hydrogen sulfide, sulfur dioxide, and hydrochloric acid gases in the ambient air, and by moderate rain water pH values found at these sites (4.42 to 6.3). Rain water pH in Hawaii upwind of degassing sources typically ranges from 4.3 to 5.2 (Miller and Yoshinaga, 1981) Sulfate and chloride ion concentrations in rainwater are somewhat above background but of uncertain origin for some of these samples, since we could not correct for sea salt interference based on our analyses.
• Precipitation data generally support the ambient air measurements: areas that
have high SO2 emissions also have high sulfate in the rainwater and attendantly lower pH. Likewise, areas of known elevated HCl concentration in the ambient air have high chloride in rainwater and low pH.
• Precipitation data showed highest chloride and sulfate values near coastal
entries (8388 ppm and 422 ppm) respectively. B-site had the second highest sulfate values (260 ppm) and the 2360' skylight site had the second highest chloride ion concentration (348 ppm). Coastal values are, however, strongly influenced by sea-spray. The high sulfate values from B-site and the 2360' skylight site are certainly a reflection of the concentrations of gases coming from the local volcanic sources.
The grab-sample measurements of ambient-air contrast with those made of gases taken directly from fumaroles because, importantly, they incorporate the surface-mixing of atmospheric air. This surface mixing changes the composition of the gases, not only by dilution, but also by chemical reaction; of particular note, is the ratio of H2S/SO2 in eruptive gases. From measurements of gases taken directly as they exsolve from the magma, i.e., eruptive gases (Gerlach, 1993, Greenland,
22
1985), we expect this ratio to be in the range of 0.04 to 0.28. The values obtained using our ambient-air measurements in eruptive areas, are in the range of 0.001 to 0.002. This low ratio is likely due to the low temperature (< 400 oC) reaction between H2S and SO2 according to Greenland and Aruscavage (1986) and to a lesser extent, due to air-oxidation of H2S, to form SO2.
2 H2S + SO2 = 2 H2O + 3S
2H2S +3O2 = SO2 + 2H2O
Both of these reactions are important for limiting H2S concentration in ambient air around degassing sources, owing to the strongly oxidizing conditions present. The first reaction is kinetically most favorable, taking place in seconds to minutes upon mixing at temperatures below 400oC. Volcanic systems like Kilauea, with high SO2 emission-rates, therefore, effectively have a built-in H2S abatement system: H2S and SO2 are co-evolved but react, nearly quantitatively removing H2S, the limiting reagent. The second reaction above is less important because the half-life for the second reaction (time required for half of a given quantity of H2S to react) is 2 days, (Henderson-Sellers, 1984). This second reaction eventually results in the formation of H2SO4. Sulfur dioxide is removed by oxidation also, but its high emission rate and slow oxidation rate keeps ambient concentrations high, especially during low wind conditions. Although we did not collect precipitation samples from as many sites as Scholl and Ingebritsen (1994), our collections were made somewhat more frequently, and the two data sets show basically the same trends. Samples taken near actively degassing sites showed higher sulfate and/or chloride, depending upon the abundance of the gas coming from the source near the site. We did not attempt in our study to differentiate between seawater chloride and sulfate and volcanically emitted chloride and sulfate. In the case of precipitation measurements made near coastal entries though, it was possible to differentiate clearly between rainwater samples taken during active lava effusion, and after the ocean entry had shut off. Vent-on conditions (7/26/93) resulted in rainwater sulfate concentrations 40 times higher than vent-off conditions (10/29/93). Corresponding rainwater chloride concentrations were 100 times higher during vent-on conditions. Continuous air-quality monitoring, Kilauea summit An examination of the time series data from the air quality site shows the importance of wind speed and wind direction relative to the location of degassing areas in determining ambient concentrations of SO2 and H2S. We speculate that
23
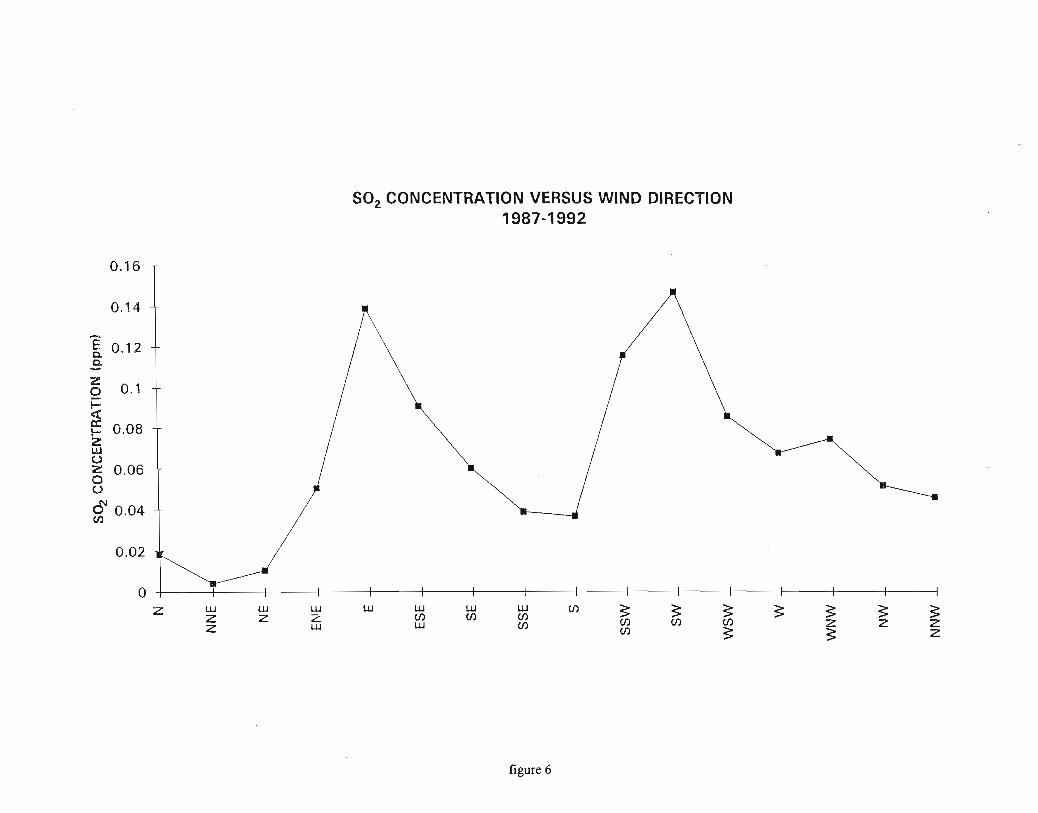
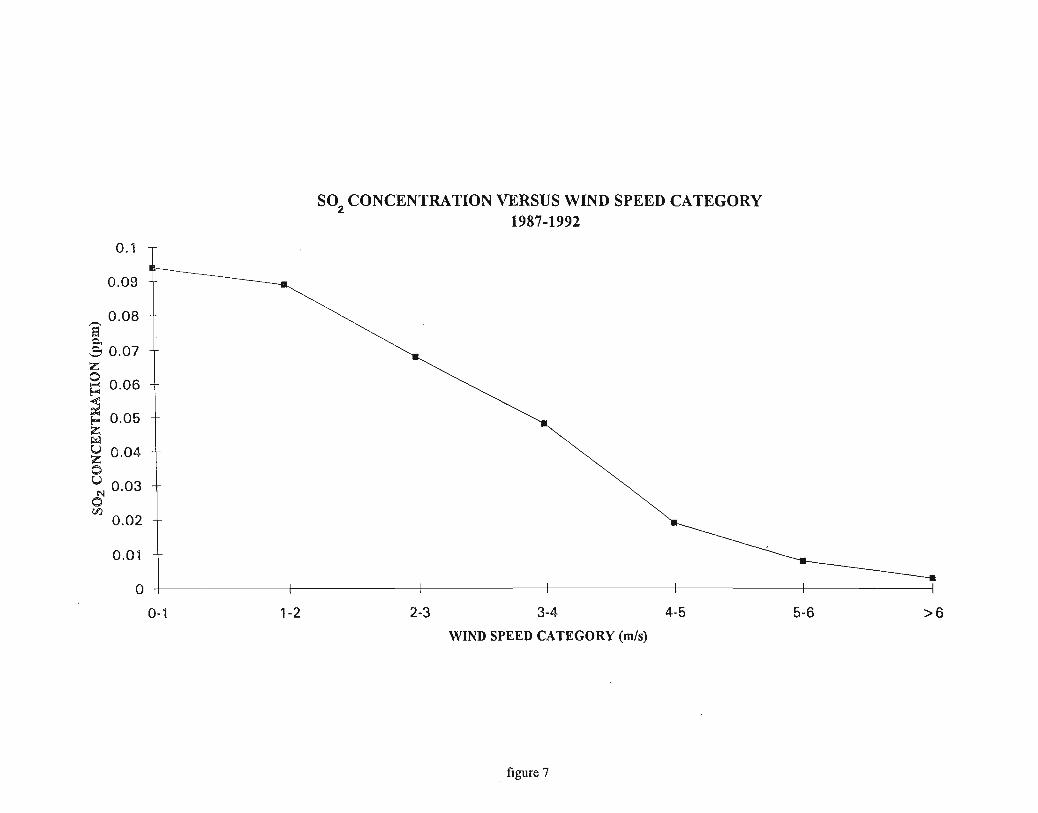
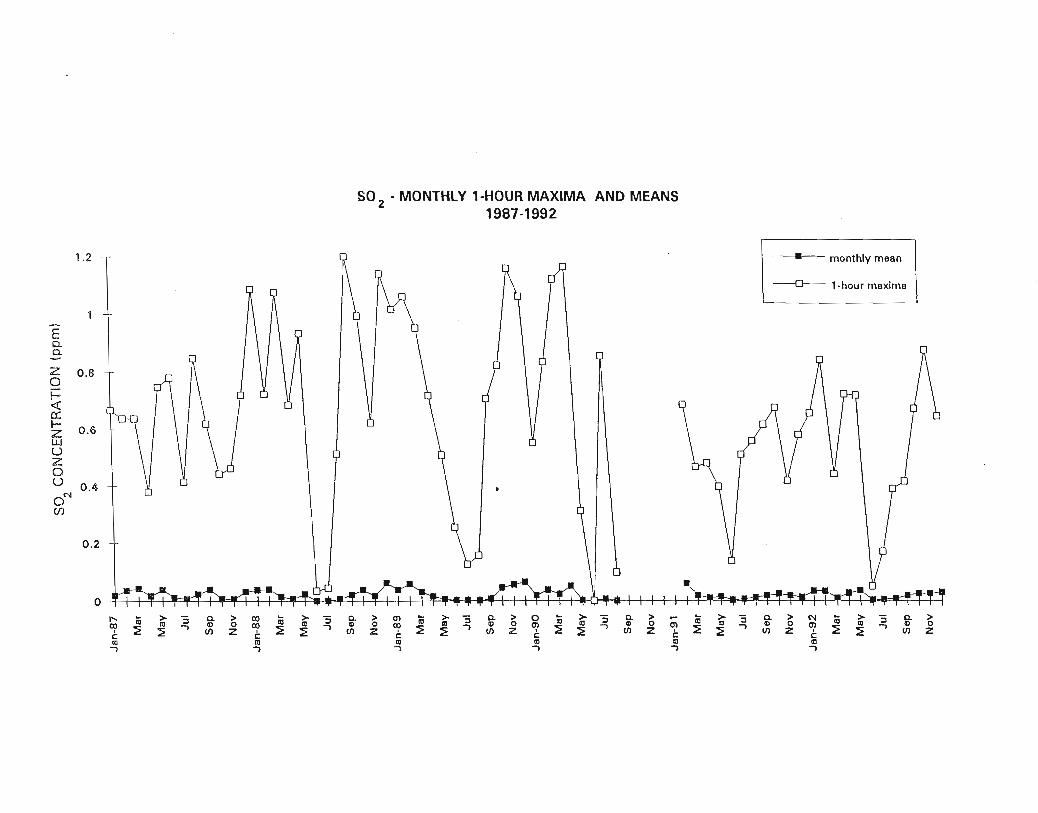
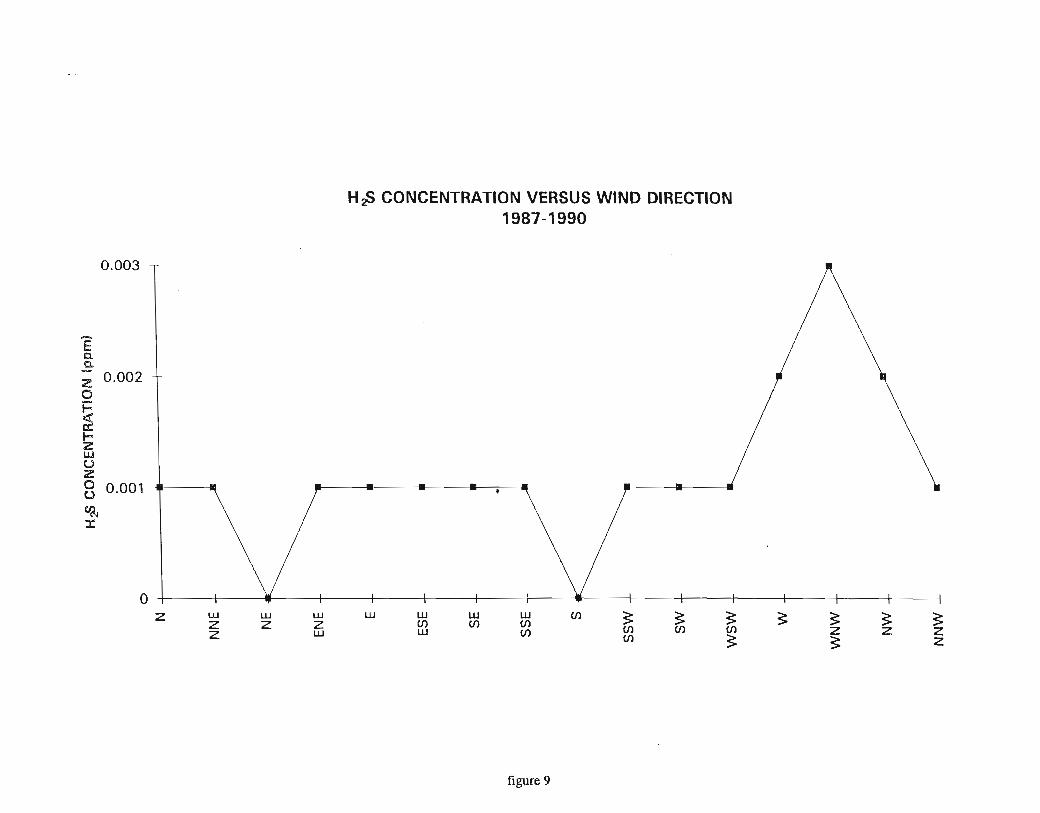
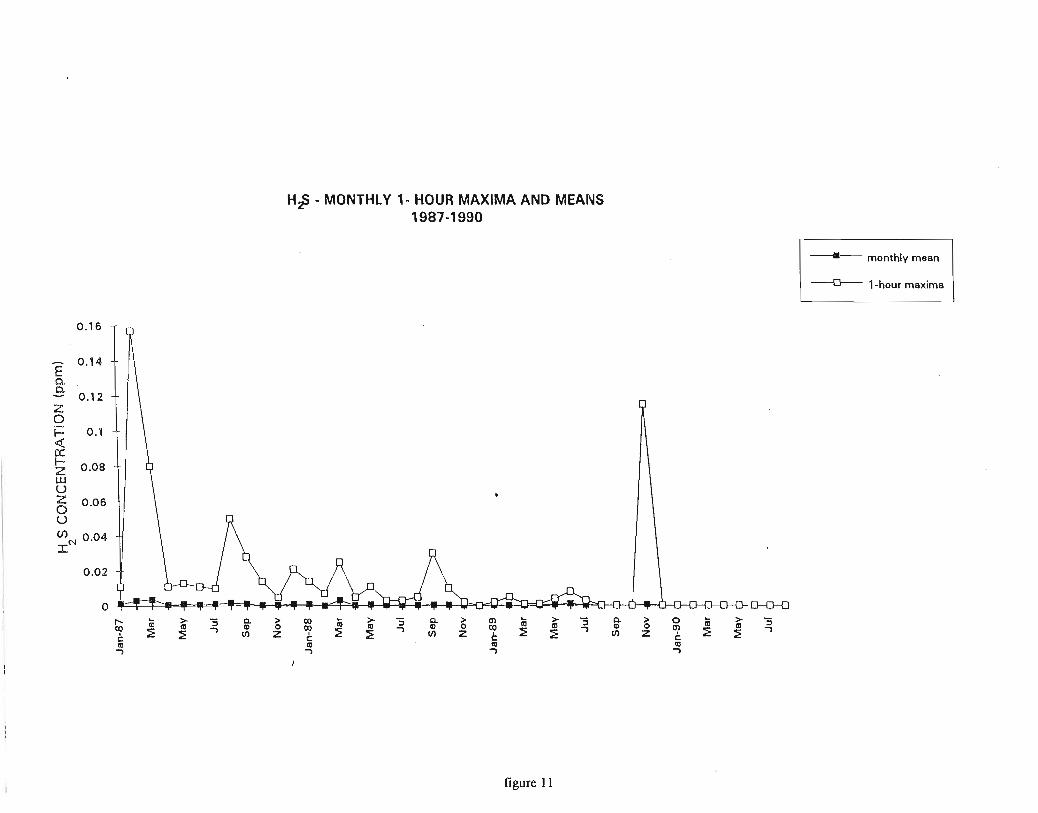
the gases from the summit caldera, Kilauea middle ERZ, and Sulphur Bank area all influence data collected from this monitoring site. Sulfur Dioxide Data for mean SO2 concentration versus wind direction show that ambient levels of SO2 at this site are highest when the wind is blowing roughly from the E or SW (figure 6). Under these two wind conditions the monitoring site is downwind from the middle ERZ and summit caldera respectively, two of the primary areas where we found SO2 degassing during our ambient-air grab-sampling. The smaller SO2 maximum in figure 6, corresponding to the WNW wind direction, is probably due to the proximity of the monitoring site to Sulphur Bank which is located approximately 500 meters to the WNW. Ambient-air grab-sampling confirmed that Sulphur Bank is an SO2 source, although concentrations found there were an order of magnitude less than the maximum values measured at B-site on the rim of Halemaumau summit crater. Even though the SO2 concentrations at Sulphur Bank are lower, they probably contribute significantly to ambient levels seen at the continuous monitoring site because of the close proximity of Sulphur Bank. Under prevailing trade wind conditions, (trade winds for the purposes of this study are defined as steady winds from generally the northeast direction) mean SO2 concentrations are lower than under any other wind condition, and are close to zero The effects of wind speed on measured SO2 concentration are shown in figure 7. Under very mild winds (0-2 m/s), SO2 concentrations are highest. Increasing wind speed effectively dilutes the gas, resulting in lower measured concentrations. Monthly one-hour maxima and means for ambient SO2 concentrations are shown in figure 8. An interesting detail to note is the lower maximum and mean values consistently recorded for the months of June and July. Steady trade winds are prevalent during these months and the recorded values further confirm the association between steady trade winds and lower ambient levels of SO2 at this site. Hydrogen Sulfide H2S monitoring generally yielded low concentrations, with all zero-H2S values recorded for the entire 1990 monitoring period. After the pause in all air quality monitoring from September 1990 to February 1991, the H2S monitoring was discontinued because of the infrequency of non-zero ambient concentrations. Mean H2S concentration by wind direction is plotted in figure 9. The most prominent feature in this figure, the maximum associated with the WNW wind directions, is almost certainly due to the H2S contribution of Sulphur Bank. As noted previously, Sulphur Bank is located only 500 meters roughly WNW of the
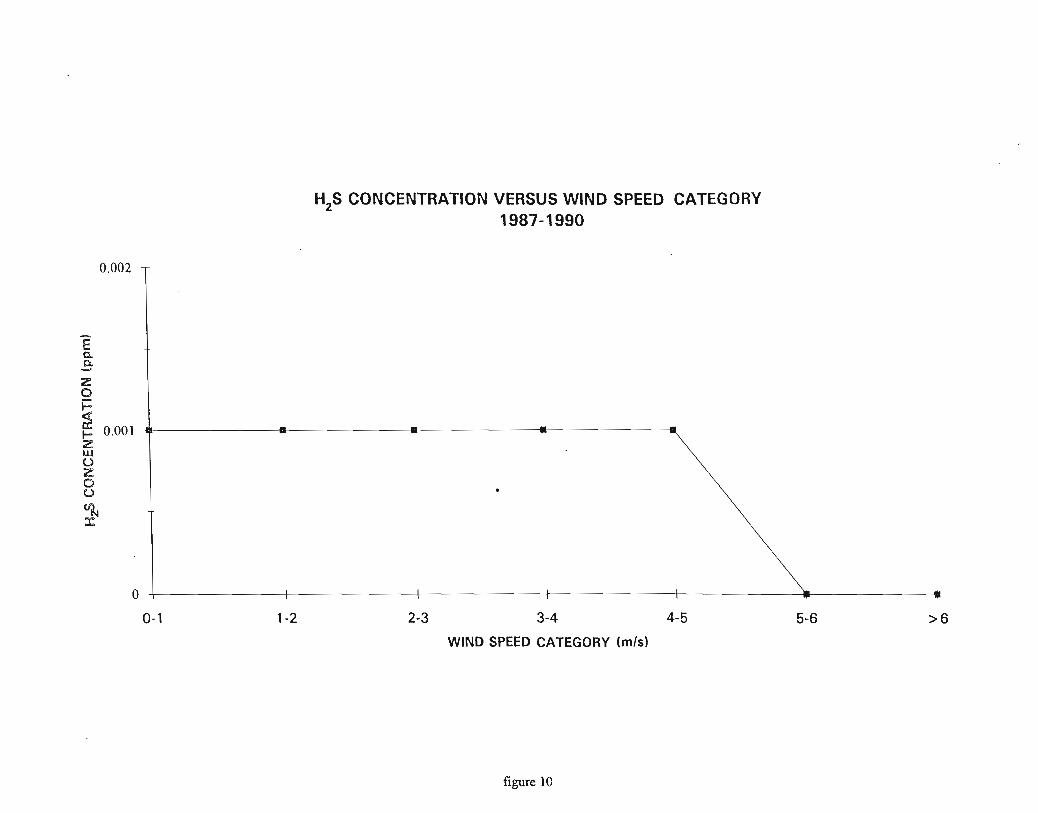
24
monitoring site and thus under WNW winds the monitoring site is directly downwind. Even with the close proximity of Sulphur Bank, the mean value of all hourly averages recorded when the wind was blowing out of the WNW was 0.003 ppm. Data for mean H2S concentration for various wind speed categories shows that ambient levels of H2S drop off to zero when wind speeds reach 5 m/s. (figure 10). Figure 10 incorporates all data collected over the entire monitoring period, including all hourly averages with values of 0.000 ppm. This plot indicates consistent, low H2S levels over a variety of wind speeds as a result of the high number of zero hourly values in the data set. Monthly one-hour maxima and means for H2S are presented in figure 11. Although one hour maxima for 1987-1989 are frequently non-zero values, monthly means are generally zero. No mean exceeded 0.004 ppm, and mean values greater than 0.002 ppm were reached on only three occasions. In examining the data for highest monthly one-hour maxima, we found that these were accompanied either by winds which included a west directional component, or by low speed (<3 m/s) variable winds. Variable winds which accompany hourly H2S maxima generally have a west directional component during hourly averages near the time of the maximum event. Long periods of low speed variable winds, or low speed west-component winds give rise to higher maxima, as an accumulation of emissions collects undispersed by strong steady winds. The lower one-hour maximum values recorded for 1989-1990 may be due to differences in meteorological conditions for these years as compared to 1987-1988, or may reflect a change in the degassing character of Sulphur Bank. In 1993 the Hawaii State Department of Health set an ambient air quality standard for H2S of 0.025 ppm (hourly average). Although no ambient H2S was detected during the final year of H2S monitoring at Hawaii Volcanoes National Park, and no current data is available, hourly averages at the park monitoring site reached 0.025 ppm 0.05% of the time during the 1987-1990 monitoring period. Intermittent sulfur dioxide emission-rate measurements- Ground-based summit and middle East Rift Zone measurements Results from vehicle-based SO2 measurements made at the summit of Kilauea from 1982 through October 1993 are shown in figure 12. Summit data show that before the current east-rift eruption started in January 1983, the total emission rate of SO2 from Kilauea was 170 ± 50 t/d essentially all of it coming from the summit caldera (Casadevall and others, 1987). With the onset of the eruption, the SO2 emission rates at the summit increased to around 200 to 400 t/d. The waning
25
of the continuous effusive eruption at the Kupaianaha vent (episode 48) in late 1991 was accompanied by a slight decrease in summit emissions that has continued to the present. From 1983-1986, emission rates at Pu'u 'O'o were high during eruptive episodes, but low during inter-episode periods. The eruptive episodes occurred every 3 to 4 weeks, each episode lasted typically less than 24 hours (Wolfe and others, 1988). Emission rates as high as 32,000 t/d (December, 1984; this data point is intentionally omitted from figure 13) were measured during these episodes (Casadevall and others, 1987). During inter-episode periods, emission rates were substantially less, as measured by tripod-based COSPEC, with 90-150 t/d coming from Pu'u 'O'o (Chartier and others, 1988). Between 1986 and 1991, during the continuous effusive activity at the Kupaianaha vent, intermittent tripod-based measurements were continued at Pu'u 'O'o by HVO personnel. Pu'u 'O'o was (and still is) considered to be the primary degassing source on the ERZ during that time period and measurements showed that the ERZ SO2 contribution was between 700 to 1200 t/d (figure 13). Vehicle-based measurements made along Chain of Craters road since 1992 support the idea that SO2 degassing from the ERZ has remained essentially constant since 1986 (figure 14). Measurements show that during short eruptive pauses in 1992 (lasting several hours to three days), ERZ emissions were generally lower than during vigorously active periods. During a nine day pause in February 1993, the longest pause since the beginning of episode 48 in 1986, measurements yielded 280 t/d, an SO2 emission-rate more consistent with the 1983-1986 inter-episode SO2 values. The vertical bars on figure 14 represent the standard deviation of all measurements on a given day. Data points with no bars have standard deviations too small to be shown. While the Chain of Craters road measurements have a higher degree of uncertainty than tripod-based ERZ measurements, owing to being made at a greater distance from the degassing source and uncertainty in wind speed, they are currently the best estimate of ERZ emission rates. Our current estimate of total SO2 emissions from Kilauea ranges between 400 t/d during eruptive pauses, to as much as 1850 t/d during eruptively active periods. This estimate is based on combining the summit values of 125-250 t/d with those obtained from the east rift zone of 280-1500 t/d. Vehicle-based lower East Rift Zone measurements near PGV Plant During the three lower ERZ traverses in October 1992, no SO2 was detected. Although lower ERZ on-site wind speed and direction measurements showed light and variable winds ( 2.7 m/s from 40°-90°), tradewinds of 3-4 m/s were recorded at the summit during this time period.
26
Discussion
In this study, we characterized gas emissions from the summit and along the ERZ of Kilauea using a three-fold approach to produce useful data for constraining the influence of Kilauean gas emissions on ambient air character around the volcano during times of active eruption and during eruptive pauses. Ambient-air grab-sample and precipitation measurements constitute a series of temporal snapshots defining gas concentrations next to and away from degassing sources at the summit and along the upper, middle, and lower ERZ of Kilauea and at the coastal entries. Continuous air-quality monitoring at the summit location gives detailed and reliable information on ambient SO2 and H2S concentrations along with meteorological parameters. These air quality data have excellent temporal control, but only for one geographical point on the volcano. Intermittent COSPEC measurements provide data on the total quantity of SO2 emitted from the summit and ERZ of Kilauea, i.e. essentially the entire budget of SO2 released from the volcano, during both eruptive and non-eruptive periods. We summarized the data collected by each technique in the Results section. Synthesizing these several types of data, we characterize Kilauea's summit and ERZ gas emissions in a more useful general geological and geographical way as follows: Summit solfatara areas of Kilauea are distinguished by high ambient levels of SO2, sometimes exceeding 100 ppmv at distances of 1 m or less from fumaroles, and lower levels of H2S, as high as 4.2 ppmv. Ambient-air hydrochloric acid is low, as is chloride ion in precipitation, 3 ppm or less. Sulfate ion concentration in precipitation is high, up to 260 ppm, and pH, low. Whereas ambient SO2 concentrations were high at the measurement sites, overall emission rate of SO2 from the summit is from 4 to 6 times lower than for the ERZ. Prevailing northeasterly tradewinds typically carry SO2 and its chemical products to the southwest. Although rainfall to the southwest of Kilauea Caldera is roughly equivalent to that of Portland, Oregon (100 - 130 cm/yr) the SO2 and H2SO4 help to sustain the sparsely vegetated landscape of the Ka'u Desert. During kona or low speed variable wind conditions gases are dispersed in the summit area and areas to the east of the volcano. Middle ERZ degassing areas are characterized by hot oxidizing conditions, promoting high ambient SO2, up to 38 ppm, as far as 100 m from the nearest degassing source, and low to moderate H2S, 0.1 ppm or less. Up to 0.9 ppm HCl was found in the air, and precipitation samples mirrored this, showing up to 348 ppm chloride ion. Measured sulfate ion in precipitation was high, up to 144 ppm, and pH was as low as 1.88. Combined SO2 emissions from these middle ERZ sources are the highest on the volcano during eruptive periods, generally ranging between 700 and 1200 t/d since late 1986. During eruptive pauses lasting more
27
than several days, middle ERZ sources contribute 400 t/d of SO2 or less. Steady tradewinds with a strong northerly component carry the gases and their chemical products to the southwest end of the National Park and along the southern coast of the island. During more northerly winds, these products are blown out to sea, though they may reappear in precipitation on the island further south or get swept around to Kailua-Kona. The more unusual kona-wind episodes cause middle ERZ gases and their chemical products to be dispersed in a wide area ranging from the summit of the volcano down toward Kea'au and over to Pahoa and Hilo. Coastal-entry areas showed, most notably, high HCl in the voluminous ocean entry gas plume. Ambient SO2 concentrations were high, up to 75 ppm within 1 m of fumaroles near the coast. Hydrogen sulfide in ambient air was moderate to high, up to 0.162 ppm. Precipitation in the area of the eruption plume was high in both measured chloride and sulfate, though our numbers do not incorporate sea-salt corrections. Precipitation measurements also showed low pH values, down to 2.46. Strong prevailing trade winds and offshore winds carry gases and other chemical products released from coastal-entries along shore and out to sea. Under these conditions, the emitted products may appear in precipitation within the National Park or follow the southern coastline of the island and be carried around the island towards Kailua-Kona. During onshore winds, or weak trade wind conditions, emissions are mostly dispersed within the Park, especially below Holei Pali. Lower ERZ thermal and non-thermal areas show little evidence of influence from volcanic emissions. These areas are characterized by absence of SO2, H2S, and HCl in the ambient air. Precipitation pH values were moderate, 4.42 to 6.3, with the 4.42 value recorded approximately 12 km from Pu'u 'O'o and the middle ERZ degassing areas. Sulfate ion concentration in precipitation for these areas was 4 ppm or less; chloride ion was present at up to 9 ppm, again these numbers being uncorrected for sea-salt influence. COSPEC measurements detected no SO2 in the lower ERZ area near PGV. Prevailing tradewinds and distance from degassing sources probably keep ambient air in the lower ERZ free of influence from volcanic gases and their chemical products. The results from the continuous air quality monitoring, the ambient-air grab-sample measurements, and the emission rate studies point out the importance of wind conditions on determining overall dispersion and effects of emitted gases and their chemical products on ambient air character. The continuous air quality monitoring data show that ambient SO2 and H2S levels exceed background levels only under specific wind regimes, that is, when the air quality site is downwind from the summit, Sulphur Bank, or middle ERZ degassing areas. The effects of wind conditions on ambient-air grab-sample measurements near actively
28
degassing areas of Pu'u 'O'o show that during kona winds, measured ambient SO2 and H2S concentrations are higher. Precipitation samples near the shore at coastal entries (makai) show lower pH and higher sulfate and chloride ion concentrations than do samples away from the shore (mauka) because of on-shore and along-shore wind effects. Our SO2 emission-rate measurements at the summit and ERZ are significantly affected by wind direction and wind speed; there are certain wind conditions under which SO2 may not be reliably measured even when we know the volcano is still outgassing at a relatively constant rate. These conditions include low-speed variable, or kona winds, that produce a broad and diffuse cloud from the emitted summit gases. The isopleth maps of Scholl and Ingebritsen (1994) clearly show how prevailing wind patterns at the summit and rift zones of Kilauea influence areal distribution of gas emission chemical products, specifically sulfate and chloride. The common important point for all of these examples is that, in assessing impact of the volcano on ambient air character, the direction of the wind with respect to actively degassing sources is as important as how many tonnes of gas are coming out of the vents. Furthermore, the "signal" of real day-to-day variations in emission rates can be hidden in the "noise" of variable wind conditions. This study found that the chemical and physical conditions present between where the gases are emitted and where the effects are measured are also important in determining the effects of gas emissions on ambient air character. This was illustrated by the discrepancy between the measured concentration of H2S in eruptive gases and in ambient air near the eruptive site. In this case, the reaction of H2S and SO2 effectively scrubs H2S under the oxidizing conditions present near eruptive vents. This is seen visibly when clear hot fume, fresh from a vent or skylight, becomes translucent with the formation of very fine sulfur particles, as it moves away from the vent and cools. Sulphur Bank, where near-surface hydrolysis of SO2 forms H2S, is another case, where gas species released from depth are not the same as those that are seen on the surface. A final important conclusion is that Kilauea is a spatially and temporally dynamic system. The present eruption, historically the longest on record for Kilauea, is now in its 11th year and 53rd eruptive episode, and has undergone many changes in eruptive style and location. During the time of this field study (May - September, 1993), we witnessed some of these changes occurring. While the overall character of the eruption has remained basically the same during our field study, eruptive vents have ceased activity, lava tubes have shut down and others have taken their place. The current eruption may continue for several more years, cease abruptly, or may migrate up-rift towards the summit as has been the case in previous sustained ERZ eruptions. When the current eruption finally does end, we expect total SO2 emission rates for the volcano to drop back to 100 to 200 t/d,
29

essentially all of it coming from the summit caldera. This eventual shutdown in the eruption would essentially eliminate SO2, H2S, HCl and other emissions from the ERZ.
30
REFERENCES
Allen, E.T., 1922, Preliminary tests of gases at Sulphur Banks, Hawaii: Monthly bulletin of the Hawaiian Volcano Observatory, v. 10, no. 8, p.89-92. Andres, R.J., Kyle, P.R., Stokes, J.B., and Rose, W.I., 1989, SO2 from episode
48A eruption, Hawaii: Sulfur dioxide emissions from the episode 48A east rift zone eruption of Kilauea Volcano, Hawaii: Bulletin of Volcanology, v. 52, p. 113-117.
Casadevall, T., Greenland, P., and Furukawa, B., 1981, Gas studies of the March
10-12, l980, intrusion of Kilauea Volcano, Hawaii [abs.], in American Geophysical Union fall meeting, San Francisco, Calif, Dec. 7-11,1981, Program and abstracts: Eos, Transactions, American Geophysical Union, v. 62, no. 45, p. l072. �
Casadevall, T.J., and Hazlett, R.W., 1983, Thermal areas on Kilauea and Mauna Loa Volcanoes, Hawaii: Journal of Volcanology and Geothermal Research, v. l6, p. l73-l88.
Casadevall, T.J., Stokes, J.B., Greenland, L.P., Malinconico, L.L., Casadevall,
J.R., and Furukawa, B.T., 1987, SO2 and CO2 emission rates at Kilauea Volcano, 1979-1984, chap. 29 in Decker, R.W., Wright, T.L., and Stauffer, P.H., eds., Volcanism in Hawaii: U.S. Geological Survey Professional Paper 1350, v. 1, p. 771-780. �
Chartier, T.A., Rose, W.I., and Stokes, J.B., 1985, SO2 emission rates at Pu`u `O`o vent, Kilauea between east rift zone phases 33 and 34 [abs.], in AGU fall meeting, San Francisco, Calif., Dec. 8-13, 1985, Program and abstracts: Eos, Transactions, American Geophysical Union, v. 66, no. 46, p. 1132.
Doukas, M.P., and Gerlach, T.M., 1994, Airborne Gas Monitoring of SO2 and
CO2 during the 1992 eruption at Crater Peak, Mount Spurr, Alaska: U.S. Geological Survey Bulletin XX (in press).
Friedman, I.F., and Reimer, G.M., 1987, Helium at Kilauea Volcano, Part I,
Spatial and temporal variations at Sulphur Bank. chap.33 part 1 in Decker, R.W., Wright, T.L., and Stauffer, P.H., eds., Volcanism in Hawaii: U.S. Geological Survey Professional Paper 1350, v. 1, p. 809-813. �
31
Gerlach, T.M., 1980, Evaluation of volcanic gas analyses from Kilauea Volcano: Journal of Volcanology and Geothermal Research, v. 7, no. 3/4, p. 295-317.
Gerlach, T.M., 1986, Exsolution of H2O, CO2, and S during eruptive episodes at
Kilauea Volcano, Hawaii: Journal of Geophysical Research, v. 91, no. B12, p. 12,177-12,185.
Gerlach, T.M., 1993, Oxygen fugacity of Kilauea volcanic gases and the oxygen
fugacity of Kilauea basalt: Geochimica et Cosmochimica Acta, v. 57, p. 795-814.
Gerlach, T.M., Krumhansl, J.L., Fournier, R.O., and Kjargaard, J., 1989, Acid rain
from the heating and evaporation of sea water by molten lava: A new volcanic hazard [abs.], in AGU fall meeting, San Francisco, Calif., Dec. 4-8, 1989, Program and abstracts: Eos, Transactions, American Geophysical Union supp., v. 70, no. 43, p. 1421.
Giggenbach, W.F., 1987, Redox processes governing the chemistry of fumarolic
gas discharges from White Island, New Zealand: Applied Geochemistry, vol. 2, p. 143-161.
Greenland, L.P., 1984, Gas composition of the January 1983 eruption of Kilauea
Volcano, Hawaii: Geochimica et Cosmochimica Acta, v. 48, p. 193-195.
Greenland, L.P., 1986, Gas analyses from the Pu`u `O`o eruption in 1985, Kilauea Volcano, Hawaii: Bulletin of Volcanology, v. 48, p. 341-348.
Greenland, L.P., 1987, Hawaiian eruptive gases, chap. 28, in Decker, R.W.,
Wright, T.L., and Stauffer, P.H., eds., Volcanism in Hawaii: U.S. Geological Survey Professional Paper 1350, v. 1, p. 759-770.
Greenland, L.P., 1988, Gases from the 1983-84 east-rift eruption, chap. 4, in
Wolfe, E.W., eds., The Pu`u `O`o Eruption of Kilauea Volcano, Hawaii: Episodes 1 through 20, January 3, 1983, through June 8, 1984: U.S. Geological Survey Professional Paper 1463, p. 145-153. �
Greenland, L.P., and Aruscavage, P., 1986, Volcanic emission of Se, Te, and As from Kilauea Volcano, Hawaii: Journal of Volcanology and Geothermal Research, v. 27, p. 195-201.
32
Hazlett, R.W., 1990, Geological Field Guide Kilauea Volcano: Hawaii Natural History Association, 127 p. �
Henderson-Sellers, B., 1984, Pollution of our Atmosphere: Adam Hilger Ltd, Bristol, UK., p. 18.
Hinkle, M.E., and Stokes, J.B., 1990, Tabulation of CO2, SO2, and He
concentrations in summit fumarole gases and wind and rainfall data at Kilauea Volcano, Hawaii, for the period June 1987-February 1989: U.S. Geological Survey Open-File Report 90-507, 27 p.
Holcomb, R.T., 1987, Eruptive history and long-term behavior of Kilauea
Volcano, chap. 12 in Decker, R.W., Wright, T.L., and Stauffer, P.H., eds., Volcanism in Hawaii: U.S. Geological Survey Professional Paper 1350, v. 1, p. 261-350.
Jaggar, T.A., 1940, Magmatic gases: American Journal of Science, v. 238, p. 313-353 [includes plates].
Lodge, J.P., Jr. ed., 1989, Methods of Air Sampling and Analysis, Lewis Publishers, Inc., p. 171-187. Miller, J.M., and Yoshinaga, A.M., 1981, The pH of Hawaiian precipitation, a
preliminary report: Geophysical Research Letters, v.8, no.7, p.779-782. Nash, A.J., 1992, Diurnal surface weather variations on the island of Hawaii:
Honolulu, Master's thesis, Department of Meteorology, University Hawaii, 127 p.
Payne, J.H., and Ballard, S.S., 1940, The incidence of hydrogen sulfide at Kilauea solfatara preceding the 1940 Mauna Loa activity: Science, v.92, no. 2384, p. 218-219. Reimer, G.M., 1987, Helium at Kilauea Volcano, Part II, Distribution in the
summit region, chap. 33; in Decker, R.W., Wright, T.L., and Stauffer, P.H., eds., Volcanism in Hawaii: U.S. Geological Survey Professional Paper 1350, v. 1, p.815-819. �
Scholl, M.A., and Ingebritsen, S.E., 1994, Estimated bulk deposition of sulfate and chloride in the Kilauea Volcano area, Hawaii: U.S. Geological Survey Water Resources Investigations Report no. 94-XXX (in press).
33
Snoeyink, V.L., and Jenkins, D., 1980, Water Chemistry, John Wiley and Sons, 463 p. Stoiber, R.E., Malinconico, L.L., Jr., and Casadevall, T.J., 1979, SO2 monitoring
by remote sensing at Kilauea Volcano, Hawaii [abs.], in Hawaii Symposium on Intraplate Volcanism and Submarine Volcanism, Hilo, Hawaii, July 16-22, 1979, Abstract Volume: Hilo, Hi., U.S. Geological Survey and University of Hawaii, p. 174.
Wolfe, E.W., Neal, C.A., Banks, N.G., and Duggan, T.J., 1988, Geologic
observations and chronology of eruptive events chap. 1, in Wolfe, E.W., eds., The Pu`u `O`o Eruption of Kilauea Volcano, Hawaii: Episodes 1 through 20, January 3, 1983, through June 8, 1984: U.S. Geological Survey Professional Paper 1463, p. 1-97.
34
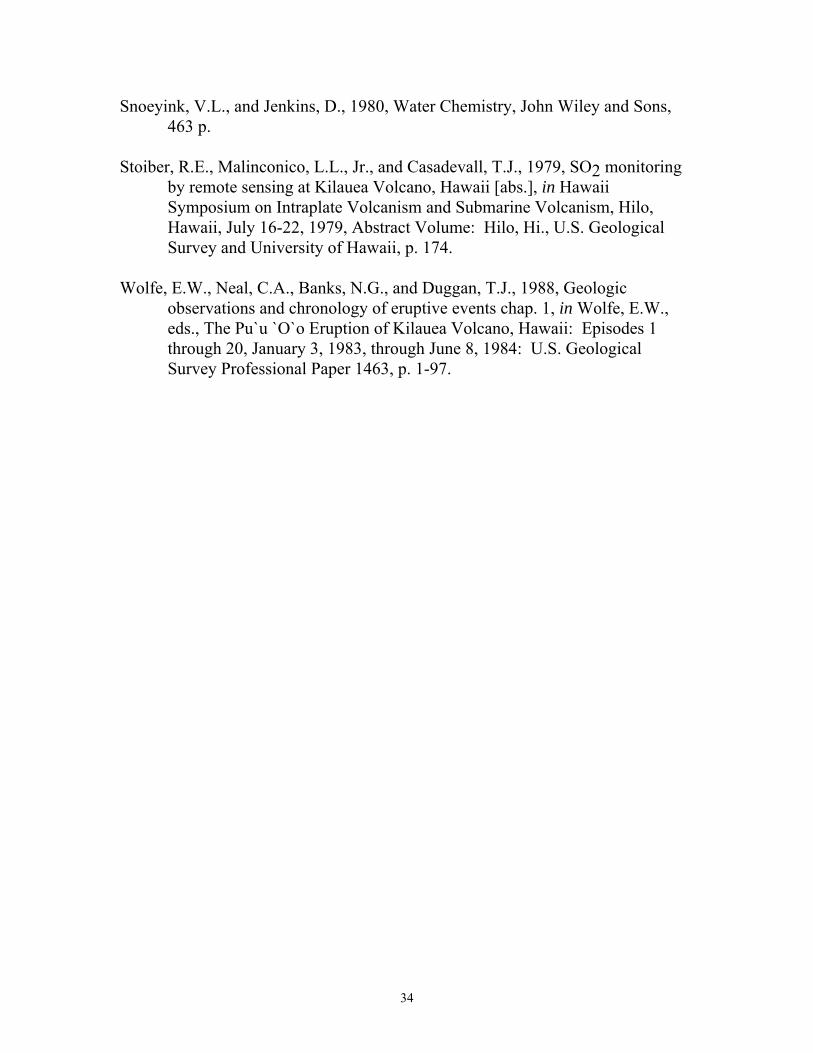
figure 1 - Location map Island of Hawaii, and ambient-air grab-sample data collection sites at the summit, along the entire ERZ of Kilauea and at coastal lava ocean-entries. Boxed areas are shown with more detail in figures 2, 3, and 4. The roads around PGV used for making vehicle-based SO2 measurements by COSPEC are also shown. figure 2 - Map of Sulphur Bank solfatara, which is located along a fracture line at the base of the ring-fault escarpment within Kilauea Caldera and 500 m WNW of the continuous Air-quality monitoring site figure 3 - Data collection sites for ambient-air grab-sample measurements at summit and upper ERZ. The road for the summit COSPEC (SO2) measurement traverse is also shown. Map adapted from Hazlett, 1993. figure 4 - Location map of data collection sites for ambient-air grab-sample along middle ERZ and coast. figure 5 - Map showing location of National Park Service air quality monitoring site, that is operated cooperatively with the USGS, located approximately 4 km NE of primary summit caldera degassing area, and 16 km WNW of primary ERZ degassing areas. General trade wind direction is shown by upper gray arrows and kona wind direction by lower black arrows. figure 6 - Graph of mean SO2 concentration as a function of wind direction, as measured at the Air-Quality monitoring site at the summit of Kilauea for all data for the period 1987-1992. Concentration peaks are at E, SW, and WNW and correspond to directions of primary degassing areas along the ERZ, summit caldera, and Sulphur Bank, respectively. figure 7 - Graph of mean SO2 concentration at summit air quality monitoring site for all data from 1987-1992, versus wind speed category. Under mild wind conditions, ambient SO2 concentrations are highest. As wind speed exceeds 4-5 m/s, SO2 concentration approaches zero ppm. figure 8 - Graph of monthly 1-hour SO2 maxima and means at summit air quality monitoring site for all data from 1987-1992. Typically, lower maxima and means occur in months of June and July, when trade winds prevail. figure 9 - Graph of mean H2S concentration versus wind direction for all data from 1987-1990 at summit air quality monitoring site. Peak at WNW
35
36
shows influence of close proximity of Sulphur Bank. Despite this proximity, however, the mean value of all hourly averages recorded when winds were from Sulphur Bank direction was only 0.003 ppm. figure 10 - Graph of mean H2S concentration versus wind speed category at summit Air-Quality monitoring site for all data from 1987-1990. H2S concentration drops off to zero when wind speed reaches 5 m/s. Note that this figure also indicates consistently low H2S levels even when wind speeds are low. figure 11 - Graph of H2S monthly 1-hour maxima and means for 1987-1990 at summit air quality monitoring site. Monthly means for the period were at or below 0.004 ppm. Highest one-hour maxima were accompanied by low speed (<3 m/s) variable winds, or winds with a westerly component. figure 12 - Graph of vehicle-based SO2 emission rate measurements made at the summit of Kilauea from 1979 through October 1993. Before the current east-rift eruption started in January 1983, total emission rate for the volcano was 170 ± 50 t/d, essentially all of it coming out of the summit caldera. Emission-rates climbed to between 200 and 400 t/d with the onset of eruptive activity at Pu'u 'O'o. Rates have decreased slightly since the end of 1991 as the activity at Kupaianaha vent waned during episode 48 (EE 48 on figure). Emission rates have continued at this slightly lower level during activity at a succession of vents around Pu'u 'O'o. figure 13 - Graph of tripod-based SO2 emission rate measurements made near Pu'u 'O'o. From 1986-1991, ERZ eruptive SO2 emissions ranged between 700 and 1200 t/d. Inter-episode emission rates during the era of Pu'u 'O'o fountaining were substantially less. figure 14 - Graph of vehicle-based SO2 emission rate measurements made along Chain of Craters Road. East Rift Zone eruptive SO2 emissions have remained relatively constant since 1986, and inter-episode emission rates are generally lower than during vigorously active periods.


![Geography of Canada - cws.amscotta.com · Mount Kilauea, Hawaii / Kobe, Japan [A] An active volcano on Mount Kilauea in Hawaii. Kilauea seems to be a virtually ongoing eruption. [B]](https://img.pdfslide.us/doc/110x75/5ee21d52ad6a402d666cbc44/geography-of-canada-cws-mount-kilauea-hawaii-kobe-japan-a-an-active-volcano.jpg)