Embed Size (px)
Citation preview
6/11/2013
1
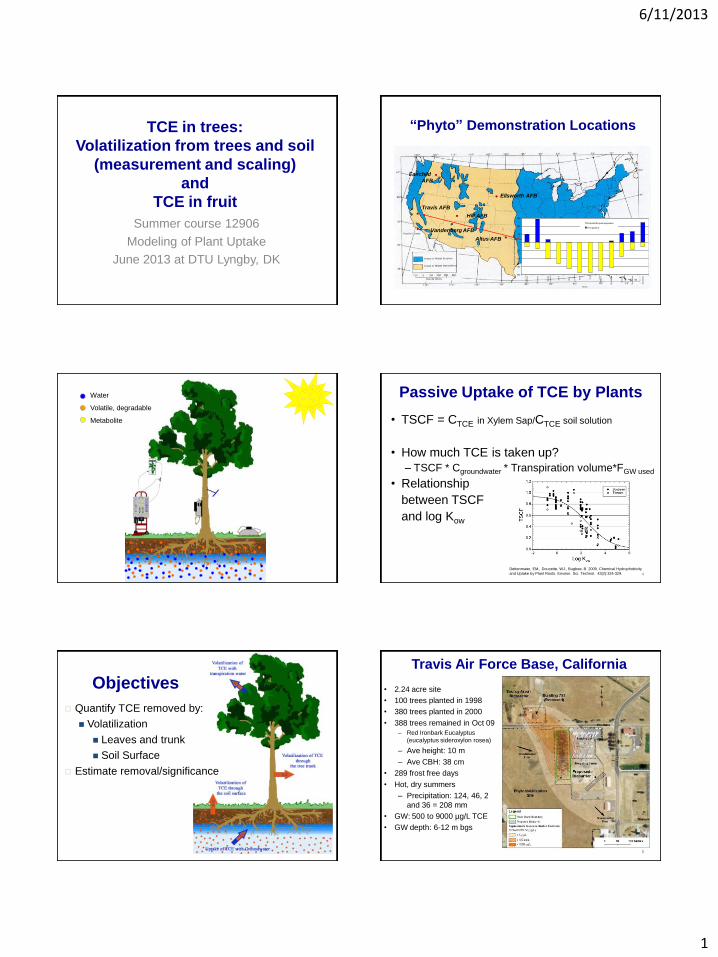
TCE in trees:
Volatilization from trees and soil
(measurement and scaling)
and
TCE in fruit
Summer course 12906
Modeling of Plant Uptake
June 2013 at DTU Lyngby, DK
“Phyto” Demonstration Locations
Fairchild
AFB
Vandenberg AFB
Travis AFB
Hill AFB
Altus AFB
Ellsworth AFB
-200
-150
-100
-50
0
50
100
150
Jan
uary
Feb
ruary
Marc
h
Ap
ril
May
Jun
e
July
Au
gu
st
Sep
tem
ber
Octo
ber
No
vem
ber
Decem
ber
Month
Pre
cip
itat
ion
an
d E
vap
otr
ansp
irat
ion
(m
illim
eter
s)
Potential Evapotranspiration
Precipitation
Water
Volatile, degradable
Metabolite
4
• TSCF = CTCE in Xylem Sap/CTCE soil solution
• How much TCE is taken up?
– TSCF * Cgroundwater * Transpiration volume*FGW used
• Relationship
between TSCF
and log Kow
Dettenmaier, EM., Doucette, WJ., Bugbee, B. 2009. Chemical Hydrophobicity
and Uptake by Plant Roots. Environ. Sci. Technol. 43(2):324-329.
Passive Uptake of TCE by Plants
Objectives
Quantify TCE removed by:
Volatilization
Leaves and trunk
Soil Surface
Estimate removal/significance
6
Travis Air Force Base, California
• 2.24 acre site
• 100 trees planted in 1998
• 380 trees planted in 2000
• 388 trees remained in Oct 09
– Red Ironbark Eucalyptus
(eucalyptus sideroxylon rosea)
– Ave height: 10 m
– Ave CBH: 38 cm
• 289 frost free days
• Hot, dry summers
– Precipitation: 124, 46, 2
and 36 = 208 mm
• GW: 500 to 9000 µg/L TCE
• GW depth: 6-12 m bgs
6/11/2013
2
8
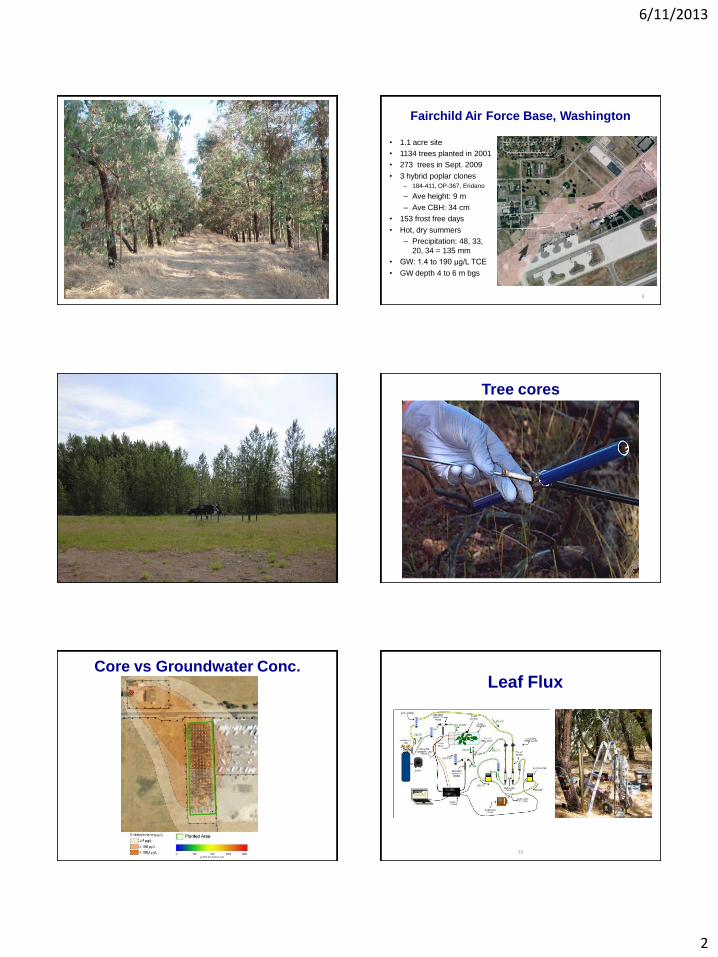
Fairchild Air Force Base, Washington
• 1.1 acre site
• 1134 trees planted in 2001
• 273 trees in Sept. 2009
• 3 hybrid poplar clones
– 184-411, OP-367, Eridano
– Ave height: 9 m
– Ave CBH: 34 cm
• 153 frost free days
• Hot, dry summers
– Precipitation: 48, 33,
20, 34 = 135 mm
• GW: 1.4 to 190 μg/L TCE
• GW depth 4 to 6 m bgs
Tree cores
10
Core vs Groundwater Conc. Leaf Flux Sampling
12
Leaf Flux
6/11/2013
3
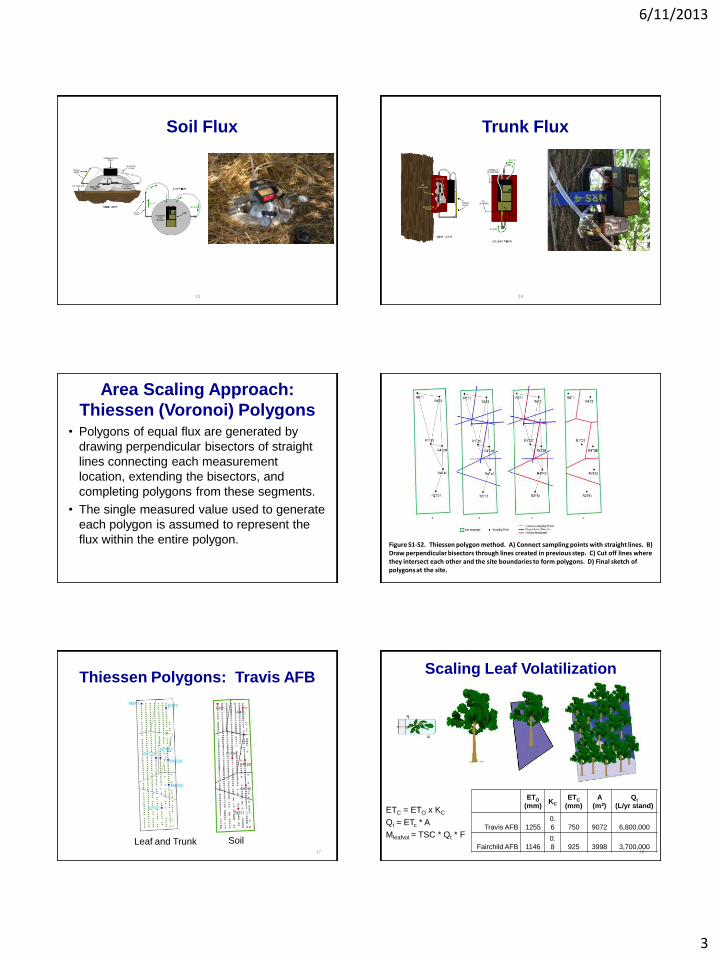
Soil Flux Sampling
13
Soil Flux Trunk Flux Sampling
14
Trunk Flux
Area Scaling Approach:
Thiessen (Voronoi) Polygons • Polygons of equal flux are generated by
drawing perpendicular bisectors of straight
lines connecting each measurement
location, extending the bisectors, and
completing polygons from these segments.
• The single measured value used to generate
each polygon is assumed to represent the
flux within the entire polygon. Figure S1-S2. Thiessen polygon method. A) Connect sampling points with straight lines. B) Draw perpendicular bisectors through lines created in previous step. C) Cut off lines where they intersect each other and the site boundaries to form polygons. D) Final sketch of polygons at the site.
17
Thiessen Polygons: Travis AFB
Leaf and Trunk Soil 18
Scaling Leaf Volatilization
ETC = ETO x KC
Qt = ETc * A
Mleafvol = TSC * Qt * F
ETO
(mm) KC
ETC
(mm)
A
(m2)
Qt
(L/yr stand)
Travis AFB 1255
0.
6 750 9072 6,800,000
Fairchild AFB 1146
0.
8 925 3998 3,700,000
6/11/2013
4
19
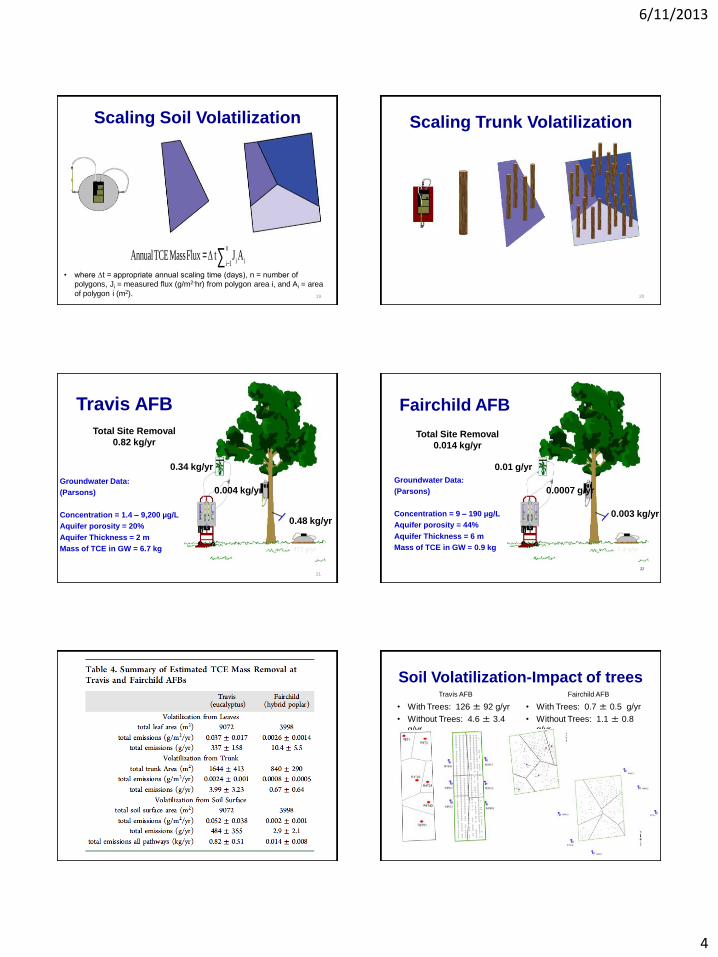
Scaling Soil Volatilization
AnnualTCEMassFlux =∆ t Ji Aii-1
n
å• where ∆t = appropriate annual scaling time (days), n = number of
polygons, Ji = measured flux (g/m2-hr) from polygon area i, and Ai = area
of polygon i (m2).
20
Scaling Trunk Volatilization
21
Groundwater Data:
(Parsons)
Concentration = 1.4 – 9,200 µg/L
Aquifer porosity = 20%
Aquifer Thickness = 2 m
Mass of TCE in GW = 6.7 kg
472 g/yr
0.48 kg/yr
0.004 kg/yr
0.34 kg/yr
Total Site Removal
0.82 kg/yr
Travis AFB
22
Groundwater Data:
(Parsons)
Concentration = 9 – 190 µg/L
Aquifer porosity = 44%
Aquifer Thickness = 6 m
Mass of TCE in GW = 0.9 kg
7.3 g/yr
0.003 kg/yr
0.0007 g/yr
0.01 g/yr
Total Site Removal
0.014 kg/yr
Fairchild AFB
Soil Volatilization-Impact of trees
• With Trees: 126 ± 92 g/yr
• Without Trees: 4.6 ± 3.4
g/yr
• With Trees: 0.7 ± 0.5 g/yr
• Without Trees: 1.1 ± 0.8
g/yr
Travis AFB Fairchild AFB
6/11/2013
5
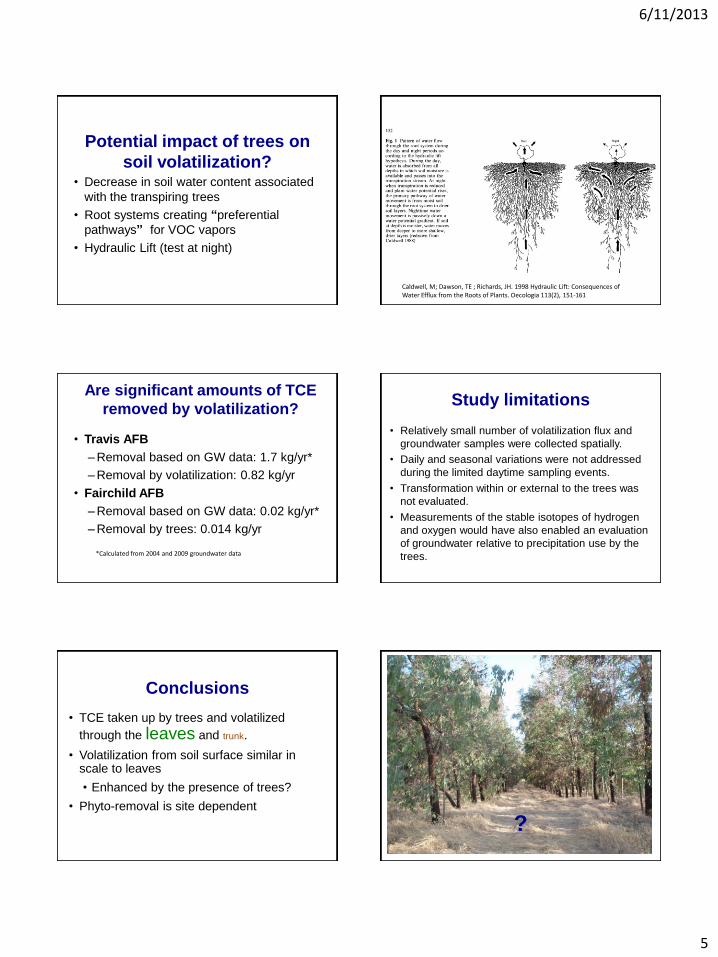
Potential impact of trees on
soil volatilization? • Decrease in soil water content associated
with the transpiring trees
• Root systems creating “preferential
pathways” for VOC vapors
• Hydraulic Lift (test at night)
Caldwell, M; Dawson, TE ; Richards, JH. 1998 Hydraulic Lift: Consequences of Water Efflux from the Roots of Plants. Oecologia 113(2), 151-161
Are significant amounts of TCE
removed by volatilization?
• Travis AFB
–Removal based on GW data: 1.7 kg/yr*
–Removal by volatilization: 0.82 kg/yr
• Fairchild AFB
–Removal based on GW data: 0.02 kg/yr*
–Removal by trees: 0.014 kg/yr
*Calculated from 2004 and 2009 groundwater data
Study limitations
• Relatively small number of volatilization flux and
groundwater samples were collected spatially.
• Daily and seasonal variations were not addressed
during the limited daytime sampling events.
• Transformation within or external to the trees was
not evaluated.
• Measurements of the stable isotopes of hydrogen
and oxygen would have also enabled an evaluation
of groundwater relative to precipitation use by the
trees.
• TCE taken up by trees and volatilized
through the leaves and trunk.
• Volatilization from soil surface similar in scale to leaves
• Enhanced by the presence of trees?
• Phyto-removal is site dependent
Conclusions
?
6/11/2013
6
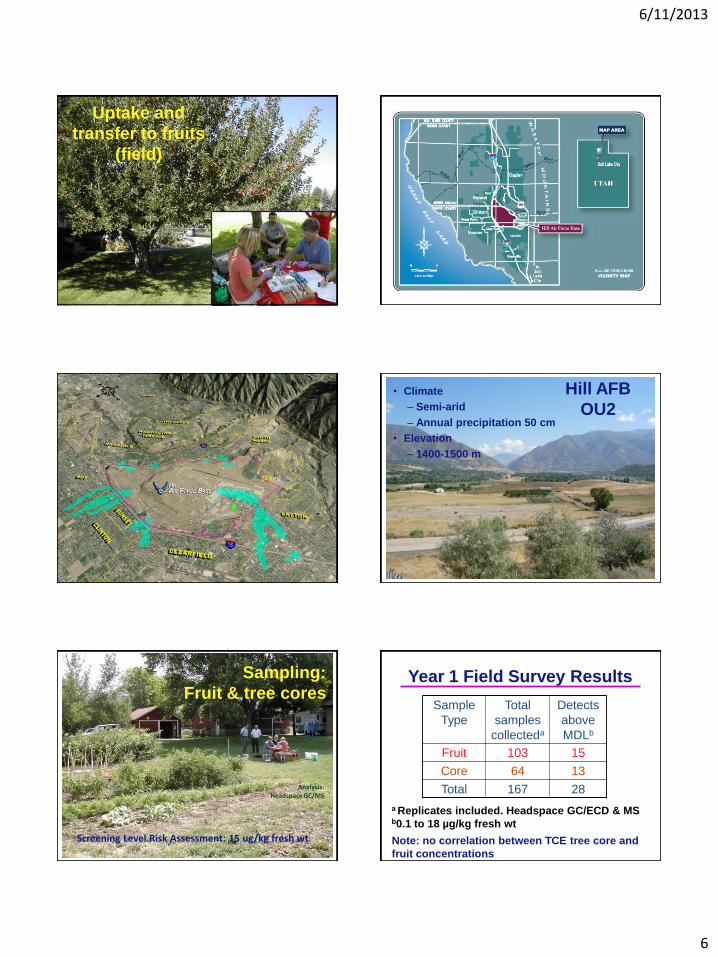
Uptake and
transfer to fruits
(field)
7 5 T H A I R B A S E W I N G
Areas of Contamination
BE AMERICA’S BEST
27 km2
Hill AFB
OU2 • Climate
– Semi-arid
– Annual precipitation 50 cm
• Elevation
– 1400-1500 m
Analysis: Headspace GC/MS
Sampling:
Fruit & tree cores
Screening Level Risk Assessment: 15 ug/kg fresh wt
Year 1 Field Survey Results
Sample
Type
Total
samples
collecteda
Detects
above
MDLb
Fruit 103 15
Core 64 13
Total 167 28
a Replicates included. Headspace GC/ECD & MS
b0.1 to 18 µg/kg fresh wt
Note: no correlation between TCE tree core and
fruit concentrations
6/11/2013
7
Risk Assessment- Hilltop
Times Headline
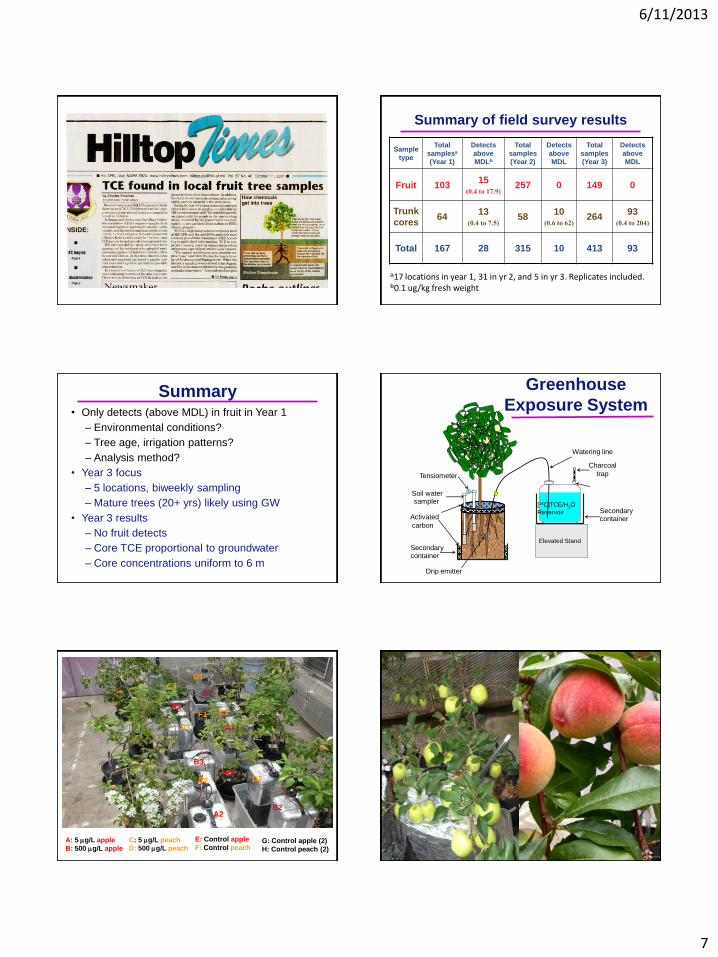
Summary of field survey results
Sample
type
Total
samplesa
(Year 1)
Detects
above
MDLb
Total
samples
(Year 2)
Detects
above
MDL
Total
samples
(Year 3)
Detects
above
MDL
Fruit 103 15
(0.4 to 17.9) 257 0 149 0
Trunk
cores 64
13 (0.4 to 7.5)
58 10
(0.6 to 62) 264
93 (0.4 to 204)
Total 167 28 315 10 413 93
a17 locations in year 1, 31 in yr 2, and 5 in yr 3. Replicates included. b0.1 ug/kg fresh weight
Summary • Only detects (above MDL) in fruit in Year 1
– Environmental conditions?
– Tree age, irrigation patterns?
– Analysis method?
• Year 3 focus
– 5 locations, biweekly sampling
– Mature trees (20+ yrs) likely using GW
• Year 3 results
– No fruit detects
– Core TCE proportional to groundwater
– Core concentrations uniform to 6 m
Secondary container
Soil water sampler
Secondary container
[
Tensiometer
Activated
carbon
Elevated Stand
[14C]TCE/H2O
Reservoir
Charcoal
trap
Watering line
Drip emitter
Greenhouse
Exposure System
Greenhouse fruit uptake
photo C3 B2
C1
A1
D2
B2
D1
A3
D3
B3
C2
A2
E1
F1
A: 5 mg/L apple
B: 500 mg/L apple
E: Control apple
F: Control peach C: 5 mg/L peach
D: 500 mg/L peach G: Control apple (2)
H: Control peach (2)
Apple & peach photo

6/11/2013
8
Average [14C] data 2nd yr
high/low (µg/kg fresh wt)
Comparing Peaches to Peaches
Fruit flesh
44 / 0.6
Leaves
260 / 3.2
Branches
560 / 8.4
Elevated Stand
Irrigation
water (µg/L)
690/ 5.3
Fruit peel
Fruit flesh
Branches
Leaves*
Irrigation
water
67
483
64
562
1210 259
626 606
*No statistical difference
Elevated Stand
171 days 14C [TCE]
exposure
Elevated Stand
220 days 14C [TCE]
exposure
TCE <0.1
TCE <0.1
TCE <0.1
TCE 690
Comparing Apples to Peaches
average [14C] 2nd yr (µg/kg fresh wt)
23 44
TCE <0.1
Early Stages of Fruit Development
Similar phloem contribution
and xylem contribution
(some backflow during high ET demands)
Later Stages of Fruit Development
Large phloem contribution
Small xylem contribution
(Lang, A. 1990. Xylem, phloem, and transpiration flows
in developing apple fruits. J. Exp. Bot. 41:645-651.)
Control apple trees
(no sulfolane added)
Treatment apple trees
(100 ppm sulfolane added)
Sulfolane in apple trees
Leaves: 3700 mg/kg
30-day
exposure:
55 mg/L
Apple: 16 mg/kg
Xylem
Volatilization (glycoside metabolite, trichloroethanol)
(TCE, sulfolane)
(TCE)
Tentative Hypothesis
Phloem
sulfolane
TCE
Summary
• Trees take up, metabolize, and volatilize TCE if
utilizing contaminated groundwater.
• Field & lab data suggest TCE contamination of
fruit unlikely due to volatilization losses.
– Identity & fate of 14C metabolites not clear.
• Mature trees useful for identifying GW plumes.
6/11/2013
9
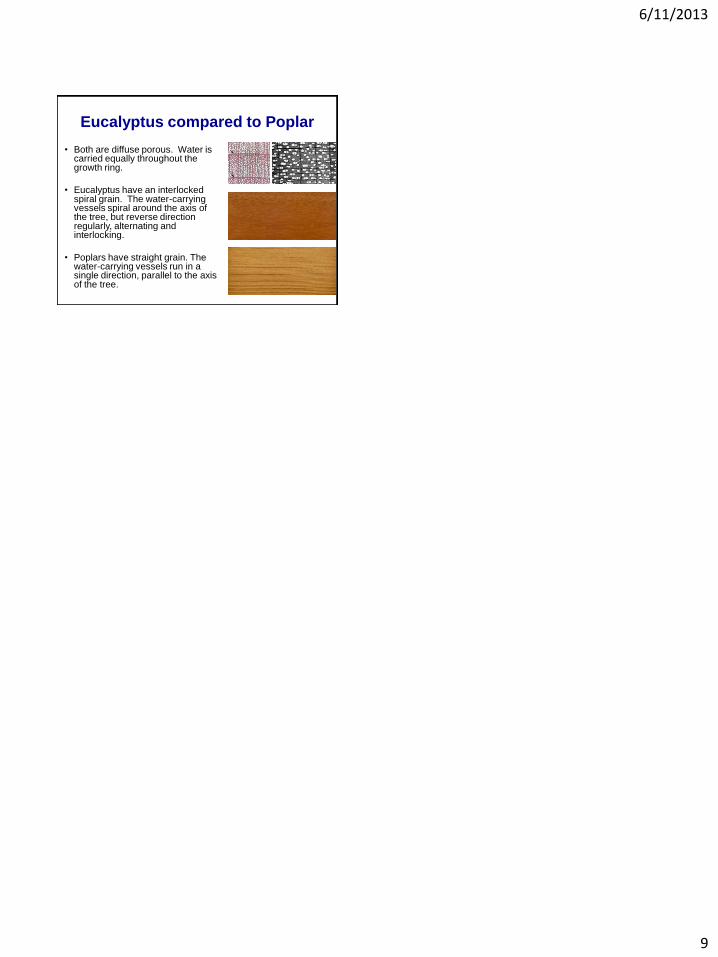
Eucalyptus compared to Poplar
• Both are diffuse porous. Water is carried equally throughout the growth ring.
• Eucalyptus have an interlocked spiral grain. The water-carrying vessels spiral around the axis of the tree, but reverse direction regularly, alternating and interlocking.
• Poplars have straight grain. The water-carrying vessels run in a single direction, parallel to the axis of the tree.