Embed Size (px)
Citation preview
Voice gender perception by cochlear implanteesa)
Damir Kovačićb�
Cognitive Neuroscience Sector, Scuola Internazionale Superiore di Studi Avanzati (SISSA),Via Lionello Stock 2/2, 34135 Trieste, Italy and SUVAG Polyclinic, Kneza LJ. Posavskog 10,10000 Zagreb, Croatia
Evan BalabanBehavioral Neurosciences Program, Stewart Biological Sciences Building, McGill University, 1205 AvenueDr. Penfield, Montreal, Quebec H3A 1B1, Canada and Laboratorio de Imagen Médica, HospitalGeneral Universitario Gregorio Marańón, Calle Dr. Esquerdo 46, 28007 Madrid, Spain
�Received 5 June 2008; revised 4 March 2009; accepted 26 May 2009�
Gender identification of human voices was studied in a juvenile population of cochlear implant �CI�users exposed to naturalistic speech stimuli from 20 male and 20 female speakers using twodifferent voice gender perception tasks. Stimulus output patterns were recorded from eachindividual CI for each stimulus, and features related to voice fundamental frequency and spectralenvelope were extracted from these electrical output signals to evaluate the relationship betweenimplant output and behavioral performance. In spite of the fact that temporal and place cues ofsimilar quality were produced by all CI devices, only about half of the subjects were able to labelmale and female voices correctly. Participants showed evidence of using available temporal cues,but showed no evidence of using place cues. The implants produced a consistent and novel cue tovoice gender that participants did not appear to utilize. A subgroup of participants could discriminatemale and female voices when two contrasting voices were presented in succession, but were unableto identify gender when voices were singly presented. It is suggested that the nature of long-termauditory categorical memories needs to be studied in more detail in these individuals.© 2009 Acoustical Society of America. �DOI: 10.1121/1.3158855�
PACS number�s�: 43.64.Me, 43.71.Bp, 43.66.Ts �RYL� Pages: 762–775
I. INTRODUCTION
Cochlear implant �CI� users exhibit high variability intheir ability to perceive speech �Svirsky et al., 2000; Blameyet al., 2001�. An important goal of CI research is to elucidatepotential factors underlying this variation. Anecdotal evi-dence and previous studies �Cleary and Pisoni, 2002; Fuet al., 2004; Spahr and Dorman, 2004; Cleary et al., 2005;Fu et al., 2005� suggest that even seemingly simple taskssuch as identifying speakers pose challenges for CI users.
The identification of voice gender must be ultimatelybased on the quality of the spectral and temporal cues thatspeech items provide, even though individual variation ineach individual’s memory, experience, and motivation arealso necessarily involved. Gender-related features of vocaltract anatomy �via body size effects on vocal tract length�VTL��, and laryngeal fold size �influencing differences inthe temporal rate of vibration, which are reflected in differ-ences in fundamental frequency �F0�� provide normal-hearing �NH� listeners with cues for voice gender identifica-tion. An almost perfect recognition of voice gender isachieved in NH individuals when both VTL and F0 cues areused �Bachorowski and Owren, 1999; Owren et al., 2007;
a�Portions of these data were presented at the Conference for ImplantableAuditory Prosthesis 2007, Lake Tahoe, CA.
b�Author to whom correspondence should be addressed. Present address:Laboratory of Auditory Neurophysiology, K.U. Leuven, Campus Gasthuis-berg O&N 2, Herestraat 49 bus 1021, B-3000 Leuven, Belgium. Electronic
mail: [email protected]762 J. Acoust. Soc. Am. 126 �2�, August 2009 0001-4966/2009/1
Smith et al., 2007�. In addition, automated recognition sys-tems using VTL and F0 show robust performance in the faceof within- and between-speaker acoustic variations �Childersand Wu, 1991; Wu and Childers, 1991�.
CIs appear to elicit temporal pitch percepts only below�300 Hz �Carlyon and Deeks, 2002; Zeng, 2002� and haveinherently low spectral resolution �Cohen et al., 1996;McKay, 2005�. CI users may rely on particular isolated spec-tral or temporal cues, or some combination in gender identi-fication tasks �Fu et al., 2004; Laneau and Wouters, 2004b;Fu et al., 2005; Chang and Fu, 2006�. Temporal cues aredelivered in the form of envelope modulations to one ormore stimulation electrodes, while spectral cues are providedvia the spatial pattern of electrode array stimulation �McKayet al., 1994, 1995; Laneau and Wouters, 2004a, 2004b�. Suchcues should yield high levels of gender identification whenvoices are far apart from each other in F0 and VTL, eventhough CI users are poor at distinguishing speakers withsimilar vocal characteristics �Cleary and Pisoni, 2002; Fuet al., 2005�. However, the extent to which the implants ofdifferent users provide information of similar quality aboutnatural speech signals may also play a role in individualvariation in CI listener performance.
The present study examines CI users’ perception ofvoice gender by assessing the degree to which individual CIsreliably transmit potentially available voice gender cues totheir wearers, and the dependence of behavioral performance
on the quality of this information.© 2009 Acoustical Society of America26�2�/762/14/$25.00
A. Availability of temporal cues to voice gender
Previous studies examining signals with amplitudemodulated envelopes, both in hearing subjects �Burns andViemeister, 1976, 1981� and CI users �McKay et al., 1995;McKay and McDermott, 2000�, show that the fundamentalfrequency of the input signal can be effectively encoded bytemporal modulations of the signal envelope. Within the sig-nal processor of each implant, input signals are processedinto frequency sub-bands by means of a set of bandpass fil-ters. Each sub-band is then assigned to the most relevantelectrode in such a way that tonotopic organization isroughly preserved. Sub-bands with high-frequency contentare delivered to the most basal electrodes, and sub-bandswith low-frequency information are delivered to electrodescloser to the cochlear apex. In order to minimize perceptionof the carrier frequency and to correctly represent envelopemodulations related to F0, the carrier frequency is usually atleast four times higher than the typical F0 value �McDermottand McKay, 1994�.
To find channels that are likely to represent F0 in theirenvelopes, the modulation spectrum �MS� of the stimulussounds was examined after being processed by the samefilter-bank settings used in each subject’s device. By compar-ing the acoustic MS �calculated from bandpass-filteredacoustic signals� with MSs obtained from electrodogramscaptured from a subject’s device, the electrode channel�s�that are theoretically able to deliver F0-related temporal cuesrelevant for gender identification in each subject could beidentified. These channels are said to have F0 modulationavailability, and were used to ascertain the relationship be-tween perceptual performance and the quality of available F0information for the different stimuli.
B. Availability of place cues to voice gender
Previous research with both CI devices and CI simula-tions delivered to NH subjects suggests that place cues forvoice gender identification are available to CI users �Fuet al., 2004, 2005; Gonzalez and Oliver, 2005�. Laneau andWouters �2004a� also demonstrated possible utilization ofplace cues for pitch discrimination in multi-electrode stimu-lation settings, with the average just-noticeable differencesfor place pitch ranging from 0.25 to 0.46 mm.
The present study assessed the availability of place cuesfor voice gender based on the relationship between stimu-lated electrode location and the vocal pitch or spectral enve-lope distribution of the speakers. Each stimulus produced aspecific spatial output profile of electrode stimulation, quan-tified here as the cumulative sum of pulses in each electrodeduring the 2 s of stimulation provided by each stimulus. Amedian central location for this electrode stimulation pattern,equivalent to the “center-of-mass” of the area below thecurve in the stimulation output profile, was calculated. Thecorrelation between median electrode values and either theacoustic F0 of speech items or the distribution of their spec-
1
tral envelope energy was then examined.J. Acoust. Soc. Am., Vol. 126, No. 2, August 2009 D. Kovačić and
C. Overall design of the experiments
Quantitative measures of temporal and place informa-tion that the implants provide about vocal stimuli were re-lated to variation in behavioral responses to these samestimuli using two different testing procedures. The first was afixed identification procedure with a one-interval, two-alternative forced choice �2AFC� task in which subjects in-dicated whether the speech sample was spoken by a male orfemale speaker. The second was an adaptive two-interval2AFC discrimination procedure in which the adaptive pa-rameter was the difference in the fundamental frequencies�F0� of male and female speech items �subjects responded byindicating which speech item was uttered by a femalespeaker�. These two procedures were employed in order toassess the potential role of long-term auditory representa-tions in CI users’ performance. Allowing direct, short-termcomparisons of two speech samples permitted additionalevaluation of the auditory abilities of subjects who were notable to distinguish voice gender in the fixed procedure. Theadaptive procedure also directly assessed how voice genderidentification abilities relate to the size of F0 differences. Thetwo procedures employed different speech items spoken bythe same set of 20 male and 20 female speakers. This numberof speakers was used to ensure that general processing strat-egies for the differences between male and female voiceswere being studied, rather than specific memorization strate-gies that could be used to discriminate among a small num-ber of voices.
II. METHODS
A. Subjects
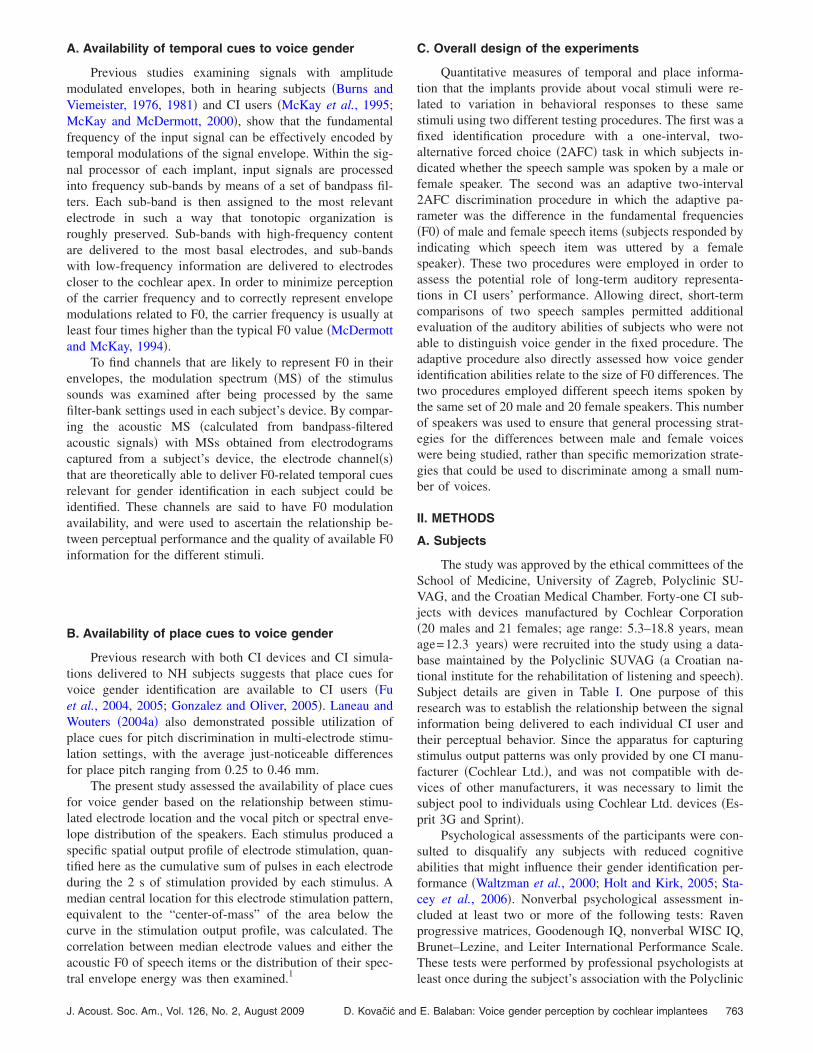
The study was approved by the ethical committees of theSchool of Medicine, University of Zagreb, Polyclinic SU-VAG, and the Croatian Medical Chamber. Forty-one CI sub-jects with devices manufactured by Cochlear Corporation�20 males and 21 females; age range: 5.3–18.8 years, meanage=12.3 years� were recruited into the study using a data-base maintained by the Polyclinic SUVAG �a Croatian na-tional institute for the rehabilitation of listening and speech�.Subject details are given in Table I. One purpose of thisresearch was to establish the relationship between the signalinformation being delivered to each individual CI user andtheir perceptual behavior. Since the apparatus for capturingstimulus output patterns was only provided by one CI manu-facturer �Cochlear Ltd.�, and was not compatible with de-vices of other manufacturers, it was necessary to limit thesubject pool to individuals using Cochlear Ltd. devices �Es-prit 3G and Sprint�.
Psychological assessments of the participants were con-sulted to disqualify any subjects with reduced cognitiveabilities that might influence their gender identification per-formance �Waltzman et al., 2000; Holt and Kirk, 2005; Sta-cey et al., 2006�. Nonverbal psychological assessment in-cluded at least two or more of the following tests: Ravenprogressive matrices, Goodenough IQ, nonverbal WISC IQ,Brunet–Lezine, and Leiter International Performance Scale.These tests were performed by professional psychologists at
least once during the subject’s association with the PolyclinicE. Balaban: Voice gender perception by cochlear implantees 763
SUVAG as a part of their hearing rehabilitation care. None ofthe subjects who participated in the present study had signifi-cant nonverbal psychological disorders. Spoken languageproficiency was compromised in some cases because of pre-vious auditory deprivation �Svirsky et al., 2000, 2004�. How-ever, no minimal requirements in language proficiency wereused as part of the selection criteria for the present study.Both the simplicity of the gender identification task �not re-quiring complex linguistic skills�, and the fact that everyparticipant in the study was able to provide their own expla-
TABLE I. Characteristics of the CI participant popelectrical signals.
SubjectAge at testing
�years; months� Sex EarProce
typ
CI01 5; 4 F R EspriCI02 10; 6 M R SprCI03 12; 1 M L EspriCI04 15; 8 F R EspriCI05 18; 9 M L EspriCI06 11; 4 M R SprCI07 12; 2 M R EspriCI08 6; 9 M L EspriCI09 9; 5 M R EspriCI10 11; 0 F L EspriCI11 11; 1 M R EspriCI12 14; 0 M R EspriCI13* 14; 7 F R EspriCI14 11; 3 M L EspriCI15 17; 6 F R EspriCI16 7; 9 M R EspriCI17 14; 5 F R EspriCI18 13; 1 F R EspriCI19* 14; 4 F R EspriCI20* 9; 7 F R EspriCI21 11; 0 M R SprCI22 18; 5 F L EspriCI23 9; 2 F R EspriCI24 14; 9 F R EspriCI25 8; 8 F R EspriCI26 17; 3 M R EspriCI27* 12; 9 F R EspriCI28* 8; 5 F L EspriCI29 11; 4 M R EspriCI30 8; 9 M R SprCI31 15; 7 M L EspriCI32 13; 11 F R EspriCI33 14; 0 F R EspriCI34 12; 11 F R EspriCI35* 14; 7 F R EspriCI36 10; 5 F R EspriCI37 15; 10 M R EspriCI38 10; 11 M R EspriCI39 9; 1 M R SprCI40 14; 4 M L EspriCI41 10; 0 F L Spr
Mean 12.3SD 3.2
nation of what they were supposed to do, suggest that varia-
764 J. Acoust. Soc. Am., Vol. 126, No. 2, August 2009 D. Kova
tions in spoken language proficiency did not create problemsfor subjects understanding the nature of the experimentaltasks.
Control participants were 15 hearing children �8 malesand 7 females, age range 6.7–10.6 years, mean age 9.3 years�recruited from one primary school in Zagreb. Neither theparticipants and their parents, nor their teachers reportedhearing problems. In each case, parents or caregivers signeda consent form before their children participated in thisstudy. The sex composition did not differ between the control
2
n. Asterisks �*� denote unsuccessful capture of CI
No. ofelectrodes
Stimulationrate per channel
�Hz�Sound coding
strategy
20 1200 ACE22 1200 ACE20 900 ACE20 900 ACE20 900 ACE21 1200 ACE20 900 ACE20 1200 ACE20 1200 ACE20 900 ACE20 900 ACE20 900 ACE20 250 SPEAK20 900 ACE20 900 ACE20 1200 ACE20 1200 ACE20 900 ACE18 500 ACE20 900 ACE19 1200 ACE20 900 ACE20 1200 ACE20 900 ACE19 1200 ACE20 900 ACE16 900 ACE19 1200 ACE20 1200 ACE22 1200 ACE20 1200 ACE20 900 ACE20 900 ACE20 900 ACE19 720 ACE20 1200 ACE20 900 ACE19 1200 ACE22 1200 ACE20 900 ACE22 900 ACE
ulatio
ssore
t 3Gintt 3Gt 3Gt 3Gintt 3Gt 3Gt 3Gt 3Gt 3Gt 3Gt 3Gt 3Gt 3Gt 3Gt 3Gt 3Gt 3Gt 3Gintt 3Gt 3Gt 3Gt 3Gt 3Gt 3Gt 3Gt 3Gintt 3Gt 3Gt 3Gt 3Gt 3Gt 3Gt 3Gt 3Gintt 3Gint
�C� and experimental �E� group �� =0.09, p�0.99�, but
čić and E. Balaban: Voice gender perception by cochlear implantees
the age composition differed �Mann–Whitney U-test,meanC�9.3, �SD�1.3� years, meanE�12.3, �SD�3.2� years,nC=15, nE=41, p�0.001�. The primary goal of the controlgroup was to check whether the stimuli were of abnormaldifficulty; due to the reduced hearing experience of CI sub-jects and their delays in language acquisition �Svirsky et al.,2000, 2004; Nicholas and Geers, 2007�, it is appropriate tocompare older CI subjects with younger hearing controls.
B. Stimuli
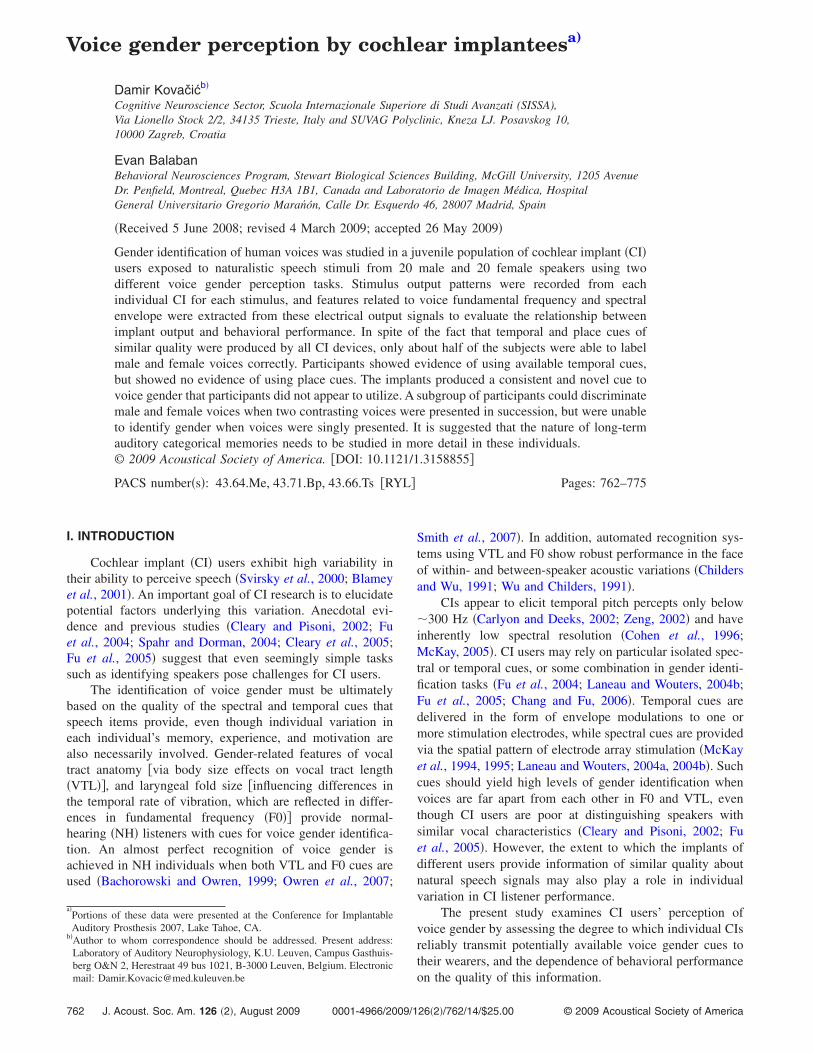
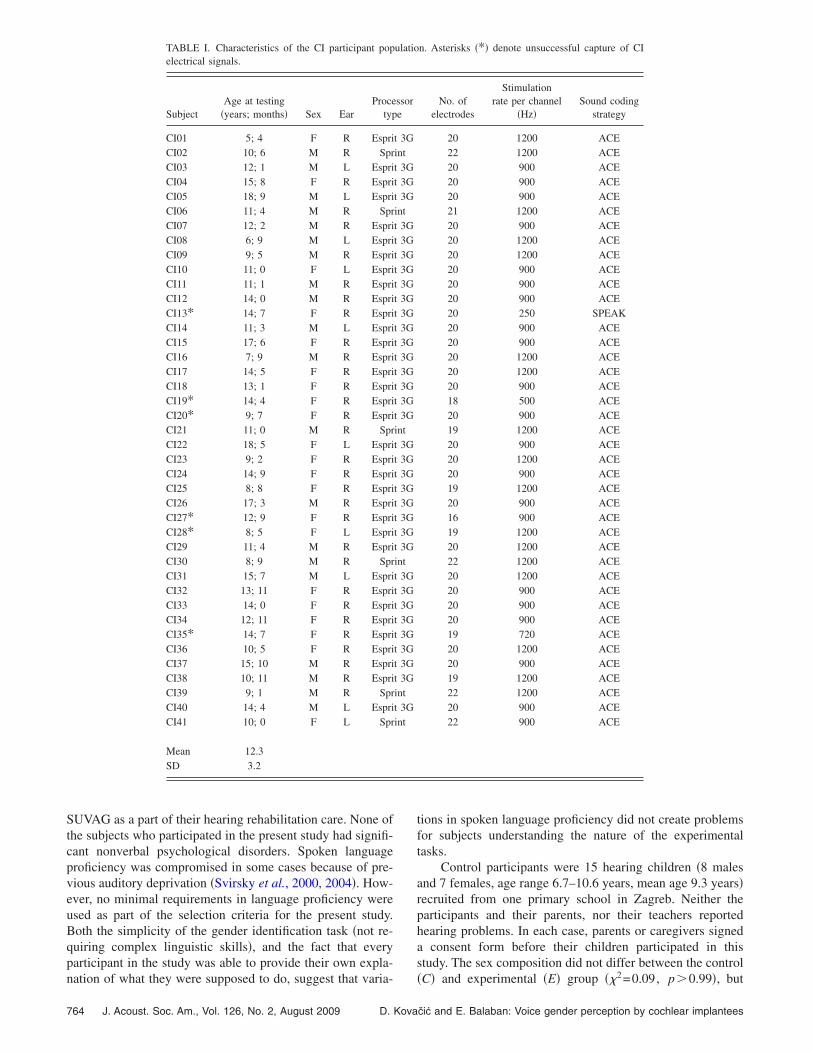
Speech samples in the form of short news-like storiesfrom 20 different male and 20 different female professionalradio announcers were obtained from the national broadcast-ing radio company Hrvatski radio in digitized format,sampled at 44100 Hz using a 16-bit coding scheme. Thesamples were cut into 40 speech items of 2-s length with thefollowing two requirements: �i� the onset was always alignedwith the word onset and �ii� the offsets were never withinphoneme boundaries. Since it was not possible to maintainthe exact length of 2000 ms for all speech items in this way,the PSOLA lengthening algorithm �Moulines and Laroche,1995� was used to equalize the length of all utterances. Thismanipulation was done using PRAAT software �Boersma andWeenink, 2006� with scaling factors between 0.84 and 1.25.At these scaling values, the PSOLA lengthening algorithmpreserves pitch contours. Fundamental frequencies of thespeakers were calculated using the autocorrelation method�Boersma, 1993� implemented in PRAAT software. The aver-age F0 values of the speech items are shown in Fig. 1. Natu-ral F0 variability occurs in this stimulus set both within theutterances of each speaker �pitch contours not shown� andbetween speakers. The male and female stimulus populationsdiffered in their average fundamental frequencies �averagefemale F0=183.3�5.4 Hz and average male F0=117.9�4.8 Hz, about 56% of one octave apart �Z=5.13,n=20, p�0.0001, Mann–Whitney U-test��. Natural variabil-ity in this sample yielded an overlapping area of F0 valuesbetween five female and four male voices, as indicated inFig. 1 by the horizontal band. This overlapping range was
FIG. 1. Fundamental frequency �F0� values for the 20 male and 20 femalespeakers used in this study. The mean female F0=183.3�5.4 Hz, and themean male F0=117.9�4.8 Hz. The shaded horizontal band denotes theregion of overlapping fundamental frequencies �between 137.9 and 163.3Hz�. With overlapping speakers excluded, the mean female F0=195.1�3.1 Hz and the mean male F0=110.1�3.3 Hz.
between 137.9 �minimal female F0� and 163.3 Hz �maximal
J. Acoust. Soc. Am., Vol. 126, No. 2, August 2009 D. Kovačić and
male F0�. With overlapping speakers removed, the mean fe-male F0 was 195.1�3.1 Hz and the mean male F0 was110.1�3.3 Hz.
C. Voice gender identification
Prior to the commencement of the experiment, each sub-ject was given instructions and performed practice trials untilthe experimenter was assured that the subject understood thetask. The practice and experimental trials used PRESENTA-
TION software �Version 10.1, Neurobehavioral Systems, Inc.,Albany, CA�. In each trial, one 2-s-long speech item waschosen randomly, and delivered to either headphones �hear-ing control subjects� or to the CI device �CI subjects� viadirect line input. The subject was requested to respond byclicking on one of two response buttons representing a maleand a female. The response buttons were associated with acomputer display showing sketches of typical male and fe-male faces. Feedback �a smiling face for correct responsesand the symbol “X” for incorrect responses� was given inorder to maintain the subject’s interest in the experiment. Theitems were not replayed, even for incorrect responses. Thefirst and second halves of the trials had response button po-sitions exchanged �in the first half, the female was associatedwith the left button�. Five sets of randomly chosen speechitems were created and their presentation was counterbal-anced between subjects. Practice consisted of six trials withtwo different female and male speech items from the samespeaker database that were not used in the experimental tri-als. Response buttons �indicating male or female voice� wereinterchanged after half of the practice trials. CI subjects typi-cally needed just one practice run before understanding thetask and starting the experimental phase. To make sure thatthe participant understood the task, they were instructed togive their own explanation of what they had to do to theexperimenter. Since the aim of this experiment was to assesseach participant’s ability to identify the gender of a voice,their performance did not have to reach a pre-defined crite-rion in order to progress to the experimental phase. Both thesimplicity of the task, and the visual reinforcement withsketched pictures of male and female faces during responseperiods allowed all subjects �including two 4-year-old hear-ing subjects in a pilot study� to perform the task reliablythroughout the practice trials and the experiment.
For the hearing control subjects, Sennheiser HD 580headphones were used, with monaural presentation of stimulito the right ear at 65 dB sound pressure level �SPL� �A-level�as measured by a RadioShack sound level meter �model 33-2055�. Except for this difference in the stimulus deliveryapparatus, the items and procedures were the same in bothhearing control and CI subjects. After completion of thefixed identification procedure, the subjects had a short break�10 min� and then resumed their participation by undergoinga second procedure, described below. When the second adap-tive procedure finished, the electrode stimulation patternsgenerated by all of the presented speech items were capturedusing processor control interface �PCI� and interface card�IF5� hardware �manufactured by Cochlear Ltd., Sydney,
Australia and provided by Cochlear AG, Basel, Switzerland�E. Balaban: Voice gender perception by cochlear implantees 765
and the RFSTAT software system �manufactured and providedby the Cooperative Research Centre for Cochlear Implantand Hearing Aid Innovation �CRC HEAR�, Melbourne, Aus-tralia�. CI signal capture was performed by recording twolong audio sequences played to the subject’s CI device withthe transmitting coil attached to the PCI+IF5 system �insteadof the subject’s implanted receiver coil�, keeping the samedevice settings used during the experiment. Each audio se-quence was 84.25 s long and contained all speech items pre-sented in the two procedures. Speech items were sequentiallyplaced one after the other in the audio sequence and wereseparated by 100 ms of silence. In order to synchronize thecapture signal onset with that of the audio signal, a 50-mswhite noise burst was placed at the beginning of each longsequence. The analysis of CI captured signals was performedusing custom software written in MATLAB �The Mathworks,Natick, MA�. While the signals were being captured, sub-jects were led to an adjoining room and asked to make draw-ings of familiar objects. Total time of the experiment wastypically about 30–40 min �fixed and adaptive procedurestypically lasting about 5–10 min each�.
D. Adaptive speech-based F0 discrimination of voicegender
An adaptive speech-based F0 discrimination procedurewas used to assess voice gender perception as a function ofvoice F0 differences using an up-down staircase method�Levitt, 1971�. Since several researchers have highlighted thesusceptibility of adaptive threshold estimates to variabilitycaused by attentional lapses or confusion at the beginning oftrials �Baker and Rosen, 2001; Amitay et al., 2006�, subjectswere first instructed how to respond in this task. They weretold that they were going to hear two speech excerpts, oneafter the other, in which one item was always male and theother was always female, with no possibility that both weremale or female. Their task was to listen to both speech itemsand choose by pressing the appropriate button on the key-board which one was female. The female/male distinctionwas reinforced through analogy with the child’s mother andfather, and, a practice test was administered with ten trials.The majority of CI subjects successfully completed the prac-tice test confirming that they understood the task; the otherswere all successful after repeating the practice test oncemore.
The stimuli were recordings of different utterances fromthe same speakers used in the identification procedure �noutterances were shared between procedures�. In each trial,one speech item selected from 20 speakers of one sex waspaired with another speech item selected from 20 speakers ofthe other sex. The position of the female voice in the stimu-lus pair was chosen at random. The stimulus set consisted of400 different stimulus pairs, each of which had a unique �F0between the female and male speech item. The largest sepa-ration of F0 in a stimulus pair was 142.8 Hz, and there wasa region with negative �F0 for stimulus pairs in which theF0 of the female voice was lower than the F0 of the malevoice �with the minimal value of �F0=−23.6 Hz�.
The initial �F0 was set to 109 Hz, and the adaptive step
was held constant at 10 Hz. The experiment stopped when766 J. Acoust. Soc. Am., Vol. 126, No. 2, August 2009 D. Kova
either 10 reversal points had been achieved or 50 total trialshad been run. In order to avoid possible pop-out memoryeffects of repeating stimulus pairs that were played recently,a minimal span of four trials was set between repeats of thesame stimulus pair. In accordance with the relative scarcityof stimulus pairs on both extreme ends of the distribution of�F0, �F0 could not be increased or decreased beyond theseedge points. To deal with cases in which subjects would be-come stuck at the edges, the adaptive procedure was modi-fied; if the �F0 entered the region consisting of the fivestimulus pairs with either the largest or the smallest F0 dif-ferences, then the adaptive procedure would randomlychoose one of the stimulus pairs in this range.
Performance in the adaptive discrimination procedurewas assessed with discrimination threshold estimates�DTEs�. These were obtained for each subject by averagingthe values of the last five reversal points of the adaptiveprocedure. Since the value of the adaptive parameter waslimited by natural variation in the population of speakers, thesubject might reach either a ceiling �indicating perfect per-formance� or floor level �indicating chance performance�. Inthese cases, DTEs cannot be estimated more precisely thanbeing smaller or larger than the edge boundaries. The lowerboundary in this procedure was �F0=−13.5 Hz, whereasthe upper boundary was �F0=133.1 Hz.
Hearing controls were run using the same stimuli andprocedures as implemented for the CI group, the only differ-ence being the presentation of the sounds through SennheiserHD 580 headphones �monaural presentation to the right earat 65 dB SPL�A��.
E. Capturing procedures of stimulus-inducedelectrode output patterns from CI devices
In order to make sure that the CIs received direct stimu-lation from the experimental computer, without being con-taminated by external background noise, a specially-constructed sound-insulated chamber was used �seeAppendix�. To maintain comparable loudness levels corre-sponding to 65 dB SPL�A� for all stimulus presentations toeach subject, a two-step procedure was followed. The levelof each stimulus was first calibrated by manual manipulationof signal levels in order to have a RadioShack model 332055sound level meter reading of 65 dB SPL�A� in free-field,approximately 105 cm from the midline of a Harman Kardon2.1 loudspeaker system. Then, using each subject’sclinically-assigned CI processor in isolation from the subject,the master volume level on the computer playback softwarewas adjusted by playing a standard 10-s multi-talker babblestimulus free-field via a Soundblaster Creative Audigy ZSsound card and Harman Kardon 2.1 loudspeaker system. Thesound level meter was located at the Esprit 3G or Sprintmicrophone approximately 120 cm from the midline of theloudspeaker, and was used to measure the intensity levelwhile adjusting the master/output level of the signal to pro-duce a sound pressure level of 65 dB SPL�A�. Once theproper setting was achieved, RF STATISTICS software wasused to capture the CI output while playing each stimulus
through the CI processor. Using the “Statistics” tab of thečić and E. Balaban: Voice gender perception by cochlear implantees
capture software, it was possible to determine the averagecurrent level over the duration of each stimulus. The averageof these current levels was taken, and the 10-s multi-talkerbabble stimulus was then played to the CI processor whilethe stimulus level was adjusted to produce an average currentlevel identical to that obtained for the experimental stimuli.The CI processor was then returned to the subject, and thisfinal setting was used to play the experimental stimuli tothem. The relationship between the clinical units measuredby the capturing system and actual physical �current� units �Iin �A� was determined by the following equation:
I = F � 10 � 175cl/255, �1�
where F is the calibration factor �equal to 1 for the devicesstudied here, Peter Seligman, Cochlear Ltd., personal com-munication� and cl is the value in clinical units �Drennan andPfingst, 2006�.
F. Analysis procedures for captured data
The 1 �s temporal resolution of the capturing apparatuswas changed to 20 �s �corresponding to a sampling fre-quency of 50 kHz� using time-scale conversion, in order todecrease the memory burden for computational analyses.Each channel in each subject’s device had minimum �thresh-old or T-level� and maximum �comfortable or C-level� cur-rent level values, which bracketed the device’s stimulationlevels, determined on the basis of the CI user’s loudnesspercepts for pure tones during clinical fitting. These werestandardized by conversion to percentage of dynamic range,using the formula
y =x − T
C − T, �2�
where y is a converted value in percent of dynamic range, xis the stimulation current in units of current levels, T is thethreshold level in units of current levels, and C is comfort-able level in units of current levels for the stimulated elec-trode. The capturing procedure was not successful in 6 out of41 subjects �denoted by asterisks in Table I�; captured datatherefore encompassed 35 subjects.
MSs were calculated via Fourier transformation of theautocorrelation of the stimulus output patterns �Singh andTheunissen, 2003�. Bandpass filtering based on filter-banksusing the same cut-off frequencies as in the electrodes in theCI device was first performed using the Nucleus MatlabToolbox, a part of the NIC© proprietary software �Cochlear,2002� generously provided by Cochlear AG. MSs were cal-culated by autocorrelating and then Fourier-transformingeach envelope. This analysis included the frequency rangebetween 75 and 225 Hz, which encompassed the F0 valuesof all stimuli �the upper bound of 225 Hz was one-quarter ofthe lowest stimulation rate �900 Hz�, preventing aliasing ef-fects in the data analysis�. The lower cut-off value of 75 Hzremoved the effects of low-frequency modulation due toacoustic variation at syllabic/phonemic levels.
To measure the overall availability of F0 modulationinformation for a particular stimulus sound in each subject,
the MSs of electrode outputs were summed over all channelsJ. Acoust. Soc. Am., Vol. 126, No. 2, August 2009 D. Kovačić and
that �1� were stimulated for at least 25% of the stimulusduration and �2� possessed distinct F0-related peaks in theiracoustic MSs �peaks less than 40 Hz �a typical just-noticeable difference �JND� for CI temporal pitch for F0 val-ues around 200 Hz �Zeng, 2002�� from the F0 value�. Toassess the availability of temporal cues for each stimulusitem in each subject, the following algorithm was followed:�1� Find all local peaks in the MS that have energy at 0.8 ormore of the maximum amplitude between 75 and 225 Hz and�2� find the closest peak to F0 with relatively greatest inten-sity. Using this procedure, each stimulus was assigned a CIMS F0-related peak value for each subject.
To assess the influence of the number of electrodes car-rying F0-related modulation cues and their relative strength,cue-carrying electrodes were sorted according to the relativestrength of their F0-related peaks �“modulation strength”�.The analysis used the mean modulation strengths of the fourstrongest electrodes, and was performed both across responsetypes �correct vs incorrect trials� and gender �male vs femalespeech items�.
Individual DTEs fell into two broad groupings ��56 and�89 Hz�, meaning that subjects with larger and smallerthresholds experienced a different number of trials and a dif-ferent range of frequency differences. To assess the perfor-mance of their CI devices in an unbiased fashion, two differ-ent stimulus sets were selected based on the performance ofsubjects who scored above chance in the identification pro-cedure. Stimulus set 1 �SS1� consisted of 15 stimulus pairschosen from trials that were correctly responded to by 2 ormore performing subjects and that were never incorrectlyresponded to by any of these subjects. Stimulus set 2 �SS2�contained 15 stimulus pairs chosen from trials responded toincorrectly by at least 2 performing subjects and that werenever correctly responded to. The F0 separation betweenspeech items in these trials was similar for the two sets andwas limited to the range between 10 and 60 Hz �meanSS1
=37.3�3.5 Hz, meanSS2=31.7�3.6, Mann–WhitneyU-test, Z=−0.975, nSS1=15, nSS2=15, p=0.33�.
Finally, the quality of F0 cues to voice gender was quan-tified using the MS peak closest to F0, and the centroid po-sition in the MS for each stimulus pair. Linear regressionswere calculated using the F0 difference between stimuli asthe independent variable, and the difference in CI MS peaksor MS-centroid positions as the dependent variable. The r2
value for each subject was used as an estimator of the qualityof information that each CI processor provided about eachtype of cue.
III. RESULTS
A. Voice gender identification
1. Behavioral data
Figure 2 shows mean voice gender identification resultsfor the CI participants. Scores between 13 and 26 correctresponses are consistent with chance performance based onthe binomial distribution. Overall, 18 of the CI participants�44% of the CI subjects� could correctly identify the sex ofthe speaker at better-than-chance performance levels �mean
value of 84.3�1.0% correct� from an isolated stimulus;E. Balaban: Voice gender perception by cochlear implantees 767

these subjects will subsequently be referred to as “perform-ing” �P� subjects. The other 23 �56% of the study CI popu-lation�, with a mean value of 54.4�2.0% correct, were un-able to identify the gender of isolated stimulus voices, andwill subsequently be referred to as “non-performing” �NP�subjects.2 All subjects in the control group performed withmaximal or near-maximal performance �mean 98.0�0.4%correct�, confirming that the stimulus set was not of abnor-mal difficulty. Further analysis did not reveal any differencesin CI subjects’ performance between male and female speechitems, independently of whether they could or could not cor-rectly label them.
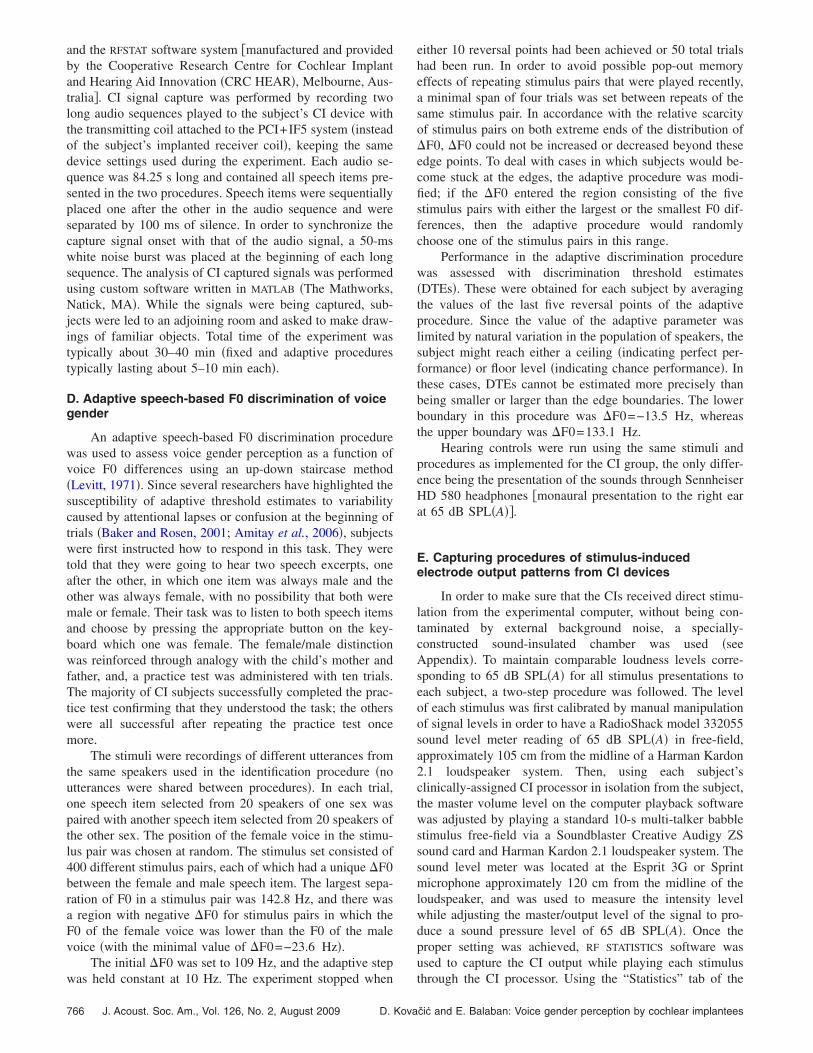
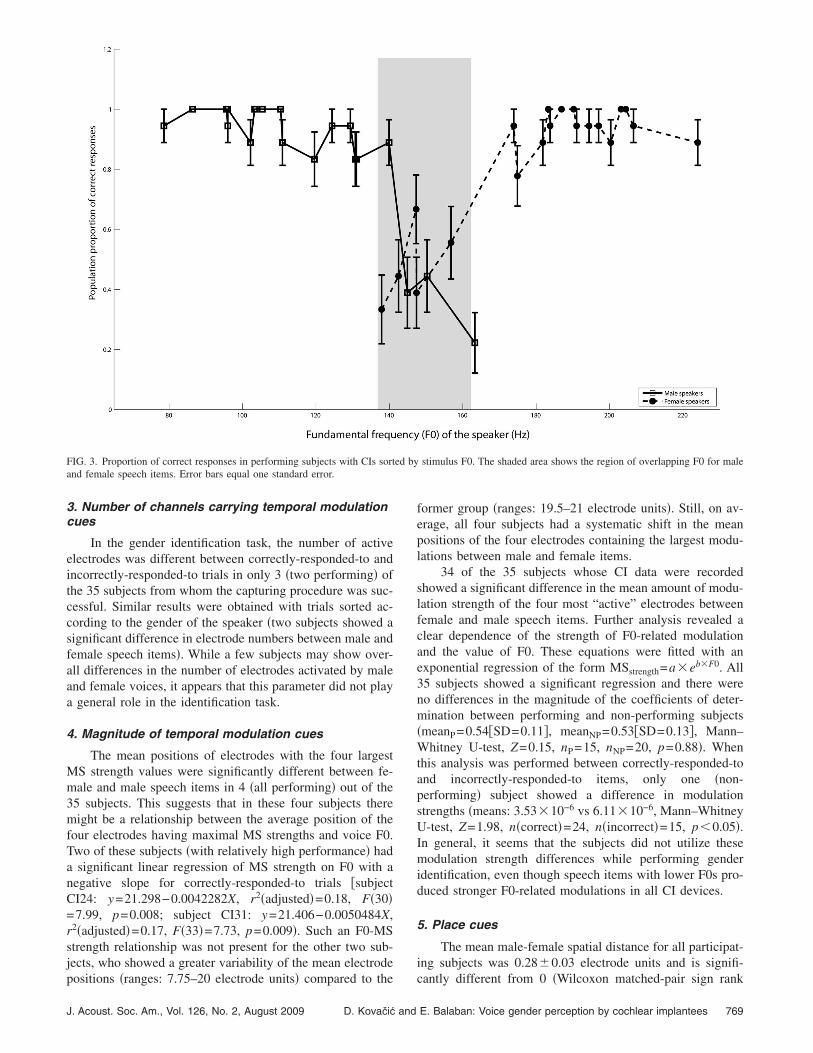
An analysis by items in subjects with above-chance per-formance is shown in Fig. 3. This reveals a V-shaped notchin the proportion of correct responses in relation to thespeaker’s F0, reflecting response uncertainty in the region ofgender-ambiguous F0 values.3
2. Temporal F0-related modulation cues
The correlations between F0-related peaks measured
FIG. 2. Proportion of correct responses of 41 subjects with CIs in the fixedidentification procedure. Dashed lines indicate the upper and lower bound-aries for chance performance set by the binomial distribution. Performing CIsubjects achieved a mean of 84.3�1.0% correct responses; non-performingCI subjects had a mean of 54.4�2.0% correct responses. The control groupof NH subjects performed with a mean accuracy of 98.0�0.4%.
from CI MSs and the corresponding F0 values measured
768 J. Acoust. Soc. Am., Vol. 126, No. 2, August 2009 D. Kova
from the stimulus waveforms were nominally significant inall 35 subjects that CI output signals were successfully cap-tured from �15 performing and 20 non-performing�, confirm-ing that all CI devices provided robust F0-related temporalcues. The devices of performing and non-performing sub-jects did not significantly differ in the magnitudes of thesecorrelations �meanP=0.84�SD=0.10�, meanNP=0.79�SD=0.14�, Mann–Whitney U-test, Z=0.98, nP=15, nNP=20, p=0.325�. However, over all subjects, the correlation coeffi-cients of correctly identified items were significantly higherthan those of incorrectly identified items �means: 0.83 �SD=0.15� vs 0.54 �SD=0.48�, Mann–Whitney U-test, Z=3.15,n=35, p=0.002�, indicating that the quality of temporal cuesprovided by the devices was significantly related to percep-tual performance.
The 15 performing subjects had a large difference incorrelation values between correct and incorrect items�means of 0.87 �SD=0.1� vs 0.21 �SD=0.56�, Mann–Whitney U-test, Z=3.73, n=15, p=0.0002�. In contrast,there was no difference in the magnitude of the correlationcoefficients between correct and incorrect items in the 20non-performing subjects �means of 0.80 �SD=0.17� vs 0.78�SD=0.18�, Mann–Whitney U-test, Z=0.72, n=20, p=0.47�.
To combine the data from both types of voices into asingle measure, an analysis of the distance of the F0-relatedpeak in the CI MSs from the F0 “gender boundary” �thehalf-way point between the mean position of the male andfemale F0-related peaks of all speech items� and behavioralperformance was carried out. All performing subjects had apositive correlation between these two measures, which wassignificantly different from 0 �Pearson correlation coeffi-cients ranged from 0.33 and 0.83, p�0.05 in all subjects;p-values were calculated using Fisher’s r-to-z transform�,suggesting that performance was related to how clear male orfemale temporal F0 cues were.
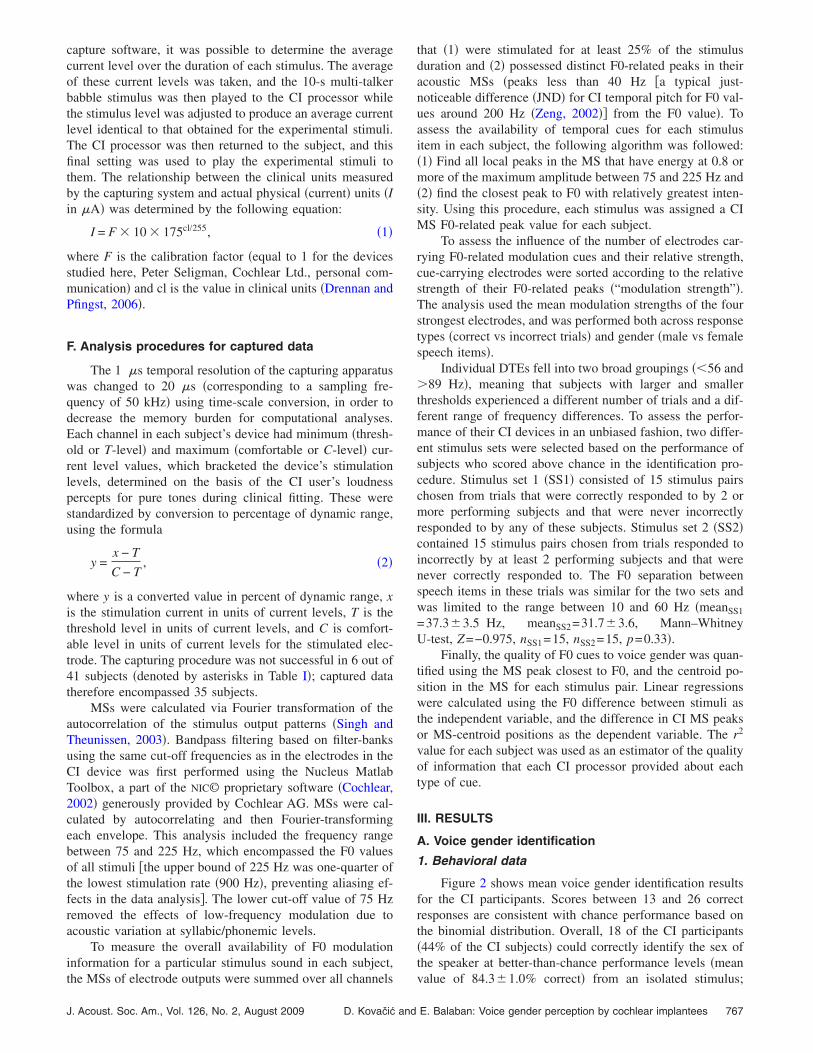
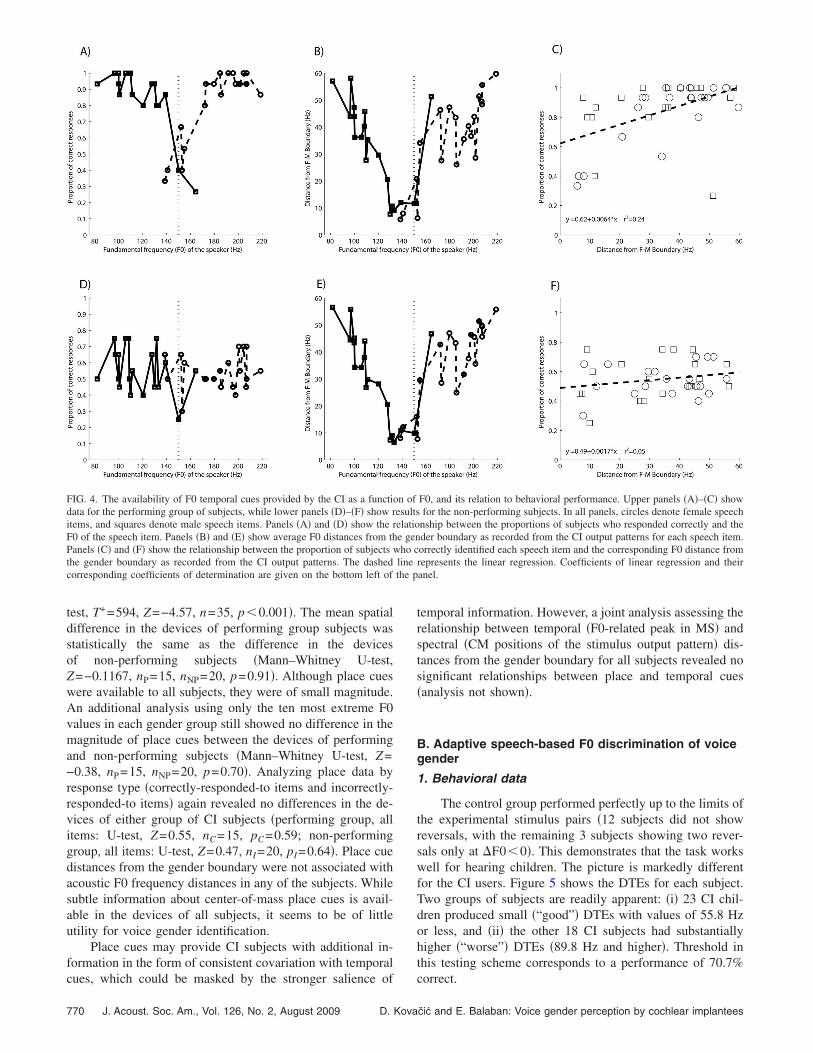
The acoustic and CI F0 distances of each item from thegender boundary were averaged across subjects, and pooledwithin performing and non-performing groups �Fig. 4�. TheF0 modulation information provided by the CI of the twogroups is very similar, exhibiting a V-shaped relationship be-tween acoustic and CI F0 distance from the gender boundary�this V-shape was previously observed in the analysis byitems of the behavioral data from the performing subjectsshown in Fig. 3�. A regression of the form y=B1+B2�xbetween CI F0 distance and the proportion of subjects whocorrectly responded to each item was calculated for eachsubject group �where y is the proportion of subjects whoresponded correctly and x is the frequency distance of theF0-related peak in the CI MS from the gender boundary�.The regression was significant and accounted for 24% of theobserved gender identification variation in the performing CIsubjects �r2=0.24, F�13�=11.691, p=0.002�, suggestingthat they may use additional cues. The regression wasnot significant for the non-performing subjects �r2
=0.05, F�18�=1.913, p=0.17�.
čić and E. Balaban: Voice gender perception by cochlear implantees
3. Number of channels carrying temporal modulationcues
In the gender identification task, the number of activeelectrodes was different between correctly-responded-to andincorrectly-responded-to trials in only 3 �two performing� ofthe 35 subjects from whom the capturing procedure was suc-cessful. Similar results were obtained with trials sorted ac-cording to the gender of the speaker �two subjects showed asignificant difference in electrode numbers between male andfemale speech items�. While a few subjects may show over-all differences in the number of electrodes activated by maleand female voices, it appears that this parameter did not playa general role in the identification task.
4. Magnitude of temporal modulation cues
The mean positions of electrodes with the four largestMS strength values were significantly different between fe-male and male speech items in 4 �all performing� out of the35 subjects. This suggests that in these four subjects theremight be a relationship between the average position of thefour electrodes having maximal MS strengths and voice F0.Two of these subjects �with relatively high performance� hada significant linear regression of MS strength on F0 with anegative slope for correctly-responded-to trials �subjectCI24: y=21.298−0.0042282X, r2�adjusted�=0.18, F�30�=7.99, p=0.008; subject CI31: y=21.406−0.0050484X,r2�adjusted�=0.17, F�33�=7.73, p=0.009�. Such an F0-MSstrength relationship was not present for the other two sub-jects, who showed a greater variability of the mean electrode
FIG. 3. Proportion of correct responses in performing subjects with CIs sortand female speech items. Error bars equal one standard error.
positions �ranges: 7.75–20 electrode units� compared to the
J. Acoust. Soc. Am., Vol. 126, No. 2, August 2009 D. Kovačić and
former group �ranges: 19.5–21 electrode units�. Still, on av-erage, all four subjects had a systematic shift in the meanpositions of the four electrodes containing the largest modu-lations between male and female items.
34 of the 35 subjects whose CI data were recordedshowed a significant difference in the mean amount of modu-lation strength of the four most “active” electrodes betweenfemale and male speech items. Further analysis revealed aclear dependence of the strength of F0-related modulationand the value of F0. These equations were fitted with anexponential regression of the form MSstrength=a�eb�F0. All35 subjects showed a significant regression and there wereno differences in the magnitude of the coefficients of deter-mination between performing and non-performing subjects�meanP=0.54�SD=0.11�, meanNP=0.53�SD=0.13�, Mann–Whitney U-test, Z=0.15, nP=15, nNP=20, p=0.88�. Whenthis analysis was performed between correctly-responded-toand incorrectly-responded-to items, only one �non-performing� subject showed a difference in modulationstrengths �means: 3.53�10−6 vs 6.11�10−6, Mann–WhitneyU-test, Z=1.98, n�correct�=24, n�incorrect�=15, p�0.05�.In general, it seems that the subjects did not utilize thesemodulation strength differences while performing genderidentification, even though speech items with lower F0s pro-duced stronger F0-related modulations in all CI devices.
5. Place cues
The mean male-female spatial distance for all participat-ing subjects was 0.28�0.03 electrode units and is signifi-
stimulus F0. The shaded area shows the region of overlapping F0 for male
ed bycantly different from 0 �Wilcoxon matched-pair sign rank
E. Balaban: Voice gender perception by cochlear implantees 769
test, T+=594, Z=−4.57, n=35, p�0.001�. The mean spatialdifference in the devices of performing group subjects wasstatistically the same as the difference in the devicesof non-performing subjects �Mann–Whitney U-test,Z=−0.1167, nP=15, nNP=20, p=0.91�. Although place cueswere available to all subjects, they were of small magnitude.An additional analysis using only the ten most extreme F0values in each gender group still showed no difference in themagnitude of place cues between the devices of performingand non-performing subjects �Mann–Whitney U-test, Z=−0.38, nP=15, nNP=20, p=0.70�. Analyzing place data byresponse type �correctly-responded-to items and incorrectly-responded-to items� again revealed no differences in the de-vices of either group of CI subjects �performing group, allitems: U-test, Z=0.55, nC=15, pC=0.59; non-performinggroup, all items: U-test, Z=0.47, nI=20, pI=0.64�. Place cuedistances from the gender boundary were not associated withacoustic F0 frequency distances in any of the subjects. Whilesubtle information about center-of-mass place cues is avail-able in the devices of all subjects, it seems to be of littleutility for voice gender identification.
Place cues may provide CI subjects with additional in-formation in the form of consistent covariation with temporal
FIG. 4. The availability of F0 temporal cues provided by the CI as a functiodata for the performing group of subjects, while lower panels �D�–�F� show ritems, and squares denote male speech items. Panels �A� and �D� show the rF0 of the speech item. Panels �B� and �E� show average F0 distances from thPanels �C� and �F� show the relationship between the proportion of subjects wthe gender boundary as recorded from the CI output patterns. The dashedcorresponding coefficients of determination are given on the bottom left of
cues, which could be masked by the stronger salience of
770 J. Acoust. Soc. Am., Vol. 126, No. 2, August 2009 D. Kova
temporal information. However, a joint analysis assessing therelationship between temporal �F0-related peak in MS� andspectral �CM positions of the stimulus output pattern� dis-tances from the gender boundary for all subjects revealed nosignificant relationships between place and temporal cues�analysis not shown�.
B. Adaptive speech-based F0 discrimination of voicegender
1. Behavioral data
The control group performed perfectly up to the limits ofthe experimental stimulus pairs �12 subjects did not showreversals, with the remaining 3 subjects showing two rever-sals only at �F0�0�. This demonstrates that the task workswell for hearing children. The picture is markedly differentfor the CI users. Figure 5 shows the DTEs for each subject.Two groups of subjects are readily apparent: �i� 23 CI chil-dren produced small �“good”� DTEs with values of 55.8 Hzor less, and �ii� the other 18 CI subjects had substantiallyhigher �“worse”� DTEs �89.8 Hz and higher�. Threshold inthis testing scheme corresponds to a performance of 70.7%
F0, and its relation to behavioral performance. Upper panels �A�–�C� showfor the non-performing subjects. In all panels, circles denote female speech
nship between the proportions of subjects who responded correctly and theder boundary as recorded from the CI output patterns for each speech item.orrectly identified each speech item and the corresponding F0 distance fromrepresents the linear regression. Coefficients of linear regression and theiranel.
n ofesultselatioe genho c
linethe p
correct.
čić and E. Balaban: Voice gender perception by cochlear implantees

2. Temporal cues
Performing and non-performing subjects4 had similar r2
values for both measures of F0 information in both stimulussets �Mann–Whitney U tests, stimulus set 1:r2�MS-centroid�=0.59�0.03 vs 0.54�0.04, Z=−1.20, nP
=19, nNP=14, p=0.23; r2�F0-peak�=0.58�0.04 vs0.54�0.07, Z=−0.22, nP=19, nNP=14, p=0.82; stimulus set2: r2�MS-centroid�=0.31�0.04 vs 0.35�0.04, Z=−0.49,nP=19, nNP=14, p=0.62; r2�F0-peak�=0.22�0.03 vs0.21�0.05, Z=−0.26, nP=19, nNP=14, p=0.8�. This empiri-cally confirms that the CI devices of performing and non-performing subjects provided similar F0 information.
Figure 6 shows differences between the stimulus sets inthe quality of the information transmitted by the CI. Itemsfrom stimulus set 1 provide significantly better temporal in-formation than items from stimulus set 2 in all subjects �Wil-coxon matched-pair sign rank test for F0-peak and MS-centroid information: T+=538, Z=−4.60, n=33, p�0.0001�.These differences exist in both performance groups for bothtemporal measures �Wilcoxon matched-pair sign rank test,F0-peak information; performing group, T+=189, Z=−3.78,n=19, p=0.0002; non-performing: T+=96, Z=−2.73, n=14,p=0.0063; MS-centroid information: performing group, T+
=186, Z=−3.66, n=19, p=0.0003; non-performing: T+=96,Z=−2.73, n=14, p=0.0063�.
Another way to look at the quality of temporal informa-tion provided by the CI is the degree of consistency between
FIG. 5. Scores in the adaptive speech-based F0 discrimination procedure:�A� adaptive DTEs for each CI subject; �B� box plot of the DTE for bothperformance groups. In-box horizontal lines are the median values. Plottingbar boundaries are between the 25%th and 75%th percentiles; error bars gobetween the 10%th and 90%th percentiles.
the CI MS spectra peaks and MS-centroid positions, as mea-
J. Acoust. Soc. Am., Vol. 126, No. 2, August 2009 D. Kovačić and
sured by their correlation. Over all subjects, the correlationcoefficient was nominally larger in stimulus set 1 comparedto stimulus set 2 �0.57 �n=33, p�0.001, Fisher r-to-z� vs0.39 �n=33, p=0.02, Fisher r-to-z��, but the difference in themagnitude of these two correlation coefficients was not sig-nificant �z=0.91, p=0.35�. Similar results were found whenthis analysis was repeated separately for each performancegroup �analysis not shown�.
In order to assess whether either of the temporal mea-sures provided better cues than the other, a comparison of ther2 values for items from stimulus set 1 was examined, butthis revealed no advantage over all subjects, or for the per-forming or non-performing groups. The same analysis forstimulus set 2 revealed that MS-centroids were representedwith a higher degree of fidelity compared to F0-peak infor-mation �Wilcoxon signed rank test, performing group:r2�MS-centroid�=0.31�0.04 vs r2�F0-peak�=0.22�0.03,T+=41, Z=−2.173, n=19, p=0.03; non-performing group:r2�MS-centroid�=0.35�0.04 vs r2�F0-peak�=0.21�0.05,T+=18, Z=−2.166, n=14, p=0.03; all subjects:r2�MS-centroid�=0.33�0.03 vs r2�F0-peak�=0.22�0.03,T+=112, Z=−3.011, n=33, p=0.003�. The fact that MS-centroid information is better-represented in stimulus itemsthat CI subjects discriminate more poorly suggests that CIusers may not be able to extract information from this cuevery effectively.
Adaptive discrimination performance could be limitedby the availability of relevant temporal information. How-ever, an examination of regressions between the r2 values ofMS-centroid and F0-peak temporal information and adaptiveDTEs yielded no significant relationships.
3. Place cues
The analysis of place cues in the form of the stimuluspair differences between center-of-mass position of thestimulus output patterns and the corresponding F0 revealedthat only two subjects had significant correlations forcorrectly-responded items �performing subject CI30, correla-tion coefficient=0.40, p=0.02, and n=34; non-performing
FIG. 6. Differences in r2 between stimulus sets for measures of temporalinformation provided by the CI device �F0-related peak, left; and MS-centroid, right�. In-box horizontal lines are the median values. Plotting barboundaries are between the 25%th and 75%th percentiles; error bars gobetween the 10%th and 90%th percentiles.
subject CI25, correlation coefficient=0.48, p=0.05, and n
E. Balaban: Voice gender perception by cochlear implantees 771
=17�. As in the identification task, temporal cues in the formof amplitude modulation of pulse trains appear to be a majorsource of useful information about speaker gender that CIdevices are transmitting.
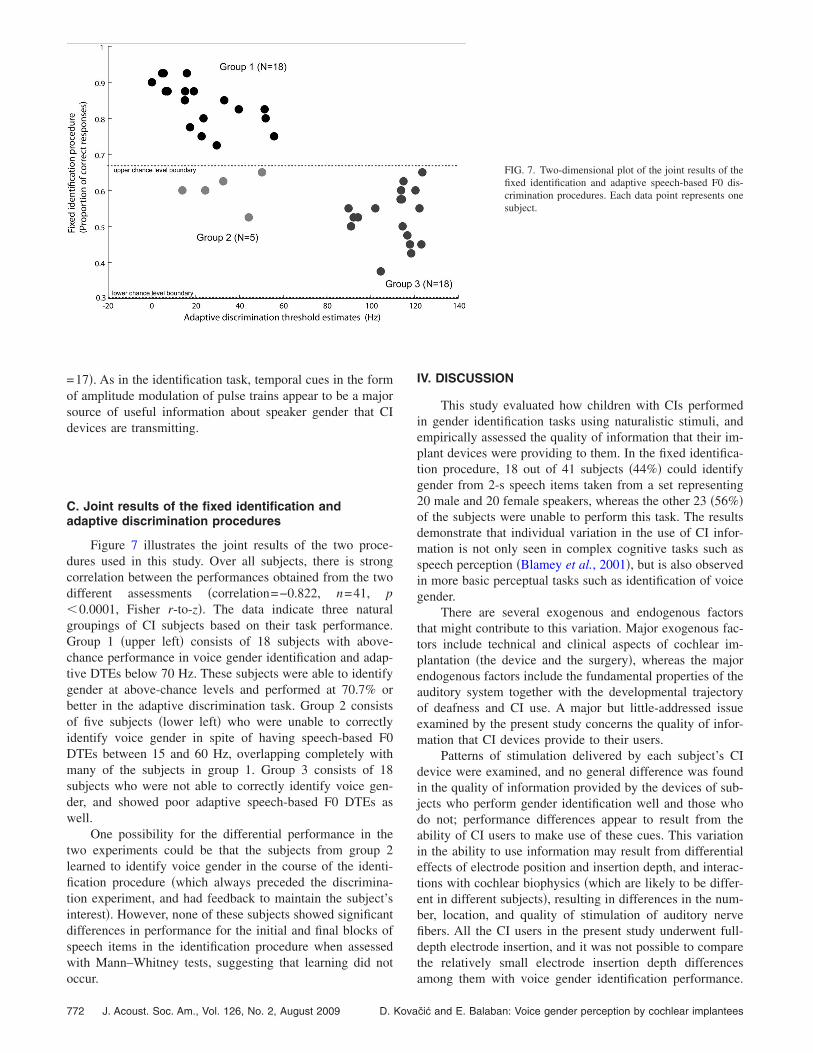
C. Joint results of the fixed identification andadaptive discrimination procedures
Figure 7 illustrates the joint results of the two proce-dures used in this study. Over all subjects, there is strongcorrelation between the performances obtained from the twodifferent assessments �correlation=−0.822, n=41, p�0.0001, Fisher r-to-z�. The data indicate three naturalgroupings of CI subjects based on their task performance.Group 1 �upper left� consists of 18 subjects with above-chance performance in voice gender identification and adap-tive DTEs below 70 Hz. These subjects were able to identifygender at above-chance levels and performed at 70.7% orbetter in the adaptive discrimination task. Group 2 consistsof five subjects �lower left� who were unable to correctlyidentify voice gender in spite of having speech-based F0DTEs between 15 and 60 Hz, overlapping completely withmany of the subjects in group 1. Group 3 consists of 18subjects who were not able to correctly identify voice gen-der, and showed poor adaptive speech-based F0 DTEs aswell.
One possibility for the differential performance in thetwo experiments could be that the subjects from group 2learned to identify voice gender in the course of the identi-fication procedure �which always preceded the discrimina-tion experiment, and had feedback to maintain the subject’sinterest�. However, none of these subjects showed significantdifferences in performance for the initial and final blocks ofspeech items in the identification procedure when assessedwith Mann–Whitney tests, suggesting that learning did not
occur.772 J. Acoust. Soc. Am., Vol. 126, No. 2, August 2009 D. Kova
IV. DISCUSSION
This study evaluated how children with CIs performedin gender identification tasks using naturalistic stimuli, andempirically assessed the quality of information that their im-plant devices were providing to them. In the fixed identifica-tion procedure, 18 out of 41 subjects �44%� could identifygender from 2-s speech items taken from a set representing20 male and 20 female speakers, whereas the other 23 �56%�of the subjects were unable to perform this task. The resultsdemonstrate that individual variation in the use of CI infor-mation is not only seen in complex cognitive tasks such asspeech perception �Blamey et al., 2001�, but is also observedin more basic perceptual tasks such as identification of voicegender.
There are several exogenous and endogenous factorsthat might contribute to this variation. Major exogenous fac-tors include technical and clinical aspects of cochlear im-plantation �the device and the surgery�, whereas the majorendogenous factors include the fundamental properties of theauditory system together with the developmental trajectoryof deafness and CI use. A major but little-addressed issueexamined by the present study concerns the quality of infor-mation that CI devices provide to their users.
Patterns of stimulation delivered by each subject’s CIdevice were examined, and no general difference was foundin the quality of information provided by the devices of sub-jects who perform gender identification well and those whodo not; performance differences appear to result from theability of CI users to make use of these cues. This variationin the ability to use information may result from differentialeffects of electrode position and insertion depth, and interac-tions with cochlear biophysics �which are likely to be differ-ent in different subjects�, resulting in differences in the num-ber, location, and quality of stimulation of auditory nervefibers. All the CI users in the present study underwent full-depth electrode insertion, and it was not possible to comparethe relatively small electrode insertion depth differences
FIG. 7. Two-dimensional plot of the joint results of thefixed identification and adaptive speech-based F0 dis-crimination procedures. Each data point represents onesubject.
among them with voice gender identification performance.
čić and E. Balaban: Voice gender perception by cochlear implantees
However, data were collected on exogenous variables suchas age of the CI surgery, age of the onset of deafness, dura-tion of CI use, and duration of deafness; an evaluation of therole of these variables will appear in a separate publication.
For the group of CI wearers who were proficient at gen-der identification, the quality of temporal information wassignificantly better for the items that they responded to cor-rectly when compared to incorrect items. Such a contrast wasnot found in the group of subjects who performed poorly ingender identification, suggesting that the performing groupof subjects could use the temporal information provided bytheir devices. Place cues were available but of small magni-tude, with no evidence for their use. A greater use of tempo-ral cues over spectral cues has also been suggested by pre-vious researchers. For example, Fu et al. �2004� comparedgender discrimination abilities using vowels, and found up to30% better performance when temporal cues were available.Fu et al. �2005� compared gender identification abilities withvowels spoken by talkers coming from two sets, with an F0separation between female and male speakers of 100 and 10Hz. CI users performed well with the first talker set �F0separation of 100 Hz�, but their performance decreasedsharply for the set of speakers with small F0 separation.
The issue remains whether the non-utilization of placeinformation in the experiments presented here is due to dif-ficulties in detection, or masking by the stronger presence oftemporal cues. A preference for temporal over place cues forfundamental frequency was confirmed by Laneau and Wout-ers �2004b�, who found an increase in just-noticeable differ-ences for F0 discrimination in four CI users from just above1 octave when place cues were presented alone, to 6%–60%of an octave when temporal information was added.
The fact that F0 information only accounts for approxi-mately one-quarter of the variation in voice gender identifi-cation �Fig. 4�C�� suggests the use of additional gender-related cues. One such cue was present in the form ofvariation in electrode modulation strength. All subjects’ de-vices exhibited a significant relationship between the modu-lation strength of the four most active electrodes and voiceF0, but subjects appeared insensitive to it. It is unclearwhether modulation strength cues are not useful becausethey are perceptually difficult to detect, because CI users areunable to interpret them, or because users are not payingattention to them; it is equally unclear whether CI userscould learn to make use of them. Further research with CIsubjects and NH subjects listening to CI simulations is nec-essary to better understand and exploit any perceptual rel-evance of electrode modulation strengths and their spatialpatterning for sound processing schemes.
The CI speech coding algorithm implemented in the de-vices studied here does not appear to provide equally goodtemporal representations of fundamental frequencies for allvoices. Stimulus pairs that were more problematic for genderidentification also had poorer temporal representations offundamental frequency. Since CI output patterns are the re-sult of a complex interplay between clinical parameter set-tings of the devices and spectro-temporal features of the in-
coming sounds, this suggests the need for a betterJ. Acoust. Soc. Am., Vol. 126, No. 2, August 2009 D. Kovačić and
optimization strategy for the speech coding algorithm in or-der to facilitate gender identification for a wider variety ofvoices.5
Finally, this study identified five CI users who could notidentify the gender of singly-presented voices but could doso at better-than-chance levels when two voices were se-quentially presented. This dissociation of abilities for voicegender identification and adaptive speech-based F0 discrimi-nation is striking, as these users had periods of CI experience�an average of 4.04�0.96 years of use� equivalent to the 18CI users who could successfully perform both tasks �an av-erage of 4.02�1.06 years of use�.
The two paradigms differ in terms of how subjects mightstrategically perform them. Auditory events appear to pro-duce a transient auditory sensory memory trace lasting up to10–20 s �Cowan, 1984; Semal and Demany, 1991; Krum-hansl and Iverson, 1992; Clement et al., 1999; Caclin et al.,2006�. In a single-interval gender identification task, gender-relevant acoustic information in a stimulus item must becompared with long-term memory representations of gender-related acoustic features. Two items presented one after theother within �5 s could be compared without reference tolong-term representations. Winkler et al. �2002� and Winklerand Cowan �2005� assessed ways in which short-term audi-tory �“surface”� information gets encoded into longer-termmemory, suggesting that the auditory context within whichthe sounds are to be remembered plays an important role.Perhaps some general types of auditory experiences at anearly age are necessary to set up relations between soundsand contexts that facilitate the formation of long-term cat-egorical auditory memories. This issue has important impli-cations for the ease with which CI users may be able to usedifferent kinds of auditory information, and needs to be ex-amined more rigorously in future research.
V. CONCLUSION
Forty-one juvenile cochlear implantees were exposed tonaturalistic speech samples from a variety of speakers, andasked to perform two voice gender perception tasks; thestimulus output patterns of their CIs were also documentedfor each speech sample. CI electrical output features relatedto voice fundamental frequency �F0� and spectral envelopewere evaluated in relation to behavioral performance. Tem-poral and place cues were equally available in all CI devices,but only about half of the subjects were able to label gendercorrectly. Subjects who could identify voice gender appearedto utilize temporal cues but showed no evidence of usingplace cues. At least one other robust F0-related cue waspresent in the output of all CI devices that participants ap-peared unable to make use of. A subgroup of participantscould discriminate voice gender when two contrasting voiceswere presented in succession, but were unable to identifygender when voices were singly presented, suggesting that itmay be fruitful to more carefully examine the characteristicsof long-term auditory category formation in CI user popula-
tions.E. Balaban: Voice gender perception by cochlear implantees 773
ACKNOWLEDGMENTS
This work was supported by the Croatian Ministry ofScience, Education and Sports Grant �Grant No. 207-0000000-2293�, the Central European Initiative Science andTechnology Network Research Fellowship to D.K., NSERCGrant No. 298612 and CFI Grant No. 9908 to E.B., andSISSA. The authors thank Ernst von Wallenberg and Co-chlear AG, Basel for providing hardware, Andrew Vandali�CRC HEAR, Melbourne� and Peter Seligman �CochlearLtd., Melbourne� for software and consultation, Davor Pet-rinović �Faculty of Electrical Engineering and Computing,Zagreb� and Vladimir Kozina �AKO Electrical Engineering,Zagreb� for technical support and the staff of SUVAG Poly-clinic for logistic support, and Colette McKay and twoanonymous reviewers for helpful comments.
APPENDIX: COCHLEAR IMPLANT MICROPHONEISOLATION
For subjects using Sprint processors, an Intra-Operativedirect cable �manufactured by Cochlear Ltd., Sydney, Aus-tralia and provided by Cochlear AG, Basel, Switzerland� thatshuts off the external microphone was used during these ex-periments. However, most of the subjects used an Esprit 3GCI processor �typically programed with the mixing mode en-abled�. Direct analog input to the processor via a cable con-nection would not normally switch off the external proces-sor’s microphone, resulting in the analog input being mixedwith environmental sounds. This was undesirable during thesound measurements and experimental stimulus presenta-tions, and it was equally undesirable to change any param-eter settings on a subject’s processor. Therefore, an acousticisolation chamber for the implant ear-piece was constructed.This consisted of a small thermos double-walled containerfilled with cement aggregated with small iron balls �1–2 mmin diameter� in order to obtain high density for reducingsound transmission. The Esprit 3G processor was placedwithin the insulated box, which was then sealed. A 30-cmlong coil cable was connected to the processor. The insulatedbox was suspended in the vicinity of and behind the subject’shead, making sure that it did not distract the subject or inter-fere with their comfort.
The attenuation of the insulated box was measured withan internal microphone �ECM 335-62M frequency range 20–20 000 Hz� and an external source of white noise �95 dBSPL �C-weighting, slow reading�� using three different fre-quency ranges: �1� octave-wide filtered white noise �60 dB/octave roll-off� centered at 1000 Hz �27 dB attenuation�, �2�octave-wide filtered white noise �60 dB/octave roll-off� cen-tered at 2000 Hz �25 dB attenuation�, and �3� stimulation bya loudspeaker with a frequency range 100–20 000 Hz �30 dBattenuation�. In addition, a generic CI device �Esprit 3G, 15active electrodes, frequency table 7, frequency range 120–8658 Hz, and stimulation rate: 900 Hz pps/channel� sealedinside the box required augmentation of the sound by 36 dBto produce similar average pulse output activity.
1The F0 values of the speech items used here range from 80 to 220 Hz; CI
maps typically have this entire frequency range assigned to the most apical774 J. Acoust. Soc. Am., Vol. 126, No. 2, August 2009 D. Kova
active electrode. How is it possible to use any F0 place cue informationwhen it all falls within one channel? F0 differences are also correlatedwith differences in the distribution of spectral envelopes between male andfemale speakers �Ives et al., 2005; Smith and Patterson, 2005; Smith et al.,2005, 2007�. In the course of auditory experience with the device, CI usersmight build up a representation of the population distribution of the center-of-mass of stimulation over the electrode array for male and femalevoices, which could allow them to discern stimulation patterns whosecenter-of-mass differs by fractions of an electrode position.
2If the male and female voices with an overlapping F0 are excluded fromthe analysis, the mean performance increased significantly to 94.1�2.0%in the performing group of CI subjects �Mann–Whitney U-test, n=18, Z=−4.02, and p�0.000 01�, but was unchanged in the non-performinggroup of CI subjects �mean performance 56.0�2.0%, Mann–WhitneyU-test, n=23, Z=−0.26, and p=0.79�.
3One male speech item was consistently ambiguous in the control group,and this item was excluded from all further analyses.
4CI output patterns captured from stimulus sets 1 and 2 were unusable intwo non-performing subjects because of equipment failure.
5Cleary and Pisoni �2002� found that CI users performed poorly in voiceidentification when the linguistic content of paired utterances differed.This does not necessarily conflict with the present findings. In Cleary andPisoni, 2002, the subjects performed a “same-different” task for identify-ing the speaker �using 3 different female voices� in the face of variation inthe content of utterances, in contrast to the voice gender identification taskusing 20 male and 20 female voices studied here. Short-term comparisonmay have facilitated the performance of the subjects in the present study,but not those in Cleary and Pisoni, 2002, because gender identification canbe successfully based on a few relatively static vocal cues �even with alarge number of voices�. In contrast, useful cues for speaker identificationinclude more dynamic voice features, and subjects need to use differentcombinations of static and dynamic features to tell the difference betweendifferent types of voices. Short-term comparisons would help with theformer kind of task, but may hinder overall performance in the latter kindof task.
Amitay, S., Irwin, A., Hawkey, D. J., Cowan, J. A., and Moore, D. R.�2006�. “A comparison of adaptive procedures for rapid and reliablethreshold assessment and training in naive listeners,” J. Acoust. Soc. Am.119, 1616–1625.
Bachorowski, J. A., and Owren, M. J. �1999�. “Acoustic correlates of talkersex and individual talker identity are present in a short vowel segmentproduced in running speech,” J. Acoust. Soc. Am. 106, 1054–1063.
Baker, R. J., and Rosen, S. �2001�. “Evaluation of maximum-likelihoodthreshold estimation with tone-in-noise masking,” Br. J. Audiol. 35, 43–52.
Blamey, P. J., Sarant, J. Z., Paatsch, L. E., Barry, J. G., Bow, C. P., Wales,R. J., Wright, M., Psarros, C., Rattigan, K., and Tooher, R. �2001�. “Re-lationships among speech perception, production, language, hearing loss,and age in children with impaired hearing,” J. Speech Lang. Hear. Res. 44,264–285.
Boersma, P. �1993�. “Accurate short-term analysis of the fundamental fre-quency and the harmonics-to-noise ratio of a sampled sound,” Proc. Inst.Phonetic Sci. 17, 97–110.
Boersma, P., and Weenink, D. �2006�. Praat: Doing Phonetics by Computer(Version 4.4.32) �Computer program�. Retrieved October 1, 2006 fromhttp://www.praat.org/.
Burns, E. M., and Viemeister, N. F. �1976�. “Non-spectral pitch,” J. Acoust.Soc. Am. 60, 863–869.
Burns, E. M., and Viemeister, N. F. �1981�. “Played-again SAM: Furtherobservations on the pitch of amplitude-modulated noise,” J. Acoust. Soc.Am. 70, 1655–1660.
Caclin, A., Brattico, E., Tervaniemi, M., Naatanen, R., Morlet, D., Giard, M.H., and McAdams, S. �2006�. “Separate neural processing of timbre di-mensions in auditory sensory memory,” J. Cogn. Neurosci. 18, 1959–1972.
Carlyon, R. P., and Deeks, J. M. �2002�. “Limitations on rate discrimina-tion,” J. Acoust. Soc. Am. 112, 1009–1025.
Chang, Y. P., and Fu, Q. J. �2006�. “Effects of talker variability on vowelrecognition in cochlear implants,” J. Speech Lang. Hear. Res. 49, 1331–1341.
Childers, D. G., and Wu, K. �1991�. “Gender recognition from speech. PartII: Fine analysis,” J. Acoust. Soc. Am. 90, 1841–1856.
Cleary, M., and Pisoni, D. B. �2002�. “Talker discrimination by prelingually
čić and E. Balaban: Voice gender perception by cochlear implantees

deaf children with cochlear implants: Preliminary results,” Ann. Otol. Rhi-nol. Laryngol. Suppl. 189, 113–118.
Cleary, M., Pisoni, D. B., and Kirk, K. I. �2005�. “Influence of voice simi-larity on talker discrimination in children with normal hearing and chil-dren with cochlear implants,” J. Speech Lang. Hear. Res. 48, 204–223.
Clement, S., Demany, L., and Semal, C. �1999�. “Memory for pitch versusmemory for loudness,” J. Acoust. Soc. Am. 106, 2805–2811.
Cochlear �2002�. “Nucleus implant communicator �NIC� system overview,”Cochlear Ltd.
Cohen, L. T., Busby, P. A., Whitford, L. A., and Clark, G. M. �1996�.“Cochlear implant place psychophysics 1. Pitch estimation with deeplyinserted electrodes,” Audiol. Neuro-Otol. 1, 265–277.
Cowan, N. �1984�. “On short and long auditory stores,” Psychol. Bull. 96,341–370.
Drennan, W. R., and Pfingst, B. E. �2006�. “Current-level discrimination inthe context of interleaved, multichannel stimulation in cochlear implants:Effects of number of stimulated electrodes, pulse rate, and electrode sepa-ration,” J. Assoc. Res. Otolaryngol. 7, 308–316.
Fu, Q. J., Chinchilla, S., and Galvin, J. J. �2004�. “The role of spectral andtemporal cues in voice gender discrimination by normal-hearing listenersand cochlear implant users,” J. Assoc. Res. Otolaryngol. 5, 253–260.
Fu, Q. J., Chinchilla, S., Nogaki, G., and Galvin, J. J. �2005�. “Voice genderidentification by cochlear implant users: The role of spectral and temporalresolution,” J. Acoust. Soc. Am. 118, 1711–1718.
Gonzalez, J., and Oliver, J. C. �2005�. “Gender and speaker identification asa function of the number of channels in spectrally reduced speech,” J.Acoust. Soc. Am. 118, 461–470.
Holt, R. F., and Kirk, K. I. �2005�. “Speech and language development incognitively delayed children with cochlear implants,” Ear Hear. 26, 132–148.
Ives, D. T., Smith, D. R. R., and Patterson, R. D. �2005�. “Discrimination ofspeaker size from syllable phrases,” J. Acoust. Soc. Am. 118, 3816–3822.
Krumhansl, C. L., and Iverson, P. �1992�. “Perceptual interactions betweenmusical pitch and timbre,” J. Exp. Psychol. Hum. Percept. Perform. 18,739–751.
Laneau, J., and Wouters, J. �2004a. “Multichannel place pitch sensitivity incochlear implant recipients,” J. Assoc. Res. Otolaryngol. 5, 285–294.
Laneau, J., and Wouters, J. �2004b�. “Relative contributions of temporal andplace pitch cues to fundamental frequency discrimination in cochlear im-plantees,” J. Acoust. Soc. Am. 116, 3606–3619.
Levitt, H. �1971�. “Transformed up-down methods in psychoacoustics,” J.Acoust. Soc. Am. 49, 467–477.
McDermott, H. J., and McKay, C. M. �1994�. “Pitch ranking with nonsimul-taneous dual-electrode electrical stimulation of the cochlea,” J. Acoust.Soc. Am. 96, 155–162.
McKay, C. M. �2005�. “Spectral processing in cochlear implants,” in Audi-tory Spectral Processing, edited by M. S. Malmierca and D. R. F. Irvine�Elsevier Academic, San Diego, CA�, pp. 473–509.
McKay, C. M., and McDermott, H. J. �2000�. “Place and temporal cues inpitch perception: Are they truly independent?,” ARLO 1, 25–30.
McKay, C. M., McDermott, H. J., and Clark, G. M. �1994�. “Pitch perceptsassociated with amplitude-modulated current pulse trains in cochlear im-plantees,” J. Acoust. Soc. Am. 96, 2664–2673.
McKay, C. M., McDermott, H. J., and Clark, G. M. �1995�. “Pitch matching
J. Acoust. Soc. Am., Vol. 126, No. 2, August 2009 D. Kovačić and
of amplitude-modulated current pulse trains by cochlear implantees: Theeffect of modulation depth,” J. Acoust. Soc. Am. 97, 1777–1785.
Moulines, E., and Laroche, J. �1995�. “Non-parametric techniques for pitch-scale and time-scale modification of speech,” Speech Commun. 16, 175–205.
Nicholas, J. G., and Geers, A. E. �2007�. “Will they catch up? The role ofage at cochlear implantation in the spoken language development of chil-dren with severe to profound hearing loss,” J. Speech Lang. Hear. Res. 50,1048–1062.
Owren, M. J., Berkowitz, M., and Bachorowski, J. A. �2007�. “Listenersjudge talker sex more efficiently from male than from female vowels,”Percept. Psychophys. 69, 930–941.
Semal, C., and Demany, L. �1991�. “Dissociation of pitch from timbre inauditory short-term memory,” J. Acoust. Soc. Am. 89, 2404–2410.
Singh, N. C., and Theunissen, F. E. �2003�. “Modulation spectra of naturalsounds and ethological theories of auditory processing,” J. Acoust. Soc.Am. 114, 3394–3411.
Smith, D. R. R., and Patterson, R. D. �2005�. “The interaction of glottal-pulse rate and vocal-tract length in judgments of speaker size, sex, andage,” J. Acoust. Soc. Am. 118, 3177–3186.
Smith, D. R. R., Patterson, R. D., Turner, R., Kawahara, H., and Irino, T.�2005�. “The processing and perception of size information in speechsounds,” J. Acoust. Soc. Am. 117, 305–318.
Smith, D. R. R., Walters, T. C., and Patterson, R. D. �2007�. “Discriminationof speaker sex and size when glottal-pulse rate and vocal-tract length arecontrolled,” J. Acoust. Soc. Am. 122, 3628–3639.
Spahr, A. J., and Dorman, M. F. �2004�. “Performance of subjects fit withthe Advanced Bionics CII and Nucleus 3G cochlear implant devices,”Arch. Otolaryngol. Head Neck Surg. 130, 624–628.
Stacey, P. C., Fortnum, H. A., Barton, G. R., and Summerfield, A. Q. �2006�.“Hearing-impaired children in the United Kingdom, I: Auditory perfor-mance, communication skills, educational achievements, quality of life,and cochlear implantation,” Ear Hear. 27, 161–186.
Svirsky, M. A., Robbins, A. M., Kirk, K. I., Pisoni, D. B., and Miyamoto, R.T. �2000�. “Language development in profoundly deaf children with co-chlear implants,” Psychol. Sci. 11, 153–158.
Svirsky, M. A., Teoh, S. W., and Neuburger, H. �2004�. “Development oflanguage and speech perception in congenitally, profoundly deaf childrenas a function of age at cochlear implantation,” Audiol. Neuro-Otol. 9,224–233.
Waltzman, S. B., Scalchunes, V., and Cohen, N. L. �2000�. “Performance ofmultiply handicapped children using cochlear implants,” Am. J. Otol. 21,329–335.
Winkler, I., and Cowan, N. �2005�. “From sensory to long-term memory—Evidence from auditory memory reactivation studies,” J. Exp. Psychol. 52,3–20.
Winkler, I., Korzyukov, O., Gumenyuk, V., Cowan, N., Linkenkaer-Hansen,K., Ilmoniemi, R. J., Alho, K., and Naatanen, R. �2002�. “Temporary andlonger term retention of acoustic information,” Psychophysiology 39,530–534.
Wu, K., and Childers, D. G. �1991�. “Gender recognition from speech. PartI: Coarse analysis,” J. Acoust. Soc. Am. 90, 1828–1840.
Zeng, F. G. �2002�. “Temporal pitch in electric hearing,” Hear. Res. 174,
101–106.E. Balaban: Voice gender perception by cochlear implantees 775