Embed Size (px)
Citation preview
Supplementary Information
Ultrafast Relaxation Dynamics of Phosphine-
Protected, Rod-Shaped Au20 Cluster: Interplay
Between Solvation and Surface Trapping
Meng Zhou,a Saran Long,a Xiankai Wan,b Yang Li,a Yingli Niu,a Qianjin Guo, a* Quan-Ming
Wangb* and Andong Xia a*
aThe State Key Laboratory of Molecular Reaction Dynamics, and Beijing National Laboratory
for Molecular Sciences (BNLMS), Institute of Chemistry, Chinese Academy of Sciences, Beijing-
100190, People’s Republic of China
bState Key Laboratory of Physical Chemistry of Solid Surfaces, Department of Chemistry,
College of Chemistry and Chemical Engineering, Xiamen University, Xiamen, Fujian 361005,
People’s Republic of China
Corresponding authors: [email protected]; [email protected]; and [email protected]
1
Electronic Supplementary Material (ESI) for Physical Chemistry Chemical Physics.This journal is © the Owner Societies 2014
Table of Contents
S1. The structure of the rod shaped Au20 cluster........................................................................3
S2. Details about the quantum chemical calculation..................................................................4
S3. Quantum chemical calculation results...................................................................................5
S4. Transient absorption spectra fitted by multi Gaussian peaks.............................................7
S5. Oscillatory features .................................................................................................................9
2
S1. The structure of the rod shaped Au20 cluster
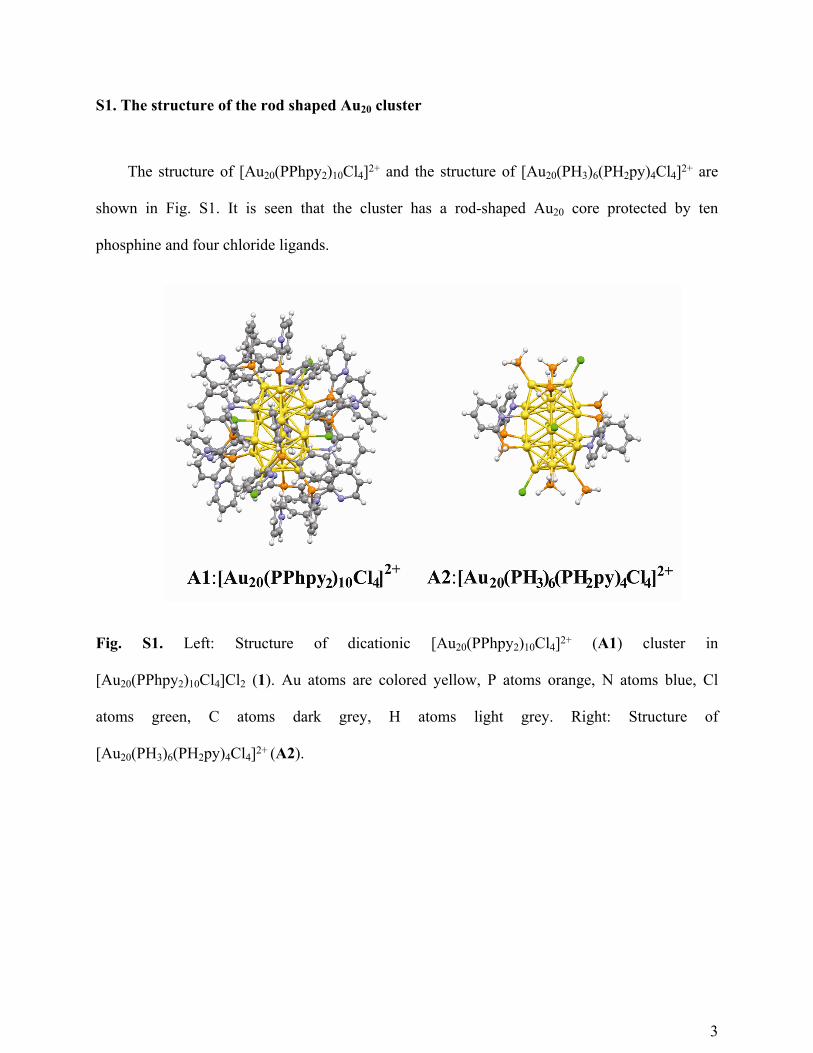
The structure of [Au20(PPhpy2)10Cl4]2+ and the structure of [Au20(PH3)6(PH2py)4Cl4]2+ are
shown in Fig. S1. It is seen that the cluster has a rod-shaped Au20 core protected by ten
phosphine and four chloride ligands.
Fig. S1. Left: Structure of dicationic [Au20(PPhpy2)10Cl4]2+ (A1) cluster in
[Au20(PPhpy2)10Cl4]Cl2 (1). Au atoms are colored yellow, P atoms orange, N atoms blue, Cl
atoms green, C atoms dark grey, H atoms light grey. Right: Structure of
[Au20(PH3)6(PH2py)4Cl4]2+ (A2).
3
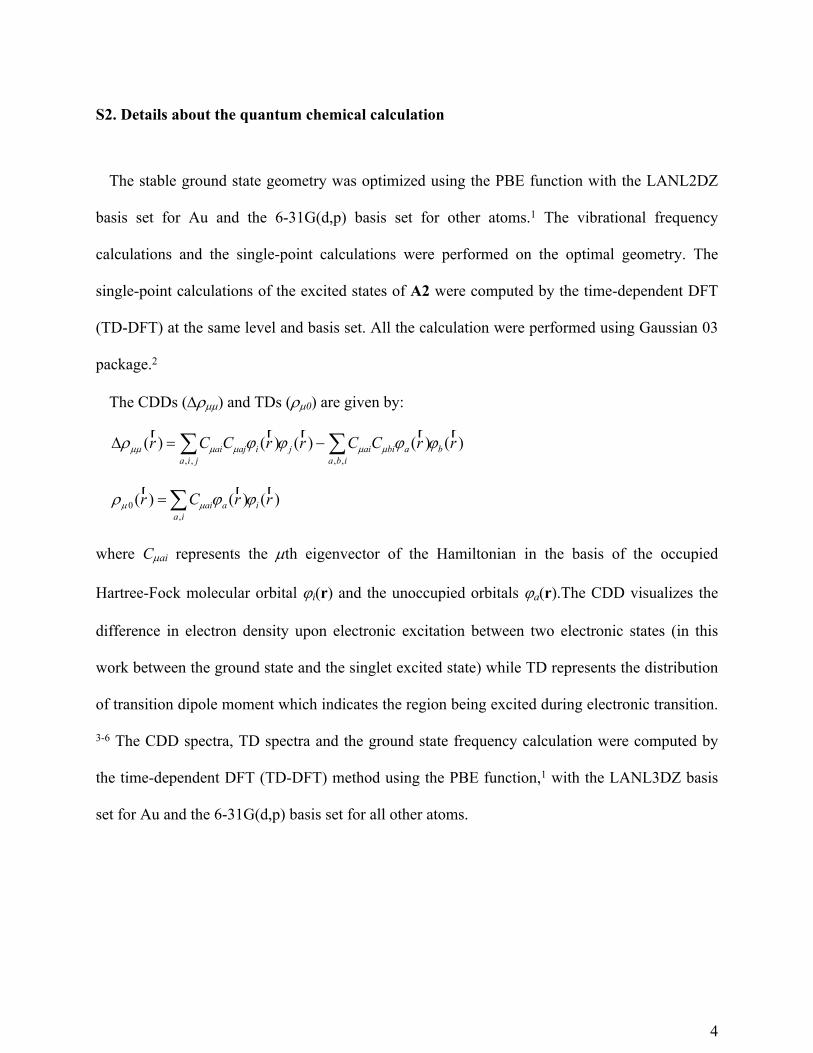
S2. Details about the quantum chemical calculation
The stable ground state geometry was optimized using the PBE function with the LANL2DZ
basis set for Au and the 6-31G(d,p) basis set for other atoms.1 The vibrational frequency
calculations and the single-point calculations were performed on the optimal geometry. The
single-point calculations of the excited states of A2 were computed by the time-dependent DFT
(TD-DFT) at the same level and basis set. All the calculation were performed using Gaussian 03
package.2
The CDDs () and TDs (0) are given by:
)()()()()(,,,,
rrCCrrCCr biba
abiaijjia
iajairrrrr
)()()(,
0 rrCr iia
aairrr
where Cai represents the th eigenvector of the Hamiltonian in the basis of the occupied
Hartree-Fock molecular orbital i(r) and the unoccupied orbitals a(r).The CDD visualizes the
difference in electron density upon electronic excitation between two electronic states (in this
work between the ground state and the singlet excited state) while TD represents the distribution
of transition dipole moment which indicates the region being excited during electronic transition.
3-6 The CDD spectra, TD spectra and the ground state frequency calculation were computed by
the time-dependent DFT (TD-DFT) method using the PBE function,1 with the LANL3DZ basis
set for Au and the 6-31G(d,p) basis set for all other atoms.
4
S3. Quantum chemical calculation results
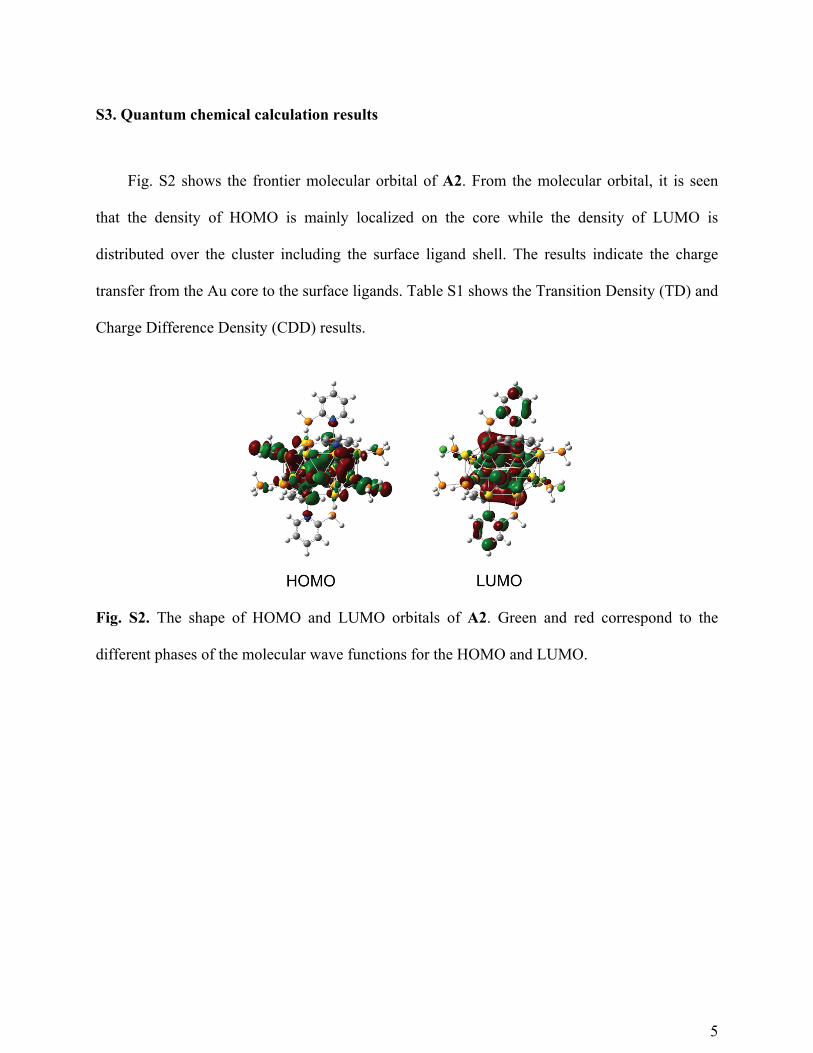
Fig. S2 shows the frontier molecular orbital of A2. From the molecular orbital, it is seen
that the density of HOMO is mainly localized on the core while the density of LUMO is
distributed over the cluster including the surface ligand shell. The results indicate the charge
transfer from the Au core to the surface ligands. Table S1 shows the Transition Density (TD) and
Charge Difference Density (CDD) results.
Fig. S2. The shape of HOMO and LUMO orbitals of A2. Green and red correspond to the
different phases of the molecular wave functions for the HOMO and LUMO.
5
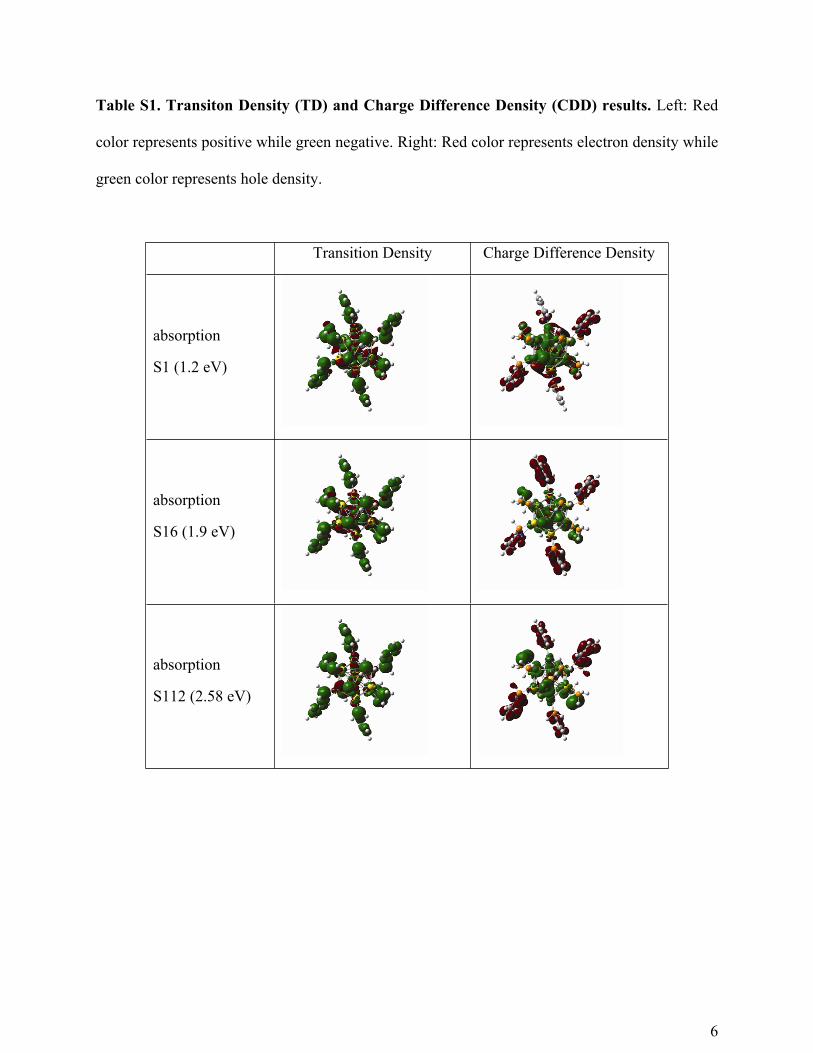
Table S1. Transiton Density (TD) and Charge Difference Density (CDD) results. Left: Red
color represents positive while green negative. Right: Red color represents electron density while
green color represents hole density.
6
Transition Density Charge Difference Density
absorption
S1 (1.2 eV)
absorption
S16 (1.9 eV)
absorption
S112 (2.58 eV)
S4. Transient absorption spectra fitted by multi Gaussian peaks
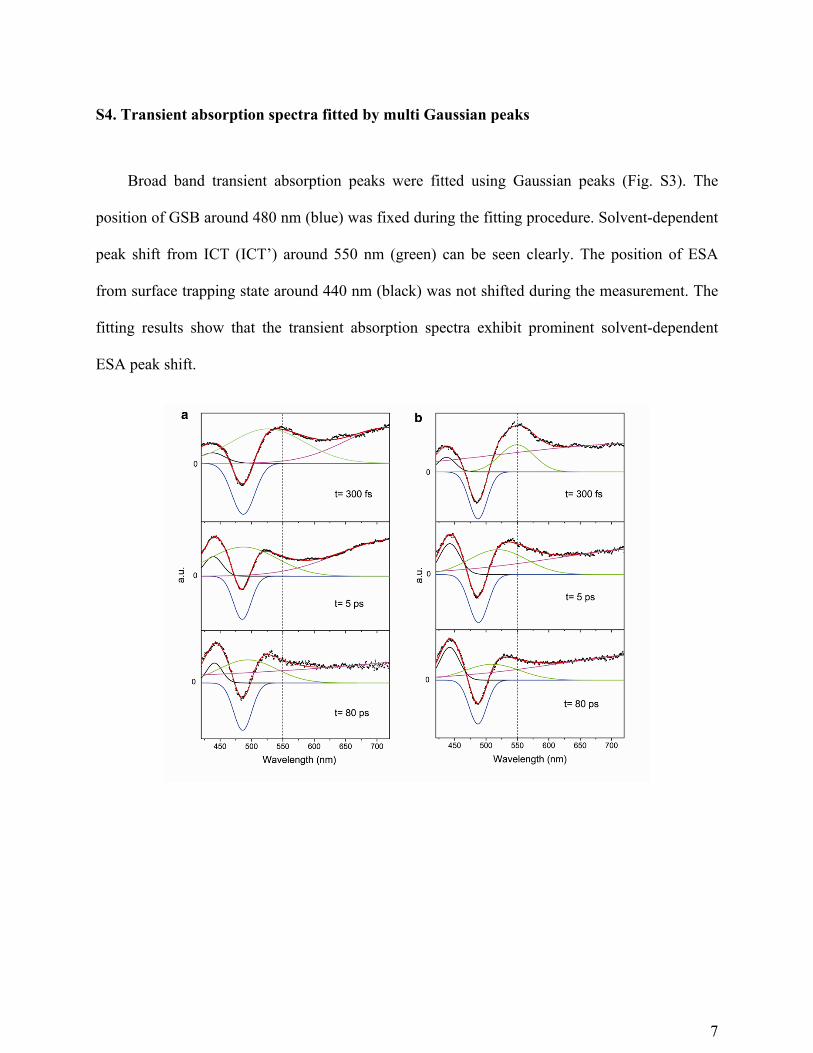
Broad band transient absorption peaks were fitted using Gaussian peaks (Fig. S3). The
position of GSB around 480 nm (blue) was fixed during the fitting procedure. Solvent-dependent
peak shift from ICT (ICT’) around 550 nm (green) can be seen clearly. The position of ESA
from surface trapping state around 440 nm (black) was not shifted during the measurement. The
fitting results show that the transient absorption spectra exhibit prominent solvent-dependent
ESA peak shift.
7
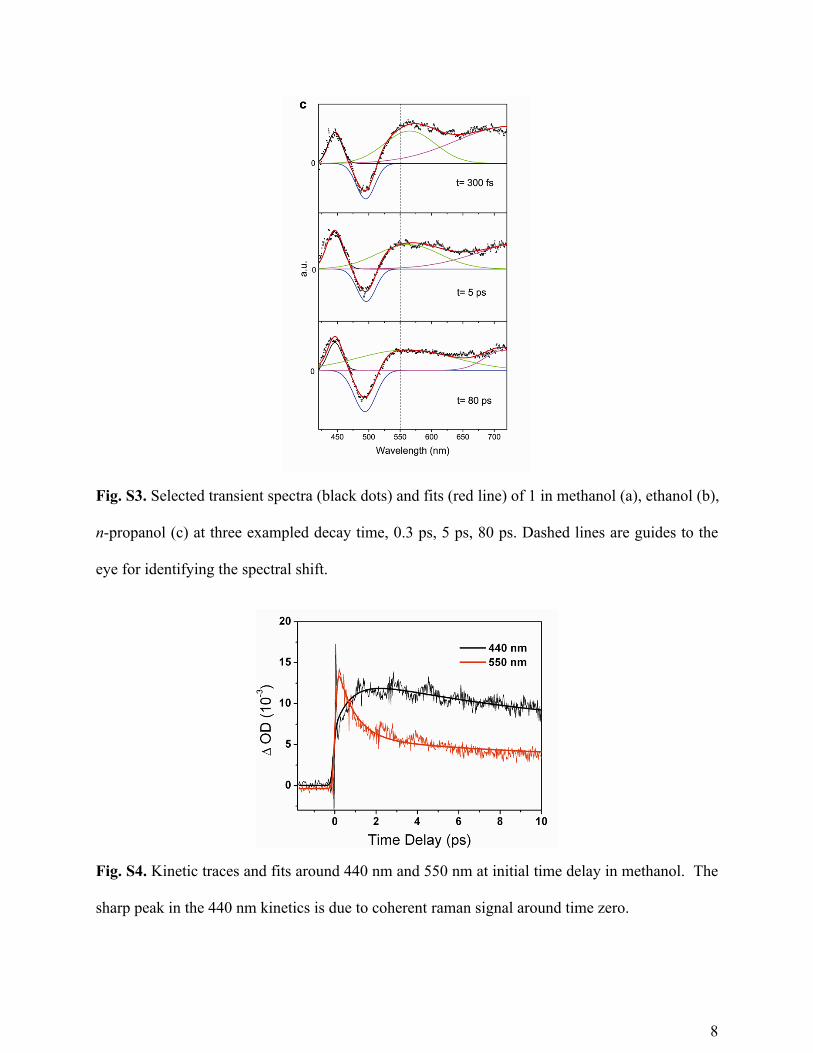
Fig. S3. Selected transient spectra (black dots) and fits (red line) of 1 in methanol (a), ethanol (b),
n-propanol (c) at three exampled decay time, 0.3 ps, 5 ps, 80 ps. Dashed lines are guides to the
eye for identifying the spectral shift.
Fig. S4. Kinetic traces and fits around 440 nm and 550 nm at initial time delay in methanol. The
sharp peak in the 440 nm kinetics is due to coherent raman signal around time zero.
8
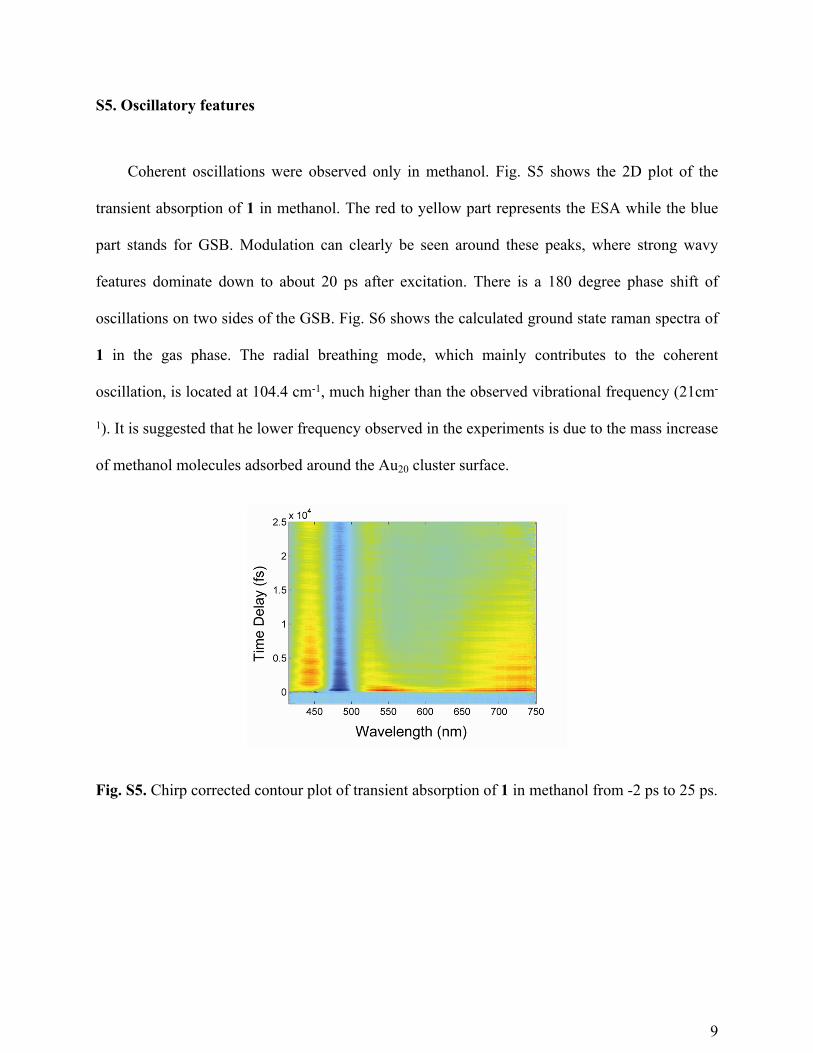
S5. Oscillatory features
Coherent oscillations were observed only in methanol. Fig. S5 shows the 2D plot of the
transient absorption of 1 in methanol. The red to yellow part represents the ESA while the blue
part stands for GSB. Modulation can clearly be seen around these peaks, where strong wavy
features dominate down to about 20 ps after excitation. There is a 180 degree phase shift of
oscillations on two sides of the GSB. Fig. S6 shows the calculated ground state raman spectra of
1 in the gas phase. The radial breathing mode, which mainly contributes to the coherent
oscillation, is located at 104.4 cm-1, much higher than the observed vibrational frequency (21cm-
1). It is suggested that he lower frequency observed in the experiments is due to the mass increase
of methanol molecules adsorbed around the Au20 cluster surface.
Fig. S5. Chirp corrected contour plot of transient absorption of 1 in methanol from -2 ps to 25 ps.
9
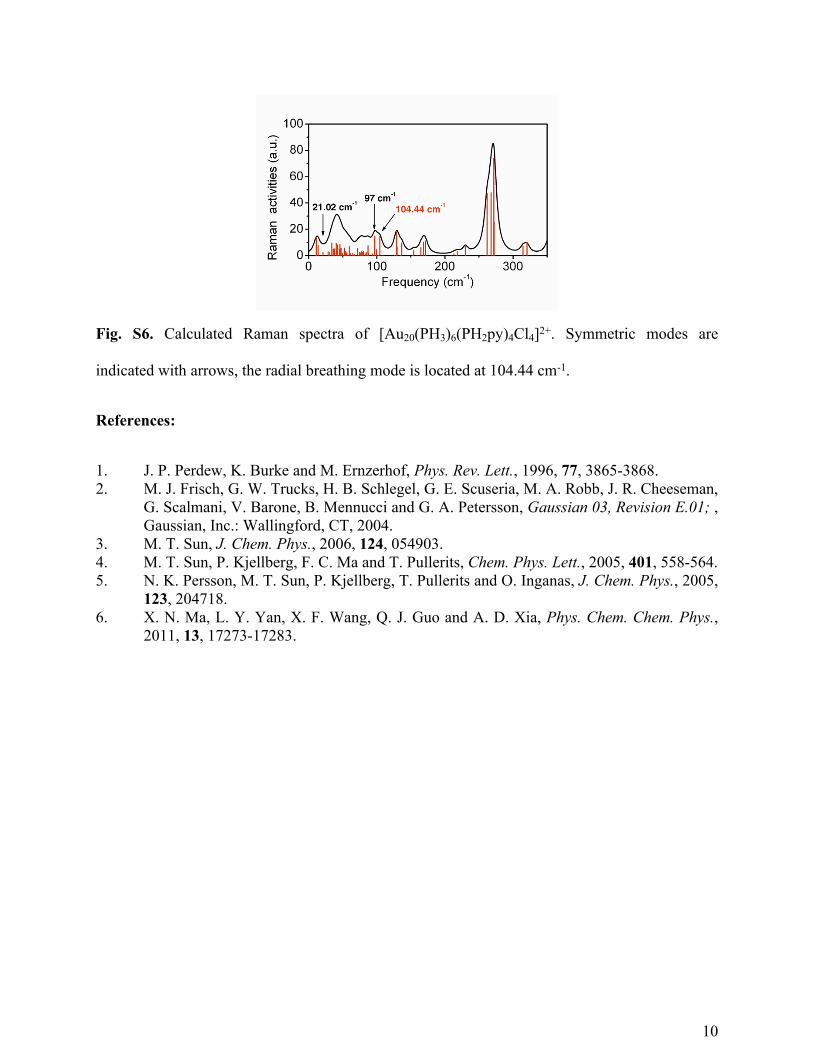
Fig. S6. Calculated Raman spectra of [Au20(PH3)6(PH2py)4Cl4]2+. Symmetric modes are
indicated with arrows, the radial breathing mode is located at 104.44 cm-1.
References:
1. J. P. Perdew, K. Burke and M. Ernzerhof, Phys. Rev. Lett., 1996, 77, 3865-3868.2. M. J. Frisch, G. W. Trucks, H. B. Schlegel, G. E. Scuseria, M. A. Robb, J. R. Cheeseman,
G. Scalmani, V. Barone, B. Mennucci and G. A. Petersson, Gaussian 03, Revision E.01; , Gaussian, Inc.: Wallingford, CT, 2004.
3. M. T. Sun, J. Chem. Phys., 2006, 124, 054903.4. M. T. Sun, P. Kjellberg, F. C. Ma and T. Pullerits, Chem. Phys. Lett., 2005, 401, 558-564.5. N. K. Persson, M. T. Sun, P. Kjellberg, T. Pullerits and O. Inganas, J. Chem. Phys., 2005,
123, 204718.6. X. N. Ma, L. Y. Yan, X. F. Wang, Q. J. Guo and A. D. Xia, Phys. Chem. Chem. Phys.,
2011, 13, 17273-17283.
10