Embed Size (px)
Citation preview

Stakeholders’ Education | Corporate Governance Research | Corporate Governance Score | Proxy Advisory
STAKEHOLDERS EMPOWERMENT SERVICES
1 | P A G E
SECTOR: CAPITAL GOODS NON-ELECTRICAL EQUIPMENT REPORTING DATE: 31ST MAY, 2016
VKS Projects Ltd. www.vksprojects.com
VKS Projects Ltd 31st May, 2016 TABLE 1 - MARKET DATA (STANDALONE) (As on 30th May, 2016)
NSE Code - VKSPL NSE Market Price (₹) 0.05 NSE Market Cap. (₹ Cr.) 5.67
Sector - Capital Goods-Non
Electrical Equipment
Face Value (₹) 1.00 Equity (₹ Cr.) 63.00
-Electrical Equipment 52-week High/Low (₹) 0.25/0.05 Net worth (₹ Cr.) 69.72
Business Group - Indian
Private
TTM P/E N.A. Traded Volume (Shares) 3,114
Year of Incorporation - 1998 TTM P/BV 0.00 Traded Volume (lacs) 0.00
Source - Capitaline
Corporate Office: COMPANY BACKGROUND
507 B Wing Sai Sangam, VKS Projects Limited operates as an engineering, procurement, and construction company in
India. The company undertakes EPC contracts of S/SS/alloy steel turnkey piping, civil land
development, industrial/commercial infra projects, structural fabrication and erection of
equipment, firefighting projects, commissioning of chemical plants, structural construction,
tankages, cross country pipelines for oil and gas, mechanical shut down jobs, erection and
alignment of static and rotary equipment, and pharma-turnkey projects, as well as effluent,
water, and sewage treatment plants. VKS Projects Limited was incorporated in 1998 and is
based in Navi Mumbai, India.
Sector 15 CBD Belapur (E),
Navi Mumbai - 400614,
Maharashtra
Company Website:
www.vksprojects.com
TABLE 2 - PRICE PERFORMANCE
30th May,
2016
29th May,
2015
30th May,
2014
% Change CAGR for 2
years 2016 vs 2015 2015 vs 2014
Price (₹) 0.05 0.15 0.50 -66.67% -70.00% -68.38%
Trading Volume (Shares)
(yearly avg.) 4,68,372 33,83,178 4,70,829 -86.16% 618.56% -
NSE Market Cap. (in ₹ Cr.) 3.15 9.45 31.50 -66.67% -70.00% -68.38%
Source - Money Control, price figures are adjusted to corporate action of stock split/bonus issue/stock merger
The Company in the month of February, 2013 has sub-divided Equity Shares of ₹ 10/- each into 10 (ten) Equity shares of ₹ 1/-
each. Further, the Company has allotted 45,00,00,000 Equity Shares by way of Bonus issue to the shareholders in May, 2013 in
the ratio of 5:2 (i.e. 5 new Equity Shares issued for every 2 Equity Share held).
Stakeholders’ Education | Corporate Governance Research | Corporate Governance Score | Proxy Advisory
STAKEHOLDERS EMPOWERMENT SERVICES
2 | P A G E
SECTOR: CAPITAL GOODS NON-ELECTRICAL EQUIPMENT REPORTING DATE: 31ST MAY, 2016
VKS Projects Ltd. www.vksprojects.com
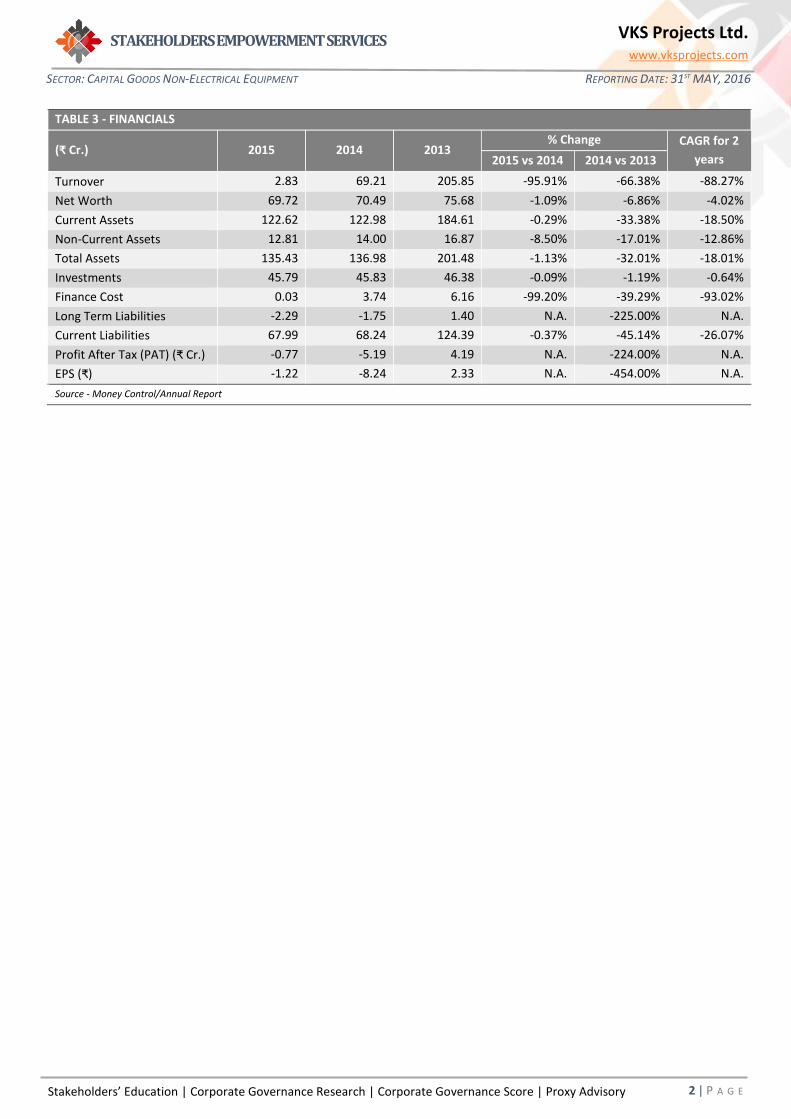
TABLE 3 - FINANCIALS
(₹ Cr.) 2015 2014 2013 % Change CAGR for 2
years 2015 vs 2014 2014 vs 2013
Turnover 2.83 69.21 205.85 -95.91% -66.38% -88.27%
Net Worth 69.72 70.49 75.68 -1.09% -6.86% -4.02%
Current Assets 122.62 122.98 184.61 -0.29% -33.38% -18.50%
Non-Current Assets 12.81 14.00 16.87 -8.50% -17.01% -12.86%
Total Assets 135.43 136.98 201.48 -1.13% -32.01% -18.01%
Investments 45.79 45.83 46.38 -0.09% -1.19% -0.64%
Finance Cost 0.03 3.74 6.16 -99.20% -39.29% -93.02%
Long Term Liabilities -2.29 -1.75 1.40 N.A. -225.00% N.A.
Current Liabilities 67.99 68.24 124.39 -0.37% -45.14% -26.07%
Profit After Tax (PAT) (₹ Cr.) -0.77 -5.19 4.19 N.A. -224.00% N.A.
EPS (₹) -1.22 -8.24 2.33 N.A. -454.00% N.A.
Source - Money Control/Annual Report
Stakeholders’ Education | Corporate Governance Research | Corporate Governance Score | Proxy Advisory
STAKEHOLDERS EMPOWERMENT SERVICES
3 | P A G E
SECTOR: CAPITAL GOODS NON-ELECTRICAL EQUIPMENT REPORTING DATE: 31ST MAY, 2016
VKS Projects Ltd. www.vksprojects.com
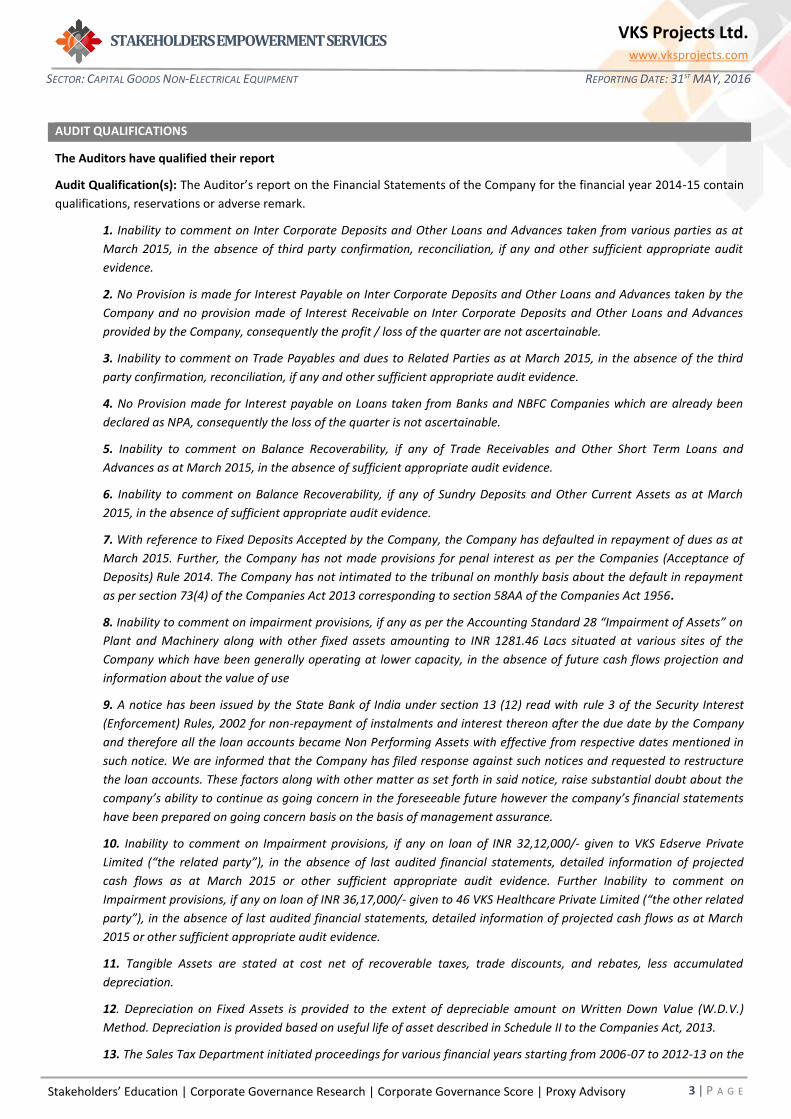
AUDIT QUALIFICATIONS
The Auditors have qualified their report
Audit Qualification(s): The Auditor’s report on the Financial Statements of the Company for the financial year 2014-15 contain
qualifications, reservations or adverse remark.
1. Inability to comment on Inter Corporate Deposits and Other Loans and Advances taken from various parties as at
March 2015, in the absence of third party confirmation, reconciliation, if any and other sufficient appropriate audit
evidence.
2. No Provision is made for Interest Payable on Inter Corporate Deposits and Other Loans and Advances taken by the
Company and no provision made of Interest Receivable on Inter Corporate Deposits and Other Loans and Advances
provided by the Company, consequently the profit / loss of the quarter are not ascertainable.
3. Inability to comment on Trade Payables and dues to Related Parties as at March 2015, in the absence of the third
party confirmation, reconciliation, if any and other sufficient appropriate audit evidence.
4. No Provision made for Interest payable on Loans taken from Banks and NBFC Companies which are already been
declared as NPA, consequently the loss of the quarter is not ascertainable.
5. Inability to comment on Balance Recoverability, if any of Trade Receivables and Other Short Term Loans and
Advances as at March 2015, in the absence of sufficient appropriate audit evidence.
6. Inability to comment on Balance Recoverability, if any of Sundry Deposits and Other Current Assets as at March
2015, in the absence of sufficient appropriate audit evidence.
7. With reference to Fixed Deposits Accepted by the Company, the Company has defaulted in repayment of dues as at
March 2015. Further, the Company has not made provisions for penal interest as per the Companies (Acceptance of
Deposits) Rule 2014. The Company has not intimated to the tribunal on monthly basis about the default in repayment
as per section 73(4) of the Companies Act 2013 corresponding to section 58AA of the Companies Act 1956.
8. Inability to comment on impairment provisions, if any as per the Accounting Standard 28 “Impairment of Assets” on
Plant and Machinery along with other fixed assets amounting to INR 1281.46 Lacs situated at various sites of the
Company which have been generally operating at lower capacity, in the absence of future cash flows projection and
information about the value of use
9. A notice has been issued by the State Bank of India under section 13 (12) read with rule 3 of the Security Interest
(Enforcement) Rules, 2002 for non-repayment of instalments and interest thereon after the due date by the Company
and therefore all the loan accounts became Non Performing Assets with effective from respective dates mentioned in
such notice. We are informed that the Company has filed response against such notices and requested to restructure
the loan accounts. These factors along with other matter as set forth in said notice, raise substantial doubt about the
company’s ability to continue as going concern in the foreseeable future however the company’s financial statements
have been prepared on going concern basis on the basis of management assurance.
10. Inability to comment on Impairment provisions, if any on loan of INR 32,12,000/- given to VKS Edserve Private
Limited (“the related party”), in the absence of last audited financial statements, detailed information of projected
cash flows as at March 2015 or other sufficient appropriate audit evidence. Further Inability to comment on
Impairment provisions, if any on loan of INR 36,17,000/- given to 46 VKS Healthcare Private Limited (“the other related
party”), in the absence of last audited financial statements, detailed information of projected cash flows as at March
2015 or other sufficient appropriate audit evidence.
11. Tangible Assets are stated at cost net of recoverable taxes, trade discounts, and rebates, less accumulated
depreciation.
12. Depreciation on Fixed Assets is provided to the extent of depreciable amount on Written Down Value (W.D.V.)
Method. Depreciation is provided based on useful life of asset described in Schedule II to the Companies Act, 2013.
13. The Sales Tax Department initiated proceedings for various financial years starting from 2006-07 to 2012-13 on the
Stakeholders’ Education | Corporate Governance Research | Corporate Governance Score | Proxy Advisory
STAKEHOLDERS EMPOWERMENT SERVICES
4 | P A G E
SECTOR: CAPITAL GOODS NON-ELECTRICAL EQUIPMENT REPORTING DATE: 31ST MAY, 2016
VKS Projects Ltd. www.vksprojects.com
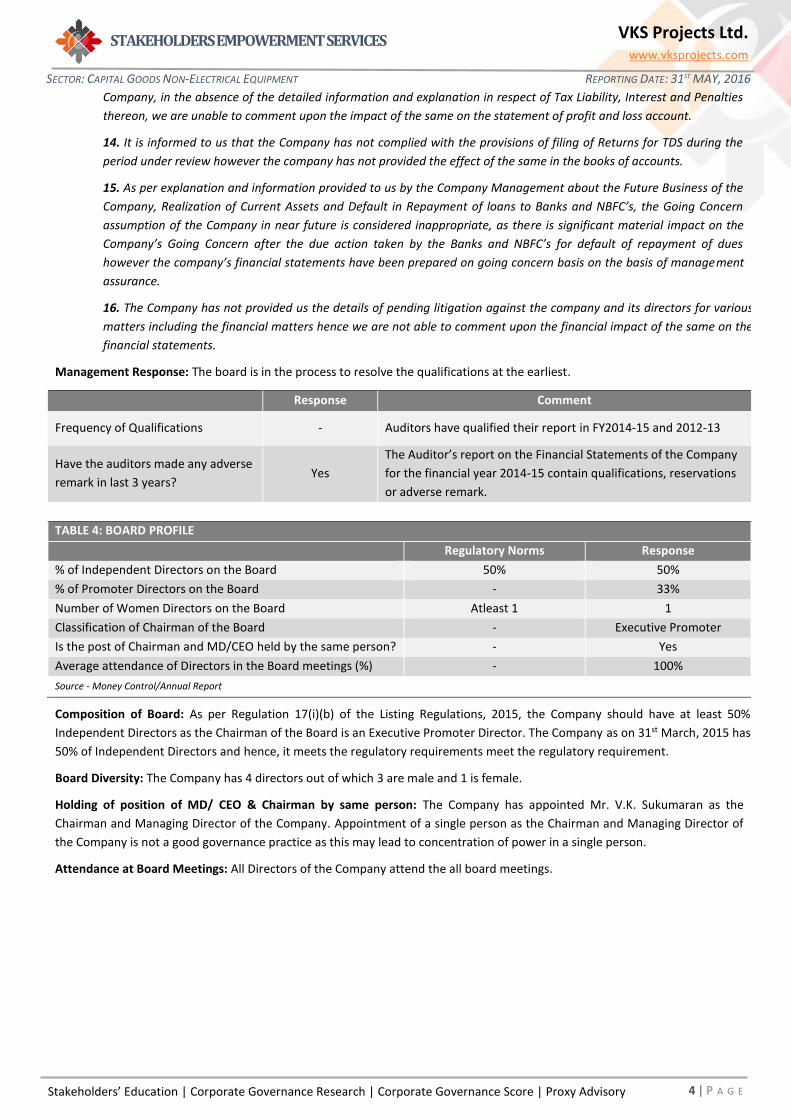
Company, in the absence of the detailed information and explanation in respect of Tax Liability, Interest and Penalties
thereon, we are unable to comment upon the impact of the same on the statement of profit and loss account.
14. It is informed to us that the Company has not complied with the provisions of filing of Returns for TDS during the
period under review however the company has not provided the effect of the same in the books of accounts.
15. As per explanation and information provided to us by the Company Management about the Future Business of the
Company, Realization of Current Assets and Default in Repayment of loans to Banks and NBFC’s, the Going Concern
assumption of the Company in near future is considered inappropriate, as there is significant material impact on the
Company’s Going Concern after the due action taken by the Banks and NBFC’s for default of repayment of dues
however the company’s financial statements have been prepared on going concern basis on the basis of management
assurance.
16. The Company has not provided us the details of pending litigation against the company and its directors for various
matters including the financial matters hence we are not able to comment upon the financial impact of the same on the
financial statements.
Management Response: The board is in the process to resolve the qualifications at the earliest.
Response Comment
Frequency of Qualifications - Auditors have qualified their report in FY2014-15 and 2012-13
Have the auditors made any adverse
remark in last 3 years? Yes
The Auditor’s report on the Financial Statements of the Company
for the financial year 2014-15 contain qualifications, reservations
or adverse remark.
TABLE 4: BOARD PROFILE
Regulatory Norms Response
% of Independent Directors on the Board 50% 50%
% of Promoter Directors on the Board - 33%
Number of Women Directors on the Board Atleast 1 1
Classification of Chairman of the Board - Executive Promoter
Is the post of Chairman and MD/CEO held by the same person? - Yes
Average attendance of Directors in the Board meetings (%) - 100%
Source - Money Control/Annual Report
Composition of Board: As per Regulation 17(i)(b) of the Listing Regulations, 2015, the Company should have at least 50%
Independent Directors as the Chairman of the Board is an Executive Promoter Director. The Company as on 31st March, 2015 has
50% of Independent Directors and hence, it meets the regulatory requirements meet the regulatory requirement.
Board Diversity: The Company has 4 directors out of which 3 are male and 1 is female.
Holding of position of MD/ CEO & Chairman by same person: The Company has appointed Mr. V.K. Sukumaran as the
Chairman and Managing Director of the Company. Appointment of a single person as the Chairman and Managing Director of
the Company is not a good governance practice as this may lead to concentration of power in a single person.
Attendance at Board Meetings: All Directors of the Company attend the all board meetings.
Stakeholders’ Education | Corporate Governance Research | Corporate Governance Score | Proxy Advisory
STAKEHOLDERS EMPOWERMENT SERVICES
5 | P A G E
SECTOR: CAPITAL GOODS NON-ELECTRICAL EQUIPMENT REPORTING DATE: 31ST MAY, 2016
VKS Projects Ltd. www.vksprojects.com
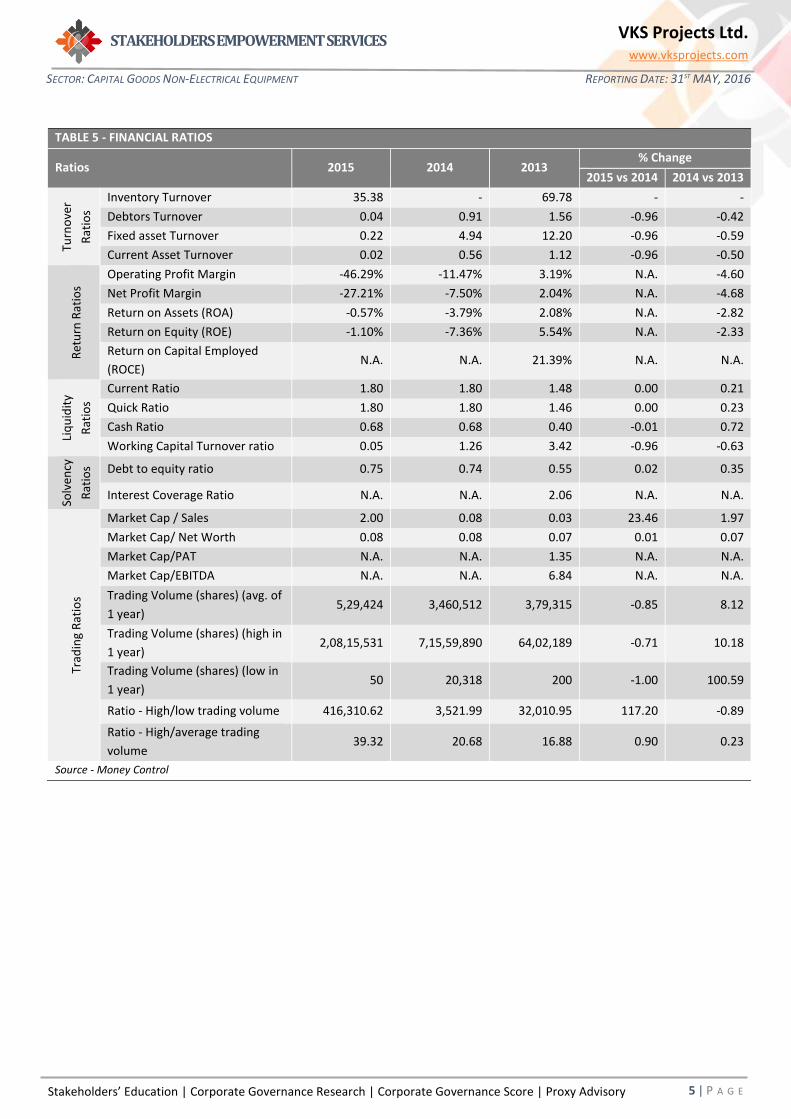
TABLE 5 - FINANCIAL RATIOS
Ratios 2015 2014 2013 % Change
2015 vs 2014 2014 vs 2013
Turn
ove
r
Rat
ios
Inventory Turnover 35.38 - 69.78 - -
Debtors Turnover 0.04 0.91 1.56 -0.96 -0.42
Fixed asset Turnover 0.22 4.94 12.20 -0.96 -0.59
Current Asset Turnover 0.02 0.56 1.12 -0.96 -0.50
Ret
urn
Rat
ios
Operating Profit Margin -46.29% -11.47% 3.19% N.A. -4.60
Net Profit Margin -27.21% -7.50% 2.04% N.A. -4.68
Return on Assets (ROA) -0.57% -3.79% 2.08% N.A. -2.82
Return on Equity (ROE) -1.10% -7.36% 5.54% N.A. -2.33
Return on Capital Employed
(ROCE) N.A. N.A. 21.39% N.A. N.A.
Liq
uid
ity
Rat
ios
Current Ratio 1.80 1.80 1.48 0.00 0.21
Quick Ratio 1.80 1.80 1.46 0.00 0.23
Cash Ratio 0.68 0.68 0.40 -0.01 0.72
Working Capital Turnover ratio 0.05 1.26 3.42 -0.96 -0.63
Solv
ency
Rat
ios Debt to equity ratio 0.75 0.74 0.55 0.02 0.35
Interest Coverage Ratio N.A. N.A. 2.06 N.A. N.A.
Trad
ing
Rat
ios
Market Cap / Sales 2.00 0.08 0.03 23.46 1.97
Market Cap/ Net Worth 0.08 0.08 0.07 0.01 0.07
Market Cap/PAT N.A. N.A. 1.35 N.A. N.A.
Market Cap/EBITDA N.A. N.A. 6.84 N.A. N.A.
Trading Volume (shares) (avg. of
1 year) 5,29,424 3,460,512 3,79,315 -0.85 8.12
Trading Volume (shares) (high in
1 year) 2,08,15,531 7,15,59,890 64,02,189 -0.71 10.18
Trading Volume (shares) (low in
1 year) 50 20,318 200 -1.00 100.59
Ratio - High/low trading volume 416,310.62 3,521.99 32,010.95 117.20 -0.89
Ratio - High/average trading
volume 39.32 20.68 16.88 0.90 0.23
Source - Money Control
Stakeholders’ Education | Corporate Governance Research | Corporate Governance Score | Proxy Advisory
STAKEHOLDERS EMPOWERMENT SERVICES
6 | P A G E
SECTOR: CAPITAL GOODS NON-ELECTRICAL EQUIPMENT REPORTING DATE: 31ST MAY, 2016
VKS Projects Ltd. www.vksprojects.com
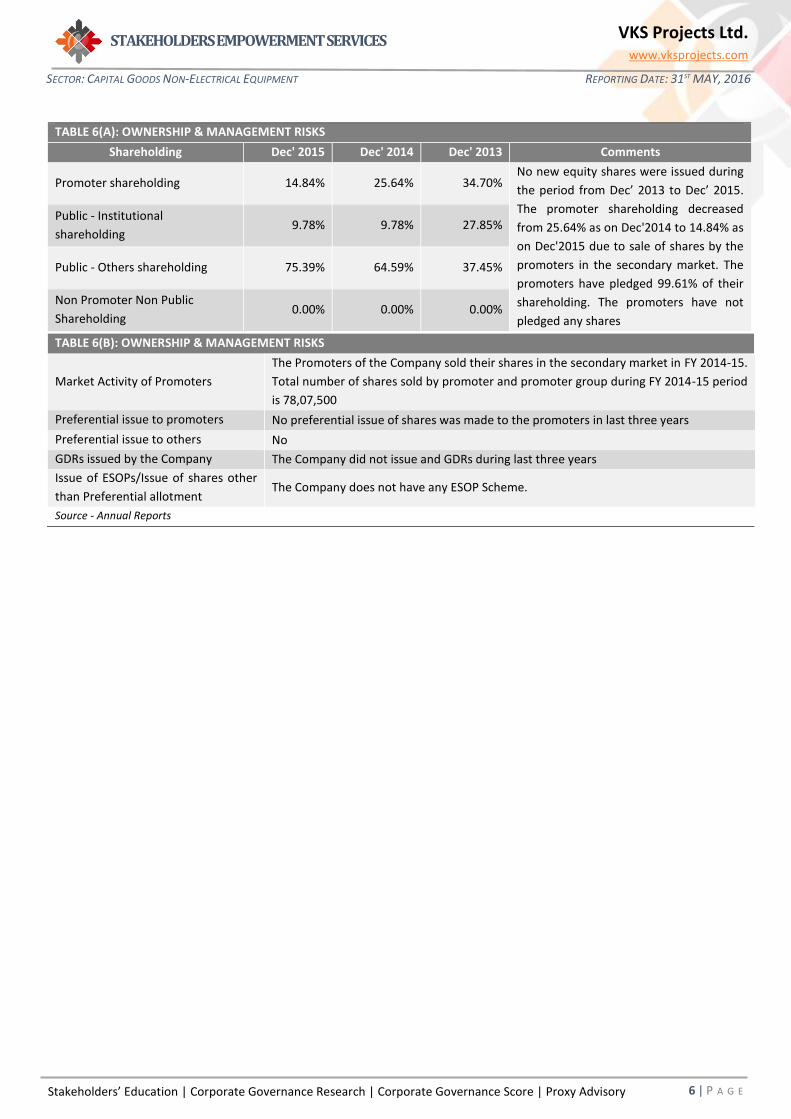
TABLE 6(A): OWNERSHIP & MANAGEMENT RISKS
Shareholding Dec' 2015 Dec' 2014 Dec' 2013 Comments
Promoter shareholding 14.84% 25.64% 34.70% No new equity shares were issued during
the period from Dec’ 2013 to Dec’ 2015.
The promoter shareholding decreased
from 25.64% as on Dec'2014 to 14.84% as
on Dec'2015 due to sale of shares by the
promoters in the secondary market. The
promoters have pledged 99.61% of their
shareholding. The promoters have not
pledged any shares
Public - Institutional
shareholding 9.78% 9.78% 27.85%
Public - Others shareholding 75.39% 64.59% 37.45%
Non Promoter Non Public
Shareholding 0.00% 0.00% 0.00%
TABLE 6(B): OWNERSHIP & MANAGEMENT RISKS
Market Activity of Promoters
The Promoters of the Company sold their shares in the secondary market in FY 2014-15.
Total number of shares sold by promoter and promoter group during FY 2014-15 period
is 78,07,500
Preferential issue to promoters No preferential issue of shares was made to the promoters in last three years
Preferential issue to others No
GDRs issued by the Company The Company did not issue and GDRs during last three years
Issue of ESOPs/Issue of shares other
than Preferential allotment The Company does not have any ESOP Scheme.
Source - Annual Reports

Stakeholders’ Education | Corporate Governance Research | Corporate Governance Score | Proxy Advisory
STAKEHOLDERS EMPOWERMENT SERVICES
7 | P A G E
SECTOR: CAPITAL GOODS NON-ELECTRICAL EQUIPMENT REPORTING DATE: 31ST MAY, 2016
VKS Projects Ltd. www.vksprojects.com
Glossary
Equity: The equity shares capital of the Company
Net Worth: The amount by which the Assets exceeds the liabilities excluding shareholders’ funds of the Company
Turnover: The revenue earned from the operations of the Company
EPS: Earning Per Share is net profit earned by the Company per share
𝐸𝑃𝑆 =Profit After Tax
Number of outstanding shares
P/E ratio: It is the ratio of the Company’s share price to earnings per share of the Company
𝑃/𝐸 𝑟𝑎𝑡𝑖𝑜 =Price of each share
Earnings per share
Current Assets: Cash and other assets that are expected to be converted to cash in one year
Fixed Assets: assets which are purchased for long-term use and are not likely to be converted quickly into cash, such as land,
buildings, and equipment
Total Assets: Current Assets + Fixed Assets
Investments: An investment is an asset or item that is purchased with the hope that it will generate income or appreciate in the
future.
Finance Cost: The Financing Cost (FC), also known as the Cost of Finances (COF), is the cost and interest and other charges
incurred during the year in relation to borrowed money.
Long Term Liabilities: Long-term liabilities are liabilities with a maturity period of over one year.
Current Liabilities: A company's debts or obligations that are due within one year.
Inventory Turnover ratio: Inventory Turnover is a ratio showing how many times a company's inventory is sold and replaced over
a period.
𝐼𝑛𝑣𝑒𝑛𝑡𝑜𝑟𝑦 𝑇𝑢𝑟𝑛𝑜𝑣𝑒𝑟 𝑟𝑎𝑡𝑖𝑜 =Sales Turnover
Inventory
Debtors Turnover: Accounts receivable turnover is an efficiency ratio or activity ratio that measures how many times a business
can turn its accounts receivable into cash during a period
𝐷𝑒𝑏𝑡𝑜𝑟𝑠 𝑇𝑢𝑟𝑛𝑜𝑣𝑒𝑟 𝑟𝑎𝑡𝑖𝑜 =Sales Turnover
Accounts recievables
Fixed Asset Turnover: The fixed-asset turnover ratio is a financial ratio of net sales to fixed assets
𝐹𝑖𝑥𝑒𝑑 𝐴𝑠𝑠𝑒𝑡 𝑇𝑢𝑟𝑛𝑜𝑣𝑒𝑟 𝑟𝑎𝑡𝑖𝑜 =Sales Turnover
Fixed Assets
Current Asset Turnover: The current-asset turnover ratio is a financial ratio of net sales to fixed assets
𝐶𝑢𝑟𝑟𝑒𝑛𝑡 𝐴𝑠𝑠𝑒𝑡 𝑇𝑢𝑟𝑛𝑜𝑣𝑒𝑟 𝑟𝑎𝑡𝑖𝑜 =Sales Turnover
Current Assets
Stakeholders’ Education | Corporate Governance Research | Corporate Governance Score | Proxy Advisory
STAKEHOLDERS EMPOWERMENT SERVICES
8 | P A G E
SECTOR: CAPITAL GOODS NON-ELECTRICAL EQUIPMENT REPORTING DATE: 31ST MAY, 2016
VKS Projects Ltd. www.vksprojects.com
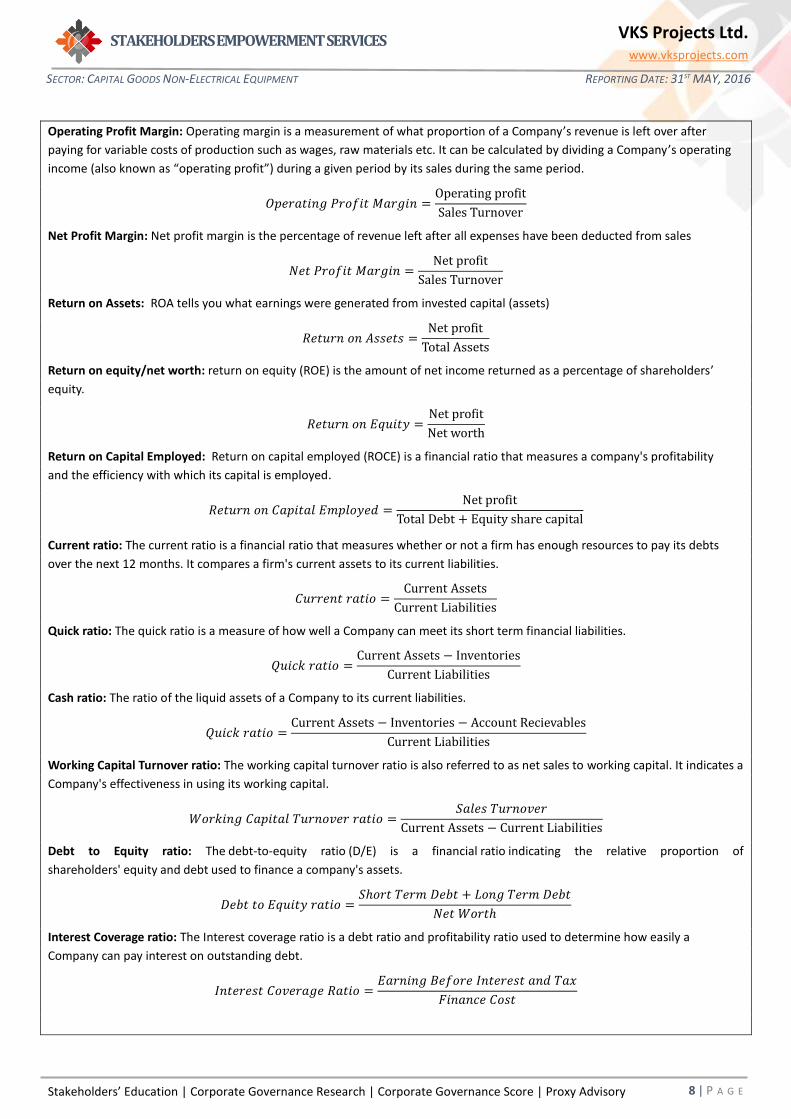
Operating Profit Margin: Operating margin is a measurement of what proportion of a Company’s revenue is left over after
paying for variable costs of production such as wages, raw materials etc. It can be calculated by dividing a Company’s operating
income (also known as “operating profit”) during a given period by its sales during the same period.
𝑂𝑝𝑒𝑟𝑎𝑡𝑖𝑛𝑔 𝑃𝑟𝑜𝑓𝑖𝑡 𝑀𝑎𝑟𝑔𝑖𝑛 =Operating profit
Sales Turnover
Net Profit Margin: Net profit margin is the percentage of revenue left after all expenses have been deducted from sales
𝑁𝑒𝑡 𝑃𝑟𝑜𝑓𝑖𝑡 𝑀𝑎𝑟𝑔𝑖𝑛 =Net profit
Sales Turnover
Return on Assets: ROA tells you what earnings were generated from invested capital (assets)
𝑅𝑒𝑡𝑢𝑟𝑛 𝑜𝑛 𝐴𝑠𝑠𝑒𝑡𝑠 =Net profit
Total Assets
Return on equity/net worth: return on equity (ROE) is the amount of net income returned as a percentage of shareholders’
equity.
𝑅𝑒𝑡𝑢𝑟𝑛 𝑜𝑛 𝐸𝑞𝑢𝑖𝑡𝑦 =Net profit
Net worth
Return on Capital Employed: Return on capital employed (ROCE) is a financial ratio that measures a company's profitability
and the efficiency with which its capital is employed.
𝑅𝑒𝑡𝑢𝑟𝑛 𝑜𝑛 𝐶𝑎𝑝𝑖𝑡𝑎𝑙 𝐸𝑚𝑝𝑙𝑜𝑦𝑒𝑑 =Net profit
Total Debt + Equity share capital
Current ratio: The current ratio is a financial ratio that measures whether or not a firm has enough resources to pay its debts
over the next 12 months. It compares a firm's current assets to its current liabilities.
𝐶𝑢𝑟𝑟𝑒𝑛𝑡 𝑟𝑎𝑡𝑖𝑜 =Current Assets
Current Liabilities
Quick ratio: The quick ratio is a measure of how well a Company can meet its short term financial liabilities.
𝑄𝑢𝑖𝑐𝑘 𝑟𝑎𝑡𝑖𝑜 =Current Assets − Inventories
Current Liabilities
Cash ratio: The ratio of the liquid assets of a Company to its current liabilities.
𝑄𝑢𝑖𝑐𝑘 𝑟𝑎𝑡𝑖𝑜 =Current Assets − Inventories − Account Recievables
Current Liabilities
Working Capital Turnover ratio: The working capital turnover ratio is also referred to as net sales to working capital. It indicates a
Company's effectiveness in using its working capital.
𝑊𝑜𝑟𝑘𝑖𝑛𝑔 𝐶𝑎𝑝𝑖𝑡𝑎𝑙 𝑇𝑢𝑟𝑛𝑜𝑣𝑒𝑟 𝑟𝑎𝑡𝑖𝑜 =𝑆𝑎𝑙𝑒𝑠 𝑇𝑢𝑟𝑛𝑜𝑣𝑒𝑟
Current Assets − Current Liabilities
Debt to Equity ratio: The debt-to-equity ratio (D/E) is a financial ratio indicating the relative proportion of
shareholders' equity and debt used to finance a company's assets.
𝐷𝑒𝑏𝑡 𝑡𝑜 𝐸𝑞𝑢𝑖𝑡𝑦 𝑟𝑎𝑡𝑖𝑜 =𝑆ℎ𝑜𝑟𝑡 𝑇𝑒𝑟𝑚 𝐷𝑒𝑏𝑡 + 𝐿𝑜𝑛𝑔 𝑇𝑒𝑟𝑚 𝐷𝑒𝑏𝑡
𝑁𝑒𝑡 𝑊𝑜𝑟𝑡ℎ
Interest Coverage ratio: The Interest coverage ratio is a debt ratio and profitability ratio used to determine how easily a
Company can pay interest on outstanding debt.
𝐼𝑛𝑡𝑒𝑟𝑒𝑠𝑡 𝐶𝑜𝑣𝑒𝑟𝑎𝑔𝑒 𝑅𝑎𝑡𝑖𝑜 =𝐸𝑎𝑟𝑛𝑖𝑛𝑔 𝐵𝑒𝑓𝑜𝑟𝑒 𝐼𝑛𝑡𝑒𝑟𝑒𝑠𝑡 𝑎𝑛𝑑 𝑇𝑎𝑥
𝐹𝑖𝑛𝑎𝑛𝑐𝑒 𝐶𝑜𝑠𝑡
Stakeholders’ Education | Corporate Governance Research | Corporate Governance Score | Proxy Advisory
STAKEHOLDERS EMPOWERMENT SERVICES
9 | P A G E
SECTOR: CAPITAL GOODS NON-ELECTRICAL EQUIPMENT REPORTING DATE: 31ST MAY, 2016
VKS Projects Ltd. www.vksprojects.com
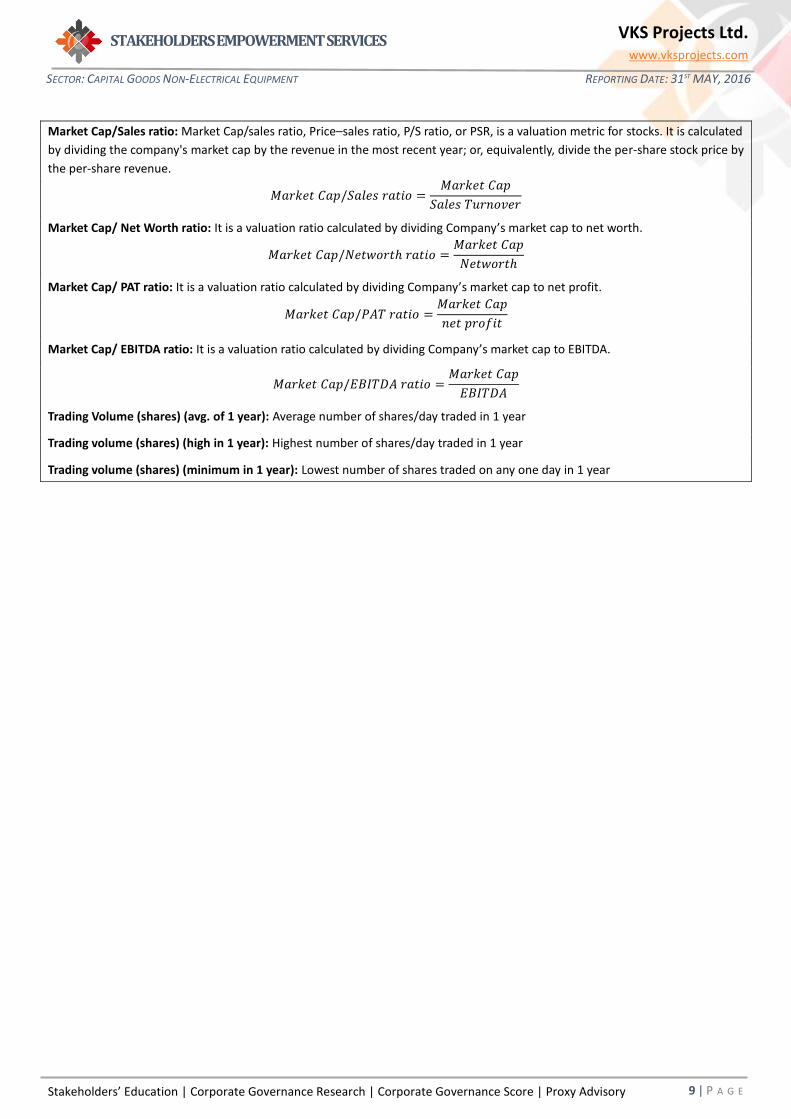
Market Cap/Sales ratio: Market Cap/sales ratio, Price–sales ratio, P/S ratio, or PSR, is a valuation metric for stocks. It is calculated
by dividing the company's market cap by the revenue in the most recent year; or, equivalently, divide the per-share stock price by
the per-share revenue.
𝑀𝑎𝑟𝑘𝑒𝑡 𝐶𝑎𝑝/𝑆𝑎𝑙𝑒𝑠 𝑟𝑎𝑡𝑖𝑜 =𝑀𝑎𝑟𝑘𝑒𝑡 𝐶𝑎𝑝
𝑆𝑎𝑙𝑒𝑠 𝑇𝑢𝑟𝑛𝑜𝑣𝑒𝑟
Market Cap/ Net Worth ratio: It is a valuation ratio calculated by dividing Company’s market cap to net worth.
𝑀𝑎𝑟𝑘𝑒𝑡 𝐶𝑎𝑝/𝑁𝑒𝑡𝑤𝑜𝑟𝑡ℎ 𝑟𝑎𝑡𝑖𝑜 =𝑀𝑎𝑟𝑘𝑒𝑡 𝐶𝑎𝑝
𝑁𝑒𝑡𝑤𝑜𝑟𝑡ℎ
Market Cap/ PAT ratio: It is a valuation ratio calculated by dividing Company’s market cap to net profit.
𝑀𝑎𝑟𝑘𝑒𝑡 𝐶𝑎𝑝/𝑃𝐴𝑇 𝑟𝑎𝑡𝑖𝑜 =𝑀𝑎𝑟𝑘𝑒𝑡 𝐶𝑎𝑝
𝑛𝑒𝑡 𝑝𝑟𝑜𝑓𝑖𝑡
Market Cap/ EBITDA ratio: It is a valuation ratio calculated by dividing Company’s market cap to EBITDA.
𝑀𝑎𝑟𝑘𝑒𝑡 𝐶𝑎𝑝/𝐸𝐵𝐼𝑇𝐷𝐴 𝑟𝑎𝑡𝑖𝑜 =𝑀𝑎𝑟𝑘𝑒𝑡 𝐶𝑎𝑝
𝐸𝐵𝐼𝑇𝐷𝐴
Trading Volume (shares) (avg. of 1 year): Average number of shares/day traded in 1 year
Trading volume (shares) (high in 1 year): Highest number of shares/day traded in 1 year
Trading volume (shares) (minimum in 1 year): Lowest number of shares traded on any one day in 1 year
Stakeholders’ Education | Corporate Governance Research | Corporate Governance Score | Proxy Advisory
STAKEHOLDERS EMPOWERMENT SERVICES
10 |
P A G E
SECTOR: CAPITAL GOODS NON-ELECTRICAL EQUIPMENT REPORTING DATE: 31ST MAY, 2016
VKS Projects Ltd. www.vksprojects.com
DISCLAIMER
Sources Company Information
Only publicly available data has been used while making the factsheet. Our
data sources include: BSE, NSE, SEBI, Capitaline, Moneycontrol, Businessweek,
Reuters, Annual Reports, IPO Documents and Company Website.
Analyst Certification
The analysts involved in development of this factsheet certify that no part of
any of the research analyst’s compensation was, is, or will be directly or
indirectly related to the contents of this factsheet.
Disclaimer
While SES has made every effort and has exercised due skill, care and diligence in compiling this factsheet based on publicly available information, it neither guarantees its accuracy, completeness or usefulness, nor assumes any liability whatsoever for any consequence from its use. This factsheet does not have any approval, express or implied, from any authority, nor is it required to have such approval. The users are strongly advised to exercise due diligence while using this factsheet.
This factsheet in no manner constitutes an offer, solicitation or advice to buy or sell securities, nor solicits votes or proxies on behalf of any party. SES, which is a not-for-profit Initiative or its staff, has no financial interest in the companies covered in this factsheet except what is disclosed on its website. The factsheet is released in India and SES has ensured that it is in accordance with Indian laws. Person resident outside India shall ensure that laws in their country are not violated while using this factsheet; SES shall not be responsible for any such violation.
All disputes subject to jurisdiction of High Court of Bombay, Mumbai.
SEBI Reg. No. INH000000016
This factsheet or any portion hereof may not
be reprinted, sold, reproduced or
redistributed without the written consent of
Stakeholders Empowerment Services
Contact Information
Stakeholders Empowerment Services
A 202, Muktangan,
Upper Govind Nagar,
Malad East,
Mumbai – 400 097
Tel +91 22 4022 0322
www.sesgovernance.com.
Research Analyst: Shraddha Bansode