Embed Size (px)
Citation preview
VIUALIZATION OF FLAME ACCELERATION AND DDT IN AN
OBSTRUCTED TUBE
by
Shervin Hashemi Mehr
A thesis submitted to the Department of Mechanical and Materials Engineering
In conformity with the requirements for
the degree of Master of Applied Science
Queen’s University
Kingston, Ontario, Canada
(October, 2021)
Copyright ©Shervin Hashemi Mehr, 2021
ii
Abstract
Self-luminous high-speed photography was used to study flame acceleration and DDT inside a
fully transparent round tube filled with equally distanced orifice plates. The combustion tube was 288 cm
long with an inner diameter of 7.6 cm. Two sets of orifice plates (50% BR and 75% BR) were used.
Stoichiometric ethylene-oxygen diluted with nitrogen or argon was used primarily in this study. The
reactivity of mixtures was controlled by the initial pressures. Stoichiometric hydrogen-oxygen with 70%
and 80% argon dilution were also used to check the effect of cell structure regularity on DDT. The
average combustion velocity was measured using high-speed video data. Soot foils were used to
determine detonation propagation mechanism, as well as for detonation cell size measurement.
The DDT criterion based on the ratio of the orifice plate opening diameter and the detonation cell
size (d/ λ ≥1) was verified for the 50% BR but was conservative for higher blockage ratios. For 75% BR a
galloping detonation mode that travels at an average velocity below the product's speed of sound
influences the determination of the DDT limit in the traditional manner based on the velocity. The use of
large argon dilution was found to not influence the propagation mechanism and flame acceleration
behavior. Also, 70% argon dilution had no noticeable effect on the critical d/ λ for 50% BR, and a very
small effect for 80% argon dilution, however, the effect was more noticeable for 75% BR. Generally,
large argon dilution increases the cell structure's regularity. Soot foil records obtained for 70% and 80%
argon dilution show that the structure is very regular but not significantly more than for the nitrogen
diluted ethylene mixtures.
DDT run-up distance was obtained using high-speed videos and soot foils. It was determined that
the Silvestrini correlation predicts the DDT run-up distance successfully for reactive mixtures. However,
for mixtures near the limit, the DDT run-up distance was significantly larger. A basic correlation for the
DDT run-up distance was proposed based on the concept of flame acceleration to fast-flame followed by
DDT induction distance that depends on the detonation cell size and activation energy.
iii
Acknowledgements
I would like to show my gratitude to my supervisor, Dr. Gaby Ciccarelli, for giving me the
wonderful opportunity to work in The Explosion Physics and Prevention Laboratory at Queen’s
University. His continued support, guidance, and insight have made this project possible and pleasurable
for the past two years. Working with him was an unforgettable journey.
Having access to the McLaughlin Hall machine shop was a privilege. I would like to thank the
staff (Andy Bryson, David Walsh, Paul Moreland, Corey Fowler) for their ongoing help and teaching
with machines operation. Also, a special thanks to Derek Hodgson for his jokes and great attitude that
made my day every time.
I would also like to thank Dr. Nabiha Chaumeix from CNRS Orleans for her contribution to this
project by calculating laminar burning velocity and density of burned and unburned gas for mixtures used
in this study
Special thanks to my colleague and friend, Vahid Yousefi that was there for me like an older
brother in the lab and life. I am grateful to my other colleagues, Myron Menezes, Michael McLoughlin,
and Scott Gray, who were always generous with their time and did not hesitate when their help was
required.
Last but not surly least, I would like to thank my family that without their support and love this
would not be possible. And special graduation to my beautiful girlfriend, Leyla, who made life wonderful
for me during the last two years.
iv
Table of Contents
Abstract ......................................................................................................................................................... ii
Acknowledgements ...................................................................................................................................... iii
List of Figures .............................................................................................................................................. vi
List of Tables ................................................................................................................................................ x
List of Abbreviations ................................................................................................................................... xi
Chapter 1 Introduction ................................................................................................................................. 1
Chapter 2 Detonation Theory and literature review ...................................................................................... 3
2.1 CJ Theory ........................................................................................................................................... 3
2.3 3D Structure ....................................................................................................................................... 11
2.4 Detonation Cell Size .......................................................................................................................... 14
2.5 Critical Tube Diameter ...................................................................................................................... 16
2.6 Detonation Initiation by Shock Reflection ........................................................................................ 20
2.7 Flame Acceleration and DDT ............................................................................................................ 23
2.8 DDT Limits ........................................................................................................................................ 26
2.9 DDT Studies in Obstructed Channels ................................................................................................ 29
Chapter 3 Experiments and Apparatus ........................................................................................................ 34
3.1 Overview ........................................................................................................................................... 34
3.2 Combustion Tube............................................................................................................................... 35
3.3 Obstacles ............................................................................................................................................ 36
3.4 Mixing Chamber And Control Panel ................................................................................................. 37
3.5 Ignition System .................................................................................................................................. 39
3.6 Camera Configurations ...................................................................................................................... 40
3.7 Image Processing ............................................................................................................................... 41
3.8 Soot Foils ........................................................................................................................................... 42
3.9 Cell Size Measurement ...................................................................................................................... 44
3.10 Operating Procedure ........................................................................................................................ 46
Chapter 4 Results and Discussion ............................................................................................................... 49
4.1 Detonation Propagation Modes ......................................................................................................... 49
4.1.1 Combustion Front Velocity ........................................................................................................ 49
4.1.2 Propagation Modes .................................................................................................................... 51
4.1.2.2 75% Blockage Ratio............................................................................................................ 66
4.1.2.3 Single Hot-Spot Wall Ignition Detonation .......................................................................... 71
v
4.1.2.4 Multi Hot-Spot Wall Ignition Detonation ........................................................................... 73
4.1.2.5 Continuous Detonation ....................................................................................................... 77
4.1.2.6 Detonation Ignition Behind the Flame Front ...................................................................... 79
4.2 DDT Properties .................................................................................................................................. 81
4.2.1 DDT Limit ................................................................................................................................. 81
4.2.2 Detonation Cell Size .................................................................................................................. 82
4.2.3 Comparison of Nitrogen Diluted and Argon Diluted Mixtures Combustion Front Velocities .. 85
4.2.4 Variation in Propagation Mode and Combustion Front Velocity .............................................. 88
4.2.5 DDT Run-Up Distance............................................................................................................... 94
Chapter 5 Conclusion and Recommendations .......................................................................................... 101
References ................................................................................................................................................. 104
Appendix A Uncertainty Analysis ............................................................................................................ 110
Appendix B Additional Measured Velocities ........................................................................................... 113
vi
List of Figures
Figure 2.1: Schematic of one-dimensional detonation wave [16]. ................................................................ 4
Figure 2.2: The two possible end-state for CJ solutions based on the tangency of Rayleigh line to the
equilibrium Hugoniot curve [15] .................................................................................................................. 7
Figure 2.3: Schematic of ZND detonation wave model [15] ........................................................................ 9
Figure 2.4: Typical reaction zone profile presenting Mach number, pressure ratio and fermeture ratio
plotted over the distance from the shock. Figure adapted from [15] .......................................................... 10
Figure 2.5: Schematic of the triple point and the three major shock waves configuration with their
propagation directions indicated by arrows [15] ......................................................................................... 12
Figure 2.6: A Schlieren picture presenting the detonation front [23] ......................................................... 12
Figure 2.7: Schematic of ideal cellular detonation wave front structure showing the trajectories of the
triple points. Shock waves are indicated by solid lines, and the end of the reaction zone is indicated by
dotted lines. Detonation parameters cell length and cell size are represented by Lc and λ, respectively [15]
.................................................................................................................................................................... 14
Figure 2.8: Soot foil obtained for a hydrogen-oxygen mixture with 85% argon dilution showing regular
detonation cells. The cell size is indicated by λ [31] .................................................................................. 15
Figure 2.9 schematic of detonation velocity variation over the length of a detonation cell [15] ............... 16
Figure 2.10: Entering of detonation into an unconfined space captured by open shutter photography
technique where a) detonation fails completely in the sub-critical case, and b) detonation reinitiates in the
supercritical case [32] ................................................................................................................................. 17
Figure 2.11: Normalized critical channel height by detonation cell size plotted over channel aspect ration
.................................................................................................................................................................... 20
Figure 2.12: Sequences of Schlieren images showing a) supper critical case where the failing detonation
reinitiated by transverse waves, b) the case where the failed detonation reinitiated by transverse waves
Mach reflection on the walls, and c) the complete failure of detonation due to expansion [42] ................ 22
Figure 2.13: Typical schematic of flame acceleration resulting in DDT in a combustion tube filled with
repeating orifice plates [15] ........................................................................................................................ 25
Figure 2.14: Typical velocity profile of flame acceleration in an obstructed channel [15] ........................ 26
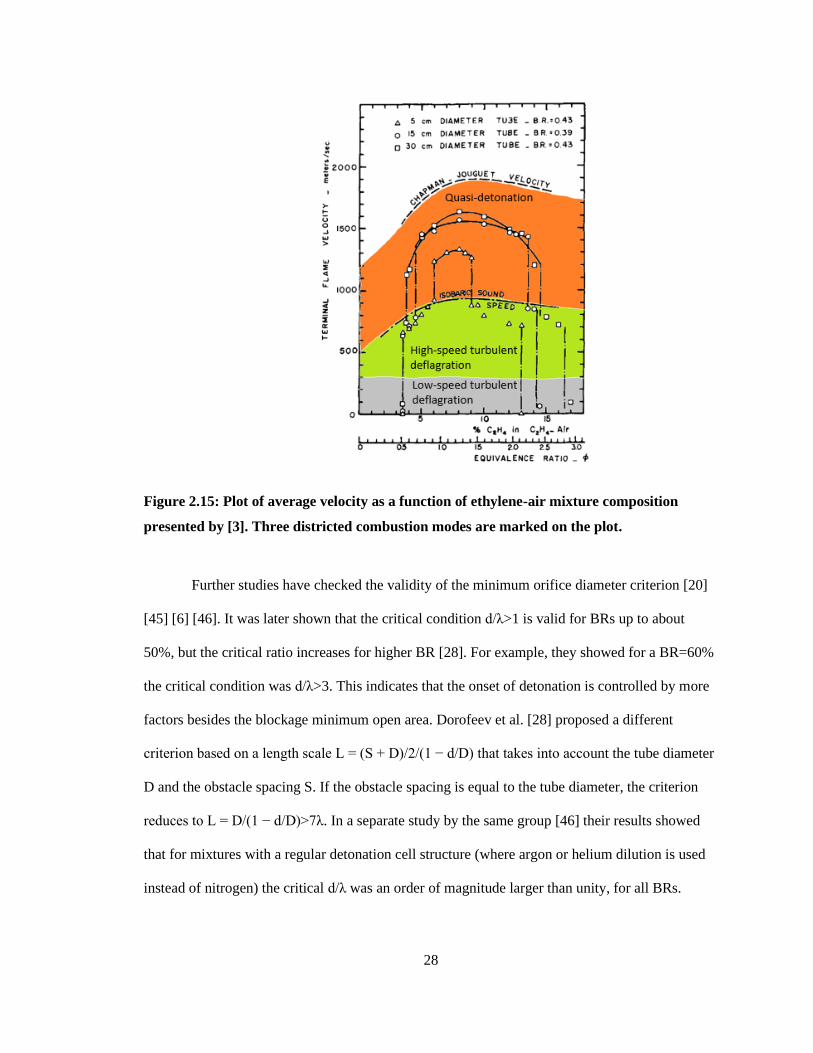
Figure 2.15: Plot of average velocity as a function of ethylene-air mixture composition presented by [3].
Three districted combustion modes are marked on the plot. ...................................................................... 28
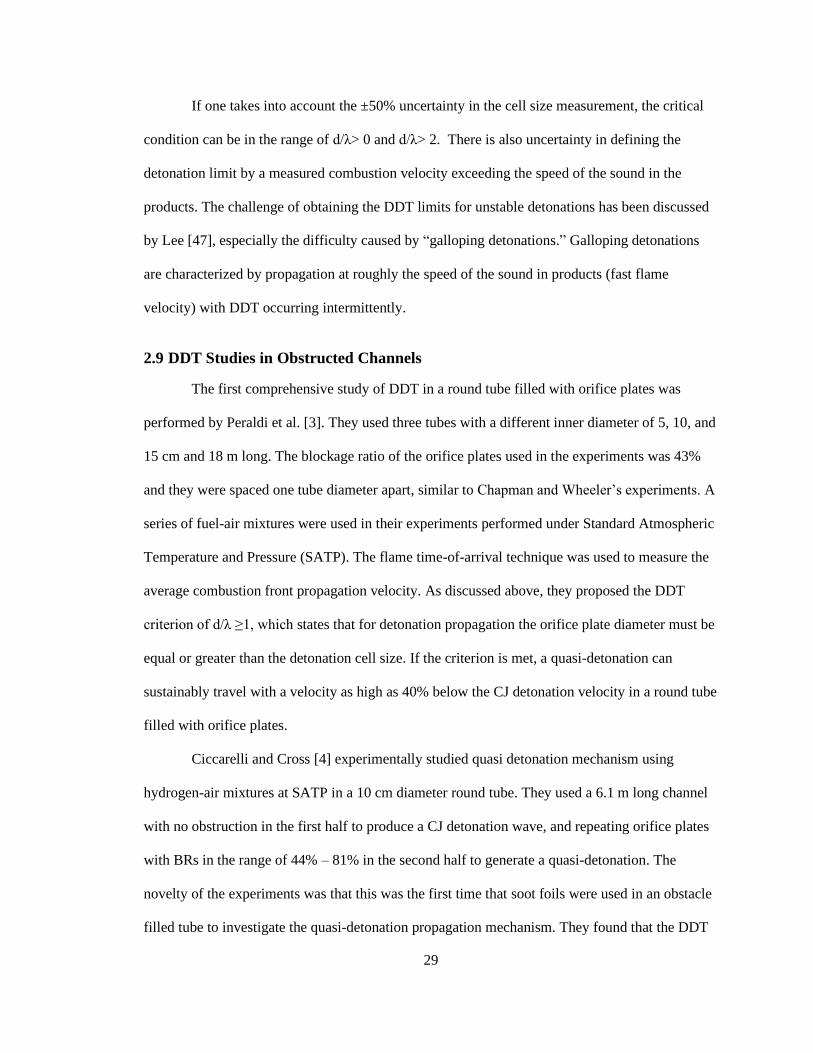
Figure 2.16: Soot foil from a stoichiometric hydrogen-oxygen mixture in 50% BR. The ignition spots are
marked on the foil [48] ............................................................................................................................... 30
vii
Figure 3.1: SolidWorks model of the transparent cylindrical combustion channel filled with repeating
orifice plates used in this study ................................................................................................................... 36
Figure 3.2: Orifice plates with 50% BR (left) and 75% BR (right) ............................................................ 37
Figure 3.3: SolidWorks model of tube, spacers and orifice plates configuration. S is the length of the
spacer (one tube diameter) and d is the opening area of the orifice plate ................................................... 37
Figure 3.4: Schematic of control panel and valve connections ................................................................... 38
Figure 3.5: Picture of ignition flange indicating the spark plug and the glow plug configuration ............. 40
Figure 3.6: X-t diagram, from video frame time sequence, showing DDT at OP9 for ethylene-oxygen =1
at initial pressure of 15.2 kPa, BR=50% (test 185) ..................................................................................... 42
Figure 3.7: SolidWorks model of curved soot foils configuration in the combustion tube ........................ 43
Figure 3.8: SolidWorks model of a long, curved soot foil configuration in the end of the combustion tube
for detonation cell size measurement. ......................................................................................................... 44
Figure 3.9: A sample of long soot foil obtained from stoichiometric ethylene-oxygen mixture with 70%
nitrogen dilution at 64.7 kPa. Detonation cell structures are very irregular, with uniform cell sizes
indicating a steady state is achieved. .......................................................................................................... 45
Figure 3.10: Soot foils sample used for detonation cell size measurement where A) has very irregular
detonation structure due to nitrogen dilution and B) has very regular structure due to argon dilution (Test
782 and Test 740, respectively) .................................................................................................................. 46
Figure 4.1: Plot of average combustion front velocity as a function initial pressure in ethylene-oxygen
mixture with 70% argon dilution mixture ................................................................................................... 50
Figure 4.2: Side-view filmed at 175,000 fps presenting the fast flame propagation of with ethylene-
oxygen-70% nitrogen mixture at 64.7 kPa (Test 617) ................................................................................ 54
Figure 4.3: high-speed video footage of ethylene-oxygen with 70% argon diluted mixture showing
detonation initiation on obstacle plate face at 10.2 kPa, filmed at 300,000 fps (Test 630) ........................ 56
Figure 4.4: Curved soot foil showing detonation initiation on obstacle face obtained from hydrogen-
oxygen with 70% argon diluted mixture at 34.8 kPa (Test 707) ................................................................ 57
Figure 4.5: Side view footage of single-wall ignition propagation of detonation filmed at 224,000 fps with
its characteristic altering ignition points and two heads of detonation (Test 634) ...................................... 59
Figure 4.6: Two soot foils located between consecutive sets of orifice plates demonstrating the detonation
on bottom wall (A) and top wall (B) in ethylene-oxygen-60% nitrogen diluted mixture at 35.2 kPa (Test
643) ............................................................................................................................................................. 60
Figure 4.7: Multi wall detonation initiation in ethylene-oxygen-60% nitrogen diluted mixture with 55.2
kPa presented by frames filmed at 224,000 fps (Test 641) ......................................................................... 61
viii
Figure 4.8: Curved soot foil showing multiple detonation ignition points on tube wall in 50% BR (Test
644) ............................................................................................................................................................. 62
Figure 4.4.9: Video of multi-ignition points on the tube wall for ethylene-oxygen mixture with 43%
nitrogen dilution at 24.4 kPa initial pressure recorded at 224,000 fps (Test 645) ...................................... 63
Figure 4.10: Consecutive frames with 0.0025 ms time difference filmed at 400,000 fps demonstrating
continues detonation in ethylene-oxygen mixture without any dilution at 29.2 kPa (Test 655) ................. 64
Figure 4.11: Selected frames (every two frames) from side view video of continuous detonation in an
ethylene-oxygen mixture without any dilution at 24.6 kPa forming an X-T, indicating the constant
velocity of continuous detonation propagation. (Test 652) ........................................................................ 65
Figure 4.12: Curved soot foiled obtained from an ethylene-oxygen mixture without any dilution at 24.1
kPa showing the complex structure of continuous detonation propagation between two orifice plates (Test
649) ............................................................................................................................................................. 66
Figure 4.13: High speed video recorded at 300,000 fps showing fast flame propagation in 75% BR for
ethylene-oxygen mixture without any dilution at initial pressure of 5.7 kPa (Test 214) ............................ 68
Figure 4.14: Galloping detonation propagation in hydrogen-oxygen mixture with 70% argon dilution at
52.2 kPa presented as the frames of a video, recorded at 150,000 fps (Test 186) ...................................... 70
Figure 4.15: Evidence of detonation initiation on obstacle face due to the galloping detonation
propagation in an ethylene-oxygen mixture with no dilution at 7.3 kPa, obtained by a curved soot foil
(Test 55) ...................................................................................................................................................... 71
Figure 4.16: Side view video of detonation initiation on tube wall between to OPs, recorded from
ethylene-oxygen mixture without any dilution with 11.2 kPa at 200,000 fps (Test 210) ........................... 72
Figure 4.17: Curved soot foil obtained from a test with stoichiometric hydrogen-oxygen-70% argon at
72.8 kPa indicating detonation initiation on bottom side of the tube wall (Test 77) .................................. 73
Figure 4.18: Selected frames of a video recording detonation propagation of ethylene-oxygen mixture
without any dilution with 10.2 kPa initial pressure at 200,000 fps (Test 206) ........................................... 74
Figure 4.19: Video of multi detonation ignition on the tube wall in ethylene-oxygen with 70% argon
dilution mixture at 43.3 kPa, filmed at 200,000 fps (Test 223) .................................................................. 76
Figure 4.20: Multi ignition points initiated at tube wall captured by a plastic soot foil in ethylene-oxygen
mixture without dilution at 13.5 kPa (Test 67) ........................................................................................... 77
Figure 4.21: Side view of continuous detonation propagation of ethylene-oxygen mixture without any
dilution at 27.6 kPa captured at 400,000 fps (Test 73) ............................................................................... 78
Figure 4.22: Curved soot foil located between OPs 10 and 11 showing continuous detonation propagation
behavior in ethylene-oxygen mixture without any dilution at 27.6 (Test 73) ............................................. 79
ix
Figure 4.23: Video frames recorded at 200,000 fps from the side view of the combustion tube showing
ignition behind the flame front in ethylene-oxygen with 70% argon dilution mixture at 32.2 kPa. The
location of the flame front is marked as dashed curved lines (Test 221) .................................................... 80
Figure 4.24: Plot of average combustion velocity as a function of initial pressure for ethylene-oxygen
mixture with 43% nitrogen dilution. The DDT limit is indicated for both 50% BR and 75% BR ............. 81
Figure 4.25: Plot of normalized average velocity as a function of mixture reactivity presented by d/λ in
50% BR setup ............................................................................................................................................. 85
Figure 4.26: Plot of normalized average velocity as a function of mixture reactivity presented by d/λ in
75% BR setup ............................................................................................................................................. 86
Figure 4.27: Plot of velocity profiles along the cylindrical channel for 50% BR for a range of initial
pressures ...................................................................................................................................................... 88
Figure 4.28: Plot of velocity profiles along the cylindrical channel for 75% BR for a range of initial
pressures ...................................................................................................................................................... 90
Figure 4.29: High-speed video footage of detonation propagation of ethylene-oxygen mixture with 70%
argon dilution at 34.6 kPa in 75% BR. High degree of detonation propagation instability demonstrated by
these frames recorded at 150,000 fps (Test 179) ........................................................................................ 91
Figure 4.30:Profile of velocity along the tube for ethylene-oxygen mixture with 70% argon dilution at
34.6 kPa in 75% BR (Test 179) .................................................................................................................. 93
Figure 4.31: DDT run-up distance obtained from videos plotted over range of initial pressure for
hydrogen-oxygen mixture with 70% argon dilution in the 50% BR .......................................................... 94
Figure 4.32: Plots of XDDT//D as a function of reactivity of the mixture for both 50% and 75% BRs ....... 96
Figure 4.33: Comparison of the measured XDDT/D to the flame acceleration, based correlation in [53] . 98
Figure 4.34:Comparison of the measured XDDT/D in 50% BR setup with the correlation XDDT/D using
Equation 4.2 ................................................................................................................................................ 99
Figure 4.35:Comparison of the measured XDDT/D in 75% BR setup with the correlation XDDT/D using
Equation 4.2 .............................................................................................................................................. 100
Figure 5.1: Average combustion velocity plotted over initial pressure for the stoichiometric hydrogen
mixtures in 50% BR and 75% BR ............................................................................................................ 113
Figure 5.2: Average combustion velocity plotted over initial pressure for the stoichiometric ethylene
mixtures in 50% BR and 75% BR ............................................................................................................ 114
x
List of Tables
Table 3.1: Test mixtures where represents the diluent to oxygen mole ratio .......................................... 35
Table 3.2: Valve numbers and functions .................................................................................................... 39
Table 4.1: Initial pressure range for each propagation mode in all the mixtures in 50% BR ..................... 52
Table 4.2: Initial pressure range for each propagation mode in all the mixtures in 75% BR ..................... 67
Table 4.3: DDT limit for test mixtures used in the experiments ................................................................. 83
Table 4.4: Values of the n corresponding to power-law XDDT/D=c(d/)-n for all the mixtures ................... 97
Table 5.1: Calculated CJ detonation velocity and speed of sound in products for the stoichiometric
mixtures .................................................................................................................................................... 115
xi
List of Abbreviations
Abbreviations
BR Blockage Ratio
CFD Computational Fluid Dynamics
CJ Chapman-Jouguet
CMOS Complementary Metal-Oxide-Semiconductor
DC Direct Current
DDT Deflagration-to-Detonation Transition
FPS Frame Per Second
ID Inner Diameter
LED Light-Emitting Diode
OD Outer Diameter
OP Orifice Plate
RZL Reaction Zone Length
SATP Standard Ambient Pressure and Temperature
ZND Zeldovich von Neumann, and Döring
English Symbols
A Arrhenius constant
B Empirical constant in Arrhenius equation
c Speed of sound
𝑐𝑝 Specific heat (constant pressure)
𝑐𝑣 Specific heat (constant volume)
xii
d Opening diameter of the orifice plate
D Tube diameter
𝑑𝑐 Critical tube diameter
𝐸𝑎 Activation energy
H Enthalpy
ℎ𝑓𝑜 Enthalpy of formation
k Ratio of specific heats
𝐿𝑐 Length of detonation cell
M Mach number
𝑀𝐶𝐽 Mach number at CJ state
P Pressure
𝑃𝑖 Initial Pressure
q Heat transfer
q Average heat release
R Universal gas constant
t Time
T Temperature
U Wave velocity
𝑉𝑐 Average combustion front velocity along channel centerline
𝑊𝑐 Critical channel width
XDDT DDT run-up distance
xiii
Greek Symbols
Δi Induction zone length
λ Detonation cell width
σ Density ratio
1
Chapter 1
Introduction
A combustion wave propagates in two distinct modes. The subsonic mode of combustion
propagation is deflagration (commonly referred to as a flame), and the supersonic mode is
detonation. Deflagration propagation is governed by the heat and mass diffusion across the flame
front, where the speed of this propagation depends on the mixture transport properties. The flame
can accelerate due to the presence of turbulence, from a laminar deflagration propagating at a few
meters per second to a turbulent deflagration at a speed of hundreds of meters per second. A
deflagration is easily ignited in a combustible gas mixture with millijoules of energy deposition in
a spark, where the measured energy required for detonation initiation in a free cloud of the same
mixture is one to thousands of kilojoules, depending on the equivalence ratio. That is the reason
why real-life catastrophic explosions typically start from a weak ignition source. A slow-burning
deflagration can accelerate to a supersonic fast-flame and then transition to a detonation wave.
This transition is referred to as deflagration-to-detonation transition (DDT). A detonation consists
of a lead shock followed by a coupled reaction zone initiated by adiabatic shock heating. The lead
shock, that propagates at a speed of a thousand meters per second, compresses the unburned gas
ahead of it. This generates a high temperature and pressure region of unburned gas resulting in
auto-ignition of the mixture. The supersonic detonation generates very high dynamic overpressure
that poses a threat to industrial safety.
With the desire for industrial safety improvement, Mallard and Le Chatelier [1]
conducted the first study of flame acceleration and propagation phenomena in 1883. Their goal
was to determine the risk of uncontrolled detonation caused by an explosion in the coal mines.
With the growing demand for alternative environmentally friendly fuels, the safety of their
production, transportation, storage, and usage was the driving force of explosion prevention
2
studies. Many industrial catastrophies, such as the accident at the Three Mile Island Nuclear plant
in 1979, and the more recently the Buncefield Fuel Depot explosion in 2005, forced more
investment in DDT and detonation research. Besides the safety concern driving the reserach in
this field, the advantage of the higher efficiency of nearly constant volume combustion has
attracted research into Pulse Detonation Engines (PDEs) and Rotating Detonation Engines
(RDEs) in recent years
To facilitate flame acceleration, repeating orifice plates were used inside tubes first by
Chapman and Wheeler in 1927 [2]. Numerous detonation studies with obstructed tubes have been
done using non-optical diagnostic techniques. In one of the primary studies, the detonation limit
was classified using average flame velocity measured by flame time of arrival technique using
pressure transducers along the tube [3]. To capture detonation structure, soot foils were used in
DDT and detonation propagation studies [4]. Orifice plates with different geometries were
studied to find the blockage ratio effect on DDT [5]. Schlieren photography was used in many
recent studies in rectangular tubes to visually study the detonation propagation [6] [7] [8] [9]. Due
to the curvature, schlieren photography could not be used in cylindrical tubes. High-speed
photography was used in cylindrical tubes to classify quasi-steady detonation propagation [10].
The previous study [10] did not consider the flame acceleration and initial onset of
detonation, i.e., DDT. The primary objectives of this study is to look at the initiation mechanism
for the initial onset of detonation, and to measure the DDT run-up distance based on high–speed
video data. Three synchronized, high-speed CMOS cameras were used to record the combustion
propagation in the fully optically accessible acrylic combustion tube. Two sets of orifice plates
with different blockage ratios were used in this study. Soot foils were used in selected tests to
confirm the location and presence of detonation propagation as well as donation cell size
measurement. The secondary objective was to investigate the effect of cell regularity on the DDT
limit and the detonation propagation mechanism.
3
Chapter 2
Detonation Theory and literature review
The topic of deflagration to detonation transition (DDT) and detonation propagation in a
obstacle filled duct involve many complex fundamental phenomena. This chapter provides a
review of basic one-dimensional detonation theory and the complex three-dimensional detonation
structure. Other detonation phenomenon, such as the effect of the duct boundary condition on
detonation propagation and shock reflection, are also reviewed. Finally, the basic phenomenon of
DDT and DDT experiments are reviewed.
2.1 CJ Theory
After the discovery of detonation phenomenon by Le Chȃtelier in 1883 [1], Chapman
[11] and Jouguet [12] independently developed a model to calculate the detonation front velocity.
The Chapman-Jouguet (CJ) Theory solves the conservation of mass, momentum, and energy
equations for a defined control volume based on the Rankine [13] and Hugoniot [14] analysis of
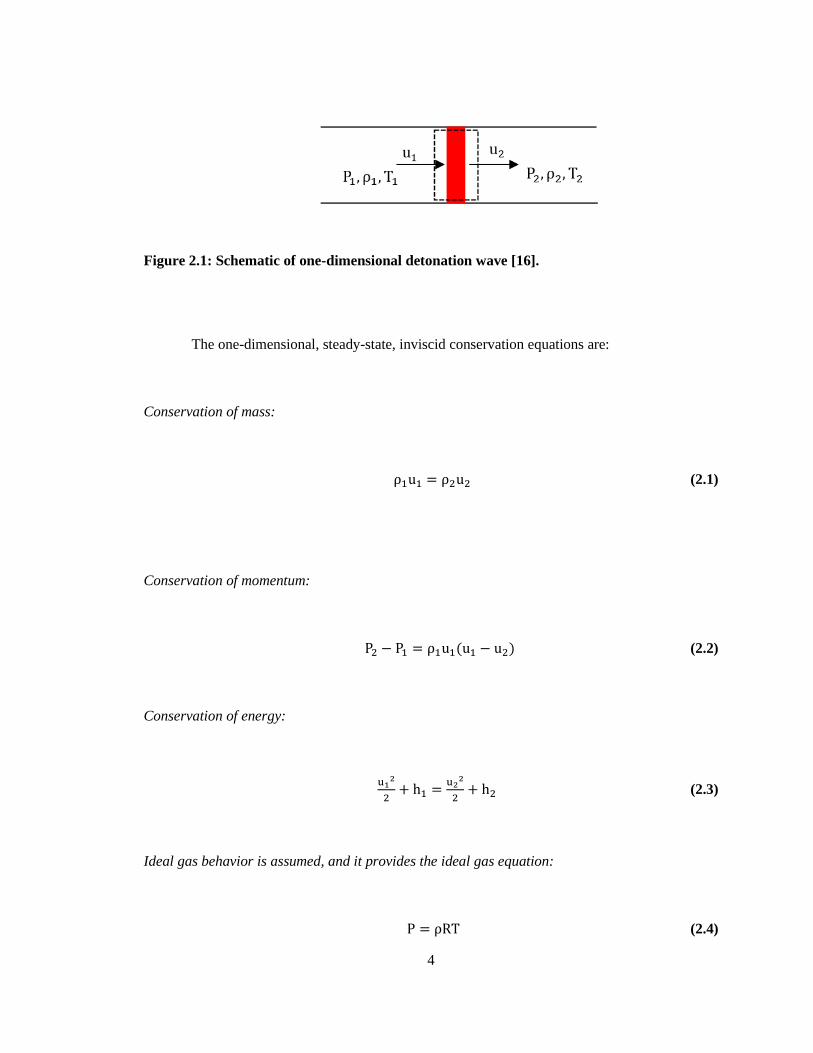
non-reacting gases. They modeled detonations as a one-dimensional compressible flow using a
control volume with an inlet and outlet assuming steady-state inviscid flow. In their model, the
energy release of combustion is assumed to occur immediately after adiabatic shock wave heating
in a constant area duct. Their model can be seen in Figure 2.1, where State 1 denotes reactants
entering the control volume and State 2 the combustion products exiting the control volume
(indicated by the dashed line). It is assumed that State 2 is at chemical equilibrium. In the model
presented in Figure 2.1, the frame of reference is fixed to the combustion wave.
4
Figure 2.1: Schematic of one-dimensional detonation wave [16].
The one-dimensional, steady-state, inviscid conservation equations are:
Conservation of mass:
ρ1u1 = ρ2u2 (2.1)
Conservation of momentum:
P2 − P1 = ρ1u1(u1 − u2) (2.2)
Conservation of energy:
u12
2+ h1 =
u22
2+ h2 (2.3)
Ideal gas behavior is assumed, and it provides the ideal gas equation:
P = ρRT (2.4)
5
Where enthalpy and heat release, h and q, are defined as:
h = h0f + Cp(T − T0) (2.5)
q = h0f1 + h0f2 (2.6)
The conservation of energy equation can be rewritten as:
u12
2+ cp1T1 + q =
u22
2+ cp2T2 (2.7)
The Rayleigh equation (2.8) is obtained by combining the conservation of mass (2.1) and
momentum equations (2.2).
P2
P1= −
ρ1
ρ2(ρ1u1
2
P1)(1 +
ρ1u12
P2) (2.8)
The Rayleigh equation describes the thermodynamic path that reactants follow in the
conversion to products when plotted on a pressure-volume diagram, see Figure 2.2. The slope of
this straight line with the pressure ratio and the inverse density ratio as variables is proportional to
the square of the front wave velocity for known initial conditions. The Hugoniot equation (2,9) is
obtained by combining the conservation of momentum (2,2) and energy equations (2,3)
𝐶𝑝𝑇2 − (𝐶𝑝𝑇1 + 𝑞) =𝑃2−𝑃1
2(1
𝜌1+
1
𝜌2) (2.9)
6
Assuming constant specific heats across the detonation wave, i.e, 𝑘 = 𝑘1 = 𝑘2 =𝐶𝑝
𝐶𝑣:
(𝑘
𝑘−1) [(
𝑃2
𝑃1) (
𝜌1
𝜌2) − 1] −
(𝑘−1)𝑞
𝐶𝑣𝑇1=
1
2(𝜌1
𝜌2+ 1)(
𝑃2
𝑃1− 1) (2.10)
This equation gives all the possible end-states for a specified heat release q. For no heat
release, equation (2.10) defines the Shock Hugoniot; and with chemical reaction resulting in heat
release the Equilibrium Hugoniot can be obtained.
This system of equations has 5 unknowns (u1, u2, P2, T2 and ρ2) and 4 equations
(Equations 2.1, 2.2, 2.3, and 2.4) with the given initial conditions (P0, T0 and ρ0). The end state
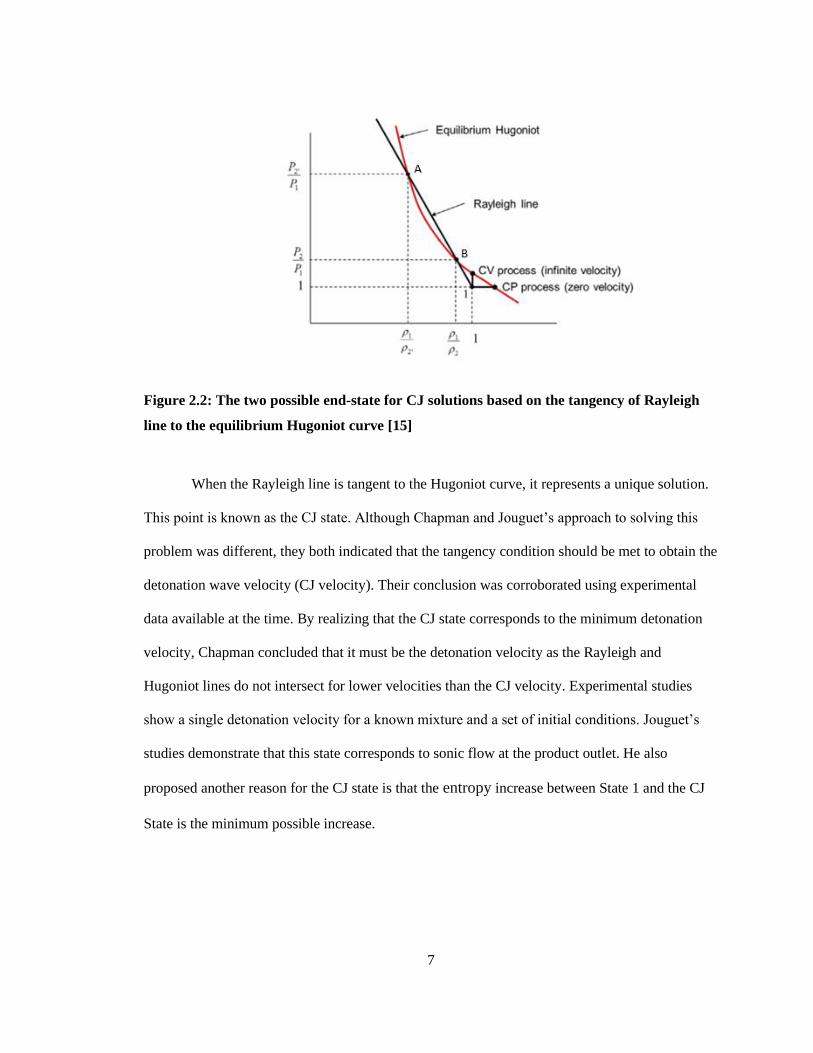
shown in Figure 2.1 must satisfy Rayleigh and Hugoniot equations. Figure 2.2 shows the
Rayleigh and Hugoniot lines and the possibility of the end states. In general, the Rayleigh line has
two intersection points with the Hugoniot line for a given front velocity (u1). They are labeled as
State A and State B representing the strong and weak detonation cases, respectively. In Case A,
the flow in products is subsonic relative to the detonation wave. This case is unstable because the
generated expansion waves at the back wall will catch the lead shock and weaken it. In case B,
the flow in products is supersonic relative to the detonation wave (M2 > 1). This case is
impossible due to the second law of thermodynamic as it represents a decrease in entropy from
State 1 to State B.
7
Figure 2.2: The two possible end-state for CJ solutions based on the tangency of Rayleigh
line to the equilibrium Hugoniot curve [15]
When the Rayleigh line is tangent to the Hugoniot curve, it represents a unique solution.
This point is known as the CJ state. Although Chapman and Jouguet’s approach to solving this
problem was different, they both indicated that the tangency condition should be met to obtain the
detonation wave velocity (CJ velocity). Their conclusion was corroborated using experimental
data available at the time. By realizing that the CJ state corresponds to the minimum detonation
velocity, Chapman concluded that it must be the detonation velocity as the Rayleigh and
Hugoniot lines do not intersect for lower velocities than the CJ velocity. Experimental studies
show a single detonation velocity for a known mixture and a set of initial conditions. Jouguet’s
studies demonstrate that this state corresponds to sonic flow at the product outlet. He also
proposed another reason for the CJ state is that the entropy increase between State 1 and the CJ
State is the minimum possible increase.
8
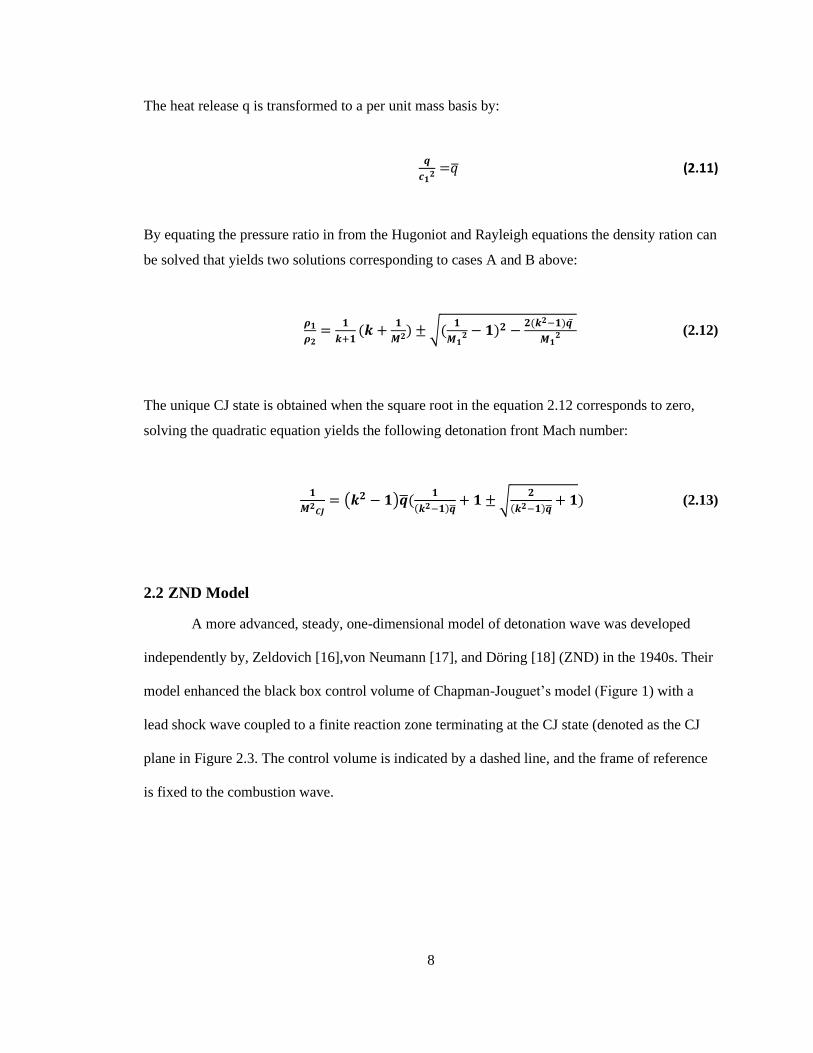
The heat release q is transformed to a per unit mass basis by:
𝒒
𝒄𝟏𝟐 =�̅� (2.11)
By equating the pressure ratio in from the Hugoniot and Rayleigh equations the density ration can
be solved that yields two solutions corresponding to cases A and B above:
𝝆𝟏
𝝆𝟐=
𝟏
𝒌+𝟏(𝒌 +
𝟏
𝑴𝟐) ± √(𝟏
𝑴𝟏𝟐 − 𝟏)𝟐 −
𝟐(𝒌𝟐−𝟏)𝒒
𝑴𝟏𝟐 (2.12)
The unique CJ state is obtained when the square root in the equation 2.12 corresponds to zero,
solving the quadratic equation yields the following detonation front Mach number:
𝟏
𝑴𝟐𝑪𝑱= (𝒌𝟐 − 𝟏)�̅�(
𝟏
(𝒌𝟐−𝟏)�̅�+ 𝟏 ± √
𝟐
(𝒌𝟐−𝟏)�̅�+ 𝟏) (2.13)
2.2 ZND Model
A more advanced, steady, one-dimensional model of detonation wave was developed
independently by, Zeldovich [16],von Neumann [17], and Döring [18] (ZND) in the 1940s. Their
model enhanced the black box control volume of Chapman-Jouguet’s model (Figure 1) with a
lead shock wave coupled to a finite reaction zone terminating at the CJ state (denoted as the CJ
plane in Figure 2.3. The control volume is indicated by a dashed line, and the frame of reference
is fixed to the combustion wave.
9
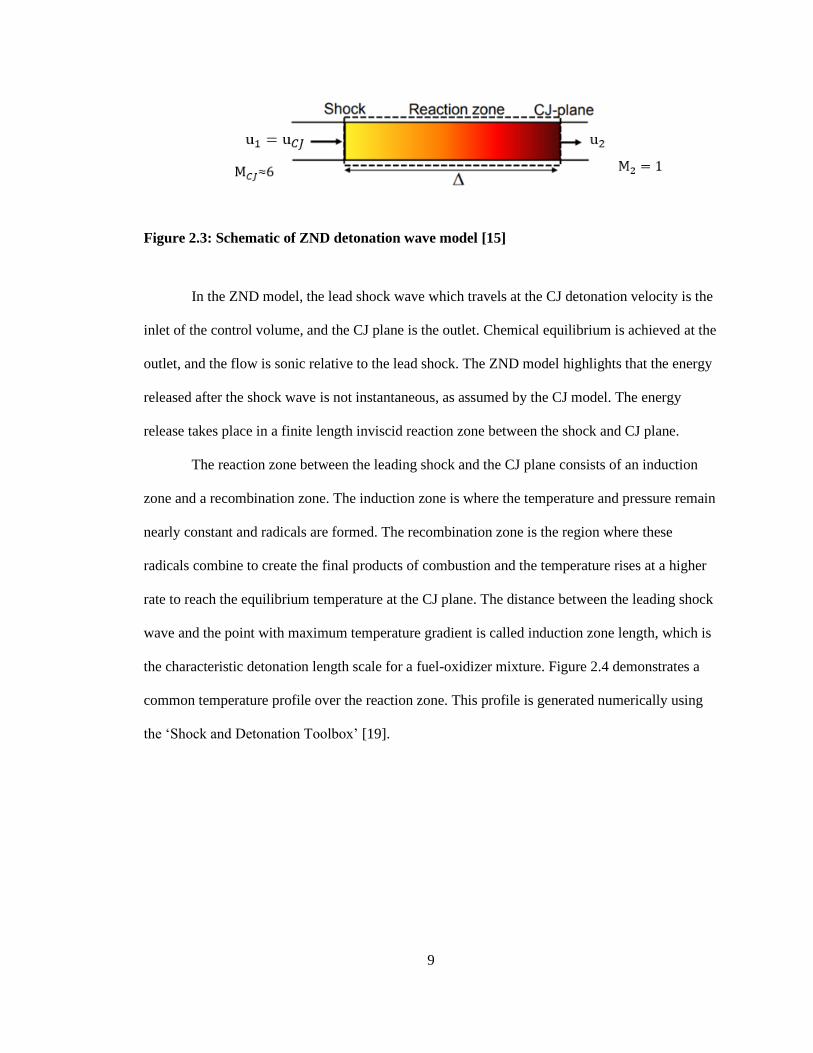
Figure 2.3: Schematic of ZND detonation wave model [15]
In the ZND model, the lead shock wave which travels at the CJ detonation velocity is the
inlet of the control volume, and the CJ plane is the outlet. Chemical equilibrium is achieved at the
outlet, and the flow is sonic relative to the lead shock. The ZND model highlights that the energy
released after the shock wave is not instantaneous, as assumed by the CJ model. The energy
release takes place in a finite length inviscid reaction zone between the shock and CJ plane.
The reaction zone between the leading shock and the CJ plane consists of an induction
zone and a recombination zone. The induction zone is where the temperature and pressure remain
nearly constant and radicals are formed. The recombination zone is the region where these
radicals combine to create the final products of combustion and the temperature rises at a higher
rate to reach the equilibrium temperature at the CJ plane. The distance between the leading shock
wave and the point with maximum temperature gradient is called induction zone length, which is
the characteristic detonation length scale for a fuel-oxidizer mixture. Figure 2.4 demonstrates a
common temperature profile over the reaction zone. This profile is generated numerically using
the ‘Shock and Detonation Toolbox’ [19].
10
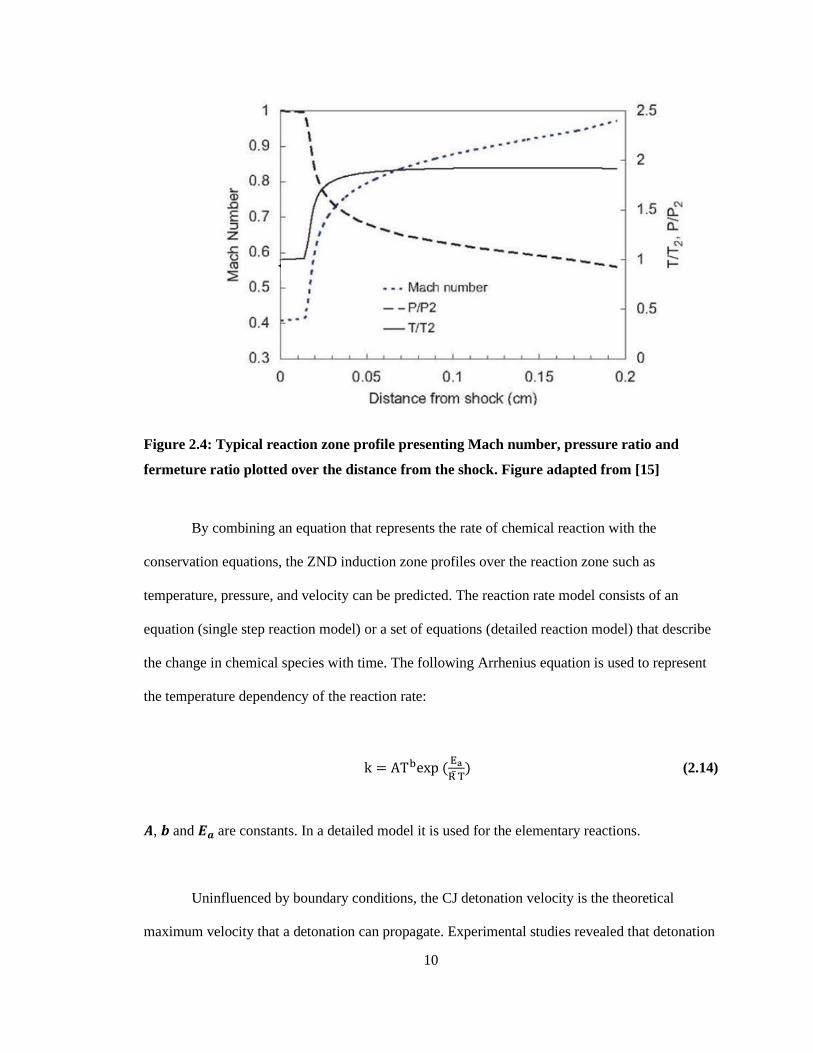
Figure 2.4: Typical reaction zone profile presenting Mach number, pressure ratio and
fermeture ratio plotted over the distance from the shock. Figure adapted from [15]
By combining an equation that represents the rate of chemical reaction with the
conservation equations, the ZND induction zone profiles over the reaction zone such as
temperature, pressure, and velocity can be predicted. The reaction rate model consists of an
equation (single step reaction model) or a set of equations (detailed reaction model) that describe
the change in chemical species with time. The following Arrhenius equation is used to represent
the temperature dependency of the reaction rate:
k = ATbexp (Ea
R̅ T) (2.14)
𝑨, 𝒃 and 𝑬𝒂 are constants. In a detailed model it is used for the elementary reactions.
Uninfluenced by boundary conditions, the CJ detonation velocity is the theoretical
maximum velocity that a detonation can propagate. Experimental studies revealed that detonation
11
waves in channels travel below the theoretical CJ speed. The results showed that in smooth tubes
with a large diameter, the difference between the measured detonation velocity and the CJ
detonation velocity is inversely proportional to the mixture initial pressure and the combustion
channel diameter [20].
Zeldovich argued that heat and momentum losses from the reaction zone to the
surrounding walls of the channel causes this measured velocity deficit from the theoretical CJ
velocity [16]. As a result, the velocity deficit is proportional to the reaction zone length. This
means that the factors that change the reaction zone length, such as a change in initial pressure,
affect the velocity deficit. He showed analytically that this velocity deficit is proportional to the
wall drag divided by the momentum flux.
2.3 3D Structure
The one-dimensional CJ and ZND models are useful for predicting the detonation
parameters and velocity deficit. However, later experiments with the help of more advanced
techniques uncovered that the detonation wave structure is three-dimensional. White’s [21]
interferometry images showed turbulence behind the shock waves. Denisov and Troshin's [22]
soot foil results reveal that detonation waves had a complex structure. A detonation front consists
of a leading shock wave with shock waves that travel along the shock in the transverse direction,
where they meet is known as a triple point. Actually, the triple point divides the lead shock into
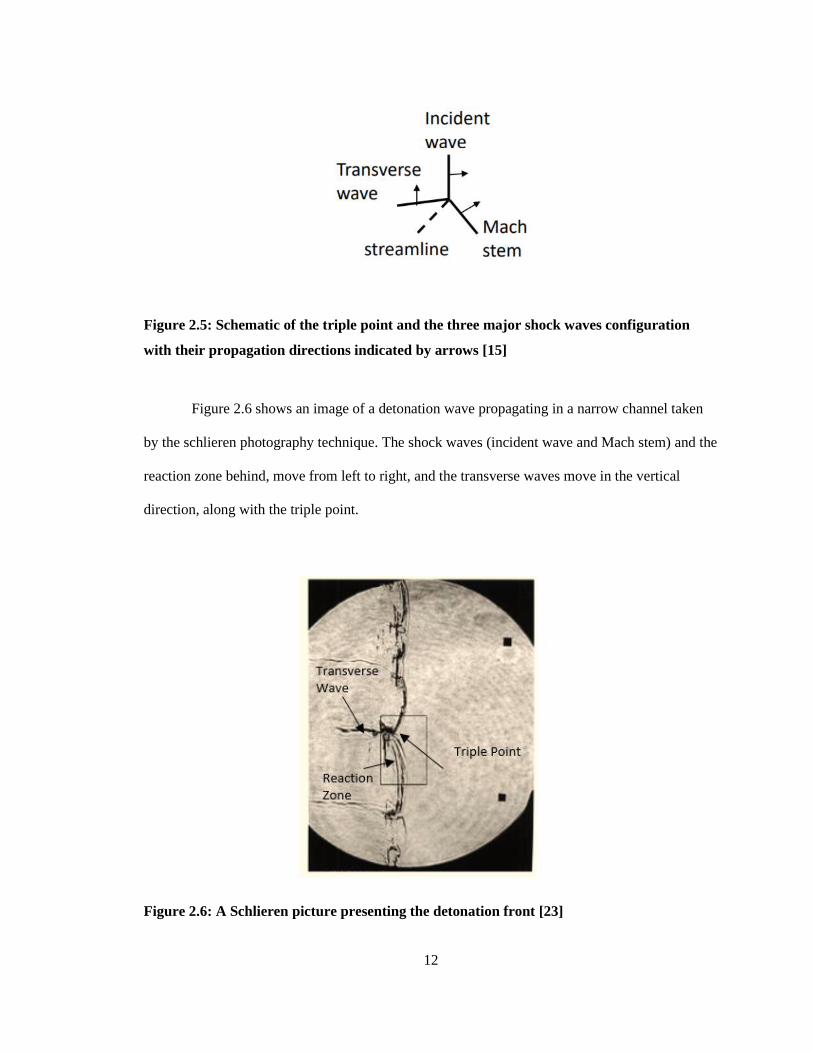
two, the Mach stem and the incident wave, as shown schematically in Figure 2.5. Also shown in
Figure 2.5 is a streamline that separates the flow that passes through these two shocks. Denisov
and Troshin [22] proposed that the detonation front consists of a multitude of these triple points,
moving in alternate directions, based on the trajectory lines left by the triple points on the soot
foil.
12
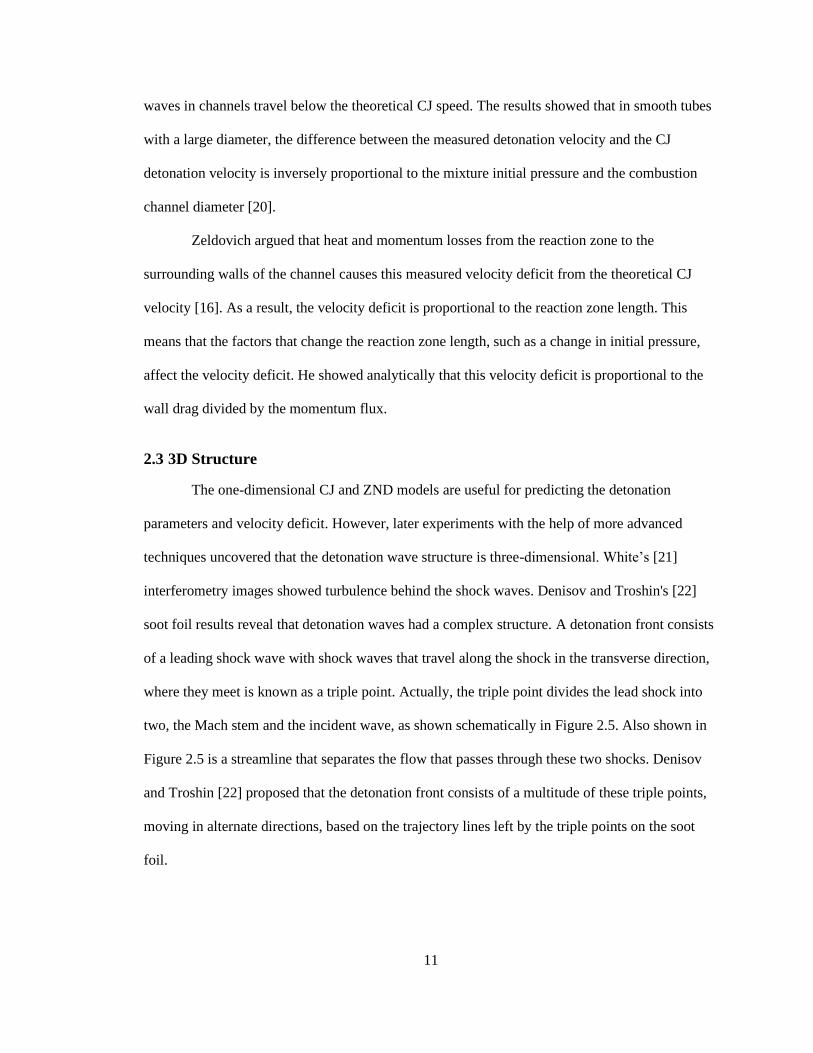
Figure 2.5: Schematic of the triple point and the three major shock waves configuration
with their propagation directions indicated by arrows [15]
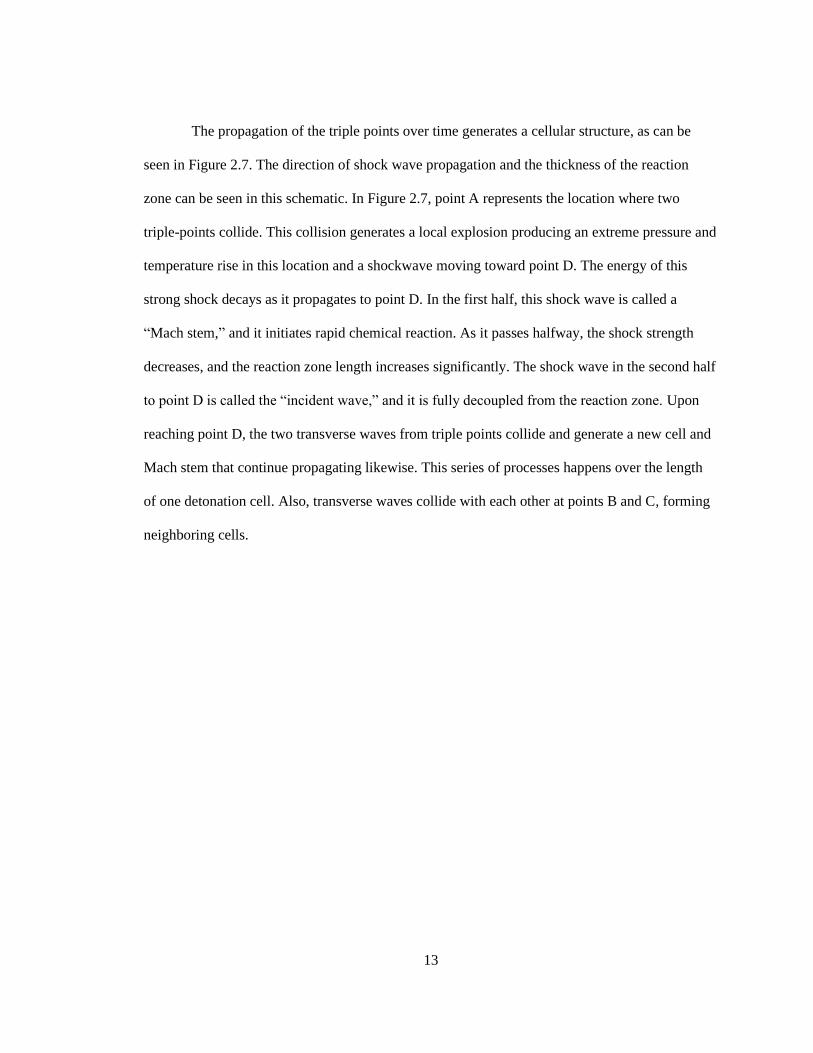
Figure 2.6 shows an image of a detonation wave propagating in a narrow channel taken
by the schlieren photography technique. The shock waves (incident wave and Mach stem) and the
reaction zone behind, move from left to right, and the transverse waves move in the vertical
direction, along with the triple point.
Figure 2.6: A Schlieren picture presenting the detonation front [23]
13
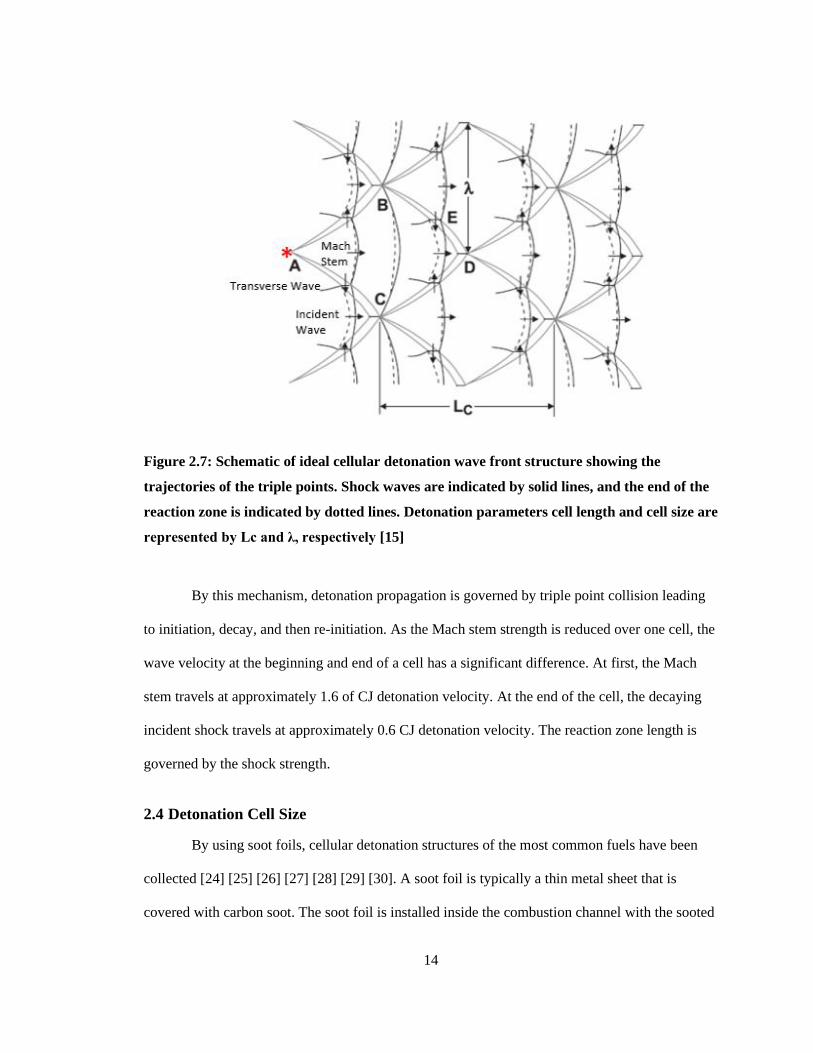
The propagation of the triple points over time generates a cellular structure, as can be
seen in Figure 2.7. The direction of shock wave propagation and the thickness of the reaction
zone can be seen in this schematic. In Figure 2.7, point A represents the location where two
triple-points collide. This collision generates a local explosion producing an extreme pressure and
temperature rise in this location and a shockwave moving toward point D. The energy of this
strong shock decays as it propagates to point D. In the first half, this shock wave is called a
“Mach stem,” and it initiates rapid chemical reaction. As it passes halfway, the shock strength
decreases, and the reaction zone length increases significantly. The shock wave in the second half
to point D is called the “incident wave,” and it is fully decoupled from the reaction zone. Upon
reaching point D, the two transverse waves from triple points collide and generate a new cell and
Mach stem that continue propagating likewise. This series of processes happens over the length
of one detonation cell. Also, transverse waves collide with each other at points B and C, forming
neighboring cells.
14
Figure 2.7: Schematic of ideal cellular detonation wave front structure showing the
trajectories of the triple points. Shock waves are indicated by solid lines, and the end of the
reaction zone is indicated by dotted lines. Detonation parameters cell length and cell size are
represented by Lc and λ, respectively [15]
By this mechanism, detonation propagation is governed by triple point collision leading
to initiation, decay, and then re-initiation. As the Mach stem strength is reduced over one cell, the
wave velocity at the beginning and end of a cell has a significant difference. At first, the Mach
stem travels at approximately 1.6 of CJ detonation velocity. At the end of the cell, the decaying
incident shock travels at approximately 0.6 CJ detonation velocity. The reaction zone length is
governed by the shock strength.
2.4 Detonation Cell Size
By using soot foils, cellular detonation structures of the most common fuels have been
collected [24] [25] [26] [27] [28] [29] [30]. A soot foil is typically a thin metal sheet that is
covered with carbon soot. The soot foil is installed inside the combustion channel with the sooted
15
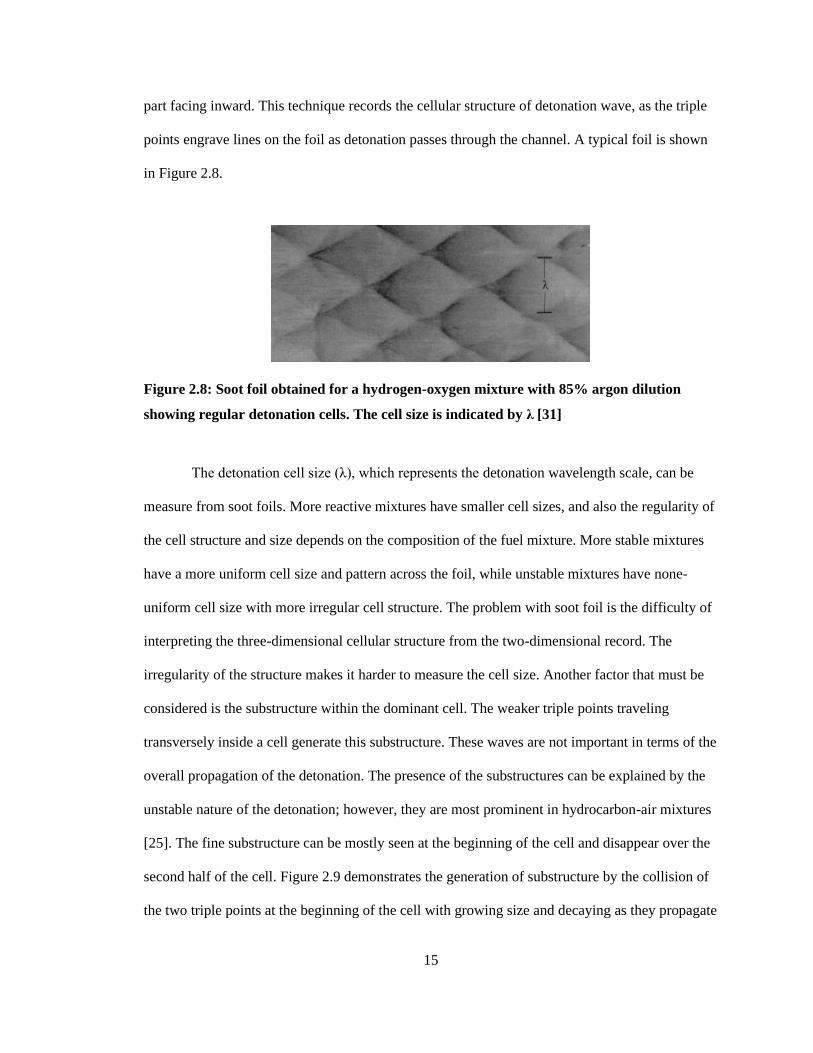
part facing inward. This technique records the cellular structure of detonation wave, as the triple
points engrave lines on the foil as detonation passes through the channel. A typical foil is shown
in Figure 2.8.
Figure 2.8: Soot foil obtained for a hydrogen-oxygen mixture with 85% argon dilution
showing regular detonation cells. The cell size is indicated by λ [31]
The detonation cell size (λ), which represents the detonation wavelength scale, can be
measure from soot foils. More reactive mixtures have smaller cell sizes, and also the regularity of
the cell structure and size depends on the composition of the fuel mixture. More stable mixtures
have a more uniform cell size and pattern across the foil, while unstable mixtures have none-
uniform cell size with more irregular cell structure. The problem with soot foil is the difficulty of
interpreting the three-dimensional cellular structure from the two-dimensional record. The
irregularity of the structure makes it harder to measure the cell size. Another factor that must be
considered is the substructure within the dominant cell. The weaker triple points traveling
transversely inside a cell generate this substructure. These waves are not important in terms of the
overall propagation of the detonation. The presence of the substructures can be explained by the
unstable nature of the detonation; however, they are most prominent in hydrocarbon-air mixtures
[25]. The fine substructure can be mostly seen at the beginning of the cell and disappear over the
second half of the cell. Figure 2.9 demonstrates the generation of substructure by the collision of
the two triple points at the beginning of the cell with growing size and decaying as they propagate
16
through the first half of the cell and disappears at roughly midspan when the detonation velocity
reaches approximately the CJ velocity.
Figure 2.9 schematic of detonation velocity variation over the length of a detonation cell
[15]
2.5 Critical Tube Diameter
The interaction of a detonation with an orifice plate is an important phenomenon that
occurs in the present experiments, and the critical tube diameter is an important
fundamental experiment. The critical tube diameter is measured experimentally and
represents the minimum tube diameter that a detonation wave can successfully transmit
into an unconfined space filled with the same gaseous mixture. As the detonation enters
the unconfined space, expansion waves form at the corner causing the detonation wave to
diffract. At the tube exit, these expansion waves propagate from the tube diameter
17
towards the tube centerline, reducing the post-shock temperature and slowing the
chemical reaction rate. This increases the reaction zone length, and eventually decouples
the detonation wave into a lead shock wave and trailing flame. The detonation wave
progressively fails from the outside towards the centerline. The detonation completely
fails if the tube diameter is smaller than the critical tube diameter and the expansion
waves reaches the centerline and the leading shock is fully decoupled from the reaction
zone, referred to as the sub-critical condition. Figure 2.10a demonstrates this via a soot
foil showing the diffraction of a detonation wave from a duct into a half-circle shaped
vessel. Detonation failure is evident by the breakdown in the cellular structure coming
out of the duct.
Figure 2.10b shows the super-critical condition where tube diameter is larger than the
critical diameter resulting in the survival of the detonation to the diameter of the receiver
vessel. In this case, the expansion resulted in detonation wave diffraction but the
curvature was insufficient to completely decouple the reaction zone from the leading
shock.
Figure 2.10: Entering of detonation into an unconfined space captured by open shutter
photography technique where a) detonation fails completely in the sub-critical case, and b)
detonation reinitiates in the supercritical case [32]
18
If the tube diameter is just larger than the critical tube diameter, the leading shock and
reaction zone decouple from each other but detonation re-initiation occurs. A local explosion
takes place in the compressed gas between the decupled lead shock and the reaction zone, that
transitions to a detonation that propagate in this region and reforms the detonation front.
Zeldovich [33] was the first to study the concept of critical tube diameter in 1957. He
concluded that there is a relation between the critical tube diameter and the ZND induction zone
length. Based on Schelkin and Troshin's [34] studies, Mitrofanov and Soloukhin [35] proposed a
correlation between critical tube diameter and the detonation cell size. Their experiments were
conducted in a cylindrical tube using low-pressure acetylene-oxygen mixtures. This correlation
was found to be approximately 𝑑𝑐 = 13λ in their investigations. Knystautas et al. [36] later
showed that this correlation holds true for most common fuel-air mixtures. It is well established
that the critical tube diameter represents a condition where confinement boundary conditions do
not influence the detonation propagation. Although the experiment has been successfully
simulated using CFD, there is currently no theory that can predict the critical tube diameter.
This correlation was also studied in a rectangular channel with critical channel width (𝑤𝑐)
corresponding to the narrow dimension of the channel. It was found by Mitrofanov and Soloukhin
[35] and Edwards et al. [37] showed that 𝑤𝑐= 10λ compared to 𝑑𝑐 ≈ 13λ for round tubes. It was
proposed that this difference between rectangular and cylindrical tubes is because two-
dimensional diffraction produces a lower detonation curvature than the three-dimensional
diffraction from a tube.
Liu et al. [38] experiment in 1984 focused on determining the equivalence between tests
in which a detonation propagates through a round orifice plate into an unconfined space and tests
that a detonation propagates from a smooth round tube (with the same diameter as the orifice
plate) into an unconfined space. They used stoichiometric hydrogen-oxygen and ethylene-oxygen
mixtures with a different amount of nitrogen dilution. The opening shape of the orifice plate was
19
also varied in their experiments. They found that for small aspect ratio rectangular openings, the
critical condition is 𝑑ℎ=A×13λ where 𝑑ℎ is the hydraulic diameter (𝑑ℎ=4 × cross-section/wetted
perimeter) and A is a coefficient based on the number of the sides of an obstacle plate geometry;
while for large aspect ratio with a rectangular opening, the critical condition is 𝑑ℎ= 3λ. Their
finding did not agree with the previous finding of Mitrofanov and Soloukhin [35] and Edwards
and al. [37].
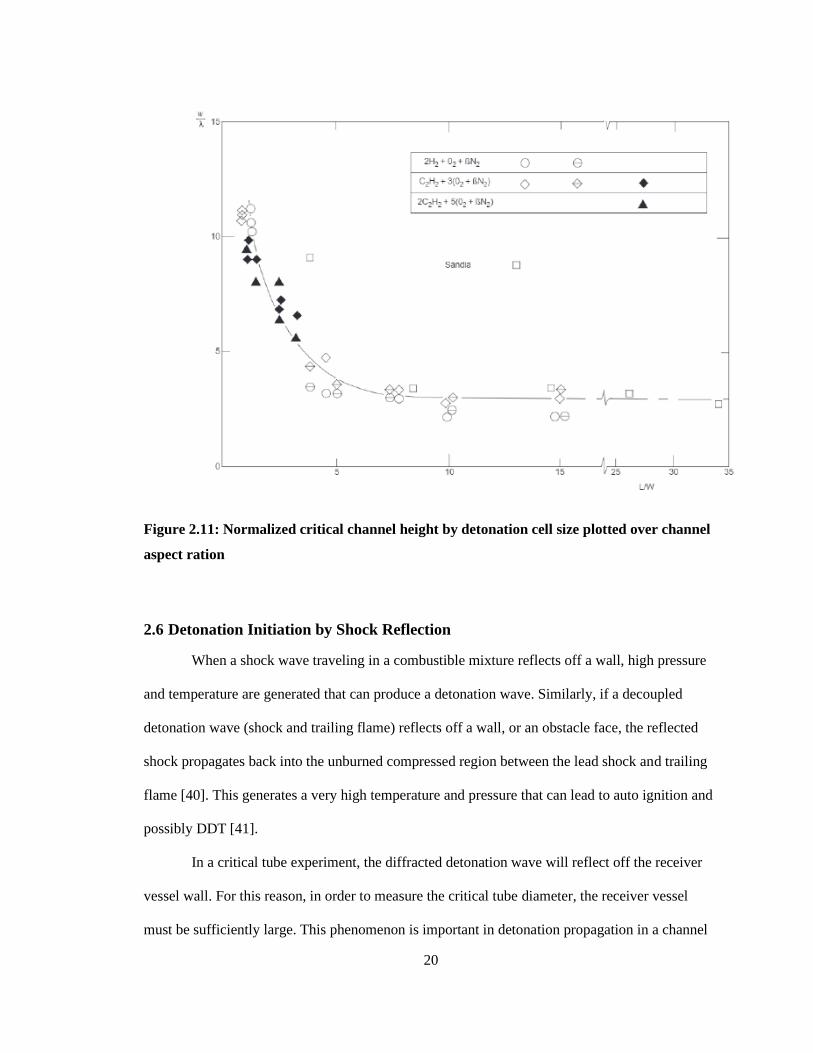
Enedick et al. [39] comprehensively studied the effect of a two-dimensional versus a
three-dimensional geometry on critical channel width to find an answer to this discrepancy. They
used hydrogen-air and acetylene air mixtures in a rectangular tube. The height of this tube was
adjustable and variable. They found that 𝑤𝑐=3λ in a true two-dimensional case where an aspect
ratio(L/w) approaching infinity (for aspect ratios of approximately 5 to 34). This confirmed the
findings of Liu et al [38]. For an aspect ratio of 1, representing the square channel, the 𝑤𝑐 ≈ 10λ
was found. Figure 2.11 shows a plot of their experimental results.
20
Figure 2.11: Normalized critical channel height by detonation cell size plotted over channel
aspect ration
2.6 Detonation Initiation by Shock Reflection
When a shock wave traveling in a combustible mixture reflects off a wall, high pressure
and temperature are generated that can produce a detonation wave. Similarly, if a decoupled
detonation wave (shock and trailing flame) reflects off a wall, or an obstacle face, the reflected
shock propagates back into the unburned compressed region between the lead shock and trailing
flame [40]. This generates a very high temperature and pressure that can lead to auto ignition and
possibly DDT [41].
In a critical tube experiment, the diffracted detonation wave will reflect off the receiver
vessel wall. For this reason, in order to measure the critical tube diameter, the receiver vessel
must be sufficiently large. This phenomenon is important in detonation propagation in a channel
21
with obstacles because the interaction between the diffracted detonation wave and the channel
wall can lead to detonation initiation. Pantow et al. [40] used schlieren photography and two
connected rectangular channels with different heights to study the effect of detonation diffraction
and shock reflection leading to re-initiation of the detonation, see Figure 2.12. They used
stoichiometric hydrogen-oxygen mixtures with varying amounts of nitrogen and argon dilution to
investigate the effect of cell regularity on the results. In their setup, detonation was formed in the
smaller channel and then propagated into the larger channel. Two-dimensional detonation
diffraction was observed with the reflection of shocks from the bottom and top wall of the larger
rectangular tube. They measured the critical (maximum) receiver channel height (ℎ𝑐), where the
detonation continued to propagate.
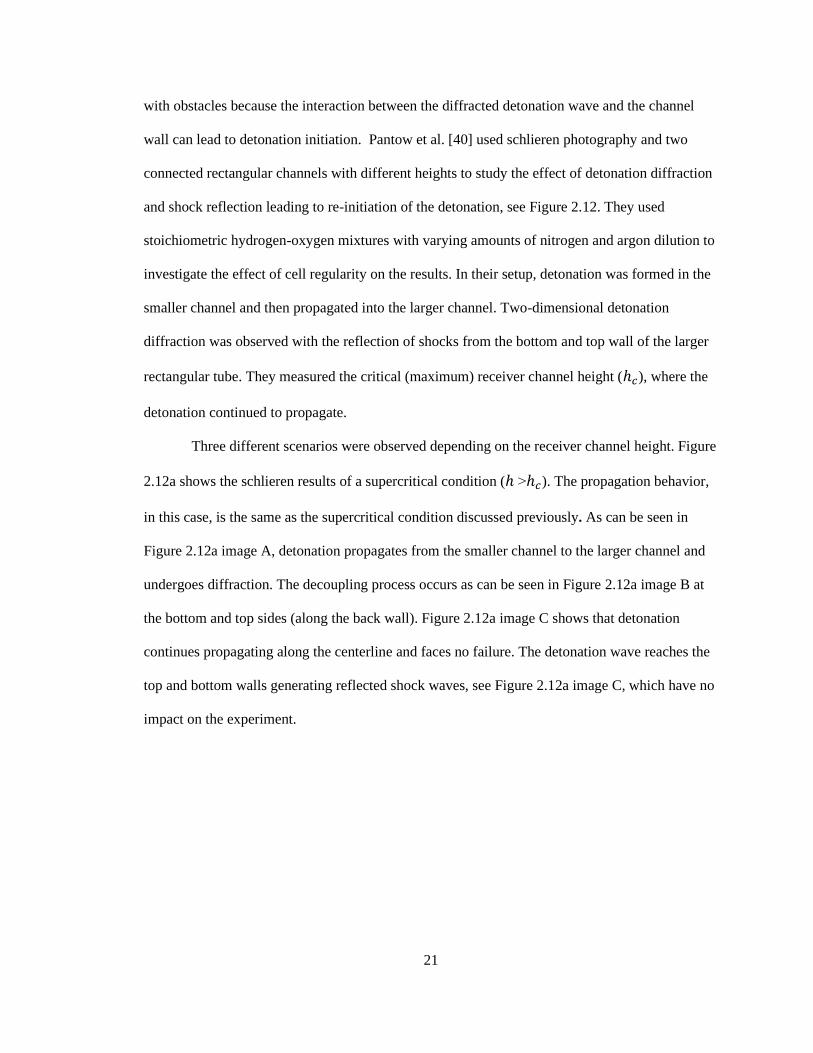
Three different scenarios were observed depending on the receiver channel height. Figure
2.12a shows the schlieren results of a supercritical condition (ℎ ˃ℎ𝑐). The propagation behavior,
in this case, is the same as the supercritical condition discussed previously. As can be seen in
Figure 2.12a image A, detonation propagates from the smaller channel to the larger channel and
undergoes diffraction. The decoupling process occurs as can be seen in Figure 2.12a image B at
the bottom and top sides (along the back wall). Figure 2.12a image C shows that detonation
continues propagating along the centerline and faces no failure. The detonation wave reaches the
top and bottom walls generating reflected shock waves, see Figure 2.12a image C, which have no
impact on the experiment.
22
Figure 2.12: Sequences of Schlieren images showing a) supper critical case where the failing
detonation reinitiated by transverse waves, b) the case where the failed detonation
reinitiated by transverse waves Mach reflection on the walls, and c) the complete failure of
detonation due to expansion [42]
Figure 2.12b provides schlieren images of a subcritical channel height condition. As can
be seen in Figure 2.12b image B, diffraction causes the detonation wave to completely fail, the
reaction zone and leading shock are decoupled at the centerline. The shock reflection produces a
detonation wave that propagates along the top and bottom wall, see Figure 2.12b image C. The
detonation wave also propagates transversely in the compressed gas region between the
decoupled reaction zone and leading shock. Figure 2.12c presents the last scenario in which the
reflected shock could not re-initiate the detonation wave.
23
2.7 Flame Acceleration and DDT
Spark ignition, or the autoignition due to the contact with hot surface, of a mixture results
in a relatively slow flame (deflagration). Under certain circumstances, this flame can accelerate
and transition to detonation. This phenomenon is known as deflagration-to-detonation transition,
or DDT. It is also possible that a detonation wave decouples into a lead shock followed by a
combustion front, i.e., transition of detonation combustion back to deflagration. This is known as
detonation failure.
A flame can accelerate and transition to detonation inside of a tube. Shchelkin [43]
realized that the increase in the flame surface area, and thus volumetric burning rate, caused by
the turbulence in the unburned gas ahead of the flame can lead to flame acceleration. For
example, the turbulent boundary layer in the unburned gas ahead of the flame can produce flame
acceleration. To amplify this mechanism, he proposed using a metal coil placed inside of the tube
to enhance turbulence. This metal coil is called a “Shchelkin spiral” and is still used today to
promote flame acceleration.
It is now known that any obstruction placed inside of the tube will result in flame
acceleration. Flame acceleration results from the interaction of a flame with turbulence generated
by an obstruction, via mechanisms that are specific to the initial and boundary conditions of the
domain. Ciccarelli and Dorofeev [20] have discussed the relationship between most of flame
properties with the flame acceleration.
With the presence of obstruction, instabilities, i.e., Rayleigh–Taylor (RT) and Kelvin–
Helmholtz (KH), may impact flame propagation by causing the flame surface to wrinkle. The
former occurs when an interface, i.e. a flame, accelerates in the direction of heavy to light
(reactants to products), and the latter is an inviscid shear instability [8] [11]. A sudden
acceleration of the flame over an obstacle can trigger these two instabilities. Also, acceleration
occurs when a shock wave interacts with a flame, this type of instability is called Richtmyer–
24
Meshkov (RM) instability. In a channel with obstacles, the increase of the flame surface is caused
by flow contraction through an opening and the generation of flame roughness due to RT, KH,
and RM instabilities. Several studies and reviews [16] [44] on premixed turbulent flames have
investigated this behavior experimentally, numerically, and analytically. As described by
Ciccarelli and Dorofeev [20], many investigators have come up with correlations that provide
turbulent flame velocity as a function of dimensionless parameters defining properties of the
mixture as well as the scale and intensity of the turbulence.
Repeating orifice plates were firstly used by Chapman and Wheeler [2] as an obstruction
in a tube. In their study in 1972, they realized a significantly faster flame acceleration can be
generated using these orifice plates with one tube diameter space between them. Compared to
their previous experiments, the flame acceleration was 40 times greater for methane-air mixture.
For the average combustion front velocity measurement in these early studies, non-optical time-
of-arrival flame diagnostic tools were used. More advanced measurement techniques are now
used to not only measure the flame tip velocity but also visualize the flame shape, such as
Schlieren, shadowgraph, high-speed photography, and PLIF.
Figure 2.13 is showing the flame acceleration mechanism in a channel with obstruction.
Both ends of this channel are closed with a weak igniter at one end. Combustion initiation will
generate the initial propagation of a laminar flame. With an increase in the flame surface area
caused by the interaction of the large-scale turbulence, the volumetric burning rate increases. This
stage is called flame-folding. The increase in the volumetric burning rate culminates in a higher
velocity of the unburned gas ahead of the flame. This will generate a positive feedback loop that
causes flame acceleration as the higher velocity in the unburned gas ahead of the flame will
increase the level of turbulence and hence the volumetric burning rate. Also, when the flame
pushes the unburned gas ahead of it, it generates a series of compression waves. These
compression waves merge to develop a leading shock when the flame approaches the speed of the
25
sound in the reactants (approximately 350 m/s). The volumetric burning rate experiences a further
rise due to the flame instabilities introduced by the interaction between a reflected shock and the
flame. When the flame achieves approximately half the CJ detonation velocity, the deflagration is
referred to as a fast flame. It is still considered as deflagration due to the subsonic velocity of this
state relative to the flame ahead of it. However, relative to a stationary observer, fast flames travel
supersonically. Mass and heat diffusion govern the combustion. As shown in Figure 16, the fast
flame can transition to detonation under favorable conditions, and the detonation can continue to
propagate as a quasi-detonation down the channel at a velocity below CJ.
Figure 2.13: Typical schematic of flame acceleration resulting in DDT in a combustion tube
filled with repeating orifice plates [15]
Figure 2.14 shows two cases for a typical flame acceleration profile obtained by flame-
time-of-arrival measurements. One profile corresponds to flame acceleration leading to a fast
flame that never transitions to detonation, and the other shows the flame acceleration profile of a
DDT event. In the first case, a fast flame is generated, and the velocity never exceeds the speed of
26
sound in the combustion products, that is roughly equal to half the CJ detonation velocity. In the
other case, with DDT occurring, the flame accelerates and passes the velocity of the speed of
sound in the products and the combustion wave velocity stabilizes below the CJ detonation
velocity.
Figure 2.14: Typical velocity profile of flame acceleration in an obstructed channel [15]
2.8 DDT Limits
The least reactive mixture in which DDT will occur is described as the DDT limit for that
mixture. Knowing the composition range of a fuel-air mixture that detonation wave with a given
tube diameter can occur is very important as the less reactive mixtures will not support DDT.
This matter is of interest from the explosion safety aspect in industrial pipe design to prevent
DDT and detonation waves. Typically, by plotting the average quasi-steady-state velocity of the
flame over the mixture reactivity, DDT limits can be determined. The reactivity of a mixture can
be varied by altering the mixture composition or the mixture initial pressure. By changing the
composition, the rich and the lean limit will be determined, and, by changing the initial pressure,
27
the density of the fuel will be changed. The size of the combustion channel can affect the DDT
limits.
Peraldi et al. [3] experimentally studied DDT with a variety of fuel-air mixtures in a
round tube with diameter d containing repeated orifice plates. This has become the standard
configuration for measuring DDT limits in obstructed channels. Two necessary conditions were
proposed for detonation to take place. One is that the gas mixture characteristic cell size must be
smaller or equal to the open area dimension of the orifice plate; the other is that the speed of
flame must reach on the order of the speed of sound of the products by flame acceleration.
Although there is no guarantee that DDT occurs, having these two conditions is necessary. This
minimum open area requirement is defined by d > λ.
They also proposed three regimes for combustion wave propagation. The first one is the
slow subsonic flame which turbulent deflagrations propagate below the speed of sound in the
reactants. The second one is the fast supersonic flames where a turbulent deflagration travels
between the speed of sound in the reactants and the products. The third one is the quasi-
detonations which travels above the speed of sound in the products and below the CJ detonation
velocity. Figure 2.15 demonstrates this classification. The blockage ratio of the orifice, mixture
reactivity, and diameter of the tube are factors that affect the deficit between the measured
detonation propagation speed and the theoretical CJ detonation velocity. The ratio of orifice plate
obstructed area and the tube cross-section is known as the blockage ratio (BR).
28
Figure 2.15: Plot of average velocity as a function of ethylene-air mixture composition
presented by [3]. Three districted combustion modes are marked on the plot.
Further studies have checked the validity of the minimum orifice diameter criterion [20]
[45] [6] [46]. It was later shown that the critical condition d/λ>1 is valid for BRs up to about
50%, but the critical ratio increases for higher BR [28]. For example, they showed for a BR=60%
the critical condition was d/λ>3. This indicates that the onset of detonation is controlled by more
factors besides the blockage minimum open area. Dorofeev et al. [28] proposed a different
criterion based on a length scale L = (S + D)/2/(1 − d/D) that takes into account the tube diameter
D and the obstacle spacing S. If the obstacle spacing is equal to the tube diameter, the criterion
reduces to L = D/(1 − d/D)>7λ. In a separate study by the same group [46] their results showed
that for mixtures with a regular detonation cell structure (where argon or helium dilution is used
instead of nitrogen) the critical d/λ was an order of magnitude larger than unity, for all BRs.
29
If one takes into account the ±50% uncertainty in the cell size measurement, the critical
condition can be in the range of d/λ> 0 and d/λ> 2. There is also uncertainty in defining the
detonation limit by a measured combustion velocity exceeding the speed of the sound in the
products. The challenge of obtaining the DDT limits for unstable detonations has been discussed
by Lee [47], especially the difficulty caused by “galloping detonations.” Galloping detonations
are characterized by propagation at roughly the speed of the sound in products (fast flame
velocity) with DDT occurring intermittently.
2.9 DDT Studies in Obstructed Channels
The first comprehensive study of DDT in a round tube filled with orifice plates was
performed by Peraldi et al. [3]. They used three tubes with a different inner diameter of 5, 10, and
15 cm and 18 m long. The blockage ratio of the orifice plates used in the experiments was 43%
and they were spaced one tube diameter apart, similar to Chapman and Wheeler’s experiments. A
series of fuel-air mixtures were used in their experiments performed under Standard Atmospheric
Temperature and Pressure (SATP). The flame time-of-arrival technique was used to measure the
average combustion front propagation velocity. As discussed above, they proposed the DDT
criterion of d/λ ≥1, which states that for detonation propagation the orifice plate diameter must be
equal or greater than the detonation cell size. If the criterion is met, a quasi-detonation can
sustainably travel with a velocity as high as 40% below the CJ detonation velocity in a round tube
filled with orifice plates.
Ciccarelli and Cross [4] experimentally studied quasi detonation mechanism using
hydrogen-air mixtures at SATP in a 10 cm diameter round tube. They used a 6.1 m long channel
with no obstruction in the first half to produce a CJ detonation wave, and repeating orifice plates
with BRs in the range of 44% – 81% in the second half to generate a quasi-detonation. The
novelty of the experiments was that this was the first time that soot foils were used in an obstacle
filled tube to investigate the quasi-detonation propagation mechanism. They found that the DDT
30
criterion proposed by Peraldi et al. was appropriate for BRs up to 50% but the critical d/λ was
larger than unity for BRs above 50%, in agreement with the findings of Dorofeev et al [28].
Figure 2.16 shows a sample soot foil placed between orifice plates. Interestingly, a
cellular pattern was left on the soot foil that look like a mountain chain which was never before
observed. They proposed that for d < 13λ, diffraction through the orifice plate makes detonation
fail and re-initiate on the tube wall at hot-spots which form following reflection of the decoupled
leading shock. The peaks (marked by arrows in Figure 2.16) correspond to hot spots where
detonation initiation occurs, producing very fine cells bounded within the triangle pattern below.
More reactive mixtures produce detonation waves from multiple hot spots which then merge, two
such hot spots can be seen in Figure 2.16.
Figure 2.16: Soot foil from a stoichiometric hydrogen-oxygen mixture in 50% BR. The
ignition spots are marked on the foil [48]
They observed for less sensitive mixtures initiation took place at a single hot spot
between orifice plates. For mixtures near the propagation limit, they found that hot spots were not
observed between all orifice plates. The noted that it is possible for a detonation to propagate with
intermittent failure between obstacles, similar to a galloping detonation wave observed in a
smooth tube. Their conclusion based on the soot foil results was that even for highly reactive
31
quasi detonation, detailed detonation structures are very transient. Ciccarelli and Cross did not
observe single-head spin, similar to that observed in an unobstructed tube at the detonation limit.
Lieberman and Lee [49] used a round plastic combustion tube equipped with repeating
orifice plates to experimentally study wave propagation of stoichiometric oxy-acetylene mixtures
with different amounts of argon dilution. Their tube was 4 m long with 50.8 mm diameter. They
used two sets of orifice plates with a blockage ratio of 45% and 55%. They also varied the
distance between orifice plates from ¼ the tube diameter to one tube diameter. They used a very
high-speed rotating drum film camera to capture the combustion light emitted through a narrow
slit along the tube centerline. Although this narrow slit did not provide any information on the
detonation wave structure, this technique provided detailed detonation front velocity data. They
observed approximately constant velocity with minor fluctuations in quasi-detonation velocity
between obstacle pairs in the quasi-detonation regime. They found that the velocity decreases
while passing through the obstacle followed by a sharp increase. This pattern was observed over
the range of orifice plate spacing tested (¼D to 1D). They also studied the effect of the regularity
of the mixture on detonation failure using argon for dilution. Heavily diluted mixtures with argon
display a very regular detonation cellular. They proposed two different detonation failure
mechanisms. In irregular mixtures, the detonation reaction zone is cooled by the detonation
diffraction after passing through the obstacle. In a heavily diluted mixture by argon which
represents a very regular mixture, severe curvature of the detonation front causes the detonation
failure.
Kuznetsov et al. [46] studied the effect of detonation cellular regularity on the DDT
critical condition. In their experiment, they used an 11.5 m detonation tube with a 174 mm
internal diameter equipped with equally spaced orifice plates with blockage ratios of 0.1, 0.3, and
0.6. To change the regularity of the mixture, they used a stoichiometric hydrogen-oxygen mixture
with different inert gas dilutions (nitrogen, argon, and helium). They found that the critical DDT
32
condition is significantly influenced by the regularity of the detonation cellular structure. Argon
and helium dilution make the detonation cell structure more regular, whereas nitrogen-diluted
mixtures have irregular detonation cell structures. The critical condition for DDT, such as the
required cell size, is significantly smaller in regular mixtures compared to the irregular mixture in
the same tube with the same blockage ratio. They proposed that with the same value of detonation
cell size, the regular mixtures are less likely to undergo DDT than irregular mixtures.
For pressures near the limit in smooth tubes, detonation propagation was observed where
the detonation fails and reinitiates multiple times and propagates at a velocity similar to the
product’s speed of sound. In 1951, this behavior was first observed by Mooradian and Gordon
[50] in a 10 m long tube with 20 mm inner diameter for the hydrogen-air mixture. Duff et al. [51]
also observed this periodic behaviorand named it a “galloping detonation.” A more recent
detailed study by Gao et al. [52] investigated the galloping detonation in smooth tubes with
different diameters over different mixtures. They proposed that the instability of a mixture helps
the galloping detonation to appear more often. Therefore, galloping detonation does not occur in
highly argon diluted mixtures, that have a regular detonation cellular structure. They also found
that increasing the tube diameter, resulted in the range of initial pressure producing the galloping
mode decreased significantly.
Soot foils are used to capture the detonation cell structure; they record the triple-point
trajectories on the channel wall. A flat foil can be placed on the inside of a rectangular channel, or
shaped and inserted into round tubes. However, they do not provide any information on the
instantaneous shape of the reaction front and shock wave. The advancements in fast frame rate
CMOS cameras changed the study of detonation phenomena. Using these cameras with a
rectangular cross-section channel with flat windows for optical access makes it possible to use
schlieren photography to visualize shock waves and reaction fronts. Studies have been done on
visualizing the quasi-detonation wave propagation mechanism and the structure of it using high-
33
speed high-resolution schlieren photography [6] [8]. Kellenberg et al [8] combined transparent
sooted glass and schlieren photography for a better understanding of detonation propagation.
Combination of PLIF and schlieren photography was also used by Boeck et al [9] for this
purpose.
Since schlieren photography relies on collimated light beams, this technique cannot be
used in cylindrical channels due to distortion of the light by the curved walls. Recently, self-
luminous, high-speed photography was used by Rainsford et al [10] to look at detonation
propagation in a tube filled with orifice plates. In these experiments, a self-sustained CJ
detonation wave was transmitted into a clear round tube equipped with orifice plates. The
visualization results were used to interpret the soot foil records obtained by Cross et al. obtained
in a similar size steel tube. Never before captured details of the detonation re-initiation at the tube
wall and orifice plate upstream-surface were obtained. The effect of BR on the DDT criterion was
attributed to the absence of wall ignition for large BR orifice plates.
From a practical explosion safety perspective, the flame acceleration distance required for
transition to detonation is important. The term most often used to describe this is the DDT run-up
distance. Bollinger et al carried the most comprehensive DDT studies in unobstructed tubes [53].
Silvestrini et al. [54] developed a flame velocity versus distance correlation based on available
unobstructed experimental data. They proposed a DDT run up distance assuming that DDT
occurs when the flame velocity reaches half the CJ detonation velocity shown in Equation 2.15
where σ is density ratio of unburned gas over the burned gas and SL is the laminar burning
velocity. This was extended to an obstacle-filled tube by including a factor involving the BR. The
correlation in Equation 2.16 was obtained by fitting experimental obstructed tube DDT data.
[X
D]DDT smooth =
1
0.0061(σ−1) (0.15
D)0.4 ln (0.077
VCJ
σSL) (2.15)
[X
D]DDT BR =
1
1+15BR [X
D]DDT smooth (2.16)
34
Chapter 3
Experiments and Apparatus
3.1 Overview
DDT experiments with different fuel-oxygen mixtures with different dilution types was
investigated in a cylindrical tube filled with repeating orifice plates. Table 3.1 lists the mixtures
that were used in the experiments for each blockage ratio setup. The reactivity of the test mixture
was varied by changing the initial pressure between 4 kPa and 88 kPa. The mixtures were ignited
at one end of the tube and the flame accelerated through equally spaced orifice plates. To study
the impact of blockage ratio, two sets of orifice plates with different opening areas were used in
experiments. A high-speed camera was used to obtain the average combustion velocity by
tracking the flame front. Two cameras were occasionally synchronized, one for the overall
propagation and one for zoomed-in images of the detonation propagation between obstacles to get
a better understanding of the combustion wave propagation mechanism. To better identify the
DDT limits and study the detonation structure, aluminum or plastic soot foils were inserted inside
the tube between orifice plates.
35
Table 3.1: Test mixtures where represents the diluent to oxygen mole ratio
3.2 Combustion Tube
The combustion chamber consists of two acrylic cylindrical tubes with 8.89 cm inner
diameter and 10.16 cm outer diameter. The length of the tubes are 44 cm and 244 cm, providing
288 cm length in total. Figure 3.1 shows a SolidWorks model of the optically clear tube with the
orifice plates installed. Three 1.91 cm thick acrylic flanges were used to connect the tubes. The
flanges have a 7.6 cm hole through the center and a 0.16 cm recess around the hole to align the
round tubes. There is an o-ring grove in the recess, with a BUNA o-ring to seal the end of the
tube. The middle acrylic flange has a recess and o-ring groove on either side which is used to
align the two tubes. Two 2.52 cm thick aluminum endplates are used to close off the tube. The
ignitor is mounted on one endplate along with two pipe fittings, the opposite endplate is a blank.
Four 310 cm long rods, 1.2 cm diameter rods pass through four 1.27 cm diameter holes in corners
of each flange. The ends of the rods are threaded and bolted tight to keep the tube together. Two
1.27 cm thick wooden supporters with a 10.16 cm hole were used to prevent sagging of the tube
36
(not shown in Figure 3.1). The supports were placed around orifice plates to not block the camera
field of view.
Figure 3.1: SolidWorks model of the transparent cylindrical combustion channel filled with
repeating orifice plates used in this study
3.3 Obstacles
In the 288 cm long tube, a total of 33 orifice plates were installed to promote flame
acceleration. Two sets of 1.27 cm thick orifice plates (50% and 75% blockage ratio) with 8.89 cm
outer-diameter were investigated. The inner-diameters of these two sets are 5.33 and 3.89 cm,
respectively. Note, 26 of the 33 orifice plates is made from 6061-Aluminum, and the rest are
acrylic. There is no specific reason for the difference in the material of the orifice plates. Figure
3.2 shows an acrylic 50% blockage ratio and a 6061-Aluminum 75% blockage ratio orifice plate.
The orifice plates were spaced equally at one tube diameter. The separation was maintained by
6.4 cm long spacers inserted into the tube between orifice plates. The spacer outer and inner-
diameter were 8.9 cm 7.6 cm, respectively. The spacers are made from optically clear acrylic and
fit tightly in the tube. Figure 3.3 shows the obstacle and spacer configuration where d is the
37
orifice plate inner diameter, and S is the spacing between obstacles. There is a lengthwise slit on
every spacer to help the fitment inside the outer tube. Over time the spacers became cloudy from
the high temperature combustion, new spacers were prepared when needed.
Figure 3.2: Orifice plates with 50% BR (left) and 75% BR (right)
Figure 3.3: SolidWorks model of tube, spacers and orifice plates configuration. S is the
length of the spacer (one tube diameter) and d is the opening area of the orifice plate
3.4 Mixing Chamber And Control Panel
The test mixtures were made in the mixing chamber using the partial pressure method at
a final total pressure of 4 bars (60 psia). The amount of inert gas dilution is quantified by , the
mole ratio of diluent to oxygen. The value of was varied from 0 (no dilution) to 3.79,
38
representing stoichiometric fuel-air if the diluent is nitrogen. Argon was also used as a diluent as
it results in a more regular sell structure compared to nitrogen. To prevent any air leakage from
outside into the chamber, a new mixture was prepared as the pressure inside the chamber fell
below the atmospheric pressure. The mixing chamber is equipped with an impeller that runs with
an electric drill for at least twenty minutes to ensure a homogenous mixture. A schematic of the
piping and gas control panel (denoted by red dashed box) is provided in Figure 3.4. All the gas
tanks are standard compressed gas cylinders. To manage the flow of the gas into the panel, these
gas bottles are equipped with regulators. All connections such as valves, hoses, and fittings are
supplied by Swagelok. Table 3.2 demonstrate functions of each valve in the setup.
Figure 3.4: Schematic of control panel and valve connections
39
Table 3.2: Valve numbers and functions
3.5 Ignition System
A Bosch automotive glow plug (model 0 250 202127), mounted on the endplate, was
used to ignite a flame. The glow plug was powered by a 12 VDC power supply. When energized
a current runs through the glow plug causing it to heat up to a very high temperature. Once the
gaseous mixture around the glow plug reaches its autoignition temperature, it is ignited, and a
laminar flame is generated. This procedure takes less than 7 seconds, depending on the initial
pressure and mixture composite. The glow plug was turned on manually, and the long time to
ignition allowed to trigger the cameras manually. Flame acceleration and DDT is accompanied by
an audible sound camera trigger mode was set to “End Mode,” whereby the video recording ends
when the trigger is activated. The recording time duration is set based on the camera frame rate
and the total number of frames specified. A spark plug was also mounted on the same flange to
ignite the mixtures with initial pressures where the glow plug could not ignite. For tests that glow
plug and spark plug was used together, the video was captured automatically by a signal that
triggered both spark plug and the camera. Figure 3.5 shows the ignition flange.
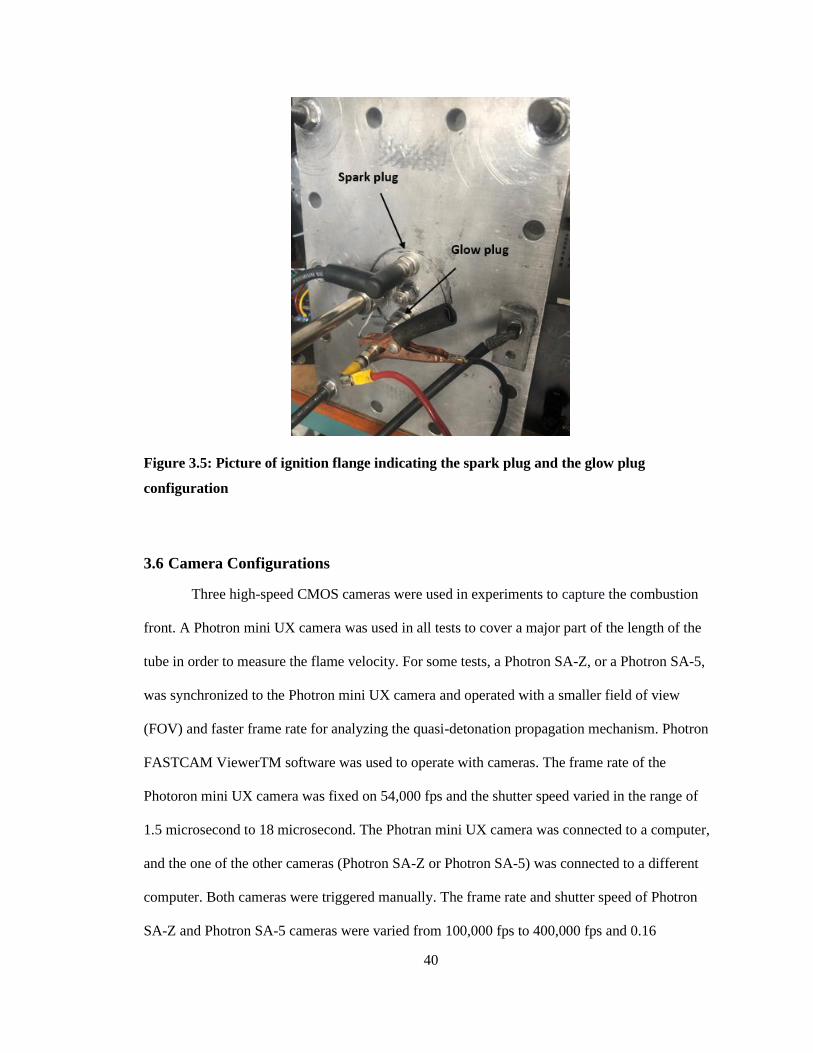
40
Figure 3.5: Picture of ignition flange indicating the spark plug and the glow plug
configuration
3.6 Camera Configurations
Three high-speed CMOS cameras were used in experiments to capture the combustion
front. A Photron mini UX camera was used in all tests to cover a major part of the length of the
tube in order to measure the flame velocity. For some tests, a Photron SA-Z, or a Photron SA-5,
was synchronized to the Photron mini UX camera and operated with a smaller field of view
(FOV) and faster frame rate for analyzing the quasi-detonation propagation mechanism. Photron
FASTCAM ViewerTM software was used to operate with cameras. The frame rate of the
Photoron mini UX camera was fixed on 54,000 fps and the shutter speed varied in the range of
1.5 microsecond to 18 microsecond. The Photran mini UX camera was connected to a computer,
and the one of the other cameras (Photron SA-Z or Photron SA-5) was connected to a different
computer. Both cameras were triggered manually. The frame rate and shutter speed of Photron
SA-Z and Photron SA-5 cameras were varied from 100,000 fps to 400,000 fps and 0.16
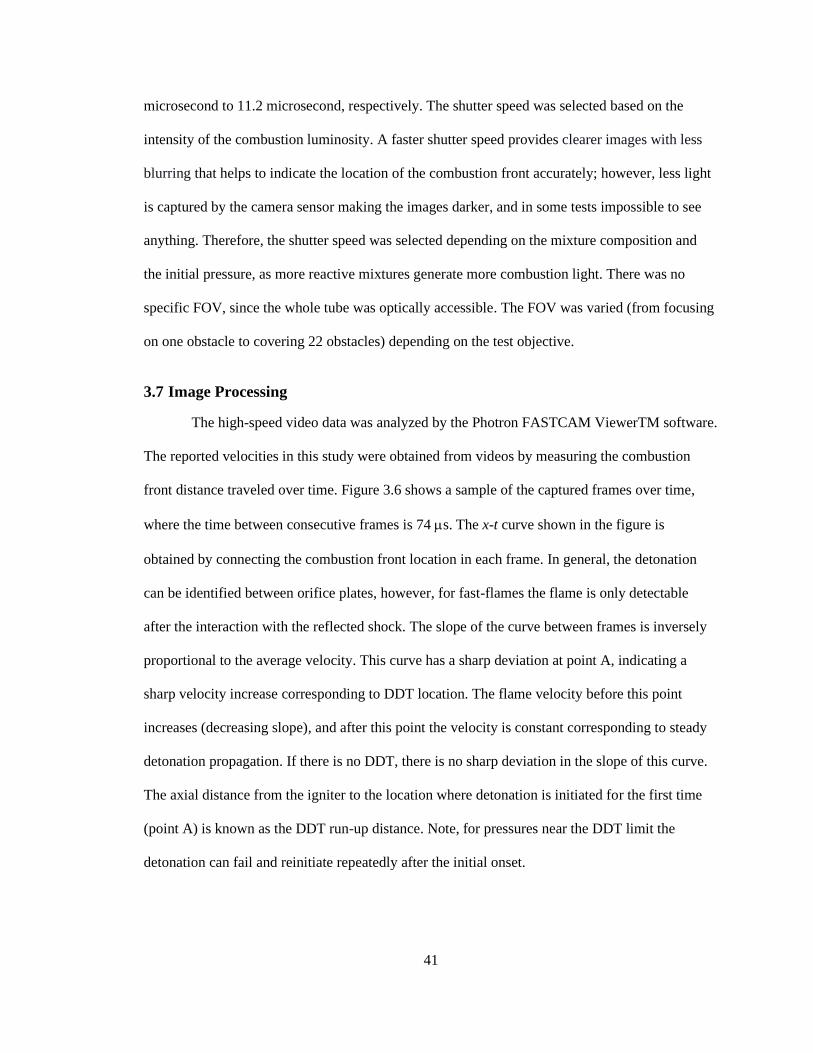
41
microsecond to 11.2 microsecond, respectively. The shutter speed was selected based on the
intensity of the combustion luminosity. A faster shutter speed provides clearer images with less
blurring that helps to indicate the location of the combustion front accurately; however, less light
is captured by the camera sensor making the images darker, and in some tests impossible to see
anything. Therefore, the shutter speed was selected depending on the mixture composition and
the initial pressure, as more reactive mixtures generate more combustion light. There was no
specific FOV, since the whole tube was optically accessible. The FOV was varied (from focusing
on one obstacle to covering 22 obstacles) depending on the test objective.
3.7 Image Processing
The high-speed video data was analyzed by the Photron FASTCAM ViewerTM software.
The reported velocities in this study were obtained from videos by measuring the combustion
front distance traveled over time. Figure 3.6 shows a sample of the captured frames over time,
where the time between consecutive frames is 74 s. The x-t curve shown in the figure is
obtained by connecting the combustion front location in each frame. In general, the detonation
can be identified between orifice plates, however, for fast-flames the flame is only detectable
after the interaction with the reflected shock. The slope of the curve between frames is inversely
proportional to the average velocity. This curve has a sharp deviation at point A, indicating a
sharp velocity increase corresponding to DDT location. The flame velocity before this point
increases (decreasing slope), and after this point the velocity is constant corresponding to steady
detonation propagation. If there is no DDT, there is no sharp deviation in the slope of this curve.
The axial distance from the igniter to the location where detonation is initiated for the first time
(point A) is known as the DDT run-up distance. Note, for pressures near the DDT limit the
detonation can fail and reinitiate repeatedly after the initial onset.
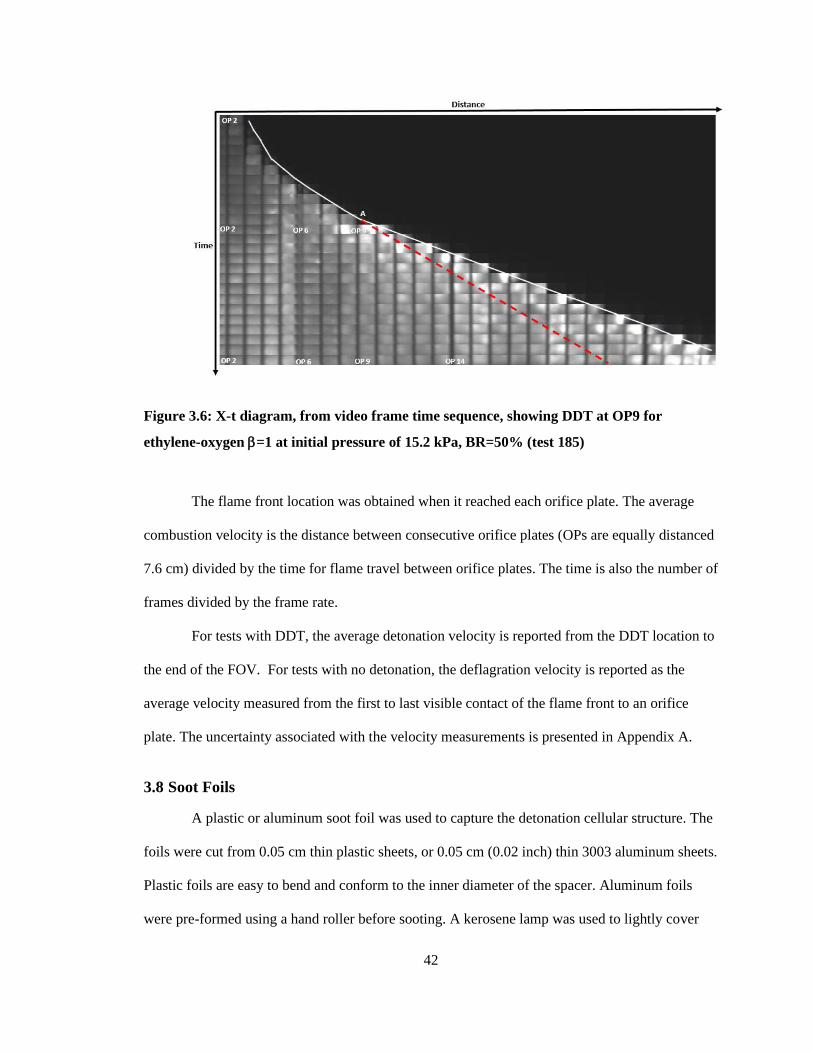
42
Figure 3.6: X-t diagram, from video frame time sequence, showing DDT at OP9 for
ethylene-oxygen =1 at initial pressure of 15.2 kPa, BR=50% (test 185)
The flame front location was obtained when it reached each orifice plate. The average
combustion velocity is the distance between consecutive orifice plates (OPs are equally distanced
7.6 cm) divided by the time for flame travel between orifice plates. The time is also the number of
frames divided by the frame rate.
For tests with DDT, the average detonation velocity is reported from the DDT location to
the end of the FOV. For tests with no detonation, the deflagration velocity is reported as the
average velocity measured from the first to last visible contact of the flame front to an orifice
plate. The uncertainty associated with the velocity measurements is presented in Appendix A.
3.8 Soot Foils
A plastic or aluminum soot foil was used to capture the detonation cellular structure. The
foils were cut from 0.05 cm thin plastic sheets, or 0.05 cm (0.02 inch) thin 3003 aluminum sheets.
Plastic foils are easy to bend and conform to the inner diameter of the spacer. Aluminum foils
were pre-formed using a hand roller before sooting. A kerosene lamp was used to lightly cover
43
one side of the foil with soot. The sooted foil was placed inside the spacer and the spacer was
then placed between orifice plates. The length of a foil covered the full length of the spacer, and
the width of the foil covered the spacer inner circumference, i.e. the foil was 6.35 cm × 23.88 cm.
The location of soot foil(s) was varied from test to test. Figure 3.7 shows a schematic of soot foils
located between obstacles 10 -11 and 11-12. Soot foils were also used to measure the cell
size for specific mixtures; they were placed at the end of the tube where there are no
obstacles, and a longer foil was used to ensure steady state. In this case, only aluminum
sheets were used since the significant pressure rise at the end of the tube damaged the
plastic foils.
Figure 3.7: SolidWorks model of curved soot foils configuration in the combustion tube
After tests involving soot foils, the tube was opened and the soot foils were removed and
sprayed with a clear paint (Rust-oleum Painter’s Touch Clear Satin) to preserve the imprint, and
the tube was reassembled again. The soot foils were photographed with a smartphone camera
(iPhone X) under an LED light bank.
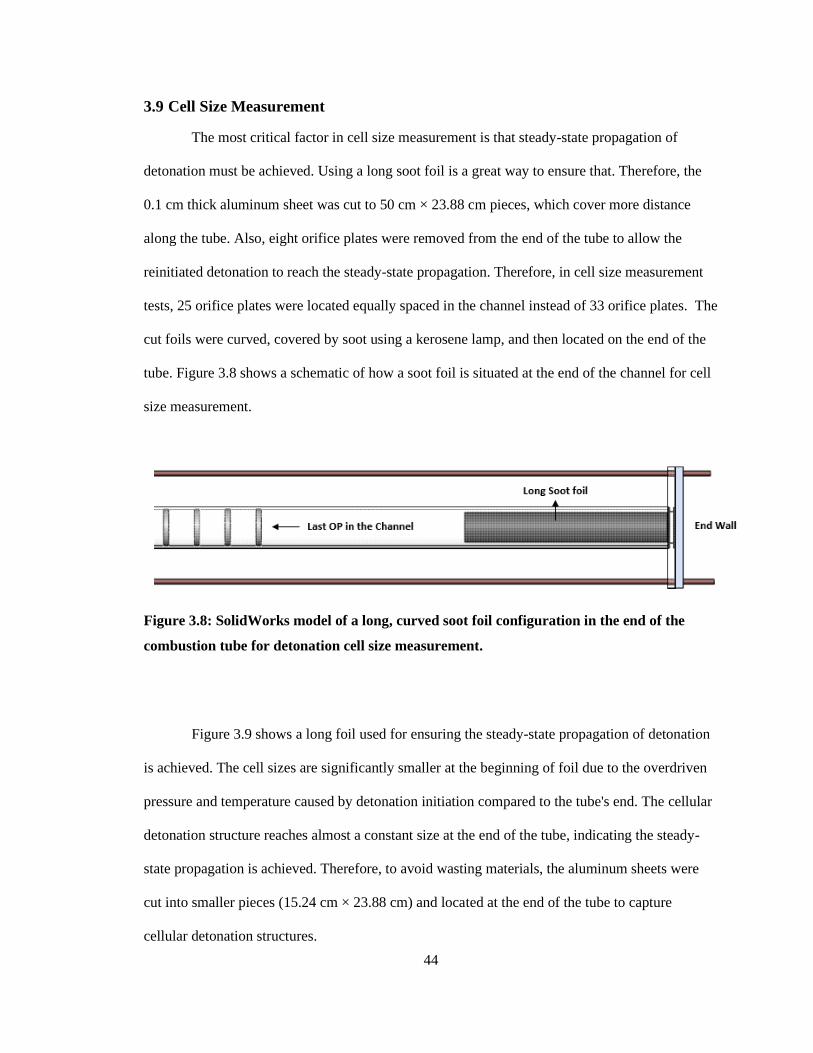
44
3.9 Cell Size Measurement
The most critical factor in cell size measurement is that steady-state propagation of
detonation must be achieved. Using a long soot foil is a great way to ensure that. Therefore, the
0.1 cm thick aluminum sheet was cut to 50 cm × 23.88 cm pieces, which cover more distance
along the tube. Also, eight orifice plates were removed from the end of the tube to allow the
reinitiated detonation to reach the steady-state propagation. Therefore, in cell size measurement
tests, 25 orifice plates were located equally spaced in the channel instead of 33 orifice plates. The
cut foils were curved, covered by soot using a kerosene lamp, and then located on the end of the
tube. Figure 3.8 shows a schematic of how a soot foil is situated at the end of the channel for cell
size measurement.
Figure 3.8: SolidWorks model of a long, curved soot foil configuration in the end of the
combustion tube for detonation cell size measurement.
Figure 3.9 shows a long foil used for ensuring the steady-state propagation of detonation
is achieved. The cell sizes are significantly smaller at the beginning of foil due to the overdriven
pressure and temperature caused by detonation initiation compared to the tube's end. The cellular
detonation structure reaches almost a constant size at the end of the tube, indicating the steady-
state propagation is achieved. Therefore, to avoid wasting materials, the aluminum sheets were
cut into smaller pieces (15.24 cm × 23.88 cm) and located at the end of the tube to capture
cellular detonation structures.
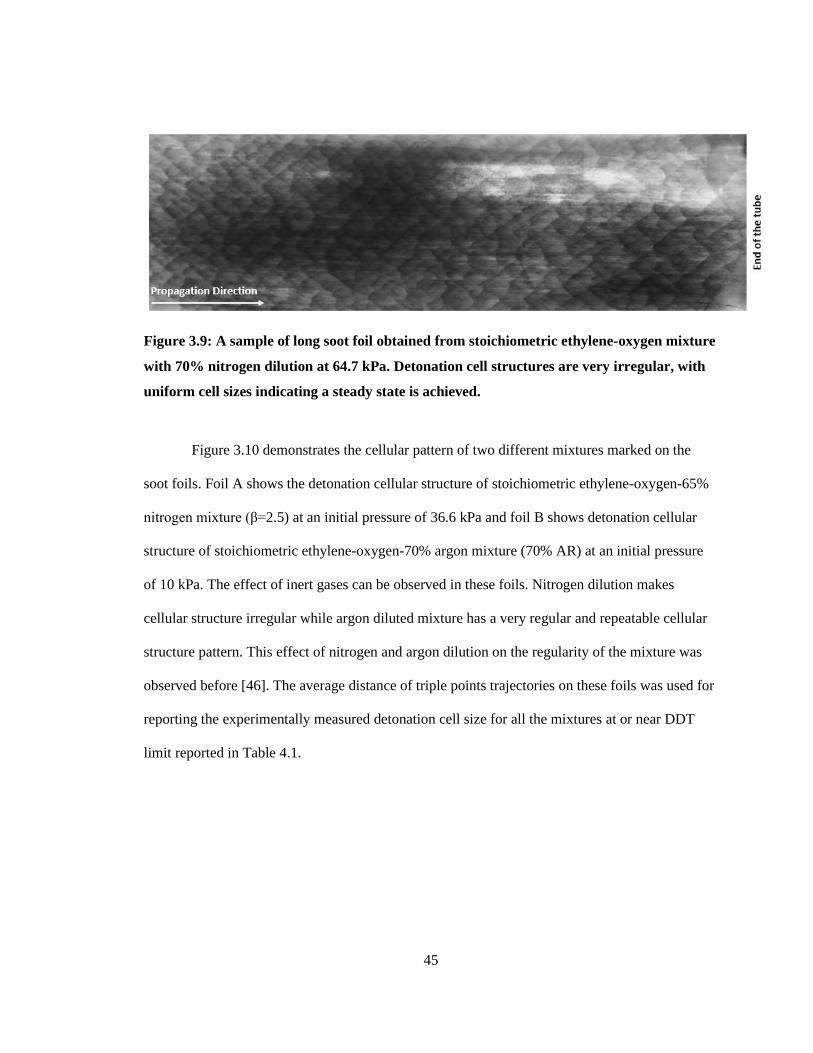
45
Figure 3.9: A sample of long soot foil obtained from stoichiometric ethylene-oxygen mixture
with 70% nitrogen dilution at 64.7 kPa. Detonation cell structures are very irregular, with
uniform cell sizes indicating a steady state is achieved.
Figure 3.10 demonstrates the cellular pattern of two different mixtures marked on the
soot foils. Foil A shows the detonation cellular structure of stoichiometric ethylene-oxygen-65%
nitrogen mixture (β=2.5) at an initial pressure of 36.6 kPa and foil B shows detonation cellular
structure of stoichiometric ethylene-oxygen-70% argon mixture (70% AR) at an initial pressure
of 10 kPa. The effect of inert gases can be observed in these foils. Nitrogen dilution makes
cellular structure irregular while argon diluted mixture has a very regular and repeatable cellular
structure pattern. This effect of nitrogen and argon dilution on the regularity of the mixture was
observed before [46]. The average distance of triple points trajectories on these foils was used for
reporting the experimentally measured detonation cell size for all the mixtures at or near DDT
limit reported in Table 4.1.
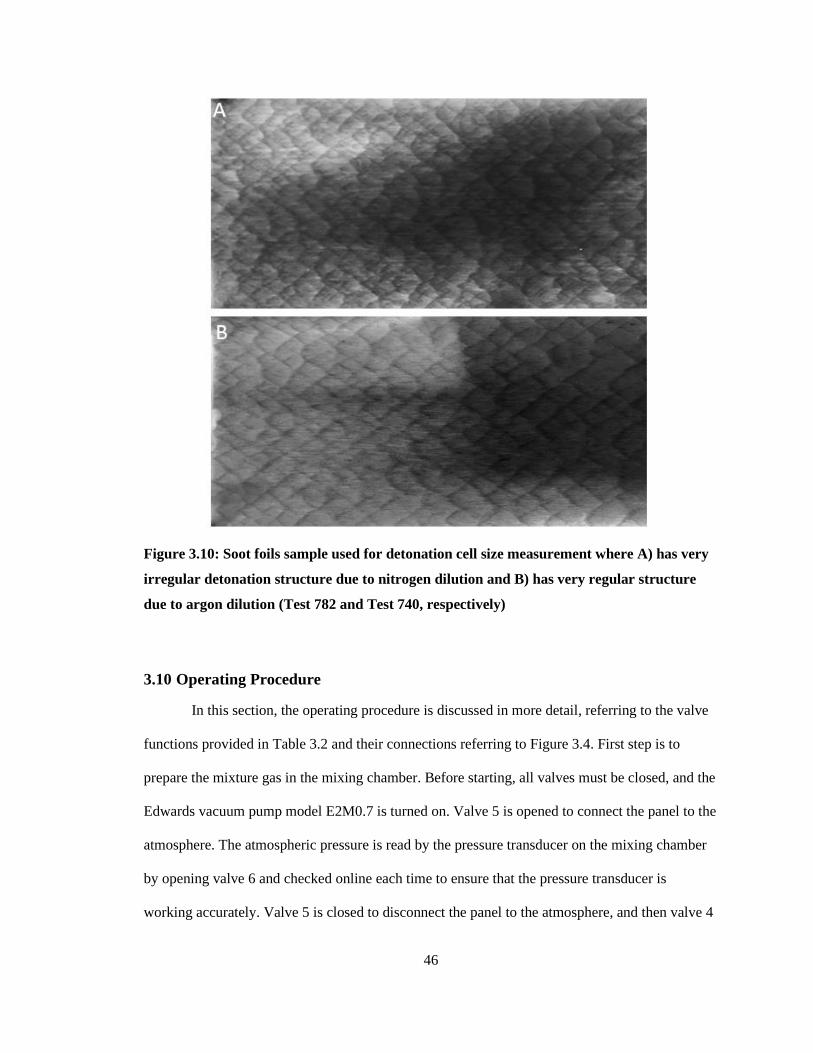
46
Figure 3.10: Soot foils sample used for detonation cell size measurement where A) has very
irregular detonation structure due to nitrogen dilution and B) has very regular structure
due to argon dilution (Test 782 and Test 740, respectively)
3.10 Operating Procedure
In this section, the operating procedure is discussed in more detail, referring to the valve
functions provided in Table 3.2 and their connections referring to Figure 3.4. First step is to
prepare the mixture gas in the mixing chamber. Before starting, all valves must be closed, and the
Edwards vacuum pump model E2M0.7 is turned on. Valve 5 is opened to connect the panel to the
atmosphere. The atmospheric pressure is read by the pressure transducer on the mixing chamber
by opening valve 6 and checked online each time to ensure that the pressure transducer is
working accurately. Valve 5 is closed to disconnect the panel to the atmosphere, and then valve 4
47
is opened to connect the panel and the mixing chamber to the vacuum pump. Valves 2, 3, and 8
are opened to vacuum the pipeline connected to the gas bottles. The mixing chamber, panel, and
pipelines must be vacuumed for at least 30 minutes. After that, the vacuum pressure is recorded,
and Valves 2, 3, 4, and 8 are closed. The gas bottles are now open, and Valve 2 is opened to
adding the fuel (ethylene or hydrogen) to the mixing chamber and will be closed when desired
pressure is reached. Next step, oxygen is added by opening valve 3 and is closed when desired
pressure is reached. Finally, the inert gas (nitrogen or argon) is added by opening the Valve 8
until the desired pressure + recorded vacuumed pressure is read by the pressure transducer. Then
Valve 6 is closed to disconnect the chamber from the panel. The gas bottles are sealed, and the
impeller is turned on for thirty minutes to mix the gases. When it is done, the impeller is turned
off. Whenever the mixture pressure falls below the atmospheric pressure, the remaining mixture
is diluted by adding more inert gas to it and send to the atmosphere by opening valve 5. Then, the
mixture preparation procedure is repeated.
While the mixture is being prepared, the ignition system and camera configuration are set
up and tested. Frame rate and shutter speed is selected depending on the mixture and purpose of
the test, and the background light is calibrated. The cameras are set on end trigger mode and
beginning recording. Ear and eye protection are worn in this stage. Valves 4, 7, and 9 are opened
to start vacuuming the combustion tube. The safety valve 10 is opened, allowing to read the tube
pressure. Once thirty minutes has passed, the vacuum pressure is recorded, and Valve 4 is closed
to disconnect the tube from the vacuum pump. Valve 6 is opened smoothly to fill the tube with
the prepared mixture gas. Once the pressure transducer reads the desirable pressure, Valve 6 is
closed. Safety Valve 9 and 10 are also closed to protect the panel and pressure transducer from
the combustion shock inside the tube, respectively. Then the glow plug is turned on quickly. It
takes up to 5 seconds for ignition to start allowing to be prepared for ending the camera
recording. Once the combustion sound is heard, the recording is stopped manually. The Photoran
48
mini UX camera captures 2.5 seconds before it was stopped recording, and the other camera
capture range of 0.4 seconds to 0.8 seconds, depending on the frame rate. Immediately after the
recording is stopped, Valves 4 and 9 are opened to vacuum the tube, respectively, and Valve 10 is
opened to read the tube pressure. While the tube is under the vacuuming procedure, the recorded
videos are processed, and cameras are prepared for the next test.
49
Chapter 4
Results and Discussion
The experimental results are provided in this section. Detailed analysis of the data is covered in
the discussion section.
4.1 Detonation Propagation Modes
In this section, the measured average combustion front velocity and the propagation
mechanism for typical tests are provided for both 50% and 75 % blockage ratio setups. The
mixture composition is reported in Table 2.1. Note that only four of the mixtures were studied in
the 75% blockage ratio setup since DDT was not observed in the other mixtures.
4.1.1 Combustion Front Velocity
The average combustion velocity is plotted versus initial pressure in Figure 4.1 for
stoichiometric ethylene-oxygen mixture with 70% argon dilution (β=3/AR), for both 50% and
75% blockage ratio setups. Using the method described in Section 3.7, the average combustion
velocity was measured for each test. The theoretical CJ detonation velocity and product speed of
sound (for an adiabatic, isobaric process) were also calculated and presented in this plot for
reference. The calculation method for the CJ detonation velocity and product speed of sound is
provided in Appendix B. To avoid presenting repeated content, only β=3/AR mixture results are
discussed in this section. Other mixture plots of average combustion velocity as a function of
initial pressure are provided in Appendix B.
50
The average velocity increases with increasing initial pressure. The average velocity
approaches the theoretical CJ velocity for pressures higher than 60 kPa in the 50% BR setup,
whereas the average velocity does not exceed halfway between product speed of sound to CJ
speed in the 75% BR setup. The velocity exceeds the speed of sound in the product above a
certain initial pressure. This point where combustion propagates at a velocity exceeding the
product's speed of sound for the first time is traditionally known as the DDT limit. It requires
higher initial pressure in 75% BR set up for the same mixture to undergo DDT comparing to the
50% BR setup. The maximum deflagration and detonation velocity is significantly lower in the
75% BR setup. The average velocity also shows large fluctuations in the 75% BR setup, whereas
for the 50% BR, there is a smooth increase in the average velocity with increasing initial pressure.
The galloping detonation propagation mode was observed only in the 75% BR setup as described
0
500
1000
1500
2000
0 5 10 15 20 25 30 35 40 45 50 55 60 65 70 75Ave
rage
Co
mb
ust
ion
Fro
nt
Vel
oci
ty (
m/s
)
Initial Pressure (kPa)
Galloping Detonation - 75% BR Deflagration - 75% BR Detonation - 75% BR
Detonation - 50% BR Deflagration - 50% BR
CJ detonation velocity
Products speed of sound
Figure 4.1: Plot of average combustion front velocity as a function initial pressure in ethylene-
oxygen mixture with 70% argon dilution mixture
51
in the next section. The different behaviors observed in the 75% BR setup suggest that the
combustion propagation is highly unstable
4.1.2 Propagation Modes
The propagation mechanism is presented in two sections because of the differences
observed in the 50% and 75% blockage ratio setups. 50% Blockage ratio setup
Different combustion wave propagation modes were observed in the tube filled with a
50% blockage ratio orifice plates. High-speed video and soot foils are used to classify the five
modes of propagation mechanisms. The steady propagation modes observed are grouped as fast
flame, where no detonation is observed, and quasi-detonation. The quasi-detonation mode can be
sub-divided into continuous and discontinuous mode. The discontinuous mode is highlighted by
failure and reinitiation, where reinitiation can occur as ignition on the obstacle face, single
hotspot wall ignition, or multi hot spot wall ignition. Shock reflection off a boundary generates a
region of high temperature gas that results in one or more local ignition sites commonly referred
to as a hot spot. These propagation modes are explained individually further in this chapter.
Table 4.1 presents the range of initial pressure for which each detonation propagation
mode was observed. One to two of these detonation propagation modes were not observed
depending on the initial pressure. The lowest pressure recorded for each mixture in this table
indicates the DDT limit, and the highest indicates the highest pressure tested in this study.
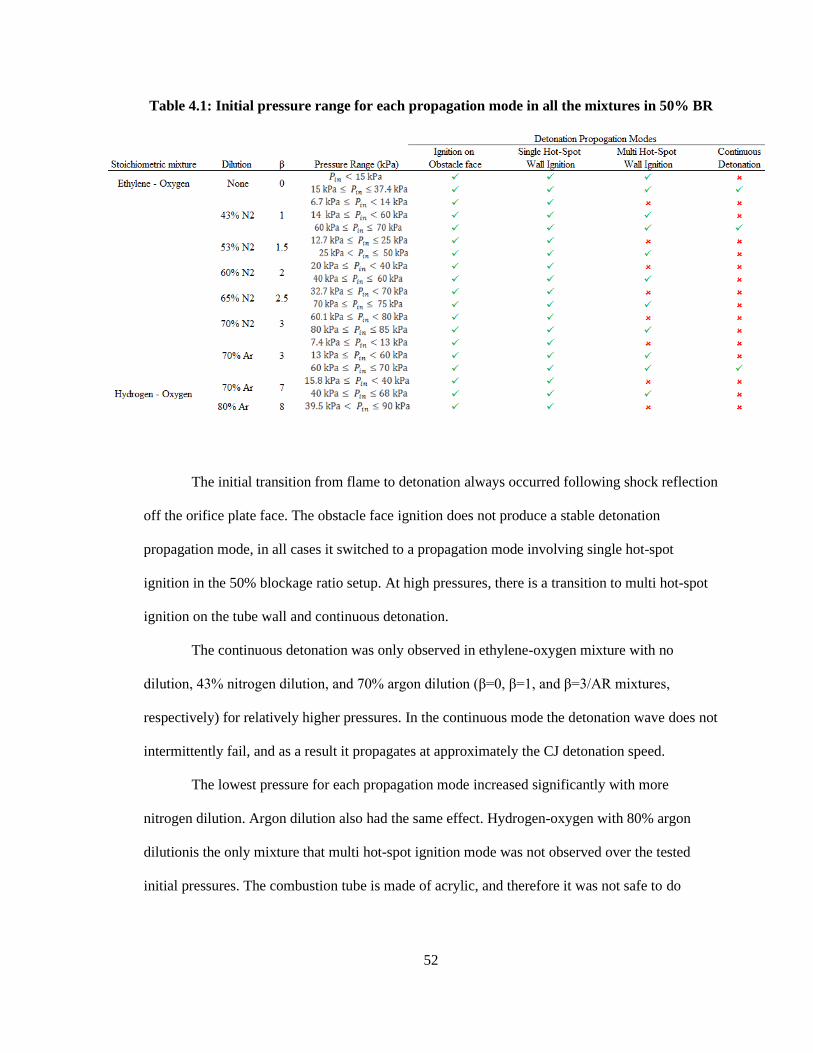
52
Table 4.1: Initial pressure range for each propagation mode in all the mixtures in 50% BR
The initial transition from flame to detonation always occurred following shock reflection
off the orifice plate face. The obstacle face ignition does not produce a stable detonation
propagation mode, in all cases it switched to a propagation mode involving single hot-spot
ignition in the 50% blockage ratio setup. At high pressures, there is a transition to multi hot-spot
ignition on the tube wall and continuous detonation.
The continuous detonation was only observed in ethylene-oxygen mixture with no
dilution, 43% nitrogen dilution, and 70% argon dilution (β=0, β=1, and β=3/AR mixtures,
respectively) for relatively higher pressures. In the continuous mode the detonation wave does not
intermittently fail, and as a result it propagates at approximately the CJ detonation speed.
The lowest pressure for each propagation mode increased significantly with more
nitrogen dilution. Argon dilution also had the same effect. Hydrogen-oxygen with 80% argon
dilutionis the only mixture that multi hot-spot ignition mode was not observed over the tested
initial pressures. The combustion tube is made of acrylic, and therefore it was not safe to do
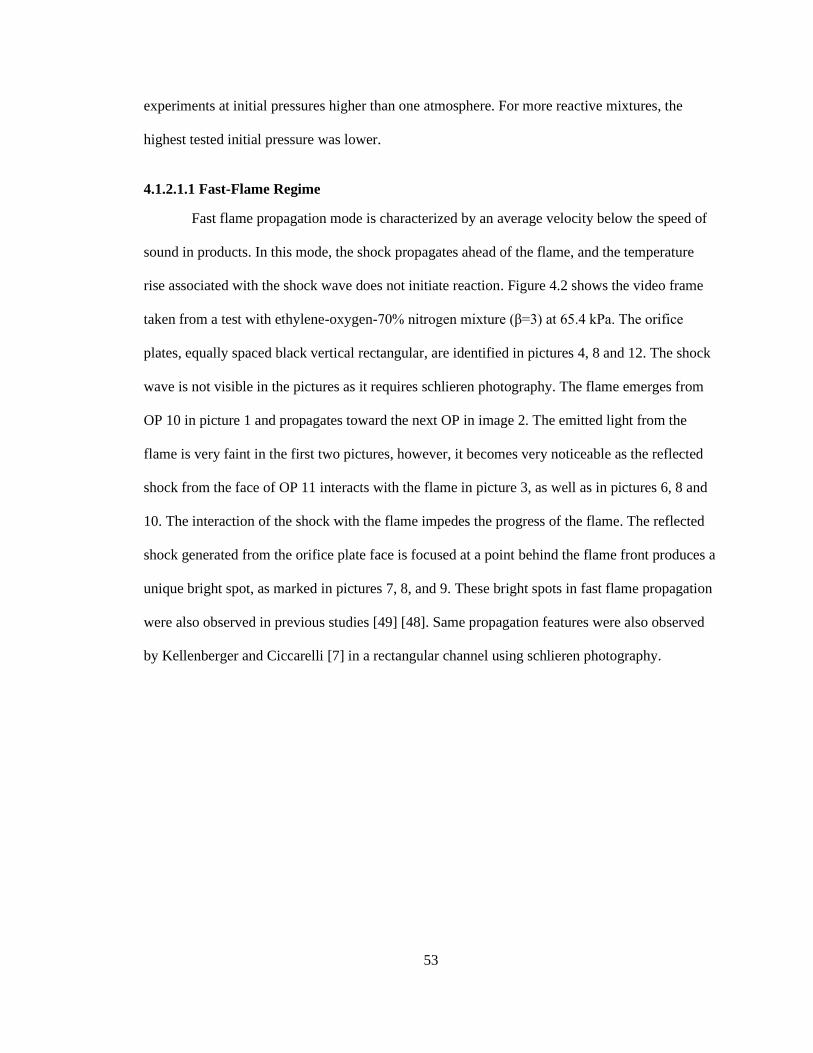
53
experiments at initial pressures higher than one atmosphere. For more reactive mixtures, the
highest tested initial pressure was lower.
4.1.2.1.1 Fast-Flame Regime
Fast flame propagation mode is characterized by an average velocity below the speed of
sound in products. In this mode, the shock propagates ahead of the flame, and the temperature
rise associated with the shock wave does not initiate reaction. Figure 4.2 shows the video frame
taken from a test with ethylene-oxygen-70% nitrogen mixture (β=3) at 65.4 kPa. The orifice
plates, equally spaced black vertical rectangular, are identified in pictures 4, 8 and 12. The shock
wave is not visible in the pictures as it requires schlieren photography. The flame emerges from
OP 10 in picture 1 and propagates toward the next OP in image 2. The emitted light from the
flame is very faint in the first two pictures, however, it becomes very noticeable as the reflected
shock from the face of OP 11 interacts with the flame in picture 3, as well as in pictures 6, 8 and
10. The interaction of the shock with the flame impedes the progress of the flame. The reflected
shock generated from the orifice plate face is focused at a point behind the flame front produces a
unique bright spot, as marked in pictures 7, 8, and 9. These bright spots in fast flame propagation
were also observed in previous studies [49] [48]. Same propagation features were also observed
by Kellenberger and Ciccarelli [7] in a rectangular channel using schlieren photography.
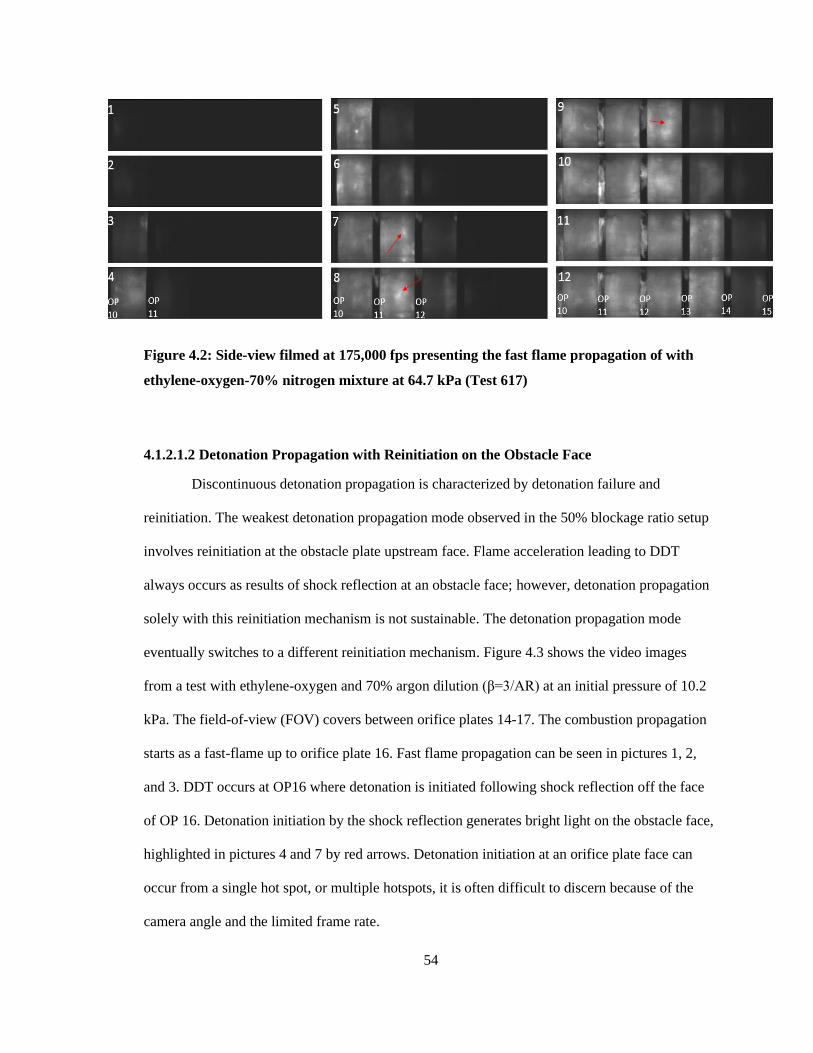
54
Figure 4.2: Side-view filmed at 175,000 fps presenting the fast flame propagation of with
ethylene-oxygen-70% nitrogen mixture at 64.7 kPa (Test 617)
4.1.2.1.2 Detonation Propagation with Reinitiation on the Obstacle Face
Discontinuous detonation propagation is characterized by detonation failure and
reinitiation. The weakest detonation propagation mode observed in the 50% blockage ratio setup
involves reinitiation at the obstacle plate upstream face. Flame acceleration leading to DDT
always occurs as results of shock reflection at an obstacle face; however, detonation propagation
solely with this reinitiation mechanism is not sustainable. The detonation propagation mode
eventually switches to a different reinitiation mechanism. Figure 4.3 shows the video images
from a test with ethylene-oxygen and 70% argon dilution (β=3/AR) at an initial pressure of 10.2
kPa. The field-of-view (FOV) covers between orifice plates 14-17. The combustion propagation
starts as a fast-flame up to orifice plate 16. Fast flame propagation can be seen in pictures 1, 2,
and 3. DDT occurs at OP16 where detonation is initiated following shock reflection off the face
of OP 16. Detonation initiation by the shock reflection generates bright light on the obstacle face,
highlighted in pictures 4 and 7 by red arrows. Detonation initiation at an orifice plate face can
occur from a single hot spot, or multiple hotspots, it is often difficult to discern because of the
camera angle and the limited frame rate.
55
The parabolic shape of the flame, see blue arrow in pictures 2 and 4, can be seen trailing
behind the shock. The interaction of the reflected shock and the trailing flame before OP 14 can
be clearly seen in picture 1 (see blue arrow), along with the flame tip emerging from the orifice
plate. The detonation wave propagating upstream from OP 16 is visible in picture 6. This
detonation propagates until it reaches the flame where no further reactants exist. Detonation fails
after experiencing diffracting through OP16 and a detonation re-initiate at OP17. This
propagation mode continues with increasing average combustion front velocity and eventually
transitions to single hotspot wall ignition, covered in the next section. The number of orifice
plates and the time it takes for detonation mode transition varies depending on the initial pressure
and the reactivity of the mixture. For highly reactive mixtures (high initial pressure), the obstacle
face ignition only happens at the time of DDT, and the detonation propagation immediately
switches to single or multiwall detonation ignition.
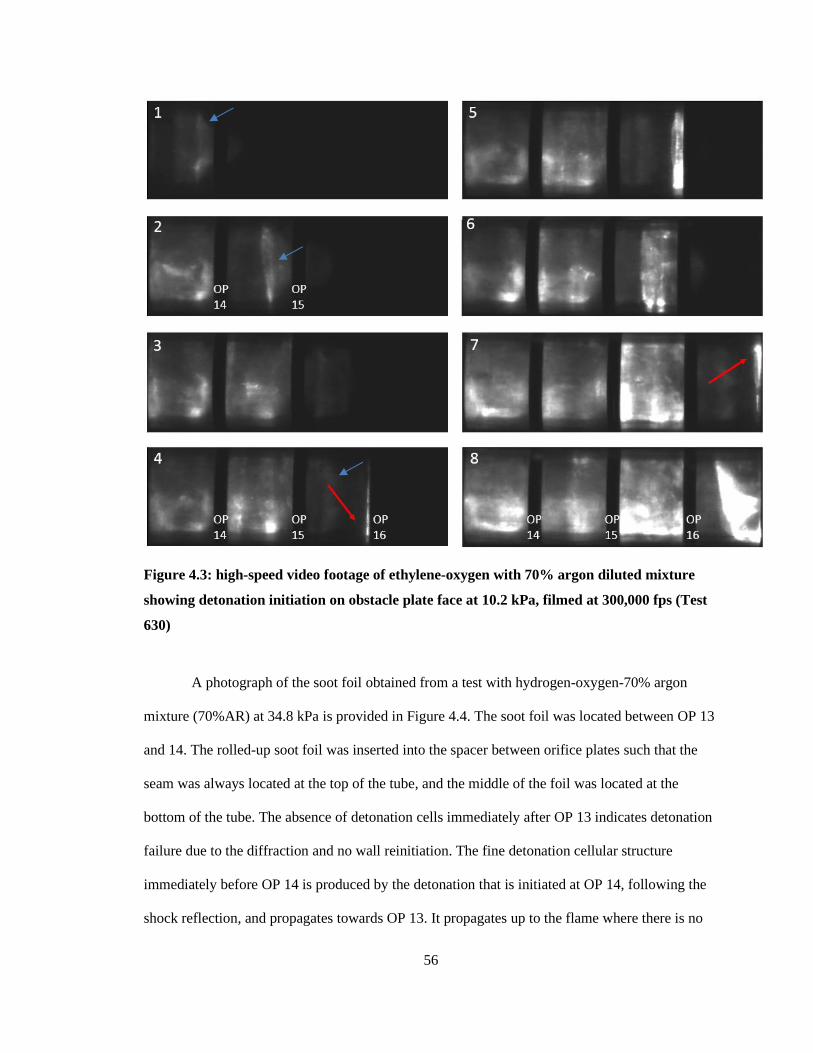
56
Figure 4.3: high-speed video footage of ethylene-oxygen with 70% argon diluted mixture
showing detonation initiation on obstacle plate face at 10.2 kPa, filmed at 300,000 fps (Test
630)
A photograph of the soot foil obtained from a test with hydrogen-oxygen-70% argon
mixture (70%AR) at 34.8 kPa is provided in Figure 4.4. The soot foil was located between OP 13
and 14. The rolled-up soot foil was inserted into the spacer between orifice plates such that the
seam was always located at the top of the tube, and the middle of the foil was located at the
bottom of the tube. The absence of detonation cells immediately after OP 13 indicates detonation
failure due to the diffraction and no wall reinitiation. The fine detonation cellular structure
immediately before OP 14 is produced by the detonation that is initiated at OP 14, following the
shock reflection, and propagates towards OP 13. It propagates up to the flame where there is no
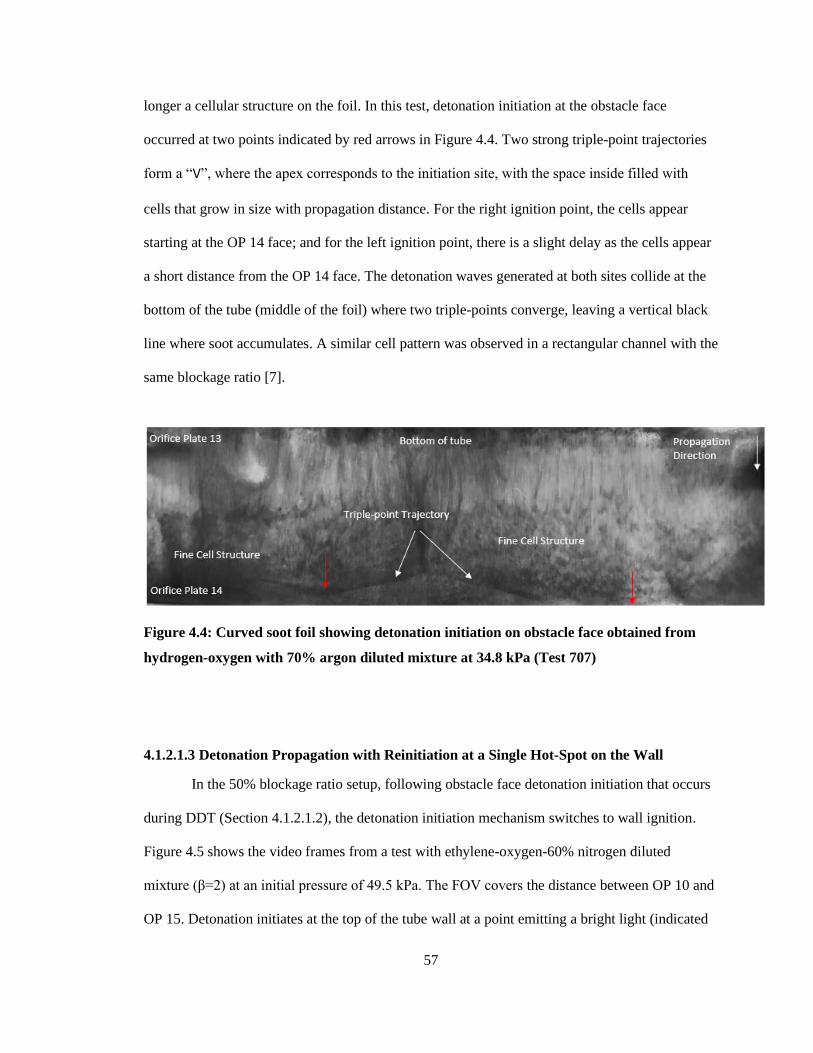
57
longer a cellular structure on the foil. In this test, detonation initiation at the obstacle face
occurred at two points indicated by red arrows in Figure 4.4. Two strong triple-point trajectories
form a “V”, where the apex corresponds to the initiation site, with the space inside filled with
cells that grow in size with propagation distance. For the right ignition point, the cells appear
starting at the OP 14 face; and for the left ignition point, there is a slight delay as the cells appear
a short distance from the OP 14 face. The detonation waves generated at both sites collide at the
bottom of the tube (middle of the foil) where two triple-points converge, leaving a vertical black
line where soot accumulates. A similar cell pattern was observed in a rectangular channel with the
same blockage ratio [7].
Figure 4.4: Curved soot foil showing detonation initiation on obstacle face obtained from
hydrogen-oxygen with 70% argon diluted mixture at 34.8 kPa (Test 707)
4.1.2.1.3 Detonation Propagation with Reinitiation at a Single Hot-Spot on the Wall
In the 50% blockage ratio setup, following obstacle face detonation initiation that occurs
during DDT (Section 4.1.2.1.2), the detonation initiation mechanism switches to wall ignition.
Figure 4.5 shows the video frames from a test with ethylene-oxygen-60% nitrogen diluted
mixture (β=2) at an initial pressure of 49.5 kPa. The FOV covers the distance between OP 10 and
OP 15. Detonation initiates at the top of the tube wall at a point emitting a bright light (indicated
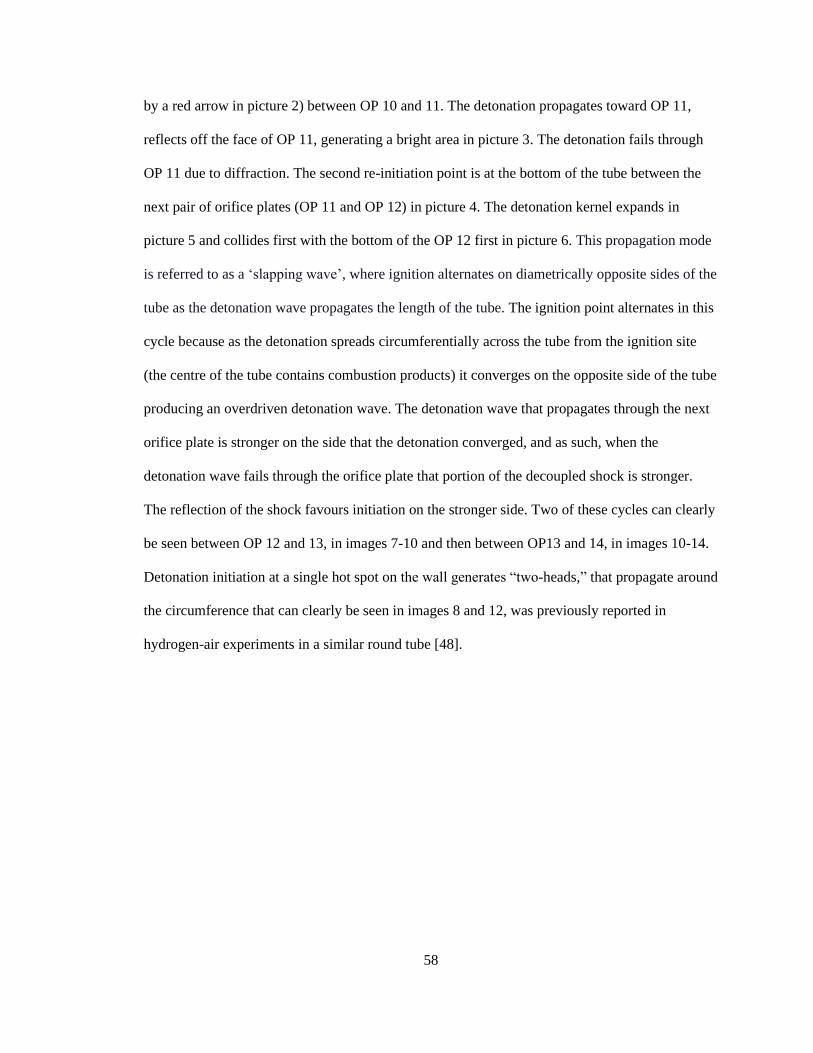
58
by a red arrow in picture 2) between OP 10 and 11. The detonation propagates toward OP 11,
reflects off the face of OP 11, generating a bright area in picture 3. The detonation fails through
OP 11 due to diffraction. The second re-initiation point is at the bottom of the tube between the
next pair of orifice plates (OP 11 and OP 12) in picture 4. The detonation kernel expands in
picture 5 and collides first with the bottom of the OP 12 first in picture 6. This propagation mode
is referred to as a ‘slapping wave’, where ignition alternates on diametrically opposite sides of the
tube as the detonation wave propagates the length of the tube. The ignition point alternates in this
cycle because as the detonation spreads circumferentially across the tube from the ignition site
(the centre of the tube contains combustion products) it converges on the opposite side of the tube
producing an overdriven detonation wave. The detonation wave that propagates through the next
orifice plate is stronger on the side that the detonation converged, and as such, when the
detonation wave fails through the orifice plate that portion of the decoupled shock is stronger.
The reflection of the shock favours initiation on the stronger side. Two of these cycles can clearly
be seen between OP 12 and 13, in images 7-10 and then between OP13 and 14, in images 10-14.
Detonation initiation at a single hot spot on the wall generates “two-heads,” that propagate around
the circumference that can clearly be seen in images 8 and 12, was previously reported in
hydrogen-air experiments in a similar round tube [48].
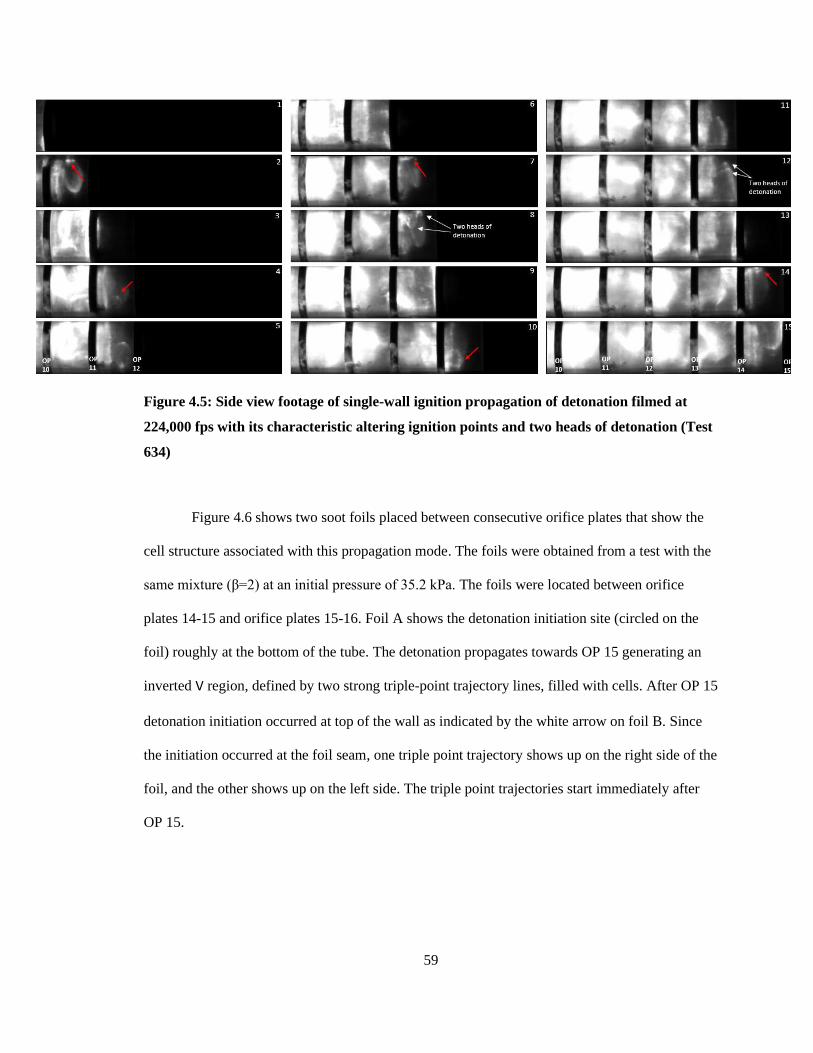
59
Figure 4.5: Side view footage of single-wall ignition propagation of detonation filmed at
224,000 fps with its characteristic altering ignition points and two heads of detonation (Test
634)
Figure 4.6 shows two soot foils placed between consecutive orifice plates that show the
cell structure associated with this propagation mode. The foils were obtained from a test with the
same mixture (β=2) at an initial pressure of 35.2 kPa. The foils were located between orifice
plates 14-15 and orifice plates 15-16. Foil A shows the detonation initiation site (circled on the
foil) roughly at the bottom of the tube. The detonation propagates towards OP 15 generating an
inverted V region, defined by two strong triple-point trajectory lines, filled with cells. After OP 15
detonation initiation occurred at top of the wall as indicated by the white arrow on foil B. Since
the initiation occurred at the foil seam, one triple point trajectory shows up on the right side of the
foil, and the other shows up on the left side. The triple point trajectories start immediately after
OP 15.
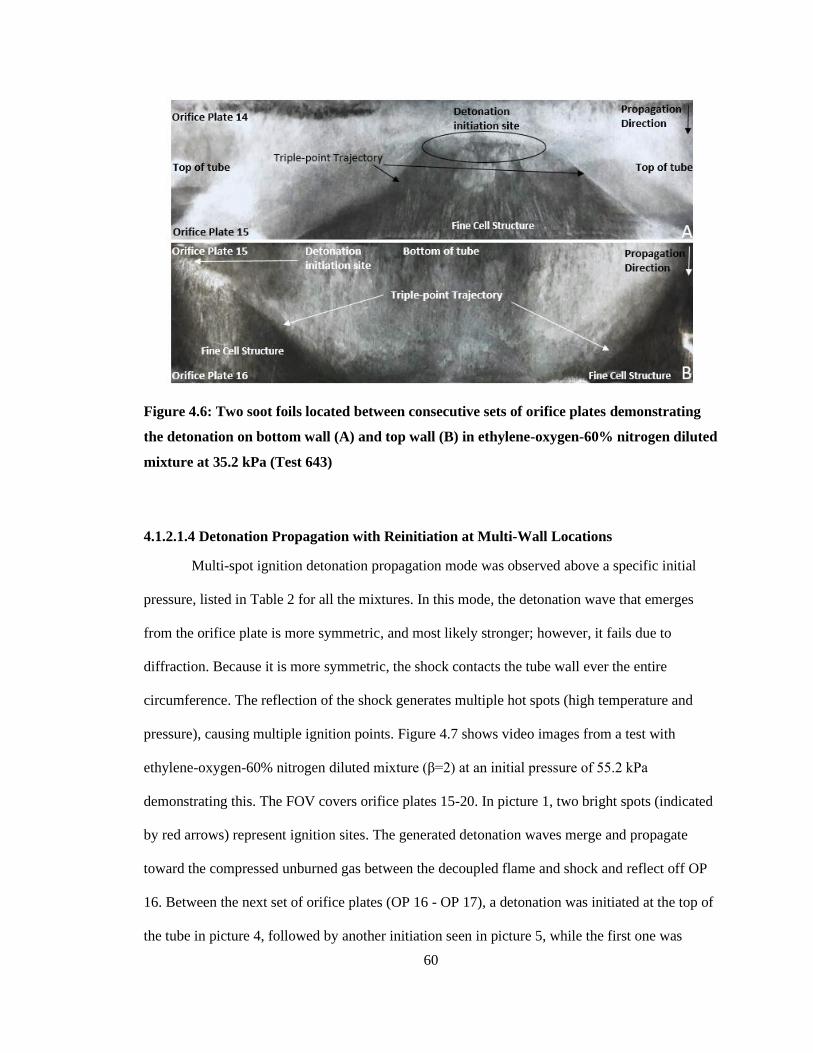
60
Figure 4.6: Two soot foils located between consecutive sets of orifice plates demonstrating
the detonation on bottom wall (A) and top wall (B) in ethylene-oxygen-60% nitrogen diluted
mixture at 35.2 kPa (Test 643)
4.1.2.1.4 Detonation Propagation with Reinitiation at Multi-Wall Locations
Multi-spot ignition detonation propagation mode was observed above a specific initial
pressure, listed in Table 2 for all the mixtures. In this mode, the detonation wave that emerges
from the orifice plate is more symmetric, and most likely stronger; however, it fails due to
diffraction. Because it is more symmetric, the shock contacts the tube wall ever the entire
circumference. The reflection of the shock generates multiple hot spots (high temperature and
pressure), causing multiple ignition points. Figure 4.7 shows video images from a test with
ethylene-oxygen-60% nitrogen diluted mixture (β=2) at an initial pressure of 55.2 kPa
demonstrating this. The FOV covers orifice plates 15-20. In picture 1, two bright spots (indicated
by red arrows) represent ignition sites. The generated detonation waves merge and propagate
toward the compressed unburned gas between the decoupled flame and shock and reflect off OP
16. Between the next set of orifice plates (OP 16 - OP 17), a detonation was initiated at the top of
the tube in picture 4, followed by another initiation seen in picture 5, while the first one was
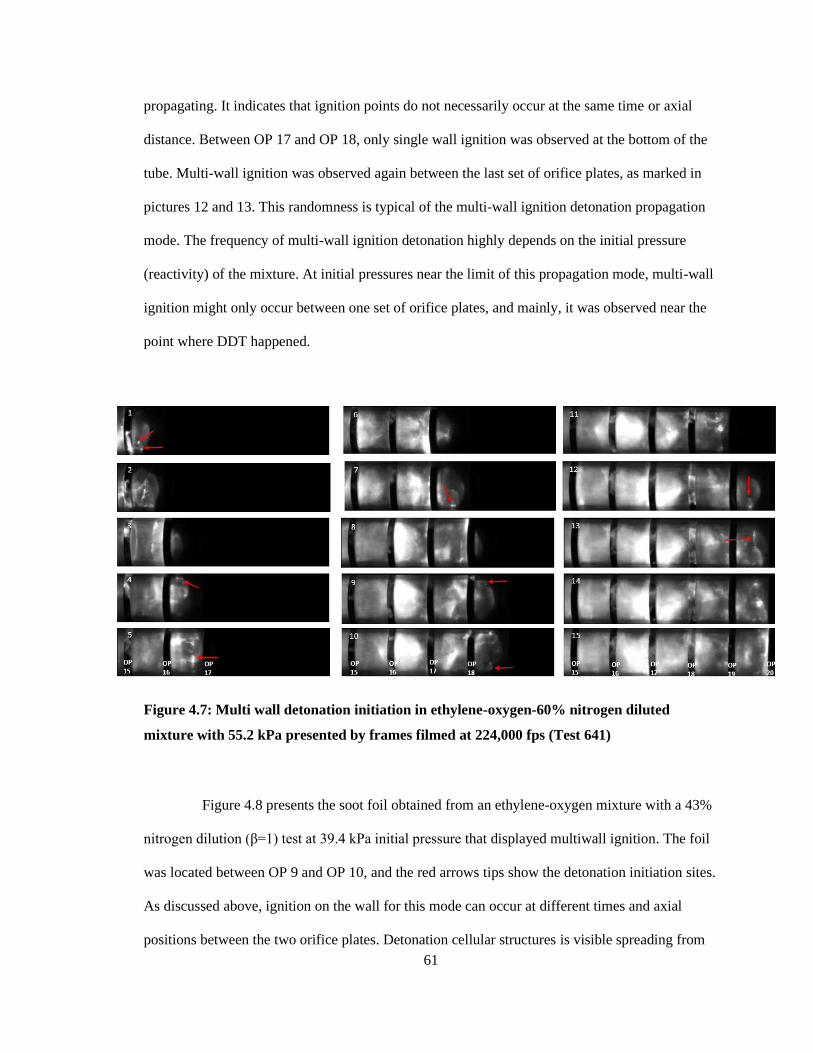
61
propagating. It indicates that ignition points do not necessarily occur at the same time or axial
distance. Between OP 17 and OP 18, only single wall ignition was observed at the bottom of the
tube. Multi-wall ignition was observed again between the last set of orifice plates, as marked in
pictures 12 and 13. This randomness is typical of the multi-wall ignition detonation propagation
mode. The frequency of multi-wall ignition detonation highly depends on the initial pressure
(reactivity) of the mixture. At initial pressures near the limit of this propagation mode, multi-wall
ignition might only occur between one set of orifice plates, and mainly, it was observed near the
point where DDT happened.
Figure 4.7: Multi wall detonation initiation in ethylene-oxygen-60% nitrogen diluted
mixture with 55.2 kPa presented by frames filmed at 224,000 fps (Test 641)
Figure 4.8 presents the soot foil obtained from an ethylene-oxygen mixture with a 43%
nitrogen dilution (β=1) test at 39.4 kPa initial pressure that displayed multiwall ignition. The foil
was located between OP 9 and OP 10, and the red arrows tips show the detonation initiation sites.
As discussed above, ignition on the wall for this mode can occur at different times and axial
positions between the two orifice plates. Detonation cellular structures is visible spreading from
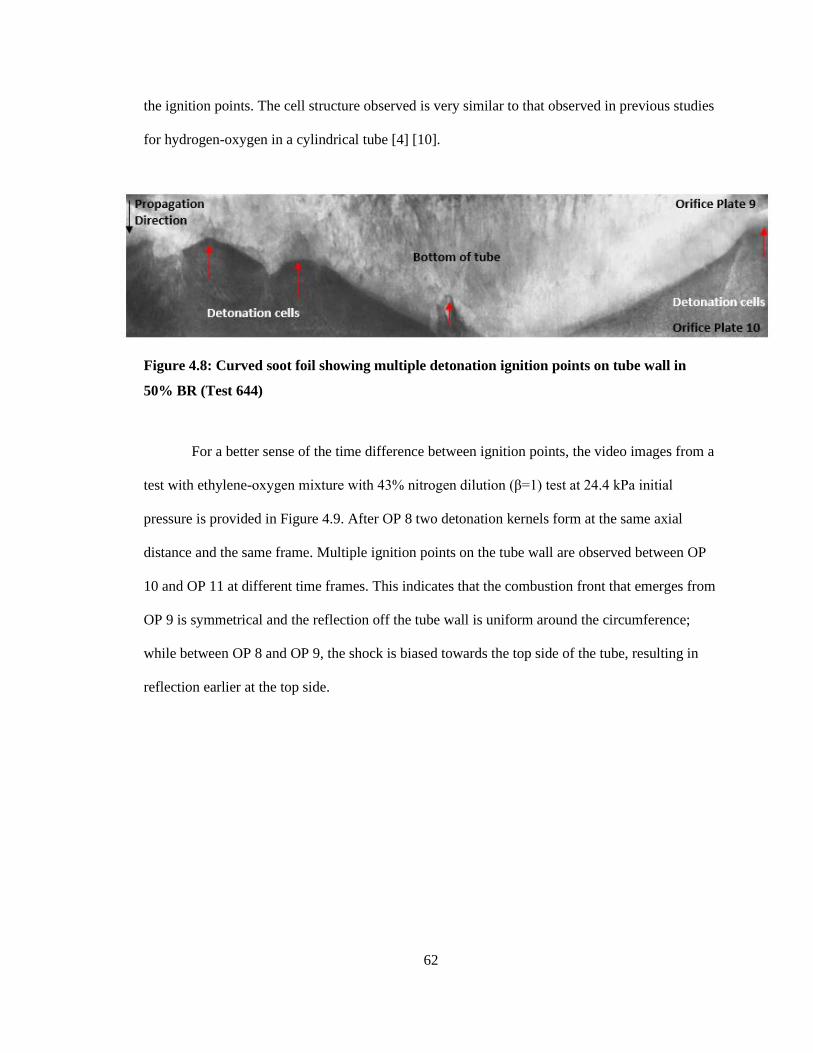
62
the ignition points. The cell structure observed is very similar to that observed in previous studies
for hydrogen-oxygen in a cylindrical tube [4] [10].
Figure 4.8: Curved soot foil showing multiple detonation ignition points on tube wall in
50% BR (Test 644)
For a better sense of the time difference between ignition points, the video images from a
test with ethylene-oxygen mixture with 43% nitrogen dilution (β=1) test at 24.4 kPa initial
pressure is provided in Figure 4.9. After OP 8 two detonation kernels form at the same axial
distance and the same frame. Multiple ignition points on the tube wall are observed between OP
10 and OP 11 at different time frames. This indicates that the combustion front that emerges from
OP 9 is symmetrical and the reflection off the tube wall is uniform around the circumference;
while between OP 8 and OP 9, the shock is biased towards the top side of the tube, resulting in
reflection earlier at the top side.
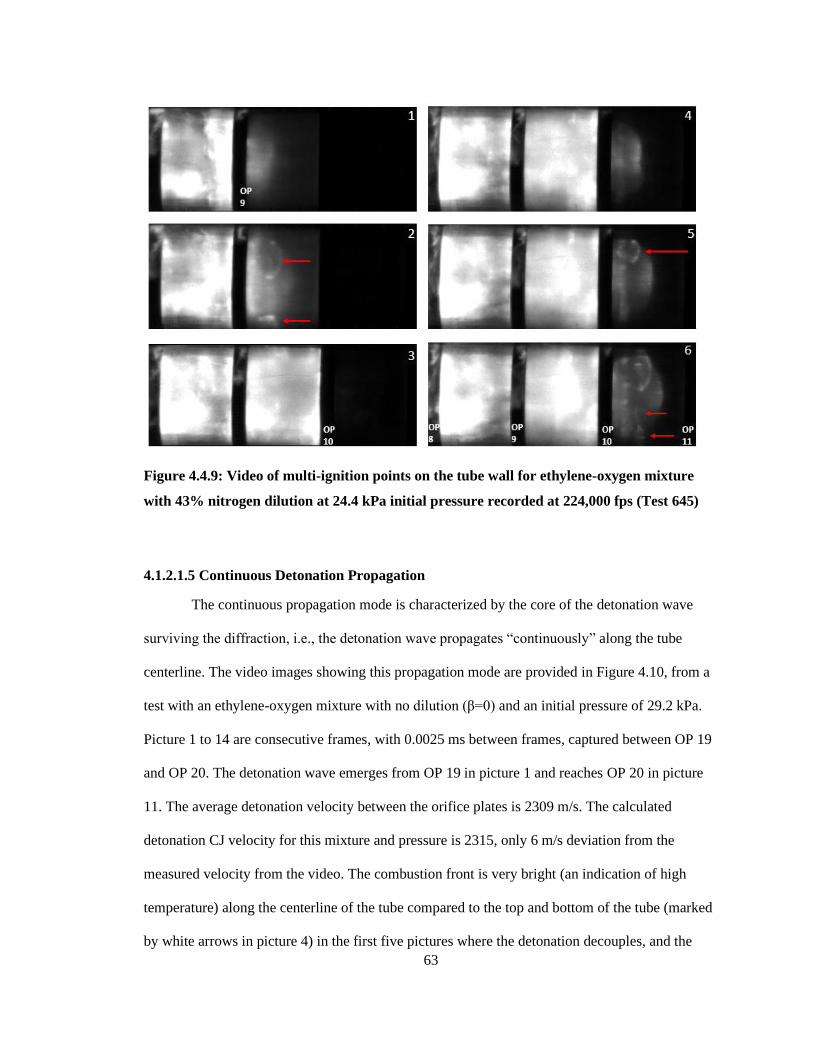
63
Figure 4.4.9: Video of multi-ignition points on the tube wall for ethylene-oxygen mixture
with 43% nitrogen dilution at 24.4 kPa initial pressure recorded at 224,000 fps (Test 645)
4.1.2.1.5 Continuous Detonation Propagation
The continuous propagation mode is characterized by the core of the detonation wave
surviving the diffraction, i.e., the detonation wave propagates “continuously” along the tube
centerline. The video images showing this propagation mode are provided in Figure 4.10, from a
test with an ethylene-oxygen mixture with no dilution (β=0) and an initial pressure of 29.2 kPa.
Picture 1 to 14 are consecutive frames, with 0.0025 ms between frames, captured between OP 19
and OP 20. The detonation wave emerges from OP 19 in picture 1 and reaches OP 20 in picture
11. The average detonation velocity between the orifice plates is 2309 m/s. The calculated
detonation CJ velocity for this mixture and pressure is 2315, only 6 m/s deviation from the
measured velocity from the video. The combustion front is very bright (an indication of high
temperature) along the centerline of the tube compared to the top and bottom of the tube (marked
by white arrows in picture 4) in the first five pictures where the detonation decouples, and the
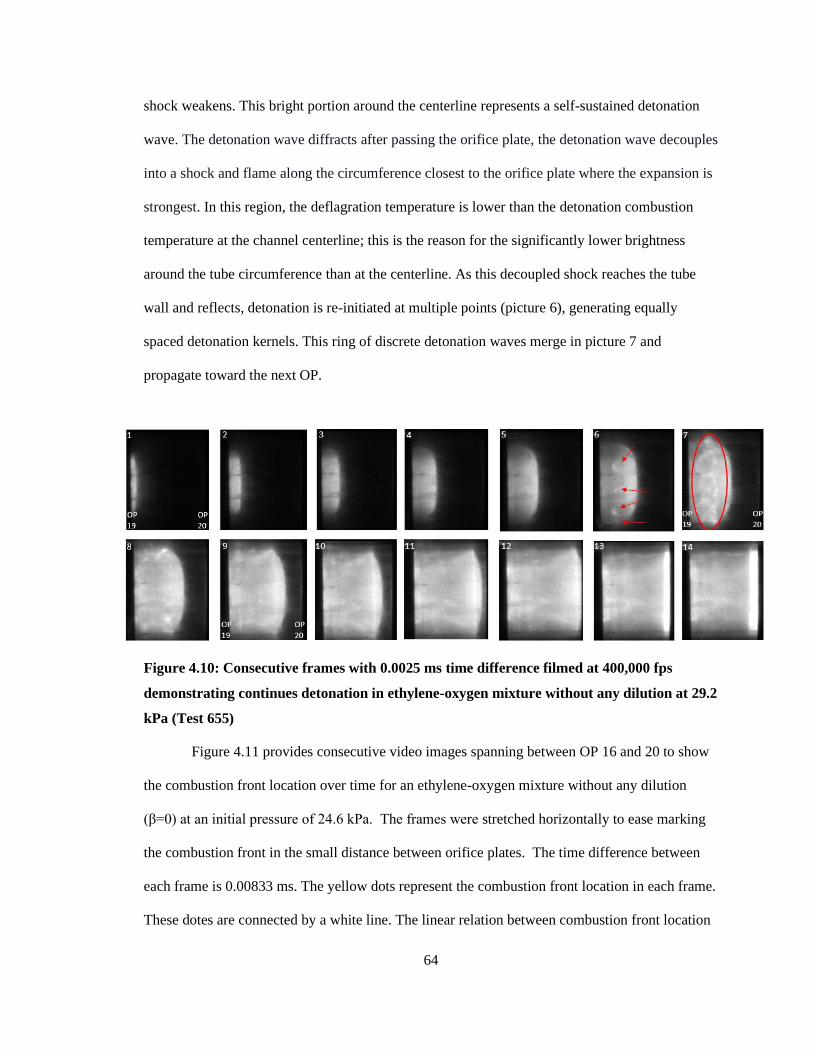
64
shock weakens. This bright portion around the centerline represents a self-sustained detonation
wave. The detonation wave diffracts after passing the orifice plate, the detonation wave decouples
into a shock and flame along the circumference closest to the orifice plate where the expansion is
strongest. In this region, the deflagration temperature is lower than the detonation combustion
temperature at the channel centerline; this is the reason for the significantly lower brightness
around the tube circumference than at the centerline. As this decoupled shock reaches the tube
wall and reflects, detonation is re-initiated at multiple points (picture 6), generating equally
spaced detonation kernels. This ring of discrete detonation waves merge in picture 7 and
propagate toward the next OP.
Figure 4.10: Consecutive frames with 0.0025 ms time difference filmed at 400,000 fps
demonstrating continues detonation in ethylene-oxygen mixture without any dilution at 29.2
kPa (Test 655)
Figure 4.11 provides consecutive video images spanning between OP 16 and 20 to show
the combustion front location over time for an ethylene-oxygen mixture without any dilution
(β=0) at an initial pressure of 24.6 kPa. The frames were stretched horizontally to ease marking
the combustion front in the small distance between orifice plates. The time difference between
each frame is 0.00833 ms. The yellow dots represent the combustion front location in each frame.
These dotes are connected by a white line. The linear relation between combustion front location
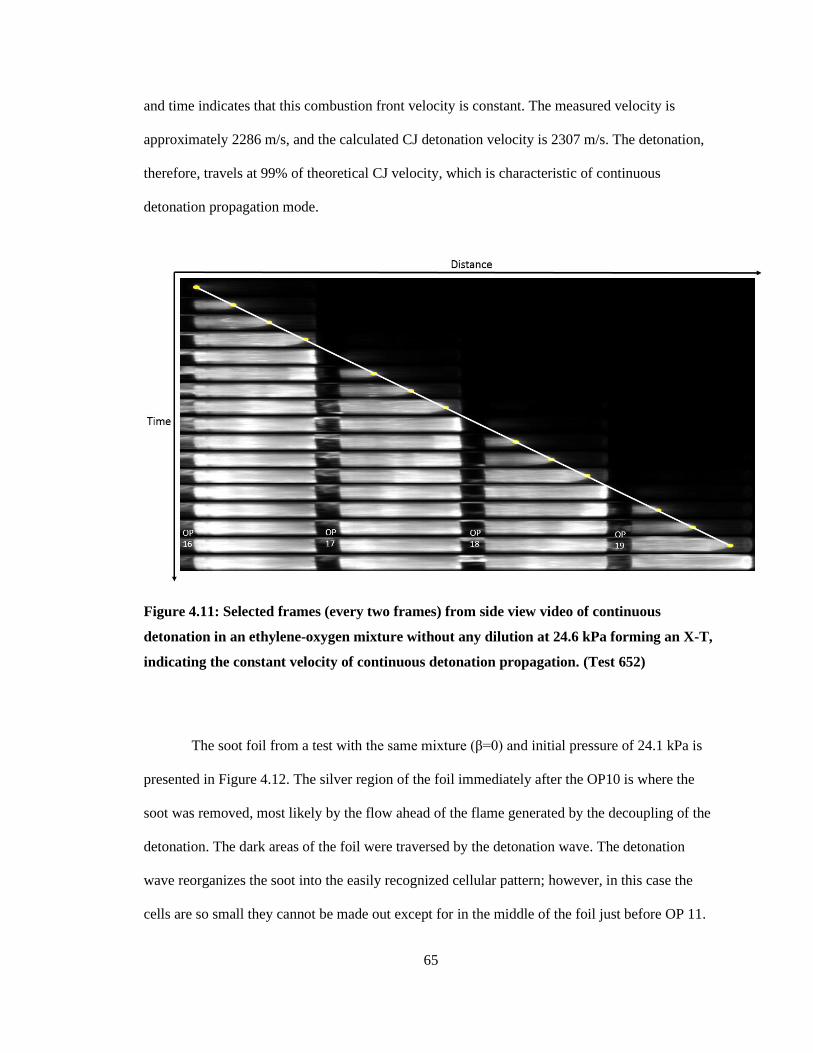
65
and time indicates that this combustion front velocity is constant. The measured velocity is
approximately 2286 m/s, and the calculated CJ detonation velocity is 2307 m/s. The detonation,
therefore, travels at 99% of theoretical CJ velocity, which is characteristic of continuous
detonation propagation mode.
Figure 4.11: Selected frames (every two frames) from side view video of continuous
detonation in an ethylene-oxygen mixture without any dilution at 24.6 kPa forming an X-T,
indicating the constant velocity of continuous detonation propagation. (Test 652)
The soot foil from a test with the same mixture (β=0) and initial pressure of 24.1 kPa is
presented in Figure 4.12. The silver region of the foil immediately after the OP10 is where the
soot was removed, most likely by the flow ahead of the flame generated by the decoupling of the
detonation. The dark areas of the foil were traversed by the detonation wave. The detonation
wave reorganizes the soot into the easily recognized cellular pattern; however, in this case the
cells are so small they cannot be made out except for in the middle of the foil just before OP 11.
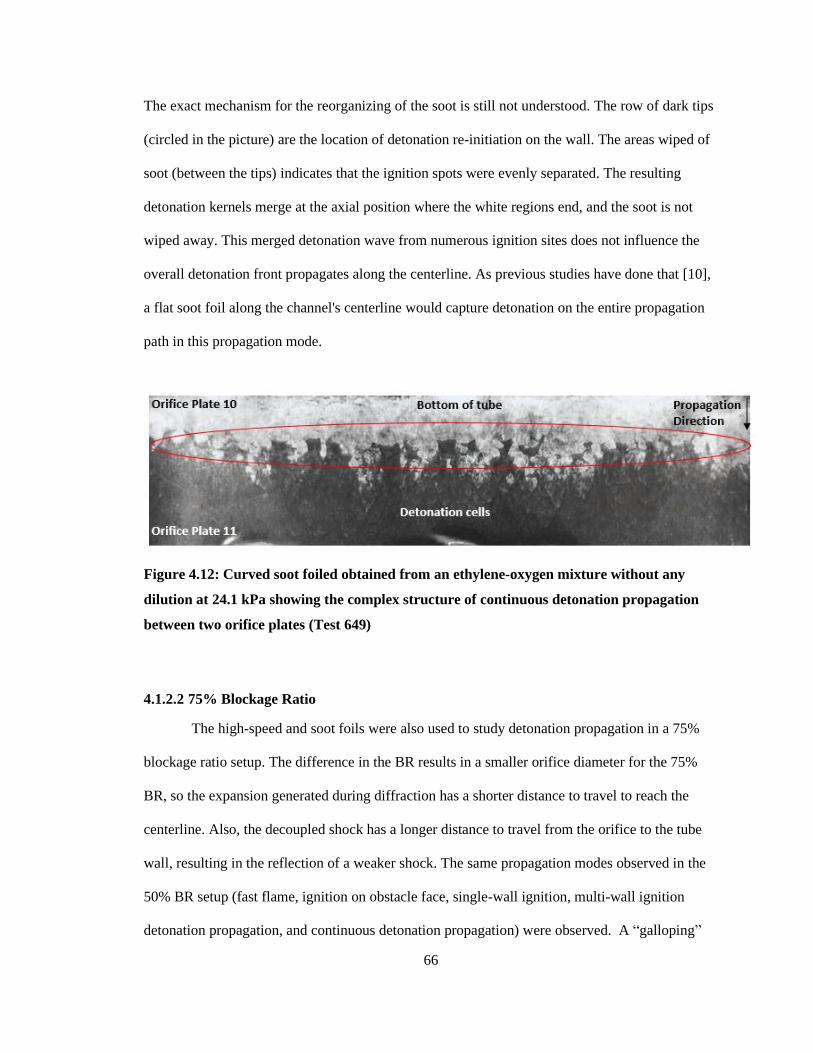
66
The exact mechanism for the reorganizing of the soot is still not understood. The row of dark tips
(circled in the picture) are the location of detonation re-initiation on the wall. The areas wiped of
soot (between the tips) indicates that the ignition spots were evenly separated. The resulting
detonation kernels merge at the axial position where the white regions end, and the soot is not
wiped away. This merged detonation wave from numerous ignition sites does not influence the
overall detonation front propagates along the centerline. As previous studies have done that [10],
a flat soot foil along the channel's centerline would capture detonation on the entire propagation
path in this propagation mode.
Figure 4.12: Curved soot foiled obtained from an ethylene-oxygen mixture without any
dilution at 24.1 kPa showing the complex structure of continuous detonation propagation
between two orifice plates (Test 649)
4.1.2.2 75% Blockage Ratio
The high-speed and soot foils were also used to study detonation propagation in a 75%
blockage ratio setup. The difference in the BR results in a smaller orifice diameter for the 75%
BR, so the expansion generated during diffraction has a shorter distance to travel to reach the
centerline. Also, the decoupled shock has a longer distance to travel from the orifice to the tube
wall, resulting in the reflection of a weaker shock. The same propagation modes observed in the
50% BR setup (fast flame, ignition on obstacle face, single-wall ignition, multi-wall ignition
detonation propagation, and continuous detonation propagation) were observed. A “galloping”
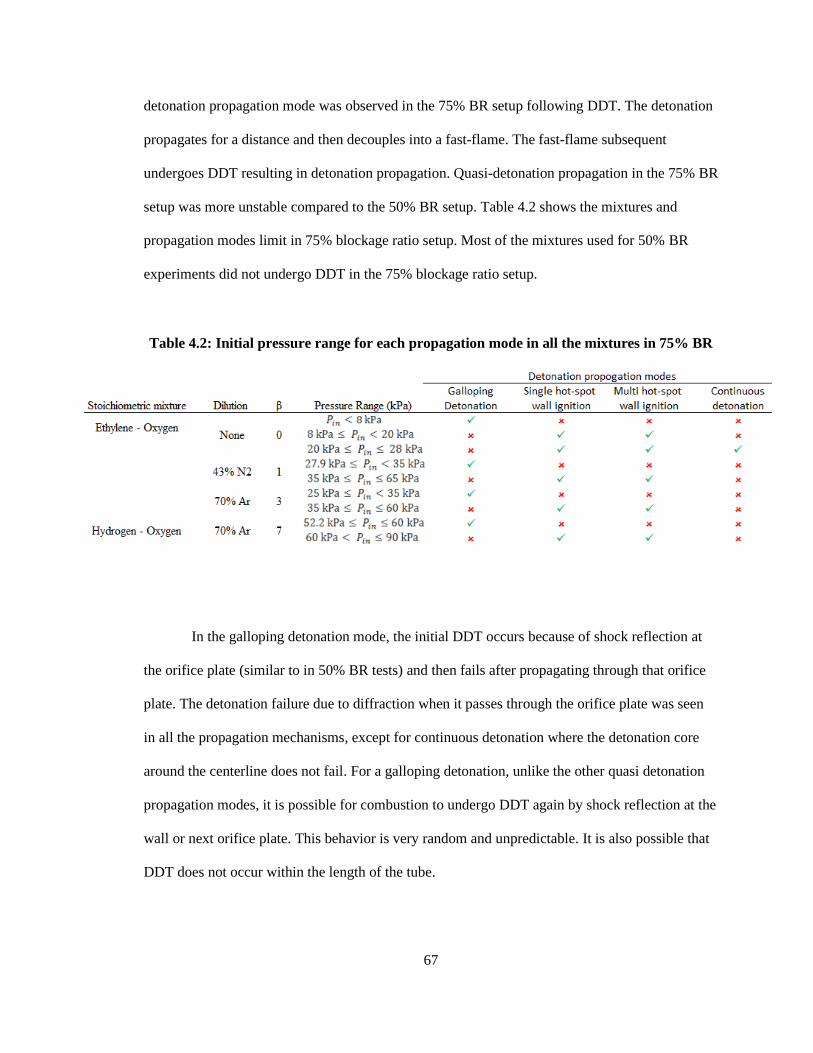
67
detonation propagation mode was observed in the 75% BR setup following DDT. The detonation
propagates for a distance and then decouples into a fast-flame. The fast-flame subsequent
undergoes DDT resulting in detonation propagation. Quasi-detonation propagation in the 75% BR
setup was more unstable compared to the 50% BR setup. Table 4.2 shows the mixtures and
propagation modes limit in 75% blockage ratio setup. Most of the mixtures used for 50% BR
experiments did not undergo DDT in the 75% blockage ratio setup.
Table 4.2: Initial pressure range for each propagation mode in all the mixtures in 75% BR
In the galloping detonation mode, the initial DDT occurs because of shock reflection at
the orifice plate (similar to in 50% BR tests) and then fails after propagating through that orifice
plate. The detonation failure due to diffraction when it passes through the orifice plate was seen
in all the propagation mechanisms, except for continuous detonation where the detonation core
around the centerline does not fail. For a galloping detonation, unlike the other quasi detonation
propagation modes, it is possible for combustion to undergo DDT again by shock reflection at the
wall or next orifice plate. This behavior is very random and unpredictable. It is also possible that
DDT does not occur within the length of the tube.
68
In the 75% BR setup, the single-wall ignition propagation mode was rarely observed and
is always transient. Unlike the 50% BR setup, whenever single-wall ignition was observed, multi-
wall ignition was also observed in the same test.
The continuous detonation propagation mode was only observed in stoichiometric
ethylene-oxygen mixture with no dilution (β=0) for initial pressures equal to or greater than 20
kPa.
4.1.2.2.1 Fast Flame Regime
Video images are provided in Figure 4.13 for a test with an ethylene-oxygen mixture
without any dilution (β=0) at an initial pressure of 5.7 kPa that produced a fast-flame. The flame
that is very faint (due to the low pressure) passes through OP 15 in picture 3 and reaches OP 16 in
p 6. The interaction of the reflected shock and flame in pictures 7 and 9 generates a characteristic
bright spot at the centreline. DDT was not observed in this FOV that only includes 3 orifice
plates; however, since 5.7 kPa is above the DDT limit for this mixture, DDT would occur at some
point further down the channel.
Figure 4.13: High speed video recorded at 300,000 fps showing fast flame propagation in
75% BR for ethylene-oxygen mixture without any dilution at initial pressure of 5.7 kPa
(Test 214)
69
4.1.2.2.2 Galloping Detonation
Figure 4.14 shows video images demonstrating the galloping mode in a stoichiometric
hydrogen-oxygen mixture with 70% argon dilution (70% AR). Fast flame propagation is
observed between OP 17 and OP 18 in picture 1 with the characteristic bright spot. DDT occurs
for the first time on the bottom of OP 19 face (marked by the red arrow in picture 2). The red
circle in picture 2 between OP 17 and OP 18 indicates ignition behind the flame front. This
phenomenon is described in Section 4.1.2.6. The detonation initiated at OP 19 passes through that
orifice plate, fails due to diffraction, and is reinitiated at the OP 20 face in picture 3. The same
behavior was observed between OP 20 and OP 21, where detonation was reinitiated at the OP 21
face. However, detonation is not reinitiated on the face of the next orifice plate, and the
combustion propagates as a fast-flame throughout the rest of the tube. The development of a fast-
flame after detonation failure is a characteristic of the 75% BR setup. The average flame velocity
of this test was 622 m/s, while the calculated products speed of sound and detonation CJ velocity
are 876 m/s and 1674 m/s, respectively. This shows that although a detonation forms, the average
combustion velocity is well below the products speed of sound. This is a characteristic of
galloping detonation mode where detonation propagation does not increase the average velocity
to the value greater than the speed of sound in the products.
70
Figure 4.14: Galloping detonation propagation in hydrogen-oxygen mixture with 70%
argon dilution at 52.2 kPa presented as the frames of a video, recorded at 150,000 fps (Test
186)
Figure 4.15 shows the soot foil obtained from another test with the same mixture (β=0) at
7.3 kPa. The foil was located between orifice plates 11 and 12. The fine detonation cellular
structure near OP 12 indicates that detonation initiation occurs at the face of OP 12. Red arrows
mark two ignition sites on the foil in the vicinity of the top of the tube. The magnified area of one
of the initiation sites is demonstrated in Figure 4.15. Two triple-point trajectories generated by
detonation initiation are marked. They both start at the same point, indicating the location of
detonation initiation. The cellular pattern of detonation structure is more visible in the magnified
picture
71
Figure 4.15: Evidence of detonation initiation on obstacle face due to the galloping
detonation propagation in an ethylene-oxygen mixture with no dilution at 7.3 kPa, obtained
by a curved soot foil (Test 55)
4.1.2.3 Single Hot-Spot Wall Ignition Detonation
Unlike in a 50% BR setup, the single hot-spot wall ignition detonation propagation
mechanism is very unstable in a 75% BR setup. As discussed in 50% blockage ratio results, this
mode is stronger than ignition on obstacle face mode and weaker than multi hot-spot wall ignition
mode. Therefore, when detonation starts propagating in this mode, it is likely that it will switch to
either orifice plate face ignition mode or multi-wall ignition mode. Figure 4.16 shows video
images from a test with an ethylene-oxygen mixture without any dilution (β=0) at an initial
pressure of 11.2 kPa. The combustion front emerging from OP 12 is faintly visible in picture 1.
The combustion is significantly brighter at the tube centerline compared to the top and bottom of
the tube in picture 2. This is typical of a coupled detonation at the centerline and decoupled
around the tube periphery due to diffraction, as explained in Section 4.1.2.1.5. Eventually,
detonation completely fails, passing half of the way to OP 13, as seen in picture 3. The reflection
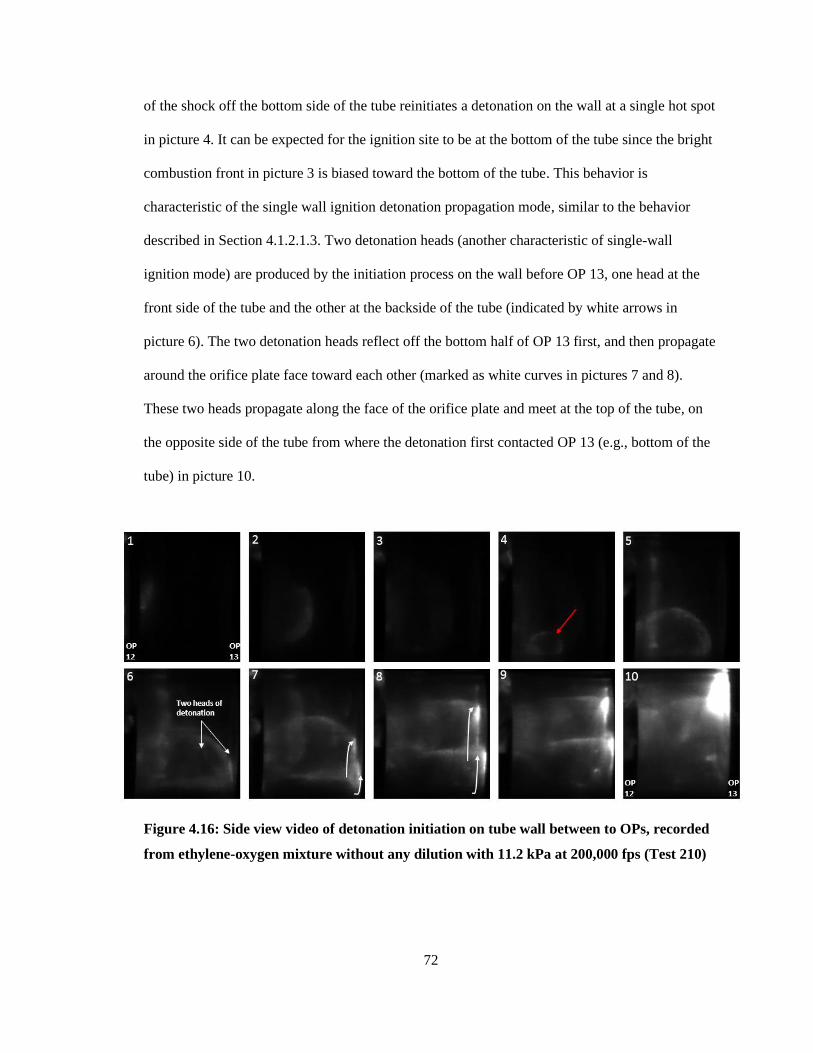
72
of the shock off the bottom side of the tube reinitiates a detonation on the wall at a single hot spot
in picture 4. It can be expected for the ignition site to be at the bottom of the tube since the bright
combustion front in picture 3 is biased toward the bottom of the tube. This behavior is
characteristic of the single wall ignition detonation propagation mode, similar to the behavior
described in Section 4.1.2.1.3. Two detonation heads (another characteristic of single-wall
ignition mode) are produced by the initiation process on the wall before OP 13, one head at the
front side of the tube and the other at the backside of the tube (indicated by white arrows in
picture 6). The two detonation heads reflect off the bottom half of OP 13 first, and then propagate
around the orifice plate face toward each other (marked as white curves in pictures 7 and 8).
These two heads propagate along the face of the orifice plate and meet at the top of the tube, on
the opposite side of the tube from where the detonation first contacted OP 13 (e.g., bottom of the
tube) in picture 10.
Figure 4.16: Side view video of detonation initiation on tube wall between to OPs, recorded
from ethylene-oxygen mixture without any dilution with 11.2 kPa at 200,000 fps (Test 210)
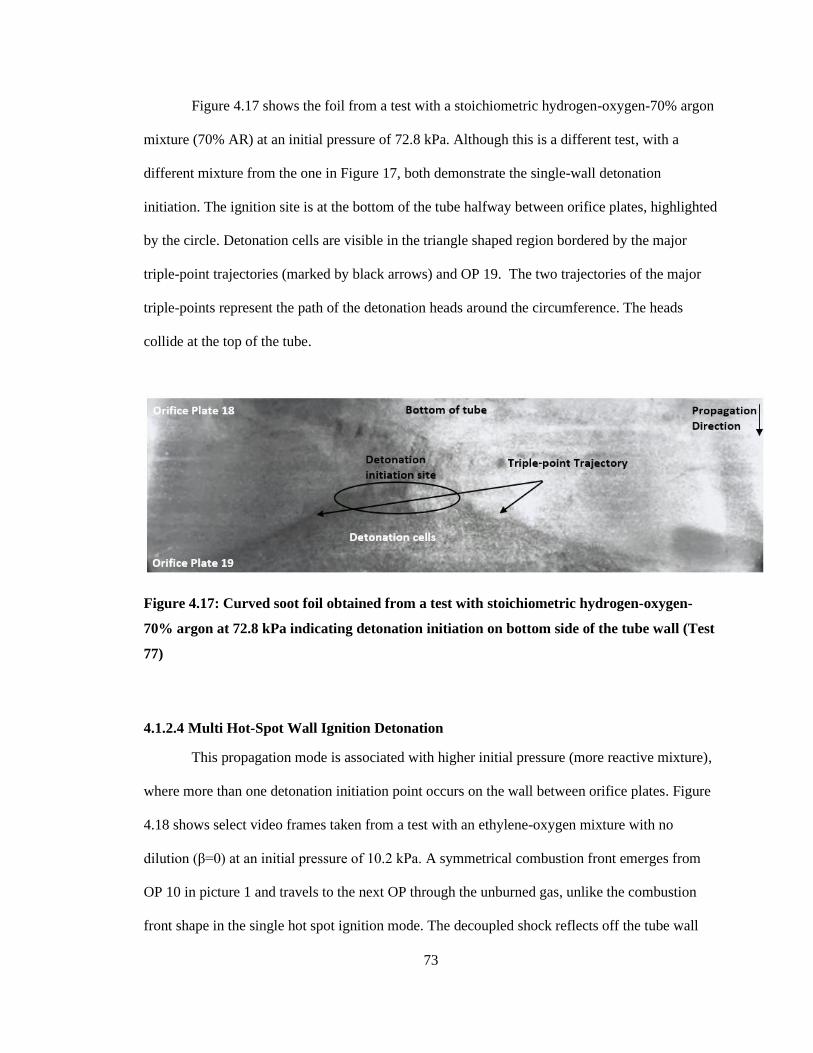
73
Figure 4.17 shows the foil from a test with a stoichiometric hydrogen-oxygen-70% argon
mixture (70% AR) at an initial pressure of 72.8 kPa. Although this is a different test, with a
different mixture from the one in Figure 17, both demonstrate the single-wall detonation
initiation. The ignition site is at the bottom of the tube halfway between orifice plates, highlighted
by the circle. Detonation cells are visible in the triangle shaped region bordered by the major
triple-point trajectories (marked by black arrows) and OP 19. The two trajectories of the major
triple-points represent the path of the detonation heads around the circumference. The heads
collide at the top of the tube.
Figure 4.17: Curved soot foil obtained from a test with stoichiometric hydrogen-oxygen-
70% argon at 72.8 kPa indicating detonation initiation on bottom side of the tube wall (Test
77)
4.1.2.4 Multi Hot-Spot Wall Ignition Detonation
This propagation mode is associated with higher initial pressure (more reactive mixture),
where more than one detonation initiation point occurs on the wall between orifice plates. Figure
4.18 shows select video frames taken from a test with an ethylene-oxygen mixture with no
dilution (β=0) at an initial pressure of 10.2 kPa. A symmetrical combustion front emerges from
OP 10 in picture 1 and travels to the next OP through the unburned gas, unlike the combustion
front shape in the single hot spot ignition mode. The decoupled shock reflects off the tube wall
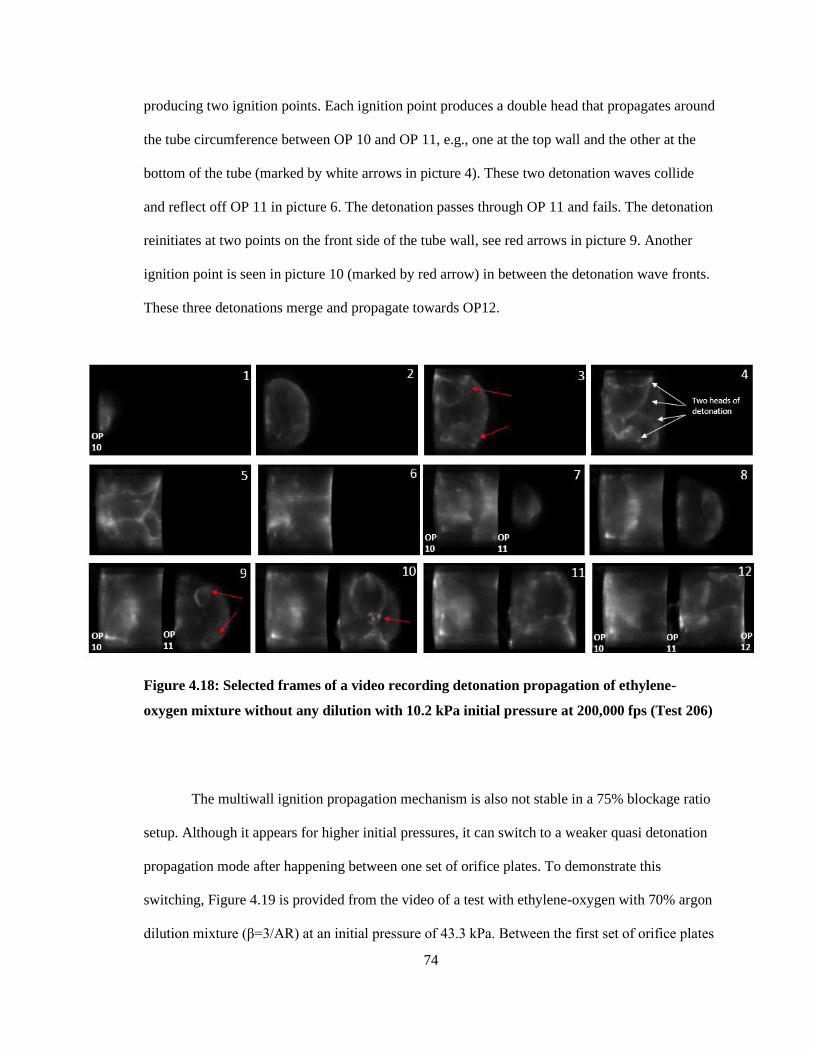
74
producing two ignition points. Each ignition point produces a double head that propagates around
the tube circumference between OP 10 and OP 11, e.g., one at the top wall and the other at the
bottom of the tube (marked by white arrows in picture 4). These two detonation waves collide
and reflect off OP 11 in picture 6. The detonation passes through OP 11 and fails. The detonation
reinitiates at two points on the front side of the tube wall, see red arrows in picture 9. Another
ignition point is seen in picture 10 (marked by red arrow) in between the detonation wave fronts.
These three detonations merge and propagate towards OP12.
Figure 4.18: Selected frames of a video recording detonation propagation of ethylene-
oxygen mixture without any dilution with 10.2 kPa initial pressure at 200,000 fps (Test 206)
The multiwall ignition propagation mechanism is also not stable in a 75% blockage ratio
setup. Although it appears for higher initial pressures, it can switch to a weaker quasi detonation
propagation mode after happening between one set of orifice plates. To demonstrate this
switching, Figure 4.19 is provided from the video of a test with ethylene-oxygen with 70% argon
dilution mixture (β=3/AR) at an initial pressure of 43.3 kPa. Between the first set of orifice plates
75
in the FOV (OP 8 and OP 9), detonation is ignited at (at least) four points marked by red arrows
in picture 3. Between the next set of orifice plates (OP 9 and OP 10), detonation completely fails
reinitiates at the face of OP 10. Therefore, the detonation propagation mode is altered from multi-
wall ignition to orifice plate ignition mode, which was seen in much lower initial pressures in this
mixture. Between OP 10 and OP 11 same mode was observed where detonation initiated on the
face of OP 11 due to shock reflection. Another change in propagation mode happens between the
next set of orifice plates (OP 11 and OP 12), where reinitiation occurs at the back wall (picture 9)
and starts to wrap around, multiple ignitions are then observed in picture 10 and picture 11. These
detonation waves merge in picture 12 and reflect off OP 12. Finally ignition between the last
orifice plates (OP 12 and OP 13) happens at the bottom of the tube, at a single ignition point on
the wall as marked by a red arrow in picture 14. In this limited FOV between OP 8 and OP 13,
the propagation mode changed three times from multi-wall ignition to orifice plate face ignition
and back to multi-wall ignition again, and finally to single wall ignition.
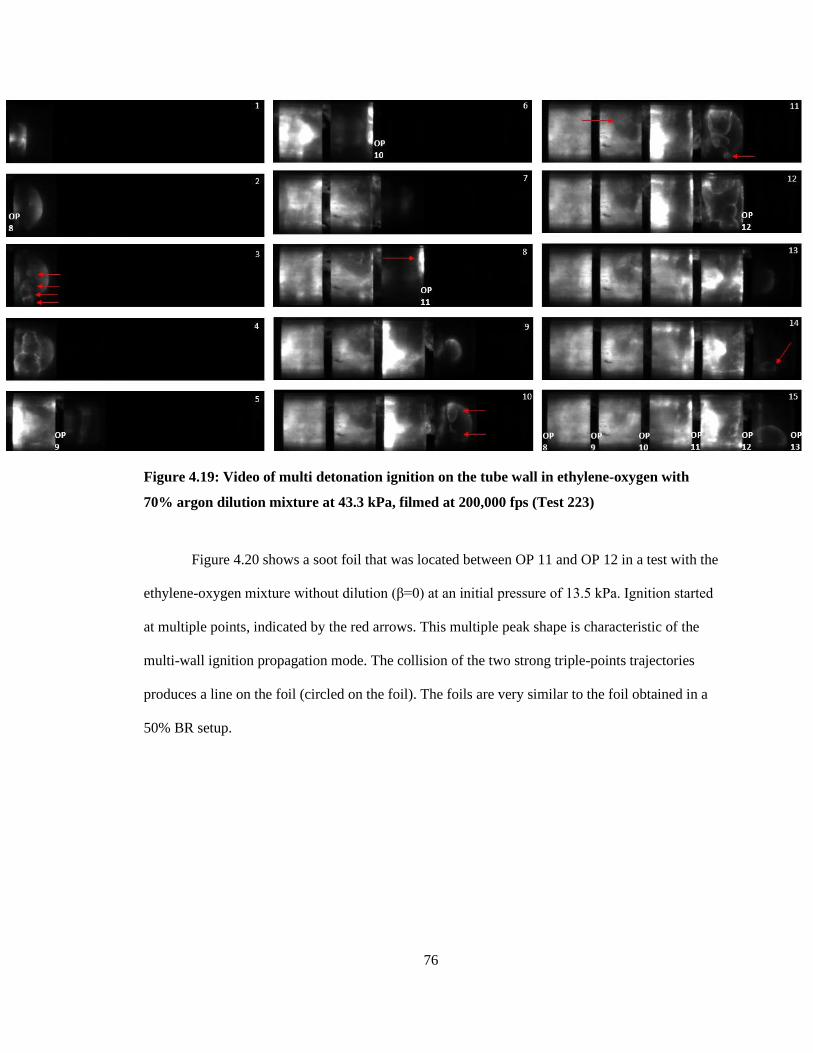
76
Figure 4.19: Video of multi detonation ignition on the tube wall in ethylene-oxygen with
70% argon dilution mixture at 43.3 kPa, filmed at 200,000 fps (Test 223)
Figure 4.20 shows a soot foil that was located between OP 11 and OP 12 in a test with the
ethylene-oxygen mixture without dilution (β=0) at an initial pressure of 13.5 kPa. Ignition started
at multiple points, indicated by the red arrows. This multiple peak shape is characteristic of the
multi-wall ignition propagation mode. The collision of the two strong triple-points trajectories
produces a line on the foil (circled on the foil). The foils are very similar to the foil obtained in a
50% BR setup.
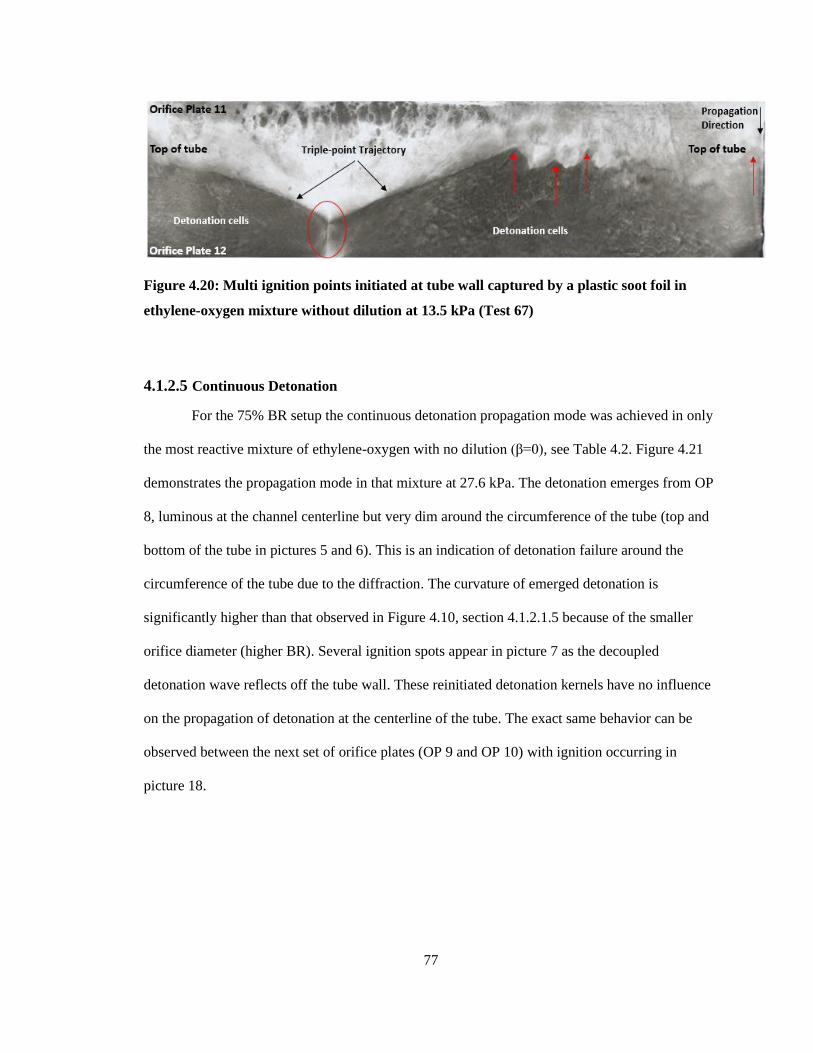
77
Figure 4.20: Multi ignition points initiated at tube wall captured by a plastic soot foil in
ethylene-oxygen mixture without dilution at 13.5 kPa (Test 67)
4.1.2.5 Continuous Detonation
For the 75% BR setup the continuous detonation propagation mode was achieved in only
the most reactive mixture of ethylene-oxygen with no dilution (β=0), see Table 4.2. Figure 4.21
demonstrates the propagation mode in that mixture at 27.6 kPa. The detonation emerges from OP
8, luminous at the channel centerline but very dim around the circumference of the tube (top and
bottom of the tube in pictures 5 and 6). This is an indication of detonation failure around the
circumference of the tube due to the diffraction. The curvature of emerged detonation is
significantly higher than that observed in Figure 4.10, section 4.1.2.1.5 because of the smaller
orifice diameter (higher BR). Several ignition spots appear in picture 7 as the decoupled
detonation wave reflects off the tube wall. These reinitiated detonation kernels have no influence
on the propagation of detonation at the centerline of the tube. The exact same behavior can be
observed between the next set of orifice plates (OP 9 and OP 10) with ignition occurring in
picture 18.
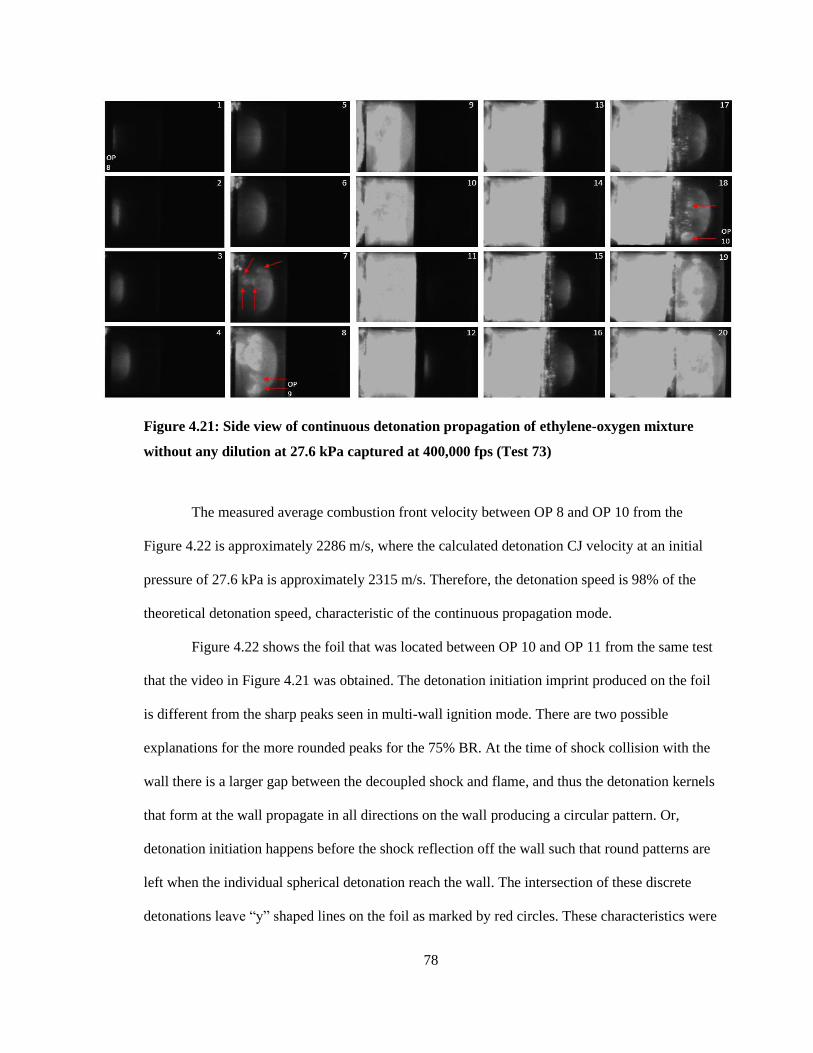
78
Figure 4.21: Side view of continuous detonation propagation of ethylene-oxygen mixture
without any dilution at 27.6 kPa captured at 400,000 fps (Test 73)
The measured average combustion front velocity between OP 8 and OP 10 from the
Figure 4.22 is approximately 2286 m/s, where the calculated detonation CJ velocity at an initial
pressure of 27.6 kPa is approximately 2315 m/s. Therefore, the detonation speed is 98% of the
theoretical detonation speed, characteristic of the continuous propagation mode.
Figure 4.22 shows the foil that was located between OP 10 and OP 11 from the same test
that the video in Figure 4.21 was obtained. The detonation initiation imprint produced on the foil
is different from the sharp peaks seen in multi-wall ignition mode. There are two possible
explanations for the more rounded peaks for the 75% BR. At the time of shock collision with the
wall there is a larger gap between the decoupled shock and flame, and thus the detonation kernels
that form at the wall propagate in all directions on the wall producing a circular pattern. Or,
detonation initiation happens before the shock reflection off the wall such that round patterns are
left when the individual spherical detonation reach the wall. The intersection of these discrete
detonations leave “y” shaped lines on the foil as marked by red circles. These characteristics were
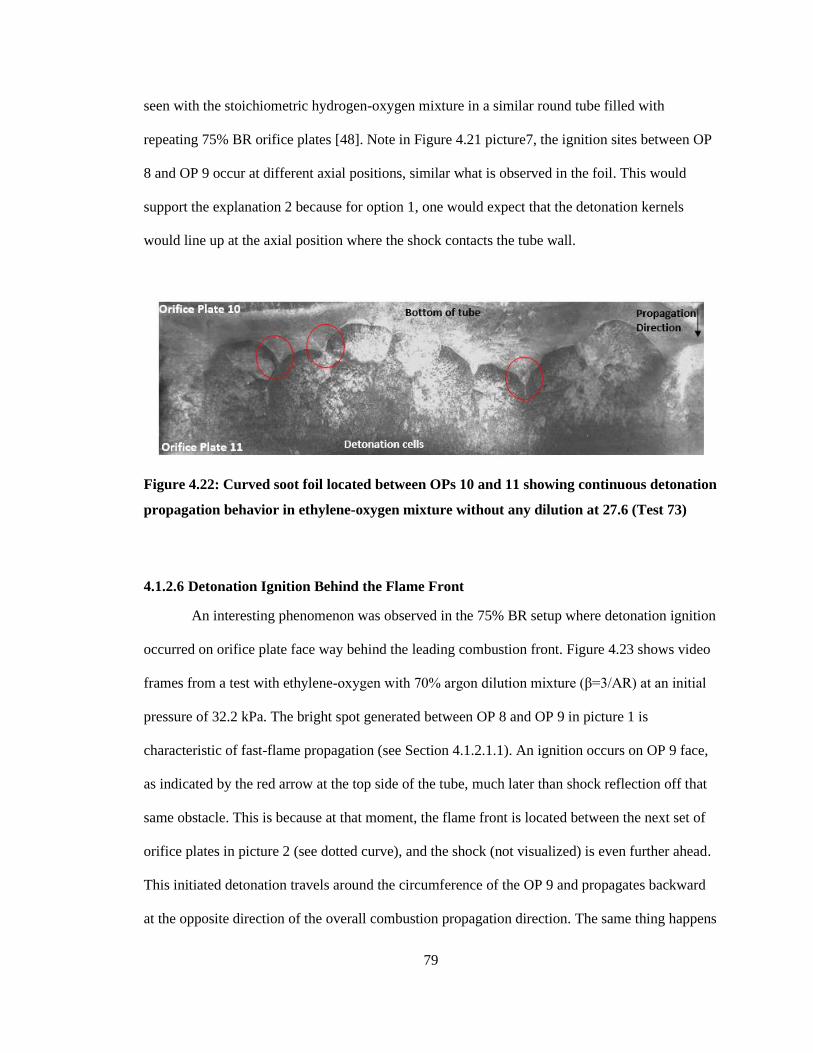
79
seen with the stoichiometric hydrogen-oxygen mixture in a similar round tube filled with
repeating 75% BR orifice plates [48]. Note in Figure 4.21 picture7, the ignition sites between OP
8 and OP 9 occur at different axial positions, similar what is observed in the foil. This would
support the explanation 2 because for option 1, one would expect that the detonation kernels
would line up at the axial position where the shock contacts the tube wall.
Figure 4.22: Curved soot foil located between OPs 10 and 11 showing continuous detonation
propagation behavior in ethylene-oxygen mixture without any dilution at 27.6 (Test 73)
4.1.2.6 Detonation Ignition Behind the Flame Front
An interesting phenomenon was observed in the 75% BR setup where detonation ignition
occurred on orifice plate face way behind the leading combustion front. Figure 4.23 shows video
frames from a test with ethylene-oxygen with 70% argon dilution mixture (β=3/AR) at an initial
pressure of 32.2 kPa. The bright spot generated between OP 8 and OP 9 in picture 1 is
characteristic of fast-flame propagation (see Section 4.1.2.1.1). An ignition occurs on OP 9 face,
as indicated by the red arrow at the top side of the tube, much later than shock reflection off that
same obstacle. This is because at that moment, the flame front is located between the next set of
orifice plates in picture 2 (see dotted curve), and the shock (not visualized) is even further ahead.
This initiated detonation travels around the circumference of the OP 9 and propagates backward
at the opposite direction of the overall combustion propagation direction. The same thing happens
80
at OP 10 and 11. A fast-flame propagates between 11 and 12, and when the shock front reflects
off OP 13, detonation is initiated, and the propagation mode switches to detonation ignition on
obstacle face mode.
Figure 4.23: Video frames recorded at 200,000 fps from the side view of the combustion
tube showing ignition behind the flame front in ethylene-oxygen with 70% argon dilution
mixture at 32.2 kPa. The location of the flame front is marked as dashed curved lines (Test
221)
The same hot spot ignition was observed in a cylindrical tube with 75% BR orifice plates
in a stoichiometric hydrogen-oxygen mixture [48]. Boeck et al. [9] reported a similar
phenomenon in schlieren video of flame propagation in a square channel with repeated obstacles.
They observed ignition in highly turbulent areas ahead of an obstacle, adiabatically heated by the
reflected shock far behind the shock front. In this study, this late ignition was observed in the
75% BR setup, but not the 50% BR setup. One can argue that this is because for the taller orifice
plate face (with the 75% BR) more mixture is bypassed by the flame as it passes through the
81
orifice and remains hot longer because of the longer time required for the expansion to reduce the
high pressure and temperature generated by the reflected shock.
4.2 DDT Properties
Unlike in the Rainsford study [10], the flame acceleration and DDT was captured in this study.
The measured DDT run-up distance is reported in this section along with the correlations
developed with the data. For use in the correlation, cell size data was obtained because none was
available in the literature. The cell size data is also used establish a d/ DDT limit criterion.
4.2.1 DDT Limit
Figure 4.24 shows the average combustion front velocity plotted versus initial pressure in
an ethylene-oxygen mixture with 43% nitrogen dilution (β=1) both in 50% and 75% blockage
ratio setups. According to classical DDT limit definition, the detonation limit in 50% BR and75%
BR setup in this mixture is 6.7 kPa and 27.9 kPa, respectively (marked by a dashed line).
Figure 4.24: Plot of average combustion velocity as a function of initial pressure for ethylene-oxygen mixture with
43% nitrogen dilution. The DDT limit is indicated for both 50% BR and 75% BR
0
500
1000
1500
2000
2500
0 5 10 15 20 25 30 35 40 45 50 55 60 65 70
Ave
rage
Co
mb
ust
ion
Fro
nt
Vel
oci
ty (
kPa)
Initial Pressure (kPa)Detonation 75% BR Galloping Detonation-75%BR Deflagration - 75% BR Detonation - 50% BR Deflagration - 50% BR
DDT limit: 6.7 kPa DDT limit:27.9 kPa
CJ detonation velocity
Products speed of sound
82
With the benefit of a fully optically accessible combustion tube and high-speed camera,
detonation was observed for initial pressures with average combustion velocity lower than
products speed of sound in a 75% blockage ratio setup. In these cases, a galloping detonation was
observed based on video and soot foil evidence; recall this periodic detonation propagation does
not contribute to the overall combustion velocity and thus the average velocity is lower than the
product speed of sound. The DDT limit for an ethylene-oxygen mixture with 43% nitrogen
dilution (β=1) was found to be 27.9 kPa, as marked by a dashed line in Figure 4.17 for 75% BR
setup. Since the lowest pressure for which a detonation was observed using video propagates at a
speed higher than the speed of sound in products in 50% BR setup, the DDT limit is the same as
the classical DDT criterion definition, e.g., 6.7 kPa.
4.2.2 Detonation Cell Size
The DDT limits in previous studies carried out in opaque metal tubes have been
established primarily based on the measured average combustion velocity. As covered in Section
2.9, the DDT limit criterion is reported as d/λ in obstructed channels where d is the opening area
of the orifice plates, and λ is the characteristic cell size of the least reactive mixture that has
undergone DDT. To check the validity of the DDT limit criterion for the experiments in this
study, the detonation cell size of each mixture at their limit pressure was obtained and reported in
Table 4.1. The DDT limit based on the initial pressure for all the mixtures is covered in Section
4.2.2. In most cases, at the limit DDT occurred within the last five orifice plates in the tube, and
the detonation failed after the last orifice plate in the smooth part of the tube. To ensure the
detonation in the smooth part of the tube survives and stabilizes before the end of the tube, the
cell size was measure at a pressure slightly higher than the DDT limit pressure. The method for
cell size measurement was presented in section 3.9. The cell size at the limit was extrapolated
from the pressure at which the cell size was measured. The following linear relationship was used
for this purpose [55]:
83
λ = A × RZL (4.1)
where λ is the cell size, A is a constant and RZL is the reaction zone length. The reaction zone
length is calculated by the Shock and Detonation Toolbox [19]. The constant A for each mixture
was obtained using the measured cell size and the calculated RZL for the same initial pressure
that cell size was obtained. The cell size at the DDT limit pressure for each mixture was then
calculated using the mixture specific constant A and the calculated RZL. Table 4.3 also provides
d/λ values at the DDT limit for each mixture and BR. The DDT limit could not be obtained for
stoichiometric ethylene oxygen with no dilution (β=0) because DDT occurred at the lowest initial
pressure that could be ignited for both the 50% and 75% blockage ratio (3.9 kPa and 4.4 kPa,
respectively).
Table 4.3: DDT limit for test mixtures used in the experiments
84
By the classical DDT criterion, the DDT limit is the minimum initial pressure that results
in an average velocity greater than the products speed of sound. For the 50% BR setup the DDT
limit obtained from video evidence was consistent with the average detonation velocity based
classical criterion. However, this definition does not capture the galloping detonation mode
observed for the 75% BR setup that propagates at an average velocity below the products speed
of sound. DDT limit in this study indicates the lowest initial pressure that detonation initiation
was observed by the video footage and soot foils for both 50% and 75% BR.
The DDT limit for all the ethylene-oxygen mixtures lies in the range 2-2.5. Considering
the ±50% uncertainty on the measured cell size, this finding is consistent with the d/λ =1
proposed by Peraldi et al. [3]. This is also true for 70% argon dilution for both the ethylene and
hydrogen-oxygen mixtures, despite the increase in cell regularity. This is in contrast with
Kuznetsov et al. [46] claim. They proposed that cell regularity has a big impact on d/λ. They
claimed that d/λ in mixtures with more regular detonation cellular structure (such as argon diluted
mixtures) is significantly bigger than the mixture with irregular detonation cellular structure (such
as nitrogen or none diluted mixtures). Although increasing the argon dilution to 80% does
produce a larger d/λ=3.3, the effect of the argon dilution is not as pronounced as reported in [46].
In a 75% blockage ratio setup, the detonation cell size at the limit is significantly smaller
than the opening area of the orifice plate. This makes a larger d/λ comparing to 50% BR setup,
similar to that reported in previous studies in cylindrical tubes [10] [4]. Since the previous studies
used either non-visualization technics or classical DDT criterion definition resulting in not
identifying galloping detonation, it is possible that reported d/λ at the limits in the literature are
larger than d/λ in this study. The effect of cell regularity is more sensible in 75% BR setup, but
again, it is not as tense as reported by Kuznetsov et al. [46].
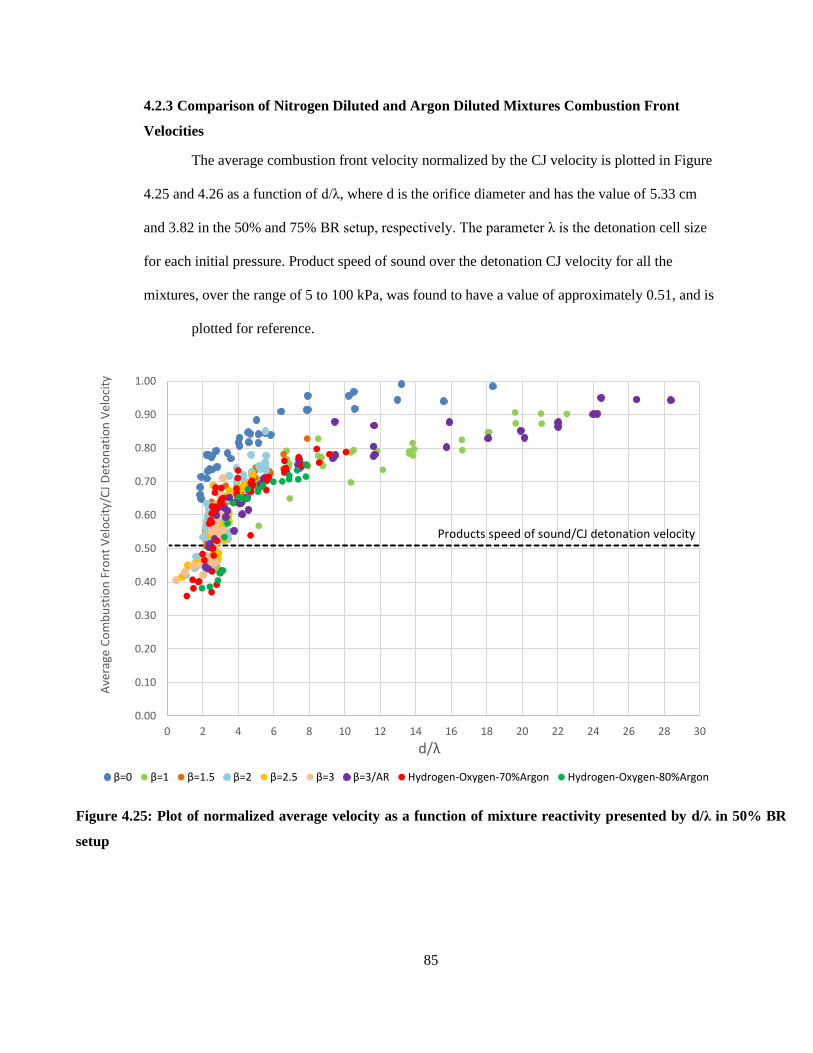
85
4.2.3 Comparison of Nitrogen Diluted and Argon Diluted Mixtures Combustion Front
Velocities
The average combustion front velocity normalized by the CJ velocity is plotted in Figure
4.25 and 4.26 as a function of d/λ, where d is the orifice diameter and has the value of 5.33 cm
and 3.82 in the 50% and 75% BR setup, respectively. The parameter λ is the detonation cell size
for each initial pressure. Product speed of sound over the detonation CJ velocity for all the
mixtures, over the range of 5 to 100 kPa, was found to have a value of approximately 0.51, and is
plotted for reference.
Figure 4.25: Plot of normalized average velocity as a function of mixture reactivity presented by d/λ in 50% BR
setup
0.00
0.10
0.20
0.30
0.40
0.50
0.60
0.70
0.80
0.90
1.00
0 2 4 6 8 10 12 14 16 18 20 22 24 26 28 30
Ave
rage
Co
mb
ust
ion
Fro
nt
Vel
oci
ty/C
J D
eto
nat
ion
Vel
oci
ty
d/λ
β=0 β=1 β=1.5 β=2 β=2.5 β=3 β=3/AR Hydrogen-Oxygen-70%Argon Hydrogen-Oxygen-80%Argon
Products speed of sound/CJ detonation velocity
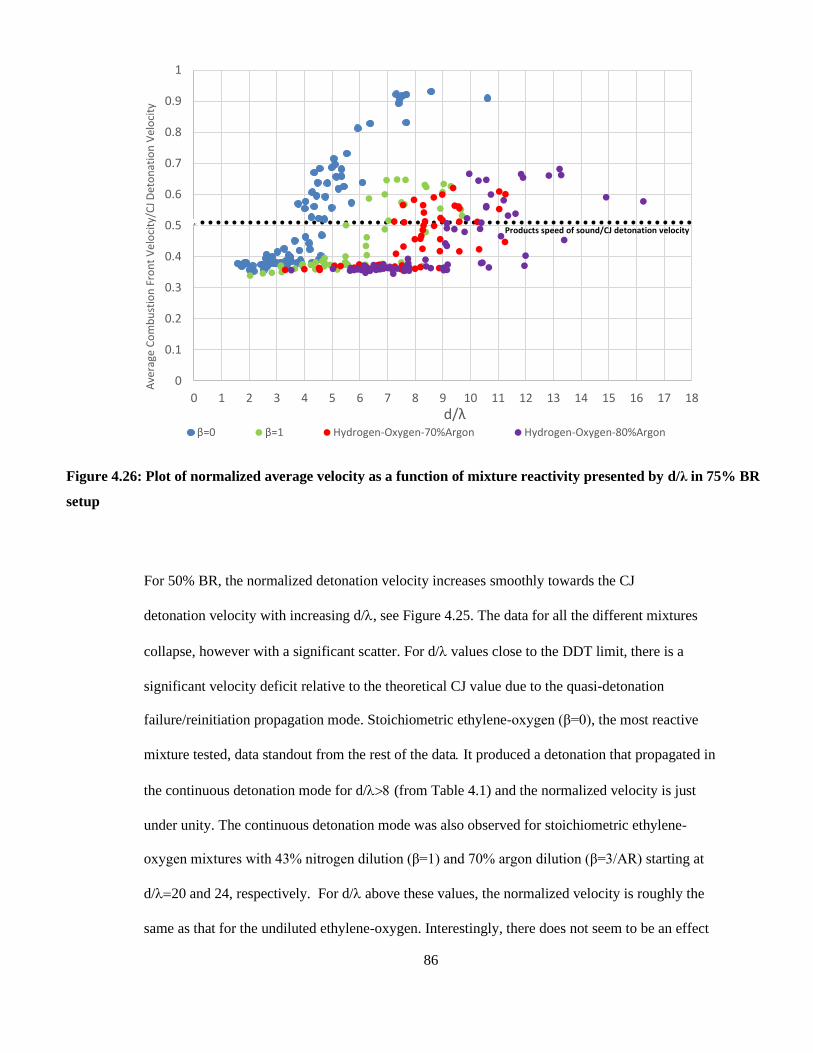
86
For 50% BR, the normalized detonation velocity increases smoothly towards the CJ
. The data for all the different mixtures 5Figure 4.2, see d/ ncreasingi withdetonation velocity
there is a ,limitDDT values close to the For d/ .scatter significanta with however ,collapse
detonation -due to the quasi relative to the theoretical CJ valuesignificant velocity deficit
, the most reactive oxygen (β=0)-toichiometric ethylenefailure/reinitiation propagation mode. S
d in It produced a detonation that propagate of the data the rest fromstandout ested, data mixture t
the normalized velocity is just and Table 4.1) (from d/ forthe continuous detonation mode
-stoichiometric ethylene The continuous detonation mode was also observed forunder unity.
starting at dilution (β=3/AR)xygen mixtures with 43% nitrogen dilution (β=1) and 70% argon o
the is roughlyvalues, the normalized velocity above these For d/ respectively. 20 and 24,=d/
Interestingly, there does not seem to be an effect .oxygen-undiluted ethylene as that for thesame
Figure 4.26: Plot of normalized average velocity as a function of mixture reactivity presented by d/λ in 75% BR
setup
0
0.1
0.2
0.3
0.4
0.5
0.6
0.7
0.8
0.9
1
0 1 2 3 4 5 6 7 8 9 10 11 12 13 14 15 16 17 18
Ave
rage
Co
mb
ust
ion
Fro
nt
Vel
oci
ty/C
J D
eto
nat
ion
Vel
oci
ty
d/λβ=0 β=1 Hydrogen-Oxygen-70%Argon Hydrogen-Oxygen-80%Argon
Products speed of sound/CJ detonation velocity
87
nitrogen dilution) on the n(argon dilution cell structure more regular thadilution gas inertof
detonation velocity, as both mixtures produced similar velocity for the continuous mode, and in
oxygen mixture produced much higher -undiluted ethylene Therange. the full d/over ,fact
, the continuous propagation mode; furthermore 20 because of< <d/8velocities for normalized
all ignition oxygen detonation propagated primarily by w-below this range the undiluted ethylene
higher velocity.a that produces
For the 75% BR, the DDT limit is very different for the argon diluted mixtures, the DDT
limit d/ value is much higher, and therefore the jump in velocity occurs at different values of d/.
The effect of inert gas dilution, associated is more pronounced in the 75% BR setup versus the
50%BR where very little effect was observed. The continuous detonation propagation mode was
only observed in stoichiometric ethylene-oxygen mixture with no dilution (β=0), and therefore that
is the only mixture that average detonation velocity almost reaches the theoretical CJ detonation
velocity, see Figure 4.26. For this reason, the velocity deficit for the other mixtures is significantly
larger, and in general, the velocity deficit in 75% BR setup is large compared to that measured in
the 50% BR setup. The DDT limit in this plot indicates the lowest d/λ where galloping detonation
was observed. Fast-flame propagation and galloping detonation propagation in all the mixtures
travels at roughly the same velocity. The lowest d/λ where the velocity surpasses the product speed
of sound corresponded to the lowest d/λ where detonation where wall ignition was observed
between considerable sets of orifice plates.
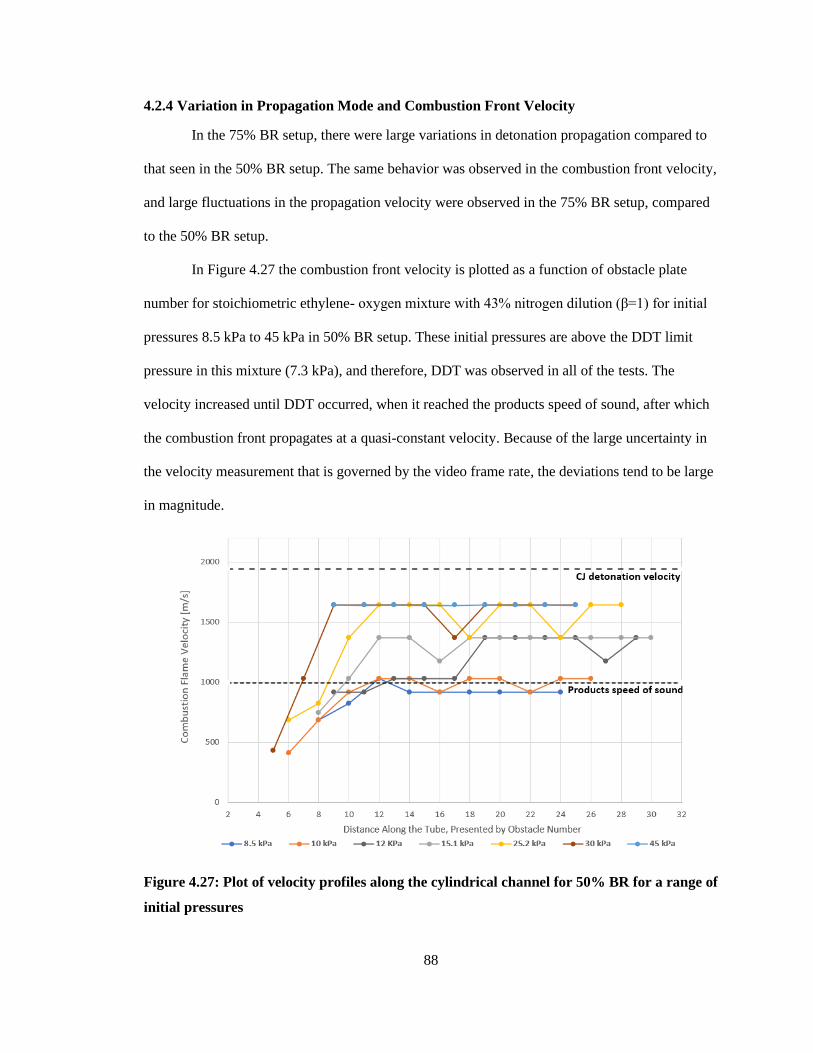
88
4.2.4 Variation in Propagation Mode and Combustion Front Velocity
In the 75% BR setup, there were large variations in detonation propagation compared to
that seen in the 50% BR setup. The same behavior was observed in the combustion front velocity,
and large fluctuations in the propagation velocity were observed in the 75% BR setup, compared
to the 50% BR setup.
In Figure 4.27 the combustion front velocity is plotted as a function of obstacle plate
number for stoichiometric ethylene- oxygen mixture with 43% nitrogen dilution (β=1) for initial
pressures 8.5 kPa to 45 kPa in 50% BR setup. These initial pressures are above the DDT limit
pressure in this mixture (7.3 kPa), and therefore, DDT was observed in all of the tests. The
velocity increased until DDT occurred, when it reached the products speed of sound, after which
the combustion front propagates at a quasi-constant velocity. Because of the large uncertainty in
the velocity measurement that is governed by the video frame rate, the deviations tend to be large
in magnitude.
Figure 4.27: Plot of velocity profiles along the cylindrical channel for 50% BR for a range of
initial pressures
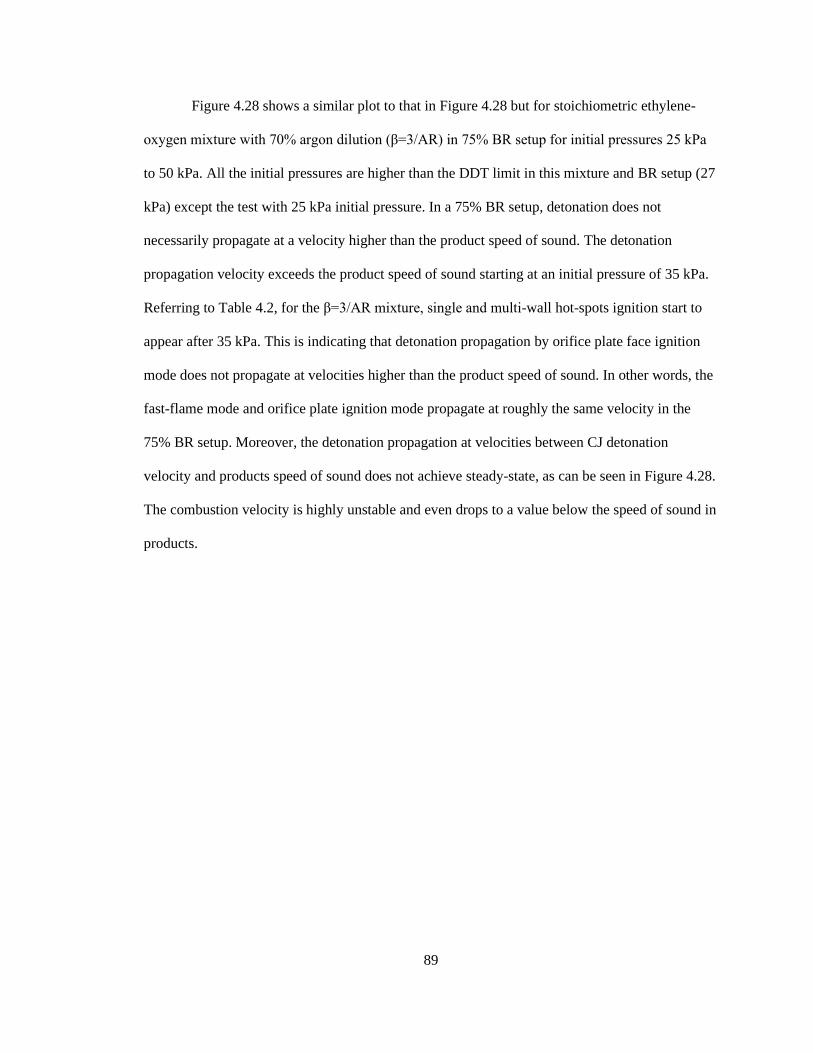
89
Figure 4.28 shows a similar plot to that in Figure 4.28 but for stoichiometric ethylene-
oxygen mixture with 70% argon dilution (β=3/AR) in 75% BR setup for initial pressures 25 kPa
to 50 kPa. All the initial pressures are higher than the DDT limit in this mixture and BR setup (27
kPa) except the test with 25 kPa initial pressure. In a 75% BR setup, detonation does not
necessarily propagate at a velocity higher than the product speed of sound. The detonation
propagation velocity exceeds the product speed of sound starting at an initial pressure of 35 kPa.
Referring to Table 4.2, for the β=3/AR mixture, single and multi-wall hot-spots ignition start to
appear after 35 kPa. This is indicating that detonation propagation by orifice plate face ignition
mode does not propagate at velocities higher than the product speed of sound. In other words, the
fast-flame mode and orifice plate ignition mode propagate at roughly the same velocity in the
75% BR setup. Moreover, the detonation propagation at velocities between CJ detonation
velocity and products speed of sound does not achieve steady-state, as can be seen in Figure 4.28.
The combustion velocity is highly unstable and even drops to a value below the speed of sound in
products.
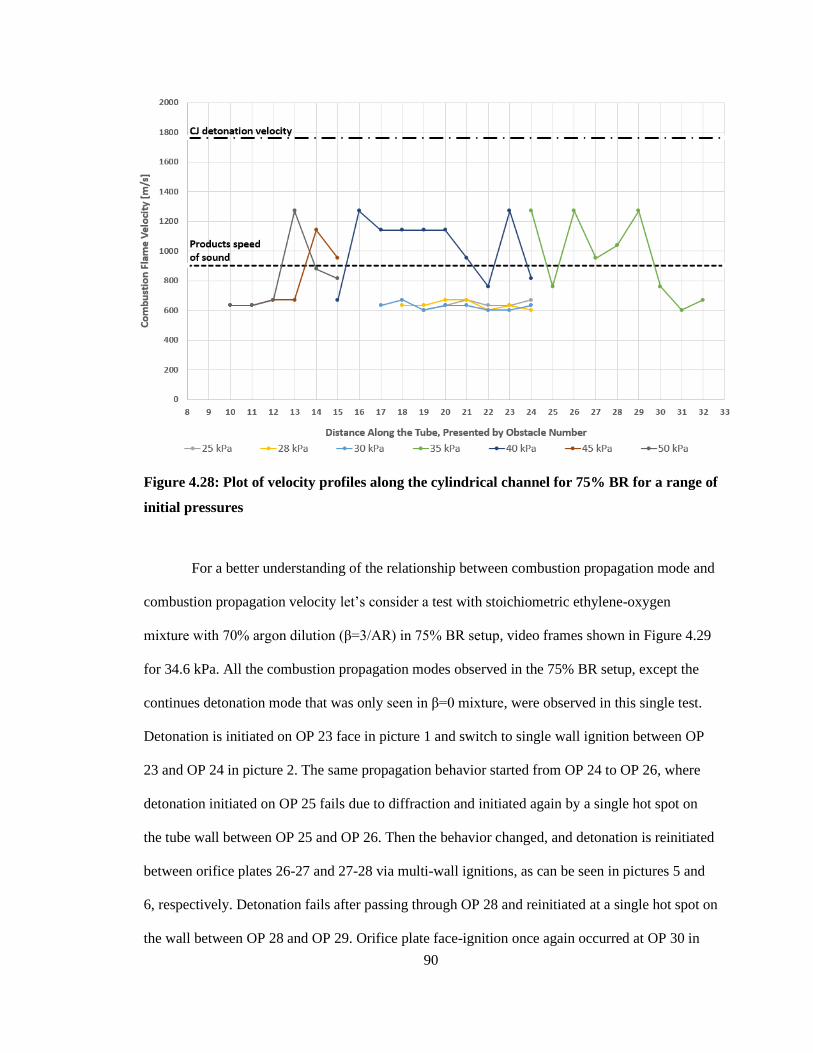
90
Figure 4.28: Plot of velocity profiles along the cylindrical channel for 75% BR for a range of
initial pressures
For a better understanding of the relationship between combustion propagation mode and
combustion propagation velocity let’s consider a test with stoichiometric ethylene-oxygen
mixture with 70% argon dilution (β=3/AR) in 75% BR setup, video frames shown in Figure 4.29
for 34.6 kPa. All the combustion propagation modes observed in the 75% BR setup, except the
continues detonation mode that was only seen in β=0 mixture, were observed in this single test.
Detonation is initiated on OP 23 face in picture 1 and switch to single wall ignition between OP
23 and OP 24 in picture 2. The same propagation behavior started from OP 24 to OP 26, where
detonation initiated on OP 25 fails due to diffraction and initiated again by a single hot spot on
the tube wall between OP 25 and OP 26. Then the behavior changed, and detonation is reinitiated
between orifice plates 26-27 and 27-28 via multi-wall ignitions, as can be seen in pictures 5 and
6, respectively. Detonation fails after passing through OP 28 and reinitiated at a single hot spot on
the wall between OP 28 and OP 29. Orifice plate face-ignition once again occurred at OP 30 in
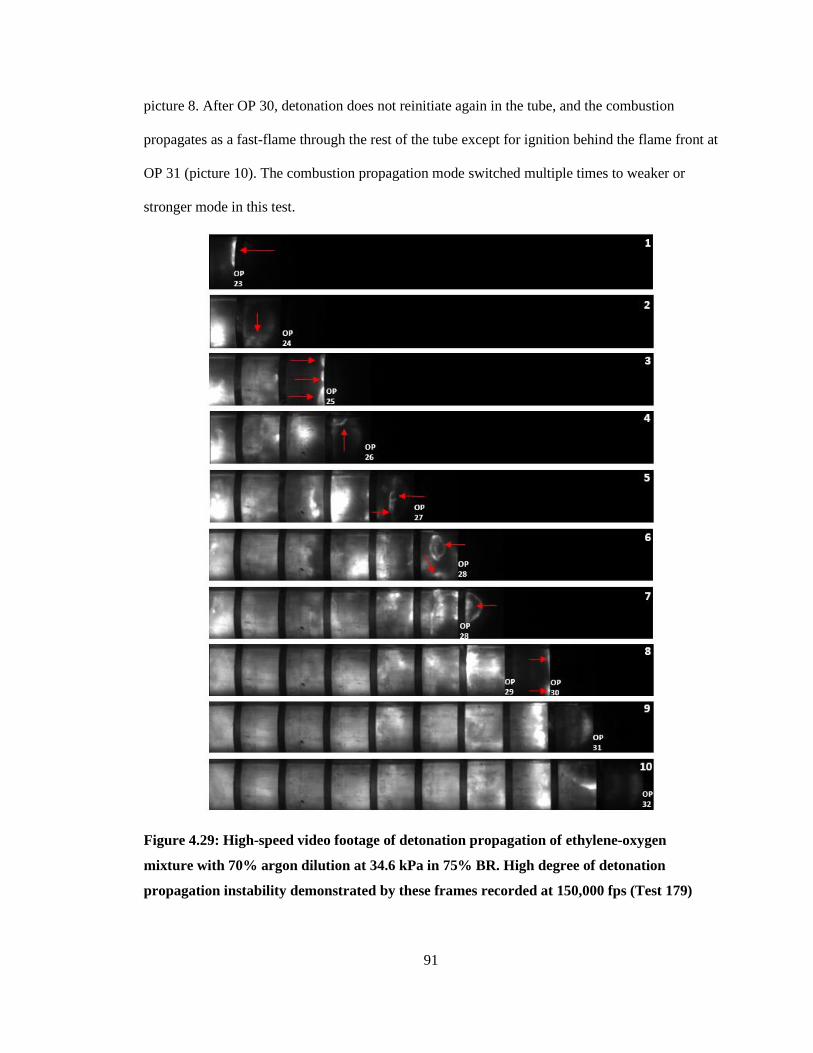
91
picture 8. After OP 30, detonation does not reinitiate again in the tube, and the combustion
propagates as a fast-flame through the rest of the tube except for ignition behind the flame front at
OP 31 (picture 10). The combustion propagation mode switched multiple times to weaker or
stronger mode in this test.
Figure 4.29: High-speed video footage of detonation propagation of ethylene-oxygen
mixture with 70% argon dilution at 34.6 kPa in 75% BR. High degree of detonation
propagation instability demonstrated by these frames recorded at 150,000 fps (Test 179)
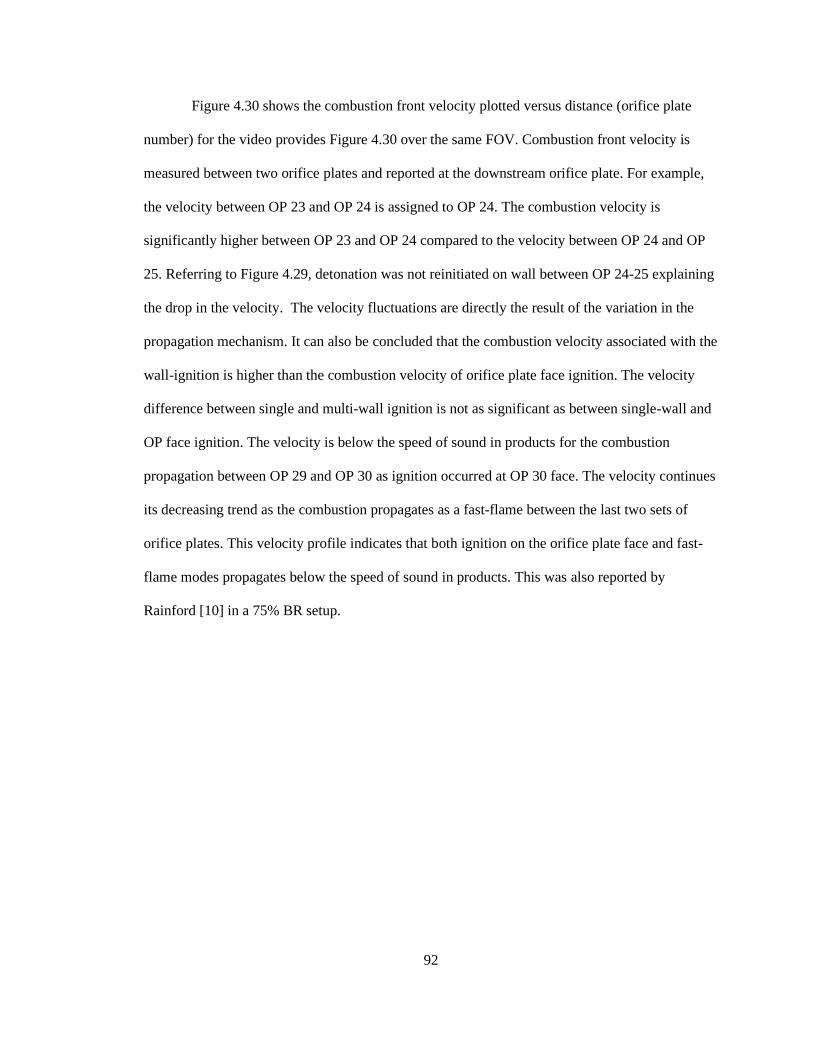
92
Figure 4.30 shows the combustion front velocity plotted versus distance (orifice plate
number) for the video provides Figure 4.30 over the same FOV. Combustion front velocity is
measured between two orifice plates and reported at the downstream orifice plate. For example,
the velocity between OP 23 and OP 24 is assigned to OP 24. The combustion velocity is
significantly higher between OP 23 and OP 24 compared to the velocity between OP 24 and OP
25. Referring to Figure 4.29, detonation was not reinitiated on wall between OP 24-25 explaining
the drop in the velocity. The velocity fluctuations are directly the result of the variation in the
propagation mechanism. It can also be concluded that the combustion velocity associated with the
wall-ignition is higher than the combustion velocity of orifice plate face ignition. The velocity
difference between single and multi-wall ignition is not as significant as between single-wall and
OP face ignition. The velocity is below the speed of sound in products for the combustion
propagation between OP 29 and OP 30 as ignition occurred at OP 30 face. The velocity continues
its decreasing trend as the combustion propagates as a fast-flame between the last two sets of
orifice plates. This velocity profile indicates that both ignition on the orifice plate face and fast-
flame modes propagates below the speed of sound in products. This was also reported by
Rainford [10] in a 75% BR setup.
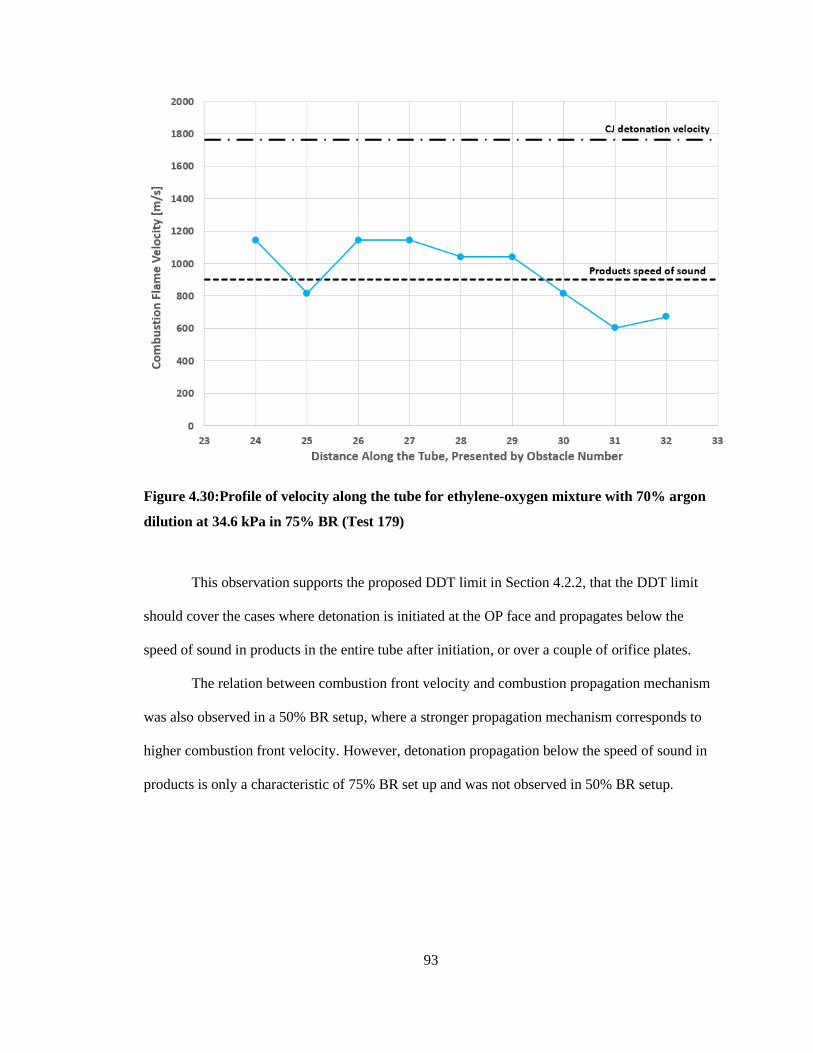
93
Figure 4.30:Profile of velocity along the tube for ethylene-oxygen mixture with 70% argon
dilution at 34.6 kPa in 75% BR (Test 179)
This observation supports the proposed DDT limit in Section 4.2.2, that the DDT limit
should cover the cases where detonation is initiated at the OP face and propagates below the
speed of sound in products in the entire tube after initiation, or over a couple of orifice plates.
The relation between combustion front velocity and combustion propagation mechanism
was also observed in a 50% BR setup, where a stronger propagation mechanism corresponds to
higher combustion front velocity. However, detonation propagation below the speed of sound in
products is only a characteristic of 75% BR set up and was not observed in 50% BR setup.
94
4.2.5 DDT Run-Up Distance
The axial distance between the position of the flame front where DDT happens for the
first time in the channel respected to the ignition point is called DDT distance or DDT run-up
distance. The DDT run-up distance presented as orifice plate number plotted over the initial
pressure can be seen in Figure 4.31 for stoichiometric hydrogen-oxygen mixture with 70% argon
dilution. In higher initial pressures, DDT initiated faster and earlier in the tube. The variation in
DDT run-up distance is significantly higher near the limit comparing to higher pressures. This is
due to the instability of combustion propagation near the DDT limit.
Figure 4.31: DDT run-up distance obtained from videos plotted over range of initial
pressure for hydrogen-oxygen mixture with 70% argon dilution in the 50% BR
For a better understanding of inert gas dilution effect on DDT run-up distance, Figure 4.32
is provided for both 50% and 75% BR setups, demonstrating the d/λ criterion plot as a function of
XDDT/D where XDDT is the position of Flame front respected to the ignition point at the DDT
location and D is the tube diameter (7.62 cm in this study). Increasing nitrogen dilution amount in
the stoichiometric ethylene-oxygen mixture increases the DDT run-up distance at the DDT limit.
This is also true for increasing the argon dilution in the stoichiometric ethylene-oxygen mixture.
95
However, the increase in DDT run-up distance is less intense at mixtures with argon dilution.
There is an increase in XDDT by increasing the argon dilution percentage in the hydrogen-oxygen
mixture from 70% to 80%. The data is fit with a power-law XDDT/D=c(d/)-n, where c is a
constant and the value of n is provided in Table 4.4.
A change in the reactivity of the mixture (d/λ) changes the DDT run-up distance criterion
(XDDT/D) in all the mixtures. However, it is possible for the initiation of DDT to happen in the
same position at the tube within a range of d/λ (or a range of initial pressure). The intensity of this
change is affected by the composition and the percentage of the diluted inert gas. In
stoichiometric ethylene-oxygen mixtures with higher nitrogen dilution percentages, the change in
DDT run-up distance by changing the initial pressure is more significant comparing to lower or
zero nitrogen dilution percentages in the mixture.
96
0
5
10
15
20
25
30
35
0 2 4 6 8 10 12 14 16 18 20
XD
DT
/D
d/λ
50% BR
β=0 β=1 β=1.5 β=2 β=2.5 β=3 β=3/AR 70% 80%
0
5
10
15
20
25
30
0 2 4 6 8 10 12 14 16 18 20
XD
DT/
D
d/λβ=0 β=1 70% β=3/AR
Figure 4.32: Plots of XDDT//D as a function of reactivity of the mixture for
both 50% and 75% BRs
97
Table 4.4: Values of the n corresponding to power-law XDDT/D=c(d/)-n for all the mixtures
Using the correlation proposed by Silvestrini et al. [54] (Equation 2.15 and Equation
2.16), DDT run-up distance can be predicted. This correlation indicates the distance the flame
reaches one-half the CJ detonation velocity in a smooth tube, and for an obstructed tube, the
correlation is multiplied by 1/(1+15BR). In order to use this prediction correlation, the laminar
burning velocity was calculated using the Cosilab® software and the San Diego mechanism.
Figure 4.33 shows the comparison between the predicated DDT run-up distance with the DDT
run-up distance measured from the videos (presented in Figure 4.31) for both 50% and 75%
blockage ratio setups. Unlike the experimental data, the calculated XDDT shows no effect of initial
pressure. The large values of experimental XDDT correspond to the near-limit pressures. As the
pressure is increased, the data points approach closer to the line (perfect correlation). The
proposed correlation by Silvestrini et al. [54] gives an acceptable prediction for high pressures
(highly reactive) mixtures. The difference with the measured and calculated XDDT is very large for
less reactive mixtures and very low for more reactive mixtures. This indicates that there is added
98
distance from where the fast flame velocity is achieved to the point DDT course that is not
captured by the proposed correlation. This distance is significantly larger in the less reactive
mixtures, similar to DDT induction length.
Referring to Figure 4.32, there is a clear dependence of XDDT on λ /d that is not included
in the flame acceleration correlation. The correlation predicts XDDT/D for the largest d/ (highest
pressure) in each mixture. However, the XDDT/D increases with decreasing d/ (initial pressure)
where it remains almost constant in the correlation. This sensitivity to the cell size is consistent
with the activation energy (Ea), where it increases with nitrogen dilution and decreasing with
argon dilution. The activation energy (Ea) is calculated for all the mixtures over the tested initial
pressure using Cantera [56] and the STD toolbox [57]. The following correlation is proposed for
DDT run- up distance prediction based on the results of this study:
𝑋𝐷𝐷𝑇
D=
𝑋½Vcj
D+ 10.3(
2.4
(𝑑
λ))(7.6×10
−4×(𝐸𝑎𝑅𝑇
)3.7
+1243) (4.2)
Figure 4.33: Comparison of the measured XDDT/D to the flame acceleration, based correlation in [53]
P
0
10
20
30
40
0 5 10 15 20
Exp
erim
enta
l XD
DT/
D
Calculated XDDT/D
50% BR
β=0 β=1 β=1.5 β=2 β=2.5 β=3 β=3/AR 70% 80%
0
10
20
30
40
0 5 10 15 20Ex
per
imen
tal X
DD
T/D
Calculated XDDT/D
75% BR
β=0 β=1 β=3/AR 70%
99
Where X½Vcj is the distance where the flam reaches half the CJ detonation velocity, as predicted
by Silvestrini [54] correlation. Figure 4.34 compares the DDT run-up distance predicted by
Equation 4.2 with the experimental data obtained for 50% BR. The correlation captures the
correct tend but there is significant scatter in the data that precludes its use for safety related
predictions.
Figure 4.34:Comparison of the measured XDDT/D in 50% BR setup with the correlation
XDDT/D using Equation 4.2
Figure 4.35 compares the DDT run-up distance predicted by Equation 4.2 with the
experimental data obtained for 75% BR. the data for the nitrogen diluted mixtures follow the
correlation but not the argon diluted mixtures. Future work needs to address the inconsistency for
the argon diluted mixtures. The data for the nitrogen diluted mixtures follow the correlation but
not the argon diluted mixtures. Future work needs to address the inconsistency for the argon
diluted mixtures. The usage of this correlation for industrial safety purposes is not recommended
due to the significant scatter in the data
0
10
20
30
40
0 10 20 30
Exp
erim
enta
l XD
DT/
D
Calculated XDDT/D
B=0 B=1 B=1.5 B=2 B=2.5 B=3 B=3 AR 70% 80%
100
Figure 4.35:Comparison of the measured XDDT/D in 75% BR setup with the correlation
XDDT/D using Equation 4.2
0
10
20
30
40
0 10 20 30
Exp
erim
enta
l XD
DT/
D
Calculated XDDT/D
B=0 B=1 B=3 AR 70%
101
Chapter 5
Conclusion and Recommendations
Flame acceleration and deflagration to detonation transition (DDT) were investigated in
this study using self-luminous high-speed photography in a fully transparent obstructed round
tube. The goal was to observe the behavior of combustion development from fast flame to quasi-
steady detonation propagation. Tests were performed using stoichiometric ethylene-oxygen
mixture and the hydrogen-oxygen mixture diluted with argon or nitrogen. Soot foils were used to
indicate the location and mechanism of the detonation propagation in the tube, as well as
detonation cell size measurement at critical pressures. Two sets of orifice plates with orifice
diameters (d) of 5.33 cm and 3.81 cm were used in the experiments, representing 50% and 75%
area blockage ratios (BR), respectively.
DDT limits were obtained using high-speed video and soot foils for each test in the two
blockage ratio setups. Experiments showed that the d/λ at the DDT limit is significantly larger for
the higher blockage ratio. This is in agreement with previous detonation studies [5] [58]. The
DDT limit in 50% BR setup corresponds to a d/λ range of 2-2.5 for all ethylene-oxygen mixtures
and hydrogen-oxygen mixtures up to 70% argon dilution. Considering the ±50% uncertainty on
the measured cell size, this finding is consistent with the d/λ =1 and L/λ =1 limit criteria [3] [28].
This consistency in d/λ at the limit despite the change in detonation cell regularity is in contrast to
Kuznetsov et al.'s finding [46]. They proposed that the relation between orifice plate opening and
detonation cell size in a heavily argon diluted mixture is d=A×λ where A is greater than 1,
resulting in much bigger d/ λ at the limit for mixtures with argon dilution comparing to other
mixtures. The results of this experiment show that increasing the argon dilution to 80% does
produce a larger d/λ of 3.3. However, the effect of argon dilution is not as intense as pronounced
in [46].
102
The use of high-speed video and soot foils in the current DDT experiments revealed that
the detonation limit for high BRs (75% BR in this study) is influenced by a galloping detonation
mode. Classical DDT limit defensive fails to detect this mode because it travels at an average
velocity below the products speed of sound. Therefore, although the d/λ at the limit in 75% BR
setups is larger than 50% BR, the d/λ at the limit in 75% BR setup is probably even larger than
this study in other experiments since they couldn't detect galloping mode as the limit. Galloping
mode was observed in a previous visualization study of Rainford [48] in 75% BR setup however
was not considered as DDT limit since it travels below the speed of sound in products.
DDT has been found to be always initiated at the orifice plate face in this experiment.
This finding was not reported before has never been reported, and it is only possible due to the
benefits of using high-speed photography in a fully transparent round tube. In the 50% BR setup,
after the initial detonation initiation, caused by shock reflection on the OP face (DDT), the
detonation either propagates continuously for high pressures or by detonation failure through the
orifice followed by reinitiation by single wall or multiwall ignition following shock reflection. In
the 75% BR, however, there is a high degree of instability in quasi detonation propagation. The
velocity of detonation was found to exceed the products speed of sounds where multi-wall
ignition occurs frequently. The argon and nitrogen dilution were found to have no effect on quasi
detonation propagation mechanism except for 80% argon dilution that prevents multi-wall
ignition in the mixture. Near the DDT limit a galloping mode was observed where the detonation
can fail at some point to form a fast-flame, and the average velocity is below the products speed
of sound.
DDT run-up distance was obtained for all the tests using high-speed videos and soot foils.
It was determined that the flame acceleration correlation by Silvestrini et al. [54] predicts the
DDT run-up distance successfully for reactive mixtures (high initial pressures). However, for
mixtures near the limit the DDT run-up distance was significantly larger. It was proposed that the
103
DDT run-up distance must include an induction length that scales with the cell size, where a fast
flame propagates before DDT. A basic correlation for the DDT run up distance was proposed
based on the concept of flame acceleration to fast-flame followed by DDT induction distance that
depends on the detonation cell size and activation energy.
Further investigation of the DDT induction length is required to establish a more accurate
correlation. Experiments focused on this phenomenon can reveal the evolution of the fast-flame
that leads up to DDT. More experiments also should be carried out using propane to investigate
more irregular cellular structures.
104
References
1. Mallard, E., Recherches experimentales et theoriques sur la combustion des melanges
gaseux explosifs. Ann. mines, 1883. 8(4): p. 274-568.
2. Chapman, W.R. and R.V. Wheeler, VI.—The propagation of flame in mixtures of
methane and air. Part V. The movement of the medium in which the flame travels. Journal
of the Chemical Society (Resumed), 1927: p. 38-46.
3. Peraldi, O., R. Knystautas, and J. Lee. Criteria for transition to detonation in tubes. in
Symposium (International) on Combustion. 1988. Elsevier.
4. Ciccarelli, G. and M. Cross, On the propagation mechanism of a detonation wave in a
round tube with orifice plates. Shock Waves, 2016. 26(5): p. 587-597.
5. Kuznetsov, M., et al., Effect of obstacle geometry on behaviour of turbulent flames. 1999:
Forschunszentrum Karlsruhe.
6. Teodorczyk, A., J. Lee, and R. Knystautas. Propagation mechanism of quasi-detonations.
in Symposium (International) on Combustion. 1989. Elsevier.
7. Kellenberger, M. and G. Ciccarelli, Propagation mechanisms of supersonic combustion
waves. Proceedings of the Combustion Institute, 2015. 35(2): p. 2109-2116.
8. Kellenberger, M. and G. Ciccarelli. Investigation of quasi-detonation propagation using
simultaneous soot foil and schlieren photography. in 25th International Colloquium on
the Dynamics of Explosions and Reactive Systems. 2015. Leeds.
9. Boeck, L., et al., Simultaneous OH-PLIF and schlieren imaging of flame acceleration in
an obstacle-laden channel. Proceedings of the Combustion Institute, 2017. 36(2): p.
2807-2814.
105
10. Rainsford, G., D.J.S. Aulakh, and G. Ciccarelli, Visualization of detonation propagation
in a round tube equipped with repeating orifice plates. Combustion and Flame, 2018.
198: p. 205-221.
11. Chapman, D.L., VI. On the rate of explosion in gases. The London, Edinburgh, and
Dublin Philosophical Magazine and Journal of Science, 1899. 47(284): p. 90-104.
12. Jouguet, E., On the propagation of chemical reactions in gases. J. de mathematiques
Pures et Appliquees, 1905. 1(347-425): p. 2.
13. Rankine, W.J.M., XV. On the thermodynamic theory of waves of finite longitudinal
disturbance. Philosophical Transactions of the Royal Society of London, 1870(160): p.
277-288.
14. Hugoniot, H., Propagation du Mouvement dans les Corps. J. Ec. Polyt. Paris, 1889. 57: p.
1-125.
15. Ciccarelli, G., MECH 832: Combustion Course Notes Kingston, Queen's University,
2020.
16. Zeldovich, Y.B., On the theory of the propagation of detonation in gaseous systems.
1950.
17. Von Neuman, J., Theory of detonation waves. 1942, Institute for Advanced Study
Princeton NJ.
18. Döring, W., On detonation processes in gases. Ann. phys, 1943. 43(421-436): p. 9.
19. Kao, S. and J. Shepherd, Numerical solution methods for control volume explosions and
ZND detonation structure. Galcit report fm2006, 2008. 7: p. 1-46.
20. Ciccarelli, G. and S. Dorofeev, Flame acceleration and transition to detonation in ducts.
Progress in energy and combustion science, 2008. 34(4): p. 499-550.
21. White, D.R., Turbulent structure of gaseous detonation. The Physics of Fluids, 1961.
4(4): p. 465-480.
106
22. Denisov, Y.N. and Y.K. Troshin. On the mechanism of detonative combustion. in
Symposium (International) on Combustion. 1961. Elsevier.
23. Austin, J., F. Pintgen, and J. Shepherd, Reaction zones in highly unstable detonations.
Proceedings of the Combustion Institute, 2005. 30(2): p. 1849-1857.
24. Cross, M. and G. Ciccarelli, DDT and detonation propagation limits in an obstacle filled
tube. Journal of Loss Prevention in the Process Industries, 2015. 36: p. 380-386.
25. Ciccarelli, G., T. Ginsberg, and J. Boccio, Detonation cell size measurements in high-
temperature hydrogen-air-steam mixtures at the bnl high-temperature combustion
facility. 1997, Nuclear Regulatory Commission.
26. Diakow, P., M. Cross, and G. Ciccarelli, Detonation characteristics of dimethyl ether and
ethanol–air mixtures. Shock Waves, 2015. 25(3): p. 231-238.
27. Knystautas, R., Measurement of cell size in hydrocarbon-air mixtures and predictions of
critical tube diameter, critical initiation energy and detonability limits. Progress in
Astronautics and Aeronautics, 1984. 94: p. 23-37.
28. Dorofeev, S., et al., Effect of scale on the onset of detonations. Shock Waves, 2000.
10(2): p. 137-149.
29. Lee, J., R. Knystautas, and C. Guirao, The link between cell size, critical tube diameter,
initiation energy and detonability limits. Fuel-Air Explosions, 1982: p. 157-187.
30. Matsui, H. and J.H. Lee. On the measure of the relative detonation hazards of gaseous
fuel-oxygen and air mixtures. in Symposium (International) on Combustion. 1979.
Elsevier.
31. Shepherd, J.E., Detonation in gases. Proceedings of the Combustion Institute, 2009.
32(1): p. 83-98.
32. Taki, S. and T. Fujiwara. Numerical simulation of triple shock behavior of gaseous
detonation. in Symposium (International) on Combustion. 1981. Elsevier.
107
33. Zeldovich, I.B., An experimental investigation of spherical detonation of gases. Soviet
Phys. Tech. Phys., 1956. 1: p. 1689-1713.
34. Shchelkin, K. and Y.K. Troshin, Non-stationary phenomena in the gaseous detonation
front. Combustion and Flame, 1963. 7: p. 143-151.
35. Mitrofanov, V. and R. Soloukhin. The diffraction of multifront detonation waves. in
Доклады Академии наук СССР. 1964.
36. Knystautas, R., J. Lee, and C. Guirao, The critical tube diameter for detonation failure in
hydrocarbon-air mixtures. Combustion and Flame, 1982. 48: p. 63-83.
37. Edwards, D., G. Thomas, and M. Nettleton, The diffraction of a planar detonation wave
at an abrupt area change. Journal of Fluid Mechanics, 1979. 95(1): p. 79-96.
38. Liu, Y., J. Lee, and R. Knystautas, Effect of geometry on the transmission of detonation
through an orifice. Combustion and Flame, 1984. 56(2): p. 215-225.
39. Benedick, W., R. Knystautas, and J.H. Lee, Large-scale experiments on the transmission
of fuel-air detonations from two-dimensional channels. 1983, Sandia National Labs.,
Albuquerque, NM (USA); McGill Univ., Montreal, Quebec ….
40. Yamashita, H., et al., Visualization study of ignition modes behind bifurcated-reflected
shock waves. Combustion and flame, 2012. 159(9): p. 2954-2966.
41. Meyer, J., P. Urtiew, and A. Oppenheim, On the inadequacy of gasdynamic processes for
triggering the transition to detonation. Combustion and Flame, 1970. 14(1): p. 13-20.
42. Pantow, E., M. Fischer, and T. Kratzel, Decoupling and recoupling of detonation waves
associated with sudden expansion. Shock waves, 1996. 6(3): p. 131-137.
43. Shchelkin, K., Influence of tube roughness on the formation and detonation propagation
in gas. Journal of Experimental and Theoretical physics, 1940. 10(10): p. 823-827.
44. Fay, J.A., Two‐dimensional gaseous detonations: Velocity deficit. The Physics of Fluids,
1959. 2(3): p. 283-289.
108
45. Lee, J., R. Knystautas, and C. Chan. Turbulent flame propagation in obstacle-filled tubes.
in Symposium (International) on Combustion. 1985. Elsevier.
46. Kuznetsov, M., V. Alekseev, and S. Dorofeev, Comparison of critical conditions for
DDT in regular and irregular cellular detonation systems. Shock Waves, 2000. 10(3): p.
217-223.
47. Lee, J., The detonation phenomenon.-New York, NY, USA: The Cambridge University
Press. 2008.
48. Rainsford, G., Visualization of detonation propagation in a round tube equipped with
repeating orifice plates. 2017, Queen's University (Canada).
49. Lieberman, D. and J. Lee, Photographic study of the transition between the quasi-
detonation and choking regimes. International Colloquim on the Dynamics of Explosions
and Reactive Systems, 2001.
50. Mooradian, A.J. and W. Gordon, Gaseous detonation. I. Initiation of detonation. The
Journal of Chemical Physics, 1951. 19(9): p. 1166-1172.
51. Manson, N., et al. Vibratory phenomena and instability of self-sustained detonations in
gases. in Symposium (International) on Combustion. 1963. Elsevier.
52. Gao, Y., H.D. Ng, and J.H. Lee, Experimental characterization of galloping detonations
in unstable mixtures. Combustion and Flame, 2015. 162(6): p. 2405-2413.
53. Bollinger, L.E., R. Edse, and J. Laughrey, Experimental detonation velocities and
induction distances in hydrogen-nitrous oxide mixtures. 1962.
54. Silvestrini, M., et al., Flame acceleration and DDT run-up distance for smooth and
obstacles filled tubes. Journal of Loss Prevention in the Process Industries, 2008. 21(5):
p. 555-562.
55. Shepherd, J., Chemical Kinetics of Hydroge-Air-Dilunet Detonations. Progress in
Astronautics and Aeronautics, 1986. 106: p. 263-293.
109
56. Goodwin, D.G., H.K. Moffat, and R.L. Speth, Cantera: An object-oriented software
toolkit for chemical kinetics, thermodynamics, and transport processes. Caltech,
Pasadena, CA, 2009. 124.
57. Browne, S., J. Ziegler, and J. Shepherd, Numerical solution methods for shock and
detonation jump conditions. GALCIT report FM2006, 2008. 6: p. 90.
58. Cross, M., Detonation hazard classification based on the critical orifice plate diameter
for detonation propagation. 2015.
110
Appendix A
Uncertainty Analysis
Mixture Composition
The ready-to-ignited pre-mixed mixture has undergone the making and filling into the
thank procedures. Each of these procedures has its own uncertainty that together represents the
uncertainty associated with mixture composition.
Since the maximum pressure that the pressure transducer can read on the mixing chamber
is 50 psi (345 kPa), the tank filled up to 300 kPa. The creation of the mixture was based on the
partial pressure method. A mixture in this study mostly consists of fuel, oxygen, and inert gas.
Depending on the mole fraction of each of these components in the mixture, each of these three
components was added to the mixing chamber. The accuracy of the pressure transducer installed
on the chamber is 0.25%. Therefore, the uncertainty associated with adding all the components to
the chamber can be calculated by Equation A.1:
Error𝑇𝑜𝑡𝑎𝑙 = (P𝐹𝑢𝑒𝑙 + P𝑂𝑥𝑦𝑔𝑒𝑛 + P𝐼𝑛𝑒𝑟𝑡 𝐺𝑎𝑠) × (0.0025) (A.1)
Where sums of each component pressure will be 300 kPa. Hence the total uncertainty will be
±0.75 kPa.
The pressure transducer on the combustion channel also has 0.25% accuracy. For
the highest and lowest pressure tested in the experiment (90 kPa and 4 kPa, respectively),
the uncertainty of filling the tube with the pre-mixed mixture is ±0.225 kPa and ±0.01
kPa, respectively. The maximum leakage rate in the channel during the leakage tests was
found to be 1 kPa over ten minutes, with the starting point of when the vacuum pump is
111
turned off. This will indicate a 0.1 kPa leakage every minute. The time it takes when the
vacuum pump valve is closed to when ignition started in the tube is less than a minute (20
seconds at maximum). Adding the leakage uncertainty to filling uncertainty results in
total uncertainty of ±0.325 kPa and ±0.11 kPa for 90 kPa and 4 kPa, respectively.
Combining the two uncertainties of preparing and using procedures, in the case of
the highest pressure tested in the thank (worst case scenario), the total uncertainty
involving the highest pressure is ±1.075 kPa.
Velocity Measurements
The average combustion velocity was obtained by tracking the flame front location and
dividing the traveled distance by the time it takes. The traveled distance was measured by
knowing the distance between two orifice plates to be 7.6 cm. The uncertainty of that distance
measurement is ±0.26 mm, which is the combination of the tolerance to which orifice plates were
built. The uncertainty of the time measurement is inverse of the frame rate. Most of the videos
were used 150,000 fps as the frame rate. The total uncertainty associated with velocity
measurement is ±13 m/s for the test with the lowest velocity (500 m/s) and ±185 m/s for the
highest velocity (2000 m/s).
DDT run-up distance measurement
The DDT run-up distance was obtained by visually detecting the orifice plate that
detonation first initiated in the tube. This was done manually with the uncertainty of a ±1
orifice plate. The distance between each orifice plate is 7.6 cm, and therefore the
uncertainty of the DDT run-up distance is ±0.076 m. Note that this error is only
associated with the videos with a frame rate lower than 100,000 fps. For the higher frame

112
rate videos, the uncertainty of the DDT run-up distance is 0. This is due to the possibility
of indicating the exact orifice plate that detonation was initiated.
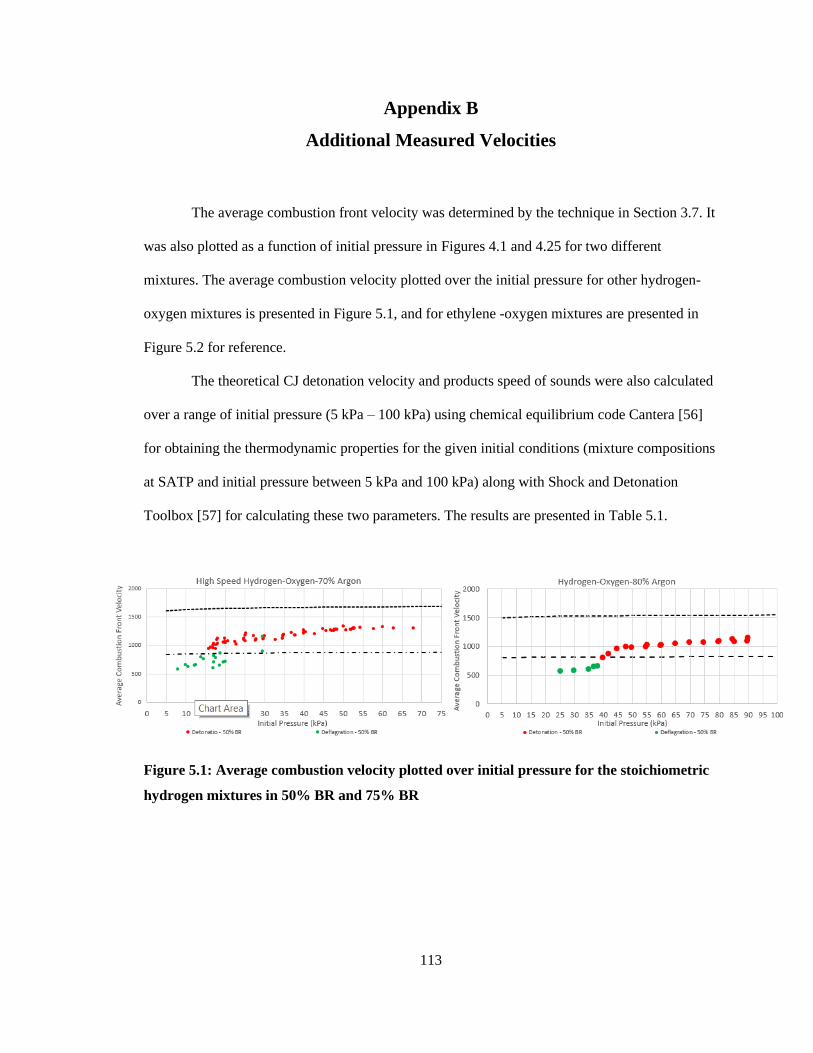
113
Appendix B
Additional Measured Velocities
The average combustion front velocity was determined by the technique in Section 3.7. It
was also plotted as a function of initial pressure in Figures 4.1 and 4.25 for two different
mixtures. The average combustion velocity plotted over the initial pressure for other hydrogen-
oxygen mixtures is presented in Figure 5.1, and for ethylene -oxygen mixtures are presented in
Figure 5.2 for reference.
The theoretical CJ detonation velocity and products speed of sounds were also calculated
over a range of initial pressure (5 kPa – 100 kPa) using chemical equilibrium code Cantera [56]
for obtaining the thermodynamic properties for the given initial conditions (mixture compositions
at SATP and initial pressure between 5 kPa and 100 kPa) along with Shock and Detonation
Toolbox [57] for calculating these two parameters. The results are presented in Table 5.1.
Figure 5.1: Average combustion velocity plotted over initial pressure for the stoichiometric
hydrogen mixtures in 50% BR and 75% BR
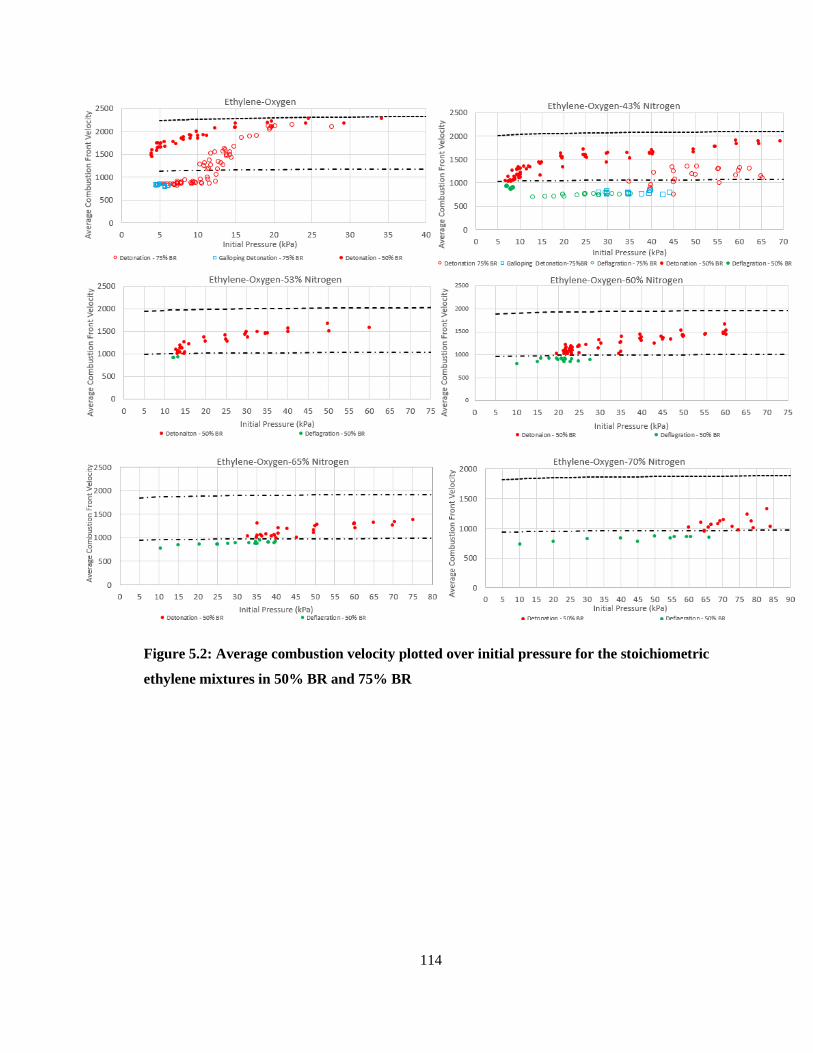
114
Figure 5.2: Average combustion velocity plotted over initial pressure for the stoichiometric
ethylene mixtures in 50% BR and 75% BR
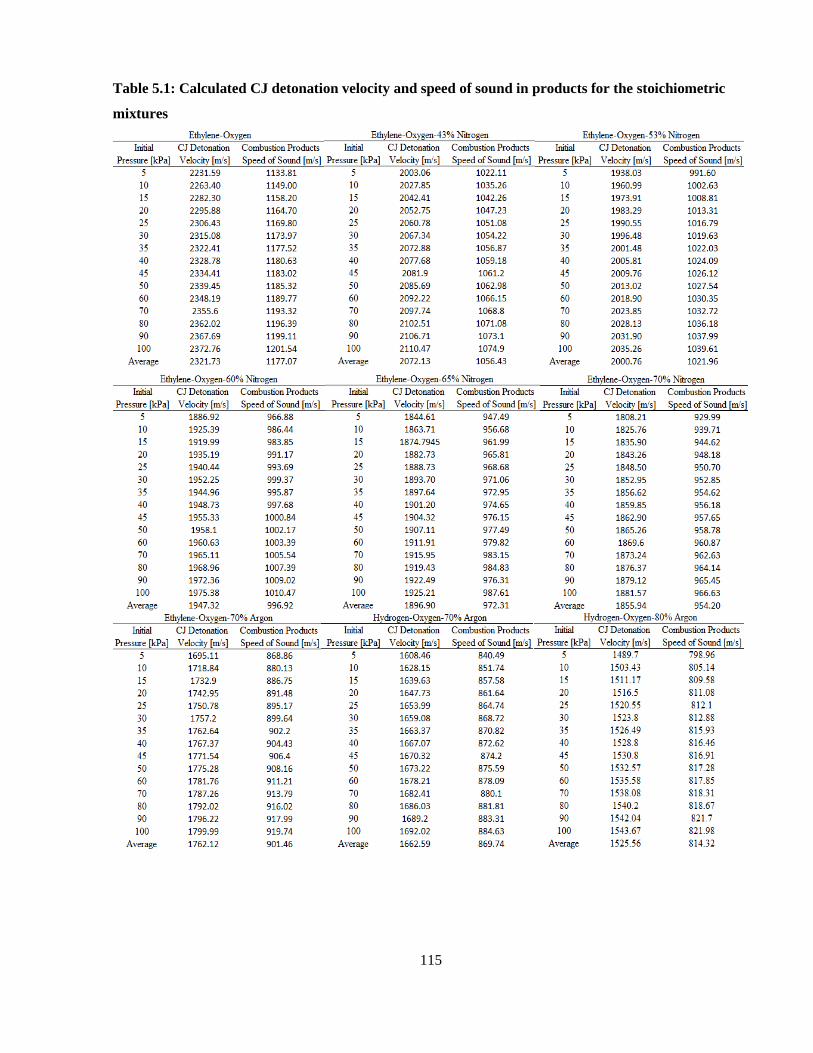
115
Table 5.1: Calculated CJ detonation velocity and speed of sound in products for the stoichiometric
mixtures