Embed Size (px)
Citation preview
Jerry Shadewald
2000 MTC Transportation Scholars Conference Ames, Iowa
123
VISUALIZING SYSTEM-WIDE ECONOMIC IMPACTS OF TRANSPORTATION PROJECTS
Jerry K. Shadewald Center for Transportation Research and Education Iowa State University ABSTRACT
The economic evaluation of proposed transportation projects has traditionally been a technical process
based on collected data and equations. Future needs must be considered to adequately meet the demands of system
users. To ensure project success as political pressure forces transportation projects to be both beneficial and non-
intrusive, transportation professionals must begin incorporating the public into every stage of a proposed project,
including the economic analysis. By bringing together existing technologies, a streamlined process of producing
future needs estimates, performing the economic evaluation of the proposed solution and displaying the costs and
benefits of the solution has been created. This process is performed in a geographic information system
environment that enables the efficient storage and visualization of data, thereby increasing the efficiency of the
economic evaluation as well as providing a venue to display results.
INTRODUCTION
The decision to spend tax dollars for infrastructure improvement requires justifying the capital costs with
more than simply a timesavings to the users. Current construction projects will not have the obvious economic
benefits enjoyed by the Interstate System projects of the 1950s and 60s, therefore decision makers must be
conscious of economic factors from the beginning of any proposed project (1). Both the scale and level of detail
required for an economic analysis typically varies according to a number of factors including the size and estimated
capital cost of the project, makeup of surrounding land-use and existing network infrastructure. Justification of
smaller projects can normally be done with very little economic analysis while multi-million dollar projects typically
require a detailed economic investigation.
In order to perform an economic evaluation of a proposed transportation project, a large set of data must
first be collected. First the population and employment base upon which the costs and benefits will be spread must
be established. An attempt at quantifying the costs and benefits must then be undertaken. Costs that should be
considered during project planning range from the more quantifiable capital, maintenance and administrative costs
Jerry Shadewald
2000 MTC Transportation Scholars Conference Ames, Iowa
124
to the more abstract environmental and societal costs. Typical benefits are a combination of increased access,
mobility, safety or environmental friendliness depending upon the function of the project. Both the costs and
benefits must be identified for the entire impacted area as well as the entire useful life of the project. The most
critical issue is the effect the project will have on the traffic flow patterns throughout the affected area. This data
may originate from spreadsheet calculations or more complicated travel demand models depending upon the size
and complexity of the affected area, however either approach results in a link-by-link forecast of traffic volumes for
each alternative (2). Pozenda suggests integrating a travel demand model with an economic evaluation model to
provide better economic predictions as part of the transportation planning process (3). This paper uses the
commercial travel demand model Tranplan to produce link speeds and volumes for both a base and an alternative
scenario.
The Federal Highway Administration (FHWA) has produced several software packages that perform an
economic analysis on proposed transportation project scenarios. Programs such as the Spreadsheet Model for
Induced Travel Estimation (SMITE) and Sketch Planning Analysis Spreadsheet Model (SPASM) provide estimates
based on spreadsheet calculations of traffic flow changes (4, 5). To assess impacts at the system level, FHWA has
developed the ITS Deployment Analysis System (IDAS) (4, 6) and the Surface Transportation Efficiency Analysis
Model (STEAM) (4, 7) programs. Both programs use network files containing travel speeds and traffic volumes,
skim tree data, origin to destination tables, socio-economic data aggregated at the traffic analysis zone and a
multitude of other economic variables to calculate traffic impacts due to an alternative scenario. National default
values are incorporated into both software packages for all calculated costs, such as emission rate, fuel cost and
accident cost. All default values are editable, allowing the programs to be customized for a particular city, county or
state.
PROJECT OVERVIEW
To assist in the transportation demand modeling process, including calibration of the model and
visualization of output, an interface has been created at the Center for Transportation Research and Education
(CTRE) at Iowa State University linking Tranplan with the geographic information system (GIS) ArcView. This
interface performs all required functions to build, edit, operate and analyze the Tranplan models for the base and
alternative scenarios. The ArcView-Tranplan interface, along with documentation, is available free from the CTRE
Jerry Shadewald
2000 MTC Transportation Scholars Conference Ames, Iowa
125
website at http://www.ctre.iastate.edu/Research/enhance/index.html (8 ). The interface then acts as a platform upon
which an economic evaluation between a base and alternative scenario can be performed.
The Benefits Efficiency Analysis Module (BEAM) is the second edition of the STEAM program and was
selected for this project over the IDAS software due to BEAM’s ability to evaluate non-ITS scenarios. The chief
enhancement of the BEAM program is the ability to perform economic analysis on user-defined districts within a
network. BEAM conducts a detailed analysis of the costs and benefits between a base and alternative scenario,
including an optional risk analysis, allowing for a range of possible values for the economic variables. A benefit to
cost ratio for the alternative scenario is produced, along with several other scenario comparison values. This output
can then be displayed at the district level in the ArcView-Tranplan interface. The BEAM program may also be
available free of charge at the FHWA website (9). To produce the BEAM formatted input data and visualize the
district creation and analysis output, the ArcView-Tranplan interface is used in conjunction with the BEAM
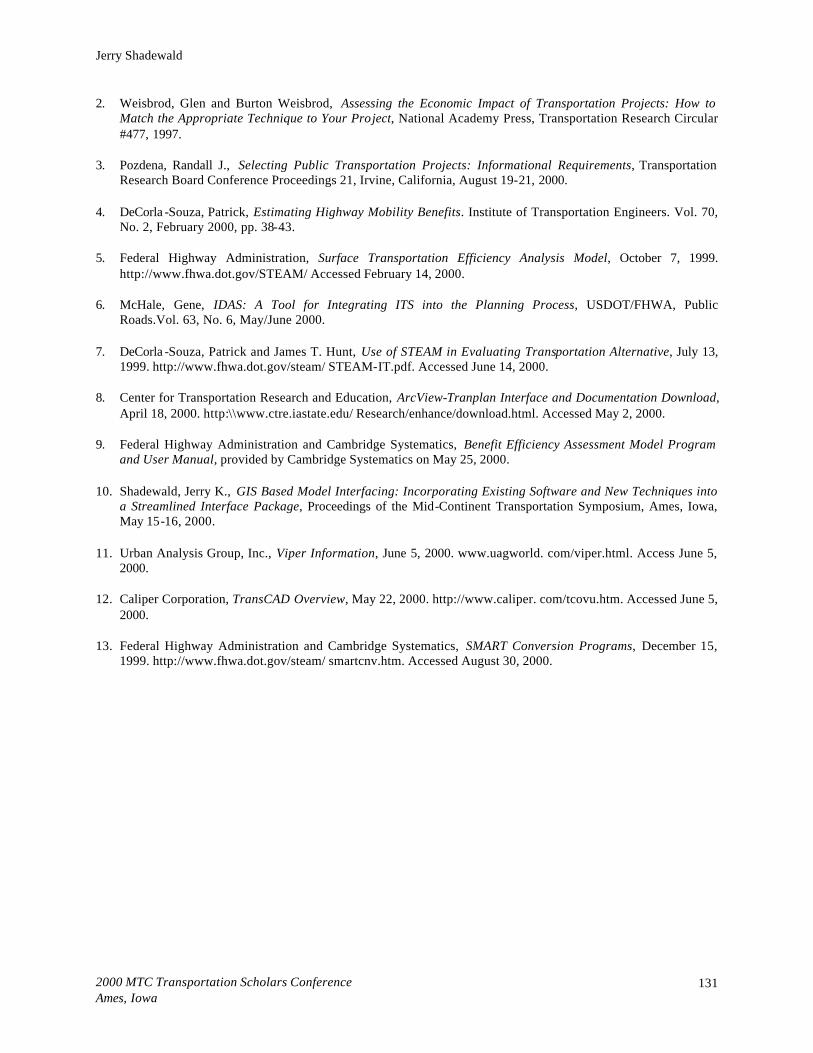
software. A flowchart showing the general steps involved in performing an economic analysis with the ArcView-
Tranplan interface and the BEAM program are shown in Figure 1.
To provide examples of the use of the ArcView-Tranplan interface, as well as the required input and output
for BEAM, a case study for the city of Davenport, Iowa was conducted. The scenarios consist of the Tranplan
network as provided by the Bi-State Regional Commission. The base scenario represents the 15 links that make up
Kimberly Road as a four-lane facility as it exists today. The alternative scenario configures these same 15 links as
six-lane facilities with higher capacities and free-flow speeds. Figure 2 provides the Tranplan network in the
Kimberly Road vicinity.
ARCVIEW-TRANPLAN INTERFACE
The ArcView-based interface allows the user to either recreate an existing Tranplan network or create a
new Tranplan network with the use of aerial photography within ArcView. Once the Tranplan network of links and
nodes has been created, the interface creates control files to be executed by Tranplan in order to perform the traffic
forecast. Tranplan is executed by the interface and the output information is returned to the interface to be added to
the original Tranplan network. Analysis and calibration tools have also been added to allow for model validation
with the ArcView-Tranplan interface (10). Figure 3 shows the interface with the Tranplan information added for the
base and alternative scenarios of the Kimberly Road case study. The original network (links and nodes shapefiles)
Jerry Shadewald
2000 MTC Transportation Scholars Conference Ames, Iowa
126
was created from the formatted text files used by Tranplan. The ld_links and connect shapefiles contain the original
link attributes from the links shapefile, along with the Tranplan output of forecasted link speeds and volumes.
The interface has incorporated the BEAM program to provide users with economic analysis functionality
when comparing transportation project alternatives. Similar transportation GIS packages are also available
commercially such as Viper (11) and TransCAD (12). The Federal Highway Administration’s STEAM website
provides conversion programs to convert several travel demand models including TransCAD, TP+, Emme/2 and
Tranplan into STEAM input files (13).
To begin an economic analysis using the ArcView-Tranplan interface, a completed Tranplan model loaded
into ArcView must exist for both the base and alternative scenarios. Note: Both projects must have the same map
projection to allow for overlaying the network files. The first step in performing the economic analysis is to load the
alternative scenario shapefiles into the base scenario’s ArcView project. This feature has been automated through
the use of the ArcView-Tranplan interface.
FORMATTING REQUIRED INPUT DATA FOR BEAM
The BEAM program requires input files for the both the base and alternative scenarios. By using a GIS
package to both visualize and reformat the data, the user can easily verify the validity of the BEAM input files. For
each scenario, a formatted network file containing information about each link in the network is required. An
origin/destination file and skim tree data file are also required for both scenarios. Since the BEA M program requires
that the number of traffic analysis zones remains constant from the base scenario to the alternative scenario, only
one centroid file is required as input. A district file containing the name of each district is also required. Table 1
shows the required input files for a BEAM analysis.
To distribute user costs and benefits to each district, the population and employment of each zone may be
used by BEAM. To transfer this zonal information to BEAM, the data must first be entered into the centroid
attribute table. Although these data are not required to perform a BEAM analysis, the population and employment
data will result in a more appropriate analysis of user benefits. Due to its ease of data handling, the use of ArcView
to populate both the population and employment fields in the centroid attribute table before beginning the BEAM
analysis is encouraged.
The BEAM economic analysis program allows the user to specify districts upon which an economic
evaluation will be conducted. These districts are smaller regions within the network, such as the central business
Jerry Shadewald
2000 MTC Transportation Scholars Conference Ames, Iowa
127
district or a suburb. The interface allows the user to create the district polygons on top of the existing Tranplan
network (Figure 3), however, the district file used as a BEAM input file is created in a later step in the process. The
district polygons are also used later by ArcView to thematically display the BEAM output at the district level.
BEAM requires that a network file containing data for every link in the network is created for both the base
and alternative scenarios. These link records must be in one-way format, ordered by both the a-node and b-node of
the link and must contain the distance, free flow speed, capacity, volume and functional class of the link. These files
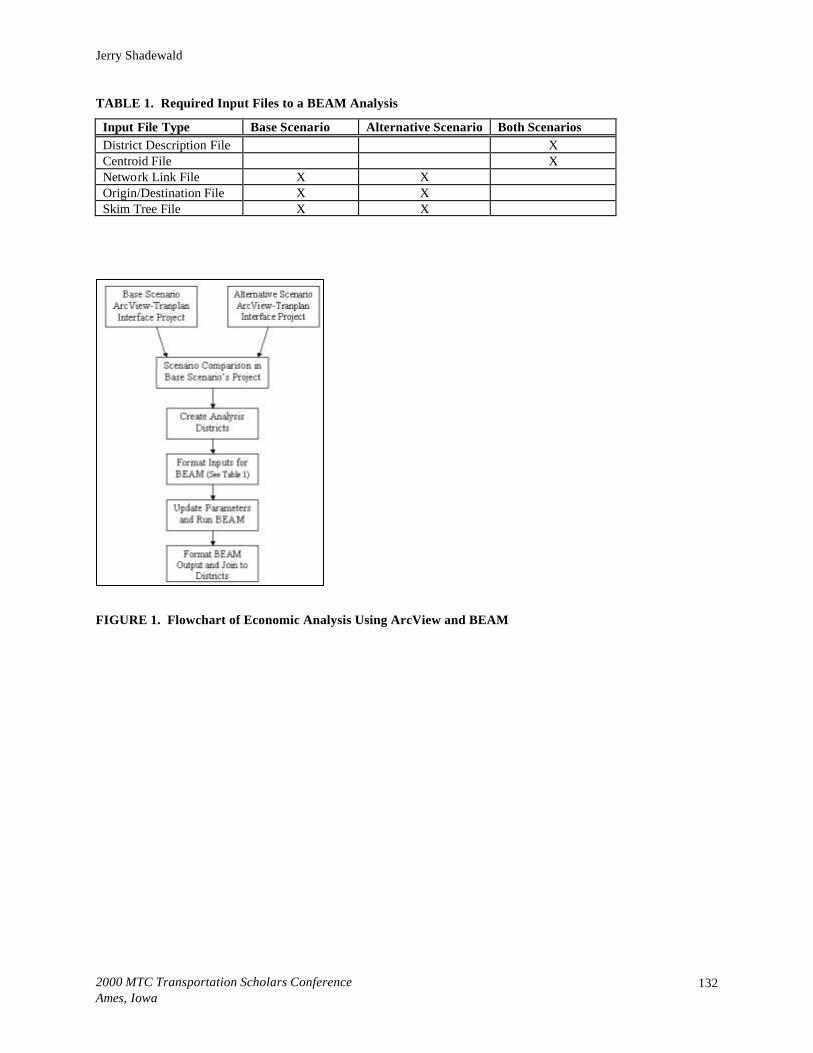
are created by the interface through the use of the Tranplan Data Formatting input screen (Figure 4). The interface
accesses the ArcView database files then formats and prints the data in BEAM format. The BEAM Users Manual
(9) discusses the format requirements for the network links in more detail.
After the link files for the base and alternative scenarios have been reformatted, the shortest impedance
route data from each zone to every other zone (skim trees) for both scenarios are extracted from Tranplan through
the aid of the interface. With link speeds, volumes, skim trees and turn prohibitor information, a Tranplan control
file is created that will output the shortest path between all zones for both the base and alternative scenario networks.
After the new control file is written, Tranplan is executed and a text file containing the shortest path information for
both the base and alternative scenarios is output. These files contain each origin zone, destination zone and the
corresponding time to travel between the zonal pair based on the last traffic assignment iteration. Another vital data
source is the origin /destination table for both the base and alternative scenarios.
A final reformatting of the Tranplan output into the required BEA M format is required and is performed by
the BEAM Input Builder screen. The output of this function is the BEAM formatted skim data files and
origin/destination files for both base and alternative scenarios, as well as the corresponding centroid and district
files. Intrazonal trips are not included in the BEAM analysis.
RUNNING BEAM
Once all required input files have been created by the ArcView-Tranplan interface, the BEAM program is
started. If creating a new BEAM analysis, the user must first define the analysis and enter the district file name
which will be used later to bring the BEAM output back into ArcView.
The next step is to define the market sectors to be analyzed. The user also specifies the auto occupancy,
expansion factor, value of time and speed relationship along with several other parameters. The expansion factor
allows BEAM to convert a daily travel demand model into a yearly economic analysis. A value of 250 is suggested

Jerry Shadewald
2000 MTC Transportation Scholars Conference Ames, Iowa
128
by FHWA to convert a weekday model into a yearly analysis. After defining the market sector, the formatted input
files are entered into BEAM. Both the network and trip table files are entered into BEAM for the base and
alternative scenarios in addition to the common centroid while the skim files are input into BEAM as ‘In-vehicle
Changes’.
Users may elect to modify the default model parameters used during a BEAM analysis. The default values
are based on national averages, however values appropriate to the study area should be obtained if possible. For the
Davenport case study, information regarding crash costs and frequencies were gathered from the Center for
Transportation Research and Education’s traffic safety data center and the Iowa Department of Transportation.
Other variables considered during the case study included the cost and tax rate of gasoline and the value of time to
drivers in their vehicles.
The last required inputs are the capital costs and operations and maintenance costs. These values are input
into BEAM, along with the useful life of the improvement, the completion date and the salvage value of the
improvement. The Kimberly Road improvement is estimated to cost $18 million dollars and increase the annual
maintenance cost of the corridor by $7650 per year.
The final step is running BEAM. The user may choose to perform a risk analysis that will vary the value of
each economic variable in order to produce an output showing the outcome’s sensitivity to that variable. Upon
completion, the results may be viewed in BEAM along with histograms showing the range of possible outcomes as
calculated during the risk analysis. To learn more about the BEAM program, users may consult the BEAM Users
Manual or contact user support at Cambridge-Systematics (9).
BRINGING BEAM OUTPUT INTO ARCVIEW
After the BEAM economic analysis has been completed, the user should verify the analysis results.
Verification of results may be done by comparing the travel demand model’s traffic assignment outputs of system-
wide VHT and VMT with BEAM’s system-wide VHT and VMT. When satisfactory results have been achieved, the
output may be brought back into ArcView. This is done to allow the user to graphically view the analysis results at
the district level and compare the proposed project’s effects on one district versus another district.
ArcView can quickly and easily join data sets on a one to one basis as long as both sets have a common
attribute such as district number. The final step in the BEAM analysis process is the joining of the BEAM district
output to the district shapefile originally used to create the BEAM district input file. This information can then be

Jerry Shadewald
2000 MTC Transportation Scholars Conference Ames, Iowa
129
displayed graphically in ArcView showing the effect the proposed project would have in one of various economic
categories. By providing aerial photography, street networks or land use maps in conjunction with the BEAM
output, information can be more easily conveyed to both decision makers and the public. Tying the economic
values to geographic features provides an easily understood basis upon which to build arguments concerning the
proposed project.
CASE STUDY
The Kimberly Road case study provides a good basis upon which to evaluate the performance of the
ArcView-Tranplan interface’s BEAM module as well as the feasibility of using the BEAM program on smaller
urban projects. Perhaps due to the use of only one mode of transportation for this case study, the true strength of the
BEAM program was not fully utilized. Another factor to consider when evaluating the use of BEAM is the amount
of congestion experienced within the network. BEAM has been developed to explicitly evaluate the more complex
congestion associated with queuing and incidents rather than volume to capacity ratios alone as well as redistribute
the productions and attractions within the network according to accessibility to the network. BEAM also allows for
multiple capital cost projects to be included over a period of time, while the Kimberly Road case study used only
one capital improvement. However, BEAM did appear to produce reasonable results when the Tranplan daily
output for VMT was compared to the BEAM yearly VMT. BEAM’s prediction of VHT was greater than the
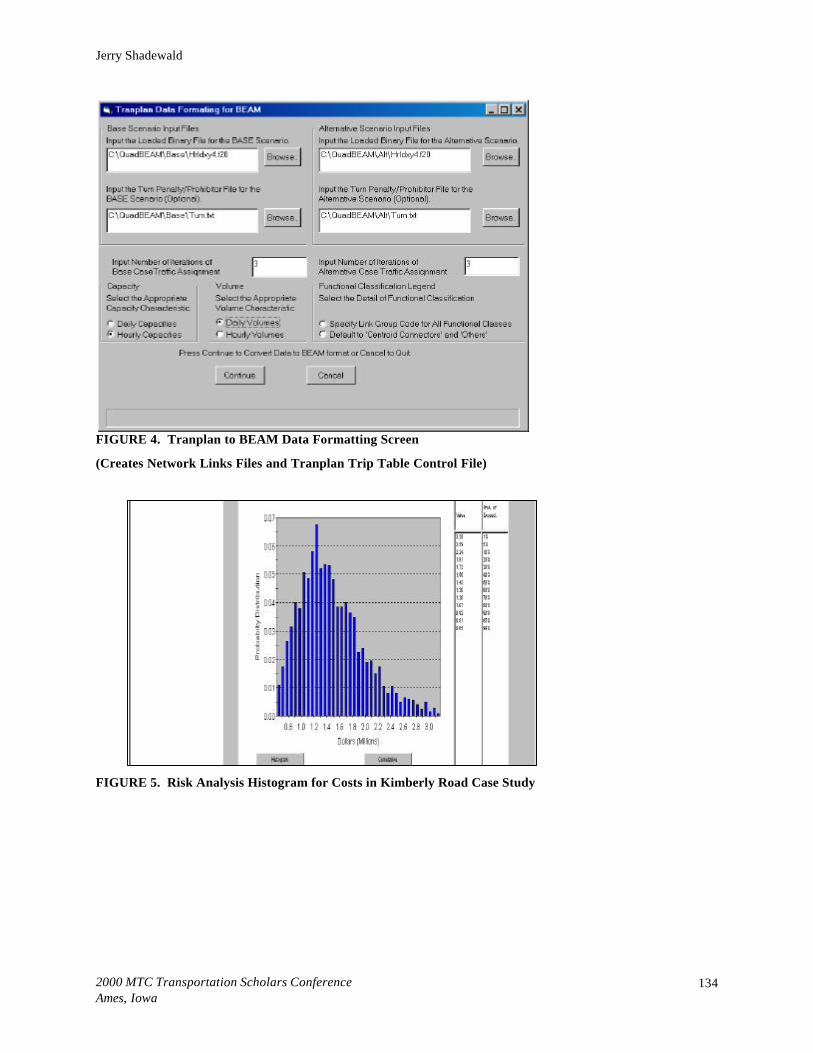
Tranplan estimate again due to BEAM’s accounting for complex congestion. Figure 5 shows the risk analysis
histogram of the costs of the Kimberly Road case study. The bottom line of the Kimberly Road case study is the
benefit-cost ratio of the proposed project. The system-wide ratio was calculated by BEAM to be approximately 5.3
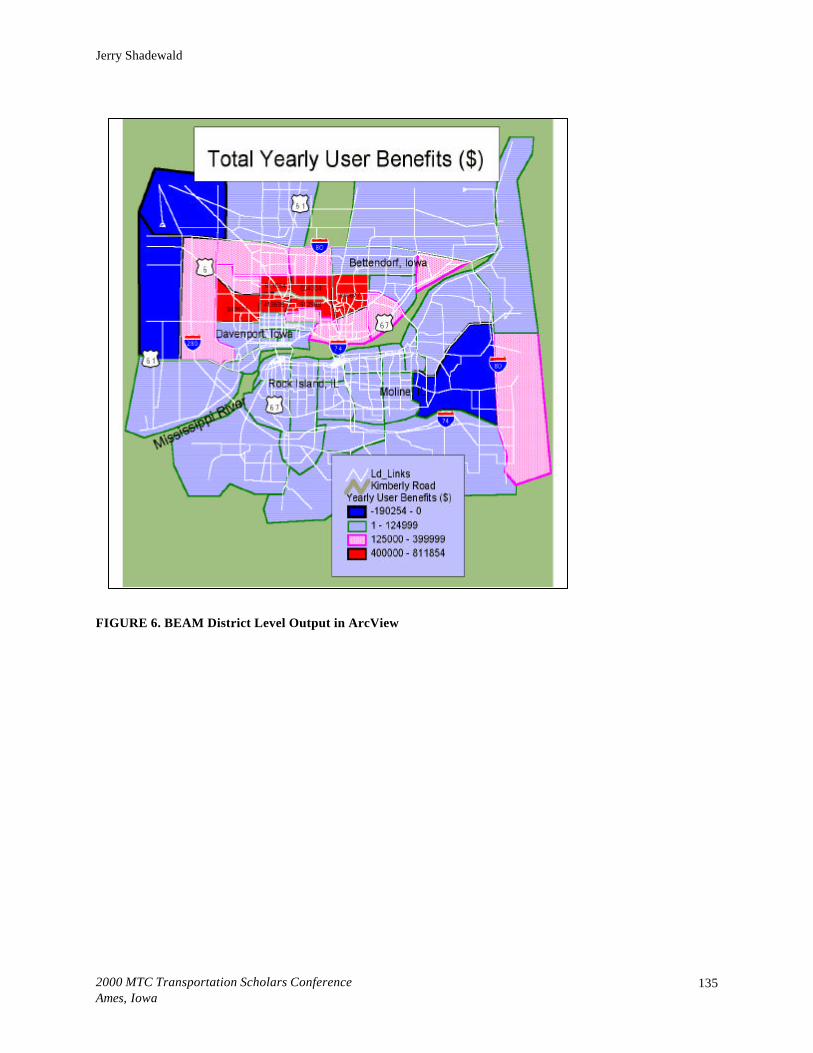
to 1. This indicates a very high benefit return for the capital and user costs associated with the project. Figure 6
shows the total user benefits to the Quad Cities residents that are attributed to the proposed widening of Kimberly
Road. By overlaying the BEAM output with the major streets within the Quad Cities, the proposed projects effects
have been tied to geographic locations that are quantifiable by nature. The ArcView-Tranplan interface proved to be
a useful aid in the Kimberly Road analysis by storing, displaying, and formatting input data as well as displaying the
BEAM output at the district level.
The Kimberly Road case study has brought about several items to consider when contemplating the use of
BEAM for the economic analysis of transportation projects. The first item is the quality of the travel demand model
output used in BEAM. Users should be sure that the traffic assignment is revealing assignment differences due only
Jerry Shadewald
2000 MTC Transportation Scholars Conference Ames, Iowa
130
to the scenario change. The second item is the functional classification used in the model network. BEAM relies
heavily on the functional class assigned to each link when assessing benefits, especially pollution and accident costs.
Finally, users should consider collecting as much local information related to the user costs as possible. Contacting
the state department of transportation may be a great starting point for collecting the accident, emissions and other
costs that make up an economic evaluation.
CONCLUSIONS
The goal of any alternatives analysis is to gather information which will aid in the decision making process.
In the past, technical professionals involved in alternative analysis relied upon the comparison of benefits and costs
to select the course of action. However, the interaction of the transportation network, the transportation users and
the surrounding land use make quantifying costs and benefits over any period of time a difficult assignment. By
utilizing FHWA software advancements, a more comprehensive assessment of project impacts can be made. As
transportation related decisions become more complex and emb edded in public opinion, the need to convey
technical information in a simple and graphical manner must be addressed.
The ArcView-Tranplan interface is similar to other available tools that allow transportation professionals to
create and edit Tranplan networks, perform the Tranplan analysis, use standard modeling tools on the output and
visualize the entire process with the aid of aerial photography or other underlying cartographic layers. BEAM is
comparable to other economic evaluation programs in its ability to account for a variety of economic factors that
affect the benefits of transportation users in a given system. By combining these two programs, a visual economic
analysis can be performed on projects that are only in the early planning stages such as the Kimberly Road project.
This package of programs could be quite useful for not only the technical portions of an economic feasibility study,
but in educating the public on the effects of proposed projects as well.
ACKNOWLEDGEMENTS
The author would like to thank the Iowa Department of Transportation Offices of Systems Planning and
Traffic Safety for their assistance and guidance during this project as well as the Bi-State Regional Commission and
the Center for Transportation Research and Education. Cambridge Systematics was also instrumental by providing
technical assistance throughout the project.
REFERENCES
1. Eberts, Randall, Understanding the Impact of Transportation on Economic Development, Transportation Research Board Conference, Transportation in the New Millennium, http://www.itsamac.com/~nsjfoster/TRB/A1A06/ A1A06Millen.pdf, Accessed August 30, 2000.
Jerry Shadewald
2000 MTC Transportation Scholars Conference Ames, Iowa
131
2. Weisbrod, Glen and Burton Weisbrod, Assessing the Economic Impact of Transportation Projects: How to Match the Appropriate Technique to Your Project, National Academy Press, Transportation Research Circular #477, 1997.
3. Pozdena, Randall J., Selecting Public Transportation Projects: Informational Requirements, Transportation Research Board Conference Proceedings 21, Irvine, California, August 19-21, 2000.
4. DeCorla -Souza, Patrick, Estimating Highway Mobility Benefits. Institute of Transportation Engineers. Vol. 70, No. 2, February 2000, pp. 38-43.
5. Federal Highway Administration, Surface Transportation Efficiency Analysis Model, October 7, 1999. http://www.fhwa.dot.gov/STEAM/ Accessed February 14, 2000.
6. McHale, Gene, IDAS: A Tool for Integrating ITS into the Planning Process, USDOT/FHWA, Public Roads.Vol. 63, No. 6, May/June 2000.
7. DeCorla -Souza, Patrick and James T. Hunt, Use of STEAM in Evaluating Transportation Alternative, July 13, 1999. http://www.fhwa.dot.gov/steam/ STEAM-IT.pdf. Accessed June 14, 2000.
8. Center for Transportation Research and Education, ArcView-Tranplan Interface and Documentation Download, April 18, 2000. http:\\www.ctre.iastate.edu/ Research/enhance/download.html. Accessed May 2, 2000.
9. Federal Highway Administration and Cambridge Systematics, Benefit Efficiency Assessment Model Program and User Manual, provided by Cambridge Systematics on May 25, 2000.
10. Shadewald, Jerry K., GIS Based Model Interfacing: Incorporating Existing Software and New Techniques into a Streamlined Interface Package, Proceedings of the Mid-Continent Transportation Symposium, Ames, Iowa, May 15-16, 2000.
11. Urban Analysis Group, Inc., Viper Information, June 5, 2000. www.uagworld. com/viper.html. Access June 5, 2000.
12. Caliper Corporation, TransCAD Overview, May 22, 2000. http://www.caliper. com/tcovu.htm. Accessed June 5, 2000.
13. Federal Highway Administration and Cambridge Systematics, SMART Conversion Programs, December 15, 1999. http://www.fhwa.dot.gov/steam/ smartcnv.htm. Accessed August 30, 2000.
Jerry Shadewald
2000 MTC Transportation Scholars Conference Ames, Iowa
132
TABLE 1. Required Input Files to a BEAM Analysis
Input File Type Base Scenario Alternative Scenario Both Scenarios District Description File X Centroid File X Network Link File X X Origin/Destination File X X Skim Tree File X X
FIGURE 1. Flowchart of Economic Analysis Using ArcView and BEAM

Jerry Shadewald
2000 MTC Transportation Scholars Conference Ames, Iowa
133
FIGURE 2. Study Area for Kimberly Road Case Study, Davenport, Iowa
FIGURE 3. Creating Analysis Districts in ArcView
Jerry Shadewald
2000 MTC Transportation Scholars Conference Ames, Iowa
134
FIGURE 4. Tranplan to BEAM Data Formatting Screen
(Creates Network Links Files and Tranplan Trip Table Control File)
FIGURE 5. Risk Analysis Histogram for Costs in Kimberly Road Case Study
Jerry Shadewald
2000 MTC Transportation Scholars Conference Ames, Iowa
135
FIGURE 6. BEAM District Level Output in ArcView