Embed Size (px)
Citation preview
Interstate 66Interstate 66From US Route 15 in Prince William County
To Interstate 495 in Fairfax County
Virginia Department of Rail and Public Transportation
TRANSPORTATION TECHNICAL REPORT
FEBRUARY 2013
Transportation Technical Report
for the
Tier 1 Environmental Impact Statement and Related Studies
INTERSTATE 66
From: US Route 15 in Prince William County To: Interstate 495 in Fairfax County
I-66 Tier 1 – Transportation Technical Report
Errata Sheet
This technical report was prepared to support the Tier 1 Draft Environmental Impact Statement. The original report did not include Table 9-2: 2040 Forecast Volumes: Eastbound Direction – AM Peak Hour and Table 9-3: 2040 Forecast Volumes: Westbound Direction – PM Peak Hour. These tables have been inserted in the current version of the document on pages 9-3 and 9-5, respectively.
i
TABLE OF CONTENTS
LIST OF FIGURES .....................................................................................................................iii
LIST OF TABLES ....................................................................................................................... iv
CHAPTER 1 – INTRODUCTION AND BACKGROUND .............................................. 1-1
CHAPTER 2 – STUDY CORRIDOR AND ITS TRANSPORTATION SYSTEMS .... 2-1 2.1 Roadway System ........................................................................................................................... 2-1
2.2 Roadway Interchanges ................................................................................................................. 2-4
2.3 Transit Systems .............................................................................................................................. 2-6
CHAPTER 3 – ANALYSIS DATA ........................................................................................ 3-1 3.1 Roadway Data ............................................................................................................................... 3-1
3.2 Transit Data .................................................................................................................................... 3-2
3.3 Travel Characteristics ................................................................................................................... 3-2
3.4 Safety Data ..................................................................................................................................... 3-3
CHAPTER 4 – TRANSPORTATION ANALYSIS: EXISTING CONDITIONS ......... 4-1 4.1 Existing Conditions – Roadways ................................................................................................ 4-1
4.1.1 Existing Conditions Roadway Traffic Volumes ............................................................ 4-1
4.1.2 Freeway Operations .......................................................................................................... 4-1
4.1.2.1 Freeway Analytical Approach ........................................................................... 4-2
4.1.2.2 Basic Freeway .................................................................................................... 4-15
4.1.2.3 Ramp Merges and Diverges ............................................................................ 4-15
4.1.2.4 Weaves ................................................................................................................ 4-20
4.1.2.5 Collector-Distributer Roads ............................................................................. 4-20
4.1.3 Intersection Analysis ....................................................................................................... 4-21
4.1.3.1 Intersection Analytical Approach ................................................................... 4-21
4.1.3.2 Intersection Analysis ........................................................................................ 4-22
4.2 Existing Conditions – Transit Ridership and Operations ...................................................... 4-22
4.3 Transfer Points ............................................................................................................................. 4-27
I-66 Tier 1 – Transportation Technical Report
ii
CHAPTER 5 – TRAVEL SAFETY IN THE STUDY CORRIDOR ................................... 5-1 5.1 Crash Analysis Methodology ...................................................................................................... 5-1
5.2 Detailed Crash Analysis ............................................................................................................... 5-1
5.3 Summary of Safety and Geometric Deficient Locations .......................................................... 5-6
5.3.1 Summary of High Crash Locations ................................................................................. 5-6
5.3.2 Geometric and Interchange Spacing Deficiencies ......................................................... 5-8
CHAPTER 6 – TRAVEL PATTERNS AND FUTURE TRAVEL DEMAND ................. 6-1 6.1 Overview of Travel Patterns ........................................................................................................ 6-1
6.1.1 Highway Travel Patterns .................................................................................................. 6-1
6.1.2 Highway Trends ................................................................................................................ 6-3
6.1.3 Transit Travel Patterns ...................................................................................................... 6-4
6.2 No-Build Alternative Forecasts ................................................................................................... 6-4
6.2.1 MWCOG Model Forecasting ............................................................................................ 6-4
6.2.2 No-Build Conditions Roadway Forecasts ...................................................................... 6-6
6.2.3 No-Build Conditions Future Transit ............................................................................. 6-21
6.2.4 Improvement Concept Forecasts ................................................................................... 6-21
CHAPTER 7 – TRANSPORTATION ANALYSIS: FUTURE NO-BUILD CONDITIONS .......................................................................................................................... 7-1 7.1 Roadways ....................................................................................................................................... 7-1
7.1.1 Freeway Analysis ............................................................................................................... 7-1
7.1.1.1 Basic Freeway ...................................................................................................... 7-1
7.1.1.2 Ramp Merges and Diverges .............................................................................. 7-2
7.1.1.3 Weaves .................................................................................................................. 7-6
7.1.1.4 Collector-Distributer Roads ............................................................................... 7-6
7.1.2 Intersection Analysis ......................................................................................................... 7-7
7.1.3 Peak Spreading ................................................................................................................. 7-13
7.1.4 Major Points of Congestion ............................................................................................ 7-18
7.1.5 Corridor-Wide and Spot Location Safety ..................................................................... 7-19
7.2 Transit Ridership and Operations ............................................................................................ 7-19
CHAPTER 8 – IMPROVEMENT CONCEPT DEVELOPMENT AND ANALYSIS .... 8-1 8.1 Concept Development and Evaluation Process ........................................................................ 8-2
8.1.1 Goals and Objectives ......................................................................................................... 8-2
8.1.2 Improvement Concepts ..................................................................................................... 8-2
8.1.3 Other Improvement Concepts Eliminated from Detailed Study ................................ 8-4
Table of Contents
iii
8.2 Capacity Improvement Concepts (General Purpose Lanes, Managed Lanes, Metrorail Extension, Light Rail transit, Bus Rapid Transit, and VRE Extension) ................ 8-5
8.3 Improve Spot Locations/Chokepoints ...................................................................................... 8-11
8.4 Intermodal Connectivity ............................................................................................................ 8-12
8.5 Safety Improvements .................................................................................................................. 8-14
8.6 Transportation Communication and Technology .................................................................. 8-14
8.7 No-Build ....................................................................................................................................... 8-15
8.8 Analysis of Improvement Concepts ......................................................................................... 8-16
8.9 Key Findings ................................................................................................................................ 8-20
CHAPTER 9 – PRELIMINARY ANALYSIS OF THE EFFECTS OF TOLLING ........... 9-1
APPENDIX A – DATA COLLECTION PROGRAM ........................................................ A-1
APPENDIX B – GUIDELINES FOR POST-PROCESSING RAW DATA ..................... B-1
APPENDIX C – HCS OUTPUT SHEETS ............................................................................ C-1
APPENDIX D – SYNCHRO’S HCM SIGNALS REPORTS ............................................ D-1
APPENDIX E – CRASH ANALYSIS .................................................................................... E-1
APPENDIX F – TSM – CANDIDATE SHORT TERM IMPROVEMENTS .................. F-1
APPENDIX G – PEAK SPREADING COMPUTATIONS .............................................. G-1
APPENDIX H – CONCEPT DEVELOPMENT AND ANALYSIS TECHNICAL MEMORANDUM ................................................................................................................... H-1
FIGURES Figure 2-1. Study Corridor .................................................................................................................. 2-2
Figure 2-2. I-66 Lane Configuration .................................................................................................. 2-3
Figure 3-1. Location of Data Collection by Type ............................................................................. 3-2
Figure 4-1. Existing Conditions - Typical Daily Volumes .............................................................. 4-3
Figure 4-2. Existing Conditions - Typical AM Peak Hour Volumes ............................................. 4-7
Figure 4-3. Existing Conditions - Typical PM Peak Hour Volumes ........................................... 4-11
Figure 4-4. Transit Services and Ridership Data along the I-66 Corridor .................................. 4-26
Figure 5-1. Types of Crashes – Eastbound Direction by Segment (2008-2010) ........................... 5-4
Figure 5-2. Types of Crashes – Westbound Direction by Segment (2008-2010) .......................... 5-4
I-66 Tier 1 – Transportation Technical Report
iv
Figure 6-1. Historical Trends on I-66 by Segment ........................................................................... 6-3
Figure 6-2. Population and Employment Forecasts ........................................................................ 6-7
Figure 6-3. Projected Traffic Growth along I-66 Corridor .............................................................. 6-8
Figure 6-4. No-Build Conditions - Typical Daily Volumes ............................................................ 6-9
Figure 6-5. No-Build Conditions – Typical AM Peak Hour Volumes ........................................ 6-13
Figure 6-6. No-Build Conditions – Typical PM Peak Hour Volumes ......................................... 6-17
Figure 7-1 Comparison of Existing and No Build Conditions LOS – Freeway Components and Intersections ....................................................................................... 7-9
Figure 7-2. Peak Spreading on I-66: Nutley Street to the Capital Beltway ................................ 7-15
Figure 7-3. Peak Spreading on I-66: VA 28 to Fairfax County Parkway .................................... 7-16
Figure 7-4. Peak Spreading on I-66: US 29 (Gainesville) to VA 234 Bypass .............................. 7-17
Figure 7-5. Metrorail System Capacity (with 100% 8-Car Trains by 2020) ................................ 7-20
Figure 8-1. Concept Development and Evaluation Process ........................................................... 8-1
Figure 8-2. Three-Hour Demand in Person-Trips in 2040 (Maximum of Both Directions) ......................................................................................................................... 8-6
Figure 8-3. Graphical Comparison of Building Block Sizes ........................................................... 8-8
Figure 8-4. Major Points of Congestion........................................................................................... 8-13
TABLES Table 4-1. LOS Criteria for Basic Freeway Segments .................................................................... 4-2
Table 4-2. LOS Criteria for Freeway Merge and Diverge Areas .................................................. 4-2
Table 4-3. LOS Criteria for Freeway Weaving Segments ............................................................. 4-2
Table 4-4. Existing Conditions – Basic Freeway Section Operations ........................................ 4-16
Table 4-5. Existing Conditions – Eastbound Merge and Diverge Area Operations ............... 4-17
Table 4-6. Existing Conditions – Westbound Merge and Diverge Area Operations .............. 4-18
Table 4-7. Existing Conditions – Cross-Streets Merge and Diverge Area Operations ........... 4-19
Table 4-8. Existing Conditions – Weaving Sections Operations ................................................ 4-20
Table 4-9. Existing Conditions – CD Roads Capacity Check ..................................................... 4-21
Table 4-10. LOS Criteria for Signalized Intersections.................................................................... 4-22
Table 4-11. Existing Conditions – Signalized Intersection Operations ....................................... 4-23
Table 4-12. Existing Bus Services within the I-66 Study Corridor by Provider ......................... 4-25
Table 4-13. Primary Transfer Points – I-66 Corridor ..................................................................... 4-28
Table 5-1. 2008-2010 I-66 Crash Rate ............................................................................................... 5-2
Table 5-2. Summary of Eastbound Crashes (2008-2010) ............................................................... 5-3
Table 5-3. Summary of Westbound Crashes (2008-2010) ............................................................. 5-3
Table 5-4. Crash Rate by Segment (2008-2010) ............................................................................... 5-5
Table of Contents
v
Table 5-5. Number of Crashes by Severity – Eastbound (2008-2010).......................................... 5-5
Table 5-6. Number of Crashes by Severity – Westbound (2008-2010) ........................................ 5-6
Table 5-7. Crash Rates (2008-2010) ................................................................................................... 5-6
Table 6-1. Entry and Exit Points for Traffic at Eastern End of the Corridor between Nutley Street and I-495 .................................................................................................... 6-2
Table 6-2. Entry and Exit Points for Traffic in Middle of Corridor between VA 28 and Fairfax County Parkway ................................................................................................. 6-2
Table 6-3. Entry and Exit Points for Traffic at Western End of Corridor West of US 15 .......... 6-3
Table 7-1. 2040 No-Build Conditions – Basic Freeway Section Operations ............................... 7-2
Table 7-2. 2040 No-Build Conditions – Eastbound Merge and Diverge Point Operations ......................................................................................................................... 7-3
Table 7-3. 2040 No-Build Conditions – Westbound Merge and Diverge Point Operations ......................................................................................................................... 7-4
Table 7-4. 2040 No-Build Conditions – Cross-Streets Merge and Diverge Point Operations ......................................................................................................................... 7-5
Table 7-5. 2040 No-Build Conditions – Weaving Sections Operations ....................................... 7-6
Table 7-6. 2040 No-Build Conditions – CD Roads Capacity Check ............................................ 7-7
Table 7-7. 2040 No-Build Conditions Intersection Operations .................................................... 7-8
Table 7-8. Hours of Peak Spreading due to Capacity Constraints ............................................ 7-14
Table 8-1. Building Block Size Summary ........................................................................................ 8-8
Table 8-2. Percent of Person-Trips in Building Blocks Accommodated by Mode .................... 8-9
Table 8-3. Listing of Improvement Concept Scenarios (ICS) ..................................................... 8-10
Table 8-4. Evaluation and Consideration Measures .................................................................... 8-11
Table 8-5. Evaluation of Improvement Concepts against Purpose and Need Elements ........ 8-16
Table 8-6. Evaluation of Capacity Improvement Scenarios (ICSs) – Reach Scenario ............. 8-18
Table 9-1. Tolling Analysis Options ................................................................................................ 9-2
Table 9-2. 2040 Forecast Volumes: EB Direction – AM Peak Hour ............................................. 9-3
Table 9-3. 2040 Forecast Volumes: WB Direction – PM Peak Hour ............................................ 9-5

I-66 Tier 1 – Transportation Technical Report
vi
1-1
1 INTRODUCTION AND BACKGROUND
The Virginia Department of Transportation (VDOT) and the Virginia Department of Rail and Public Transportation (VDRPT), in cooperation with the Federal Highway Administration (FHWA), are studying the potential environmental impacts of transportation improvements concepts along Interstate 66 (I-66) as a Tier 1 Environmental Impact Statement (EIS). Tiering involves the evaluation of broad level programs and issues in an initial (Tier 1) analysis followed by more detailed evaluation of site-specific improvements and analyses in subsequent (Tier 2) studies. This Transportation Technical Report presents the findings of the transportation analysis undertaken in support of the Tier 1 EIS for the I-66 corridor from US 15 in the Haymarket area (Prince William County) to the Capital Beltway (I-495). The technical analysis contained in this report is one of several supporting technical documents being prepared for the Tier 1 EIS.
The discussion in this technical report is organized as follows:
• Section 2: General description of the study corridor and its transportation system
• Section 3: Sources of data for analyses, including data collected specifically for this study
• Section 4: Analysis of existing operations for all travel modes in the study corridor
• Section 5: Analysis of travel safety in the study corridor
• Section 6: Travel patterns, trends, and future year forecasting
• Section 7: Analysis of year 2040 operations under No-Build conditions for all travel modes
• Section 8: Analysis of future transportation improvement concepts to address needs
• Section 9: Preliminary analysis of the effects of tolling in the study corridor

I-66 Tier 1 – Transportation Technical Report
1-2
2-1
2 STUDY CORRIDOR AND ITS TRANSPORTATION SYSTEMS
I-66 is the main east-west interstate highway in Northern Virginia and serves the District of Columbia, Arlington County, Fairfax County, Loudoun County, Prince William County, and the cities of Fairfax, Falls Church, Manassas, and Manassas Park. The study corridor is a complex, multimodal transportation facility that includes general-purpose and high-occupancy vehicle (HOV) highway facilities, commuter rail, heavy rail, local and regional bus service, and bicycle and pedestrian facilities. For all documents prepared for this study, the “study corridor” refers to I-66 itself from US 15 to I-495. The “analysis area” refers to a wider area surrounding the study corridor. Note that for the analysis of potential impacts on the human and natural environment in the Tier 1 EIS, a secondary corridor (the “VRE Extension Corridor”) was defined outside of the study corridor; however, for use in this report and its analysis of travel patterns, such a distinction is not necessary.
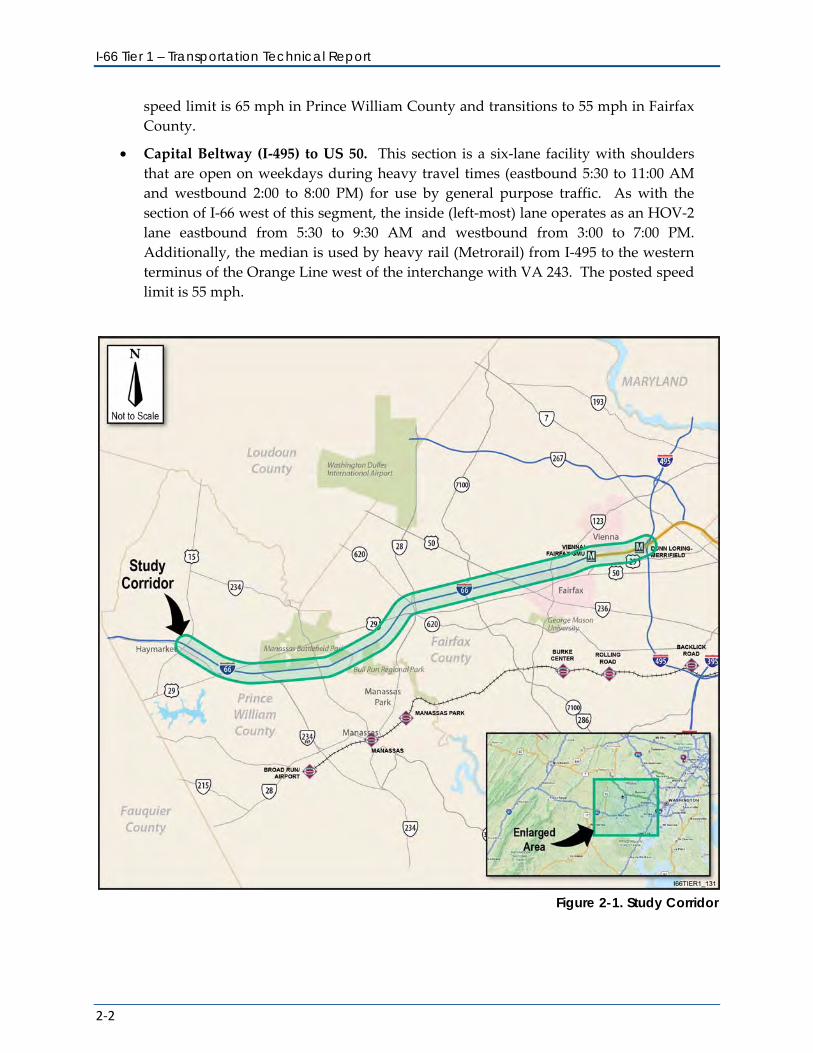
The study corridor covers the 25 miles of I-66 from US 15 in Prince William County to I-495 (Capital Beltway) in Fairfax County (shown in Figure 2-1). Within this area, I-66 includes eleven general-purpose traffic interchanges and two interchanges that serve only HOV traffic. Within the broader analysis area, major highway facilities also include the parallel arterial routes of US 50 and US 29, and several key routes serving north-south travel, including US 15, VA 234, VA 28, VA 286 (Fairfax County Parkway), VA 123, and I-495.
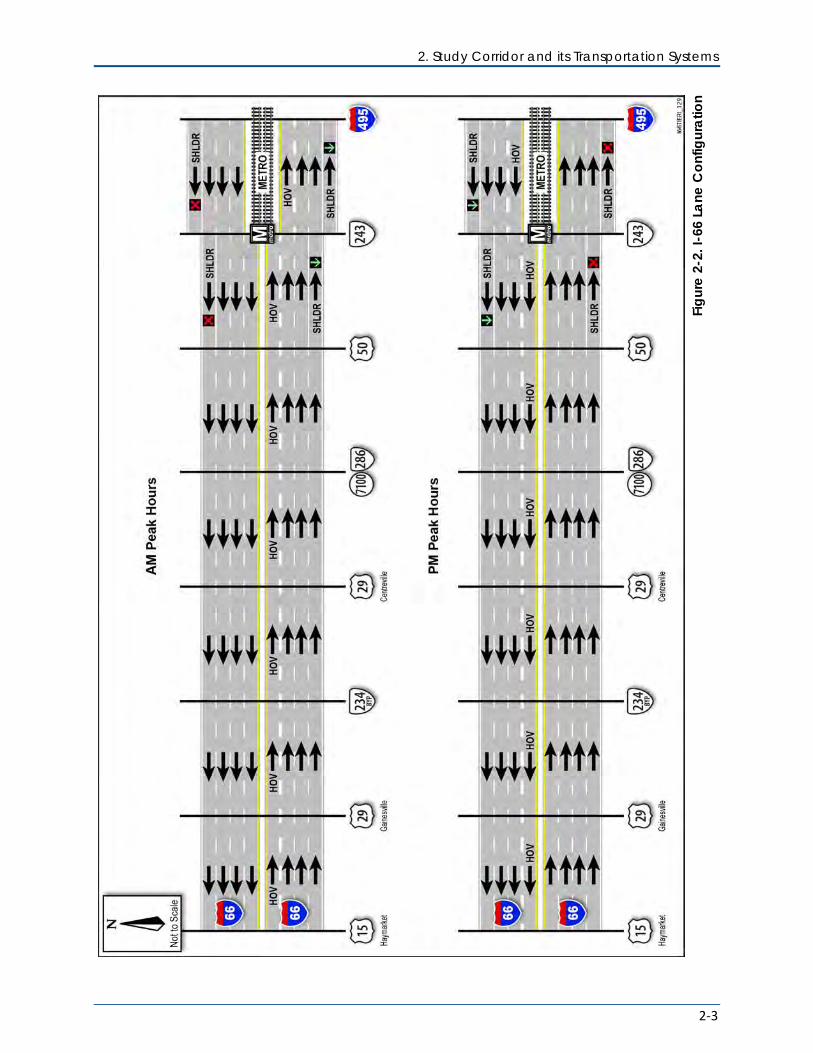
2.1 ROADWAY SYSTEM The lane configuration and associated operating characteristics of I-66 varies within the study corridor; these configurations are depicted schematically in Figure 2-2 and are also summarized below.
• US 15 to US 29 (Gainesville). This section is currently a four-lane facility, and has no HOV lanes. A planned project by VDOT is slated to widen it to eight lanes, including concurrent HOV lanes, and upgrade the interchange at US 15. The widening is designed and funding is committed; construction is planned to be completed by 2015 (the configuration depicted in Figure 2-2 shows the completed condition). The posted speed limit is 65 miles per hour (mph).
• US 29 (Gainesville) to US 50. This section is an eight-lane facility. The width of the median preserves a potential future extension of Metrorail, although it is anticipated that additional space within the median would be required to implement the potential extension. On weekdays, the inside (left-most) lane operates as an HOV-2 (two or more occupants) lane eastbound from 5:30 to 9:30 AM and westbound from 3:00 to 7:00 PM. At other times, the HOV-2 lanes are open to all traffic. The posted
I-66 Tier 1 – Transportation Technical Report
2-2
speed limit is 65 mph in Prince William County and transitions to 55 mph in Fairfax County.
• Capital Beltway (I-495) to US 50. This section is a six-lane facility with shoulders that are open on weekdays during heavy travel times (eastbound 5:30 to 11:00 AM and westbound 2:00 to 8:00 PM) for use by general purpose traffic. As with the section of I-66 west of this segment, the inside (left-most) lane operates as an HOV-2 lane eastbound from 5:30 to 9:30 AM and westbound from 3:00 to 7:00 PM. Additionally, the median is used by heavy rail (Metrorail) from I-495 to the western terminus of the Orange Line west of the interchange with VA 243. The posted speed limit is 55 mph.
Figure 2-1. Study Corridor
2. Study Corridor and its Transportation Systems
2-3
Figu
re 2
-2. I
-66
Lane
Con
figur
atio
n
I-66 Tier 1 – Transportation Technical Report
2-4
2.2 ROADWAY INTERCHANGES There are 11 general-purpose interchanges and 2 HOV interchanges in the study corridor, including the newly reconstructed I-66/Capital Beltway interchange. The interchanges, from west to east, are as follows:
1. US 15 (James Madison Highway): This interchange is a rural diamond interchange with two signalized intersections, one for the westbound I-66 ramps and another one for the eastbound I-66 ramps. VDOT has plans to upgrade this interchange, either to convert the interchange to a single-point urban interchange (SPUI) or provide a flyover for the southbound to eastbound movement. A final configuration has not yet been determined (up-to-date information pertaining to the project can be found on the VDOT website).1 US 15 is posted at 45 mph in the vicinity of the interchange, and is a four-lane facility.
2. US 29 (in Gainesville, also called US 29 West in this report): This interchange’s basic configuration is a modified cloverleaf interchange, with a directional ramp for the westbound I-66 to southbound US 29 movement. The eastbound direction includes a collector-distributor (CD) road. A signal is located at the terminus of the westbound to northbound ramp to provide access to Heathcote Boulevard. This interchange was recently reconstructed. A VDOT project is ongoing at the first intersection to the south on US 29 at Linton Hall Road to upgrade this intersection to a SPUI configuration. With this improvement, there will be no traffic signals through this junction for the US 29 through movement. The interchange project will be integrated with the current I-66 interchange in order to reduce ramp to ramp weaving movements in the southbound direction. Adjacent to this interchange, US 29 is posted at 45 mph.
3. VA 234 Bypass: This interchange, configured with a “trumpet” layout, serves Manassas and areas to the west. VA 234 is a four lane facility which is posted at 50 mph. The preferred alignment of the proposed Tri-County Parkway is a western alignment that would extend from the VA 234 Bypass north towards US 50.
4. VA 234 Business: This interchange is a combination of a partial cloverleaf layout (westbound direction) and a diamond layout (eastbound direction). Traffic signals are located at the on-ramp to westbound I-66, and at the eastbound I-66 ramps. VA 234 Business is posted at 35 mph. VA 234 has one lane in each direction on the north side of I-66 starting at Bulloch Drive. South of I-66, VA 234 is primarily a six-lane facility.
5. US 29 (in Centreville, also called US 29 East in this report): This interchange is a combination of a partial cloverleaf layout (westbound direction) and a diamond layout (eastbound direction). Traffic signals are located at the terminus of the westbound I-66 off-ramp, and at the eastbound I-66 ramps. US 29 is posted at 40 mph within the interchange, and is a six-lane facility.
6. VA 28: This interchange has a partial cloverleaf layout with loop ramps in the northwest and southeast quadrants and directional ramps in all but the southwest quadrant. A
1 http://www.virginiadot.org/projects/northernvirginia/i-66_and_route_15_interchange.asp. Accessed 2012-04-26.
2. Study Corridor and its Transportation Systems
2-5
traffic signal on the north side of the interchange serves traffic exiting from I-66 westbound, while a traffic signal on the south side of the interchange serves south VA 28 to eastbound I-66 traffic. VA 28 is posted at 50 mph and is a six-lane facility.
7. Stringfellow Road HOV ramp: A ramp at Stringfellow Road serves only HOV and bus traffic going to and from I-66 to the east and Stringfellow Road. The ramp functions as an on-ramp from Stringfellow Road to eastbound I-66 during the AM peak period, and as an off-ramp from westbound I-66 to Stringfellow Road during both PM peak and off-peak hours. On weekends, the ramp is also open to westbound traffic in order to assist in relieving congestion at adjacent interchanges for traffic destined to nearby shopping centers. Weekend operation of the ramp is also helping to ease traffic flow on the Fairfax County Parkway while intersections north of I-66 are being upgraded to grade-separated interchanges. Stringfellow Road is a 4-lane facility posted at 35 mph.
8. VA 286 (Fairfax County Parkway): This interchange has a full-cloverleaf layout including with CD roads along I-66 in both directions. Two at-grade interchanges on the Fairfax County Parkway north of I-66 are currently being upgraded to grade-separated interchanges. The Parkway is a four-lane facility posted at 50 mph.
9. Monument Drive HOV ramp: This ramp is similar to the ramp at Stringfellow Road in that it serves only HOV and bus traffic during weekday peak periods and serves traffic going to and from I-66 to the east. At other times, as at Stringfellow Road, the ramp serves traffic going from westbound I-66 to Monument Drive. Monument Drive is a four-lane facility posted at 35 mph.
10. US 50 (Lee Jackson Memorial Highway): This interchange is a modified cloverleaf interchange with a directional ramp for the southeastbound US 50 to eastbound I-66 movement. Also, a ramp is located within the interchange to carry from northwestbound US 50 traffic destined to Fair Oaks Mall. US 50 is a six-lane facility posted at 45 mph immediately south of I-66, and at 50 mph north of I-66.
11. VA 123 (Chain Bridge Road): This interchange is a modified cloverleaf interchange with a westbound to southbound directional ramp, and the eastbound direction has a CD road. VA 123 is a four-lane facility and is posted at 30 mph.
12. VA 243 (Nutley Street): This interchange is a modified cloverleaf interchange with CD roads in both directions of I-66. Located within this interchange is the Vienna Metrorail station, so ramps are provided along the CD roads to provide ingress-egress to/from Metrorail parking areas (both structured parking and surface lots). Nutley Street is posted at 30 mph, and is six through lanes within the interchange influence area.
13. Interstate 495 (I-495, the Capital Beltway): This semi-directional interchange connects I-66 to I-495, and includes ramps for some HOV movements. As part of the I-495 Express Lanes (HOT Lanes) project, this interchange was reconstructed and additional HOV ramps were constructed.
I-66 Tier 1 – Transportation Technical Report
2-6
2.3 TRANSIT SYSTEMS Thousands of commuters use transit daily along the I-66 corridor. The current transit system within the corridor includes bus services that use the I-66 roadway itself and rail service on rail facilities in the median as well as on a separate corridor that runs roughly parallel to I-66 five miles south of the study corridor. Additionally, the system includes associated facilities such as commuter parking lots and bicycle and pedestrian facilities, and programs to support transit commuting. These transit resources and supporting services within the study corridor are described below, with details of existing ridership and operations included in Section 4.2:
METRORAIL ORANGE LINE The Washington Metropolitan Area Transit Authority (WMATA) operates a heavy rail transit system, Metrorail, throughout the Washington, D.C. region. Metrorail’s Orange Line operates above ground on two tracks in the I-66 median at the eastern end of the study corridor (from the Vienna station just west of VA 243 to I-495). The Orange Line continues east from I-495 through Falls Church into Arlington County (where it moves below ground) and the Washington, D.C. core. The two Metrorail stations located within the study corridor are the Vienna/Fairfax-GMU Station (just west of VA 243) which is the Orange Line’s western-most station, and the Dunn Loring-Merrifield Station (just west of I-495). The stations include Park-and-Ride lots and bus bays that serve connecting local and regional bus services.
VIRGINIA RAILWAY EXPRESS (VRE) VRE is operated by the Northern Virginia Transportation Commission and the Potomac and Rappahannock Transportation Commission (PRTC) and connects the Northern Virginia suburbs to Union Station in Washington, D.C.. VRE’s Manassas Line, which runs generally parallel to I-66 but is removed by over 5 miles, provides parallel transportation service for a travelshed that partially overlaps that of I-66. The Manassas Line’s western-most station is Broad Run/Airport in Bristow, with stations at Manassas, Manassas Park, Burke Centre, and Rolling Road outside of the Capital Beltway. Many of the stations include Park-and-Ride lots and bus bays for connecting local and regional bus services. Amtrak operates long and short distance rail lines along the same tracks as VRE; all Amtrak lines converge at Union Station in Washington, D.C.
LOCAL AND REGIONAL BUS The primary local transit service provider in the City of Fairfax is the Fairfax CUE, operated by the City of Fairfax. The CUE service has two routes (Green and Gold) which both connect to the Vienna/Fairfax-GMU Metrorail Station. CUE also provides connections to the WMATA Metrobus service, the George Mason University shuttle service, and the Fairfax Connector.
The primary local transit service provider in Fairfax County is the Fairfax Connector. The Fairfax Connector provides service to numerous Park-and-Ride lots located in the county, and to several Metrorail stations. Connections are also possible to other bus service providers, including the City of Fairfax CUE service, Loudoun County (LC) Transit, and Potomac and Rappahannock Transportation Commission (PRTC) service. Metrobus also provides bus service within Fairfax County.
2. Study Corridor and its Transportation Systems
2-7
PRTC, which provides regional and local bus service for Prince William County, also operates the OmniRide commuter bus service. These services provide connections to Metrorail and VRE stations and Amtrak. In addition, LC Transit provides service to and from Loudoun County and other parts of the region, including Washington DC, Roslyn, and Tysons Corner. LC Transit also connects to Metrorail at West Falls Church and Roslyn. These services also connect to Park-and-Ride lots along the I-66 corridor.
Additional transit services include OmniLink, local flex route/demand response service operated by PRTC in Eastern Prince William County and the Manassas area, as well as Arlington Transit (ART) which operates transit within Arlington County.
PARK-AND-RIDE LOTS A total of 13 Park-and-Ride lots are located within the study corridor: ten in Fairfax County and three in Prince William County. Some Park-and-Ride Lots are serviced by the bus services described above while others provide opportunities for carpooling or vanpooling. Park-and-Ride Lots tend to be concentrated along major commuting corridors where connections to commuter bus and/or rail services are available.
BICYCLE AND PEDESTRIAN FACILITIES Although I-66 itself is a high-speed controlled access facility that does not allow bicycles, people may travel by bicycle for part of a trip that also includes I-66. Specifically, this means bicycling to or from a bus or rail station or Park-and-Ride and carrying a bicycle on a bus or train. While the Martha Custis multipurpose trail runs alongside I-66 inside the Capital Beltway, there are no bicycle and/or pedestrian trails that parallel to, or located within the I-66 right-of-way, between US 15 and the Capital Beltway (I-495).
TRANSPORTATION DEMAND MANAGEMENT (TDM) PROGRAMS A variety of TDM programs and services are in place to support transit use and other ridesharing activities, and to reduce overall travel demand, within the study corridor and the analysis area.
MWGOG’s Commuter Connections program provides a regional overlay, and local TDM agencies in the study area are members of this network. Commuter Connections provides regional services including a central ridematching system/database, Guaranteed Ride Home (GRH) program, Pool Rewards incentive program, regional marketing, and events like Car-free Day and Bike to Work Day.
Federal programs that have a significant impact in this area include the federal agency commuter benefit and the Telework Enhancement Act of 2010. Private or independently operated programs in the area include slugging, NuRide (supported by VDOT, VDRPT, and TDM agencies), and private information-sharing websites. The major TDM programs operating locally in the study area include Fairfax County Transportation Services Group, OmniMatch and TYTRAN.
VDRPT also provides regional services such as Telework!VA, the telework tax credit (administered by Department of Taxation), Try Transit Week, Amtrak Virginia, and guidance to
I-66 Tier 1 – Transportation Technical Report
2-8
state agencies on Internal Revenue Service (IRS) commuter benefit rule and state agency requirements.
Additional corridor-specific strategies recommended for implementation by 2015 and 2030 were identified and described in the I-66 Transit/TDM Study2.
2 I-66 Transit/TDM Study Final Report, Virginia Department of Rail and Public Transportation, December 2009.
3-1
3 ANALYSIS DATA
Data to support the analysis performed for this study came from a wide range of sources, including data collected specifically for the study itself. Reflecting the importance of the I-66 corridor in the region’s overall transportation network, significant data sets exist to support the analysis, with the most recent and comprehensive being the I-66 Transit/TDM Study.3 Another comprehensive report used for data analysis is the Draft SuperNoVa Transit/TDM Vision Plan.4 Both studies are particularly comprehensive sources of information related to transit, overall travel patterns and travel choices, and travel demand analysis. The full range of other data sources are described in this section, ranging from VDOT traffic count and safety data (both current and historic), travel demand data sources including socioeconomic data from the Metropolitan Washington Council of Governments (MWCOG), transit data from the Washington Metropolitan Area Transit Authority and other transit providers, as well as transportation system inventory and condition data from the sources noted above as well as local governments.
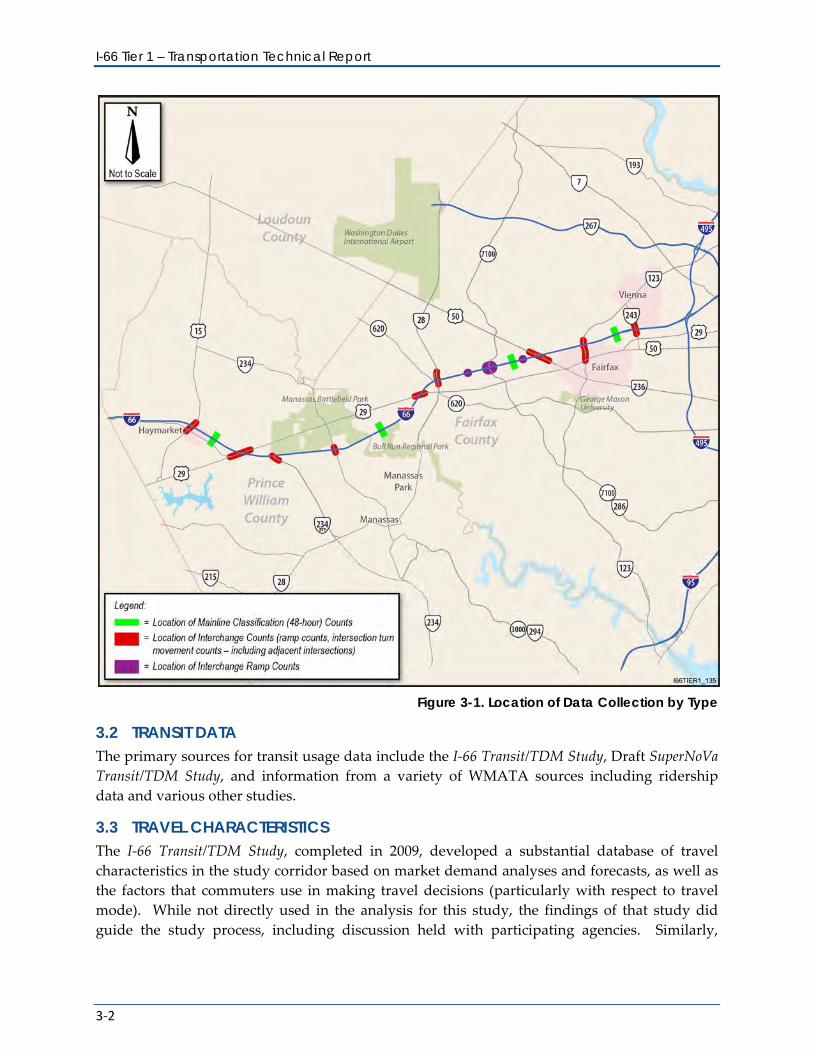
3.1 ROADWAY DATA There were two primary sources for roadway count data used in this study: 1) existing and historic data from VDOT databases including jurisdiction traffic data reports, and 2) comprehensive traffic counts performed specifically for this study. VDOT provides summaries of traffic on roadway segments across the Commonwealth by year, and this data supported checks of traffic counts and analysis of growth trends. Traffic data collected specifically for this study included intersection turn movement counts and 48-hour classification counts for both the I-66 mainline as well as interchange ramps. The locations of these counts, which were performed in September/October 2011 and April 2012, are shown in Figure 3-1. A full listing of locations and the raw data from these counts is included in Appendix A.
Roadway inventory information was gained from a combination of sources, including VDOT Microstation CAD files of existing roadway geometrics, VDOT aerial photography, and field investigation. VDOT Northern Virginia and the City of Fairfax were contacted to obtain intersection signal timing data, which would include intersection lane geometry, signal phasing, offsets with respect to adjacent signals, and treatment of left turns (permitted/protective, protected-only or split-phasing). The I-66 Transit/TDM Study also provided some supplemental information related to roadway conditions.
3 I-66 Transit/TDM Study Final Report, Virginia Department of Rail and Public Transportation, December 2009. 4 Draft SuperNoVa Transit/TDM Vision Plan, Virginia Department of Rail and Public Transportation, October 2012
I-66 Tier 1 – Transportation Technical Report
3-2
Figure 3-1. Location of Data Collection by Type
3.2 TRANSIT DATA The primary sources for transit usage data include the I-66 Transit/TDM Study, Draft SuperNoVa Transit/TDM Study, and information from a variety of WMATA sources including ridership data and various other studies.
3.3 TRAVEL CHARACTERISTICS The I-66 Transit/TDM Study, completed in 2009, developed a substantial database of travel characteristics in the study corridor based on market demand analyses and forecasts, as well as the factors that commuters use in making travel decisions (particularly with respect to travel mode). While not directly used in the analysis for this study, the findings of that study did guide the study process, including discussion held with participating agencies. Similarly,
4. Transportation Analysis: Existing Conditions
3-3
information gleaned from the ongoing SuperNova Transit/TDM Vision Plan (being prepared by the VDRPT) was used to help inform the study process.
Travel demand forecasting for the study year of 2040 was performed using the MWCOG regional travel demand forecasting model. This study used the TPB Travel Forecasting Model, Version 2.3 Build 38 (obtained from MWCOG on February 9, 2012). The 3,722 zone system Round 8.0a Cooperative Forecasts was used for the population and employment estimates. As will be described more fully in Section 6, the MWCOG modeling effort included running both a traditional No-Build scenario (reflecting only projects that are included in the region’s 2012 Financially Constrained Long‐Range Plan (CLRP), as well as a model run to estimate total person-trip travel demand for the study corridor.
3.4 SAFETY DATA Roadway safety for the I-66 study corridor was based on crash data for the years 2006 to 2010 provided by VDOT (at the time of the data request, 2011 data was not available). Detailed analysis of roadway safety is included in Section 5.

I-66 Tier 1 – Transportation Technical Report
3-4
4-1
4 TRANSPORTATION ANALYSIS: EXISTING CONDITIONS
This chapter provides a description of the transportation network within the analysis area; summarizes the roadway data collection program and existing (2011) daily and peak hour volumes; and describes existing traffic conditions within the analysis area.
4.1 EXISTING CONDITIONS – ROADWAYS
4.1.1 EXISTING CONDITIONS ROADWAY TRAFFIC VOLUMES A comprehensive data collection program for this study was performed in September/October 2011 and April 2012. The data collection program included intersection turn movement counts (24 intersections) and 48-hour classification counts (96 locations5). Counts were limited to Tuesdays, Wednesdays, and Thursdays as travel patterns on Mondays and Fridays are influenced by the weekends. Figure 3-1, presented in the previous section, illustrates the locations of the counts; a full listing of locations as well as the raw count data is provided in Appendix A.
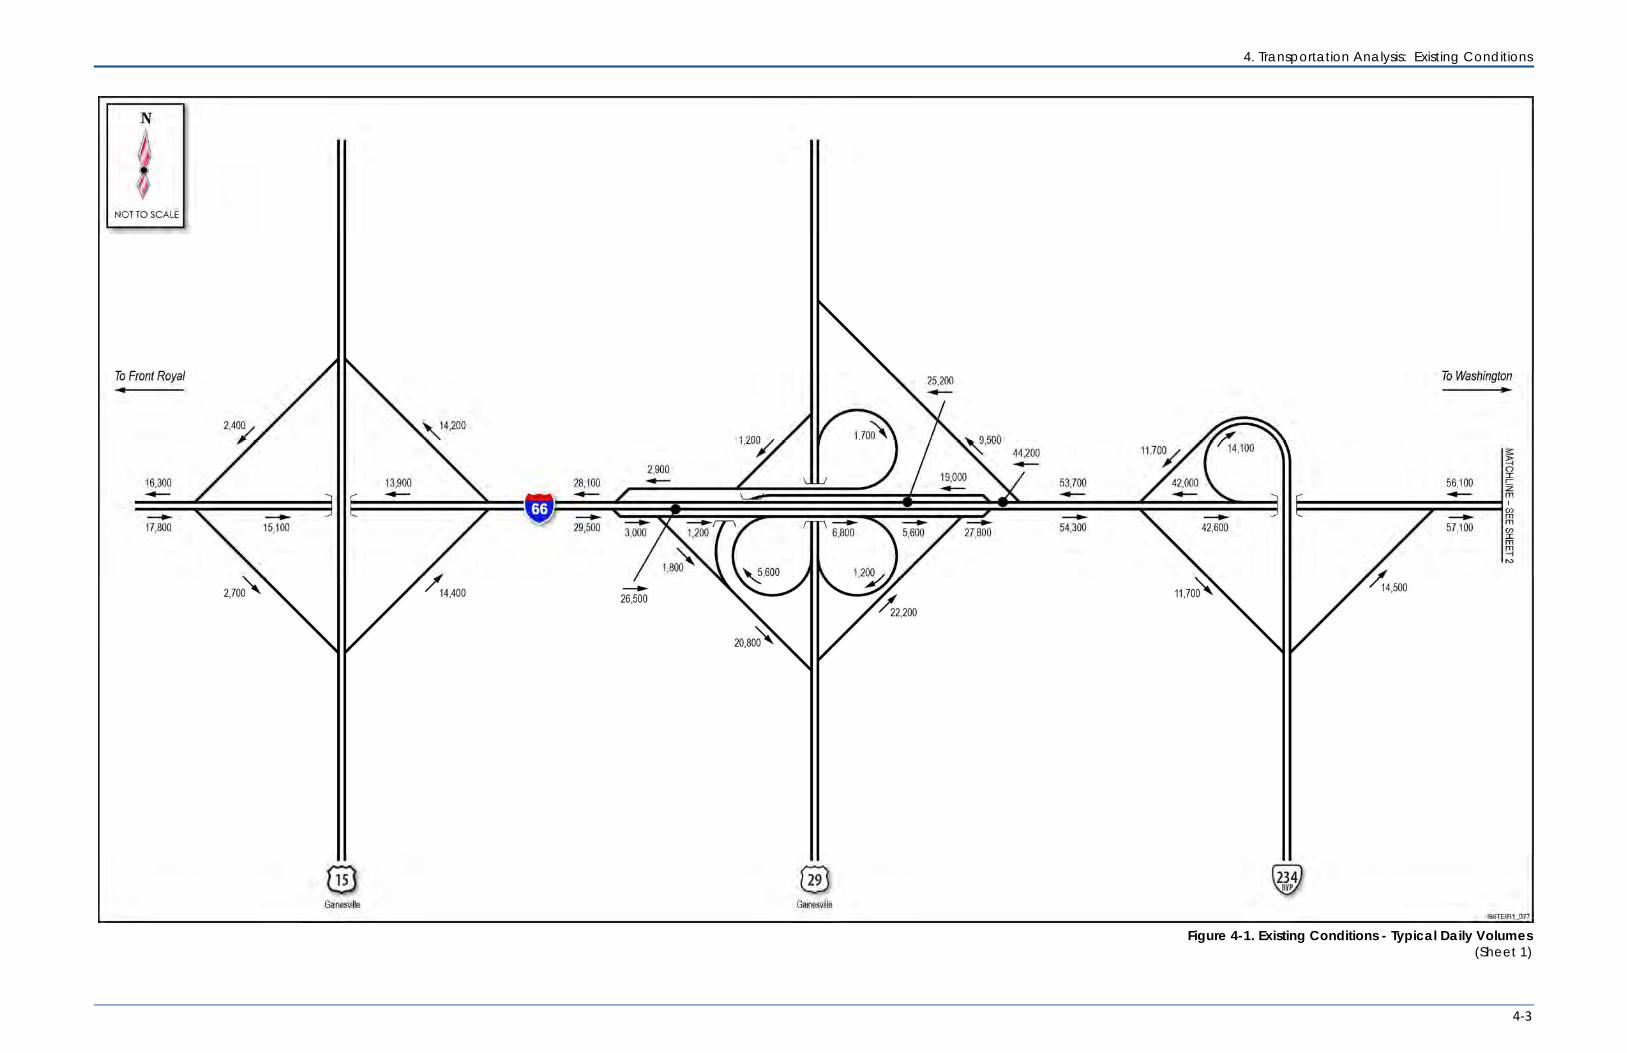
Traffic count data was processed using spreadsheets and traffic volumes were smoothed and balanced to provide a consistent corridor-wide set of analysis volumes for the AM and PM peak hours. The process to produce smoothed and balanced volumes did not adjust volumes at the four mainline segments in each direction that were counted; ramp volumes were adjusted to match these counts and to match the traffic counts from the ramp termini intersections. To ensure consistency, a set of guidelines for balancing the traffic volumes across the network were applied for daily traffic and for both the AM and PM peak hour estimates (these guidelines are included in Appendix B).
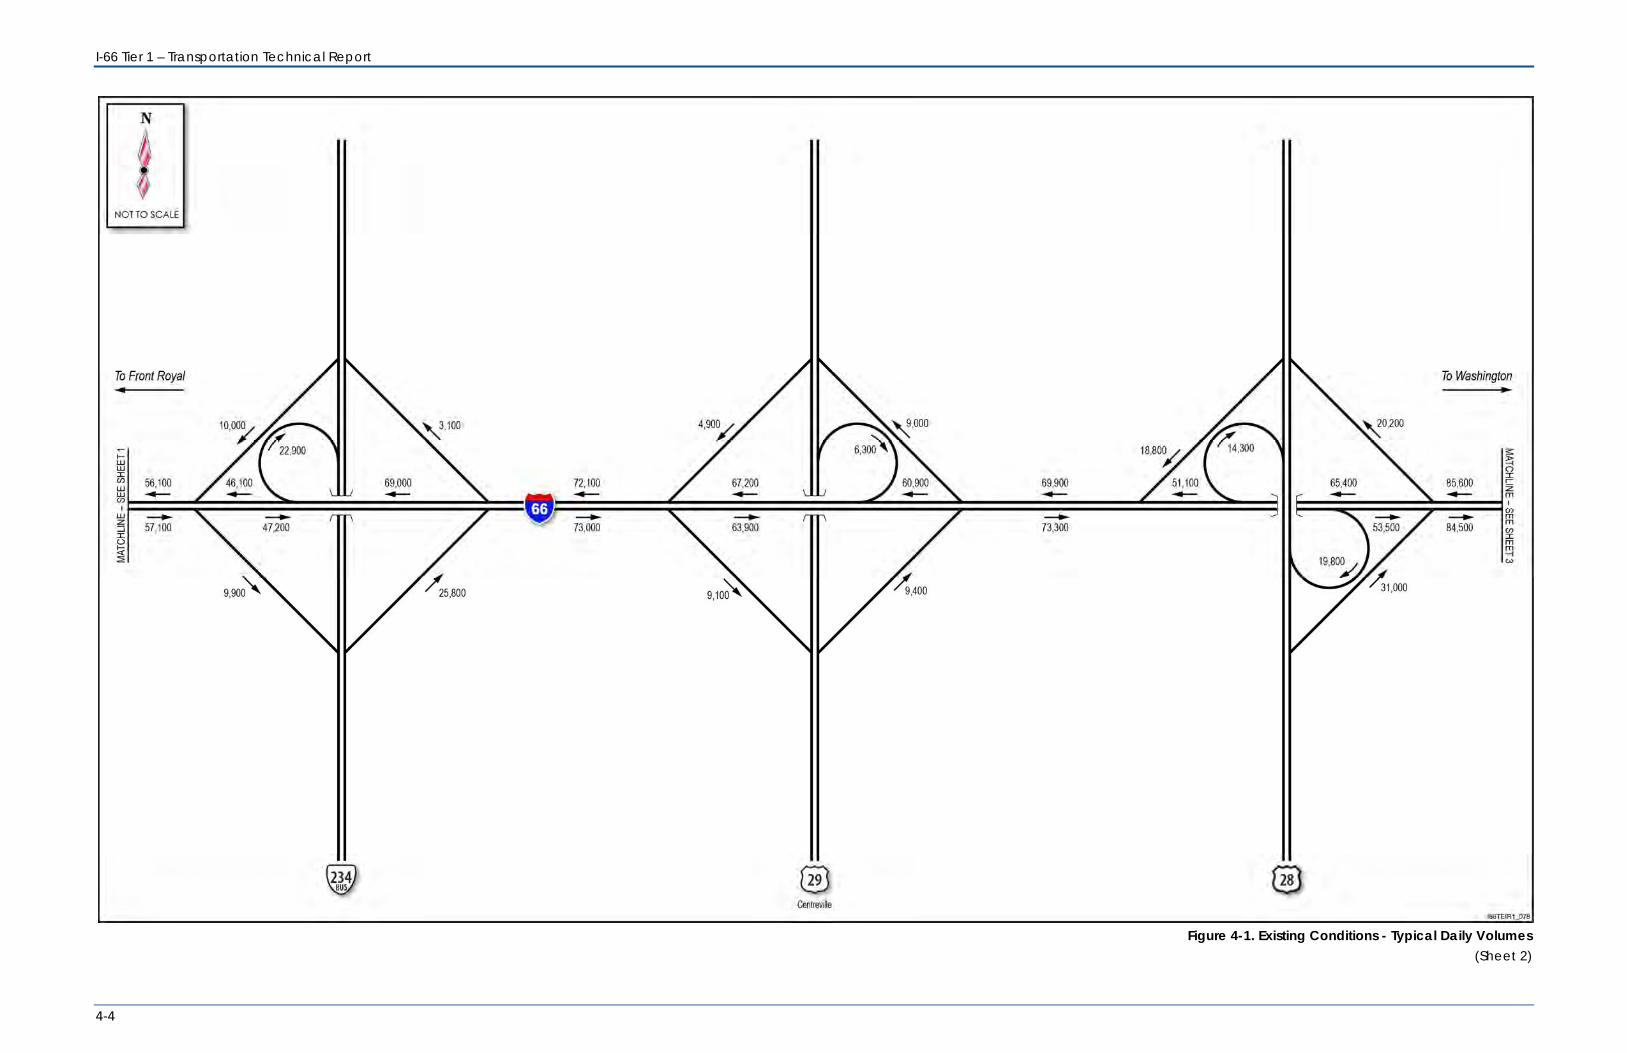
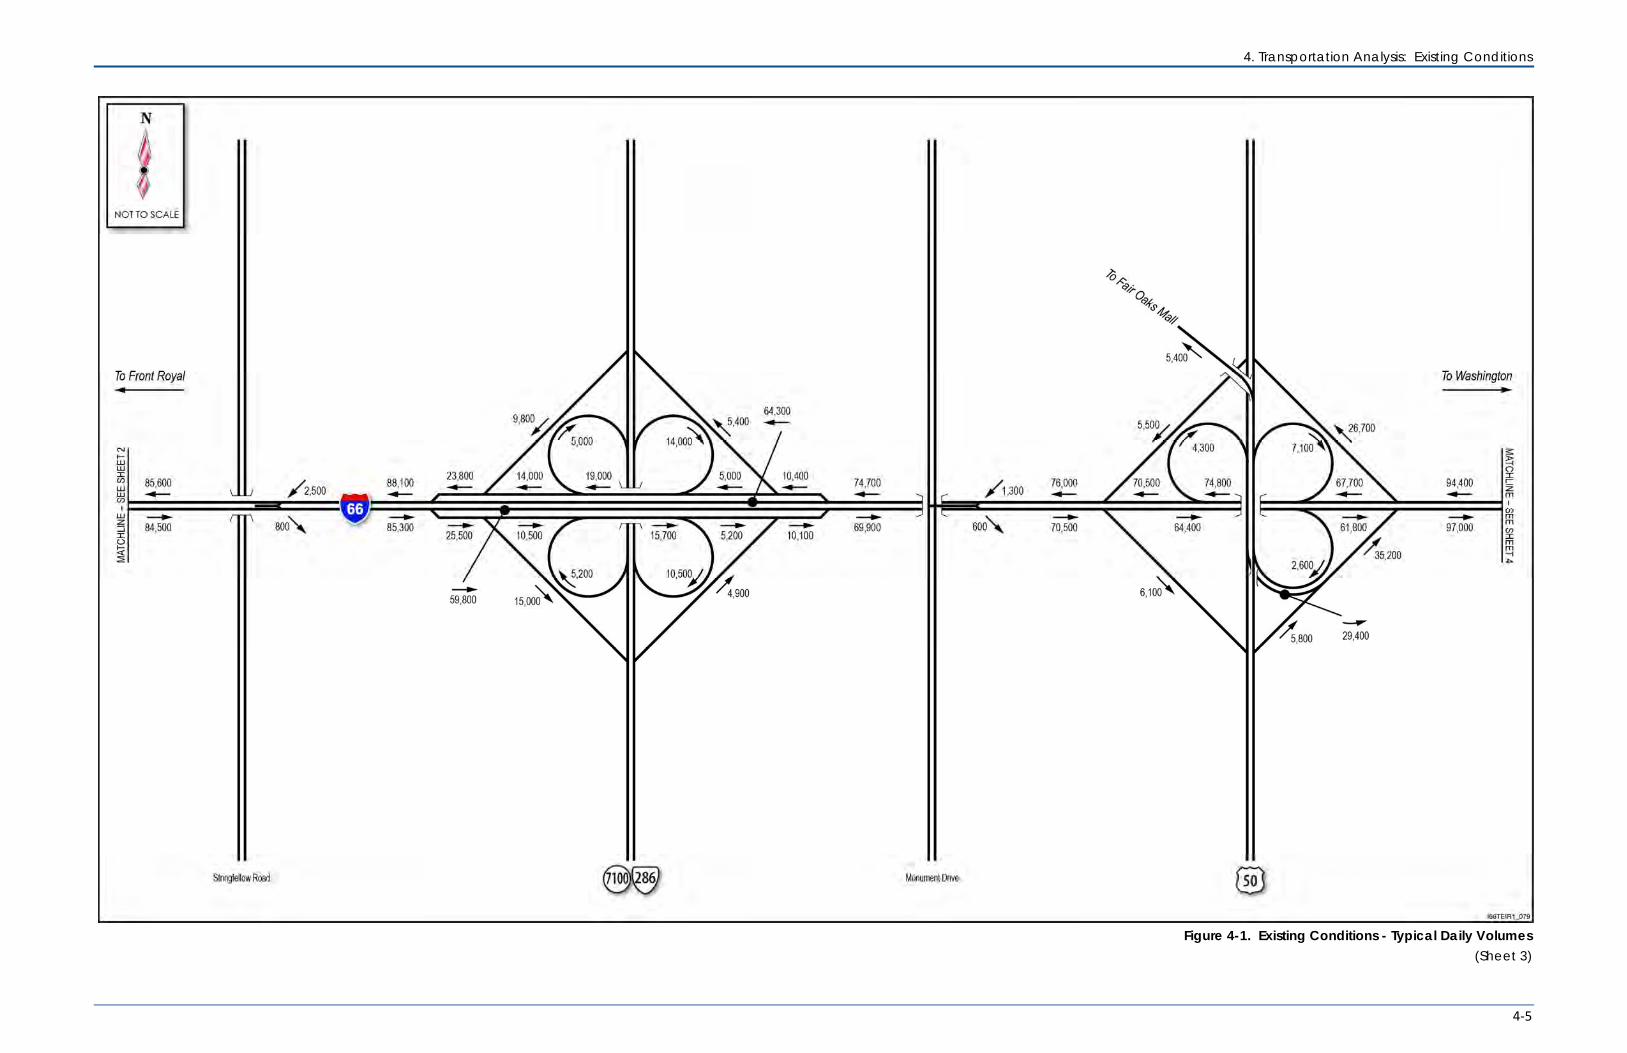
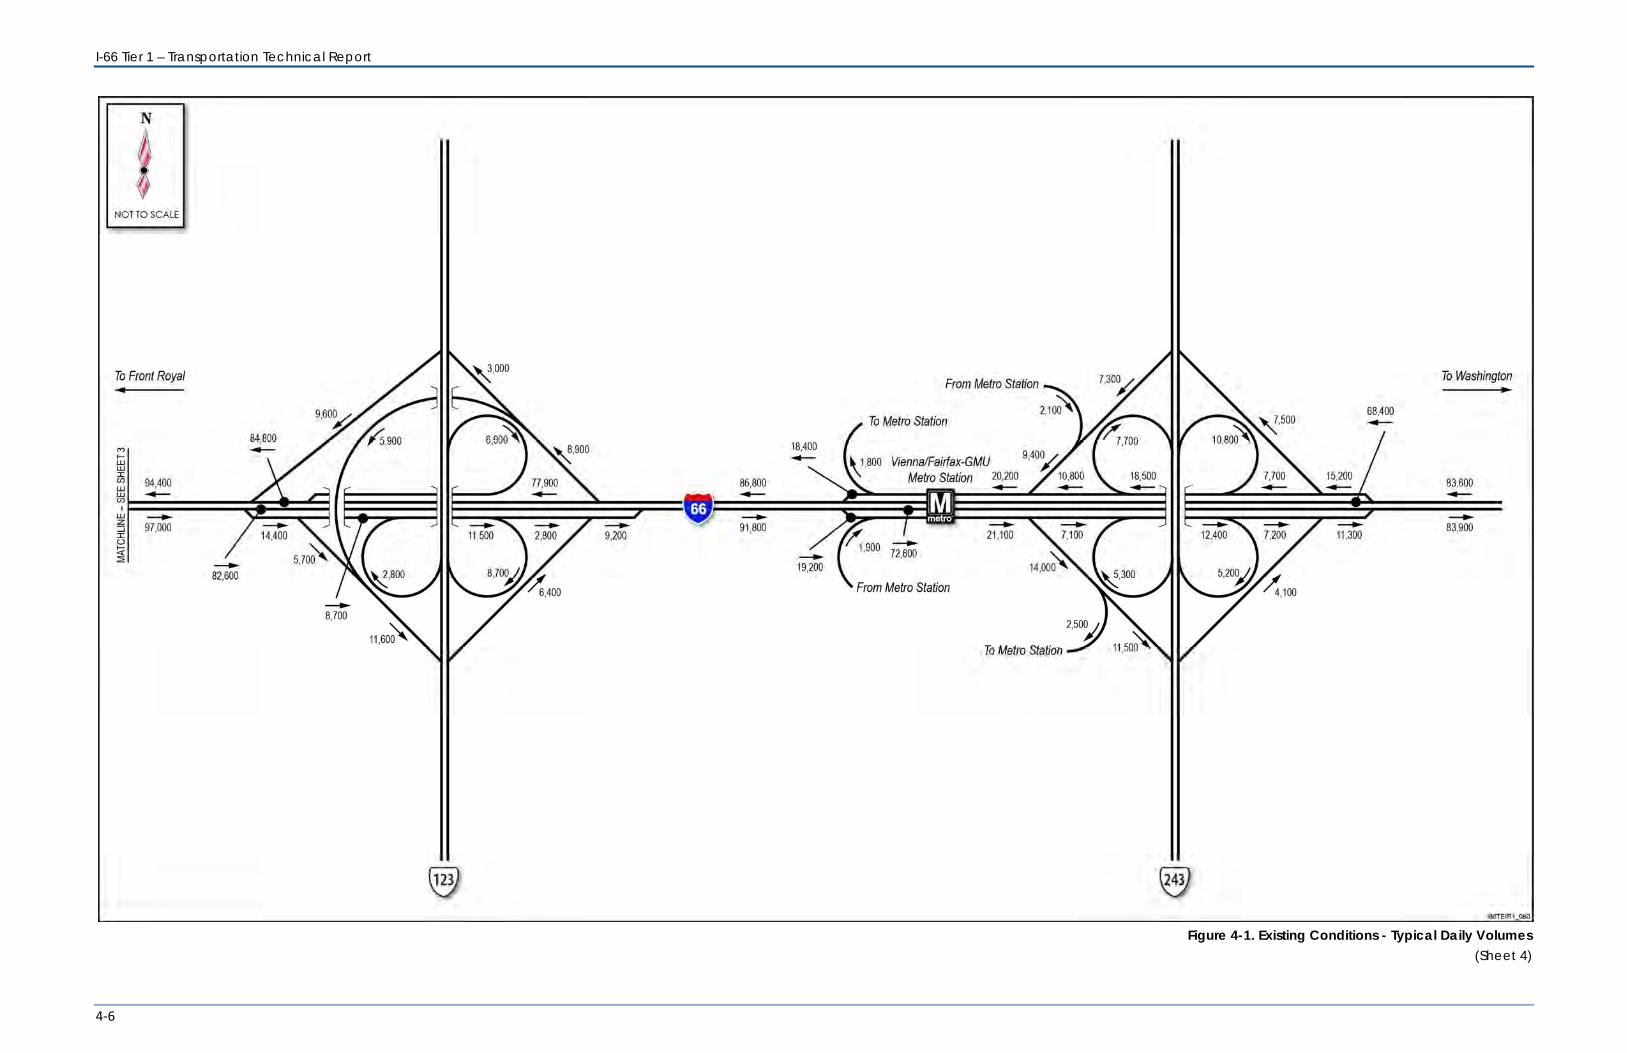
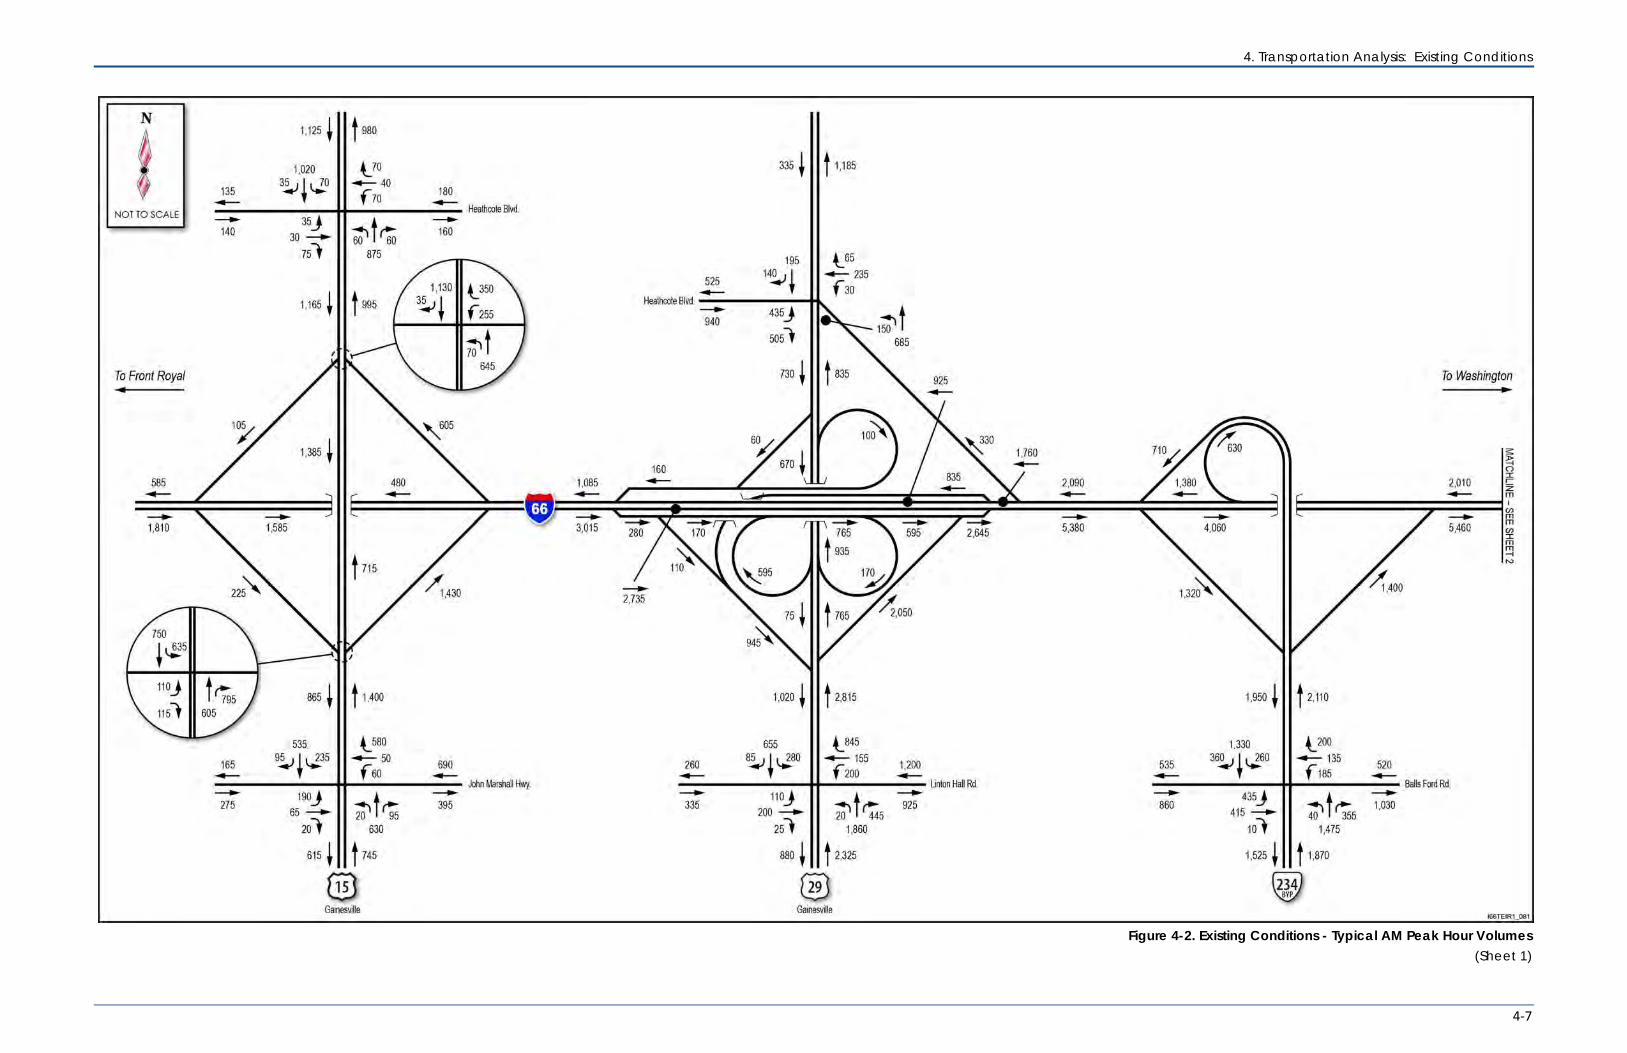
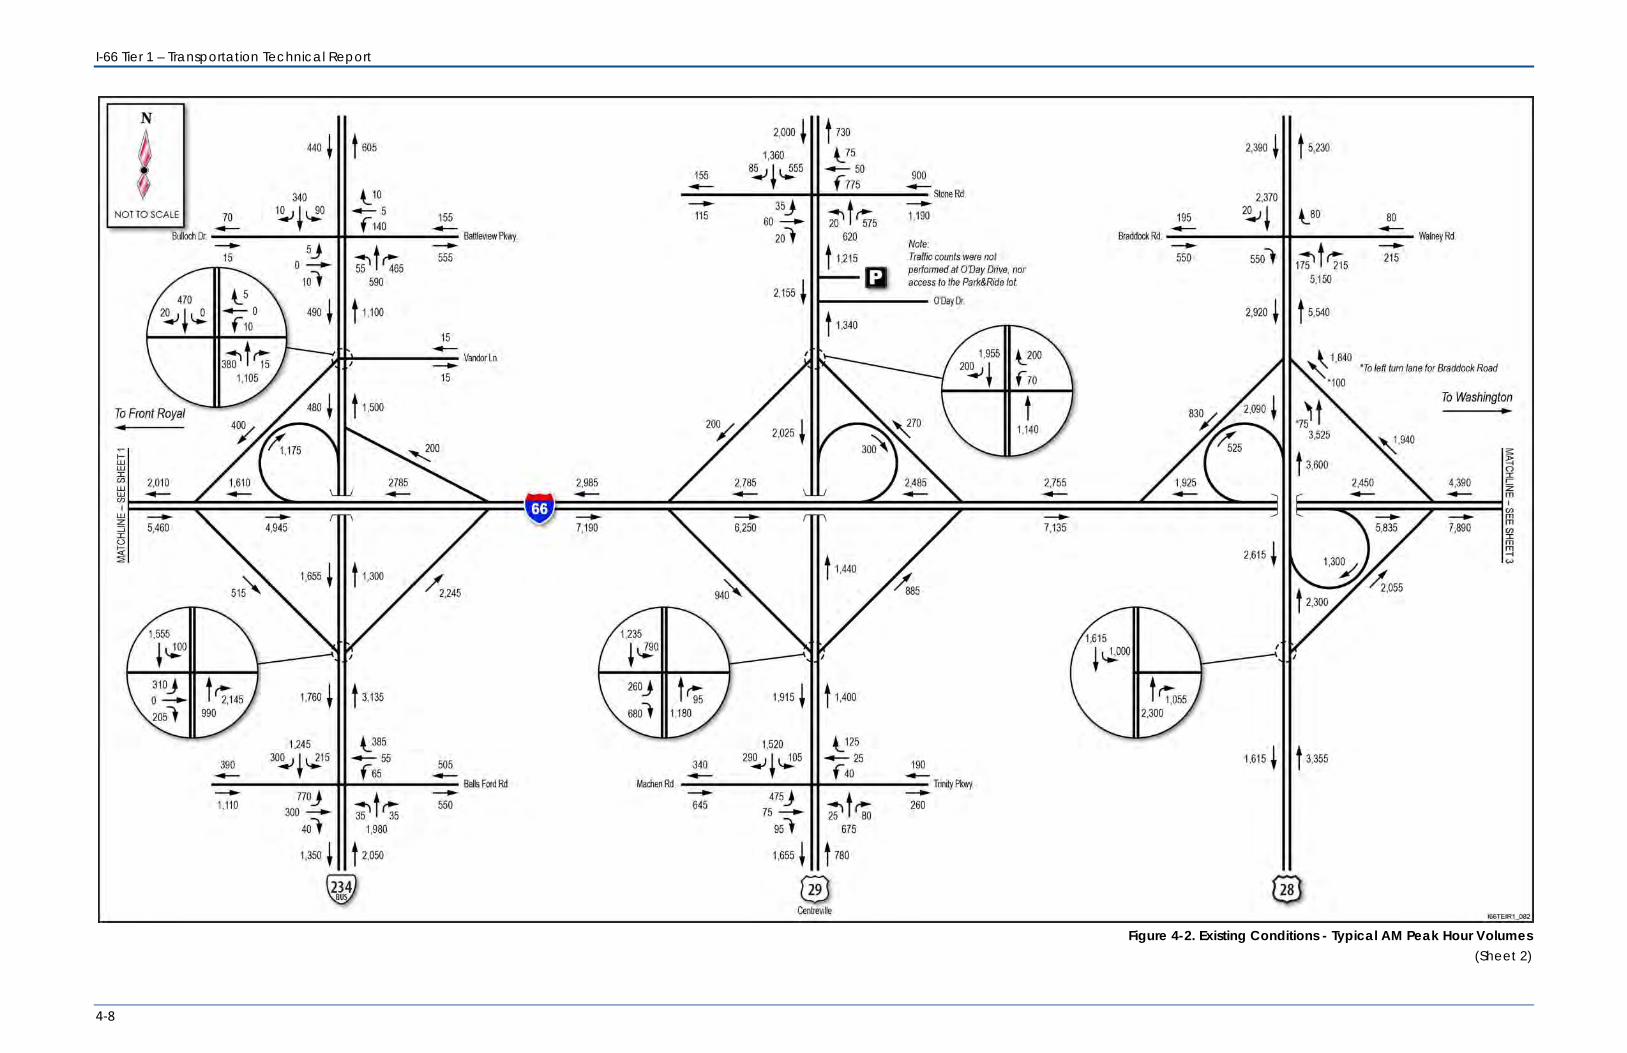
The resulting typical daily traffic volumes are presented in Figure 4-1. The typical AM peak hour volumes are presented in Figure 4-2; while the typical PM peak hour volumes are presented in Figure 4-3.
4.1.2 FREEWAY OPERATIONS Freeway operations were assessed for basic freeway segments, ramp merges and diverges, weaves, and collector-distributor (CD) roads. Highway Capacity Software 2010 (HCS) was used throughout for the analysis, except for the CD roads as Highway Capacity Manual (HCM) is limited in the minimum number of lanes that can be assessed. A detailed summary of the HCS analysis and the HCS outputs can be found in Appendix C.
5 Note that eastbound and westbound directions of I-66 are counted separately.
I-66 Tier 1 – Transportation Technical Report
4-2
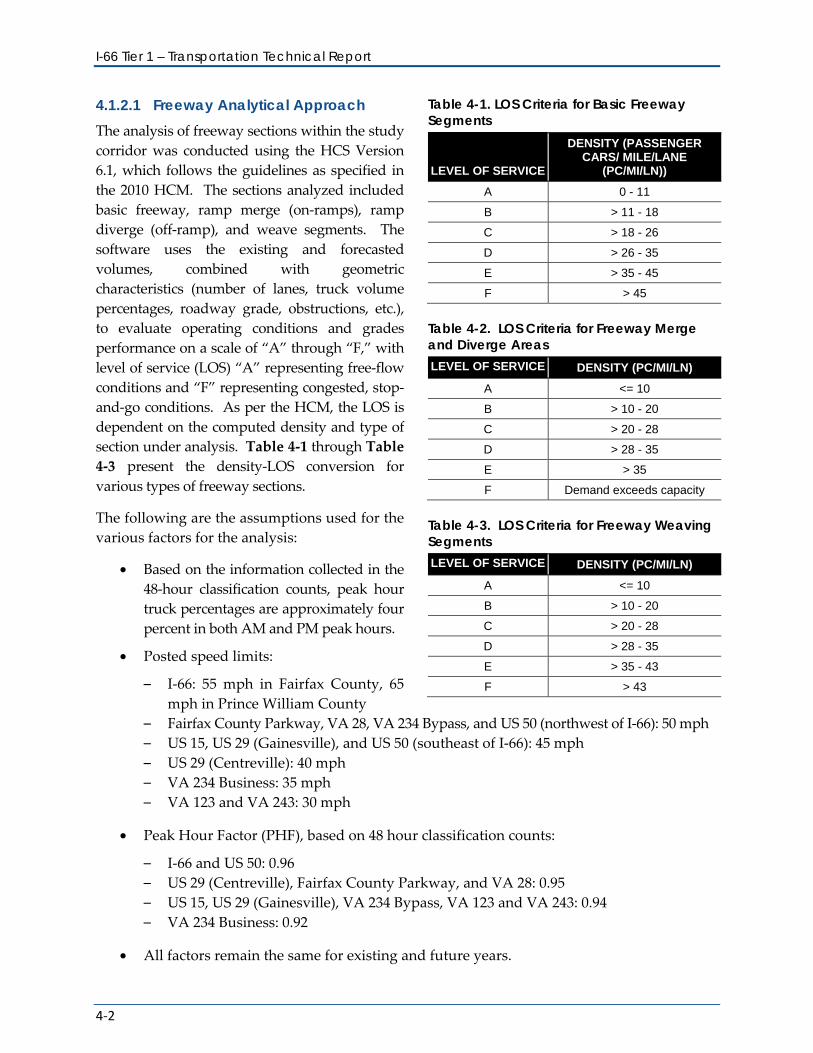
4.1.2.1 Freeway Analytical Approach The analysis of freeway sections within the study corridor was conducted using the HCS Version 6.1, which follows the guidelines as specified in the 2010 HCM. The sections analyzed included basic freeway, ramp merge (on-ramps), ramp diverge (off-ramp), and weave segments. The software uses the existing and forecasted volumes, combined with geometric characteristics (number of lanes, truck volume percentages, roadway grade, obstructions, etc.), to evaluate operating conditions and grades performance on a scale of “A” through “F,” with level of service (LOS) “A” representing free-flow conditions and “F” representing congested, stop-and-go conditions. As per the HCM, the LOS is dependent on the computed density and type of section under analysis. Table 4-1 through Table 4-3 present the density-LOS conversion for various types of freeway sections.
The following are the assumptions used for the various factors for the analysis:
• Based on the information collected in the 48-hour classification counts, peak hour truck percentages are approximately four percent in both AM and PM peak hours.
• Posted speed limits:
– I-66: 55 mph in Fairfax County, 65 mph in Prince William County
– Fairfax County Parkway, VA 28, VA 234 Bypass, and US 50 (northwest of I-66): 50 mph – US 15, US 29 (Gainesville), and US 50 (southeast of I-66): 45 mph – US 29 (Centreville): 40 mph – VA 234 Business: 35 mph – VA 123 and VA 243: 30 mph
• Peak Hour Factor (PHF), based on 48 hour classification counts:
– I-66 and US 50: 0.96 – US 29 (Centreville), Fairfax County Parkway, and VA 28: 0.95 – US 15, US 29 (Gainesville), VA 234 Bypass, VA 123 and VA 243: 0.94 – VA 234 Business: 0.92
• All factors remain the same for existing and future years.
Table 4-1. LOS Criteria for Basic Freeway Segments
LEVEL OF SERVICE
DENSITY (PASSENGER CARS/ MILE/LANE
(PC/MI/LN))
A 0 - 11
B > 11 - 18
C > 18 - 26
D > 26 - 35
E > 35 - 45
F > 45
Table 4-2. LOS Criteria for Freeway Merge and Diverge Areas LEVEL OF SERVICE DENSITY (PC/MI/LN)
A <= 10
B > 10 - 20
C > 20 - 28
D > 28 - 35
E > 35
F Demand exceeds capacity
Table 4-3. LOS Criteria for Freeway Weaving Segments LEVEL OF SERVICE DENSITY (PC/MI/LN)
A <= 10
B > 10 - 20
C > 20 - 28
D > 28 - 35
E > 35 - 43
F > 43
4. Transportation Analysis: Existing Conditions
4-3
Figure 4-1. Existing Conditions - Typical Daily Volumes
(Sheet 1)
I-66 Tier 1 – Transportation Technical Report
4-4
Figure 4-1. Existing Conditions - Typical Daily Volumes
(Sheet 2)
4. Transportation Analysis: Existing Conditions
4-5
Figure 4-1. Existing Conditions - Typical Daily Volumes
(Sheet 3)
I-66 Tier 1 – Transportation Technical Report
4-6
Figure 4-1. Existing Conditions - Typical Daily Volumes
(Sheet 4)
4. Transportation Analysis: Existing Conditions
4-7
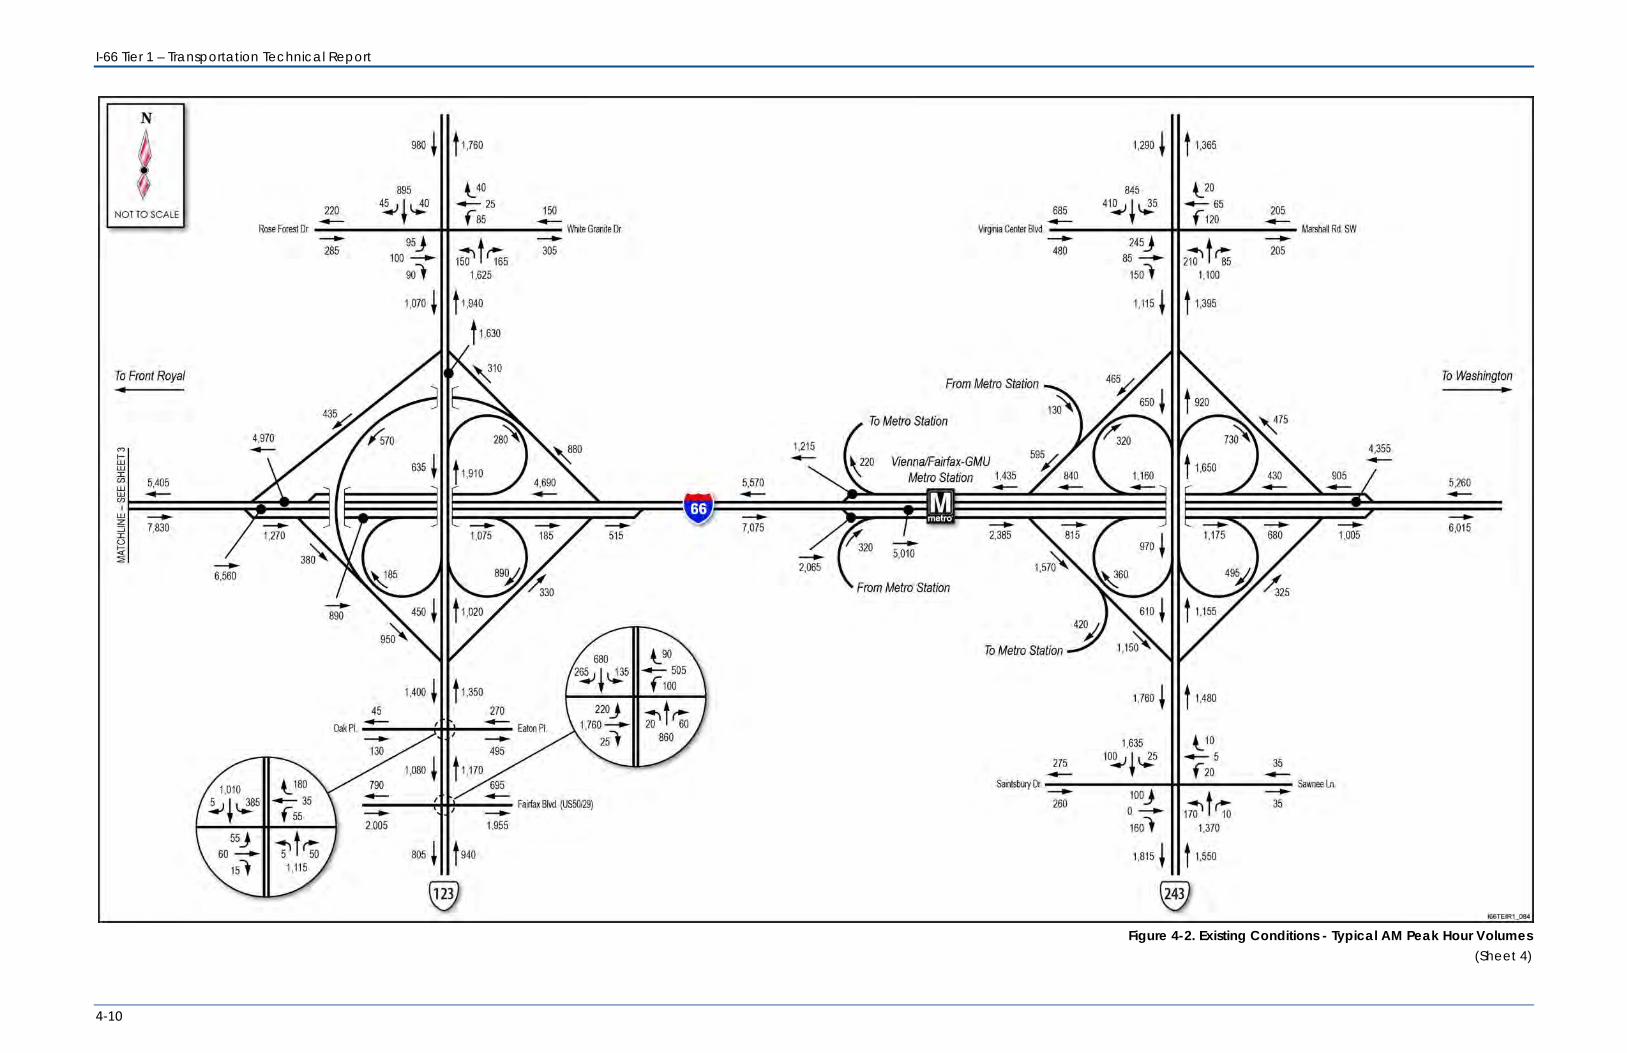
Figure 4-2. Existing Conditions - Typical AM Peak Hour Volumes
(Sheet 1)
I-66 Tier 1 – Transportation Technical Report
4-8
Figure 4-2. Existing Conditions - Typical AM Peak Hour Volumes
(Sheet 2)

4. Transportation Analysis: Existing Conditions
4-9
Figure 4-2. Existing Conditions - Typical AM Peak Hour Volumes
(Sheet 3)
I-66 Tier 1 – Transportation Technical Report
4-10
Figure 4-2. Existing Conditions - Typical AM Peak Hour Volumes
(Sheet 4)

4. Transportation Analysis: Existing Conditions
4-11
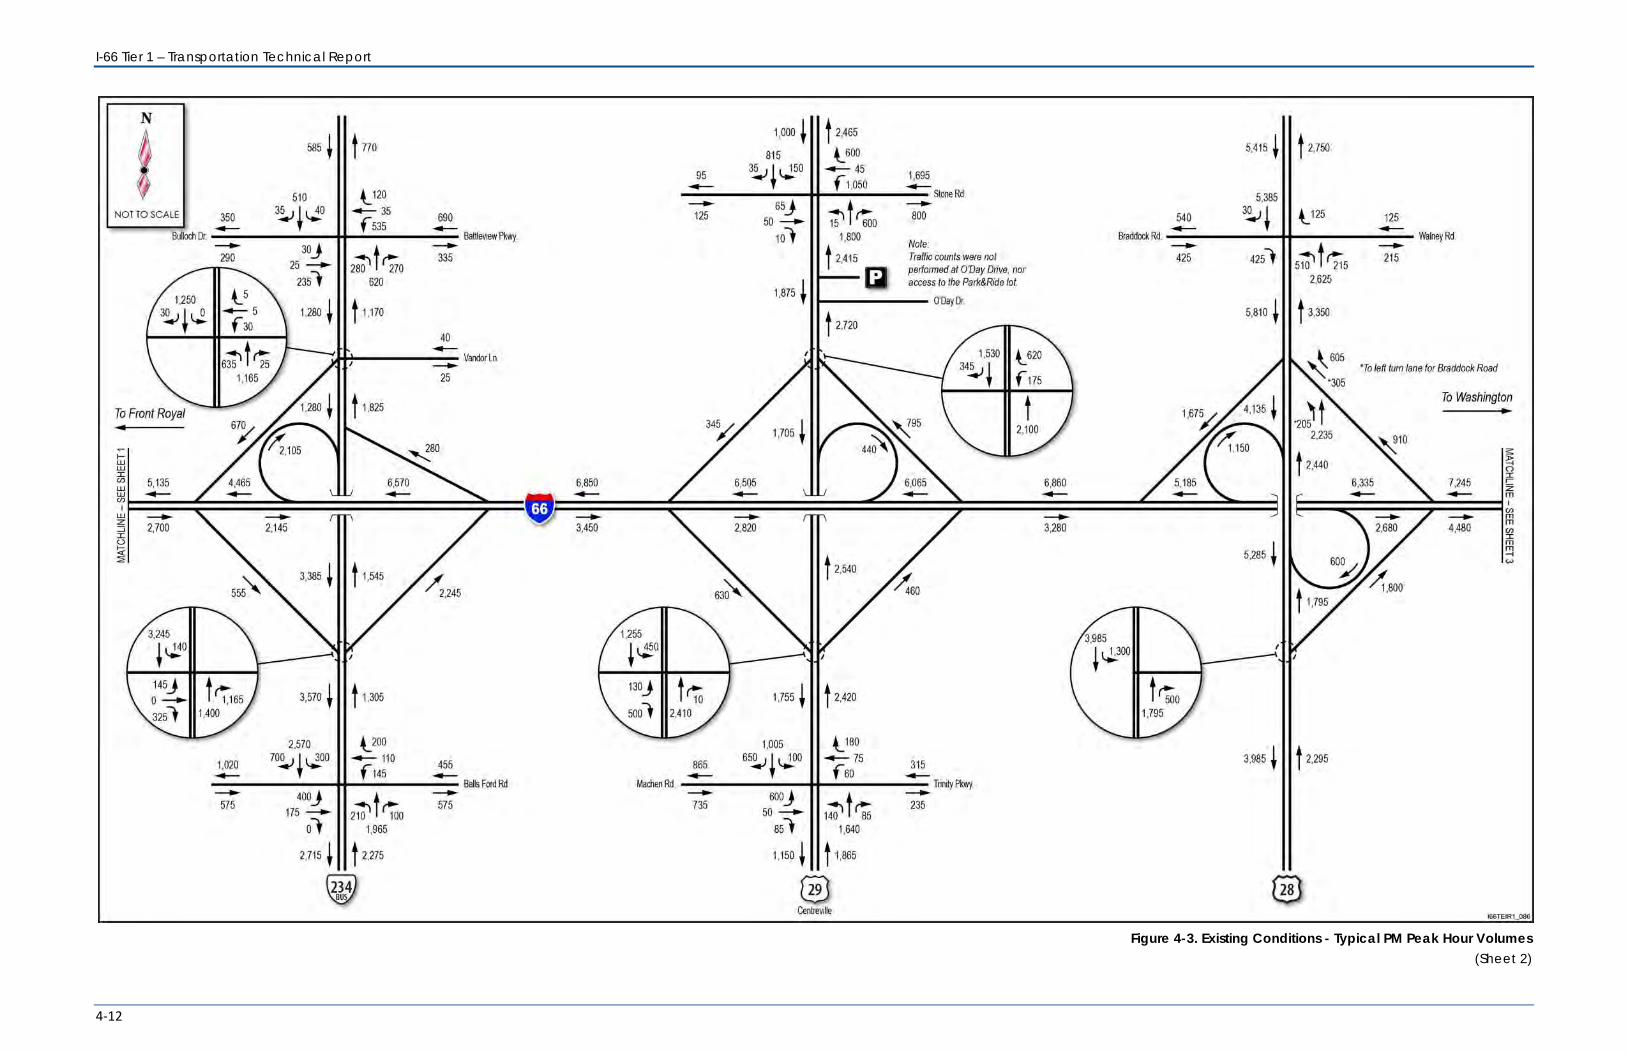
Figure 4-3. Existing Conditions - Typical PM Peak Hour Volumes
(Sheet 1)
I-66 Tier 1 – Transportation Technical Report
4-12
Figure 4-3. Existing Conditions - Typical PM Peak Hour Volumes
(Sheet 2)
4. Transportation Analysis: Existing Conditions
4-13
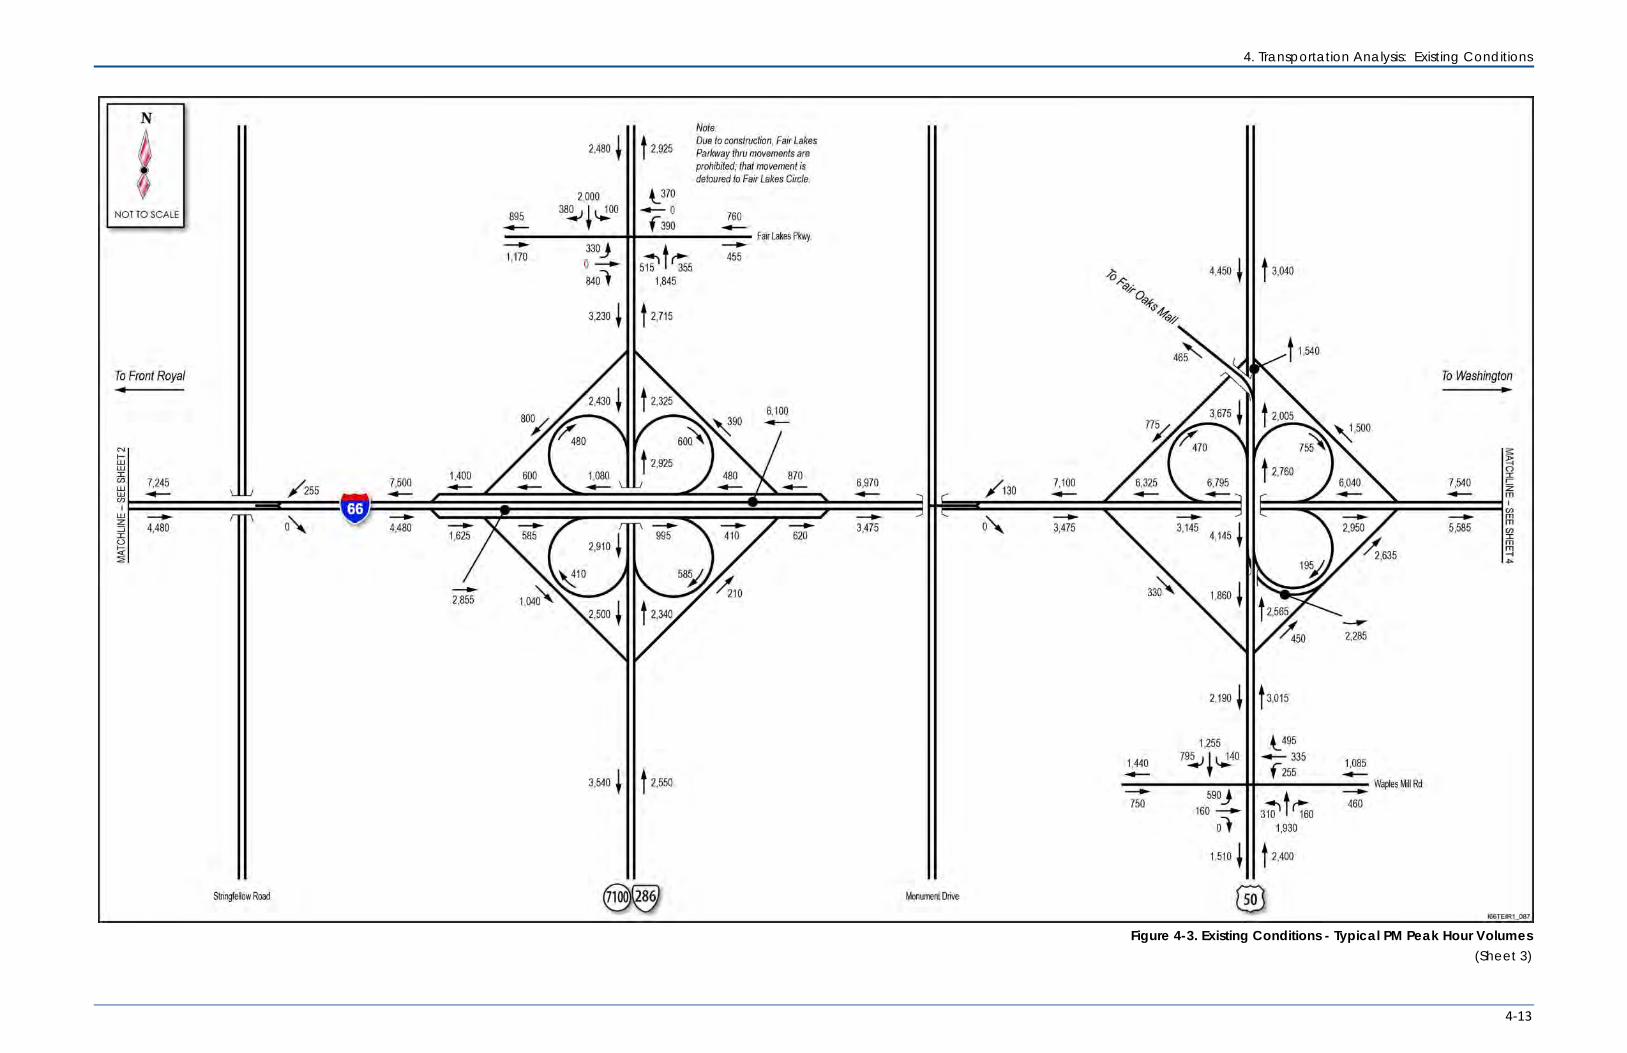
Figure 4-3. Existing Conditions - Typical PM Peak Hour Volumes
(Sheet 3)

I-66 Tier 1 – Transportation Technical Report
4-14
Figure 4-3. Existing Conditions - Typical PM Peak Hour Volumes
(Sheet 4)
4. Transportation Analysis: Existing Conditions
4-15
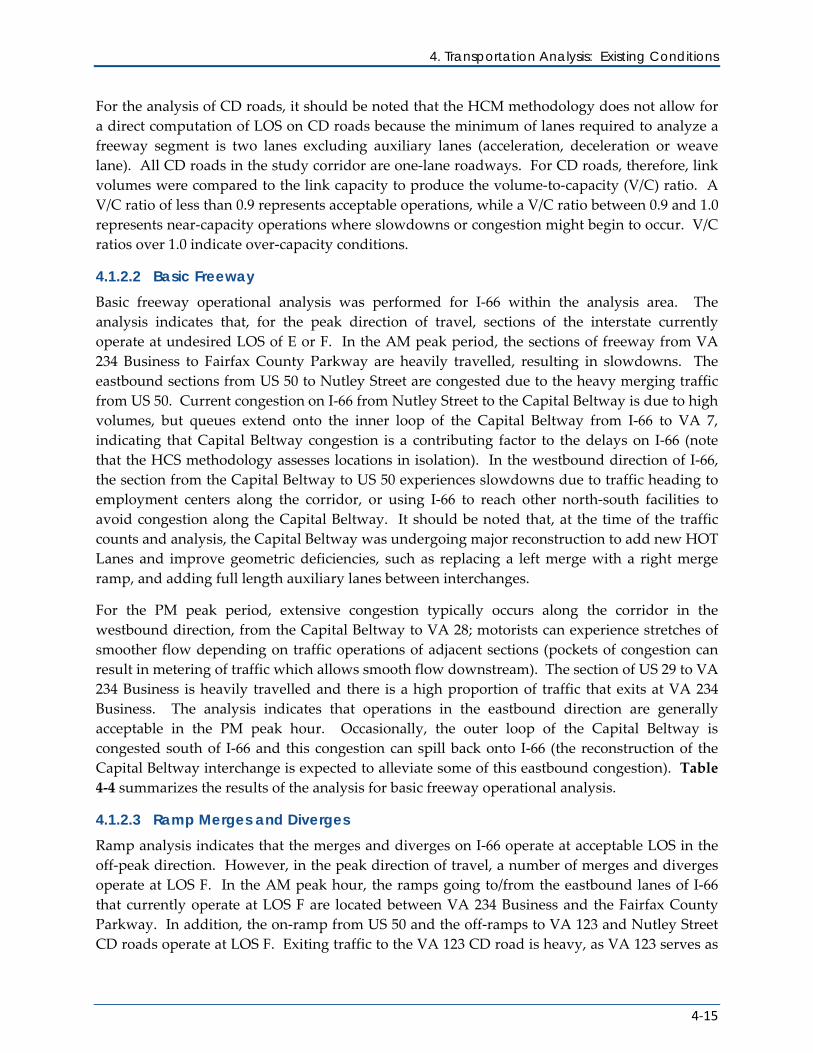
For the analysis of CD roads, it should be noted that the HCM methodology does not allow for a direct computation of LOS on CD roads because the minimum of lanes required to analyze a freeway segment is two lanes excluding auxiliary lanes (acceleration, deceleration or weave lane). All CD roads in the study corridor are one-lane roadways. For CD roads, therefore, link volumes were compared to the link capacity to produce the volume-to-capacity (V/C) ratio. A V/C ratio of less than 0.9 represents acceptable operations, while a V/C ratio between 0.9 and 1.0 represents near-capacity operations where slowdowns or congestion might begin to occur. V/C ratios over 1.0 indicate over-capacity conditions.
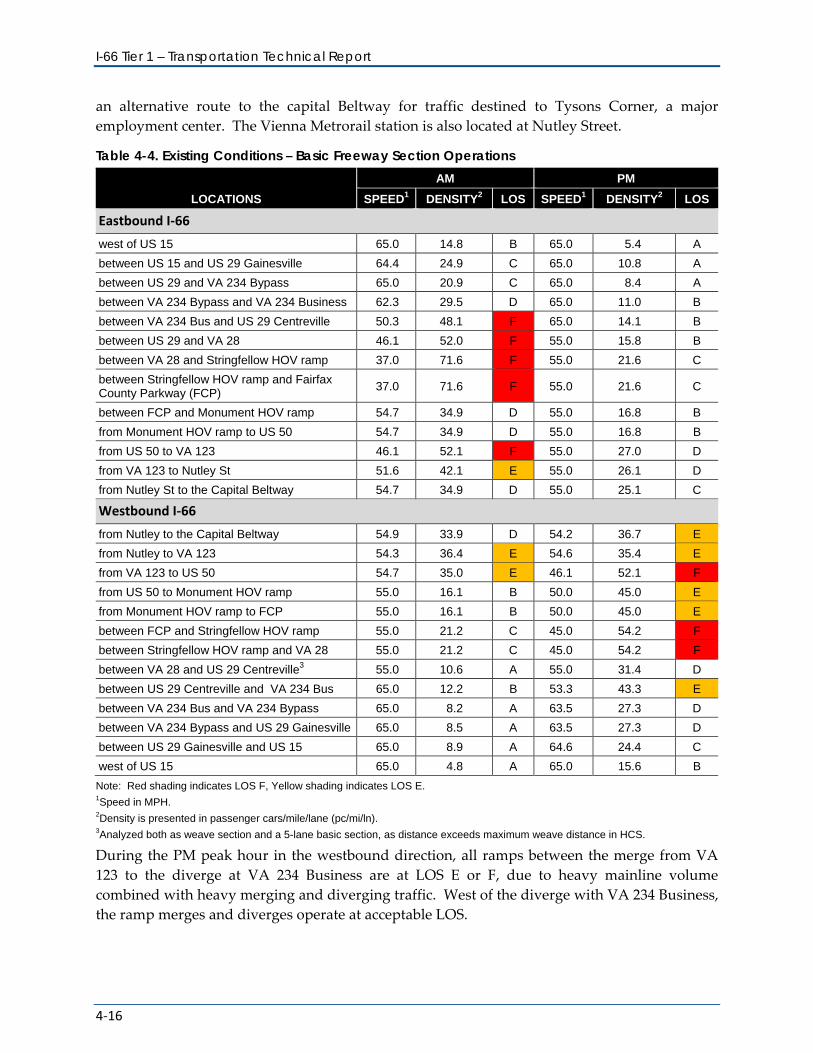
4.1.2.2 Basic Freeway Basic freeway operational analysis was performed for I-66 within the analysis area. The analysis indicates that, for the peak direction of travel, sections of the interstate currently operate at undesired LOS of E or F. In the AM peak period, the sections of freeway from VA 234 Business to Fairfax County Parkway are heavily travelled, resulting in slowdowns. The eastbound sections from US 50 to Nutley Street are congested due to the heavy merging traffic from US 50. Current congestion on I-66 from Nutley Street to the Capital Beltway is due to high volumes, but queues extend onto the inner loop of the Capital Beltway from I-66 to VA 7, indicating that Capital Beltway congestion is a contributing factor to the delays on I-66 (note that the HCS methodology assesses locations in isolation). In the westbound direction of I-66, the section from the Capital Beltway to US 50 experiences slowdowns due to traffic heading to employment centers along the corridor, or using I-66 to reach other north-south facilities to avoid congestion along the Capital Beltway. It should be noted that, at the time of the traffic counts and analysis, the Capital Beltway was undergoing major reconstruction to add new HOT Lanes and improve geometric deficiencies, such as replacing a left merge with a right merge ramp, and adding full length auxiliary lanes between interchanges.
For the PM peak period, extensive congestion typically occurs along the corridor in the westbound direction, from the Capital Beltway to VA 28; motorists can experience stretches of smoother flow depending on traffic operations of adjacent sections (pockets of congestion can result in metering of traffic which allows smooth flow downstream). The section of US 29 to VA 234 Business is heavily travelled and there is a high proportion of traffic that exits at VA 234 Business. The analysis indicates that operations in the eastbound direction are generally acceptable in the PM peak hour. Occasionally, the outer loop of the Capital Beltway is congested south of I-66 and this congestion can spill back onto I-66 (the reconstruction of the Capital Beltway interchange is expected to alleviate some of this eastbound congestion). Table 4-4 summarizes the results of the analysis for basic freeway operational analysis.
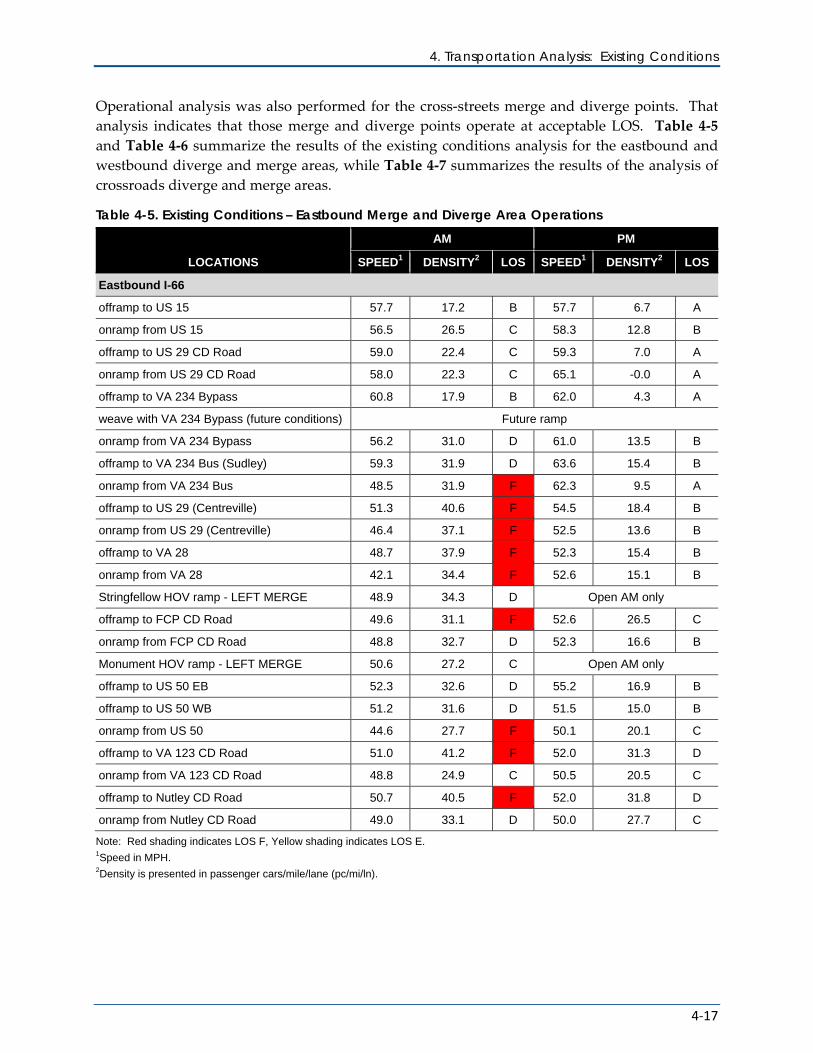
4.1.2.3 Ramp Merges and Diverges Ramp analysis indicates that the merges and diverges on I-66 operate at acceptable LOS in the off-peak direction. However, in the peak direction of travel, a number of merges and diverges operate at LOS F. In the AM peak hour, the ramps going to/from the eastbound lanes of I-66 that currently operate at LOS F are located between VA 234 Business and the Fairfax County Parkway. In addition, the on-ramp from US 50 and the off-ramps to VA 123 and Nutley Street CD roads operate at LOS F. Exiting traffic to the VA 123 CD road is heavy, as VA 123 serves as
I-66 Tier 1 – Transportation Technical Report
4-16
an alternative route to the capital Beltway for traffic destined to Tysons Corner, a major employment center. The Vienna Metrorail station is also located at Nutley Street.
Table 4-4. Existing Conditions – Basic Freeway Section Operations
LOCATIONS
AM PM
SPEED1 DENSITY2 LOS SPEED1 DENSITY2 LOS
Eastbound I-66
west of US 15 65.0 14.8 B 65.0 5.4 A
between US 15 and US 29 Gainesville 64.4 24.9 C 65.0 10.8 A
between US 29 and VA 234 Bypass 65.0 20.9 C 65.0 8.4 A
between VA 234 Bypass and VA 234 Business 62.3 29.5 D 65.0 11.0 B
between VA 234 Bus and US 29 Centreville 50.3 48.1 F 65.0 14.1 B
between US 29 and VA 28 46.1 52.0 F 55.0 15.8 B
between VA 28 and Stringfellow HOV ramp 37.0 71.6 F 55.0 21.6 C
between Stringfellow HOV ramp and Fairfax County Parkway (FCP)
37.0 71.6 F 55.0 21.6 C
between FCP and Monument HOV ramp 54.7 34.9 D 55.0 16.8 B
from Monument HOV ramp to US 50 54.7 34.9 D 55.0 16.8 B
from US 50 to VA 123 46.1 52.1 F 55.0 27.0 D
from VA 123 to Nutley St 51.6 42.1 E 55.0 26.1 D
from Nutley St to the Capital Beltway 54.7 34.9 D 55.0 25.1 C
Westbound I-66
from Nutley to the Capital Beltway 54.9 33.9 D 54.2 36.7 E
from Nutley to VA 123 54.3 36.4 E 54.6 35.4 E
from VA 123 to US 50 54.7 35.0 E 46.1 52.1 F
from US 50 to Monument HOV ramp 55.0 16.1 B 50.0 45.0 E
from Monument HOV ramp to FCP 55.0 16.1 B 50.0 45.0 E
between FCP and Stringfellow HOV ramp 55.0 21.2 C 45.0 54.2 F
between Stringfellow HOV ramp and VA 28 55.0 21.2 C 45.0 54.2 F
between VA 28 and US 29 Centreville3 55.0 10.6 A 55.0 31.4 D
between US 29 Centreville and VA 234 Bus 65.0 12.2 B 53.3 43.3 E
between VA 234 Bus and VA 234 Bypass 65.0 8.2 A 63.5 27.3 D
between VA 234 Bypass and US 29 Gainesville 65.0 8.5 A 63.5 27.3 D
between US 29 Gainesville and US 15 65.0 8.9 A 64.6 24.4 C
west of US 15 65.0 4.8 A 65.0 15.6 B
Note: Red shading indicates LOS F, Yellow shading indicates LOS E. 1Speed in MPH. 2Density is presented in passenger cars/mile/lane (pc/mi/ln). 3Analyzed both as weave section and a 5-lane basic section, as distance exceeds maximum weave distance in HCS.
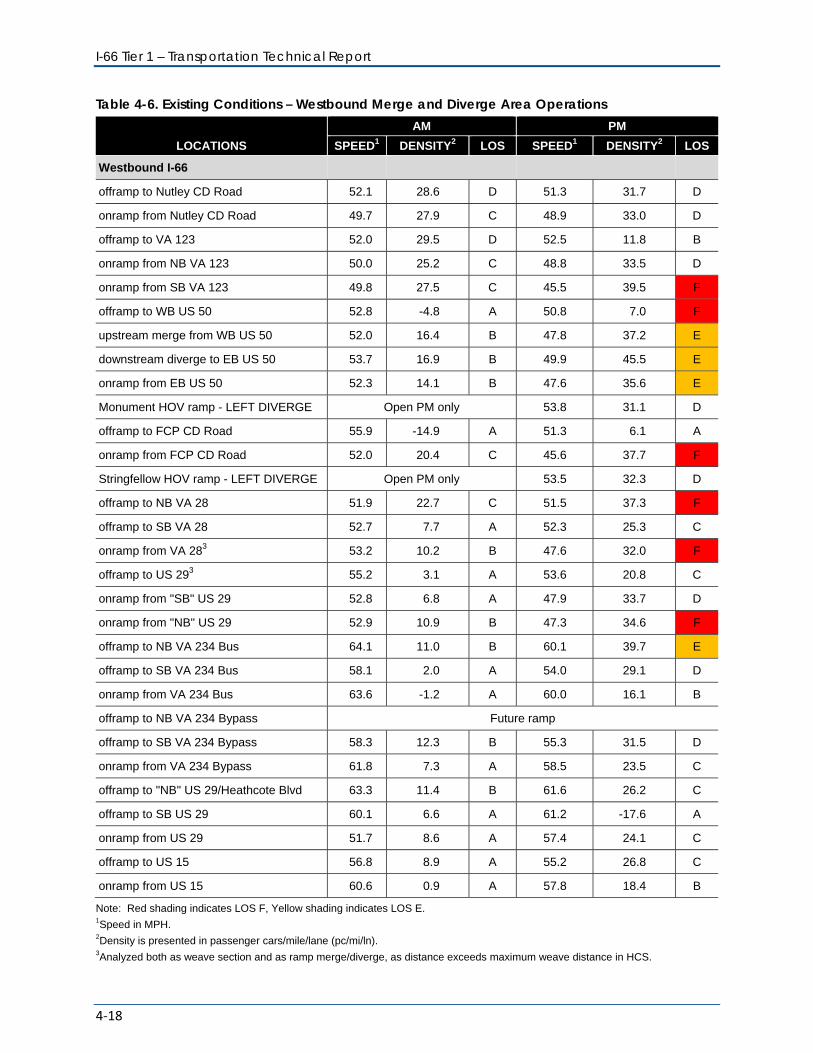
During the PM peak hour in the westbound direction, all ramps between the merge from VA 123 to the diverge at VA 234 Business are at LOS E or F, due to heavy mainline volume combined with heavy merging and diverging traffic. West of the diverge with VA 234 Business, the ramp merges and diverges operate at acceptable LOS.
4. Transportation Analysis: Existing Conditions
4-17
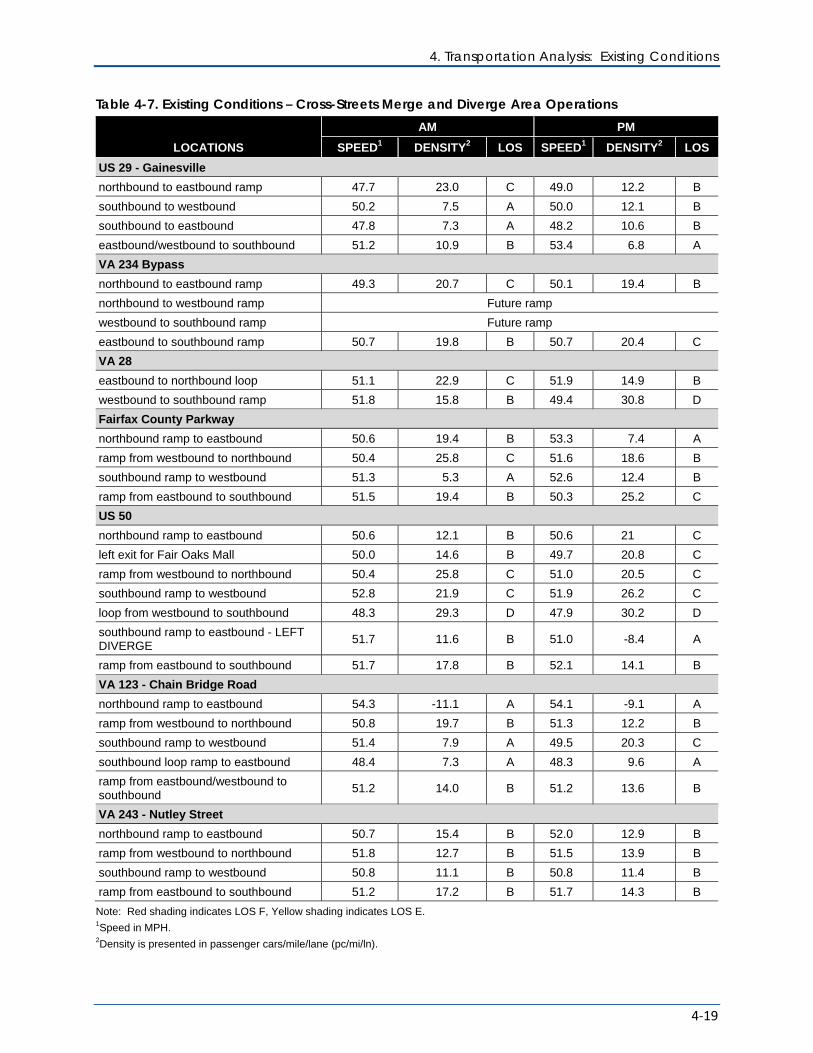
Operational analysis was also performed for the cross-streets merge and diverge points. That analysis indicates that those merge and diverge points operate at acceptable LOS. Table 4-5 and Table 4-6 summarize the results of the existing conditions analysis for the eastbound and westbound diverge and merge areas, while Table 4-7 summarizes the results of the analysis of crossroads diverge and merge areas.
Table 4-5. Existing Conditions – Eastbound Merge and Diverge Area Operations
LOCATIONS
AM PM
SPEED1 DENSITY2 LOS SPEED1 DENSITY2 LOS
Eastbound I-66
offramp to US 15 57.7 17.2 B 57.7 6.7 A
onramp from US 15 56.5 26.5 C 58.3 12.8 B
offramp to US 29 CD Road 59.0 22.4 C 59.3 7.0 A
onramp from US 29 CD Road 58.0 22.3 C 65.1 -0.0 A
offramp to VA 234 Bypass 60.8 17.9 B 62.0 4.3 A
weave with VA 234 Bypass (future conditions) Future ramp
onramp from VA 234 Bypass 56.2 31.0 D 61.0 13.5 B
offramp to VA 234 Bus (Sudley) 59.3 31.9 D 63.6 15.4 B
onramp from VA 234 Bus 48.5 31.9 F 62.3 9.5 A
offramp to US 29 (Centreville) 51.3 40.6 F 54.5 18.4 B
onramp from US 29 (Centreville) 46.4 37.1 F 52.5 13.6 B
offramp to VA 28 48.7 37.9 F 52.3 15.4 B
onramp from VA 28 42.1 34.4 F 52.6 15.1 B
Stringfellow HOV ramp - LEFT MERGE 48.9 34.3 D Open AM only
offramp to FCP CD Road 49.6 31.1 F 52.6 26.5 C
onramp from FCP CD Road 48.8 32.7 D 52.3 16.6 B
Monument HOV ramp - LEFT MERGE 50.6 27.2 C Open AM only
offramp to US 50 EB 52.3 32.6 D 55.2 16.9 B
offramp to US 50 WB 51.2 31.6 D 51.5 15.0 B
onramp from US 50 44.6 27.7 F 50.1 20.1 C
offramp to VA 123 CD Road 51.0 41.2 F 52.0 31.3 D
onramp from VA 123 CD Road 48.8 24.9 C 50.5 20.5 C
offramp to Nutley CD Road 50.7 40.5 F 52.0 31.8 D
onramp from Nutley CD Road 49.0 33.1 D 50.0 27.7 C
Note: Red shading indicates LOS F, Yellow shading indicates LOS E. 1Speed in MPH. 2Density is presented in passenger cars/mile/lane (pc/mi/ln).
I-66 Tier 1 – Transportation Technical Report
4-18
Table 4-6. Existing Conditions – Westbound Merge and Diverge Area Operations
LOCATIONS
AM PM
SPEED1 DENSITY2 LOS SPEED1 DENSITY2 LOS
Westbound I-66
offramp to Nutley CD Road 52.1 28.6 D 51.3 31.7 D
onramp from Nutley CD Road 49.7 27.9 C 48.9 33.0 D
offramp to VA 123 52.0 29.5 D 52.5 11.8 B
onramp from NB VA 123 50.0 25.2 C 48.8 33.5 D
onramp from SB VA 123 49.8 27.5 C 45.5 39.5 F
offramp to WB US 50 52.8 -4.8 A 50.8 7.0 F
upstream merge from WB US 50 52.0 16.4 B 47.8 37.2 E
downstream diverge to EB US 50 53.7 16.9 B 49.9 45.5 E
onramp from EB US 50 52.3 14.1 B 47.6 35.6 E
Monument HOV ramp - LEFT DIVERGE Open PM only 53.8 31.1 D
offramp to FCP CD Road 55.9 -14.9 A 51.3 6.1 A
onramp from FCP CD Road 52.0 20.4 C 45.6 37.7 F
Stringfellow HOV ramp - LEFT DIVERGE Open PM only 53.5 32.3 D
offramp to NB VA 28 51.9 22.7 C 51.5 37.3 F
offramp to SB VA 28 52.7 7.7 A 52.3 25.3 C
onramp from VA 283 53.2 10.2 B 47.6 32.0 F
offramp to US 293 55.2 3.1 A 53.6 20.8 C
onramp from "SB" US 29 52.8 6.8 A 47.9 33.7 D
onramp from "NB" US 29 52.9 10.9 B 47.3 34.6 F
offramp to NB VA 234 Bus 64.1 11.0 B 60.1 39.7 E
offramp to SB VA 234 Bus 58.1 2.0 A 54.0 29.1 D
onramp from VA 234 Bus 63.6 -1.2 A 60.0 16.1 B
offramp to NB VA 234 Bypass Future ramp
offramp to SB VA 234 Bypass 58.3 12.3 B 55.3 31.5 D
onramp from VA 234 Bypass 61.8 7.3 A 58.5 23.5 C
offramp to "NB" US 29/Heathcote Blvd 63.3 11.4 B 61.6 26.2 C
offramp to SB US 29 60.1 6.6 A 61.2 -17.6 A
onramp from US 29 51.7 8.6 A 57.4 24.1 C
offramp to US 15 56.8 8.9 A 55.2 26.8 C
onramp from US 15 60.6 0.9 A 57.8 18.4 B
Note: Red shading indicates LOS F, Yellow shading indicates LOS E. 1Speed in MPH. 2Density is presented in passenger cars/mile/lane (pc/mi/ln). 3Analyzed both as weave section and as ramp merge/diverge, as distance exceeds maximum weave distance in HCS.
4. Transportation Analysis: Existing Conditions
4-19
Table 4-7. Existing Conditions – Cross-Streets Merge and Diverge Area Operations
LOCATIONS
AM PM
SPEED1 DENSITY2 LOS SPEED1 DENSITY2 LOS
US 29 - Gainesville
northbound to eastbound ramp 47.7 23.0 C 49.0 12.2 B
southbound to westbound 50.2 7.5 A 50.0 12.1 B
southbound to eastbound 47.8 7.3 A 48.2 10.6 B
eastbound/westbound to southbound 51.2 10.9 B 53.4 6.8 A
VA 234 Bypass
northbound to eastbound ramp 49.3 20.7 C 50.1 19.4 B
northbound to westbound ramp Future ramp
westbound to southbound ramp Future ramp
eastbound to southbound ramp 50.7 19.8 B 50.7 20.4 C
VA 28
eastbound to northbound loop 51.1 22.9 C 51.9 14.9 B
westbound to southbound ramp 51.8 15.8 B 49.4 30.8 D
Fairfax County Parkway
northbound ramp to eastbound 50.6 19.4 B 53.3 7.4 A
ramp from westbound to northbound 50.4 25.8 C 51.6 18.6 B
southbound ramp to westbound 51.3 5.3 A 52.6 12.4 B
ramp from eastbound to southbound 51.5 19.4 B 50.3 25.2 C
US 50
northbound ramp to eastbound 50.6 12.1 B 50.6 21 C
left exit for Fair Oaks Mall 50.0 14.6 B 49.7 20.8 C
ramp from westbound to northbound 50.4 25.8 C 51.0 20.5 C
southbound ramp to westbound 52.8 21.9 C 51.9 26.2 C
loop from westbound to southbound 48.3 29.3 D 47.9 30.2 D
southbound ramp to eastbound - LEFT DIVERGE
51.7 11.6 B 51.0 -8.4 A
ramp from eastbound to southbound 51.7 17.8 B 52.1 14.1 B
VA 123 - Chain Bridge Road
northbound ramp to eastbound 54.3 -11.1 A 54.1 -9.1 A
ramp from westbound to northbound 50.8 19.7 B 51.3 12.2 B
southbound ramp to westbound 51.4 7.9 A 49.5 20.3 C
southbound loop ramp to eastbound 48.4 7.3 A 48.3 9.6 A
ramp from eastbound/westbound to southbound
51.2 14.0 B 51.2 13.6 B
VA 243 - Nutley Street
northbound ramp to eastbound 50.7 15.4 B 52.0 12.9 B
ramp from westbound to northbound 51.8 12.7 B 51.5 13.9 B
southbound ramp to westbound 50.8 11.1 B 50.8 11.4 B
ramp from eastbound to southbound 51.2 17.2 B 51.7 14.3 B
Note: Red shading indicates LOS F, Yellow shading indicates LOS E. 1Speed in MPH. 2Density is presented in passenger cars/mile/lane (pc/mi/ln).
I-66 Tier 1 – Transportation Technical Report
4-20
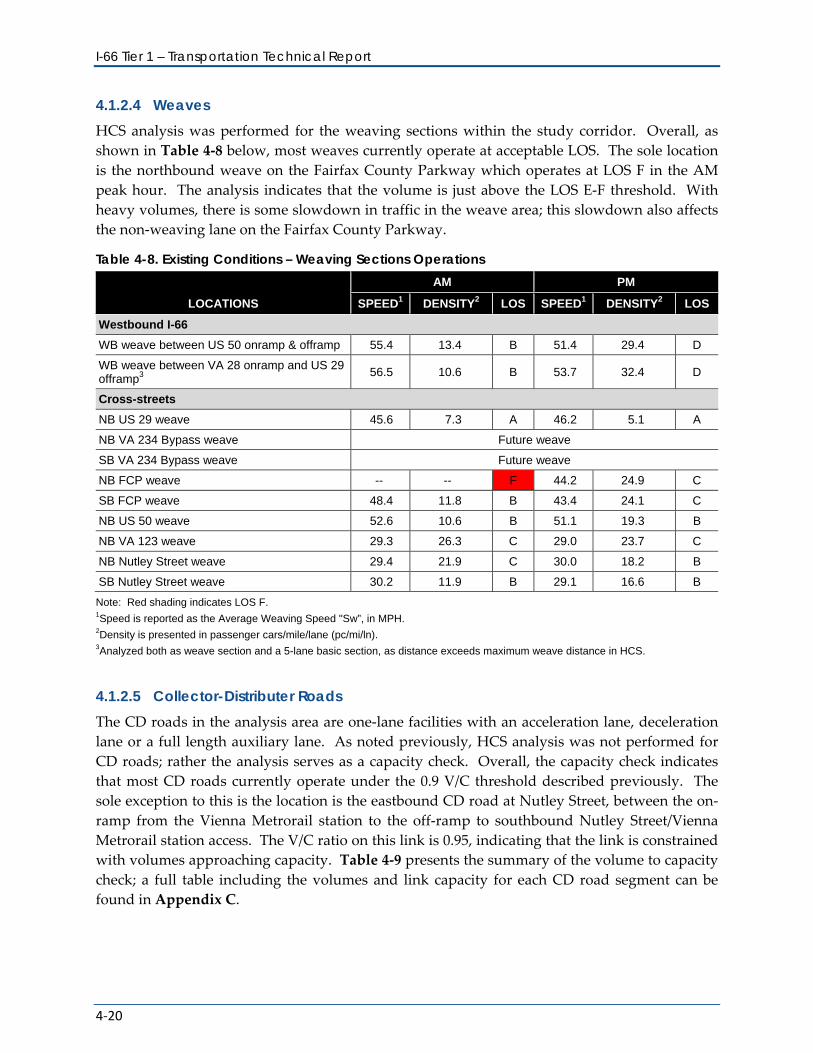
4.1.2.4 Weaves HCS analysis was performed for the weaving sections within the study corridor. Overall, as shown in Table 4-8 below, most weaves currently operate at acceptable LOS. The sole location is the northbound weave on the Fairfax County Parkway which operates at LOS F in the AM peak hour. The analysis indicates that the volume is just above the LOS E-F threshold. With heavy volumes, there is some slowdown in traffic in the weave area; this slowdown also affects the non-weaving lane on the Fairfax County Parkway.
Table 4-8. Existing Conditions – Weaving Sections Operations
LOCATIONS
AM PM
SPEED1 DENSITY2 LOS SPEED1 DENSITY2 LOS
Westbound I-66
WB weave between US 50 onramp & offramp 55.4 13.4 B 51.4 29.4 D
WB weave between VA 28 onramp and US 29 offramp3
56.5 10.6 B 53.7 32.4 D
Cross-streets
NB US 29 weave 45.6 7.3 A 46.2 5.1 A
NB VA 234 Bypass weave Future weave
SB VA 234 Bypass weave Future weave
NB FCP weave -- -- F 44.2 24.9 C
SB FCP weave 48.4 11.8 B 43.4 24.1 C
NB US 50 weave 52.6 10.6 B 51.1 19.3 B
NB VA 123 weave 29.3 26.3 C 29.0 23.7 C
NB Nutley Street weave 29.4 21.9 C 30.0 18.2 B
SB Nutley Street weave 30.2 11.9 B 29.1 16.6 B
Note: Red shading indicates LOS F. 1Speed is reported as the Average Weaving Speed "Sw”, in MPH. 2Density is presented in passenger cars/mile/lane (pc/mi/ln). 3Analyzed both as weave section and a 5-lane basic section, as distance exceeds maximum weave distance in HCS.
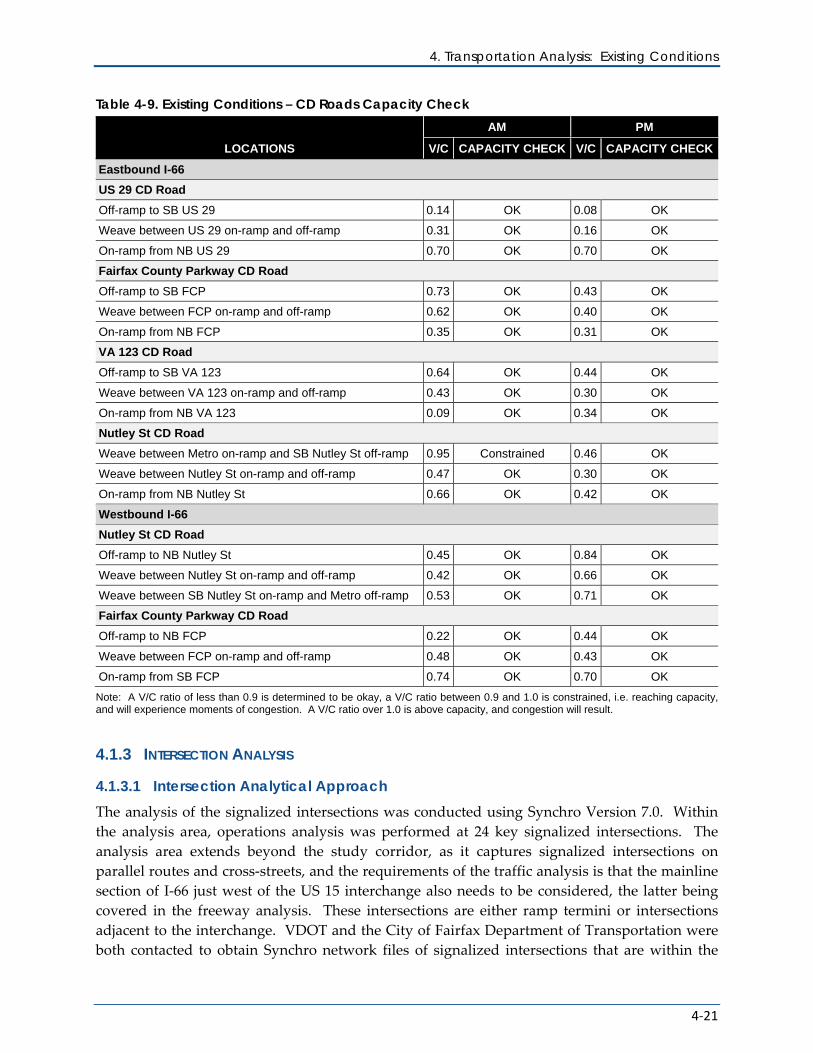
4.1.2.5 Collector-Distributer Roads The CD roads in the analysis area are one-lane facilities with an acceleration lane, deceleration lane or a full length auxiliary lane. As noted previously, HCS analysis was not performed for CD roads; rather the analysis serves as a capacity check. Overall, the capacity check indicates that most CD roads currently operate under the 0.9 V/C threshold described previously. The sole exception to this is the location is the eastbound CD road at Nutley Street, between the on-ramp from the Vienna Metrorail station to the off-ramp to southbound Nutley Street/Vienna Metrorail station access. The V/C ratio on this link is 0.95, indicating that the link is constrained with volumes approaching capacity. Table 4-9 presents the summary of the volume to capacity check; a full table including the volumes and link capacity for each CD road segment can be found in Appendix C.
4. Transportation Analysis: Existing Conditions
4-21
Table 4-9. Existing Conditions – CD Roads Capacity Check
LOCATIONS
AM PM
V/C CAPACITY CHECK V/C CAPACITY CHECK
Eastbound I-66
US 29 CD Road
Off-ramp to SB US 29 0.14 OK 0.08 OK
Weave between US 29 on-ramp and off-ramp 0.31 OK 0.16 OK
On-ramp from NB US 29 0.70 OK 0.70 OK
Fairfax County Parkway CD Road
Off-ramp to SB FCP 0.73 OK 0.43 OK
Weave between FCP on-ramp and off-ramp 0.62 OK 0.40 OK
On-ramp from NB FCP 0.35 OK 0.31 OK
VA 123 CD Road
Off-ramp to SB VA 123 0.64 OK 0.44 OK
Weave between VA 123 on-ramp and off-ramp 0.43 OK 0.30 OK
On-ramp from NB VA 123 0.09 OK 0.34 OK
Nutley St CD Road
Weave between Metro on-ramp and SB Nutley St off-ramp 0.95 Constrained 0.46 OK
Weave between Nutley St on-ramp and off-ramp 0.47 OK 0.30 OK
On-ramp from NB Nutley St 0.66 OK 0.42 OK
Westbound I-66
Nutley St CD Road
Off-ramp to NB Nutley St 0.45 OK 0.84 OK
Weave between Nutley St on-ramp and off-ramp 0.42 OK 0.66 OK
Weave between SB Nutley St on-ramp and Metro off-ramp 0.53 OK 0.71 OK
Fairfax County Parkway CD Road
Off-ramp to NB FCP 0.22 OK 0.44 OK
Weave between FCP on-ramp and off-ramp 0.48 OK 0.43 OK
On-ramp from SB FCP 0.74 OK 0.70 OK
Note: A V/C ratio of less than 0.9 is determined to be okay, a V/C ratio between 0.9 and 1.0 is constrained, i.e. reaching capacity, and will experience moments of congestion. A V/C ratio over 1.0 is above capacity, and congestion will result.
4.1.3 INTERSECTION ANALYSIS
4.1.3.1 Intersection Analytical Approach The analysis of the signalized intersections was conducted using Synchro Version 7.0. Within the analysis area, operations analysis was performed at 24 key signalized intersections. The analysis area extends beyond the study corridor, as it captures signalized intersections on parallel routes and cross-streets, and the requirements of the traffic analysis is that the mainline section of I-66 just west of the US 15 interchange also needs to be considered, the latter being covered in the freeway analysis. These intersections are either ramp termini or intersections adjacent to the interchange. VDOT and the City of Fairfax Department of Transportation were both contacted to obtain Synchro network files of signalized intersections that are within the
I-66 Tier 1 – Transportation Technical Report
4-22
jurisdiction of each agency. The files provided included AM and PM peak periods signal timing plans, which include cycle length, offsets for coordinated intersections, yellow/all-red time, and proportion of green time split between the approaches. The files also contain the geometric configuration of the intersections, such as the number of lanes and turn bays. The files were reviewed for consistency between AM and PM, and revised if different. For the existing conditions analysis, signal timing parameters (i.e. splits and offsets) were not adjusted or optimized. By performing the analysis in this manner, the results best replicate the delays that drivers experienced at the time the counts were performed.
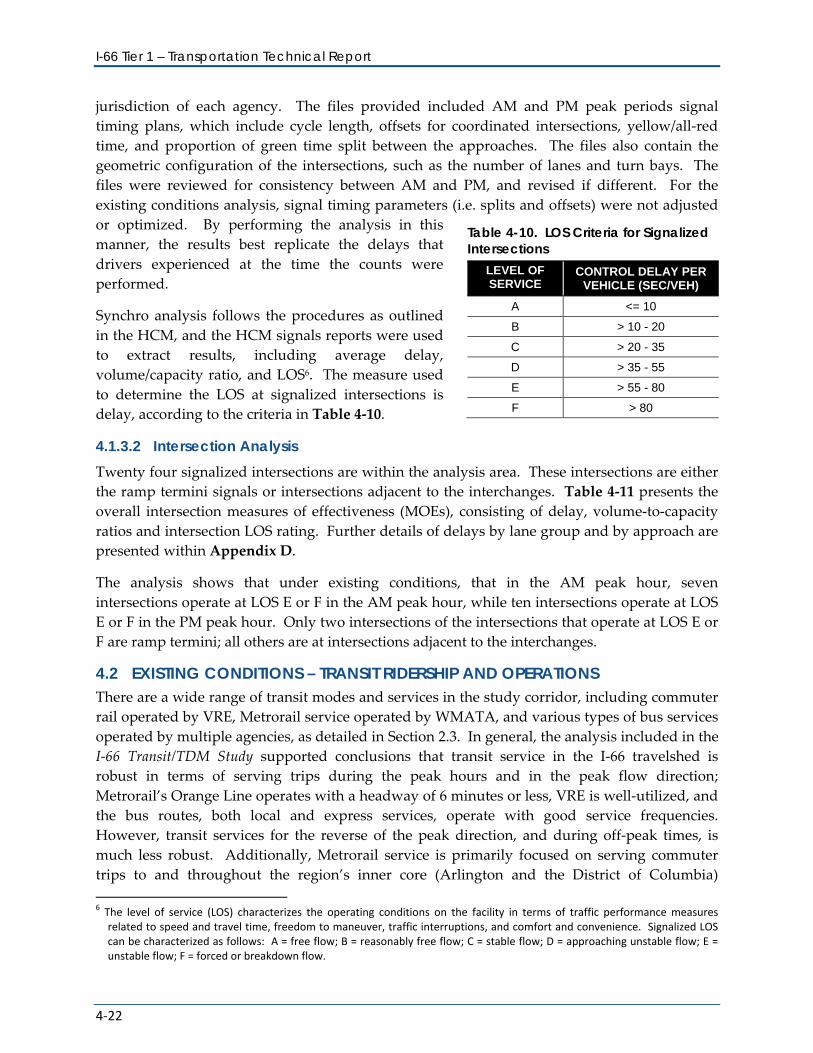
Synchro analysis follows the procedures as outlined in the HCM, and the HCM signals reports were used to extract results, including average delay, volume/capacity ratio, and LOS6. The measure used to determine the LOS at signalized intersections is delay, according to the criteria in Table 4-10.
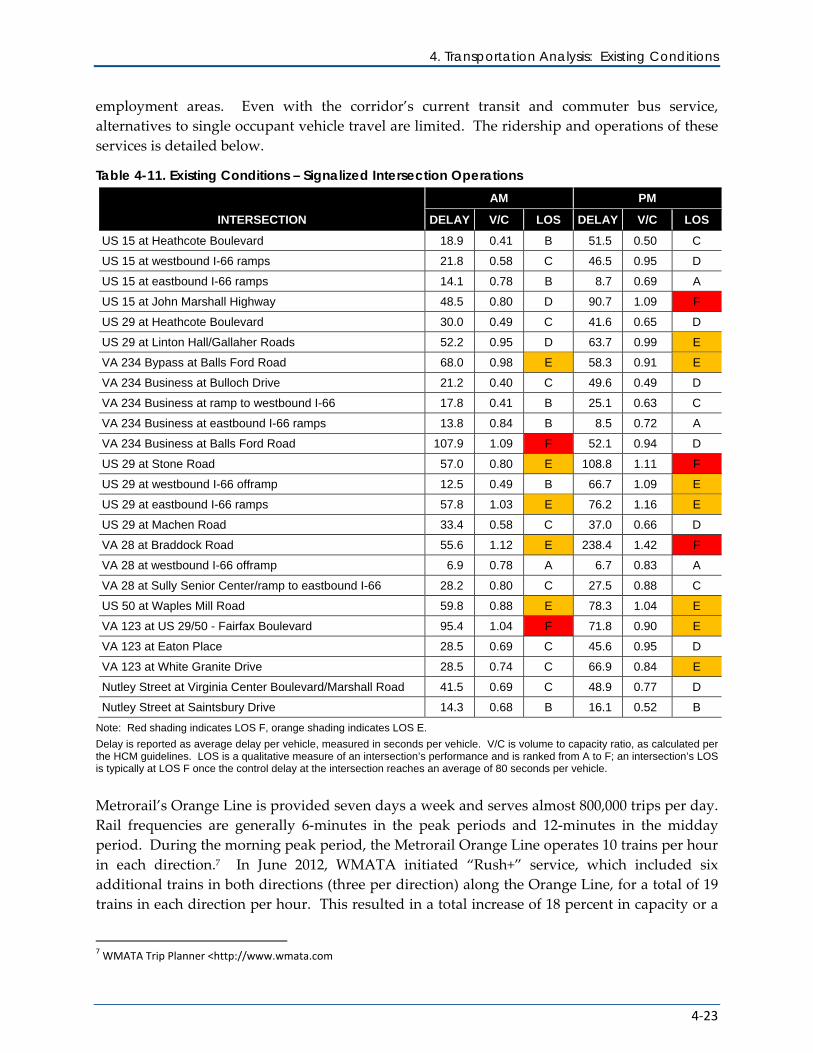
4.1.3.2 Intersection Analysis Twenty four signalized intersections are within the analysis area. These intersections are either the ramp termini signals or intersections adjacent to the interchanges. Table 4-11 presents the overall intersection measures of effectiveness (MOEs), consisting of delay, volume-to-capacity ratios and intersection LOS rating. Further details of delays by lane group and by approach are presented within Appendix D.
The analysis shows that under existing conditions, that in the AM peak hour, seven intersections operate at LOS E or F in the AM peak hour, while ten intersections operate at LOS E or F in the PM peak hour. Only two intersections of the intersections that operate at LOS E or F are ramp termini; all others are at intersections adjacent to the interchanges.
4.2 EXISTING CONDITIONS – TRANSIT RIDERSHIP AND OPERATIONS There are a wide range of transit modes and services in the study corridor, including commuter rail operated by VRE, Metrorail service operated by WMATA, and various types of bus services operated by multiple agencies, as detailed in Section 2.3. In general, the analysis included in the I-66 Transit/TDM Study supported conclusions that transit service in the I-66 travelshed is robust in terms of serving trips during the peak hours and in the peak flow direction; Metrorail’s Orange Line operates with a headway of 6 minutes or less, VRE is well-utilized, and the bus routes, both local and express services, operate with good service frequencies. However, transit services for the reverse of the peak direction, and during off-peak times, is much less robust. Additionally, Metrorail service is primarily focused on serving commuter trips to and throughout the region’s inner core (Arlington and the District of Columbia) 6 The level of service (LOS) characterizes the operating conditions on the facility in terms of traffic performance measures
related to speed and travel time, freedom to maneuver, traffic interruptions, and comfort and convenience. Signalized LOS can be characterized as follows: A = free flow; B = reasonably free flow; C = stable flow; D = approaching unstable flow; E = unstable flow; F = forced or breakdown flow.
Table 4-10. LOS Criteria for Signalized Intersections
LEVEL OF SERVICE
CONTROL DELAY PER VEHICLE (SEC/VEH)
A <= 10
B > 10 - 20
C > 20 - 35
D > 35 - 55
E > 55 - 80
F > 80
4. Transportation Analysis: Existing Conditions
4-23
employment areas. Even with the corridor’s current transit and commuter bus service, alternatives to single occupant vehicle travel are limited. The ridership and operations of these services is detailed below.
Table 4-11. Existing Conditions – Signalized Intersection Operations
INTERSECTION
AM PM
DELAY V/C LOS DELAY V/C LOS
US 15 at Heathcote Boulevard 18.9 0.41 B 51.5 0.50 C
US 15 at westbound I-66 ramps 21.8 0.58 C 46.5 0.95 D
US 15 at eastbound I-66 ramps 14.1 0.78 B 8.7 0.69 A
US 15 at John Marshall Highway 48.5 0.80 D 90.7 1.09 F
US 29 at Heathcote Boulevard 30.0 0.49 C 41.6 0.65 D
US 29 at Linton Hall/Gallaher Roads 52.2 0.95 D 63.7 0.99 E
VA 234 Bypass at Balls Ford Road 68.0 0.98 E 58.3 0.91 E
VA 234 Business at Bulloch Drive 21.2 0.40 C 49.6 0.49 D
VA 234 Business at ramp to westbound I-66 17.8 0.41 B 25.1 0.63 C
VA 234 Business at eastbound I-66 ramps 13.8 0.84 B 8.5 0.72 A
VA 234 Business at Balls Ford Road 107.9 1.09 F 52.1 0.94 D
US 29 at Stone Road 57.0 0.80 E 108.8 1.11 F
US 29 at westbound I-66 offramp 12.5 0.49 B 66.7 1.09 E
US 29 at eastbound I-66 ramps 57.8 1.03 E 76.2 1.16 E
US 29 at Machen Road 33.4 0.58 C 37.0 0.66 D
VA 28 at Braddock Road 55.6 1.12 E 238.4 1.42 F
VA 28 at westbound I-66 offramp 6.9 0.78 A 6.7 0.83 A
VA 28 at Sully Senior Center/ramp to eastbound I-66 28.2 0.80 C 27.5 0.88 C
US 50 at Waples Mill Road 59.8 0.88 E 78.3 1.04 E
VA 123 at US 29/50 - Fairfax Boulevard 95.4 1.04 F 71.8 0.90 E
VA 123 at Eaton Place 28.5 0.69 C 45.6 0.95 D
VA 123 at White Granite Drive 28.5 0.74 C 66.9 0.84 E
Nutley Street at Virginia Center Boulevard/Marshall Road 41.5 0.69 C 48.9 0.77 D
Nutley Street at Saintsbury Drive 14.3 0.68 B 16.1 0.52 B
Note: Red shading indicates LOS F, orange shading indicates LOS E.
Delay is reported as average delay per vehicle, measured in seconds per vehicle. V/C is volume to capacity ratio, as calculated per the HCM guidelines. LOS is a qualitative measure of an intersection’s performance and is ranked from A to F; an intersection’s LOS is typically at LOS F once the control delay at the intersection reaches an average of 80 seconds per vehicle.
Metrorail’s Orange Line is provided seven days a week and serves almost 800,000 trips per day. Rail frequencies are generally 6-minutes in the peak periods and 12-minutes in the midday period. During the morning peak period, the Metrorail Orange Line operates 10 trains per hour in each direction.7 In June 2012, WMATA initiated “Rush+” service, which included six additional trains in both directions (three per direction) along the Orange Line, for a total of 19 trains in each direction per hour. This resulted in a total increase of 18 percent in capacity or a
7 WMATA Trip Planner <http://www.wmata.com
I-66 Tier 1 – Transportation Technical Report
4-24
total increase of approximately 2,600 seats per peak hour. The Orange Line is the second busiest Metrorail line, carrying approximately 180,000 passenger trips on a typical weekday; peak hour trains on the Orange Line between Courthouse and Rosslyn Stations carry more passengers per car than anywhere else on the system.8 The Orange Line, which covers only the easternmost 2.6 miles of the study corridor, experiences peak hour demand that exceeds capacity. Because of the merge at Rosslyn, the number of Blue and Orange trains that can operate in Virginia is limited.
VRE service is provided in the peak periods, weekdays only, with two eastbound trains per hour and one morning westbound train along the Manassas Line during the morning peak period.9 Additional service also is provided on the Fredericksburg VRE line which runs parallel to I-95. The Manassas Line averages almost 10,000 daily trips and FY 2012 total ridership was over 4.7 million passenger trips, with ridership continuing to increase.10
Of the thirteen Park-and-Ride lots located within the study corridor, the following locations are fully utilized: the Metrorail station lots at Vienna/Fairfax-GMU and Dunn Loring/Merrifield; I-66/Stringfellow Road; and Stone Road/US 29. Overall lot utilization within the corridor is approximately 85 percent.
Bus service in the I-66 corridor is operated by six different transit agencies, including Arlington Transit (ART), CUE, Fairfax Connector, Loudoun County Transit, PRTC, and WMATA, as detailed in Section 2.3. Of these, the CUE has two fixed routes and operates seven days a week; FY 2010 fixed route ridership was over 900,000 passenger trips. The Fairfax Connector operates 68 fixed routes and circulators. Service is provided seven days a week, with 24-hour weekday service on select routes. FY 2010 ridership was over 9.6 million passenger trips. PRTC operates 17 commuter routes (OmniRide); FY 2010 ridership was almost 3.2 million passenger trips.
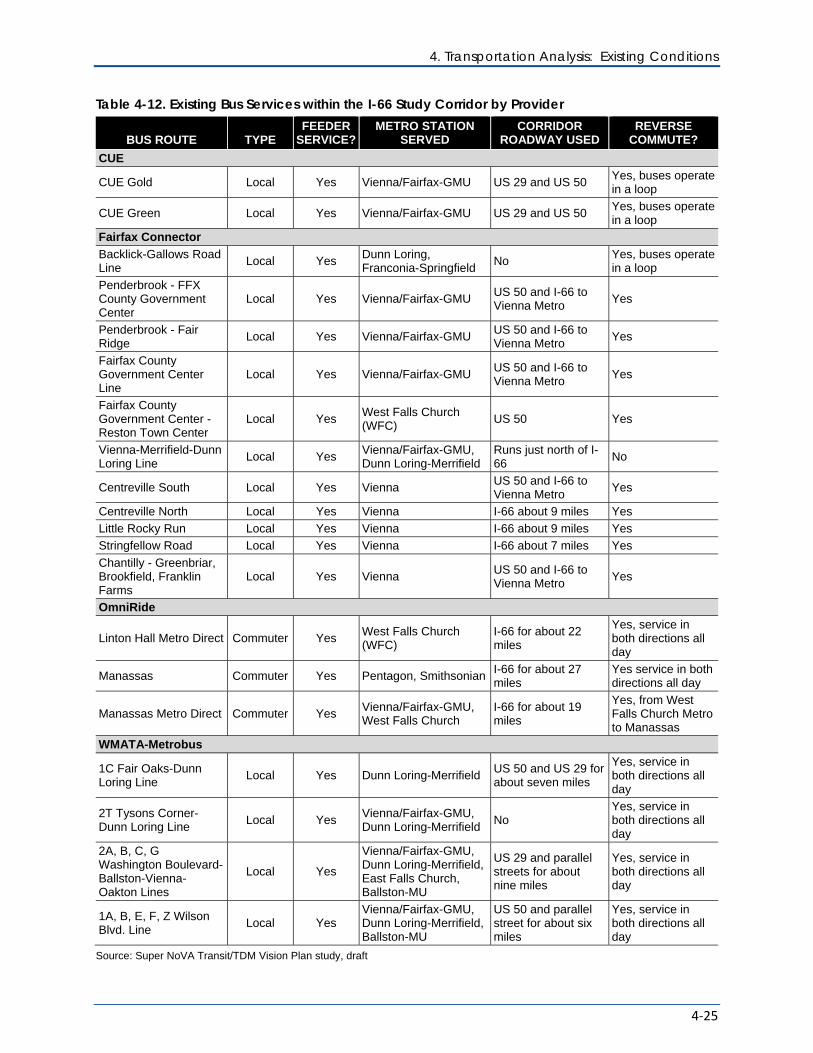
Bus services within the I-66 travel shed consist of the following as described in Table 4-12. These includes bus routes that provide services to the travel shed, but may not travel on I-66 itself, but rather a parallel route to I-66, such as US 50. Also provided in the list are bus routes that provide services to the Vienna/Fairfax-GMU and/or Dunn Loring Metrorail stations.
The combination of all bus services result in the service pattern shown in Figure 4-4 which indicates bus frequencies ranging from 37 buses per hour in both directions in the eastern end of the corridor near Rosslyn to five buses per hour west of the Beltway during the peak periods. Bus frequencies along US 50 range from five to 34 buses per hour while US 29 accommodates an additional eight buses per hour in the study corridor. The figure also shows the boardings at Metrorail Stations within the study corridor and the VRE Manassas Line located to the south. Existing bus routes in the study corridor are generally radial in nature, resulting in less availability of north/south transit routes.
8 WMATA News Release on March 19, 2012.
http://www.wmata.com/about_metro/news/PressReleaseDetail.cfm?ReleaseID=5186 9 VRE Schedules <http://www.vre.org/service/schedule.htm#Manassas 10 VRE Chief Executive Officer’s Report, July 2012. http://vre.org/about/Ops_board_items/2012/July/CEO_report.pdf
4. Transportation Analysis: Existing Conditions
4-25
Table 4-12. Existing Bus Services within the I-66 Study Corridor by Provider
BUS ROUTE TYPE FEEDER
SERVICE?METRO STATION
SERVED CORRIDOR
ROADWAY USED REVERSE
COMMUTE?
CUE
CUE Gold Local Yes Vienna/Fairfax-GMU US 29 and US 50 Yes, buses operate in a loop
CUE Green Local Yes Vienna/Fairfax-GMU US 29 and US 50 Yes, buses operate in a loop
Fairfax Connector
Backlick-Gallows Road Line
Local Yes Dunn Loring, Franconia-Springfield
No Yes, buses operate in a loop
Penderbrook - FFX County Government Center
Local Yes Vienna/Fairfax-GMU US 50 and I-66 to Vienna Metro
Yes
Penderbrook - Fair Ridge
Local Yes Vienna/Fairfax-GMU US 50 and I-66 to Vienna Metro
Yes
Fairfax County Government Center Line
Local Yes Vienna/Fairfax-GMU US 50 and I-66 to Vienna Metro
Yes
Fairfax County Government Center - Reston Town Center
Local Yes West Falls Church (WFC)
US 50 Yes
Vienna-Merrifield-Dunn Loring Line
Local Yes Vienna/Fairfax-GMU, Dunn Loring-Merrifield
Runs just north of I-66
No
Centreville South Local Yes Vienna US 50 and I-66 to Vienna Metro
Yes
Centreville North Local Yes Vienna I-66 about 9 miles Yes
Little Rocky Run Local Yes Vienna I-66 about 9 miles Yes
Stringfellow Road Local Yes Vienna I-66 about 7 miles Yes
Chantilly - Greenbriar, Brookfield, Franklin Farms
Local Yes Vienna US 50 and I-66 to Vienna Metro
Yes
OmniRide
Linton Hall Metro Direct Commuter Yes West Falls Church (WFC)
I-66 for about 22 miles
Yes, service in both directions all day
Manassas Commuter Yes Pentagon, SmithsonianI-66 for about 27 miles
Yes service in both directions all day
Manassas Metro Direct Commuter Yes Vienna/Fairfax-GMU, West Falls Church
I-66 for about 19 miles
Yes, from West Falls Church Metro to Manassas
WMATA-Metrobus
1C Fair Oaks-Dunn Loring Line
Local Yes Dunn Loring-Merrifield US 50 and US 29 for about seven miles
Yes, service in both directions all day
2T Tysons Corner-Dunn Loring Line
Local Yes Vienna/Fairfax-GMU, Dunn Loring-Merrifield
No Yes, service in both directions all day
2A, B, C, G Washington Boulevard-Ballston-Vienna- Oakton Lines
Local Yes
Vienna/Fairfax-GMU, Dunn Loring-Merrifield, East Falls Church, Ballston-MU
US 29 and parallel streets for about nine miles
Yes, service in both directions all day
1A, B, E, F, Z Wilson Blvd. Line
Local Yes Vienna/Fairfax-GMU, Dunn Loring-Merrifield, Ballston-MU
US 50 and parallel street for about six miles
Yes, service in both directions all day
Source: Super NoVA Transit/TDM Vision Plan study, draft
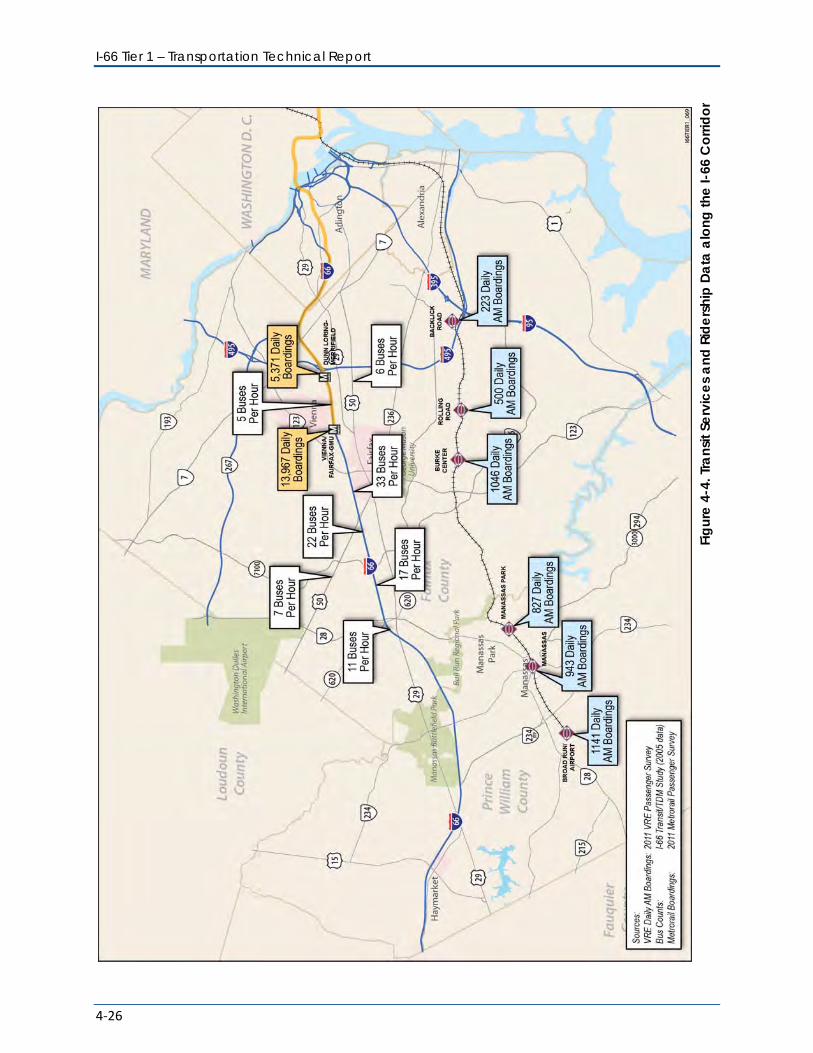
I-66 Tier 1 – Transportation Technical Report
4-26
Fi
gure
4-4
. Tra
nsit
Serv
ices
and
Rid
ersh
ip D
ata
alon
g th
e I-6
6 C
orrid
or
4. Transportation Analysis: Existing Conditions
4-27
4.3 TRANSFER POINTS Due to the multimodal and HOV-orientation of the I-66 corridor, transfers between modes to access the system are common. Improving the functionality and quality of these transfer points is, therefore, an important tool to improve the percent of travelers using non-SOV (single occupant vehicle) modes. Transfer points can serve as a barrier both to existing users as well as to the attraction of new users. How well a transfer point works can be a function of many factors. The primary factors include location, physical design, ease of access, wayfinding and signage. Poor conditions with respect to any of these factors can deter ridership.
The influence of the transfer point on travel time is largely a function of the frequency and hours of operation of connecting transit service; that is, infrequent service results in a long wait time which adds significantly to the total trip time. The design of the transfer point also can influence travel time. Key factors may include:
• Integration of transit service: Bring bus service into a Park-and-Ride lot, for example, as opposed to requiring users to cross the street, etc. For a larger lot, having the bus circulate through the lot with multiple stops is helpful.
• Distance between modes at rail stations: Bringing the bus (and hence bus stop) as close to the train platform as possible will reduce transfer time.
• Parking lot layout: Land availability in an appropriate location is often a factor in siting a Park-and-Ride facility. In constrained (developed) locations such as in much of the I-66 project area, the layout of the parking lot may add to travel time. Examples could include a long, narrow lot or smaller lots spread out over a larger area.
While detailed analysis of each potential transfer point or intermodal facility is beyond the scope of this Tier 1 EIS, Table 4-13 below presents a high-level summary of the primary transfer points in the corridor. More detailed analysis would be required to comprehensively identify and assess physical characteristics that influence travel time.
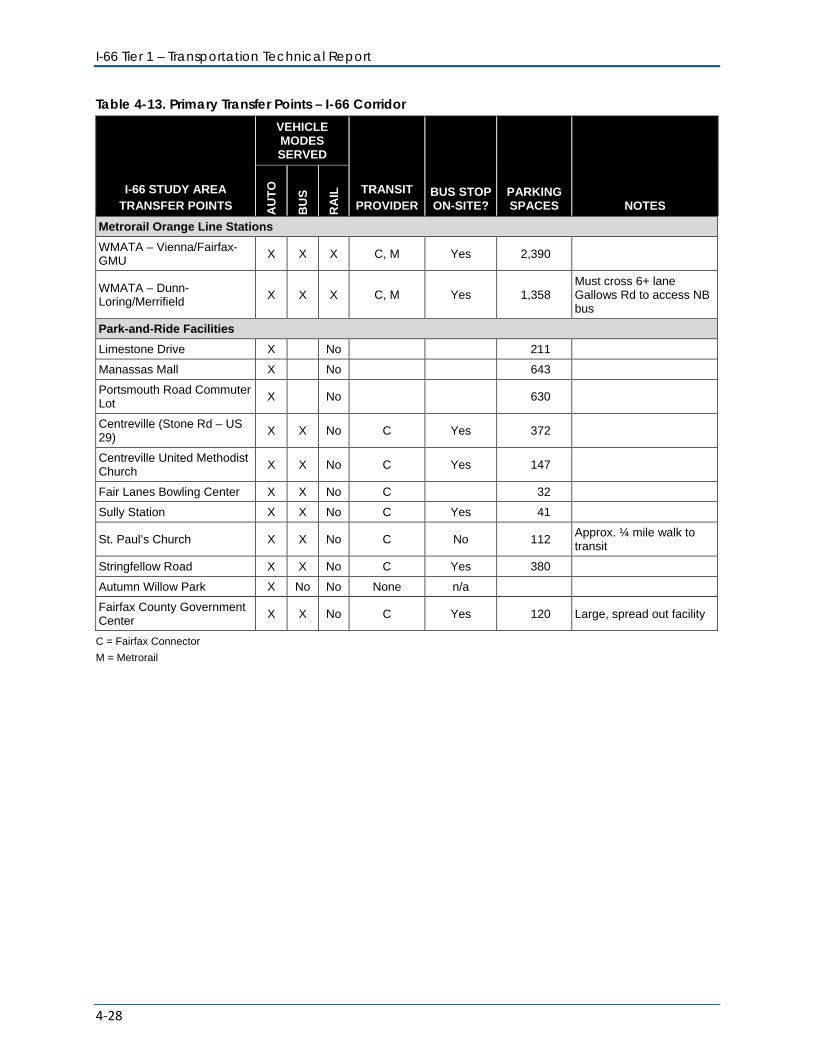
I-66 Tier 1 – Transportation Technical Report
4-28
Table 4-13. Primary Transfer Points – I-66 Corridor
I-66 STUDY AREA TRANSFER POINTS
VEHICLE MODES SERVED
TRANSIT PROVIDER
BUS STOP ON-SITE?
PARKING SPACES NOTES A
UT
O
BU
S
RA
IL
Metrorail Orange Line Stations
WMATA – Vienna/Fairfax-GMU
X X X C, M Yes 2,390
WMATA – Dunn-Loring/Merrifield
X X X C, M Yes 1,358 Must cross 6+ lane Gallows Rd to access NB bus
Park-and-Ride Facilities
Limestone Drive X No 211
Manassas Mall X No 643
Portsmouth Road Commuter Lot
X No 630
Centreville (Stone Rd – US 29)
X X No C Yes 372
Centreville United Methodist Church
X X No C Yes 147
Fair Lanes Bowling Center X X No C 32
Sully Station X X No C Yes 41
St. Paul’s Church X X No C No 112 Approx. ¼ mile walk to transit
Stringfellow Road X X No C Yes 380
Autumn Willow Park X No No None n/a
Fairfax County Government Center
X X No C Yes 120 Large, spread out facility
C = Fairfax Connector
M = Metrorail

4. Transportation Analysis: Existing Conditions
4-29

5-1
5 TRAVEL SAFETY IN THE STUDY CORRIDOR
5.1 CRASH ANALYSIS METHODOLOGY As noted in Section 3, crash data was provided to the study team by VDOT’s Traffic Engineering Division (Safety) for the period 2006 to 2010. The data was reviewed to determine crash frequencies and patterns with respect to the following parameters:
• Time of day
• Type of crash (rear-end, sideswipe (same direction), angle, etc.)
• Crash severity (fatal, critical, minor and property-damaged only)
• Crash rate per hundred million miles travelled to compare the rate against the I-66 corridor as a whole.
The study corridor was broken into sections, with the existing intersections serving as the end points for each section; the analysis focused on developing and comparing the parameters listed above with respect to these sections. The location and density of crashes was plotted in the GIS environment in order to visually identify high crash locations; this assisted in focusing efforts to identify potential safety concerns as well as possible improvements towards key locations.
5.2 DETAILED CRASH ANALYSIS In addition to the VDOT crash database (2006 to 2010) and plots of crash locations and frequencies, the crash analysis also involved field reviews as well as engineering judgment. For much of the corridor, the basic roadway geometrics of I-66 have remained unchanged geometrically, so safety deficiencies can be assessed using the 2006-2010 database. However, the section of I-66 from VA 234 Bypass to US 29, including the interchange at US 29, was improved/widened with work that was completed in 2010. When interpreting the crash analysis in this area, it is important to consider that construction activities can have an impact (through jersey barriers, narrowed lanes and shoulders, etc.), and also note that sufficient time has not passed to allow for the safety effects of the improved roadway to be assessed. It also should be noted that the Capital Beltway has been under reconstruction efforts since 2008 which could affect traffic flows and crash patterns between the Beltway and I-66.
The VDOT crash database (included in Appendix E) includes the following data:
• Time of day, month of year
• Type of crash (rear-end, sideswipe (same direction), angle, etc.)
• Crash severity (fatal, critical, minor and property-damaged only)
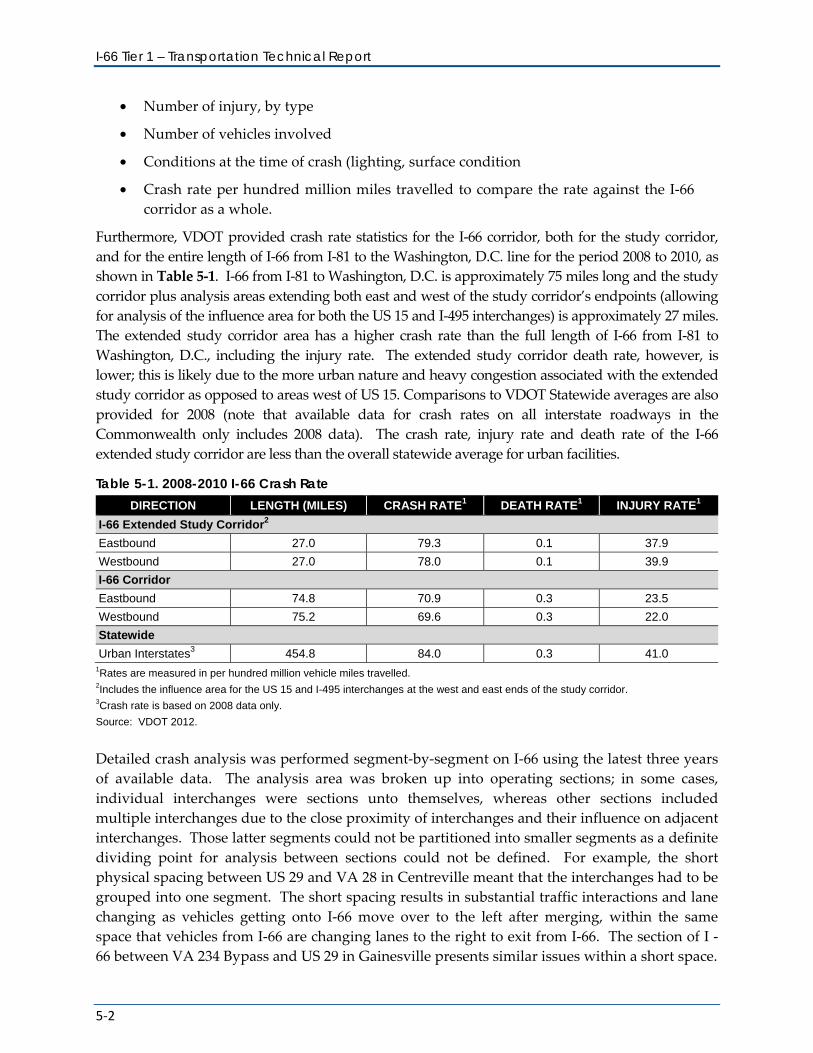
I-66 Tier 1 – Transportation Technical Report
5-2
• Number of injury, by type
• Number of vehicles involved
• Conditions at the time of crash (lighting, surface condition
• Crash rate per hundred million miles travelled to compare the rate against the I-66 corridor as a whole.
Furthermore, VDOT provided crash rate statistics for the I-66 corridor, both for the study corridor, and for the entire length of I-66 from I-81 to the Washington, D.C. line for the period 2008 to 2010, as shown in Table 5-1. I-66 from I-81 to Washington, D.C. is approximately 75 miles long and the study corridor plus analysis areas extending both east and west of the study corridor’s endpoints (allowing for analysis of the influence area for both the US 15 and I-495 interchanges) is approximately 27 miles. The extended study corridor area has a higher crash rate than the full length of I-66 from I-81 to Washington, D.C., including the injury rate. The extended study corridor death rate, however, is lower; this is likely due to the more urban nature and heavy congestion associated with the extended study corridor as opposed to areas west of US 15. Comparisons to VDOT Statewide averages are also provided for 2008 (note that available data for crash rates on all interstate roadways in the Commonwealth only includes 2008 data). The crash rate, injury rate and death rate of the I-66 extended study corridor are less than the overall statewide average for urban facilities.
Table 5-1. 2008-2010 I-66 Crash Rate DIRECTION LENGTH (MILES) CRASH RATE1 DEATH RATE1 INJURY RATE1
I-66 Extended Study Corridor2
Eastbound 27.0 79.3 0.1 37.9
Westbound 27.0 78.0 0.1 39.9
I-66 Corridor
Eastbound 74.8 70.9 0.3 23.5
Westbound 75.2 69.6 0.3 22.0
Statewide
Urban Interstates3 454.8 84.0 0.3 41.0 1Rates are measured in per hundred million vehicle miles travelled. 2Includes the influence area for the US 15 and I-495 interchanges at the west and east ends of the study corridor. 3Crash rate is based on 2008 data only.
Source: VDOT 2012.
Detailed crash analysis was performed segment-by-segment on I-66 using the latest three years of available data. The analysis area was broken up into operating sections; in some cases, individual interchanges were sections unto themselves, whereas other sections included multiple interchanges due to the close proximity of interchanges and their influence on adjacent interchanges. Those latter segments could not be partitioned into smaller segments as a definite dividing point for analysis between sections could not be defined. For example, the short physical spacing between US 29 and VA 28 in Centreville meant that the interchanges had to be grouped into one segment. The short spacing results in substantial traffic interactions and lane changing as vehicles getting onto I-66 move over to the left after merging, within the same space that vehicles from I-66 are changing lanes to the right to exit from I-66. The section of I -66 between VA 234 Bypass and US 29 in Gainesville presents similar issues within a short space.
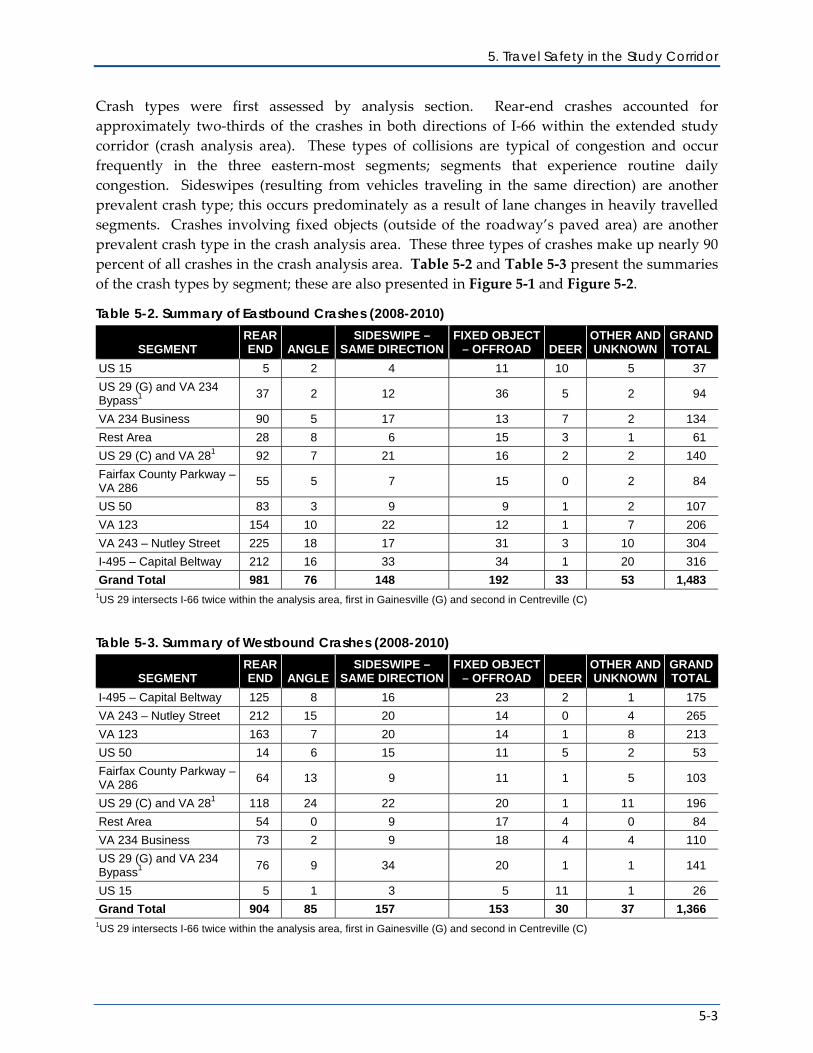
5. Travel Safety in the Study Corridor
5-3
Crash types were first assessed by analysis section. Rear-end crashes accounted for approximately two-thirds of the crashes in both directions of I-66 within the extended study corridor (crash analysis area). These types of collisions are typical of congestion and occur frequently in the three eastern-most segments; segments that experience routine daily congestion. Sideswipes (resulting from vehicles traveling in the same direction) are another prevalent crash type; this occurs predominately as a result of lane changes in heavily travelled segments. Crashes involving fixed objects (outside of the roadway’s paved area) are another prevalent crash type in the crash analysis area. These three types of crashes make up nearly 90 percent of all crashes in the crash analysis area. Table 5-2 and Table 5-3 present the summaries of the crash types by segment; these are also presented in Figure 5-1 and Figure 5-2.
Table 5-2. Summary of Eastbound Crashes (2008-2010)
SEGMENT REAR END ANGLE
SIDESWIPE – SAME DIRECTION
FIXED OBJECT – OFFROAD DEER
OTHER AND UNKNOWN
GRAND TOTAL
US 15 5 2 4 11 10 5 37
US 29 (G) and VA 234 Bypass1
37 2 12 36 5 2 94
VA 234 Business 90 5 17 13 7 2 134
Rest Area 28 8 6 15 3 1 61
US 29 (C) and VA 281 92 7 21 16 2 2 140
Fairfax County Parkway – VA 286
55 5 7 15 0 2 84
US 50 83 3 9 9 1 2 107
VA 123 154 10 22 12 1 7 206
VA 243 – Nutley Street 225 18 17 31 3 10 304
I-495 – Capital Beltway 212 16 33 34 1 20 316
Grand Total 981 76 148 192 33 53 1,483 1US 29 intersects I-66 twice within the analysis area, first in Gainesville (G) and second in Centreville (C)
Table 5-3. Summary of Westbound Crashes (2008-2010)
SEGMENT REAR END ANGLE
SIDESWIPE – SAME DIRECTION
FIXED OBJECT – OFFROAD DEER
OTHER AND UNKNOWN
GRAND TOTAL
I-495 – Capital Beltway 125 8 16 23 2 1 175
VA 243 – Nutley Street 212 15 20 14 0 4 265
VA 123 163 7 20 14 1 8 213
US 50 14 6 15 11 5 2 53
Fairfax County Parkway – VA 286
64 13 9 11 1 5 103
US 29 (C) and VA 281 118 24 22 20 1 11 196
Rest Area 54 0 9 17 4 0 84
VA 234 Business 73 2 9 18 4 4 110
US 29 (G) and VA 234 Bypass1
76 9 34 20 1 1 141
US 15 5 1 3 5 11 1 26
Grand Total 904 85 157 153 30 37 1,366 1US 29 intersects I-66 twice within the analysis area, first in Gainesville (G) and second in Centreville (C)
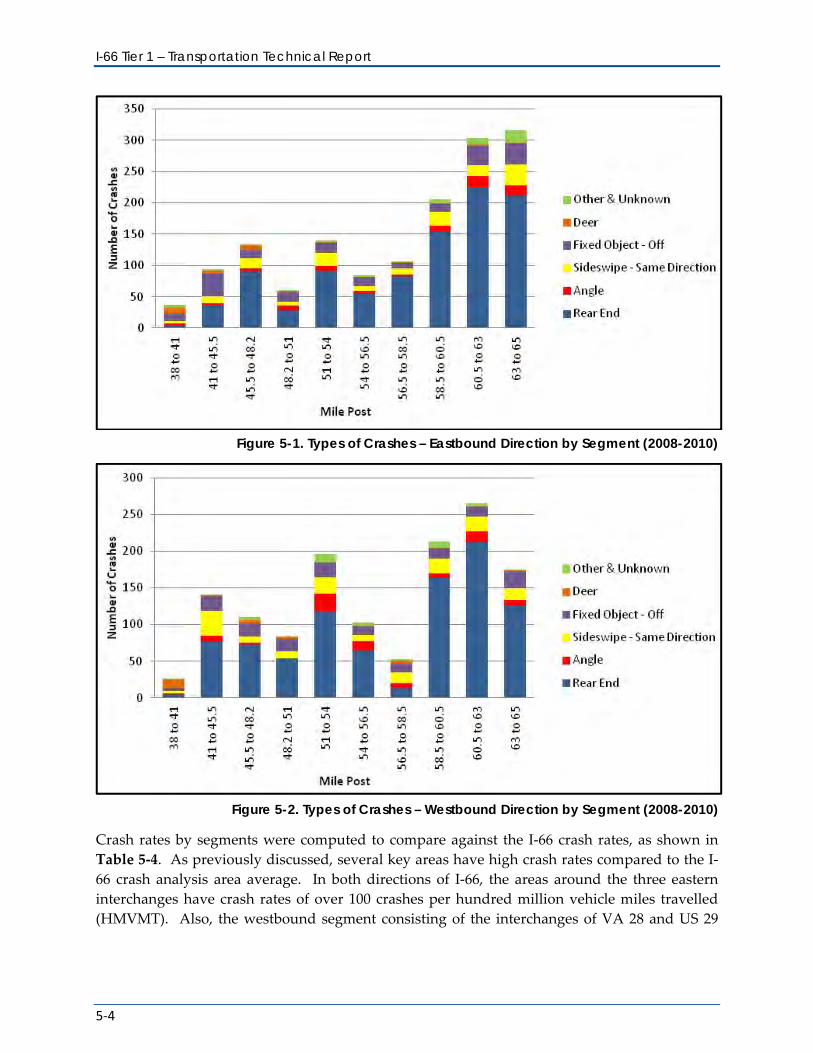
I-66 Tier 1 – Transportation Technical Report
5-4
Figure 5-1. Types of Crashes – Eastbound Direction by Segment (2008-2010)
Figure 5-2. Types of Crashes – Westbound Direction by Segment (2008-2010)
Crash rates by segments were computed to compare against the I-66 crash rates, as shown in Table 5-4. As previously discussed, several key areas have high crash rates compared to the I-66 crash analysis area average. In both directions of I-66, the areas around the three eastern interchanges have crash rates of over 100 crashes per hundred million vehicle miles travelled (HMVMT). Also, the westbound segment consisting of the interchanges of VA 28 and US 29
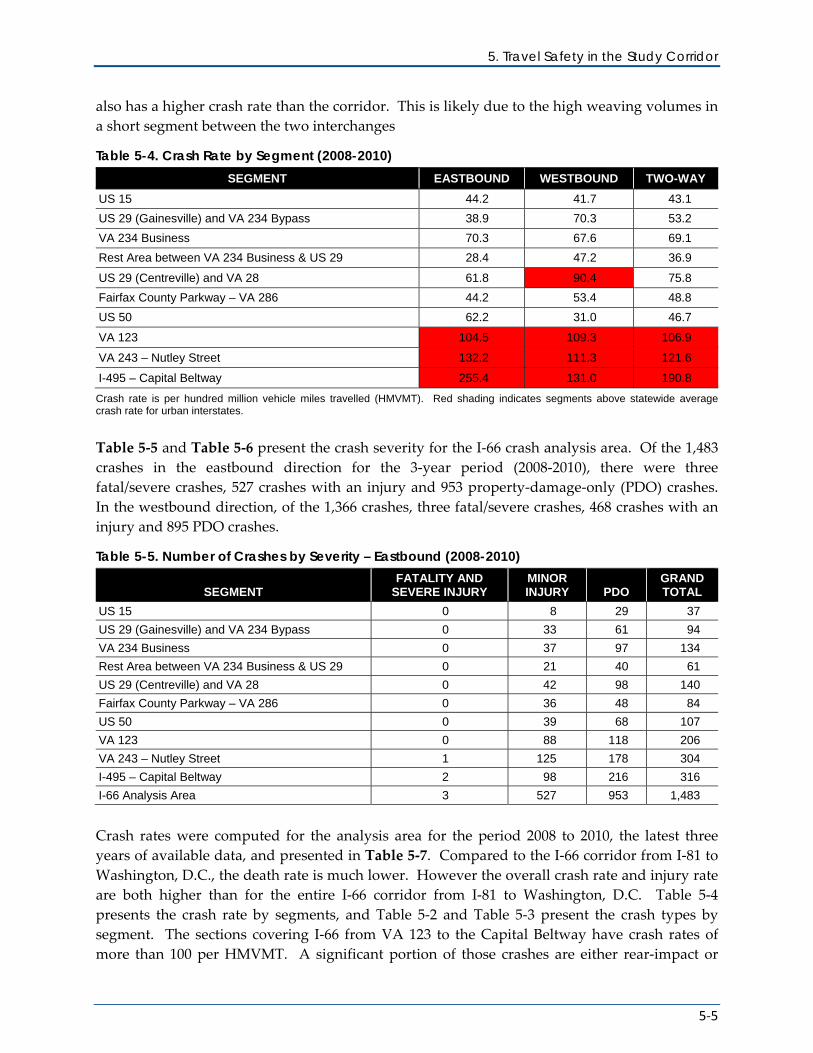
5. Travel Safety in the Study Corridor
5-5
also has a higher crash rate than the corridor. This is likely due to the high weaving volumes in a short segment between the two interchanges
Table 5-4. Crash Rate by Segment (2008-2010) SEGMENT EASTBOUND WESTBOUND TWO-WAY
US 15 44.2 41.7 43.1
US 29 (Gainesville) and VA 234 Bypass 38.9 70.3 53.2
VA 234 Business 70.3 67.6 69.1
Rest Area between VA 234 Business & US 29 28.4 47.2 36.9
US 29 (Centreville) and VA 28 61.8 90.4 75.8
Fairfax County Parkway – VA 286 44.2 53.4 48.8
US 50 62.2 31.0 46.7
VA 123 104.5 109.3 106.9
VA 243 – Nutley Street 132.2 111.3 121.6
I-495 – Capital Beltway 255.4 131.0 190.8
Crash rate is per hundred million vehicle miles travelled (HMVMT). Red shading indicates segments above statewide average crash rate for urban interstates.
Table 5-5 and Table 5-6 present the crash severity for the I-66 crash analysis area. Of the 1,483 crashes in the eastbound direction for the 3-year period (2008-2010), there were three fatal/severe crashes, 527 crashes with an injury and 953 property-damage-only (PDO) crashes. In the westbound direction, of the 1,366 crashes, three fatal/severe crashes, 468 crashes with an injury and 895 PDO crashes.
Table 5-5. Number of Crashes by Severity – Eastbound (2008-2010)
SEGMENT FATALITY AND
SEVERE INJURY MINOR INJURY PDO
GRAND TOTAL
US 15 0 8 29 37
US 29 (Gainesville) and VA 234 Bypass 0 33 61 94
VA 234 Business 0 37 97 134
Rest Area between VA 234 Business & US 29 0 21 40 61
US 29 (Centreville) and VA 28 0 42 98 140
Fairfax County Parkway – VA 286 0 36 48 84
US 50 0 39 68 107
VA 123 0 88 118 206
VA 243 – Nutley Street 1 125 178 304
I-495 – Capital Beltway 2 98 216 316
I-66 Analysis Area 3 527 953 1,483
Crash rates were computed for the analysis area for the period 2008 to 2010, the latest three years of available data, and presented in Table 5-7. Compared to the I-66 corridor from I-81 to Washington, D.C., the death rate is much lower. However the overall crash rate and injury rate are both higher than for the entire I-66 corridor from I-81 to Washington, D.C. Table 5-4 presents the crash rate by segments, and Table 5-2 and Table 5-3 present the crash types by segment. The sections covering I-66 from VA 123 to the Capital Beltway have crash rates of more than 100 per HMVMT. A significant portion of those crashes are either rear-impact or
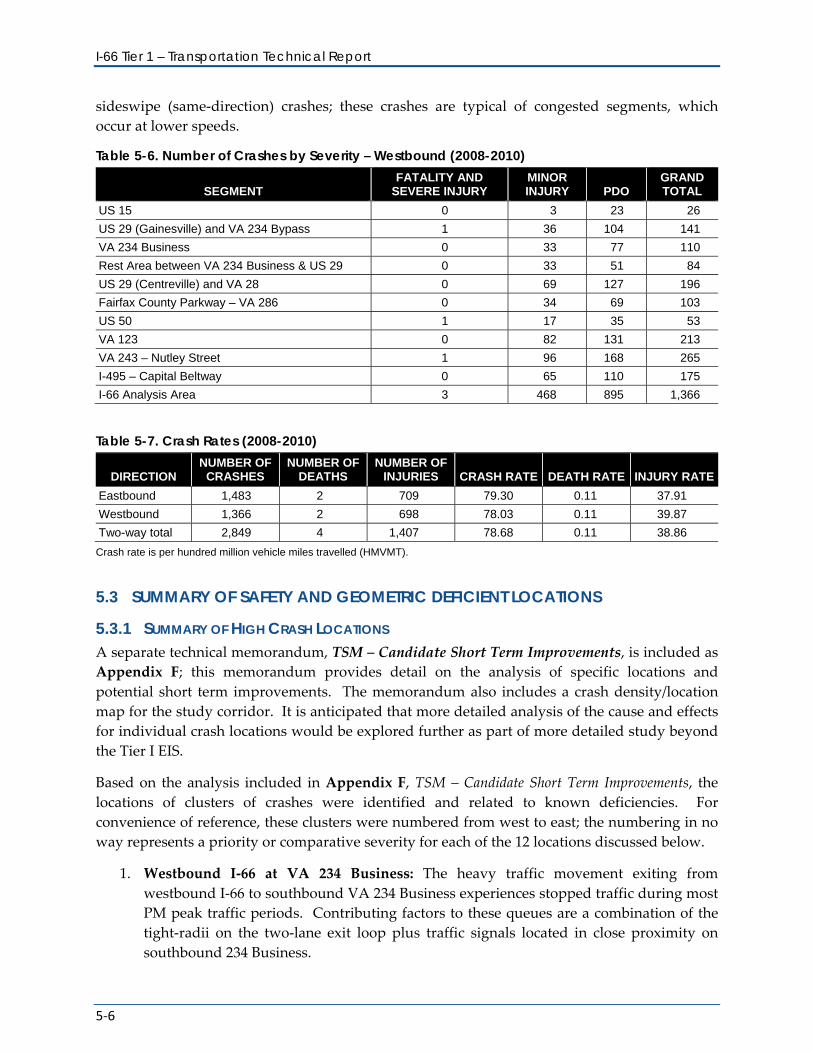
I-66 Tier 1 – Transportation Technical Report
5-6
sideswipe (same-direction) crashes; these crashes are typical of congested segments, which occur at lower speeds.
Table 5-6. Number of Crashes by Severity – Westbound (2008-2010)
SEGMENT FATALITY AND
SEVERE INJURY MINOR INJURY PDO
GRAND TOTAL
US 15 0 3 23 26
US 29 (Gainesville) and VA 234 Bypass 1 36 104 141
VA 234 Business 0 33 77 110
Rest Area between VA 234 Business & US 29 0 33 51 84
US 29 (Centreville) and VA 28 0 69 127 196
Fairfax County Parkway – VA 286 0 34 69 103
US 50 1 17 35 53
VA 123 0 82 131 213
VA 243 – Nutley Street 1 96 168 265
I-495 – Capital Beltway 0 65 110 175
I-66 Analysis Area 3 468 895 1,366
Table 5-7. Crash Rates (2008-2010)
DIRECTION NUMBER OF
CRASHES NUMBER OF
DEATHS NUMBER OF
INJURIES CRASH RATE DEATH RATE INJURY RATE
Eastbound 1,483 2 709 79.30 0.11 37.91
Westbound 1,366 2 698 78.03 0.11 39.87
Two-way total 2,849 4 1,407 78.68 0.11 38.86
Crash rate is per hundred million vehicle miles travelled (HMVMT).
5.3 SUMMARY OF SAFETY AND GEOMETRIC DEFICIENT LOCATIONS
5.3.1 SUMMARY OF HIGH CRASH LOCATIONS A separate technical memorandum, TSM – Candidate Short Term Improvements, is included as Appendix F; this memorandum provides detail on the analysis of specific locations and potential short term improvements. The memorandum also includes a crash density/location map for the study corridor. It is anticipated that more detailed analysis of the cause and effects for individual crash locations would be explored further as part of more detailed study beyond the Tier I EIS.
Based on the analysis included in Appendix F, TSM – Candidate Short Term Improvements, the locations of clusters of crashes were identified and related to known deficiencies. For convenience of reference, these clusters were numbered from west to east; the numbering in no way represents a priority or comparative severity for each of the 12 locations discussed below.
1. Westbound I-66 at VA 234 Business: The heavy traffic movement exiting from westbound I-66 to southbound VA 234 Business experiences stopped traffic during most PM peak traffic periods. Contributing factors to these queues are a combination of the tight-radii on the two-lane exit loop plus traffic signals located in close proximity on southbound 234 Business.
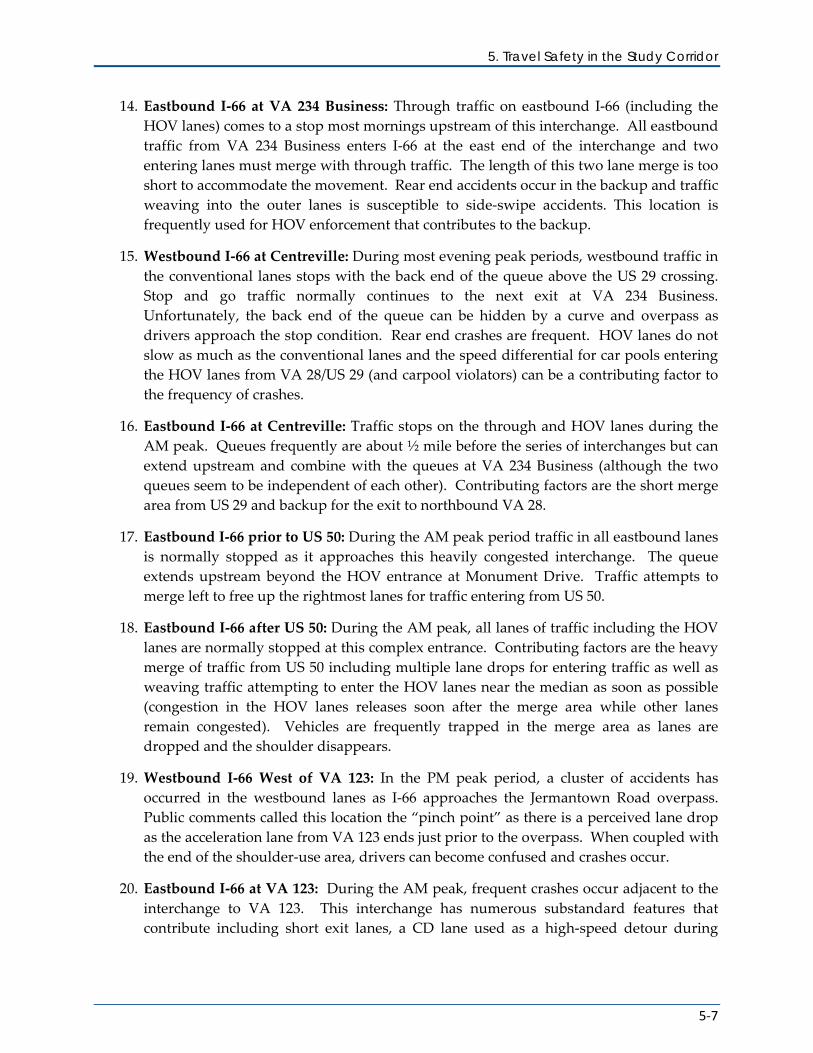
5. Travel Safety in the Study Corridor
5-7
14. Eastbound I-66 at VA 234 Business: Through traffic on eastbound I-66 (including the HOV lanes) comes to a stop most mornings upstream of this interchange. All eastbound traffic from VA 234 Business enters I-66 at the east end of the interchange and two entering lanes must merge with through traffic. The length of this two lane merge is too short to accommodate the movement. Rear end accidents occur in the backup and traffic weaving into the outer lanes is susceptible to side-swipe accidents. This location is frequently used for HOV enforcement that contributes to the backup.
15. Westbound I-66 at Centreville: During most evening peak periods, westbound traffic in the conventional lanes stops with the back end of the queue above the US 29 crossing. Stop and go traffic normally continues to the next exit at VA 234 Business. Unfortunately, the back end of the queue can be hidden by a curve and overpass as drivers approach the stop condition. Rear end crashes are frequent. HOV lanes do not slow as much as the conventional lanes and the speed differential for car pools entering the HOV lanes from VA 28/US 29 (and carpool violators) can be a contributing factor to the frequency of crashes.
16. Eastbound I-66 at Centreville: Traffic stops on the through and HOV lanes during the AM peak. Queues frequently are about ½ mile before the series of interchanges but can extend upstream and combine with the queues at VA 234 Business (although the two queues seem to be independent of each other). Contributing factors are the short merge area from US 29 and backup for the exit to northbound VA 28.
17. Eastbound I-66 prior to US 50: During the AM peak period traffic in all eastbound lanes is normally stopped as it approaches this heavily congested interchange. The queue extends upstream beyond the HOV entrance at Monument Drive. Traffic attempts to merge left to free up the rightmost lanes for traffic entering from US 50.
18. Eastbound I-66 after US 50: During the AM peak, all lanes of traffic including the HOV lanes are normally stopped at this complex entrance. Contributing factors are the heavy merge of traffic from US 50 including multiple lane drops for entering traffic as well as weaving traffic attempting to enter the HOV lanes near the median as soon as possible (congestion in the HOV lanes releases soon after the merge area while other lanes remain congested). Vehicles are frequently trapped in the merge area as lanes are dropped and the shoulder disappears.
19. Westbound I-66 West of VA 123: In the PM peak period, a cluster of accidents has occurred in the westbound lanes as I-66 approaches the Jermantown Road overpass. Public comments called this location the “pinch point” as there is a perceived lane drop as the acceleration lane from VA 123 ends just prior to the overpass. When coupled with the end of the shoulder-use area, drivers can become confused and crashes occur.
20. Eastbound I-66 at VA 123: During the AM peak, frequent crashes occur adjacent to the interchange to VA 123. This interchange has numerous substandard features that contribute including short exit lanes, a CD lane used as a high-speed detour during
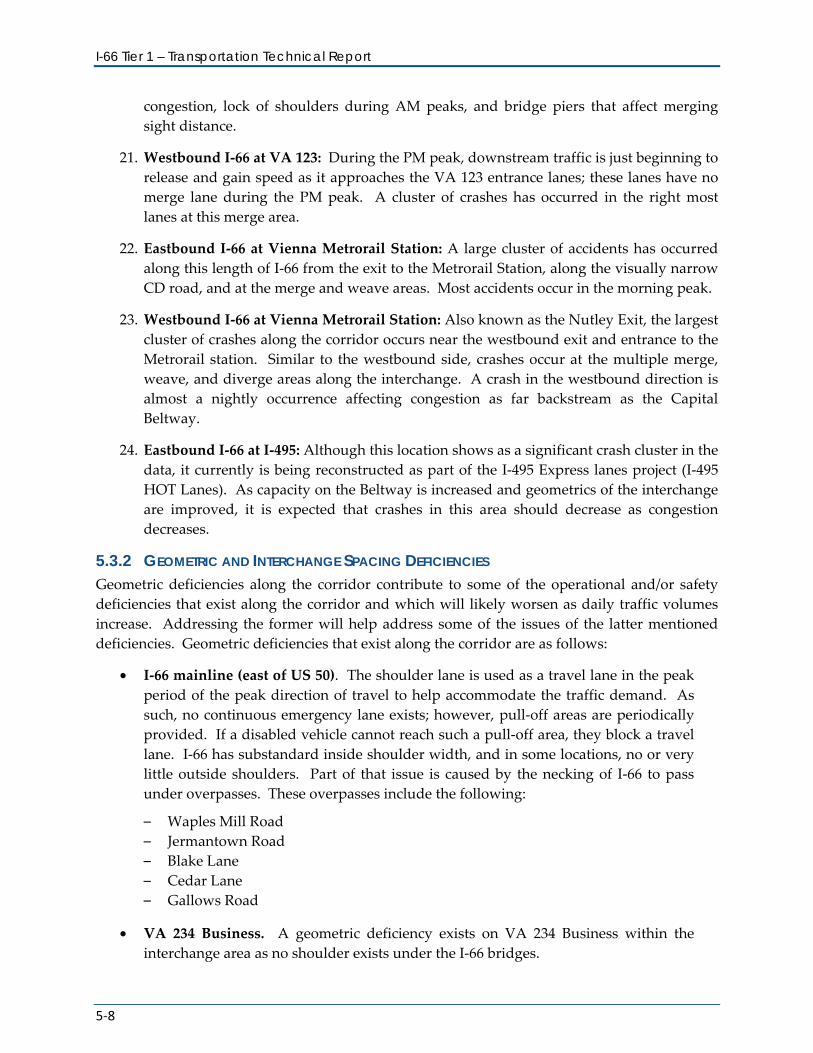
I-66 Tier 1 – Transportation Technical Report
5-8
congestion, lock of shoulders during AM peaks, and bridge piers that affect merging sight distance.
21. Westbound I-66 at VA 123: During the PM peak, downstream traffic is just beginning to release and gain speed as it approaches the VA 123 entrance lanes; these lanes have no merge lane during the PM peak. A cluster of crashes has occurred in the right most lanes at this merge area.
22. Eastbound I-66 at Vienna Metrorail Station: A large cluster of accidents has occurred along this length of I-66 from the exit to the Metrorail Station, along the visually narrow CD road, and at the merge and weave areas. Most accidents occur in the morning peak.
23. Westbound I-66 at Vienna Metrorail Station: Also known as the Nutley Exit, the largest cluster of crashes along the corridor occurs near the westbound exit and entrance to the Metrorail station. Similar to the westbound side, crashes occur at the multiple merge, weave, and diverge areas along the interchange. A crash in the westbound direction is almost a nightly occurrence affecting congestion as far backstream as the Capital Beltway.
24. Eastbound I-66 at I-495: Although this location shows as a significant crash cluster in the data, it currently is being reconstructed as part of the I-495 Express lanes project (I-495 HOT Lanes). As capacity on the Beltway is increased and geometrics of the interchange are improved, it is expected that crashes in this area should decrease as congestion decreases.
5.3.2 GEOMETRIC AND INTERCHANGE SPACING DEFICIENCIES Geometric deficiencies along the corridor contribute to some of the operational and/or safety deficiencies that exist along the corridor and which will likely worsen as daily traffic volumes increase. Addressing the former will help address some of the issues of the latter mentioned deficiencies. Geometric deficiencies that exist along the corridor are as follows:
• I-66 mainline (east of US 50). The shoulder lane is used as a travel lane in the peak period of the peak direction of travel to help accommodate the traffic demand. As such, no continuous emergency lane exists; however, pull-off areas are periodically provided. If a disabled vehicle cannot reach such a pull-off area, they block a travel lane. I-66 has substandard inside shoulder width, and in some locations, no or very little outside shoulders. Part of that issue is caused by the necking of I-66 to pass under overpasses. These overpasses include the following:
– Waples Mill Road – Jermantown Road – Blake Lane – Cedar Lane – Gallows Road
• VA 234 Business. A geometric deficiency exists on VA 234 Business within the interchange area as no shoulder exists under the I-66 bridges.
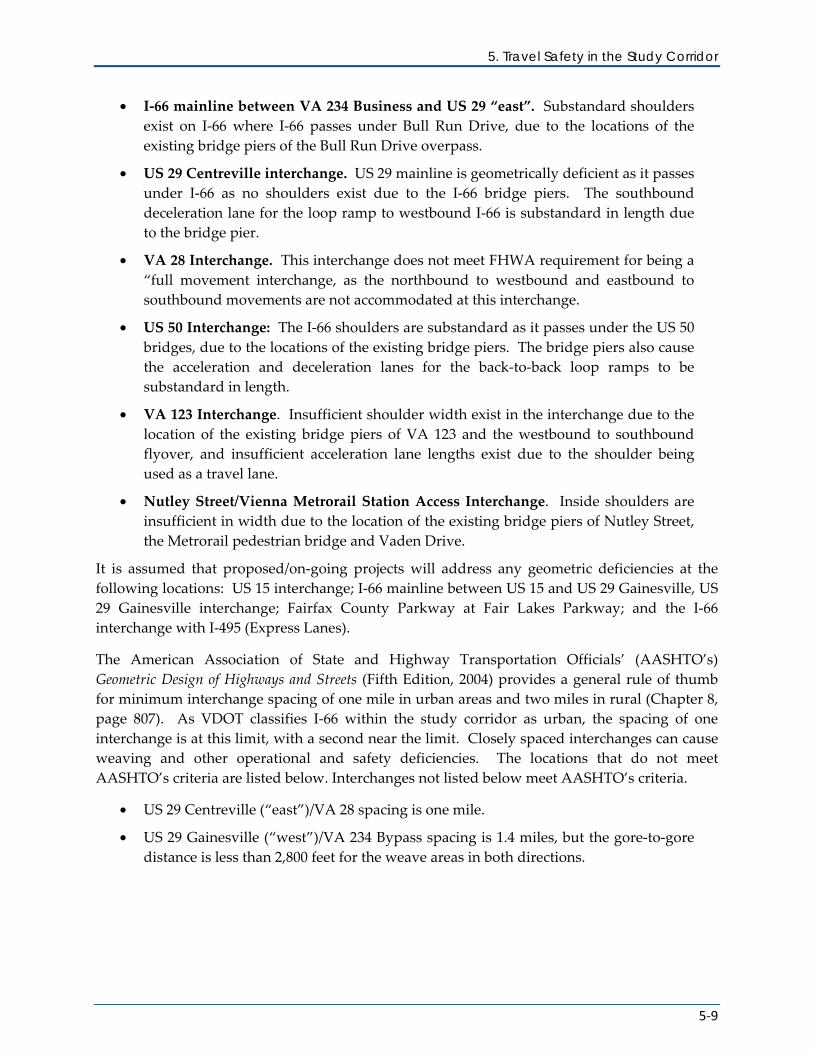
5. Travel Safety in the Study Corridor
5-9
• I-66 mainline between VA 234 Business and US 29 “east”. Substandard shoulders exist on I-66 where I-66 passes under Bull Run Drive, due to the locations of the existing bridge piers of the Bull Run Drive overpass.
• US 29 Centreville interchange. US 29 mainline is geometrically deficient as it passes under I-66 as no shoulders exist due to the I-66 bridge piers. The southbound deceleration lane for the loop ramp to westbound I-66 is substandard in length due to the bridge pier.
• VA 28 Interchange. This interchange does not meet FHWA requirement for being a “full movement interchange, as the northbound to westbound and eastbound to southbound movements are not accommodated at this interchange.
• US 50 Interchange: The I-66 shoulders are substandard as it passes under the US 50 bridges, due to the locations of the existing bridge piers. The bridge piers also cause the acceleration and deceleration lanes for the back-to-back loop ramps to be substandard in length.
• VA 123 Interchange. Insufficient shoulder width exist in the interchange due to the location of the existing bridge piers of VA 123 and the westbound to southbound flyover, and insufficient acceleration lane lengths exist due to the shoulder being used as a travel lane.
• Nutley Street/Vienna Metrorail Station Access Interchange. Inside shoulders are insufficient in width due to the location of the existing bridge piers of Nutley Street, the Metrorail pedestrian bridge and Vaden Drive.
It is assumed that proposed/on-going projects will address any geometric deficiencies at the following locations: US 15 interchange; I-66 mainline between US 15 and US 29 Gainesville, US 29 Gainesville interchange; Fairfax County Parkway at Fair Lakes Parkway; and the I-66 interchange with I-495 (Express Lanes).
The American Association of State and Highway Transportation Officials’ (AASHTO’s) Geometric Design of Highways and Streets (Fifth Edition, 2004) provides a general rule of thumb for minimum interchange spacing of one mile in urban areas and two miles in rural (Chapter 8, page 807). As VDOT classifies I-66 within the study corridor as urban, the spacing of one interchange is at this limit, with a second near the limit. Closely spaced interchanges can cause weaving and other operational and safety deficiencies. The locations that do not meet AASHTO’s criteria are listed below. Interchanges not listed below meet AASHTO’s criteria.
• US 29 Centreville (“east”)/VA 28 spacing is one mile.
• US 29 Gainesville (“west”)/VA 234 Bypass spacing is 1.4 miles, but the gore-to-gore distance is less than 2,800 feet for the weave areas in both directions.

I-66 Tier 1 – Transportation Technical Report
5-10
6-1
6 TRAVEL PATTERNS AND FUTURE TRAVEL DEMAND
This section describes the technical approach and assumptions for the travel demand modeling performed for the study and the process used to develop the 2040 forecasts.
6.1 OVERVIEW OF TRAVEL PATTERNS The primary tool and data set used to support the planning efforts in this study for identifying and testing the future No-Build concept as well as the various improvement concepts is the MWCOG regional travel demand model. In simple terms, travel demand models seek to replicate real-world travel by estimating the total number of trips going between geographic areas within the region (termed transportation analysis zones, or TAZ’s) and assigning those trips to paths between the TAZ’s. Although the primary method of validating a model is comparing link volumes (which represents the sum of all trips traveling on each of the model’s roadway links) to actual traffic counts, the models do, by definition, estimate travel patterns (i.e., where people go to and from). The MWCOG model also makes use of periodic travel surveys that allow for increased confidence that the model provides a reasonable tool for estimating travel patterns at a high level, and it also provides a good tool for estimating future travel patterns, since even origin-destination surveys only provide information on existing patterns. The discussion below describes travel patterns in the study corridor using the MWCOG model; at the higher level of detail that may be required in Tier 2 studies, it may be desirable, at the time of those studies, to collect new origin-destination data.
6.1.1 HIGHWAY TRAVEL PATTERNS I-66 in the study corridor connects a variety of land uses and activity centers. These include relatively low density residential and agricultural areas, bedroom communities, major retail and employment centers both immediately within the study corridor and within a few miles of the study corridor, and the region’s urban core consisting of Arlington and Washington, D.C. I-66 also connects to key roadways such as US 50 and I-495, and the segment of the Metrorail Orange Line within the study corridor extends into Washington, D.C. and the region as a whole. Traffic volumes (year 2011) on I-66 range from 57,600 vehicles per day (vpd) just east of US 15 to a high of 191,400 vpd just west of Nutley Street. Just as the volumes vary within the corridor, the origins and destinations of trips in the corridor also vary. Table 6-1,
Table 6-2 and Table 6-3 summarize where traffic enters and exits the corridor. Two key observations from the base year data shown in the tables are:
• Only a small proportion of traffic travels entirely through the corridor. For example, of the traffic between Nutley Street and the Capital Beltway, only 7 percent of the eastbound traffic in the morning starts west of US 15 and 42 percent of the traffic enters I-66 at either Route 123 or Nutley Street.
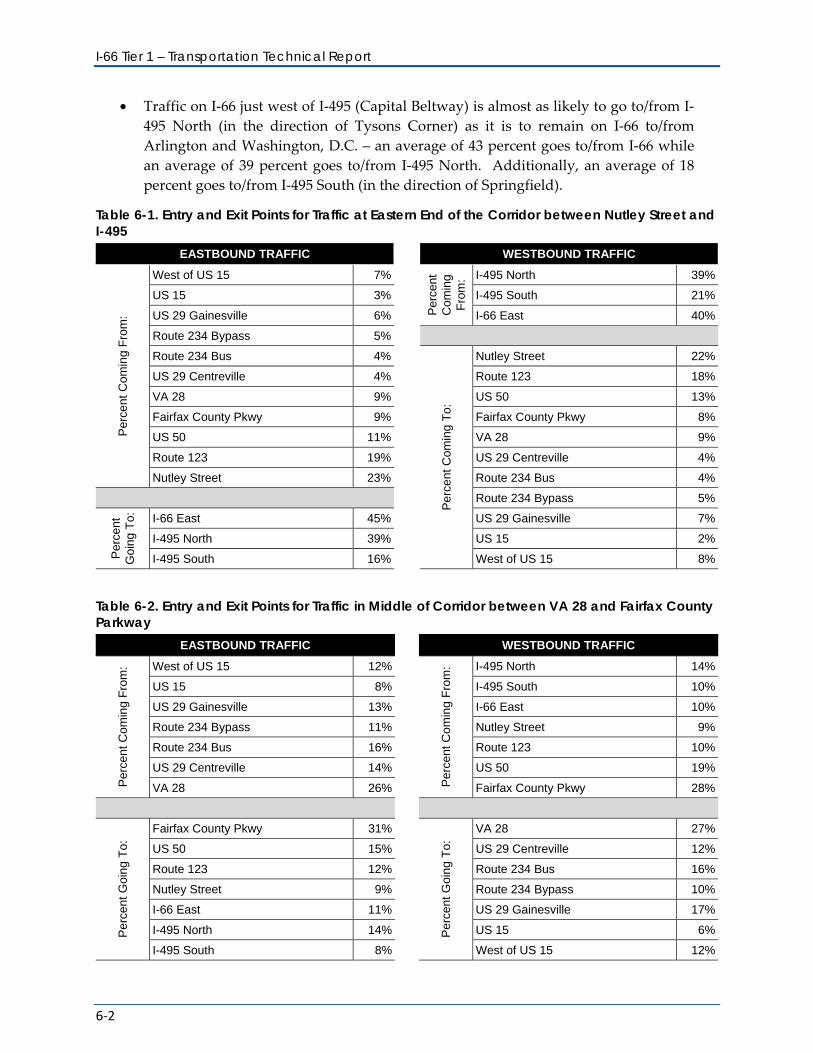
I-66 Tier 1 – Transportation Technical Report
6-2
• Traffic on I-66 just west of I-495 (Capital Beltway) is almost as likely to go to/from I-495 North (in the direction of Tysons Corner) as it is to remain on I-66 to/from Arlington and Washington, D.C. – an average of 43 percent goes to/from I-66 while an average of 39 percent goes to/from I-495 North. Additionally, an average of 18 percent goes to/from I-495 South (in the direction of Springfield).
Table 6-1. Entry and Exit Points for Traffic at Eastern End of the Corridor between Nutley Street and I-495
EASTBOUND TRAFFIC WESTBOUND TRAFFIC
Per
cent
Com
ing
Fro
m:
West of US 15 7%
Per
cent
C
omin
g F
rom
: I-495 North 39%
US 15 3% I-495 South 21%
US 29 Gainesville 6% I-66 East 40%
Route 234 Bypass 5%
Route 234 Bus 4%
Per
cent
Com
ing
To:
Nutley Street 22%
US 29 Centreville 4% Route 123 18%
VA 28 9% US 50 13%
Fairfax County Pkwy 9% Fairfax County Pkwy 8%
US 50 11% VA 28 9%
Route 123 19% US 29 Centreville 4%
Nutley Street 23% Route 234 Bus 4%
Route 234 Bypass 5%
Per
cent
G
oing
To:
I-66 East 45% US 29 Gainesville 7%
I-495 North 39% US 15 2%
I-495 South 16% West of US 15 8%
Table 6-2. Entry and Exit Points for Traffic in Middle of Corridor between VA 28 and Fairfax County Parkway
EASTBOUND TRAFFIC
WESTBOUND TRAFFIC
Per
cent
Com
ing
Fro
m: West of US 15 12%
Per
cent
Com
ing
Fro
m: I-495 North 14%
US 15 8% I-495 South 10%
US 29 Gainesville 13% I-66 East 10%
Route 234 Bypass 11% Nutley Street 9%
Route 234 Bus 16% Route 123 10%
US 29 Centreville 14% US 50 19%
VA 28 26% Fairfax County Pkwy 28%
Per
cent
Goi
ng
To:
Fairfax County Pkwy 31%
Per
cent
Goi
ng
To:
VA 28 27%
US 50 15% US 29 Centreville 12%
Route 123 12% Route 234 Bus 16%
Nutley Street 9% Route 234 Bypass 10%
I-66 East 11% US 29 Gainesville 17%
I-495 North 14% US 15 6%
I-495 South 8% West of US 15 12%
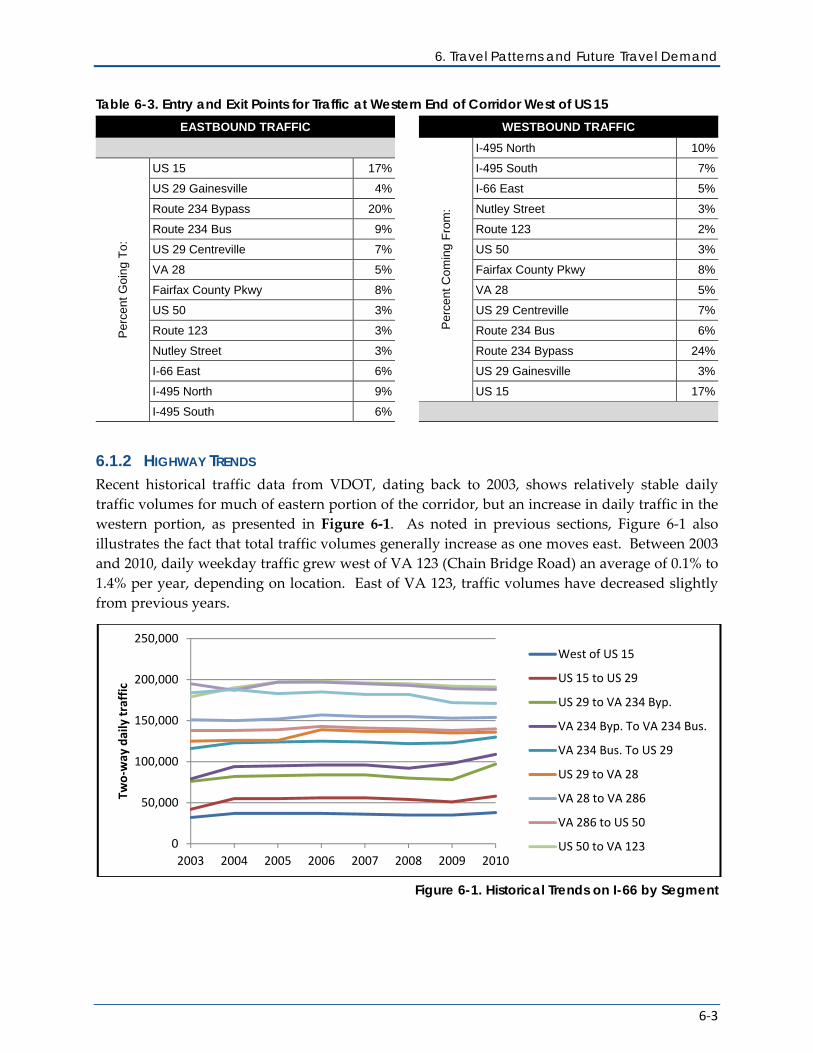
6. Travel Patterns and Future Travel Demand
6-3
Table 6-3. Entry and Exit Points for Traffic at Western End of Corridor West of US 15 EASTBOUND TRAFFIC
WESTBOUND TRAFFIC
Per
cent
Com
ing
Fro
m:
I-495 North 10%
Per
cent
Goi
ng
To:
US 15 17% I-495 South 7%
US 29 Gainesville 4% I-66 East 5%
Route 234 Bypass 20% Nutley Street 3%
Route 234 Bus 9% Route 123 2%
US 29 Centreville 7% US 50 3%
VA 28 5% Fairfax County Pkwy 8%
Fairfax County Pkwy 8% VA 28 5%
US 50 3% US 29 Centreville 7%
Route 123 3% Route 234 Bus 6%
Nutley Street 3% Route 234 Bypass 24%
I-66 East 6% US 29 Gainesville 3%
I-495 North 9% US 15 17%
I-495 South 6%
6.1.2 HIGHWAY TRENDS Recent historical traffic data from VDOT, dating back to 2003, shows relatively stable daily traffic volumes for much of eastern portion of the corridor, but an increase in daily traffic in the western portion, as presented in Figure 6-1. As noted in previous sections, Figure 6-1 also illustrates the fact that total traffic volumes generally increase as one moves east. Between 2003 and 2010, daily weekday traffic grew west of VA 123 (Chain Bridge Road) an average of 0.1% to 1.4% per year, depending on location. East of VA 123, traffic volumes have decreased slightly from previous years.
Figure 6-1. Historical Trends on I-66 by Segment
0
50,000
100,000
150,000
200,000
250,000
2003 2004 2005 2006 2007 2008 2009 2010
Two-
way
dai
ly tr
affic
West of US 15
US 15 to US 29
US 29 to VA 234 Byp.
VA 234 Byp. To VA 234 Bus.
VA 234 Bus. To US 29
US 29 to VA 28
VA 28 to VA 286
VA 286 to US 50
US 50 to VA 123
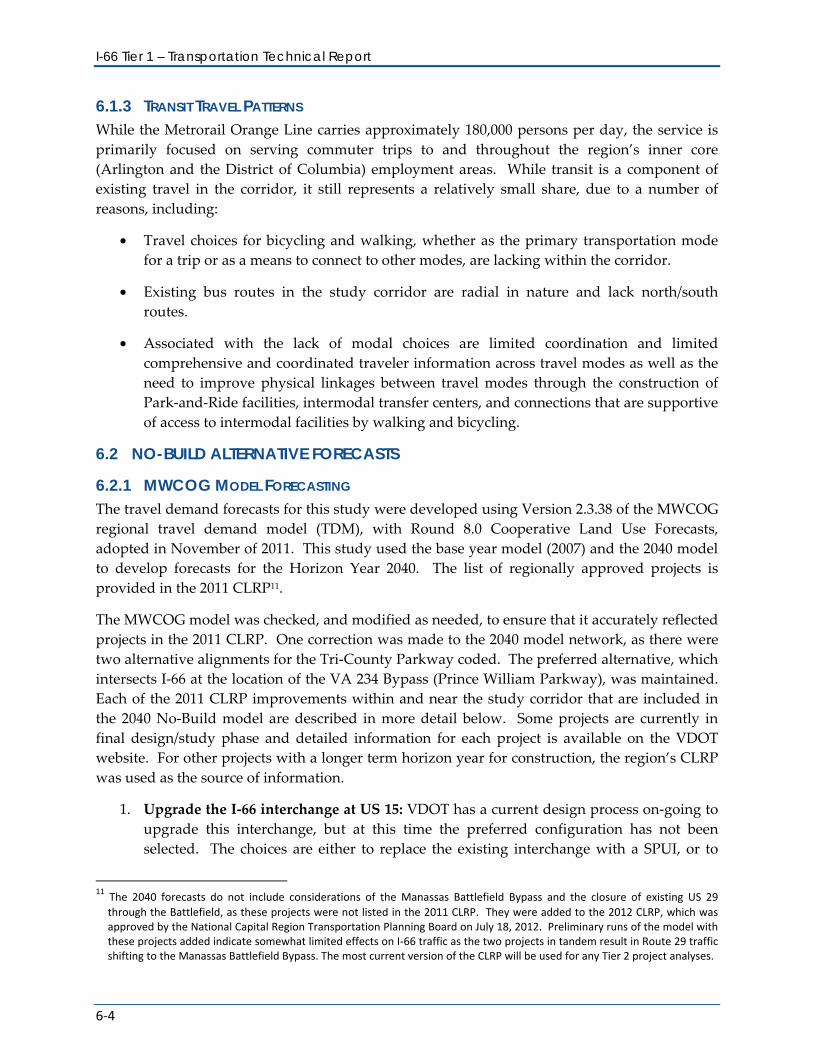
I-66 Tier 1 – Transportation Technical Report
6-4
6.1.3 TRANSIT TRAVEL PATTERNS While the Metrorail Orange Line carries approximately 180,000 persons per day, the service is primarily focused on serving commuter trips to and throughout the region’s inner core (Arlington and the District of Columbia) employment areas. While transit is a component of existing travel in the corridor, it still represents a relatively small share, due to a number of reasons, including:
• Travel choices for bicycling and walking, whether as the primary transportation mode for a trip or as a means to connect to other modes, are lacking within the corridor.
• Existing bus routes in the study corridor are radial in nature and lack north/south routes.
• Associated with the lack of modal choices are limited coordination and limited comprehensive and coordinated traveler information across travel modes as well as the need to improve physical linkages between travel modes through the construction of Park-and-Ride facilities, intermodal transfer centers, and connections that are supportive of access to intermodal facilities by walking and bicycling.
6.2 NO-BUILD ALTERNATIVE FORECASTS
6.2.1 MWCOG MODEL FORECASTING The travel demand forecasts for this study were developed using Version 2.3.38 of the MWCOG regional travel demand model (TDM), with Round 8.0 Cooperative Land Use Forecasts, adopted in November of 2011. This study used the base year model (2007) and the 2040 model to develop forecasts for the Horizon Year 2040. The list of regionally approved projects is provided in the 2011 CLRP11.
The MWCOG model was checked, and modified as needed, to ensure that it accurately reflected projects in the 2011 CLRP. One correction was made to the 2040 model network, as there were two alternative alignments for the Tri-County Parkway coded. The preferred alternative, which intersects I-66 at the location of the VA 234 Bypass (Prince William Parkway), was maintained. Each of the 2011 CLRP improvements within and near the study corridor that are included in the 2040 No-Build model are described in more detail below. Some projects are currently in final design/study phase and detailed information for each project is available on the VDOT website. For other projects with a longer term horizon year for construction, the region’s CLRP was used as the source of information.
1. Upgrade the I-66 interchange at US 15: VDOT has a current design process on-going to upgrade this interchange, but at this time the preferred configuration has not been selected. The choices are either to replace the existing interchange with a SPUI, or to
11 The 2040 forecasts do not include considerations of the Manassas Battlefield Bypass and the closure of existing US 29
through the Battlefield, as these projects were not listed in the 2011 CLRP. They were added to the 2012 CLRP, which was approved by the National Capital Region Transportation Planning Board on July 18, 2012. Preliminary runs of the model with these projects added indicate somewhat limited effects on I-66 traffic as the two projects in tandem result in Route 29 traffic shifting to the Manassas Battlefield Bypass. The most current version of the CLRP will be used for any Tier 2 project analyses.
6. Travel Patterns and Future Travel Demand
6-5
add a southbound to eastbound flyover to the existing configuration. Any planned improvements will be compatible with the planned widening of I-66 in this area. A public hearing is slated for the fall of 2012 and approval of the design would occur in 2013. Construction, at this time, is scheduled to commence in 2014.12
2. I-66 Widening: I-66 would be widened from four lanes to eight lanes from US 29 (Gainesville) to US 15, as part of the next phase of the I-66 widening projects in Prince William County. The inside (median) lane would be an HOV lane during the peak period of the peak direction of flow. Construction is scheduled to start in 2013 with a completion date of 2015.13
3. Widening of US 15: This two-lane, two-way facility from US 29 to I-66, would be widened to four lanes: This project is listed in the CLRP with a completion date of 2040.
4. Construct a Single Point Urban Interchange (SPUI) on US 29: A SPUI is currently being constructed at the intersection with US 29 and Linton Hall Road to replace the signalized intersection. US 29 through traffic will be grade-separated from the other movements. The proposed improvements will integrate with the recently reconstructed I-66/US 29 interchange, as the project is a phased improvement of the overall planned improvements in this area. This project is slated to be completed in June 2015.14
5. Construct the Tri-County Parkway: This project is still under NEPA re-evaluation and the approved alignment is the West Two Alternative15 (Alignment C-D). This alignment is the extension of VA 234 Bypass to US 50 in the Arcola area. The CLRP lists this project with a completion date of 2035.
6. Widen VA 28: This facility would be widened from six to eight lanes from I-66 to VA 7; the CLRP lists this project with a completion date of 2025.
7. Fairfax County Parkway improvements: Multiple projects area listed for this facility:
– Construct interchange: the two existing signalized intersections at Fair Lakes Parkway and Monument drive would be replaced by an interchange serving both cross-streets. As the interchange is constructed, additional pavement is being incorporated to accommodate the planned HOV lanes on the FCP. This project is slated to be completed in 2013.16
– HOV lanes: add HOV lanes on FCP from I-66 to Dulles Toll Road, the CLRP lists this project with a completion date of 2035.
– Widen: widen FCP from four to six lanes from I-66 to VA 123, the CLRP lists this project with a completion date of 2020.
12 http://www.virginiadot.org/projects/northernvirginia/i-66_and_route_15_interchange.asp 13 http://www.virginiadot.org/projects/northernvirginia/i-66_widening.asp 14 http://www.virginiadot.org/projects/northernvirginia/gainesville_improvements.asp 15 http://www.virginiadot.org/projects/northernvirginia/tri-county_parkway_location_study.asp 16 http://www.virginiadot.org/projects/northernvirginia/fairfax_county_parkway-fair_lakes.asp
I-66 Tier 1 – Transportation Technical Report
6-6
8. Bus-only ramps at Vienna Metrorail Station: To facilitate improved access to/from the west for buses, ramps connecting the HOV lanes to Saintsbury Drive or Vaden Drive would be constructed. Preferred configuration has not yet been adopted. This project is slated to be released for construction in 2014.17
9. I-66 Pavement Rehabilitation: VDOT is rehabilitating the concrete pavement of I-66 from US 50 to the Capital Beltway. Process is to perform concrete patching and final surface paving, as well as guard rail improvements and ITS improvements. No capacity improvements are part of this project. Project will be completed in the fall of 2012.18
10. Improvements at I-66/Beltway Interchange: The Capital Beltway HOT Lanes project (495 Express Lanes) is reconstructing this interchange to incorporate Express Lanes on the Beltway. The project will tie into the existing cross-section on I-66, and is slated to be completed in late 2012.
The other key inputs to the 2040 travel forecasting process are forecasts for population and employment in the region, particularly in areas that serve as the travelshed for the study corridor. The population and employment along the I-66 corridor (meaning beyond the study corridor) is expected to grow significantly. Figure 6-2 shows the existing 2011 and 2040 population and employment levels for the greater area beyond the I-66 study corridor. Substantial residential growth is expected to occur in the western end of the I-66 corridor. Likewise the eastern end of the I-66 corridor, like Tysons Corner, is expected to have substantial employment growth. Since residential growth is to the west and employment growth is to the east, the existing commuting patterns of eastbound AM and westbound PM trip patterns are expected to continue (and increase) and will cause significant strain on transportation facilities in the I-66 corridor.
6.2.2 NO-BUILD CONDITIONS ROADWAY FORECASTS The year 2040 No-Build forecasts, as predicted by the MWCOG model, indicate substantial growth along the corridor, particularly in the western half. Traffic is expected to more than double west of Gainesville. Between the two interchanges with US 29, traffic will grow between 35-66%, and further east, the total growth will be 10-23%. Figure 6-3 illustrates this expected growth in traffic.
The 2040 No-Build model forecasts were used to develop the AM, PM and Daily volumes for analysis area. The process was to extract the AM and PM peak period and Daily link volumes from the model. The model prepares a three-hour AM peak period, and to convert to peak hour, the model output was factored by 0.417, the conversion ratio from peak period to peak hour per MWCOG. The PM peak period forecasts are a four-hour forecast, and were converted to peak hour by using a factor of 0.294, per the MWCOG ratio. Once the peak hour link volumes were extracted, interchange ramp volumes and intersection turn movement volumes were developed. Turn movements were estimated using an iterative matrix factoring and balancing technique based on a standard transportation engineering technique known as Fratar. 17 http://www.virginiadot.org/projects/northernvirginia/vienna_metro_access_ramps.asp 18 http://www.virginiadot.org/projects/northernvirginia/i-66_pavement_rehabilitation.asp
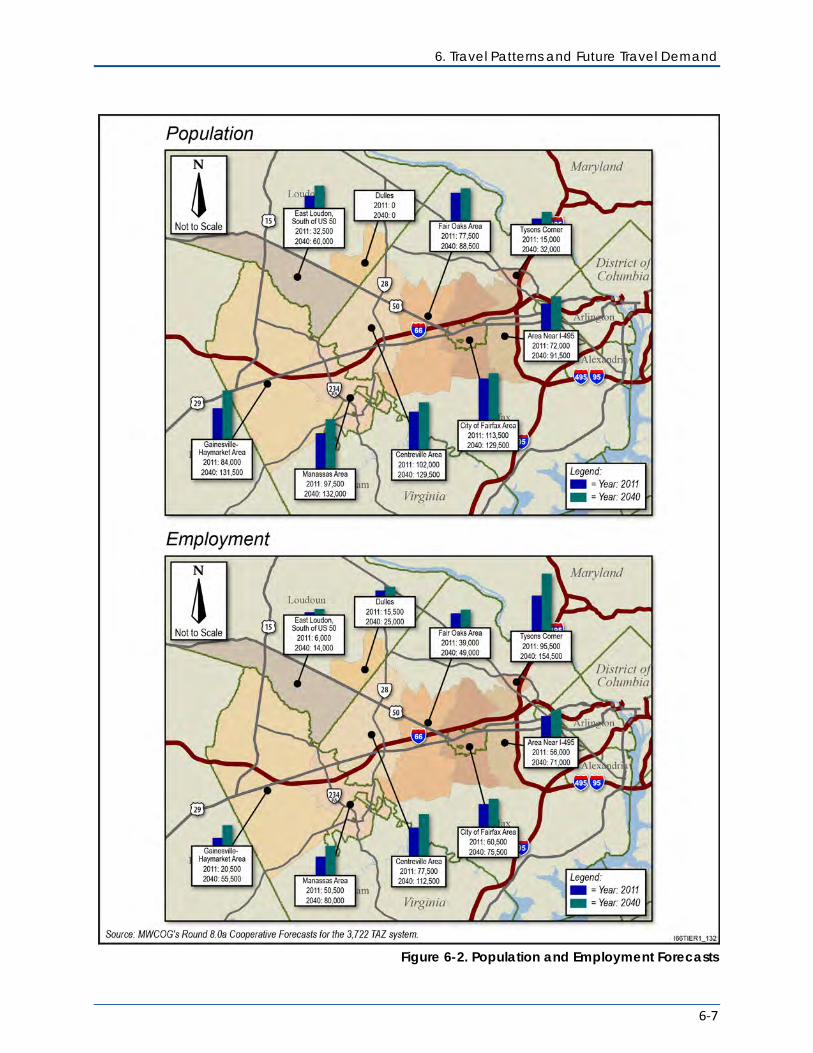
6. Travel Patterns and Future Travel Demand
6-7
Figure 6-2. Population and Employment Forecasts
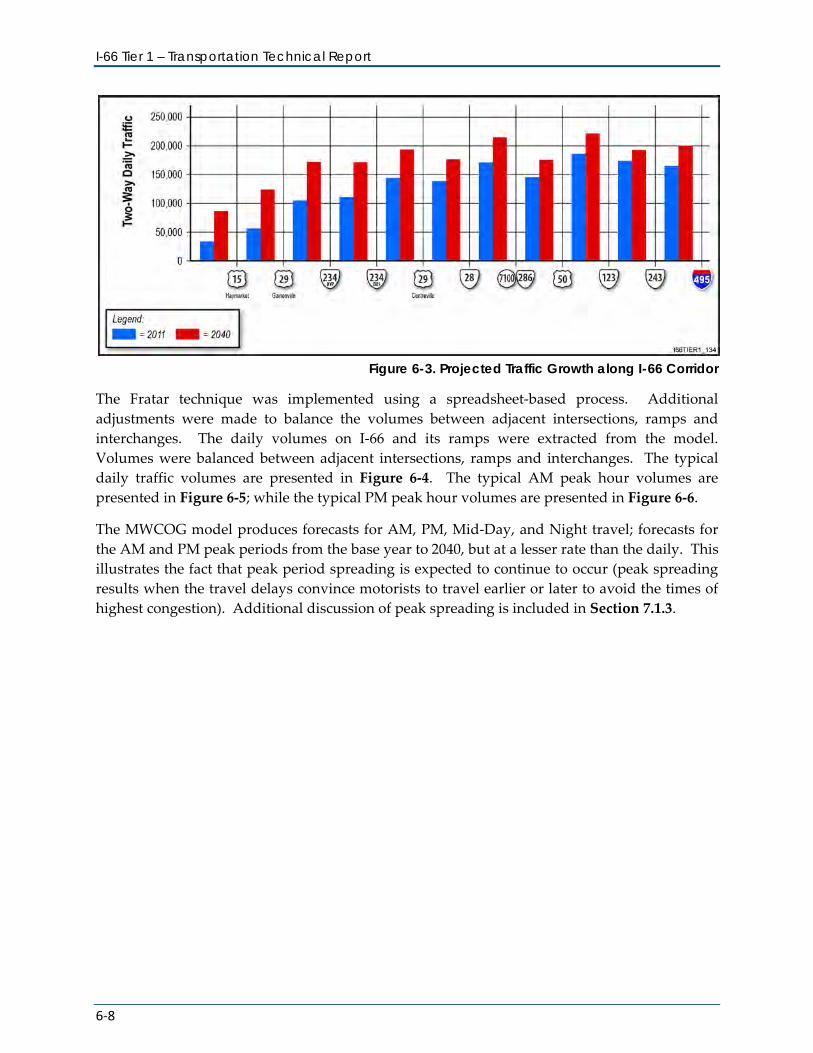
I-66 Tier 1 – Transportation Technical Report
6-8
Figure 6-3. Projected Traffic Growth along I-66 Corridor
The Fratar technique was implemented using a spreadsheet-based process. Additional adjustments were made to balance the volumes between adjacent intersections, ramps and interchanges. The daily volumes on I-66 and its ramps were extracted from the model. Volumes were balanced between adjacent intersections, ramps and interchanges. The typical daily traffic volumes are presented in Figure 6-4. The typical AM peak hour volumes are presented in Figure 6-5; while the typical PM peak hour volumes are presented in Figure 6-6.
The MWCOG model produces forecasts for AM, PM, Mid-Day, and Night travel; forecasts for the AM and PM peak periods from the base year to 2040, but at a lesser rate than the daily. This illustrates the fact that peak period spreading is expected to continue to occur (peak spreading results when the travel delays convince motorists to travel earlier or later to avoid the times of highest congestion). Additional discussion of peak spreading is included in Section 7.1.3.
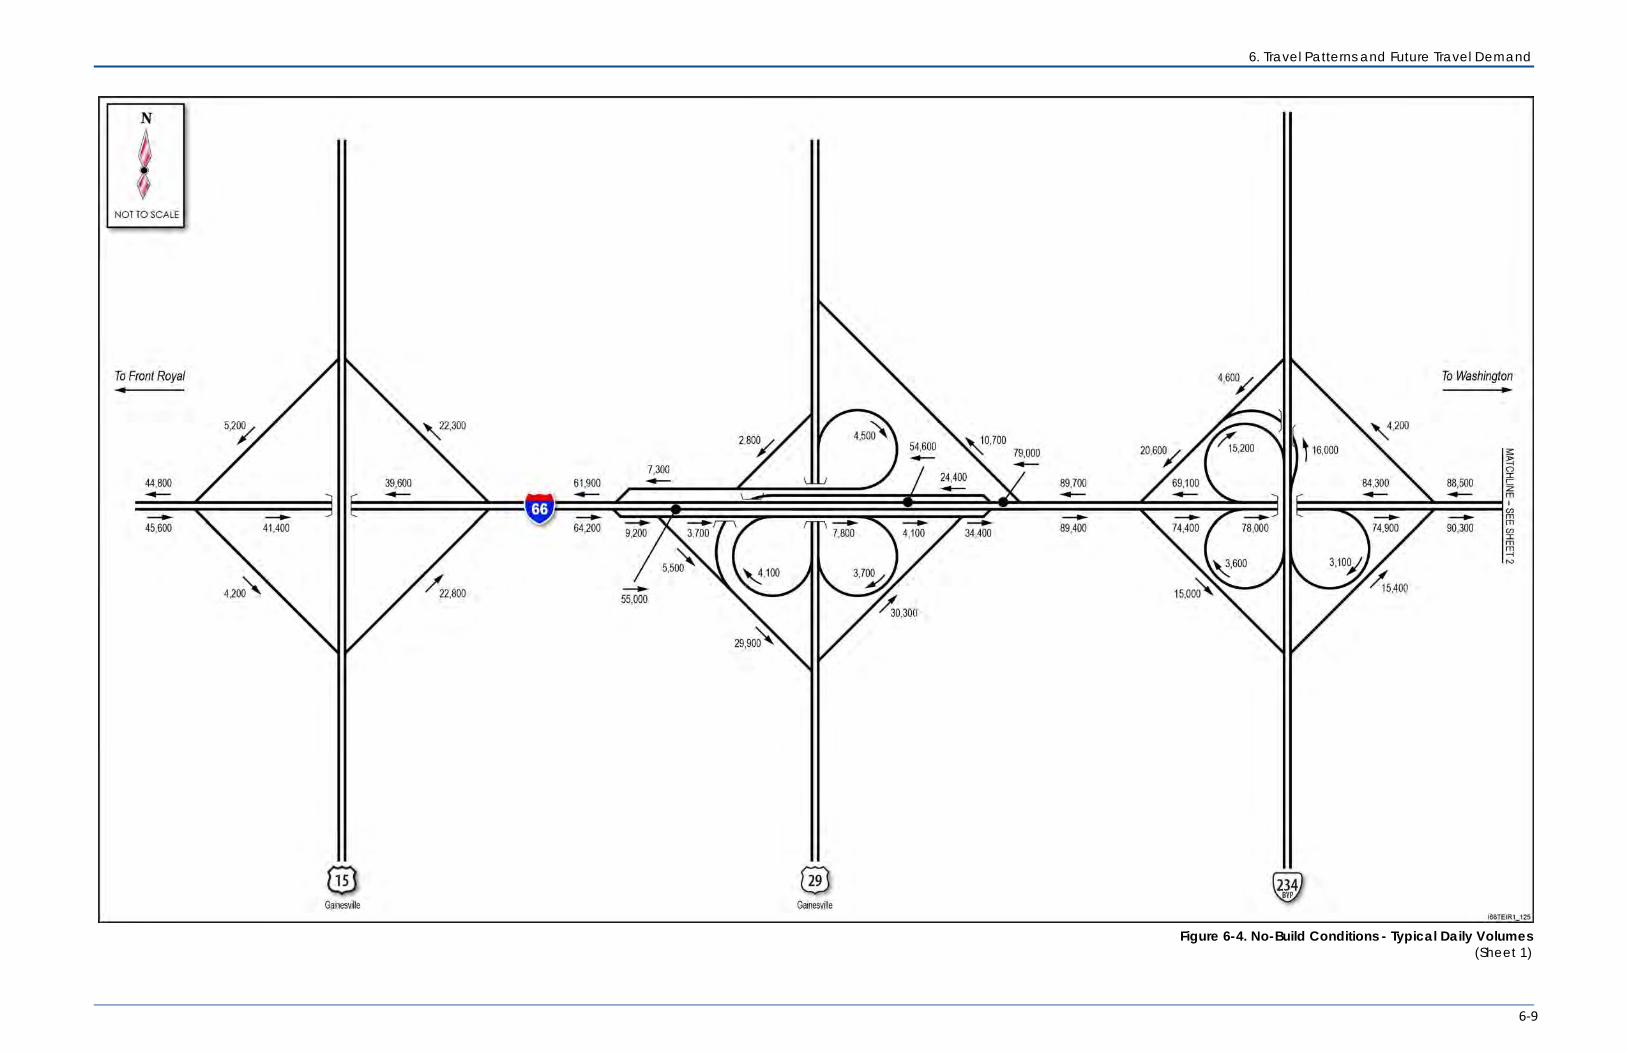
6. Travel Patterns and Future Travel Demand
6-9
Figure 6-4. No-Build Conditions - Typical Daily Volumes
(Sheet 1)
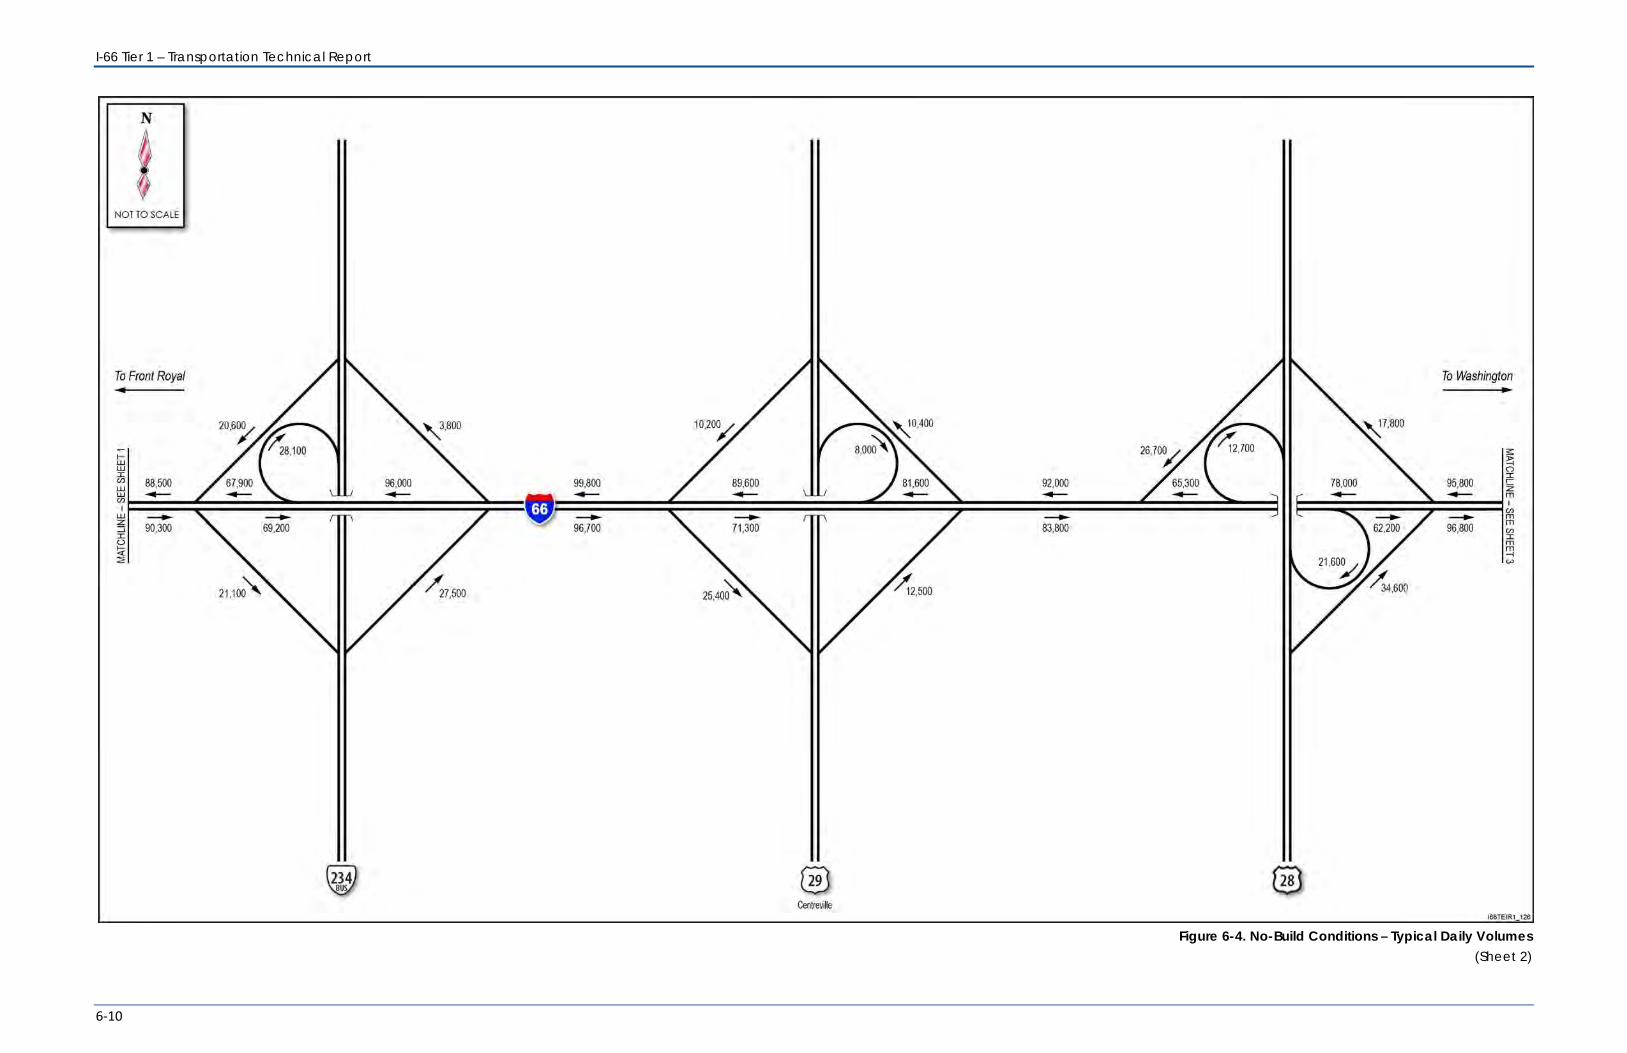
I-66 Tier 1 – Transportation Technical Report
6-10
Figure 6-4. No-Build Conditions – Typical Daily Volumes
(Sheet 2)
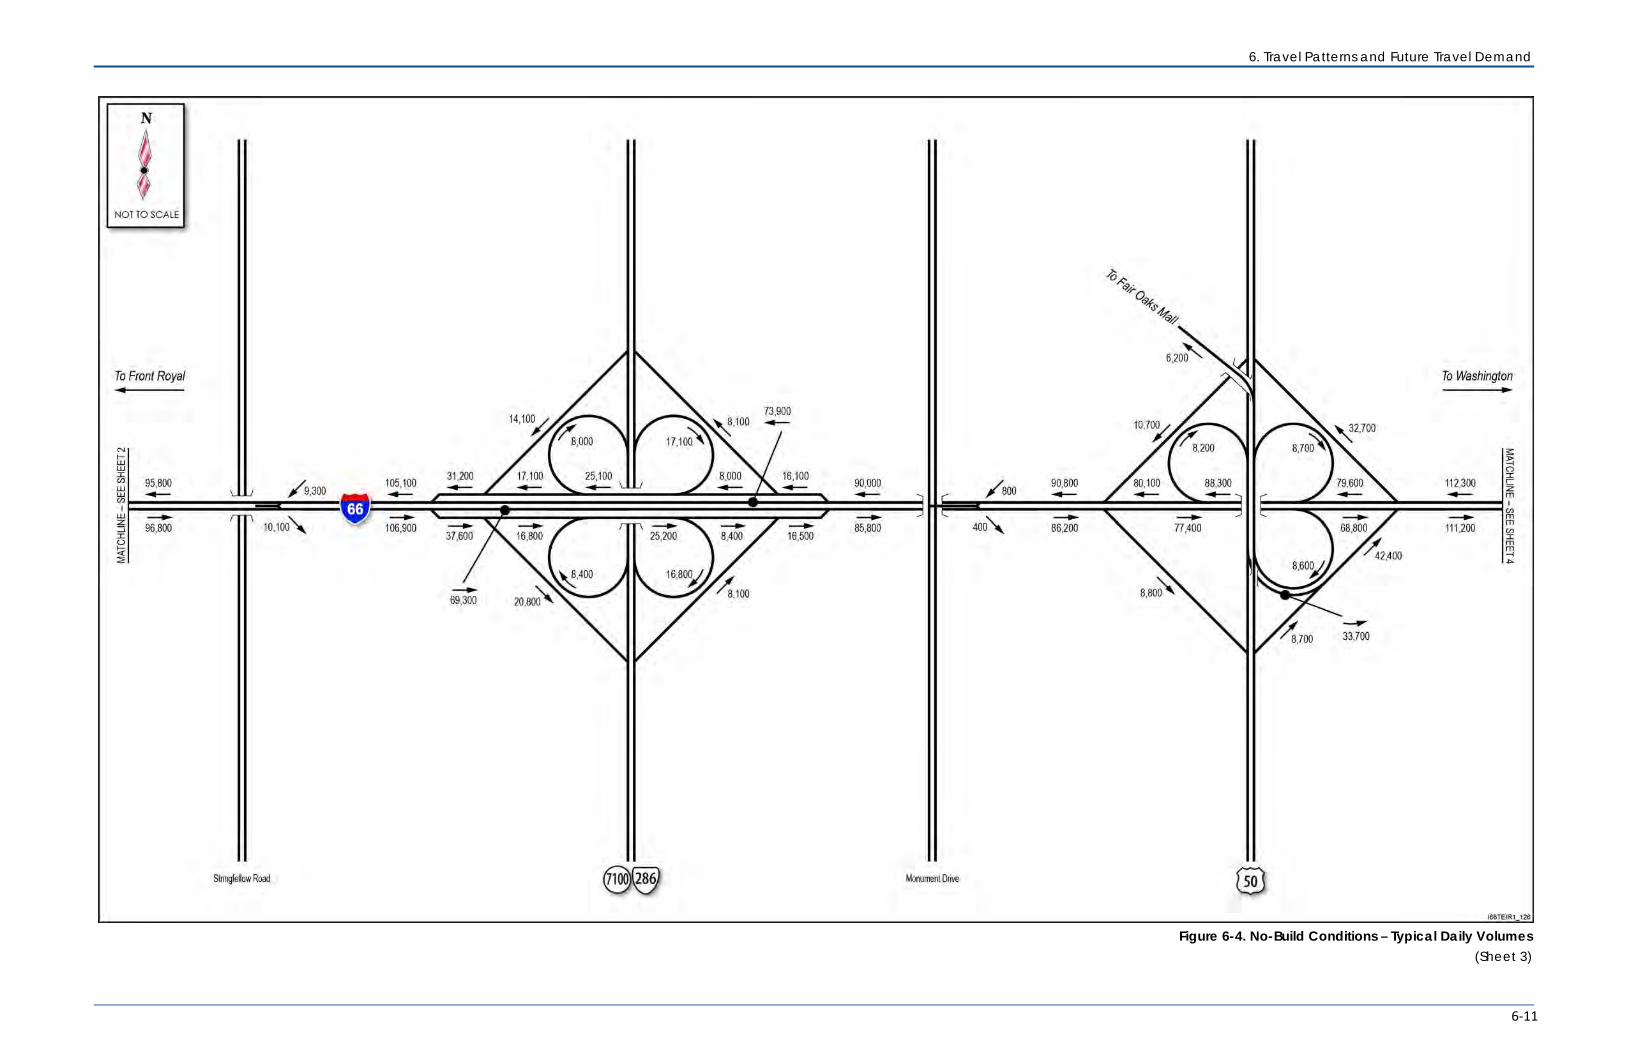
6. Travel Patterns and Future Travel Demand
6-11
Figure 6-4. No-Build Conditions – Typical Daily Volumes
(Sheet 3)

I-66 Tier 1 – Transportation Technical Report
6-12
Figure 6-4. No-Build Conditions – Typical Daily Volumes
(Sheet 4)

6. Travel Patterns and Future Travel Demand
6-13
Figure 6-5. No-Build Conditions – Typical AM Peak Hour Volumes
(Sheet 1)
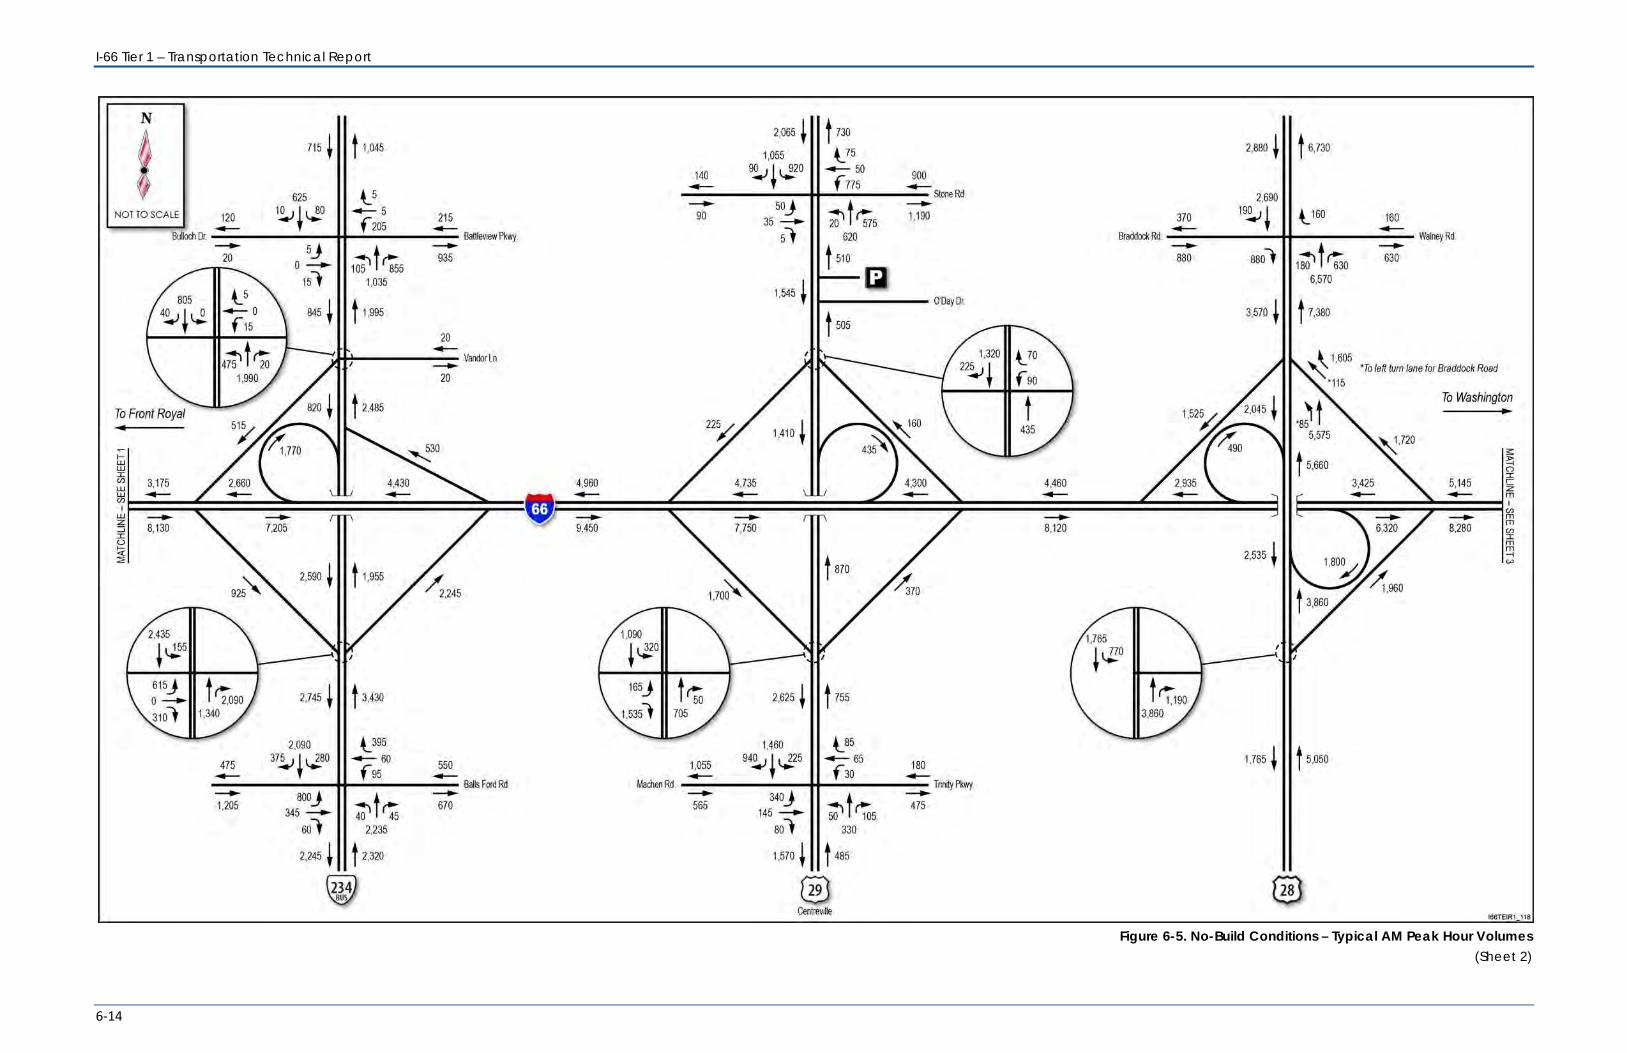
I-66 Tier 1 – Transportation Technical Report
6-14
Figure 6-5. No-Build Conditions – Typical AM Peak Hour Volumes
(Sheet 2)

6. Travel Patterns and Future Travel Demand
6-15
Figure 6-5. No-Build Conditions – Typical AM Peak Hour Volumes
(Sheet 3)
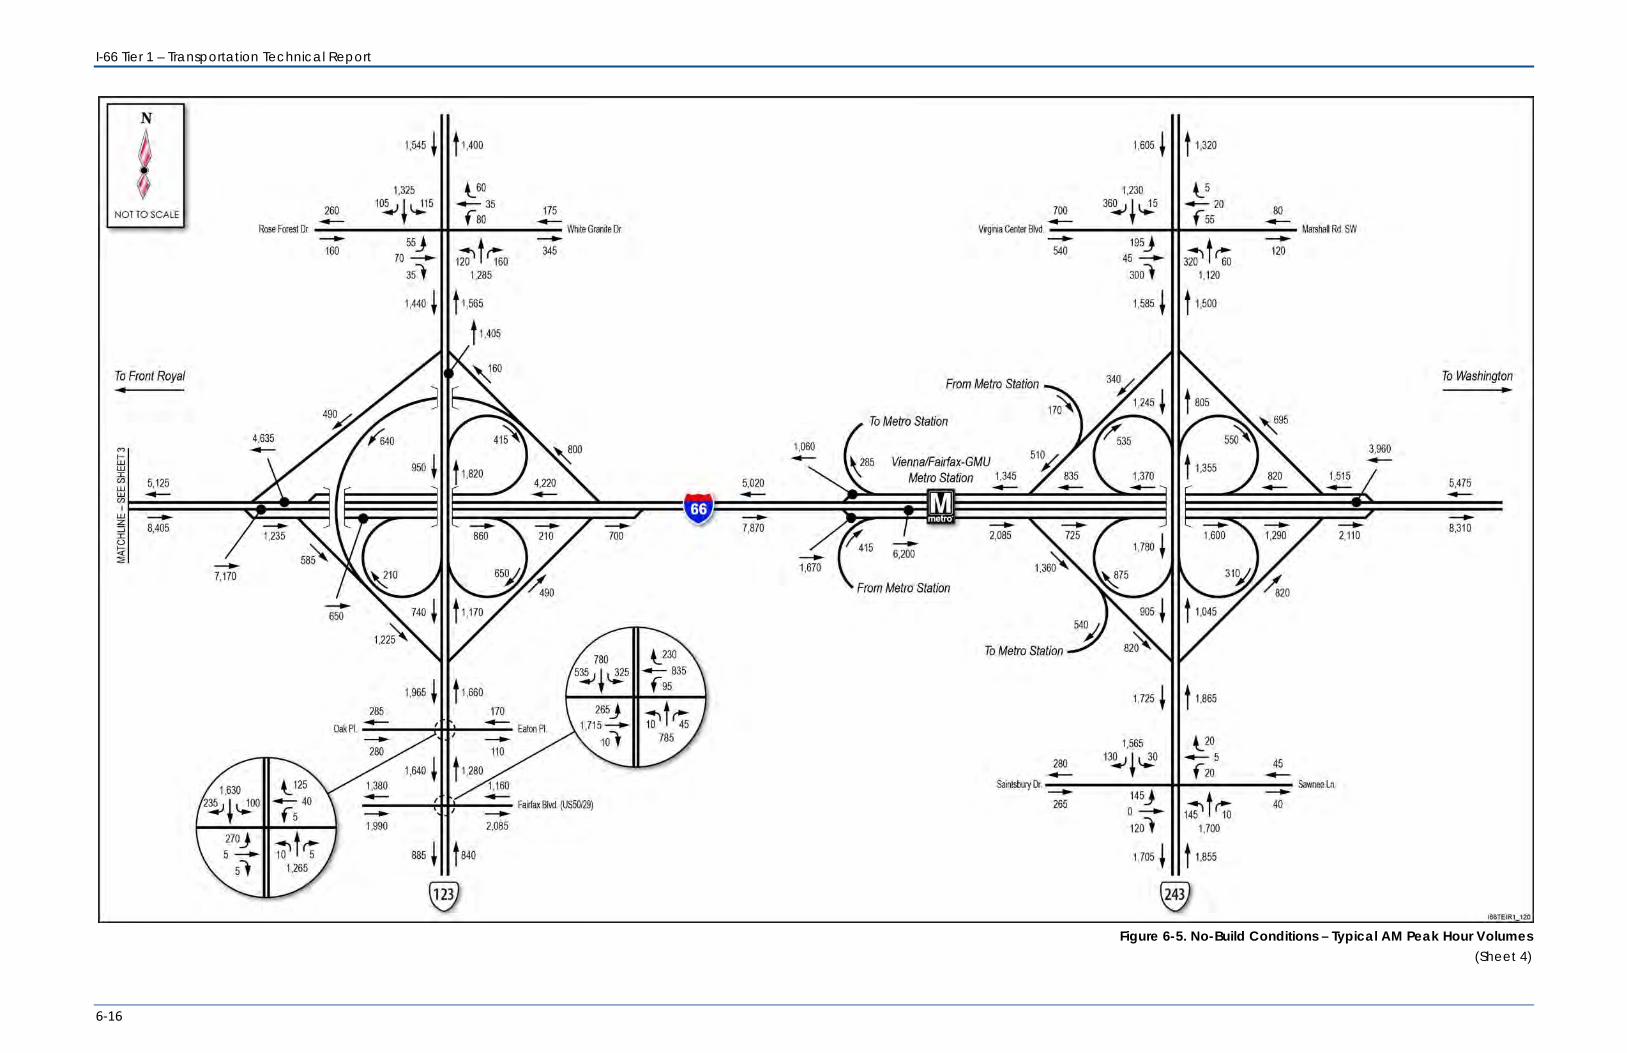
I-66 Tier 1 – Transportation Technical Report
6-16
Figure 6-5. No-Build Conditions – Typical AM Peak Hour Volumes
(Sheet 4)
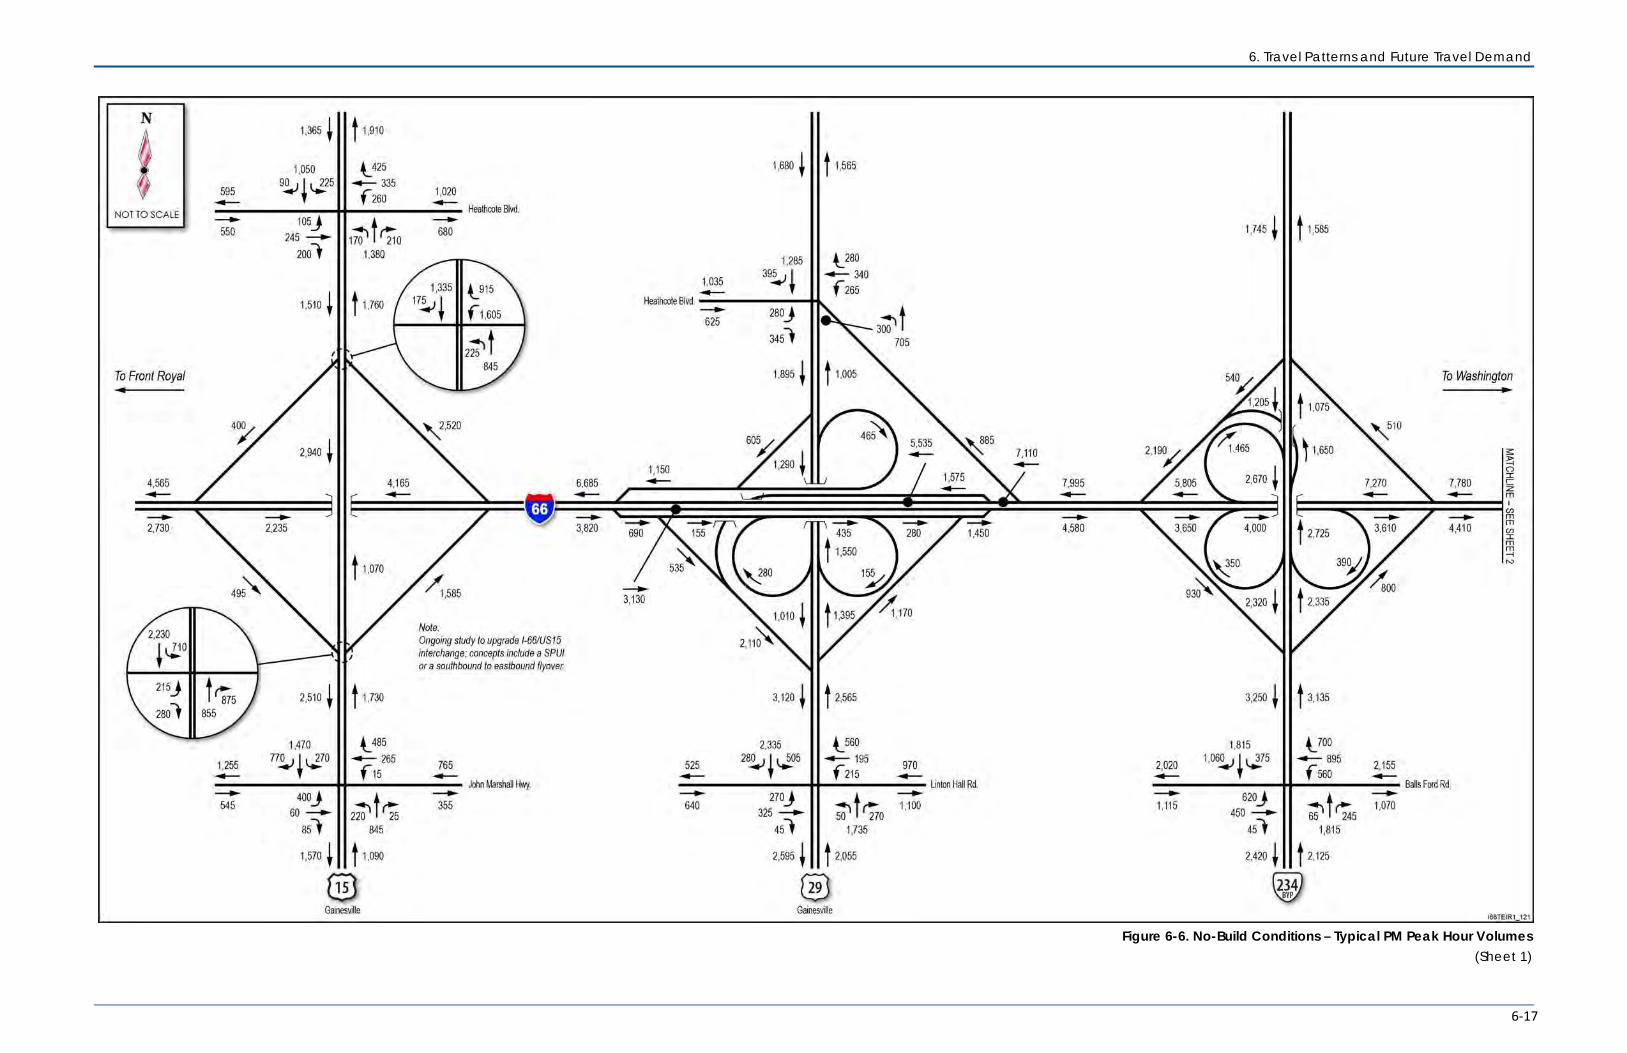
6. Travel Patterns and Future Travel Demand
6-17
Figure 6-6. No-Build Conditions – Typical PM Peak Hour Volumes
(Sheet 1)

I-66 Tier 1 – Transportation Technical Report
6-18
Figure 6-6. No-Build Conditions – Typical PM Peak Hour Volumes
(Sheet 2)
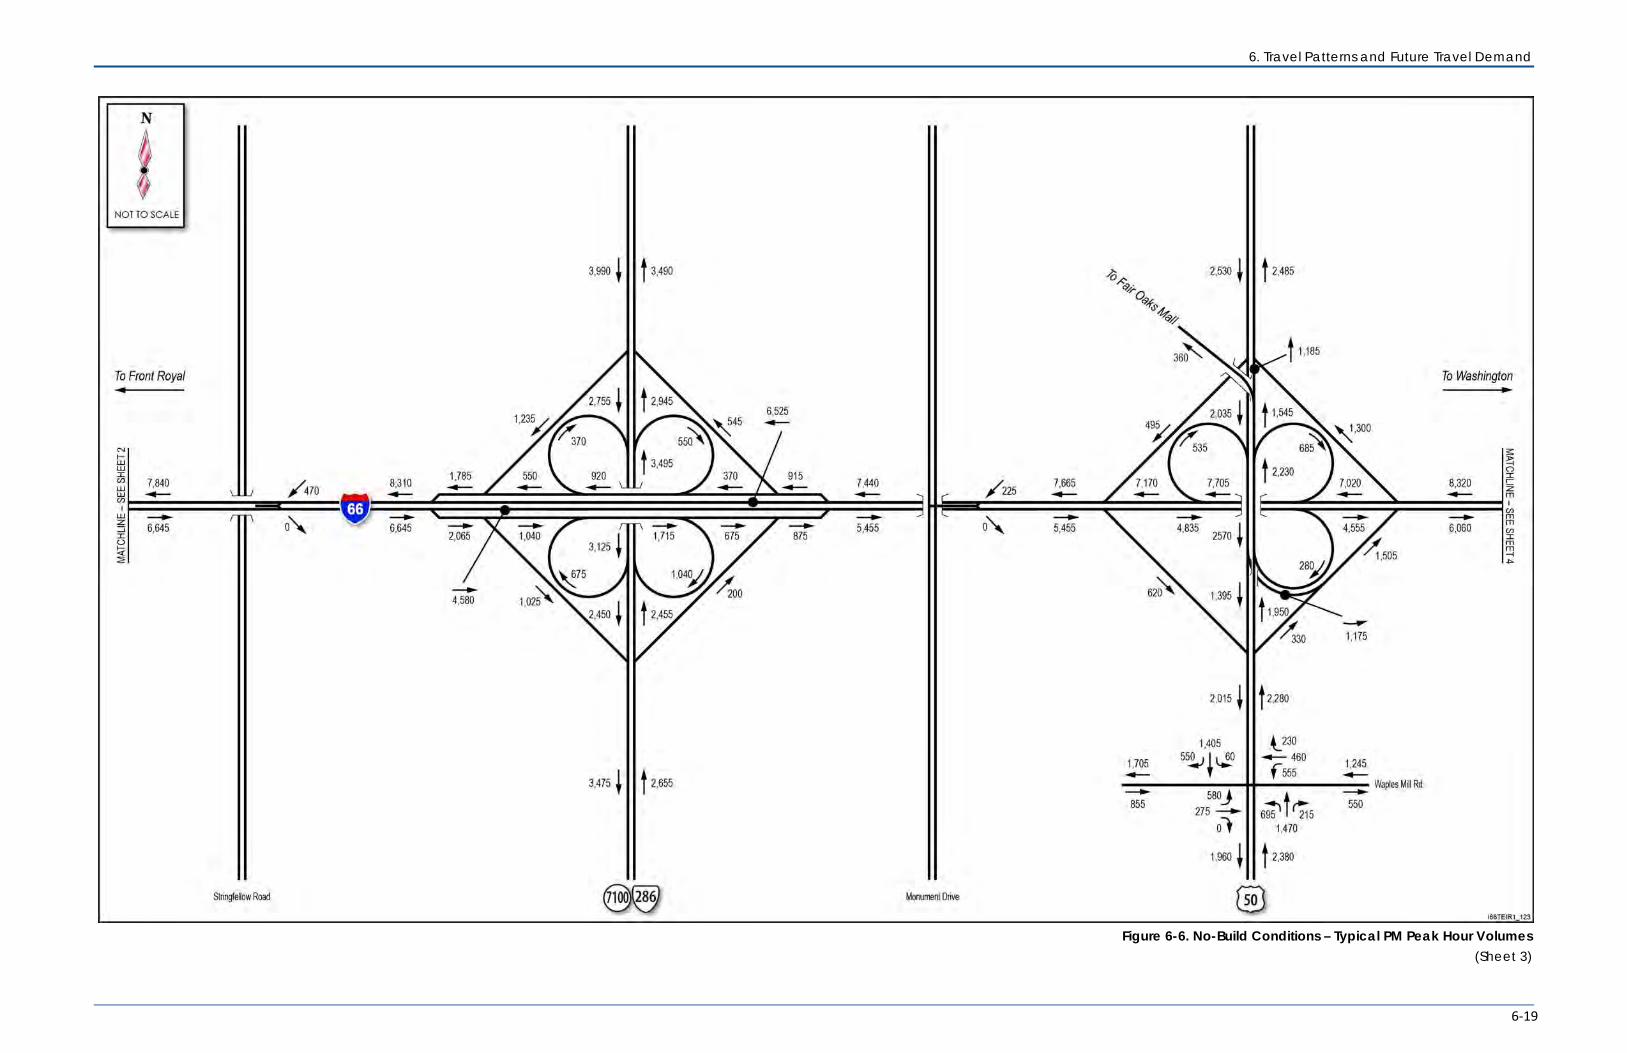
6. Travel Patterns and Future Travel Demand
6-19
Figure 6-6. No-Build Conditions – Typical PM Peak Hour Volumes
(Sheet 3)

I-66 Tier 1 – Transportation Technical Report
6-20
Figure 6-6. No-Build Conditions – Typical PM Peak Hour Volumes
(Sheet 4)
6. Travel Patterns and Future Travel Demand
6-21
6.2.3 NO-BUILD CONDITIONS FUTURE TRANSIT As indicated in the Draft SuperNoVa Transit/TDM Study, there are a few untapped transit markets anticipated to affect the I-66 corridor. Looking at the I-66 corridor from western Prince William County, approximately half of all work trips produced in this area are attracted to the inner core area, both now and in 2040. This movement is directly served by PRTC’s commuter bus services (OmniRide and Metro Direct) and rail service (VRE and Amtrak). These trips are likely being produced not only in Manassas and Manassas Park, but also in growing population centers such as Gainesville and Haymarket. Destinations are fairly concentrated in Washington, D.C., Arlington, and Alexandria, and dispersed within Fairfax County. PRTC currently only provides connections to WMATA Metrorail stations at West Falls Church and Vienna to serve locations in Fairfax County. Metrorail’s existing core capacity constraints limit the ability for expanded peak period usage for both localized and regional travel.
Future travel patterns indicate significant interaction between portions of Fairfax County and neighboring Prince William County but presently there are limited services that cross these jurisdictional lines. The largest travel flows to the inner core area are coming from western Counties beyond the study area. This travel market is served by commuter bus routes that make limited trips. Given the anticipated travel growth projections, there is a clear need for substantial expansion of transit service to address this market. There are significant travel flows anticipated along I-66 to Fairfax County, especially to the Tysons Corner and Dulles areas, from Fauquier County, Culpeper County, and Warren County. There is presently no transit service available to address these travel markets.
There also are anticipated significant travel flows to western Prince William County from these same three counties that may use I-66. Once again, there are no transit services available to address these future travel markets. In the I-66 corridor, a large number of work trips are presently attracted to western Prince William, which is anticipated to double from 2007 to 2040. While direct transit service is currently available from eastern Prince William via PRTC’s Cross County Connector, service from Eastern Loudoun/Dulles Airport and Southern Fauquier is very limited or non-existent.
6.2.4 IMPROVEMENT CONCEPT FORECASTS The process of developing and screening improvement concepts for this Tier 1 EIS reflects a high level “building block” approach that is described in detail in Section 8. A key aspect of this approach is estimating the total travel demand for the study corridor in terms of person-trips. The MWCOG model was used to develop estimates of the year 2040 person-trip demand by running the model with the I-66 study corridor as a capacity-unconstrained facility (although all connecting roads remain capacity-constrained). Note that all portions of I-66 outside of the study corridor also retained capacity constraints.
To estimate the potential total travel demand for the I-66 study corridor, the capacity constraints were relaxed so that any trip that could use the facility would in fact use it, and would not be deterred by delays incurred from increased traffic on I-66 itself. To relax the capacity restraint, the links representing I-66 were flagged as unconstrained in the model network. During the traffic assignment step of the model, delay (which is a function of the volume-to-capacity (v/c)
I-66 Tier 1 – Transportation Technical Report
6-22
ratio) is added to links, increasing the travel time. The links of I-66 which were flagged as unconstrained were given a separate delay function that was simplified to be equal to the free-flow travel time, regardless of congestion. Since traffic in the TDM is assigned by shortest paths, the assurance of free-flow travel time on a link means that no trips will switch to alternate paths as the volume increases on a link, allowing for the maximum possible traffic assignment. It should be noted that the free-flow speed guarantee was only applied to I-66 links, so congestion on intersecting roadways used to access I-66 will in part limit the volumes utilizing I-66. This reflects that this study was focused on improvements to I-66 itself and not the roadways that connect to it.
Extracting the person-demand on I-66 was accomplished by back-calculating from the vehicle-demand on the unconstrained I-66 links. The software used to execute the travel demand models allows for a “select link” analysis which tracks individual vehicle assignments throughout the assignment process. In this case, any vehicle which was assigned to I-66 between US 15 and I-495 was flagged, resulting in an origin-destination (OD) matrix for all vehicles in the MWCOG network that used I-66. A dummy matrix was then created where, for each OD pair, a value of one (true) was given if that OD pair had a non-zero value in the select link matrix, and zero (false) otherwise. In other words, if any traffic was assigned to I-66 for a particular OD pair, then that OD pair was flagged as an I-66 route.
In the mode choice step of the MWCOG model, person-trips are allocated to different modes, including automobiles of one, two, or three or more occupants, and various transit modes. At this point, the mode-specific trip tables were converted back into mode-specific person trips. Then, using factors included in the MWCOG model scripts, the mode-specific person trips were converted to directional person trips, by mode and by time (AM, PM, midday and night time periods). With person trips converted to an OD format by time of day, the dummy matrices created from the select link analysis could be applied to determine the number of persons modeled that had trips between origin and destination zones that would utilize I-66. By applying the dummy matrices to the trip tables, transit trips that share OD pairs with vehicle trips that use I-66 could be extracted; without using the dummy matrices, the transit trips would not be accounted for since they are not assigned to the network in the same way as vehicle trips. This total number of I-66 eligible person trips could then be used to test alternatives based on their ability to serve the maximum possible demand on the corridor.
The resulting total person-trip demand by section of the I-66 study corridor is included and discussed in Section 8. It is important to note that the estimates of total person-trip demand was used for developing and assessing the build improvement concepts as described in Section 8; the analysis of No-Build conditions described in the next section is based on the traditional four-step travel demand forecasting process described earlier in this section.
7-1
7 TRANSPORTATION ANALYSIS: FUTURE NO-BUILD CONDITIONS
This section presents the future No-Build concept operations and safety analyses; illustrating the expected increases in roadway and transit delay resulting from the combination of not providing needed improvements in the study corridor along with the projected growth in travel demand. The travel demands used for the 2040 No-Build Conditions were developed using the MWCOG model and methodology as described in Section 6, while the highway capacity methods to assess traffic operations were identical to those used for the Existing Conditions Analysis. As indicated in Section 4.1 for the methodology, Synchro was used for the intersection analysis and HCS 2010 was used for freeway analysis.
The freeway analysis incorporated any planned improvements to I-66 or the cross-streets for the 2040 No-Build analysis that are currently listed in the CLRP. For example, a planned project to widen I-66 from US 29 (Gainesville) to US 15 was incorporated in the analysis, as well as the ongoing improvements to Fairfax County parkway through the I-66 interchange. Such improvements are listed in Section 6.2.1.
7.1 ROADWAYS
7.1.1 FREEWAY ANALYSIS Freeway operations were assessed for basic freeway segments, ramp merges and diverges, weaves, and CD roads for the No-Build Conditions, following the same methodology as the Existing Conditions. HCS 2010 was used throughout the analysis, except for the CD roads as the HCM methodology is limited in the minimum number of lanes that can be assessed. Full summary tables and HCS outputs can be found in Appendix C.
7.1.1.1 Basic Freeway Basic freeway operational analysis was performed for I-66 within the analysis area for the No-Build Conditions. The analysis indicates that for the peak direction of travel in both time periods, I-66 will operate at LOS E or F for all sections except for one section in the PM peak hour that would operate at LOS D. Critical sections include both eastbound and westbound I-66 between VA 234 Business and US 29 (Centreville), as well as US 29 (Centreville) and Fairfax County Parkway. Table 7-1 present the results for the basic freeway operational analysis. A graphic comparison of LOS between the existing conditions and the 2040 conditions for all freeway components and intersections are shown on Figure 7-1 at the end of Section 7.1.2.
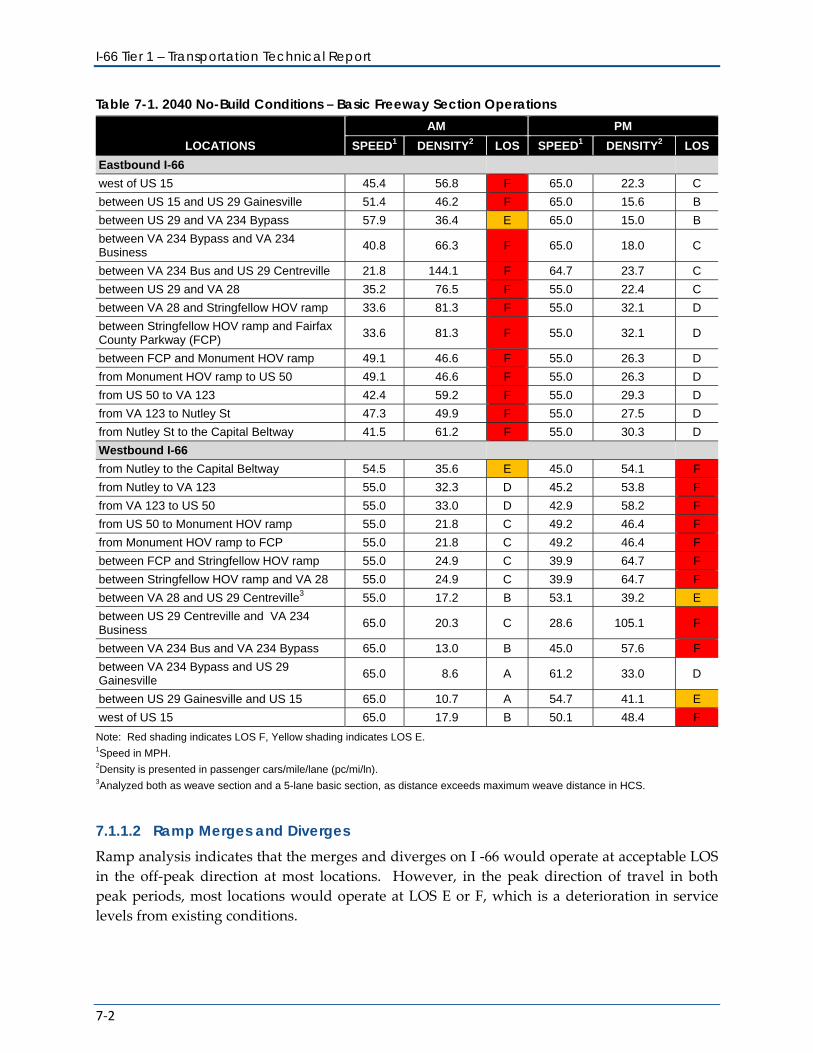
I-66 Tier 1 – Transportation Technical Report
7-2
Table 7-1. 2040 No-Build Conditions – Basic Freeway Section Operations
LOCATIONS
AM PM
SPEED1 DENSITY2 LOS SPEED1 DENSITY2 LOS
Eastbound I-66
west of US 15 45.4 56.8 F 65.0 22.3 C
between US 15 and US 29 Gainesville 51.4 46.2 F 65.0 15.6 B
between US 29 and VA 234 Bypass 57.9 36.4 E 65.0 15.0 B
between VA 234 Bypass and VA 234 Business
40.8 66.3 F 65.0 18.0 C
between VA 234 Bus and US 29 Centreville 21.8 144.1 F 64.7 23.7 C
between US 29 and VA 28 35.2 76.5 F 55.0 22.4 C
between VA 28 and Stringfellow HOV ramp 33.6 81.3 F 55.0 32.1 D
between Stringfellow HOV ramp and Fairfax County Parkway (FCP)
33.6 81.3 F 55.0 32.1 D
between FCP and Monument HOV ramp 49.1 46.6 F 55.0 26.3 D
from Monument HOV ramp to US 50 49.1 46.6 F 55.0 26.3 D
from US 50 to VA 123 42.4 59.2 F 55.0 29.3 D
from VA 123 to Nutley St 47.3 49.9 F 55.0 27.5 D
from Nutley St to the Capital Beltway 41.5 61.2 F 55.0 30.3 D
Westbound I-66
from Nutley to the Capital Beltway 54.5 35.6 E 45.0 54.1 F
from Nutley to VA 123 55.0 32.3 D 45.2 53.8 F
from VA 123 to US 50 55.0 33.0 D 42.9 58.2 F
from US 50 to Monument HOV ramp 55.0 21.8 C 49.2 46.4 F
from Monument HOV ramp to FCP 55.0 21.8 C 49.2 46.4 F
between FCP and Stringfellow HOV ramp 55.0 24.9 C 39.9 64.7 F
between Stringfellow HOV ramp and VA 28 55.0 24.9 C 39.9 64.7 F
between VA 28 and US 29 Centreville3 55.0 17.2 B 53.1 39.2 E
between US 29 Centreville and VA 234 Business
65.0 20.3 C 28.6 105.1 F
between VA 234 Bus and VA 234 Bypass 65.0 13.0 B 45.0 57.6 F
between VA 234 Bypass and US 29 Gainesville
65.0 8.6 A 61.2 33.0 D
between US 29 Gainesville and US 15 65.0 10.7 A 54.7 41.1 E
west of US 15 65.0 17.9 B 50.1 48.4 F
Note: Red shading indicates LOS F, Yellow shading indicates LOS E. 1Speed in MPH. 2Density is presented in passenger cars/mile/lane (pc/mi/ln). 3Analyzed both as weave section and a 5-lane basic section, as distance exceeds maximum weave distance in HCS.
7.1.1.2 Ramp Merges and Diverges Ramp analysis indicates that the merges and diverges on I -66 would operate at acceptable LOS in the off-peak direction at most locations. However, in the peak direction of travel in both peak periods, most locations would operate at LOS E or F, which is a deterioration in service levels from existing conditions.
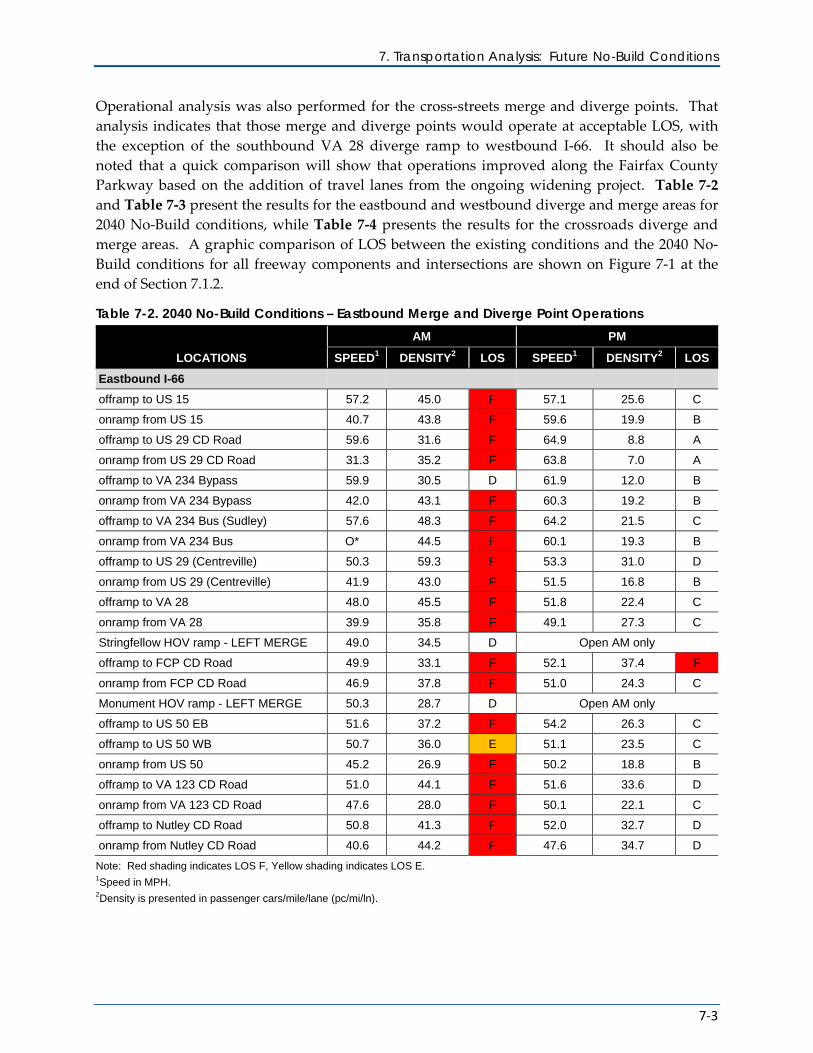
7. Transportation Analysis: Future No-Build Conditions
7-3
Operational analysis was also performed for the cross-streets merge and diverge points. That analysis indicates that those merge and diverge points would operate at acceptable LOS, with the exception of the southbound VA 28 diverge ramp to westbound I-66. It should also be noted that a quick comparison will show that operations improved along the Fairfax County Parkway based on the addition of travel lanes from the ongoing widening project. Table 7-2 and Table 7-3 present the results for the eastbound and westbound diverge and merge areas for 2040 No-Build conditions, while Table 7-4 presents the results for the crossroads diverge and merge areas. A graphic comparison of LOS between the existing conditions and the 2040 No-Build conditions for all freeway components and intersections are shown on Figure 7-1 at the end of Section 7.1.2.
Table 7-2. 2040 No-Build Conditions – Eastbound Merge and Diverge Point Operations
LOCATIONS
AM PM
SPEED1 DENSITY2 LOS SPEED1 DENSITY2 LOS
Eastbound I-66
offramp to US 15 57.2 45.0 F 57.1 25.6 C
onramp from US 15 40.7 43.8 F 59.6 19.9 B
offramp to US 29 CD Road 59.6 31.6 F 64.9 8.8 A
onramp from US 29 CD Road 31.3 35.2 F 63.8 7.0 A
offramp to VA 234 Bypass 59.9 30.5 D 61.9 12.0 B
onramp from VA 234 Bypass 42.0 43.1 F 60.3 19.2 B
offramp to VA 234 Bus (Sudley) 57.6 48.3 F 64.2 21.5 C
onramp from VA 234 Bus O* 44.5 F 60.1 19.3 B
offramp to US 29 (Centreville) 50.3 59.3 F 53.3 31.0 D
onramp from US 29 (Centreville) 41.9 43.0 F 51.5 16.8 B
offramp to VA 28 48.0 45.5 F 51.8 22.4 C
onramp from VA 28 39.9 35.8 F 49.1 27.3 C
Stringfellow HOV ramp - LEFT MERGE 49.0 34.5 D Open AM only
offramp to FCP CD Road 49.9 33.1 F 52.1 37.4 F
onramp from FCP CD Road 46.9 37.8 F 51.0 24.3 C
Monument HOV ramp - LEFT MERGE 50.3 28.7 D Open AM only
offramp to US 50 EB 51.6 37.2 F 54.2 26.3 C
offramp to US 50 WB 50.7 36.0 E 51.1 23.5 C
onramp from US 50 45.2 26.9 F 50.2 18.8 B
offramp to VA 123 CD Road 51.0 44.1 F 51.6 33.6 D
onramp from VA 123 CD Road 47.6 28.0 F 50.1 22.1 C
offramp to Nutley CD Road 50.8 41.3 F 52.0 32.7 D
onramp from Nutley CD Road 40.6 44.2 F 47.6 34.7 D
Note: Red shading indicates LOS F, Yellow shading indicates LOS E. 1Speed in MPH. 2Density is presented in passenger cars/mile/lane (pc/mi/ln).
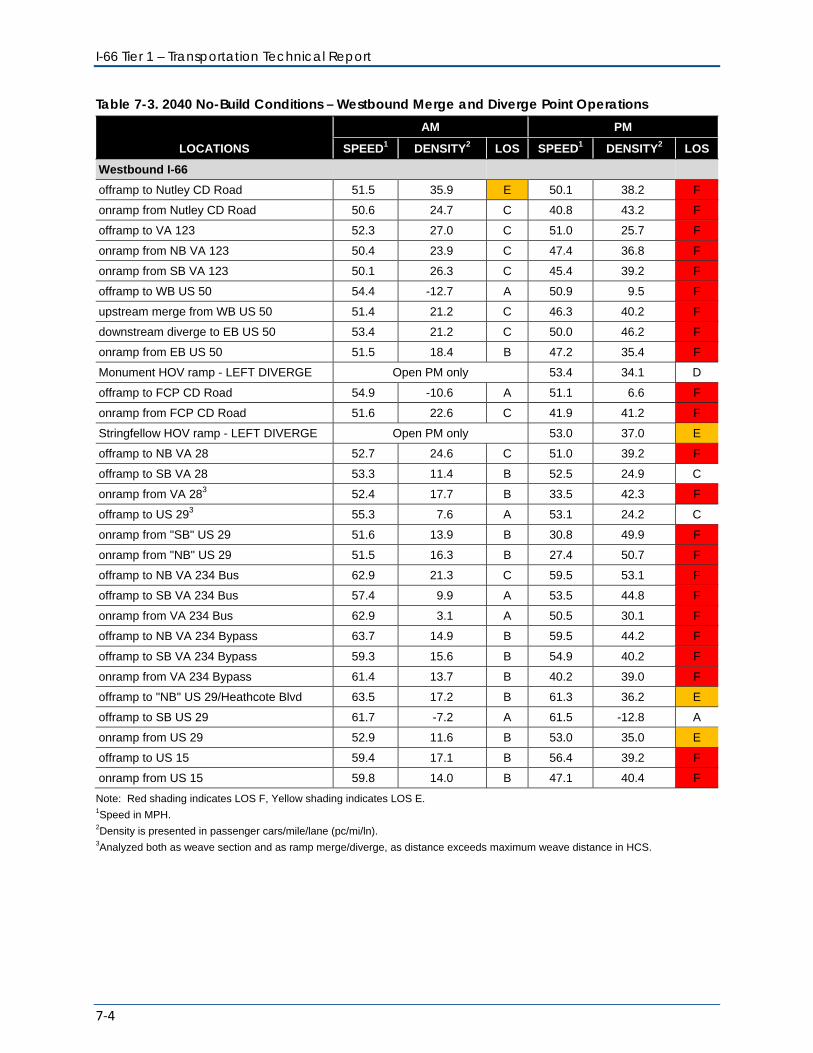
I-66 Tier 1 – Transportation Technical Report
7-4
Table 7-3. 2040 No-Build Conditions – Westbound Merge and Diverge Point Operations
LOCATIONS
AM PM
SPEED1 DENSITY2 LOS SPEED1 DENSITY2 LOS
Westbound I-66
offramp to Nutley CD Road 51.5 35.9 E 50.1 38.2 F
onramp from Nutley CD Road 50.6 24.7 C 40.8 43.2 F
offramp to VA 123 52.3 27.0 C 51.0 25.7 F
onramp from NB VA 123 50.4 23.9 C 47.4 36.8 F
onramp from SB VA 123 50.1 26.3 C 45.4 39.2 F
offramp to WB US 50 54.4 -12.7 A 50.9 9.5 F
upstream merge from WB US 50 51.4 21.2 C 46.3 40.2 F
downstream diverge to EB US 50 53.4 21.2 C 50.0 46.2 F
onramp from EB US 50 51.5 18.4 B 47.2 35.4 F
Monument HOV ramp - LEFT DIVERGE Open PM only 53.4 34.1 D
offramp to FCP CD Road 54.9 -10.6 A 51.1 6.6 F
onramp from FCP CD Road 51.6 22.6 C 41.9 41.2 F
Stringfellow HOV ramp - LEFT DIVERGE Open PM only 53.0 37.0 E
offramp to NB VA 28 52.7 24.6 C 51.0 39.2 F
offramp to SB VA 28 53.3 11.4 B 52.5 24.9 C
onramp from VA 283 52.4 17.7 B 33.5 42.3 F
offramp to US 293 55.3 7.6 A 53.1 24.2 C
onramp from "SB" US 29 51.6 13.9 B 30.8 49.9 F
onramp from "NB" US 29 51.5 16.3 B 27.4 50.7 F
offramp to NB VA 234 Bus 62.9 21.3 C 59.5 53.1 F
offramp to SB VA 234 Bus 57.4 9.9 A 53.5 44.8 F
onramp from VA 234 Bus 62.9 3.1 A 50.5 30.1 F
offramp to NB VA 234 Bypass 63.7 14.9 B 59.5 44.2 F
offramp to SB VA 234 Bypass 59.3 15.6 B 54.9 40.2 F
onramp from VA 234 Bypass 61.4 13.7 B 40.2 39.0 F
offramp to "NB" US 29/Heathcote Blvd 63.5 17.2 B 61.3 36.2 E
offramp to SB US 29 61.7 -7.2 A 61.5 -12.8 A
onramp from US 29 52.9 11.6 B 53.0 35.0 E
offramp to US 15 59.4 17.1 B 56.4 39.2 F
onramp from US 15 59.8 14.0 B 47.1 40.4 F
Note: Red shading indicates LOS F, Yellow shading indicates LOS E. 1Speed in MPH. 2Density is presented in passenger cars/mile/lane (pc/mi/ln). 3Analyzed both as weave section and as ramp merge/diverge, as distance exceeds maximum weave distance in HCS.
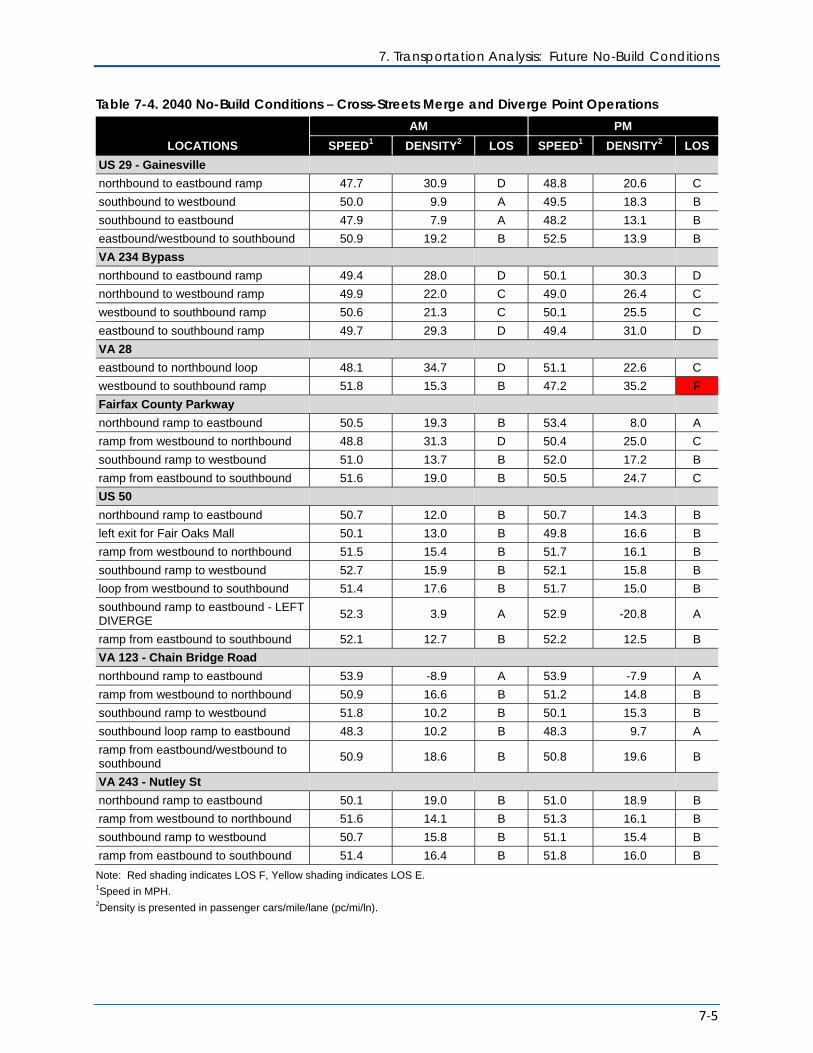
7. Transportation Analysis: Future No-Build Conditions
7-5
Table 7-4. 2040 No-Build Conditions – Cross-Streets Merge and Diverge Point Operations
LOCATIONS
AM PM
SPEED1 DENSITY2 LOS SPEED1 DENSITY2 LOS
US 29 - Gainesville
northbound to eastbound ramp 47.7 30.9 D 48.8 20.6 C
southbound to westbound 50.0 9.9 A 49.5 18.3 B
southbound to eastbound 47.9 7.9 A 48.2 13.1 B
eastbound/westbound to southbound 50.9 19.2 B 52.5 13.9 B
VA 234 Bypass
northbound to eastbound ramp 49.4 28.0 D 50.1 30.3 D
northbound to westbound ramp 49.9 22.0 C 49.0 26.4 C
westbound to southbound ramp 50.6 21.3 C 50.1 25.5 C
eastbound to southbound ramp 49.7 29.3 D 49.4 31.0 D
VA 28
eastbound to northbound loop 48.1 34.7 D 51.1 22.6 C
westbound to southbound ramp 51.8 15.3 B 47.2 35.2 F
Fairfax County Parkway
northbound ramp to eastbound 50.5 19.3 B 53.4 8.0 A
ramp from westbound to northbound 48.8 31.3 D 50.4 25.0 C
southbound ramp to westbound 51.0 13.7 B 52.0 17.2 B
ramp from eastbound to southbound 51.6 19.0 B 50.5 24.7 C
US 50
northbound ramp to eastbound 50.7 12.0 B 50.7 14.3 B
left exit for Fair Oaks Mall 50.1 13.0 B 49.8 16.6 B
ramp from westbound to northbound 51.5 15.4 B 51.7 16.1 B
southbound ramp to westbound 52.7 15.9 B 52.1 15.8 B
loop from westbound to southbound 51.4 17.6 B 51.7 15.0 B
southbound ramp to eastbound - LEFT DIVERGE
52.3 3.9 A 52.9 -20.8 A
ramp from eastbound to southbound 52.1 12.7 B 52.2 12.5 B
VA 123 - Chain Bridge Road
northbound ramp to eastbound 53.9 -8.9 A 53.9 -7.9 A
ramp from westbound to northbound 50.9 16.6 B 51.2 14.8 B
southbound ramp to westbound 51.8 10.2 B 50.1 15.3 B
southbound loop ramp to eastbound 48.3 10.2 B 48.3 9.7 A
ramp from eastbound/westbound to southbound
50.9 18.6 B 50.8 19.6 B
VA 243 - Nutley St
northbound ramp to eastbound 50.1 19.0 B 51.0 18.9 B
ramp from westbound to northbound 51.6 14.1 B 51.3 16.1 B
southbound ramp to westbound 50.7 15.8 B 51.1 15.4 B
ramp from eastbound to southbound 51.4 16.4 B 51.8 16.0 B
Note: Red shading indicates LOS F, Yellow shading indicates LOS E. 1Speed in MPH. 2Density is presented in passenger cars/mile/lane (pc/mi/ln).
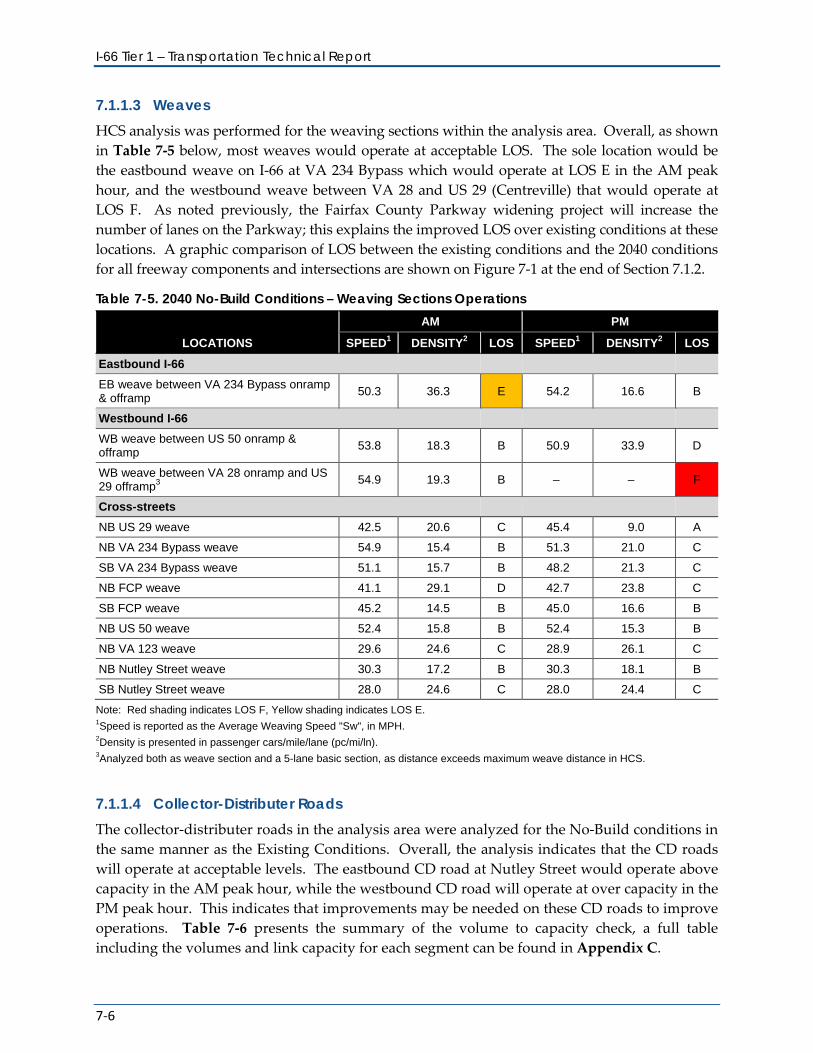
I-66 Tier 1 – Transportation Technical Report
7-6
7.1.1.3 Weaves HCS analysis was performed for the weaving sections within the analysis area. Overall, as shown in Table 7-5 below, most weaves would operate at acceptable LOS. The sole location would be the eastbound weave on I-66 at VA 234 Bypass which would operate at LOS E in the AM peak hour, and the westbound weave between VA 28 and US 29 (Centreville) that would operate at LOS F. As noted previously, the Fairfax County Parkway widening project will increase the number of lanes on the Parkway; this explains the improved LOS over existing conditions at these locations. A graphic comparison of LOS between the existing conditions and the 2040 conditions for all freeway components and intersections are shown on Figure 7-1 at the end of Section 7.1.2.
Table 7-5. 2040 No-Build Conditions – Weaving Sections Operations
LOCATIONS
AM PM
SPEED1 DENSITY2 LOS SPEED1 DENSITY2 LOS
Eastbound I-66
EB weave between VA 234 Bypass onramp & offramp
50.3 36.3 E 54.2 16.6 B
Westbound I-66
WB weave between US 50 onramp & offramp
53.8 18.3 B 50.9 33.9 D
WB weave between VA 28 onramp and US 29 offramp3
54.9 19.3 B – – F
Cross-streets
NB US 29 weave 42.5 20.6 C 45.4 9.0 A
NB VA 234 Bypass weave 54.9 15.4 B 51.3 21.0 C
SB VA 234 Bypass weave 51.1 15.7 B 48.2 21.3 C
NB FCP weave 41.1 29.1 D 42.7 23.8 C
SB FCP weave 45.2 14.5 B 45.0 16.6 B
NB US 50 weave 52.4 15.8 B 52.4 15.3 B
NB VA 123 weave 29.6 24.6 C 28.9 26.1 C
NB Nutley Street weave 30.3 17.2 B 30.3 18.1 B
SB Nutley Street weave 28.0 24.6 C 28.0 24.4 C
Note: Red shading indicates LOS F, Yellow shading indicates LOS E. 1Speed is reported as the Average Weaving Speed "Sw", in MPH. 2Density is presented in passenger cars/mile/lane (pc/mi/ln). 3Analyzed both as weave section and a 5-lane basic section, as distance exceeds maximum weave distance in HCS.
7.1.1.4 Collector-Distributer Roads The collector-distributer roads in the analysis area were analyzed for the No-Build conditions in the same manner as the Existing Conditions. Overall, the analysis indicates that the CD roads will operate at acceptable levels. The eastbound CD road at Nutley Street would operate above capacity in the AM peak hour, while the westbound CD road will operate at over capacity in the PM peak hour. This indicates that improvements may be needed on these CD roads to improve operations. Table 7-6 presents the summary of the volume to capacity check, a full table including the volumes and link capacity for each segment can be found in Appendix C.
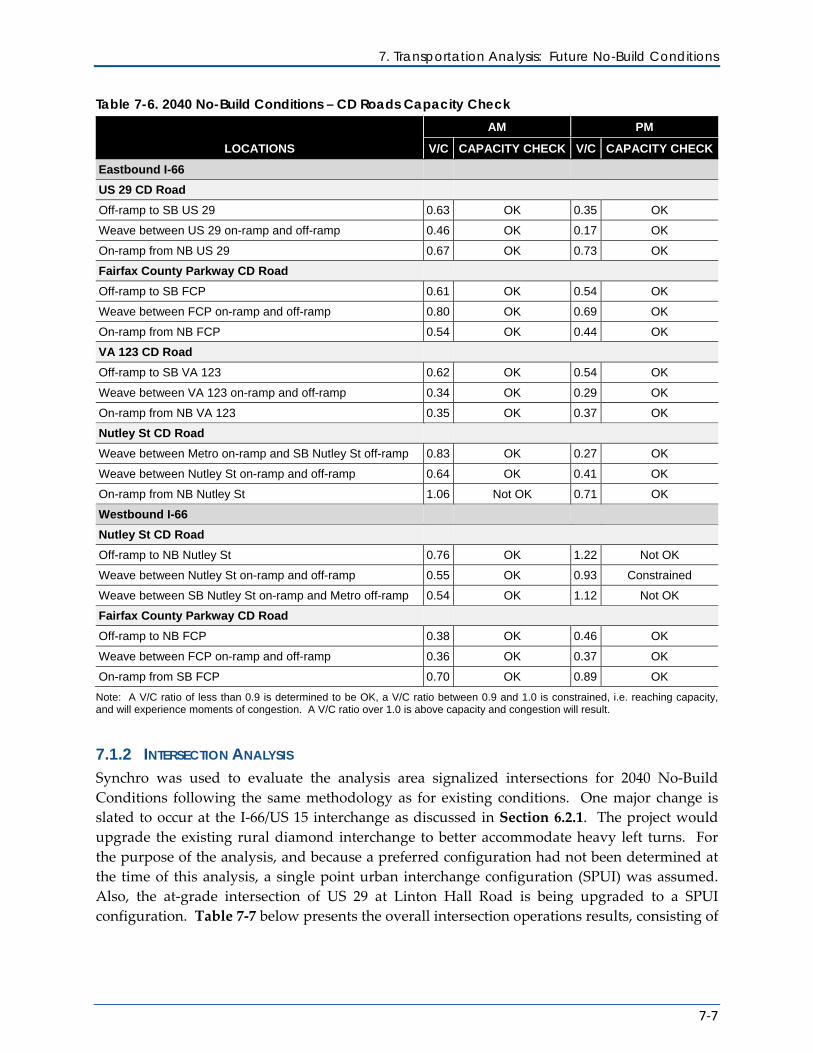
7. Transportation Analysis: Future No-Build Conditions
7-7
Table 7-6. 2040 No-Build Conditions – CD Roads Capacity Check
LOCATIONS
AM PM
V/C CAPACITY CHECK V/C CAPACITY CHECK
Eastbound I-66
US 29 CD Road
Off-ramp to SB US 29 0.63 OK 0.35 OK
Weave between US 29 on-ramp and off-ramp 0.46 OK 0.17 OK
On-ramp from NB US 29 0.67 OK 0.73 OK
Fairfax County Parkway CD Road
Off-ramp to SB FCP 0.61 OK 0.54 OK
Weave between FCP on-ramp and off-ramp 0.80 OK 0.69 OK
On-ramp from NB FCP 0.54 OK 0.44 OK
VA 123 CD Road
Off-ramp to SB VA 123 0.62 OK 0.54 OK
Weave between VA 123 on-ramp and off-ramp 0.34 OK 0.29 OK
On-ramp from NB VA 123 0.35 OK 0.37 OK
Nutley St CD Road
Weave between Metro on-ramp and SB Nutley St off-ramp 0.83 OK 0.27 OK
Weave between Nutley St on-ramp and off-ramp 0.64 OK 0.41 OK
On-ramp from NB Nutley St 1.06 Not OK 0.71 OK
Westbound I-66
Nutley St CD Road
Off-ramp to NB Nutley St 0.76 OK 1.22 Not OK
Weave between Nutley St on-ramp and off-ramp 0.55 OK 0.93 Constrained
Weave between SB Nutley St on-ramp and Metro off-ramp 0.54 OK 1.12 Not OK
Fairfax County Parkway CD Road
Off-ramp to NB FCP 0.38 OK 0.46 OK
Weave between FCP on-ramp and off-ramp 0.36 OK 0.37 OK
On-ramp from SB FCP 0.70 OK 0.89 OK
Note: A V/C ratio of less than 0.9 is determined to be OK, a V/C ratio between 0.9 and 1.0 is constrained, i.e. reaching capacity, and will experience moments of congestion. A V/C ratio over 1.0 is above capacity and congestion will result.
7.1.2 INTERSECTION ANALYSIS Synchro was used to evaluate the analysis area signalized intersections for 2040 No-Build Conditions following the same methodology as for existing conditions. One major change is slated to occur at the I-66/US 15 interchange as discussed in Section 6.2.1. The project would upgrade the existing rural diamond interchange to better accommodate heavy left turns. For the purpose of the analysis, and because a preferred configuration had not been determined at the time of this analysis, a single point urban interchange configuration (SPUI) was assumed. Also, the at-grade intersection of US 29 at Linton Hall Road is being upgraded to a SPUI configuration. Table 7-7 below presents the overall intersection operations results, consisting of
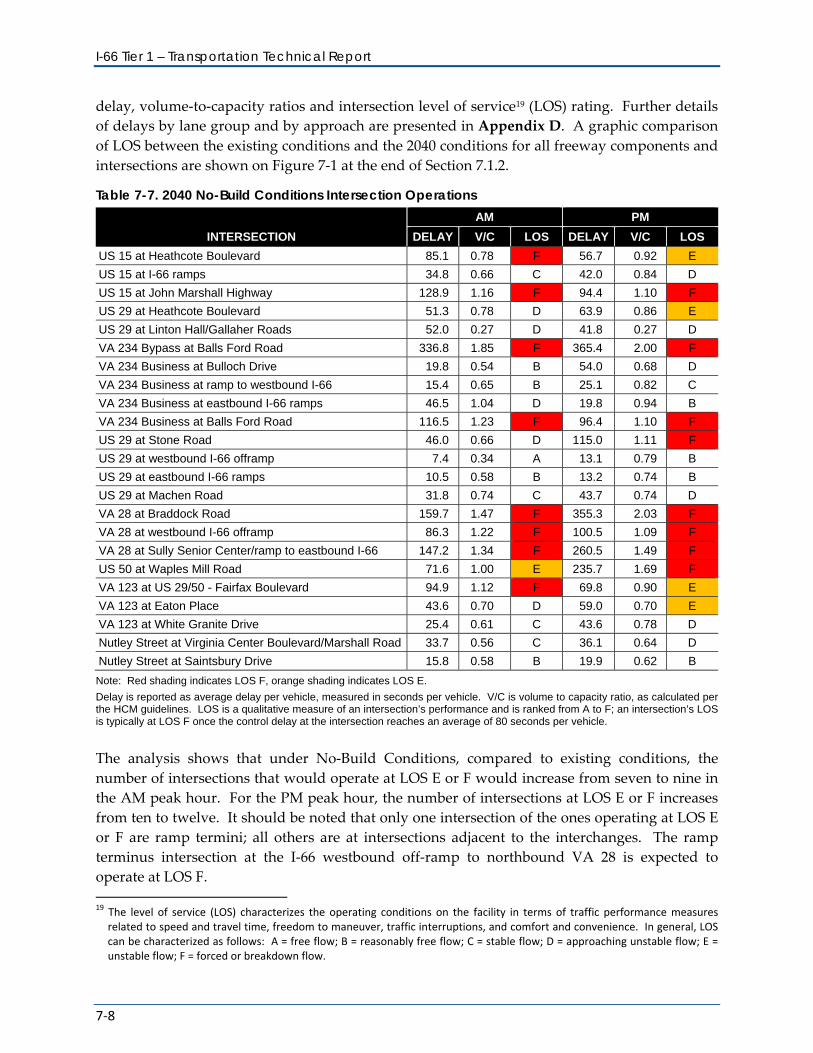
I-66 Tier 1 – Transportation Technical Report
7-8
delay, volume-to-capacity ratios and intersection level of service19 (LOS) rating. Further details of delays by lane group and by approach are presented in Appendix D. A graphic comparison of LOS between the existing conditions and the 2040 conditions for all freeway components and intersections are shown on Figure 7-1 at the end of Section 7.1.2.
Table 7-7. 2040 No-Build Conditions Intersection Operations
INTERSECTION
AM PM
DELAY V/C LOS DELAY V/C LOS
US 15 at Heathcote Boulevard 85.1 0.78 F 56.7 0.92 E
US 15 at I-66 ramps 34.8 0.66 C 42.0 0.84 D
US 15 at John Marshall Highway 128.9 1.16 F 94.4 1.10 F
US 29 at Heathcote Boulevard 51.3 0.78 D 63.9 0.86 E
US 29 at Linton Hall/Gallaher Roads 52.0 0.27 D 41.8 0.27 D
VA 234 Bypass at Balls Ford Road 336.8 1.85 F 365.4 2.00 F
VA 234 Business at Bulloch Drive 19.8 0.54 B 54.0 0.68 D
VA 234 Business at ramp to westbound I-66 15.4 0.65 B 25.1 0.82 C
VA 234 Business at eastbound I-66 ramps 46.5 1.04 D 19.8 0.94 B
VA 234 Business at Balls Ford Road 116.5 1.23 F 96.4 1.10 F
US 29 at Stone Road 46.0 0.66 D 115.0 1.11 F
US 29 at westbound I-66 offramp 7.4 0.34 A 13.1 0.79 B
US 29 at eastbound I-66 ramps 10.5 0.58 B 13.2 0.74 B
US 29 at Machen Road 31.8 0.74 C 43.7 0.74 D
VA 28 at Braddock Road 159.7 1.47 F 355.3 2.03 F
VA 28 at westbound I-66 offramp 86.3 1.22 F 100.5 1.09 F
VA 28 at Sully Senior Center/ramp to eastbound I-66 147.2 1.34 F 260.5 1.49 F
US 50 at Waples Mill Road 71.6 1.00 E 235.7 1.69 F
VA 123 at US 29/50 - Fairfax Boulevard 94.9 1.12 F 69.8 0.90 E
VA 123 at Eaton Place 43.6 0.70 D 59.0 0.70 E
VA 123 at White Granite Drive 25.4 0.61 C 43.6 0.78 D
Nutley Street at Virginia Center Boulevard/Marshall Road 33.7 0.56 C 36.1 0.64 D
Nutley Street at Saintsbury Drive 15.8 0.58 B 19.9 0.62 B
Note: Red shading indicates LOS F, orange shading indicates LOS E.
Delay is reported as average delay per vehicle, measured in seconds per vehicle. V/C is volume to capacity ratio, as calculated per the HCM guidelines. LOS is a qualitative measure of an intersection’s performance and is ranked from A to F; an intersection’s LOS is typically at LOS F once the control delay at the intersection reaches an average of 80 seconds per vehicle.
The analysis shows that under No-Build Conditions, compared to existing conditions, the number of intersections that would operate at LOS E or F would increase from seven to nine in the AM peak hour. For the PM peak hour, the number of intersections at LOS E or F increases from ten to twelve. It should be noted that only one intersection of the ones operating at LOS E or F are ramp termini; all others are at intersections adjacent to the interchanges. The ramp terminus intersection at the I-66 westbound off-ramp to northbound VA 28 is expected to operate at LOS F. 19 The level of service (LOS) characterizes the operating conditions on the facility in terms of traffic performance measures
related to speed and travel time, freedom to maneuver, traffic interruptions, and comfort and convenience. In general, LOS can be characterized as follows: A = free flow; B = reasonably free flow; C = stable flow; D = approaching unstable flow; E = unstable flow; F = forced or breakdown flow.
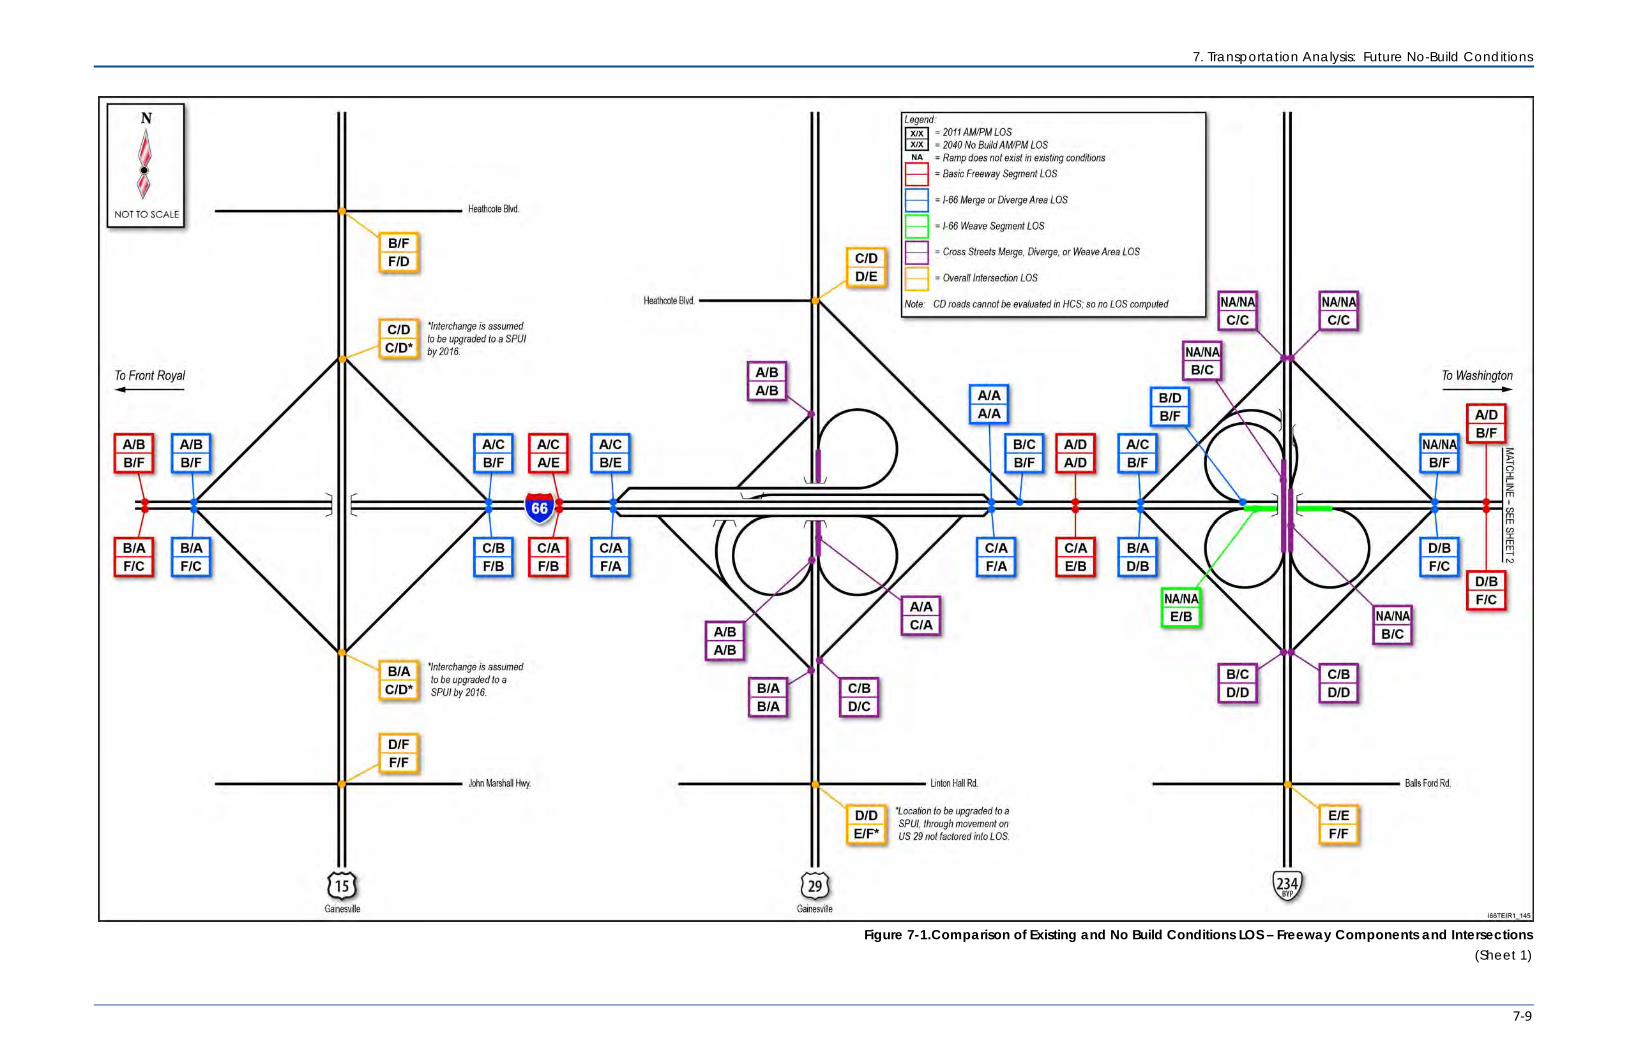
7. Transportation Analysis: Future No-Build Conditions
7-9
Figure 7-1.Comparison of Existing and No Build Conditions LOS – Freeway Components and Intersections
(Sheet 1)
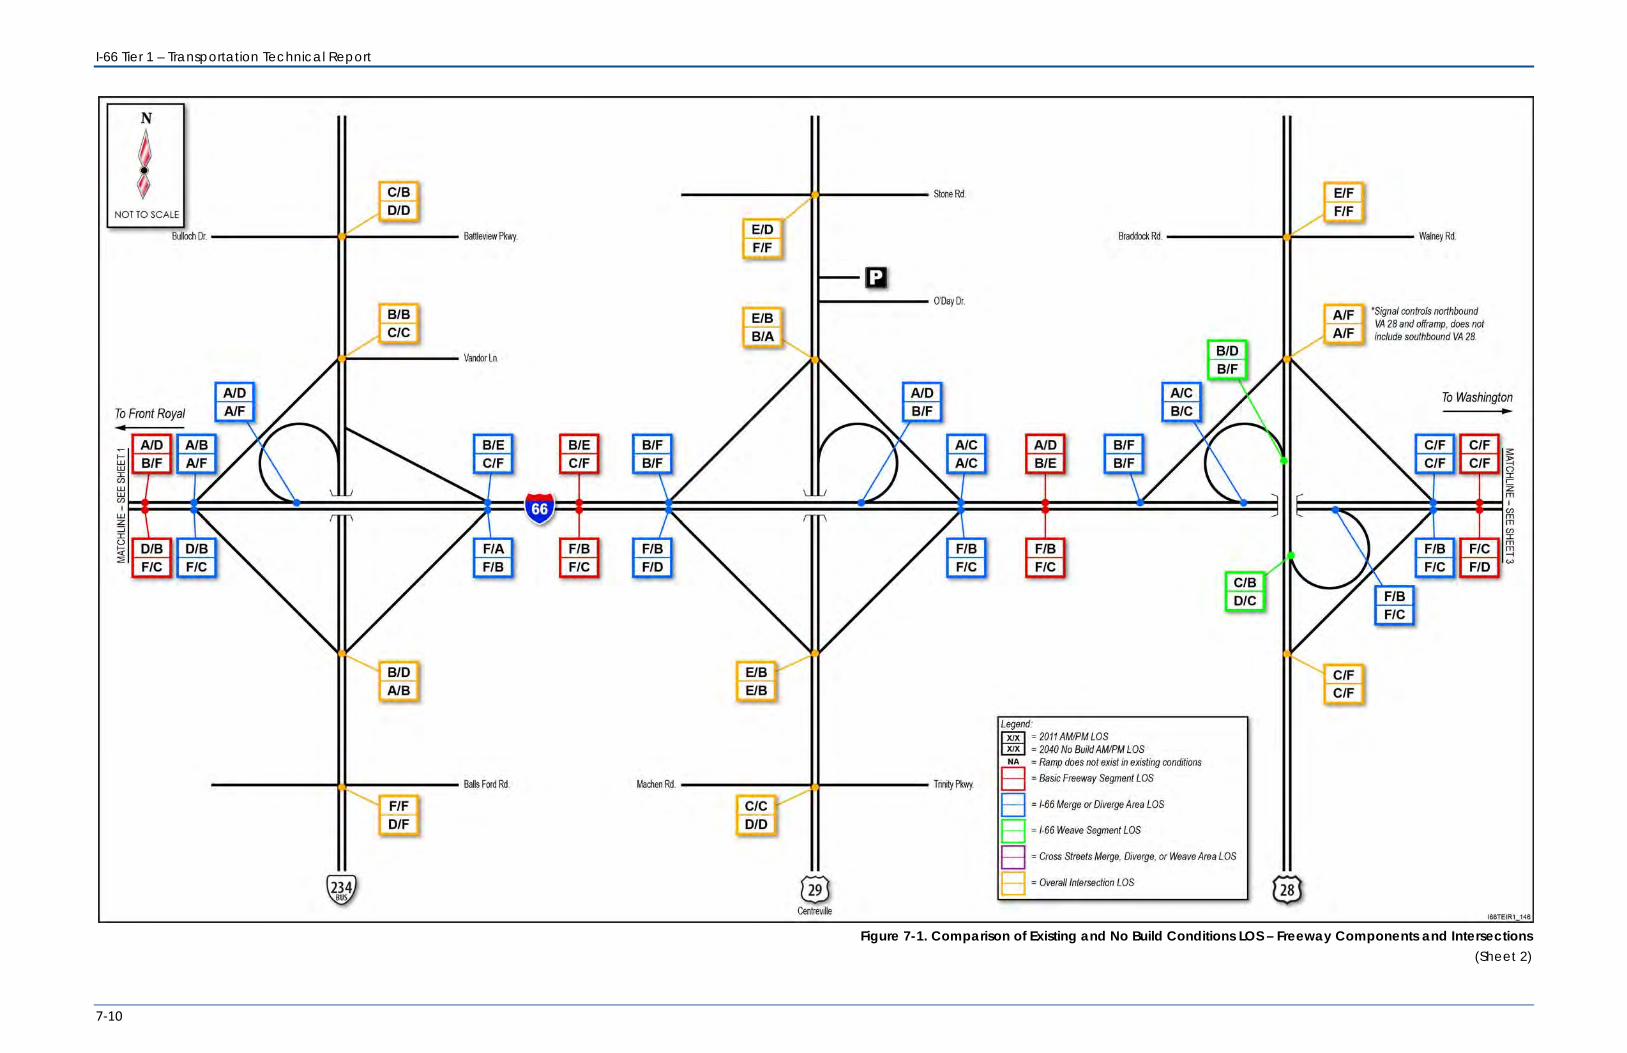
I-66 Tier 1 – Transportation Technical Report
7-10
Figure 7-1. Comparison of Existing and No Build Conditions LOS – Freeway Components and Intersections
(Sheet 2)
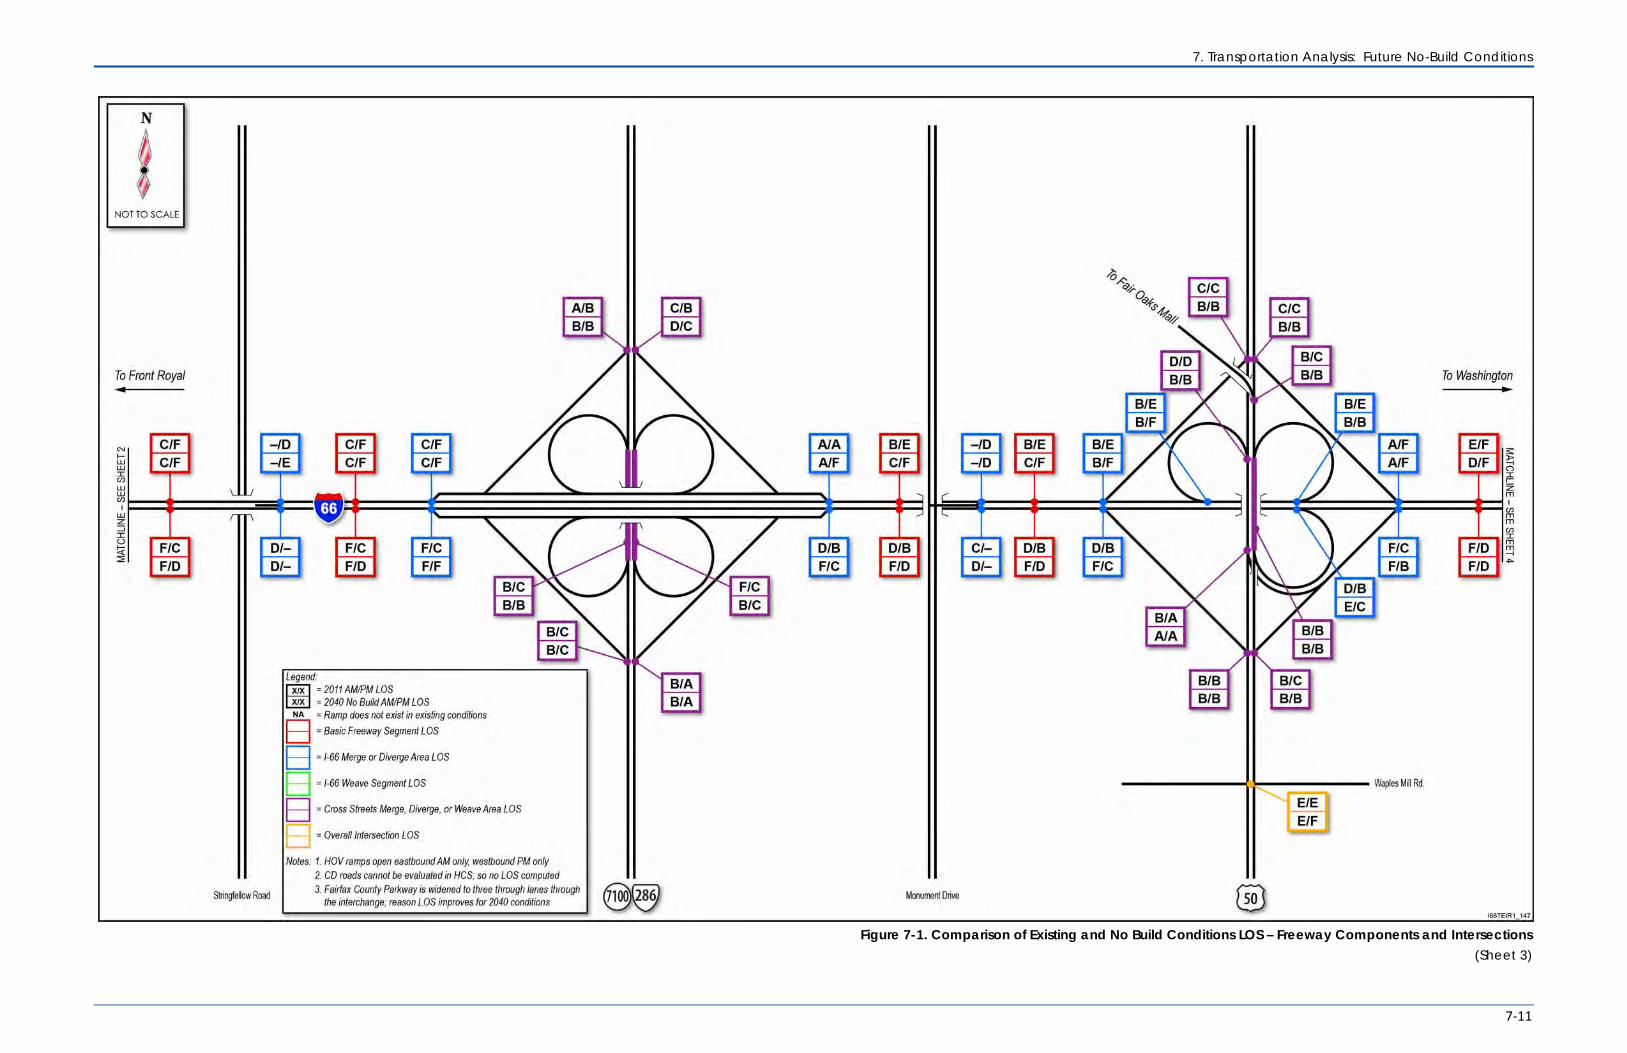
7. Transportation Analysis: Future No-Build Conditions
7-11
Figure 7-1. Comparison of Existing and No Build Conditions LOS – Freeway Components and Intersections
(Sheet 3)
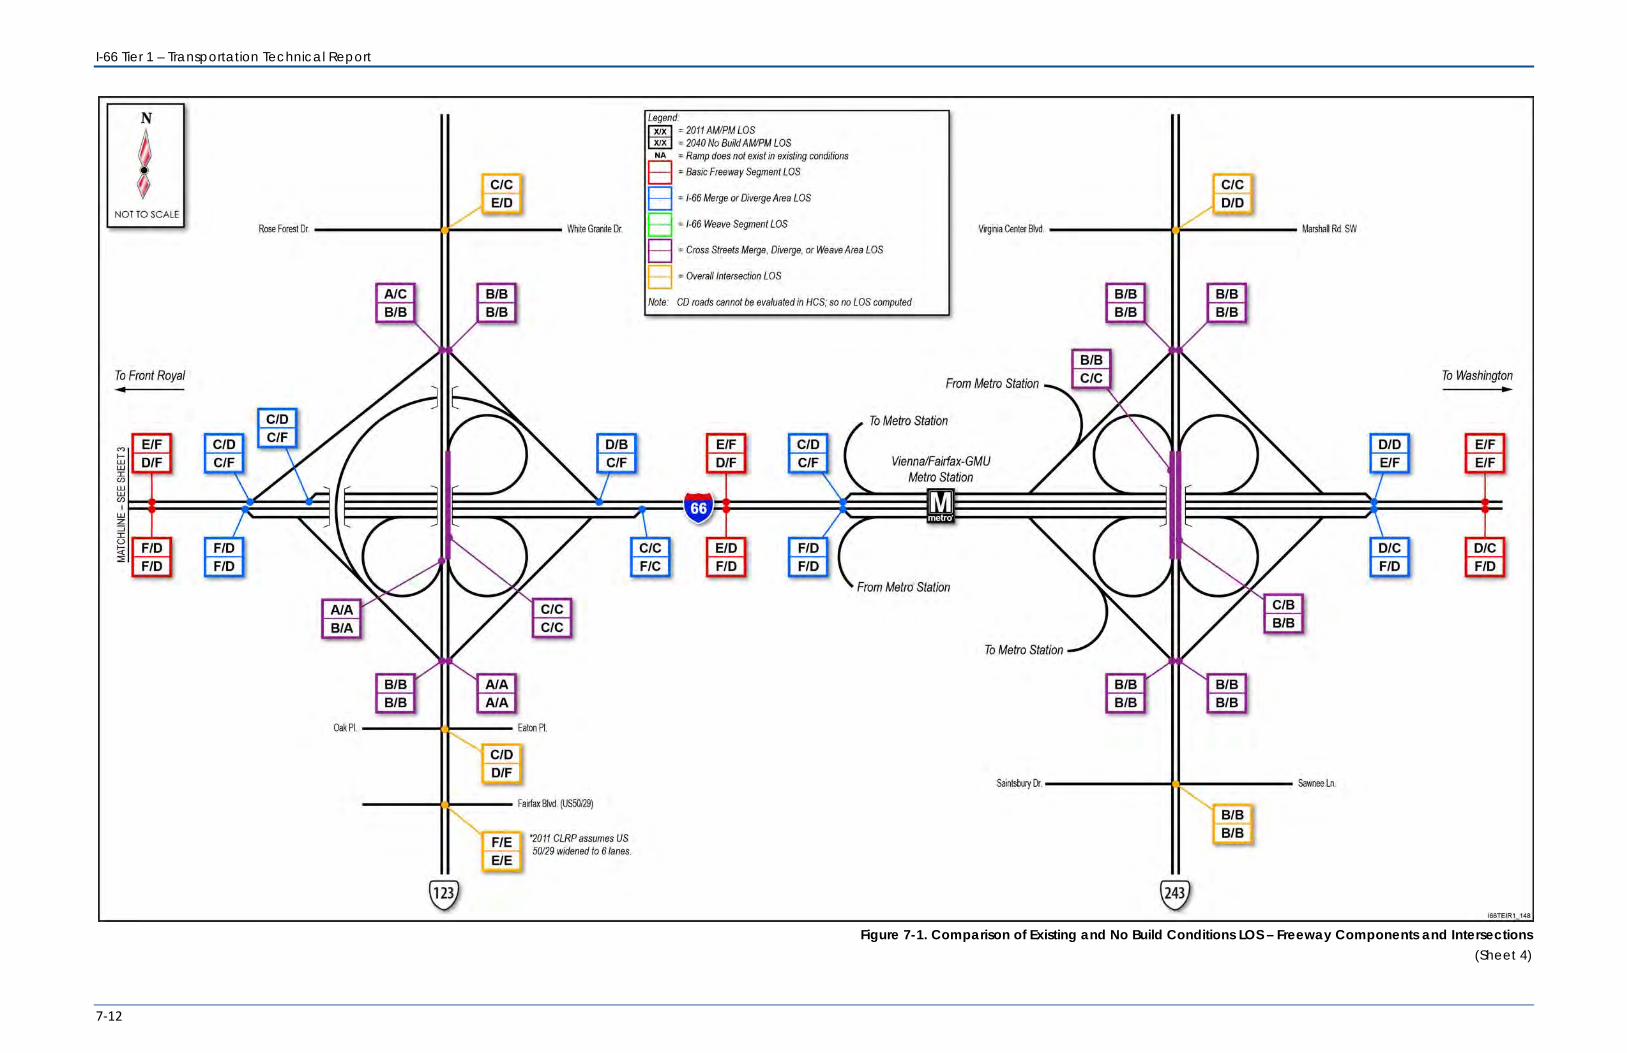
I-66 Tier 1 – Transportation Technical Report
7-12
Figure 7-1. Comparison of Existing and No Build Conditions LOS – Freeway Components and Intersections
(Sheet 4)
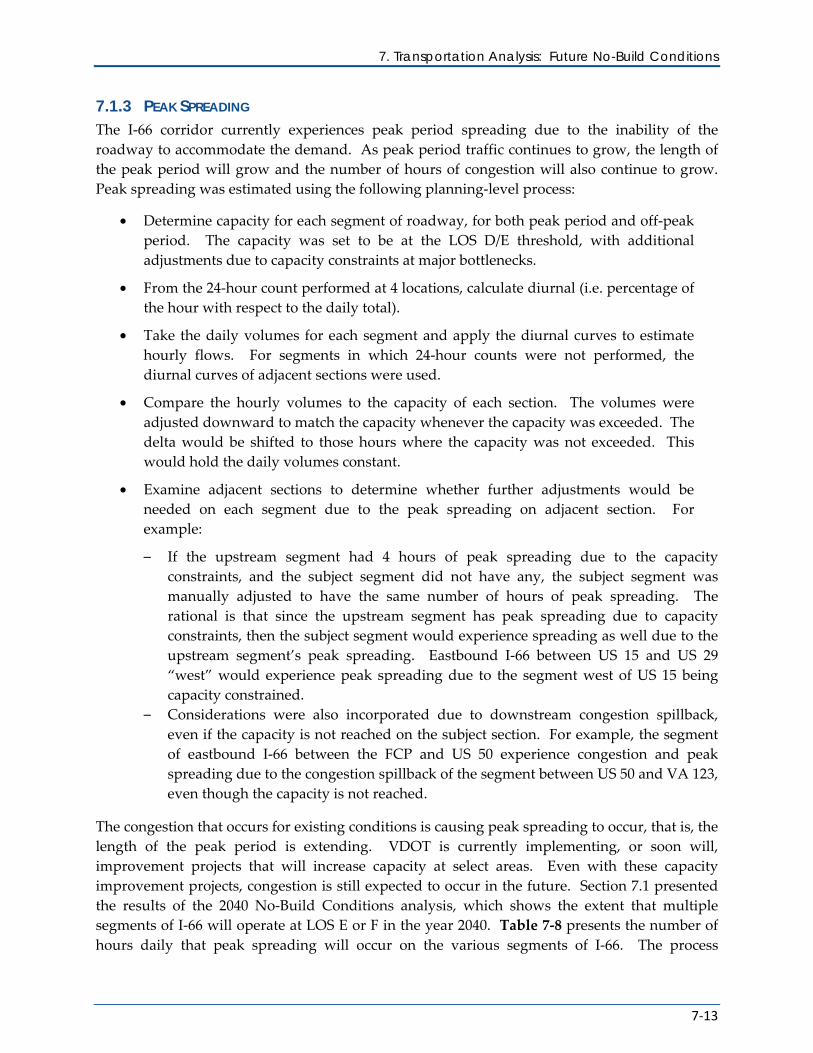
7. Transportation Analysis: Future No-Build Conditions
7-13
7.1.3 PEAK SPREADING The I-66 corridor currently experiences peak period spreading due to the inability of the roadway to accommodate the demand. As peak period traffic continues to grow, the length of the peak period will grow and the number of hours of congestion will also continue to grow. Peak spreading was estimated using the following planning-level process:
• Determine capacity for each segment of roadway, for both peak period and off-peak period. The capacity was set to be at the LOS D/E threshold, with additional adjustments due to capacity constraints at major bottlenecks.
• From the 24-hour count performed at 4 locations, calculate diurnal (i.e. percentage of the hour with respect to the daily total).
• Take the daily volumes for each segment and apply the diurnal curves to estimate hourly flows. For segments in which 24-hour counts were not performed, the diurnal curves of adjacent sections were used.
• Compare the hourly volumes to the capacity of each section. The volumes were adjusted downward to match the capacity whenever the capacity was exceeded. The delta would be shifted to those hours where the capacity was not exceeded. This would hold the daily volumes constant.
• Examine adjacent sections to determine whether further adjustments would be needed on each segment due to the peak spreading on adjacent section. For example:
– If the upstream segment had 4 hours of peak spreading due to the capacity constraints, and the subject segment did not have any, the subject segment was manually adjusted to have the same number of hours of peak spreading. The rational is that since the upstream segment has peak spreading due to capacity constraints, then the subject segment would experience spreading as well due to the upstream segment’s peak spreading. Eastbound I-66 between US 15 and US 29 “west” would experience peak spreading due to the segment west of US 15 being capacity constrained.
– Considerations were also incorporated due to downstream congestion spillback, even if the capacity is not reached on the subject section. For example, the segment of eastbound I-66 between the FCP and US 50 experience congestion and peak spreading due to the congestion spillback of the segment between US 50 and VA 123, even though the capacity is not reached.
The congestion that occurs for existing conditions is causing peak spreading to occur, that is, the length of the peak period is extending. VDOT is currently implementing, or soon will, improvement projects that will increase capacity at select areas. Even with these capacity improvement projects, congestion is still expected to occur in the future. Section 7.1 presented the results of the 2040 No-Build Conditions analysis, which shows the extent that multiple segments of I-66 will operate at LOS E or F in the year 2040. Table 7-8 presents the number of hours daily that peak spreading will occur on the various segments of I-66. The process
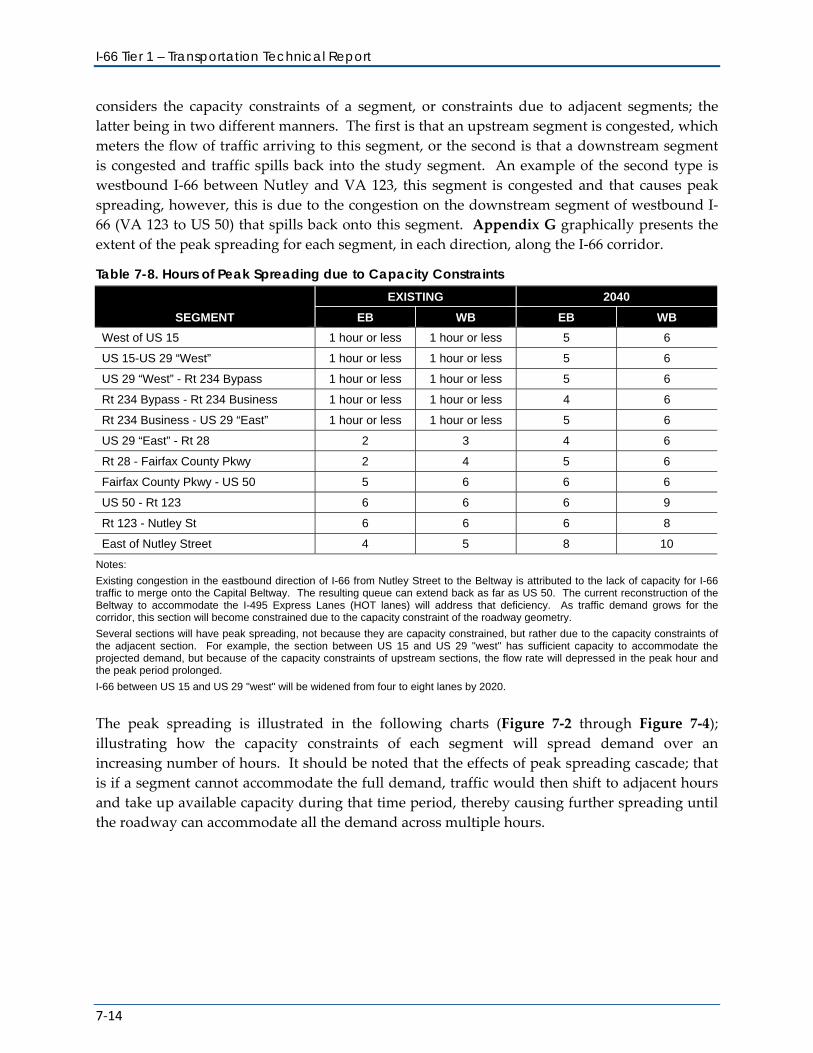
I-66 Tier 1 – Transportation Technical Report
7-14
considers the capacity constraints of a segment, or constraints due to adjacent segments; the latter being in two different manners. The first is that an upstream segment is congested, which meters the flow of traffic arriving to this segment, or the second is that a downstream segment is congested and traffic spills back into the study segment. An example of the second type is westbound I-66 between Nutley and VA 123, this segment is congested and that causes peak spreading, however, this is due to the congestion on the downstream segment of westbound I-66 (VA 123 to US 50) that spills back onto this segment. Appendix G graphically presents the extent of the peak spreading for each segment, in each direction, along the I-66 corridor.
Table 7-8. Hours of Peak Spreading due to Capacity Constraints
SEGMENT
EXISTING 2040
EB WB EB WB
West of US 15 1 hour or less 1 hour or less 5 6
US 15-US 29 “West” 1 hour or less 1 hour or less 5 6
US 29 “West” - Rt 234 Bypass 1 hour or less 1 hour or less 5 6
Rt 234 Bypass - Rt 234 Business 1 hour or less 1 hour or less 4 6
Rt 234 Business - US 29 “East” 1 hour or less 1 hour or less 5 6
US 29 “East” - Rt 28 2 3 4 6
Rt 28 - Fairfax County Pkwy 2 4 5 6
Fairfax County Pkwy - US 50 5 6 6 6
US 50 - Rt 123 6 6 6 9
Rt 123 - Nutley St 6 6 6 8
East of Nutley Street 4 5 8 10
Notes:
Existing congestion in the eastbound direction of I-66 from Nutley Street to the Beltway is attributed to the lack of capacity for I-66 traffic to merge onto the Capital Beltway. The resulting queue can extend back as far as US 50. The current reconstruction of the Beltway to accommodate the I-495 Express Lanes (HOT lanes) will address that deficiency. As traffic demand grows for the corridor, this section will become constrained due to the capacity constraint of the roadway geometry.
Several sections will have peak spreading, not because they are capacity constrained, but rather due to the capacity constraints of the adjacent section. For example, the section between US 15 and US 29 "west" has sufficient capacity to accommodate the projected demand, but because of the capacity constraints of upstream sections, the flow rate will depressed in the peak hour and the peak period prolonged.
I-66 between US 15 and US 29 "west" will be widened from four to eight lanes by 2020.
The peak spreading is illustrated in the following charts (Figure 7-2 through Figure 7-4); illustrating how the capacity constraints of each segment will spread demand over an increasing number of hours. It should be noted that the effects of peak spreading cascade; that is if a segment cannot accommodate the full demand, traffic would then shift to adjacent hours and take up available capacity during that time period, thereby causing further spreading until the roadway can accommodate all the demand across multiple hours.
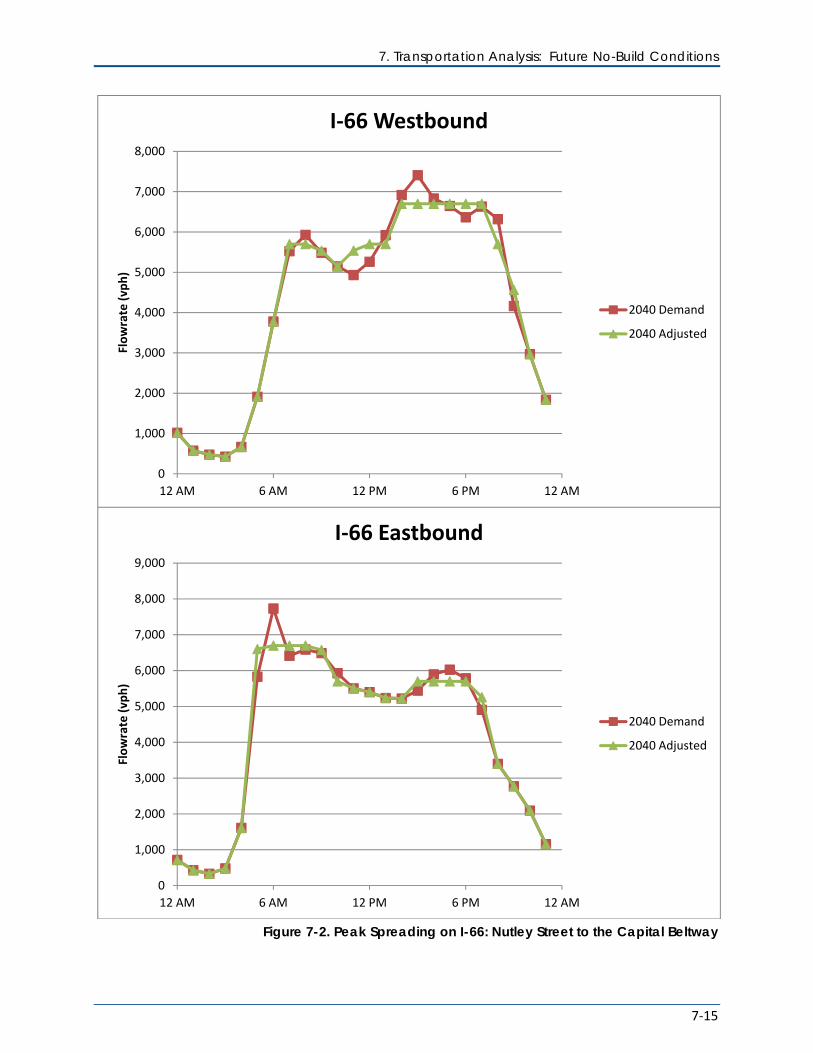
7. Transportation Analysis: Future No-Build Conditions
7-15
Figure 7-2. Peak Spreading on I-66: Nutley Street to the Capital Beltway
0
1,000
2,000
3,000
4,000
5,000
6,000
7,000
8,000
12 AM 6 AM 12 PM 6 PM 12 AM
Flow
rate
(vph
)I-66 Westbound
2040 Demand
2040 Adjusted
0
1,000
2,000
3,000
4,000
5,000
6,000
7,000
8,000
9,000
12 AM 6 AM 12 PM 6 PM 12 AM
Flow
rate
(vph
)
I-66 Eastbound
2040 Demand
2040 Adjusted
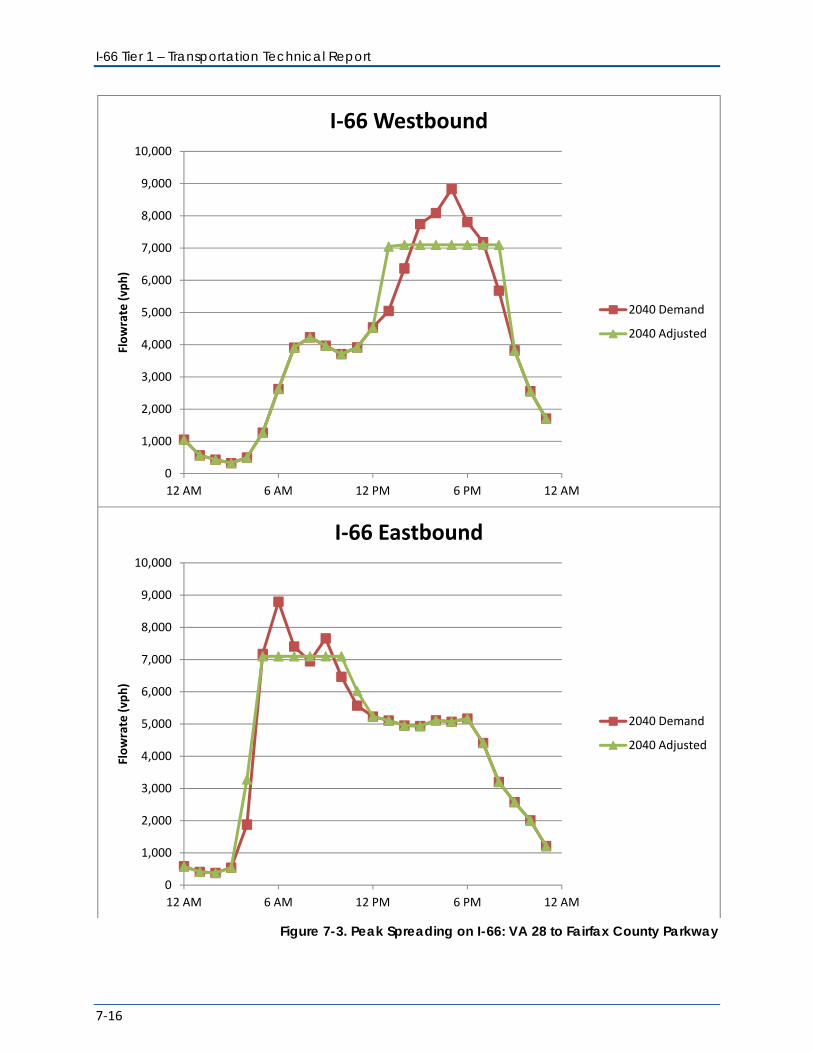
I-66 Tier 1 – Transportation Technical Report
7-16
Figure 7-3. Peak Spreading on I-66: VA 28 to Fairfax County Parkway
0
1,000
2,000
3,000
4,000
5,000
6,000
7,000
8,000
9,000
10,000
12 AM 6 AM 12 PM 6 PM 12 AM
Flow
rate
(vph
)I-66 Westbound
2040 Demand
2040 Adjusted
0
1,000
2,000
3,000
4,000
5,000
6,000
7,000
8,000
9,000
10,000
12 AM 6 AM 12 PM 6 PM 12 AM
Flow
rate
(vph
)
I-66 Eastbound
2040 Demand
2040 Adjusted
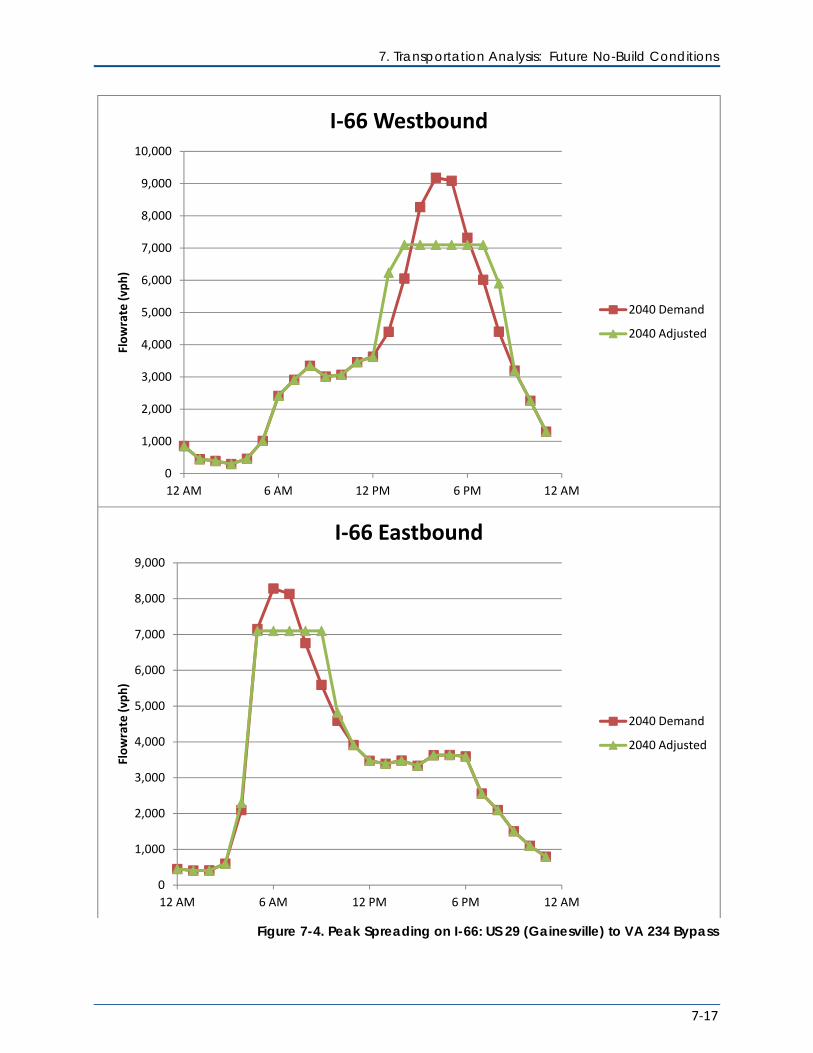
7. Transportation Analysis: Future No-Build Conditions
7-17
Figure 7-4. Peak Spreading on I-66: US 29 (Gainesville) to VA 234 Bypass
0
1,000
2,000
3,000
4,000
5,000
6,000
7,000
8,000
9,000
10,000
12 AM 6 AM 12 PM 6 PM 12 AM
Flow
rate
(vph
)I-66 Westbound
2040 Demand
2040 Adjusted
0
1,000
2,000
3,000
4,000
5,000
6,000
7,000
8,000
9,000
12 AM 6 AM 12 PM 6 PM 12 AM
Flow
rate
(vph
)
I-66 Eastbound
2040 Demand
2040 Adjusted
I-66 Tier 1 – Transportation Technical Report
7-18
7.1.4 MAJOR POINTS OF CONGESTION In addition to the need for overall transportation capacity in the I-66 corridor as presented previously in Section 7.1, traffic operations are adversely affected by points of constraint based on either capacity or geometric issues. There are a number of localized constraints (chokepoints), where daily peak period congestion occurs:
• Route 234 Bypass interchange. The merge area on I-66 for the northbound Route 234 movement to the eastbound I-66 movement is projected to deteriorate from LOS D to LOS F in the AM peak hour.
• Route 234 Business. Operational analysis indicates that the on-ramp to eastbound I-66 would perform at LOS F in the 2040 AM peak hour conditions due to short acceleration lanes. In the PM peak hour, the off-ramps would perform at LOS F in the 2040 conditions due to heavy exiting volumes. Four signals within a half mile causes operational deficiencies on Route 234 Business, as queue spill back from one signal affects the adjacent signals, including the I-66 off-ramps.
• US 29 “east” interchange. The merge and diverge areas on I-66 will operate at LOS F during the peak hours in the peak direction of flow. Close proximity of signals on US 29 periodically causes operational problems when one signal is above capacity and queues extend back to adjacent signals.
• I-66 mainline between US 29 “east” and VA 28. The eastbound direction of I-66 slows down due to the heavy entering traffic from US 29 and the heavy exiting traffic at VA 28 due to the lack of a weaving lane to accommodate the heavy weaving movements.
• VA 28 Interchange. The off-ramps from I-66 are projected to operate at LOS F during the peak periods in the peak direction of travel. Short acceleration lanes on VA 28 causes poor merging operations, which lead to traffic queues to spillback onto I-66 in each peak hour. The southbound to eastbound movement is accommodated by a left turn phase at a signal, however the demand exceeds the storage provided, and queues extend back into the southbound mainline impacting through movement. Queues often extend back beyond the signal at Braddock Road. The signal at Braddock Road/Walney Road is within the interchange influence area; to accommodate the left turns originating from westbound I-66, an intermediate signal is provided for cross-over movement from the ramp to the left turn bay, which impacts northbound VA 28 flows. All signals within the interchange influence area will operate at LOS F in 2040 conditions.
• VA 286 (Fairfax County Parkway) Interchange. The merge/diverge areas on I-66 to/from the collector distributor (CD) roads will operate at LOS F by 2040.
• US 50 Interchange. At this interchange, I-66 transitions from an eight lane facility to a six lane facility (with the shoulder lane being used as a fourth lane in the peak direction). In the eastbound direction, congestion reoccurs daily at the merge from US 50 due to the heavy volumes merging; in essence, a four lane I-66 merges with a
7. Transportation Analysis: Future No-Build Conditions
7-19
two-lane on-ramp from US 50 to feed a four lane section downstream. Part of the merging issue is caused by short acceleration lanes. The close proximity of the access points of Fair Oaks Mall also impacts this interchange.
• Route 123 Interchange. Poor acceleration lane lengths cause poor merging operation, which impacts travel speeds on I-66.
• Nutley Street/Vienna Metrorail Station Access Interchange. Operational analyses of the I-66 merge and diverge areas into/from the CD roads indicate that these points will not accommodate the projected demand. Analysis of the CD roads indicates that it will not accommodate the demand.
7.1.5 CORRIDOR-WIDE AND SPOT LOCATION SAFETY The forecasts project that the daily volumes on I-66 will increase by 2040. As a number of segments are currently at capacity during the AM and PM peak hours, it can be expected that peak spreading will continue to occur (i.e. lengthening of the peak periods) as described in Section 7.1.3. In addition, sections not currently congested, can be expected to become congested, as the 2040 No-Build AM and PM peak hour analysis indicates that more sections will operate at LOS E or F, as described in Section 7.1. As congestion increases in the corridor, it can be expected that number of rear-end collisions will increase. Likewise, an increase in the number of sideswipe crashes is likely to occur in areas of heavy merging traffic. Section 5 presented crash summary and identified high crash locations for the existing conditions, and those crash locations are repeated below:
• Westbound I-66 at VA 234 Business
• Eastbound I-66 at VA 234 Business
• Westbound I-66 at Centreville
• Eastbound I-66 at Centreville
• Eastbound I-66 prior to US 50
• Eastbound I-66 after US 50
• Westbound I-66 West of VA 123
• Eastbound I-66 at VA 123
• Westbound I-66 at VA
• Eastbound I-66 at Vienna Metrorail Station
• Westbound I-66 at Vienna Metrorail Station
• Eastbound I-66 at I-495
7.2 TRANSIT RIDERSHIP AND OPERATIONS As previously discussed, the number of Blue and Orange trains that can operate in Virginia is limited due to capacity constraints where the two lines merge in Rosslyn as well as constraints in the tunnel going into the District of Columbia. Additional demands on available capacity
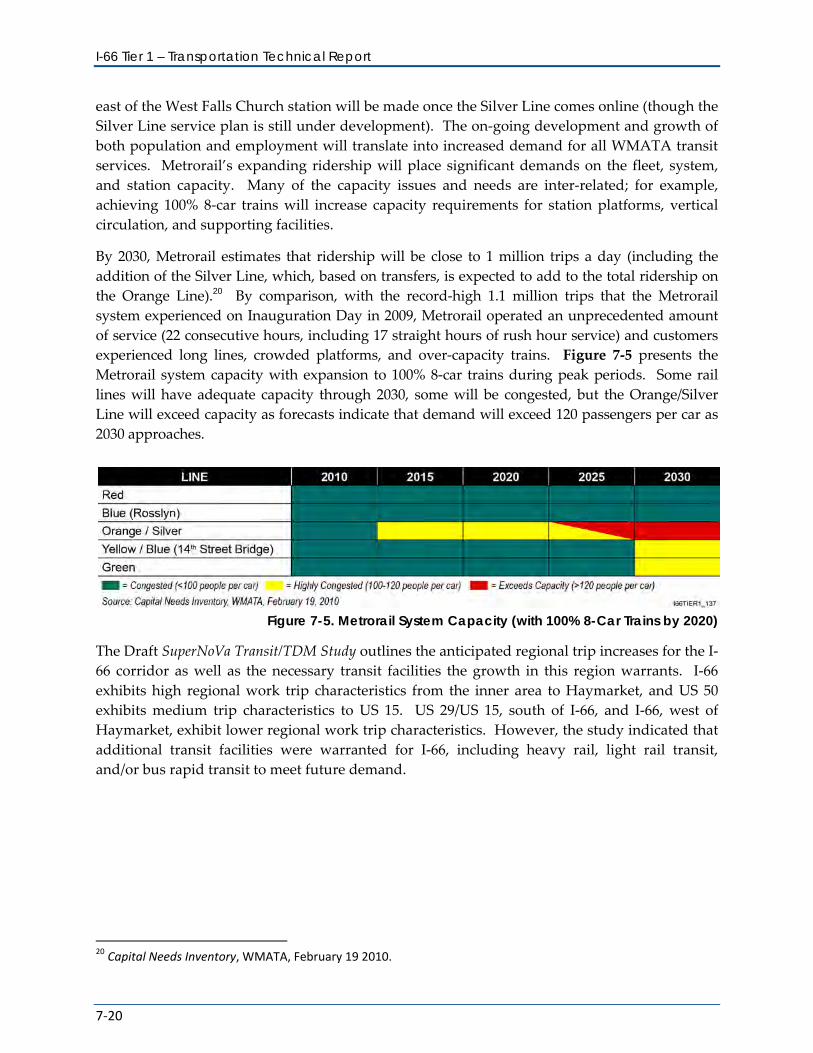
I-66 Tier 1 – Transportation Technical Report
7-20
east of the West Falls Church station will be made once the Silver Line comes online (though the Silver Line service plan is still under development). The on-going development and growth of both population and employment will translate into increased demand for all WMATA transit services. Metrorail’s expanding ridership will place significant demands on the fleet, system, and station capacity. Many of the capacity issues and needs are inter-related; for example, achieving 100% 8-car trains will increase capacity requirements for station platforms, vertical circulation, and supporting facilities.
By 2030, Metrorail estimates that ridership will be close to 1 million trips a day (including the addition of the Silver Line, which, based on transfers, is expected to add to the total ridership on the Orange Line).20 By comparison, with the record-high 1.1 million trips that the Metrorail system experienced on Inauguration Day in 2009, Metrorail operated an unprecedented amount of service (22 consecutive hours, including 17 straight hours of rush hour service) and customers experienced long lines, crowded platforms, and over-capacity trains. Figure 7-5 presents the Metrorail system capacity with expansion to 100% 8-car trains during peak periods. Some rail lines will have adequate capacity through 2030, some will be congested, but the Orange/Silver Line will exceed capacity as forecasts indicate that demand will exceed 120 passengers per car as 2030 approaches.
Figure 7-5. Metrorail System Capacity (with 100% 8-Car Trains by 2020)
The Draft SuperNoVa Transit/TDM Study outlines the anticipated regional trip increases for the I-66 corridor as well as the necessary transit facilities the growth in this region warrants. I-66 exhibits high regional work trip characteristics from the inner area to Haymarket, and US 50 exhibits medium trip characteristics to US 15. US 29/US 15, south of I-66, and I-66, west of Haymarket, exhibit lower regional work trip characteristics. However, the study indicated that additional transit facilities were warranted for I-66, including heavy rail, light rail transit, and/or bus rapid transit to meet future demand.
20 Capital Needs Inventory, WMATA, February 19 2010.
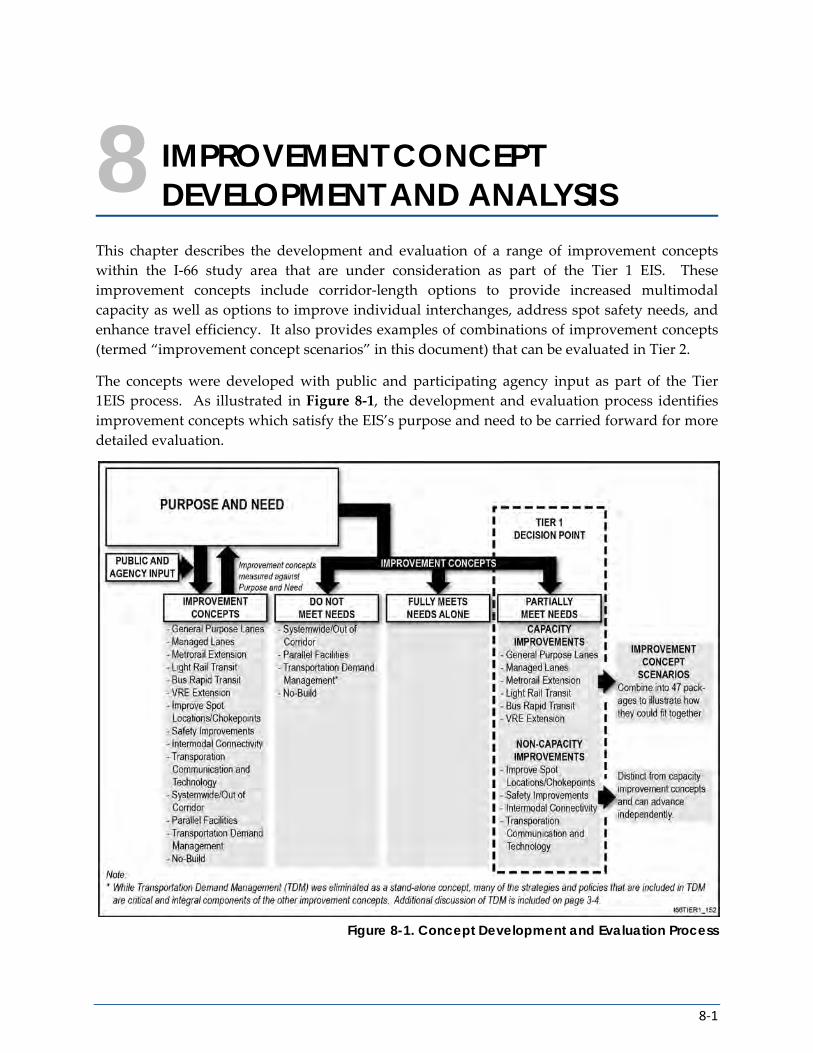
8-1
8 IMPROVEMENT CONCEPT DEVELOPMENT AND ANALYSIS
This chapter describes the development and evaluation of a range of improvement concepts within the I-66 study area that are under consideration as part of the Tier 1 EIS. These improvement concepts include corridor-length options to provide increased multimodal capacity as well as options to improve individual interchanges, address spot safety needs, and enhance travel efficiency. It also provides examples of combinations of improvement concepts (termed “improvement concept scenarios” in this document) that can be evaluated in Tier 2.
The concepts were developed with public and participating agency input as part of the Tier 1EIS process. As illustrated in Figure 8-1, the development and evaluation process identifies improvement concepts which satisfy the EIS’s purpose and need to be carried forward for more detailed evaluation.
Figure 8-1. Concept Development and Evaluation Process
I-66 Tier 1 – Transportation Technical Report
8-2
8.1 CONCEPT DEVELOPMENT AND EVALUATION PROCESS
8.1.1 GOALS AND OBJECTIVES While the goal of the evaluation process is to address the purpose and need (as presented in Chapter 2 in the EIS), specific goals and objectives were developed in cooperation with participating agencies and the general public. These goals and objectives were used as a guide in the development of the improvement concepts. Improvement concepts presented in the EIS and this supporting report were developed with the following considerations:
• Addressing the safe movement of people and goods;
• Capitalizing on the use of existing facilities to the extent practicable;
• Improving accessibility to existing and future developments;
• Creating connections between centers of employment, education, residence, shopping, culture, and entertainment;
• Funding and cost effectiveness;
• Providing high-capacity, multimodal transportation facilities with attractive travel choices;
• Minimizing project operating and maintenance costs;
• Minimizing impacts to the human and natural environments; and
• Supporting state, regional and local plans and policies.
In order to meet the Transportation Capacity Deficiencies and Major Points of Congestion needs, consideration was given to reducing travel times, increasing person through-put in the corridor, and creating opportunities to manage travel demand.
When developing improvement concepts to meet the Limited Travel Mode Choices need, consideration was given to increasing mobility options; providing enhanced rail and bus services to support mode choices; providing focused transit infrastructure including transit stations with Park-and-Ride connectivity to transit services; providing infrastructure that supports connectivity to general purpose lanes, managed lanes and transit infrastructure; improving connectivity to bike/pedestrian networks from transit infrastructure; providing improved mobility and mode choice to transit oriented development (TOD); and integrating transit service with local bus, bicycle, pedestrian, and private automobile travel modes and facilities.
To address the Safety Deficiencies and Transportation Predictability needs, consideration was given to spot roadway improvements as well as supporting the use of Intelligent Transportation Systems (ITS) and operations techniques such as incident management and active traffic management during the concept development process.
8.1.2 IMPROVEMENT CONCEPTS The term improvement concept is used in the EIS documents rather than the traditional term alternative because the improvements developed for this Tier 1 study are conceptual. These
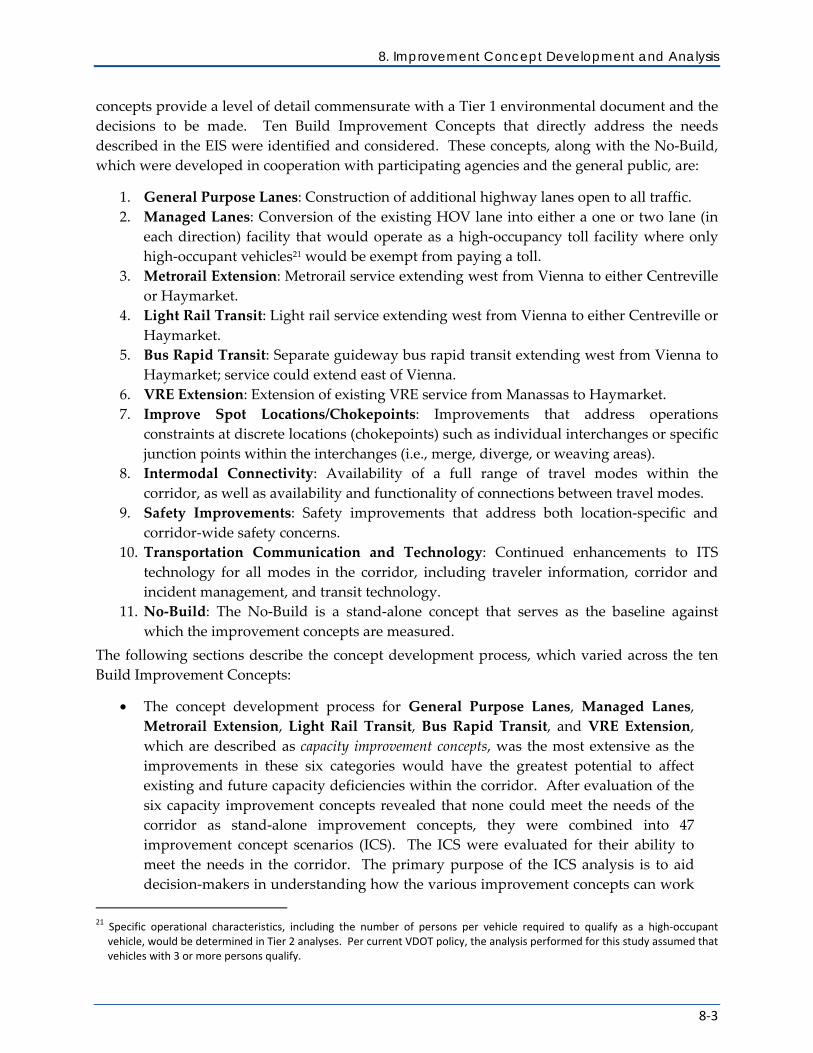
8. Improvement Concept Development and Analysis
8-3
concepts provide a level of detail commensurate with a Tier 1 environmental document and the decisions to be made. Ten Build Improvement Concepts that directly address the needs described in the EIS were identified and considered. These concepts, along with the No-Build, which were developed in cooperation with participating agencies and the general public, are:
1. General Purpose Lanes: Construction of additional highway lanes open to all traffic. 2. Managed Lanes: Conversion of the existing HOV lane into either a one or two lane (in
each direction) facility that would operate as a high-occupancy toll facility where only high-occupant vehicles21 would be exempt from paying a toll.
3. Metrorail Extension: Metrorail service extending west from Vienna to either Centreville or Haymarket.
4. Light Rail Transit: Light rail service extending west from Vienna to either Centreville or Haymarket.
5. Bus Rapid Transit: Separate guideway bus rapid transit extending west from Vienna to Haymarket; service could extend east of Vienna.
6. VRE Extension: Extension of existing VRE service from Manassas to Haymarket. 7. Improve Spot Locations/Chokepoints: Improvements that address operations
constraints at discrete locations (chokepoints) such as individual interchanges or specific junction points within the interchanges (i.e., merge, diverge, or weaving areas).
8. Intermodal Connectivity: Availability of a full range of travel modes within the corridor, as well as availability and functionality of connections between travel modes.
9. Safety Improvements: Safety improvements that address both location-specific and corridor-wide safety concerns.
10. Transportation Communication and Technology: Continued enhancements to ITS technology for all modes in the corridor, including traveler information, corridor and incident management, and transit technology.
11. No-Build: The No-Build is a stand-alone concept that serves as the baseline against which the improvement concepts are measured.
The following sections describe the concept development process, which varied across the ten Build Improvement Concepts:
• The concept development process for General Purpose Lanes, Managed Lanes, Metrorail Extension, Light Rail Transit, Bus Rapid Transit, and VRE Extension, which are described as capacity improvement concepts, was the most extensive as the improvements in these six categories would have the greatest potential to affect existing and future capacity deficiencies within the corridor. After evaluation of the six capacity improvement concepts revealed that none could meet the needs of the corridor as stand-alone improvement concepts, they were combined into 47 improvement concept scenarios (ICS). The ICS were evaluated for their ability to meet the needs in the corridor. The primary purpose of the ICS analysis is to aid decision-makers in understanding how the various improvement concepts can work
21 Specific operational characteristics, including the number of persons per vehicle required to qualify as a high-occupant
vehicle, would be determined in Tier 2 analyses. Per current VDOT policy, the analysis performed for this study assumed that vehicles with 3 or more persons qualify.
I-66 Tier 1 – Transportation Technical Report
8-4
together. However, in accordance with the MOA, the Tier 1 decision will be to advance an improvement concept(s) to Tier 2, and not a specific ICS22. This process, described in Section 8.2, resulted in the definition and analysis of capacity-related improvement concepts and ICSs.
• The process for the non-capacity improvement concepts (Improve Spot Locations/Chokepoints, Intermodal Connectivity, Safety Improvements, and Transportation Communication and Technology) followed a similar, but less detailed, process of developing and testing concepts with respect to the extent to which they address identified needs. This is due to the fact that these concepts focus more on a single mode and/or involve less potential interactions between modes and concepts; additionally, these concepts are generally more geographically focused and/or would involve lesser levels of potential impacts. These concepts can complement the capacity improvement concepts or serve in isolation to address components of the project’s purpose and need to varying degrees. Section 3.3 through Section 3.6 describes the concept development process for these remaining improvement concepts.
The No-Build Concept is described in Section 8.7. Section 8.8 provides the analysis results of the Build Improvement Concepts and ICSs, and Section 8.9 presents overall key findings of the improvement concept analysis.
8.1.3 OTHER IMPROVEMENT CONCEPTS ELIMINATED FROM DETAILED STUDY In addition to the improvement concepts carried forward in this document, a wide range of other transportation improvement concepts were considered but eliminated from further study. These included the improvement of parallel roadways and system-wide or out-of-corridor improvements to Metrorail (such as Metrorail core capacity improvements). While these concepts may be important to improving mobility across the region, they were not advanced as part of this study because it was determined that they would not directly address the needs within the study corridor across multiple dimensions, including those related to capacity deficiencies, major points of congestion, and travel time predictability.
In addition, Transportation Demand Management (TDM), which includes a range of strategies and policies that seek to reduce the demands on the transportation system by reducing travel by single-occupant vehicle (SOV); reducing peak period travel; promoting travel by transit, walking, or bicycling; and promoting more transportation-efficient land development patterns, has been eliminated as a stand-alone concept because of its inability to meet the purpose and need. TDM strategies, however, have been incorporated into the Build Improvement Concepts that were carried forward. For example, the Intermodal Connectivity improvement concept includes intermodal transportation centers that include connections to I-66 managed lanes and local bus service, are easily accessible by walking and bicycling, and provide information and amenities that support carpool and vanpool formation. The Managed Lanes improvement concepts also provide critical support for carpools and vanpools by ensuring travel time savings
22 Memorandum of Agreement among VDOT, VDRPT, FHWA and FTA Regarding the National Environmental Policy Act Process
for Improvements in the Interstate 66 Corridor (June 7, 2011). Additional discussion of the MOA is included in Chapter 1.
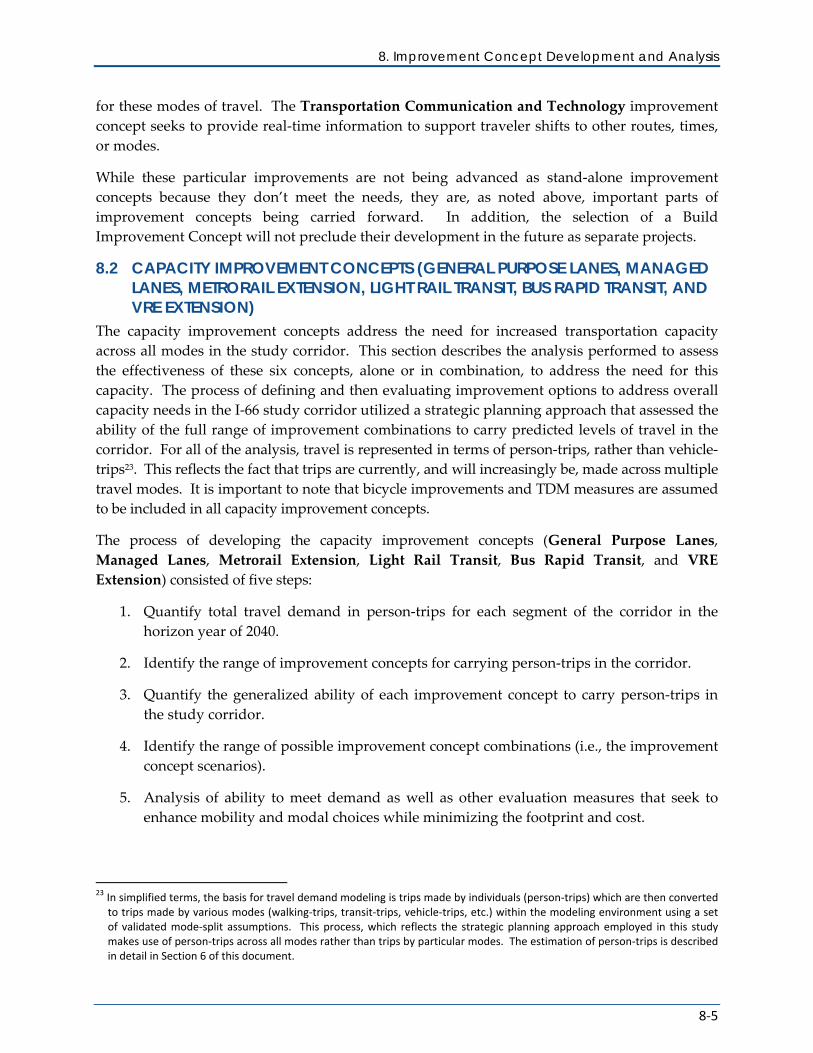
8. Improvement Concept Development and Analysis
8-5
for these modes of travel. The Transportation Communication and Technology improvement concept seeks to provide real-time information to support traveler shifts to other routes, times, or modes.
While these particular improvements are not being advanced as stand-alone improvement concepts because they don’t meet the needs, they are, as noted above, important parts of improvement concepts being carried forward. In addition, the selection of a Build Improvement Concept will not preclude their development in the future as separate projects.
8.2 CAPACITY IMPROVEMENT CONCEPTS (GENERAL PURPOSE LANES, MANAGED LANES, METRORAIL EXTENSION, LIGHT RAIL TRANSIT, BUS RAPID TRANSIT, AND VRE EXTENSION)
The capacity improvement concepts address the need for increased transportation capacity across all modes in the study corridor. This section describes the analysis performed to assess the effectiveness of these six concepts, alone or in combination, to address the need for this capacity. The process of defining and then evaluating improvement options to address overall capacity needs in the I-66 study corridor utilized a strategic planning approach that assessed the ability of the full range of improvement combinations to carry predicted levels of travel in the corridor. For all of the analysis, travel is represented in terms of person-trips, rather than vehicle-trips23. This reflects the fact that trips are currently, and will increasingly be, made across multiple travel modes. It is important to note that bicycle improvements and TDM measures are assumed to be included in all capacity improvement concepts.
The process of developing the capacity improvement concepts (General Purpose Lanes, Managed Lanes, Metrorail Extension, Light Rail Transit, Bus Rapid Transit, and VRE Extension) consisted of five steps:
1. Quantify total travel demand in person-trips for each segment of the corridor in the horizon year of 2040.
2. Identify the range of improvement concepts for carrying person-trips in the corridor.
3. Quantify the generalized ability of each improvement concept to carry person-trips in the study corridor.
4. Identify the range of possible improvement concept combinations (i.e., the improvement concept scenarios).
5. Analysis of ability to meet demand as well as other evaluation measures that seek to enhance mobility and modal choices while minimizing the footprint and cost.
23 In simplified terms, the basis for travel demand modeling is trips made by individuals (person-trips) which are then converted
to trips made by various modes (walking-trips, transit-trips, vehicle-trips, etc.) within the modeling environment using a set of validated mode-split assumptions. This process, which reflects the strategic planning approach employed in this study makes use of person-trips across all modes rather than trips by particular modes. The estimation of person-trips is described in detail in Section 6 of this document.
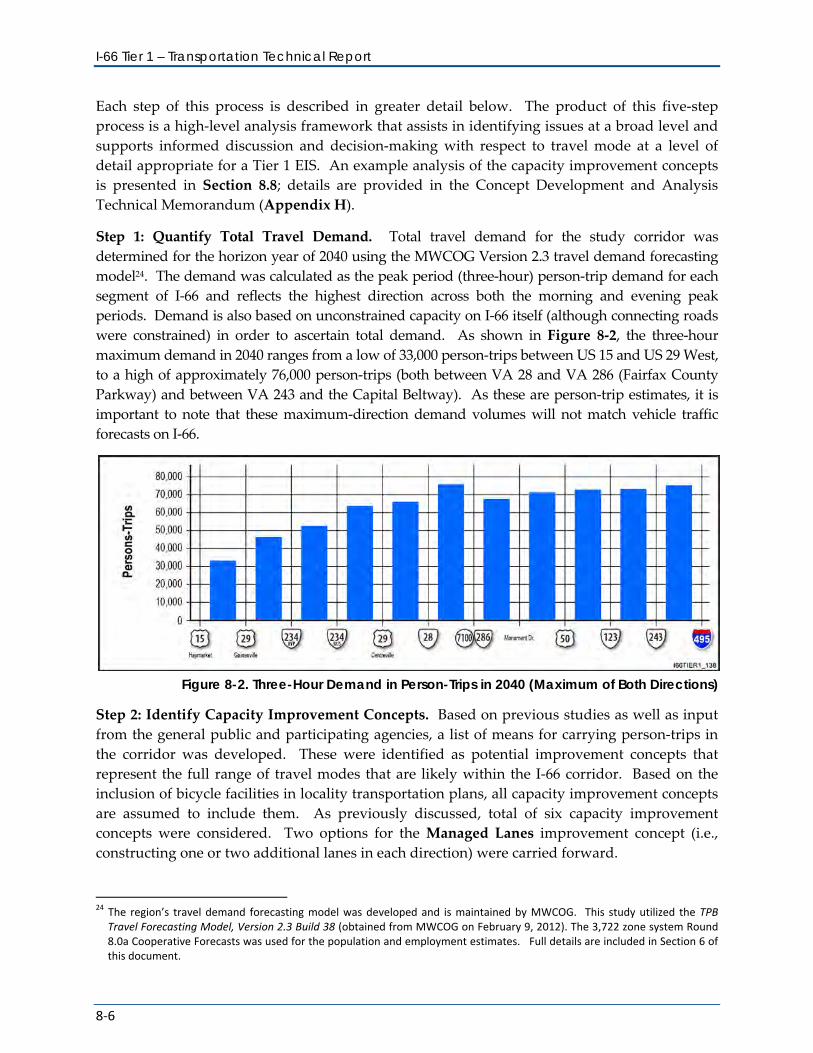
I-66 Tier 1 – Transportation Technical Report
8-6
Each step of this process is described in greater detail below. The product of this five-step process is a high-level analysis framework that assists in identifying issues at a broad level and supports informed discussion and decision-making with respect to travel mode at a level of detail appropriate for a Tier 1 EIS. An example analysis of the capacity improvement concepts is presented in Section 8.8; details are provided in the Concept Development and Analysis Technical Memorandum (Appendix H).
Step 1: Quantify Total Travel Demand. Total travel demand for the study corridor was determined for the horizon year of 2040 using the MWCOG Version 2.3 travel demand forecasting model24. The demand was calculated as the peak period (three-hour) person-trip demand for each segment of I-66 and reflects the highest direction across both the morning and evening peak periods. Demand is also based on unconstrained capacity on I-66 itself (although connecting roads were constrained) in order to ascertain total demand. As shown in Figure 8-2, the three-hour maximum demand in 2040 ranges from a low of 33,000 person-trips between US 15 and US 29 West, to a high of approximately 76,000 person-trips (both between VA 28 and VA 286 (Fairfax County Parkway) and between VA 243 and the Capital Beltway). As these are person-trip estimates, it is important to note that these maximum-direction demand volumes will not match vehicle traffic forecasts on I-66.
Figure 8-2. Three-Hour Demand in Person-Trips in 2040 (Maximum of Both Directions)
Step 2: Identify Capacity Improvement Concepts. Based on previous studies as well as input from the general public and participating agencies, a list of means for carrying person-trips in the corridor was developed. These were identified as potential improvement concepts that represent the full range of travel modes that are likely within the I-66 corridor. Based on the inclusion of bicycle facilities in locality transportation plans, all capacity improvement concepts are assumed to include them. As previously discussed, total of six capacity improvement concepts were considered. Two options for the Managed Lanes improvement concept (i.e., constructing one or two additional lanes in each direction) were carried forward.
24 The region’s travel demand forecasting model was developed and is maintained by MWCOG. This study utilized the TPB
Travel Forecasting Model, Version 2.3 Build 38 (obtained from MWCOG on February 9, 2012). The 3,722 zone system Round 8.0a Cooperative Forecasts was used for the population and employment estimates. Full details are included in Section 6 of this document.
8. Improvement Concept Development and Analysis
8-7
1. General Purpose Lanes (GP): Representing up to nine additional lanes (in each direction) depending on demand.
2. Managed Lanes 1 & 2 (ML1 & ML2): Representing one or two additional lanes in each direction that would operate as a high-occupancy toll facility with non-toll vehicles carrying 3+ persons.
3. Metrorail Extension (Metrorail): Metrorail-type service extending west from Vienna to either Centreville or Haymarket.
4. Light Rail Transit (LRT): Light rail service extending west from Vienna to either Centreville or Haymarket.
5. Bus Rapid Transit (BRT): Separate guideway bus rapid transit extending west from Vienna to Haymarket; service could extend east of Vienna.
6. VRE Extension (VRE): Extension of existing VRE service from Manassas to Haymarket.
Step 3: Quantify Ability to Carry Person-Trips. The capacity improvement concepts represent discrete units with unique carrying abilities that can be put together in various combinations to accommodate the travel demands within the corridor. If one visualizes each capacity improvement concept as a “building block”, the carrying capacity (“size”) of each building block can be determined. Note that the size of the building block for purposes of this discussion is representative of what it can carry; the physical dimension of the building block (i.e., the width of a travel lane) is a separate characteristic.
The sizing of the concepts varies based on many measures including lane capacity, hourly demand curves, vehicle occupancy, directionality and peaking, vehicle mix, physical features, demand variables, and transit vehicle size, loads, and headways. Sizing considerations took into account all of these variables at a high-level. They were reviewed within the study team and compared with other facilities in the United States, and then presented and discussed at the May 31, 2012 Cooperating and Participating Agency Meeting. Based on feedback received at this May meeting as well as subsequent feedback received via e-mail, the study team further refined the building block sizes.
The sizing of the building blocks is highly variable, particularly for transit modes, based on many measures, including overall demand, development patterns, feeder bus service, support facilities such as Park-and-Ride lots, etc. Because of this variability, the study team identified three scenarios for the building block sizing that allowed for determination of the sensitivity of the sizing with respect to evaluations and findings. The three scenarios are as follows:
1. Base Scenario: Reflects carrying ability that is most achievable based on existing travel characteristics.
2. Reach Scenario: Reflects carrying ability that pushes the limits of transit mode shares, as well as enhancements to increase usage (such as Park-and-Ride lots, increased feeder bus service, etc.).
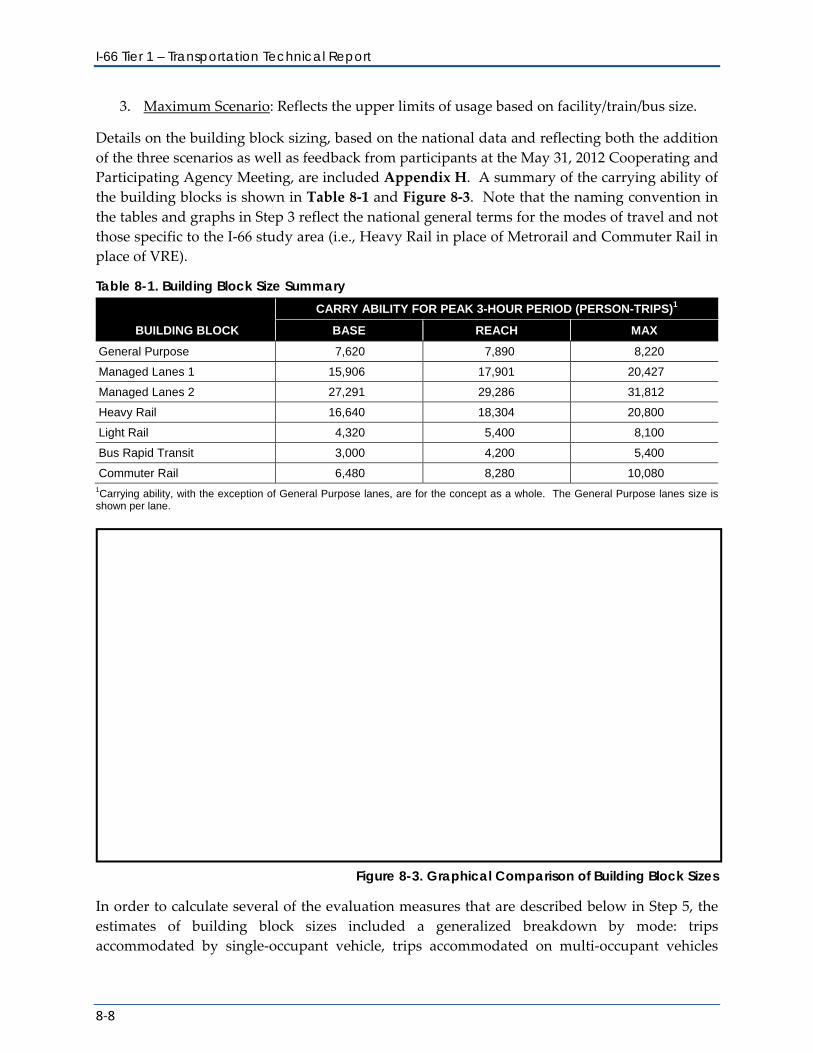
I-66 Tier 1 – Transportation Technical Report
8-8
3. Maximum Scenario: Reflects the upper limits of usage based on facility/train/bus size.
Details on the building block sizing, based on the national data and reflecting both the addition of the three scenarios as well as feedback from participants at the May 31, 2012 Cooperating and Participating Agency Meeting, are included Appendix H. A summary of the carrying ability of the building blocks is shown in Table 8-1 and Figure 8-3. Note that the naming convention in the tables and graphs in Step 3 reflect the national general terms for the modes of travel and not those specific to the I-66 study area (i.e., Heavy Rail in place of Metrorail and Commuter Rail in place of VRE).
Table 8-1. Building Block Size Summary
BUILDING BLOCK
CARRY ABILITY FOR PEAK 3-HOUR PERIOD (PERSON-TRIPS)1
BASE REACH MAX
General Purpose 7,620 7,890 8,220
Managed Lanes 1 15,906 17,901 20,427
Managed Lanes 2 27,291 29,286 31,812
Heavy Rail 16,640 18,304 20,800
Light Rail 4,320 5,400 8,100
Bus Rapid Transit 3,000 4,200 5,400
Commuter Rail 6,480 8,280 10,080 1Carrying ability, with the exception of General Purpose lanes, are for the concept as a whole. The General Purpose lanes size is shown per lane.
Figure 8-3. Graphical Comparison of Building Block Sizes
In order to calculate several of the evaluation measures that are described below in Step 5, the estimates of building block sizes included a generalized breakdown by mode: trips accommodated by single-occupant vehicle, trips accommodated on multi-occupant vehicles
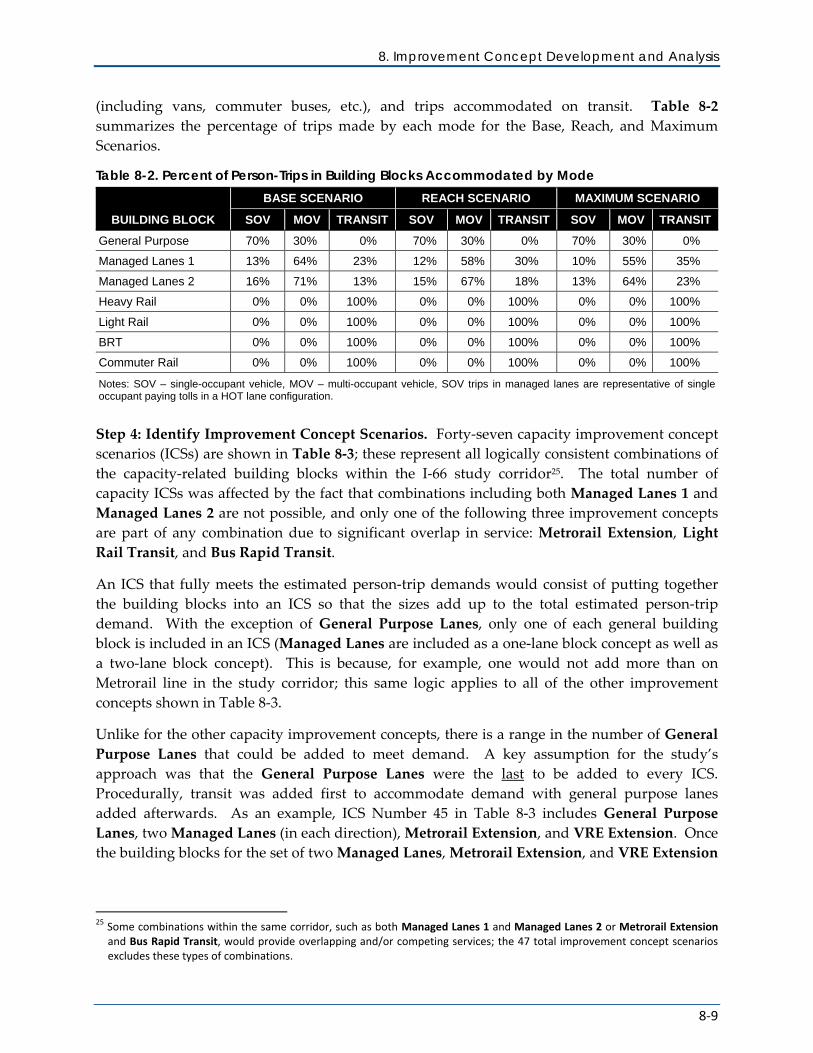
8. Improvement Concept Development and Analysis
8-9
(including vans, commuter buses, etc.), and trips accommodated on transit. Table 8-2 summarizes the percentage of trips made by each mode for the Base, Reach, and Maximum Scenarios.
Table 8-2. Percent of Person-Trips in Building Blocks Accommodated by Mode
BUILDING BLOCK
BASE SCENARIO REACH SCENARIO MAXIMUM SCENARIO
SOV MOV TRANSIT SOV MOV TRANSIT SOV MOV TRANSIT
General Purpose 70% 30% 0% 70% 30% 0% 70% 30% 0%
Managed Lanes 1 13% 64% 23% 12% 58% 30% 10% 55% 35%
Managed Lanes 2 16% 71% 13% 15% 67% 18% 13% 64% 23%
Heavy Rail 0% 0% 100% 0% 0% 100% 0% 0% 100%
Light Rail 0% 0% 100% 0% 0% 100% 0% 0% 100%
BRT 0% 0% 100% 0% 0% 100% 0% 0% 100%
Commuter Rail 0% 0% 100% 0% 0% 100% 0% 0% 100%
Notes: SOV – single-occupant vehicle, MOV – multi-occupant vehicle, SOV trips in managed lanes are representative of single occupant paying tolls in a HOT lane configuration.
Step 4: Identify Improvement Concept Scenarios. Forty-seven capacity improvement concept scenarios (ICSs) are shown in Table 8-3; these represent all logically consistent combinations of the capacity-related building blocks within the I-66 study corridor25. The total number of capacity ICSs was affected by the fact that combinations including both Managed Lanes 1 and Managed Lanes 2 are not possible, and only one of the following three improvement concepts are part of any combination due to significant overlap in service: Metrorail Extension, Light Rail Transit, and Bus Rapid Transit.
An ICS that fully meets the estimated person-trip demands would consist of putting together the building blocks into an ICS so that the sizes add up to the total estimated person-trip demand. With the exception of General Purpose Lanes, only one of each general building block is included in an ICS (Managed Lanes are included as a one-lane block concept as well as a two-lane block concept). This is because, for example, one would not add more than on Metrorail line in the study corridor; this same logic applies to all of the other improvement concepts shown in Table 8-3.
Unlike for the other capacity improvement concepts, there is a range in the number of General Purpose Lanes that could be added to meet demand. A key assumption for the study’s approach was that the General Purpose Lanes were the last to be added to every ICS. Procedurally, transit was added first to accommodate demand with general purpose lanes added afterwards. As an example, ICS Number 45 in Table 8-3 includes General Purpose Lanes, two Managed Lanes (in each direction), Metrorail Extension, and VRE Extension. Once the building blocks for the set of two Managed Lanes, Metrorail Extension, and VRE Extension
25 Some combinations within the same corridor, such as both Managed Lanes 1 and Managed Lanes 2 or Metrorail Extension
and Bus Rapid Transit, would provide overlapping and/or competing services; the 47 total improvement concept scenarios excludes these types of combinations.
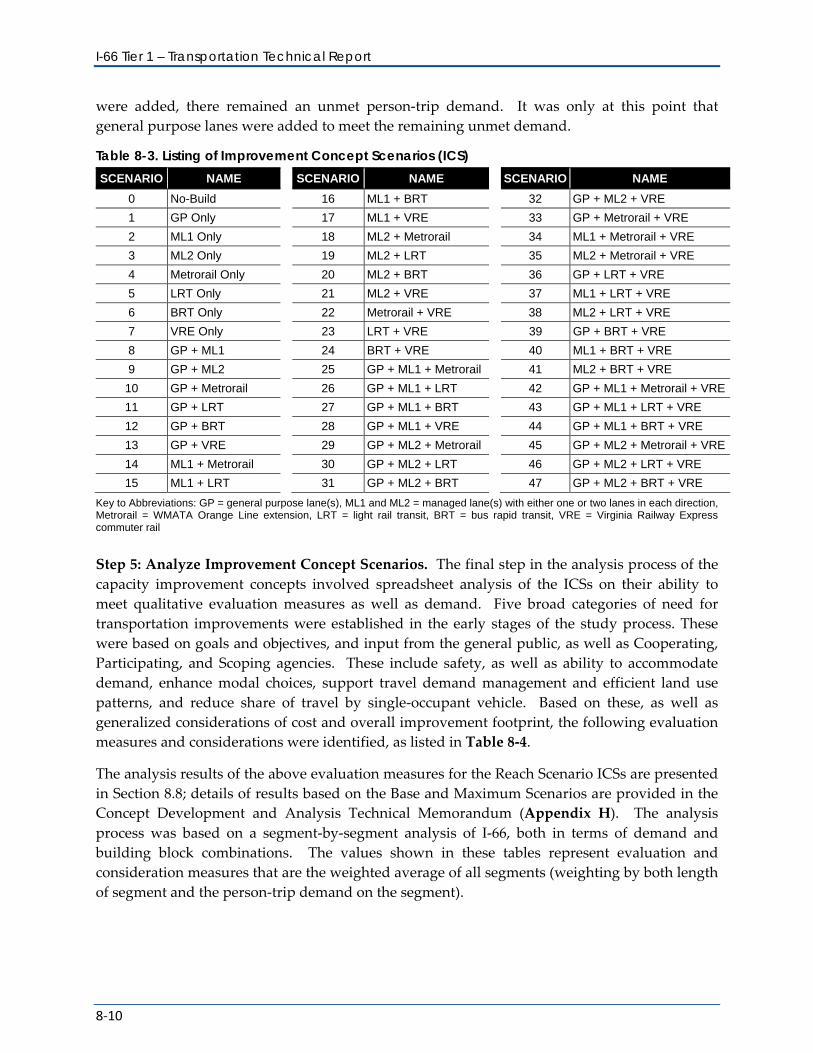
I-66 Tier 1 – Transportation Technical Report
8-10
were added, there remained an unmet person-trip demand. It was only at this point that general purpose lanes were added to meet the remaining unmet demand.
Table 8-3. Listing of Improvement Concept Scenarios (ICS) SCENARIO NAME SCENARIO NAME SCENARIO NAME
0 No-Build 16 ML1 + BRT 32 GP + ML2 + VRE
1 GP Only 17 ML1 + VRE 33 GP + Metrorail + VRE
2 ML1 Only 18 ML2 + Metrorail 34 ML1 + Metrorail + VRE
3 ML2 Only 19 ML2 + LRT 35 ML2 + Metrorail + VRE
4 Metrorail Only 20 ML2 + BRT 36 GP + LRT + VRE
5 LRT Only 21 ML2 + VRE 37 ML1 + LRT + VRE
6 BRT Only 22 Metrorail + VRE 38 ML2 + LRT + VRE
7 VRE Only 23 LRT + VRE 39 GP + BRT + VRE
8 GP + ML1 24 BRT + VRE 40 ML1 + BRT + VRE
9 GP + ML2 25 GP + ML1 + Metrorail 41 ML2 + BRT + VRE
10 GP + Metrorail 26 GP + ML1 + LRT 42 GP + ML1 + Metrorail + VRE
11 GP + LRT 27 GP + ML1 + BRT 43 GP + ML1 + LRT + VRE
12 GP + BRT 28 GP + ML1 + VRE 44 GP + ML1 + BRT + VRE
13 GP + VRE 29 GP + ML2 + Metrorail 45 GP + ML2 + Metrorail + VRE
14 ML1 + Metrorail 30 GP + ML2 + LRT 46 GP + ML2 + LRT + VRE
15 ML1 + LRT 31 GP + ML2 + BRT 47 GP + ML2 + BRT + VRE
Key to Abbreviations: GP = general purpose lane(s), ML1 and ML2 = managed lane(s) with either one or two lanes in each direction, Metrorail = WMATA Orange Line extension, LRT = light rail transit, BRT = bus rapid transit, VRE = Virginia Railway Express commuter rail
Step 5: Analyze Improvement Concept Scenarios. The final step in the analysis process of the capacity improvement concepts involved spreadsheet analysis of the ICSs on their ability to meet qualitative evaluation measures as well as demand. Five broad categories of need for transportation improvements were established in the early stages of the study process. These were based on goals and objectives, and input from the general public, as well as Cooperating, Participating, and Scoping agencies. These include safety, as well as ability to accommodate demand, enhance modal choices, support travel demand management and efficient land use patterns, and reduce share of travel by single-occupant vehicle. Based on these, as well as generalized considerations of cost and overall improvement footprint, the following evaluation measures and considerations were identified, as listed in Table 8-4.
The analysis results of the above evaluation measures for the Reach Scenario ICSs are presented in Section 8.8; details of results based on the Base and Maximum Scenarios are provided in the Concept Development and Analysis Technical Memorandum (Appendix H). The analysis process was based on a segment-by-segment analysis of I-66, both in terms of demand and building block combinations. The values shown in these tables represent evaluation and consideration measures that are the weighted average of all segments (weighting by both length of segment and the person-trip demand on the segment).
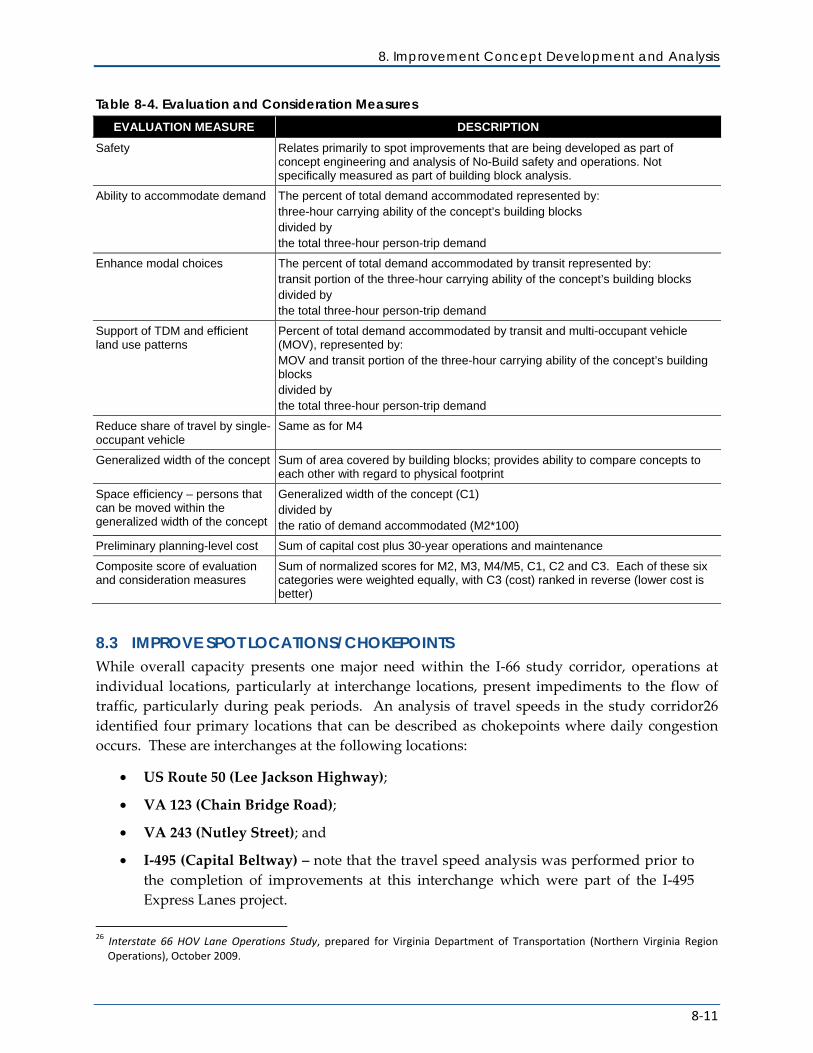
8. Improvement Concept Development and Analysis
8-11
Table 8-4. Evaluation and Consideration Measures EVALUATION MEASURE DESCRIPTION
Safety Relates primarily to spot improvements that are being developed as part of concept engineering and analysis of No-Build safety and operations. Not specifically measured as part of building block analysis.
Ability to accommodate demand The percent of total demand accommodated represented by: three-hour carrying ability of the concept’s building blocks divided by the total three-hour person-trip demand
Enhance modal choices The percent of total demand accommodated by transit represented by: transit portion of the three-hour carrying ability of the concept’s building blocks divided by the total three-hour person-trip demand
Support of TDM and efficient land use patterns
Percent of total demand accommodated by transit and multi-occupant vehicle (MOV), represented by: MOV and transit portion of the three-hour carrying ability of the concept’s building blocks divided by the total three-hour person-trip demand
Reduce share of travel by single- occupant vehicle
Same as for M4
Generalized width of the concept Sum of area covered by building blocks; provides ability to compare concepts to each other with regard to physical footprint
Space efficiency – persons that can be moved within the generalized width of the concept
Generalized width of the concept (C1) divided by the ratio of demand accommodated (M2*100)
Preliminary planning-level cost Sum of capital cost plus 30-year operations and maintenance
Composite score of evaluation and consideration measures
Sum of normalized scores for M2, M3, M4/M5, C1, C2 and C3. Each of these six categories were weighted equally, with C3 (cost) ranked in reverse (lower cost is better)
8.3 IMPROVE SPOT LOCATIONS/CHOKEPOINTS While overall capacity presents one major need within the I-66 study corridor, operations at individual locations, particularly at interchange locations, present impediments to the flow of traffic, particularly during peak periods. An analysis of travel speeds in the study corridor26 identified four primary locations that can be described as chokepoints where daily congestion occurs. These are interchanges at the following locations:
• US Route 50 (Lee Jackson Highway);
• VA 123 (Chain Bridge Road);
• VA 243 (Nutley Street); and
• I-495 (Capital Beltway) – note that the travel speed analysis was performed prior to the completion of improvements at this interchange which were part of the I-495 Express Lanes project.
26 Interstate 66 HOV Lane Operations Study, prepared for Virginia Department of Transportation (Northern Virginia Region
Operations), October 2009.
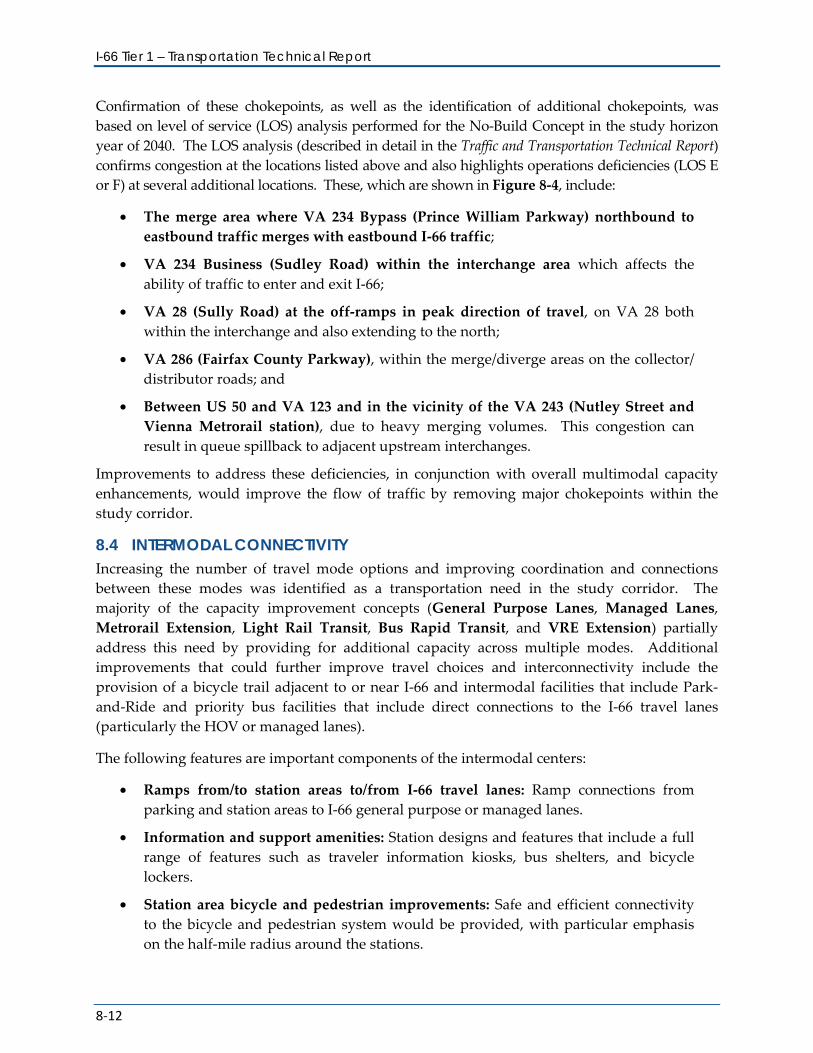
I-66 Tier 1 – Transportation Technical Report
8-12
Confirmation of these chokepoints, as well as the identification of additional chokepoints, was based on level of service (LOS) analysis performed for the No-Build Concept in the study horizon year of 2040. The LOS analysis (described in detail in the Traffic and Transportation Technical Report) confirms congestion at the locations listed above and also highlights operations deficiencies (LOS E or F) at several additional locations. These, which are shown in Figure 8-4, include:
• The merge area where VA 234 Bypass (Prince William Parkway) northbound to eastbound traffic merges with eastbound I-66 traffic;
• VA 234 Business (Sudley Road) within the interchange area which affects the ability of traffic to enter and exit I-66;
• VA 28 (Sully Road) at the off-ramps in peak direction of travel, on VA 28 both within the interchange and also extending to the north;
• VA 286 (Fairfax County Parkway), within the merge/diverge areas on the collector/ distributor roads; and
• Between US 50 and VA 123 and in the vicinity of the VA 243 (Nutley Street and Vienna Metrorail station), due to heavy merging volumes. This congestion can result in queue spillback to adjacent upstream interchanges.
Improvements to address these deficiencies, in conjunction with overall multimodal capacity enhancements, would improve the flow of traffic by removing major chokepoints within the study corridor.
8.4 INTERMODAL CONNECTIVITY Increasing the number of travel mode options and improving coordination and connections between these modes was identified as a transportation need in the study corridor. The majority of the capacity improvement concepts (General Purpose Lanes, Managed Lanes, Metrorail Extension, Light Rail Transit, Bus Rapid Transit, and VRE Extension) partially address this need by providing for additional capacity across multiple modes. Additional improvements that could further improve travel choices and interconnectivity include the provision of a bicycle trail adjacent to or near I-66 and intermodal facilities that include Park-and-Ride and priority bus facilities that include direct connections to the I-66 travel lanes (particularly the HOV or managed lanes).
The following features are important components of the intermodal centers:
• Ramps from/to station areas to/from I-66 travel lanes: Ramp connections from parking and station areas to I-66 general purpose or managed lanes.
• Information and support amenities: Station designs and features that include a full range of features such as traveler information kiosks, bus shelters, and bicycle lockers.
• Station area bicycle and pedestrian improvements: Safe and efficient connectivity to the bicycle and pedestrian system would be provided, with particular emphasis on the half-mile radius around the stations.
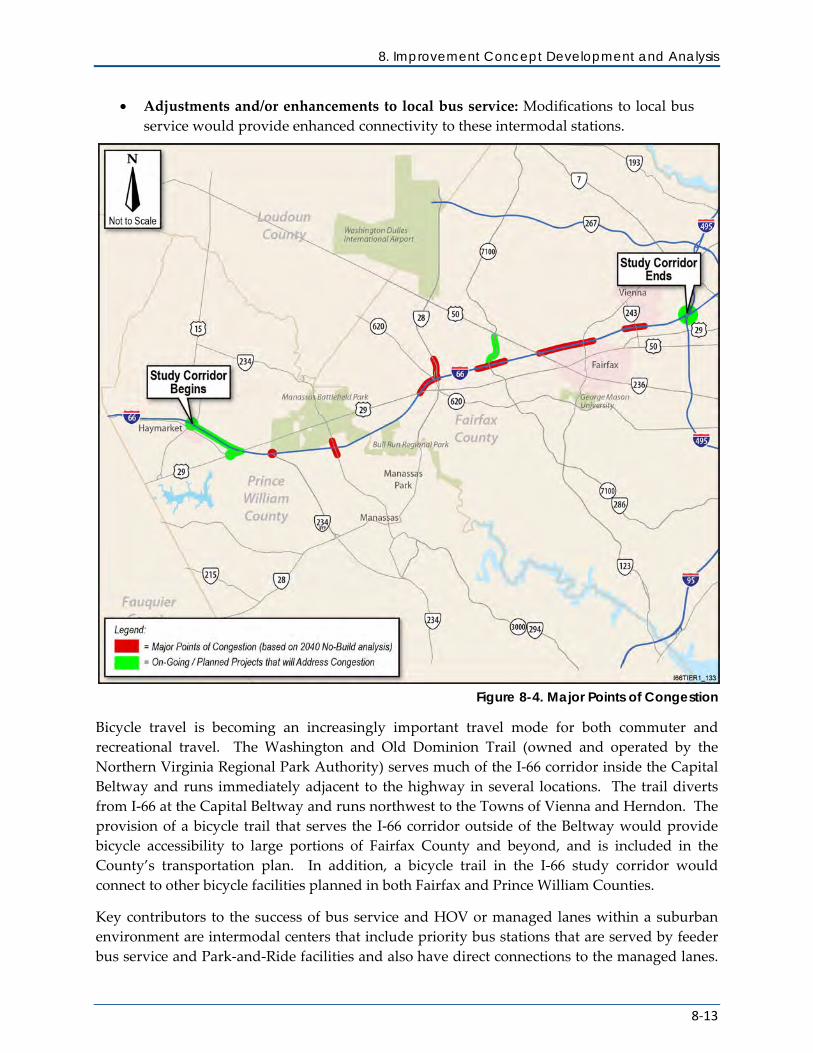
8. Improvement Concept Development and Analysis
8-13
• Adjustments and/or enhancements to local bus service: Modifications to local bus service would provide enhanced connectivity to these intermodal stations.
Figure 8-4. Major Points of Congestion
Bicycle travel is becoming an increasingly important travel mode for both commuter and recreational travel. The Washington and Old Dominion Trail (owned and operated by the Northern Virginia Regional Park Authority) serves much of the I-66 corridor inside the Capital Beltway and runs immediately adjacent to the highway in several locations. The trail diverts from I-66 at the Capital Beltway and runs northwest to the Towns of Vienna and Herndon. The provision of a bicycle trail that serves the I-66 corridor outside of the Beltway would provide bicycle accessibility to large portions of Fairfax County and beyond, and is included in the County’s transportation plan. In addition, a bicycle trail in the I-66 study corridor would connect to other bicycle facilities planned in both Fairfax and Prince William Counties.
Key contributors to the success of bus service and HOV or managed lanes within a suburban environment are intermodal centers that include priority bus stations that are served by feeder bus service and Park-and-Ride facilities and also have direct connections to the managed lanes.
I-66 Tier 1 – Transportation Technical Report
8-14
Key locations for intermodal centers that have been identified in regional planning documents (both expansion of existing locations as well as new locations) include27:
• Haymarket;
• Gainesville;
• VA 234 Bypass (enhancements to existing Park-and-Ride lot);
• Bull Run;
• Centreville;
• Stringfellow Road;
• Monument Drive/Fairfax Corner; and
• Vienna/GMU (enhancements to existing Metrorail station).
8.5 SAFETY IMPROVEMENTS As noted in Chapter 2, the crash rate in the study corridor is just under the statewide average for urban interstates in Virginia, but is higher when compared to the overall I-66 corridor from I-81 to the Potomac River. There are segments and spot locations where the history of crashes indicates specific safety improvement needs. Within the study corridor, the segment of I-66 between US 50 and the Capital Beltway has higher crash rates, both overall and those with injuries, than the statewide average. Contributing features include high levels of congestion as well as geometric features of the roadway that do not meet current design standards. Some of the contributing elements include short acceleration and deceleration lanes, use of the shoulder lane as a travel lane during the peak periods, and the lack of a shoulder during the peak periods with limited emergency pullout areas. Examples of specific safety improvements include:
• Interchange at US 50: Improve eastbound entrance, including extension of merge lanes.
• Interchange at Vienna Metrorail Station: Improve westbound merge/diverge areas; provide tow-truck at the interchange for contingent use during PM peaks.
• Interchanges at VA 28/US 29: Improve the eastbound on-ramp from US 29 and eastbound off-ramp to VA 28 to meet current auxiliary lane standards to improve merge and diverge operations.
• Interchange at VA 234 Business: Extend the westbound on-ramp from VA 234 Business and widen ramp widths for westbound dual-lane exit.
8.6 TRANSPORTATION COMMUNICATION AND TECHNOLOGY These improvements make use of new technologies, often collectively referred to as intelligent transportation systems, or ITS. They provide the tools to increase the efficiency of the corridor in moving people and in enhancing safety. The improvements enhance the ability to provide additional real-time information to travelers for all modes of travel, allow for rapid response to
27 These locations were identified in the I-66 Transit/TDM Study (Virginia Department of Rail and Public Transportation,
December 2009); the locations were confirmed as part of this study.
8. Improvement Concept Development and Analysis
8-15
incidents, provide for smoother flow of traffic through ramp metering, and allow for dynamic use of shoulders when needed. A key focus of ITS is collecting, processing and disseminating information to the system’s users. Improvements within this group include:
• Advanced Transportation Management Systems (ATMS): This includes improvements aimed at safety and incident management through the use of sign gantries, shoulder and lane control signs, speed displays, incident and queue detection, and increased traffic camera coverage. An ATMS continuously monitors traffic and roadway conditions and supports rapid response to incidents and other on-the-road changes. The system collects information on conditions using monitoring equipment, such as vehicle detection sensors, closed-circuit television cameras, etc. Some ATMS enhancement efforts are currently ongoing in the corridor.28
• Integrated Corridor Management (ICM): The focus of ICM is on providing information to travelers with respect to travel conditions, so that decisions can be made with respect to shifting routes or travel modes. A complete system would provide the traveler with information such as the location of a transit facility, the availability of parking, and route schedules.
8.7 NO-BUILD The no action or No-Build Concept provides a baseline against which to compare the Build Improvement Concepts. Under the No-Build, only those projects included in the 2011 Constrained Long Range Plan (CLRP) for the Washington Metropolitan Region are included. They include:
1. Upgrade of US 15 interchange.
2. I-66 Widening (from four to eight lanes) between US 15 and US 29 (Gainesville) with inside (median) HOV lane.
3. Widening of US 15 to four lanes from US 29 to I-66.
4. Construct interchange at US 29 Linton Hall Road, including bridging railroad tracks.
5. Extend VA 234 Bypass to US 50 (Tri-County Parkway); environmental studies ongoing.
6. Widen VA 28 from six to eight lanes from I-66 to VA 7.
7. Fairfax County Parkway improvements, including a new interchange at Fair Lakes Parkway and Monument Drive, construction of HOV lanes from I-66 to the Dulles Toll Road, and widening from four to six lanes between VA 123 and I-66.
8. Construct bus-only ramps at the Vienna Metrorail station.
9. Pavement rehabilitation of I-66 between US 50 and I-495.
28 ATMS improvements within the I-66 corridor, as well as other key corridors across the Commonwealth, are continually being
identified to enhance efficiency and safety and reflect ongoing advances in technology. Improvements that are currently being implemented in the corridor are described here: http://www.virginiadot.org/projects/northernvirginia/i-66_atms.asp
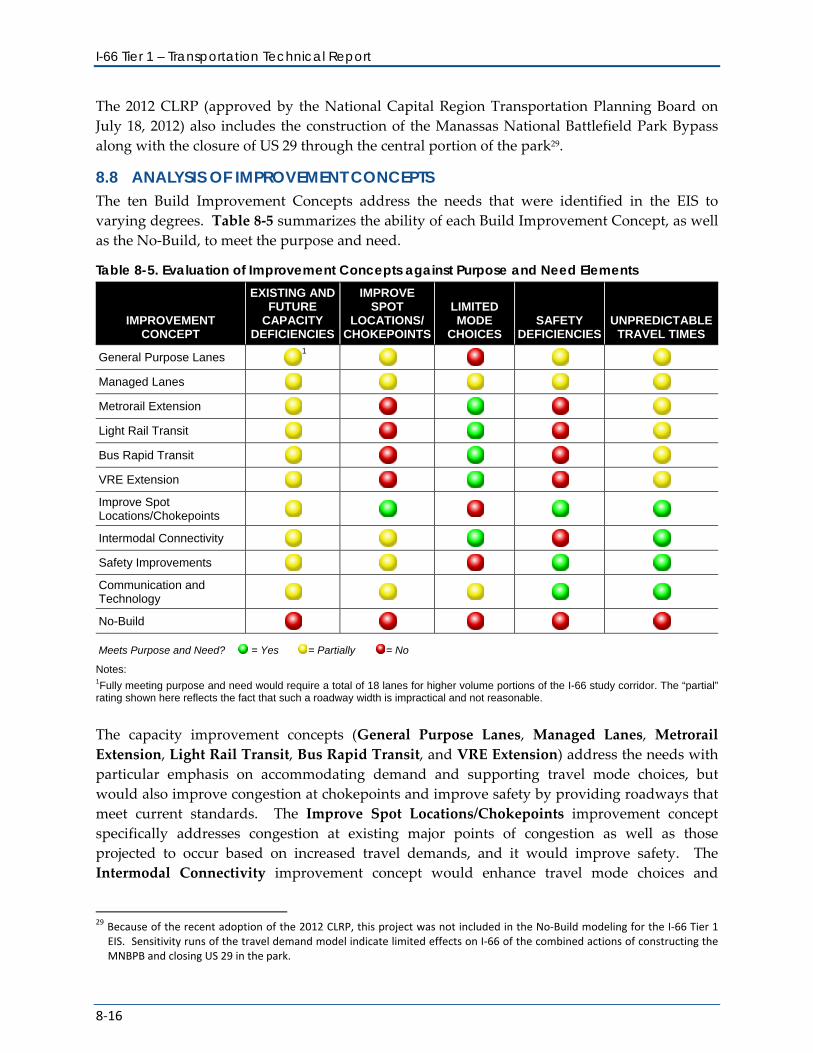
I-66 Tier 1 – Transportation Technical Report
8-16
The 2012 CLRP (approved by the National Capital Region Transportation Planning Board on July 18, 2012) also includes the construction of the Manassas National Battlefield Park Bypass along with the closure of US 29 through the central portion of the park29.
8.8 ANALYSIS OF IMPROVEMENT CONCEPTS The ten Build Improvement Concepts address the needs that were identified in the EIS to varying degrees. Table 8-5 summarizes the ability of each Build Improvement Concept, as well as the No-Build, to meet the purpose and need.
Table 8-5. Evaluation of Improvement Concepts against Purpose and Need Elements
IMPROVEMENT CONCEPT
EXISTING AND FUTURE
CAPACITY DEFICIENCIES
IMPROVE SPOT
LOCATIONS/ CHOKEPOINTS
LIMITED MODE
CHOICES SAFETY
DEFICIENCIES UNPREDICTABLE
TRAVEL TIMES
General Purpose Lanes 1
Managed Lanes
Metrorail Extension
Light Rail Transit
Bus Rapid Transit
VRE Extension
Improve Spot Locations/Chokepoints
Intermodal Connectivity
Safety Improvements
Communication and Technology
No-Build
Meets Purpose and Need? = Yes = Partially = No
Notes: 1Fully meeting purpose and need would require a total of 18 lanes for higher volume portions of the I-66 study corridor. The “partial” rating shown here reflects the fact that such a roadway width is impractical and not reasonable.
The capacity improvement concepts (General Purpose Lanes, Managed Lanes, Metrorail Extension, Light Rail Transit, Bus Rapid Transit, and VRE Extension) address the needs with particular emphasis on accommodating demand and supporting travel mode choices, but would also improve congestion at chokepoints and improve safety by providing roadways that meet current standards. The Improve Spot Locations/Chokepoints improvement concept specifically addresses congestion at existing major points of congestion as well as those projected to occur based on increased travel demands, and it would improve safety. The Intermodal Connectivity improvement concept would enhance travel mode choices and
29 Because of the recent adoption of the 2012 CLRP, this project was not included in the No-Build modeling for the I-66 Tier 1
EIS. Sensitivity runs of the travel demand model indicate limited effects on I-66 of the combined actions of constructing the MNBPB and closing US 29 in the park.
8. Improvement Concept Development and Analysis
8-17
provide increased interconnectivity between travel modes. The Safety Improvements concept would enhance safety, primarily at spot locations, and the Transportation Communication and Technology improvement concept would enhance the efficiency and safety of the corridor through the application of information technologies and traveler information.
The Improve Spot Locations/Chokepoints, Intermodal Connectivity, Safety Improvements, Transportation Communication and Technology improvement concepts are, to a large extent, enhancements that have been studied and proposed in previous studies within the corridor; and have also been suggested as part of the public and agency outreach process of the previous studies as well as this EIS. If any of these improvement concepts are advanced to Tier 2, refinements would take place through a combination of detailed studies and Tier 2 environmental analyses. The capacity improvement concepts, on the other hand, reflect high-level analyses performed as part of this study to identify and evaluate transportation improvements, and combinations thereof, that address, to various degrees, the projected travel demands in the study corridor to the year 2040. The remainder of this section describes the relative ability of the various capacity improvement concepts, and combinations of capacity improvement concepts, to meet these travel demands.
The No-Build Concept does not meet any of the needs identified in the EIS, and none of the other ten Build Improvement Concepts would meet the needs alone. As illustrated by Table 8-5, it is necessary to combine the improvement concepts to identify a solution capable of meeting all of the needs in the corridor. In addition, no single capacity improvement concept (General Purpose Lanes, Managed Lanes, Metrorail Extension, Light Rail Transit, Bus Rapid Transit, and VRE Extension) can meet the capacity needs of the corridor. For this reason, combinations of the six capacity improvement concepts have been assembled into 47 Improvement Concept Scenarios. Each of the ICSs was evaluated based on metrics summarized below, with the results shown in Table 8-6 for the Reach Scenario.
• Ability to accommodate demand: the percent of total demand accommodated (represented by the three-hour carrying ability of the improvement concept divided by the total three-hour (peak period) person-trip demand);
• Ability to enhance modal choices: the percent of total demand accommodated by transit (represented by the transit portion of the three-hour carrying ability of the improvement concept divided by the total three-hour person-trip demand);
• Generalized physical width: estimated width based on planning-level footprint widths for the improvement concepts;
• Space efficiency: persons that can be moved within the generalized width of the improvement concept (represented by the ratio of total demand accommodated divided by the generalized width of the improvement concept);
• Generalized planning-level cost: sum of capital cost plus 30-year operations and maintenance; and
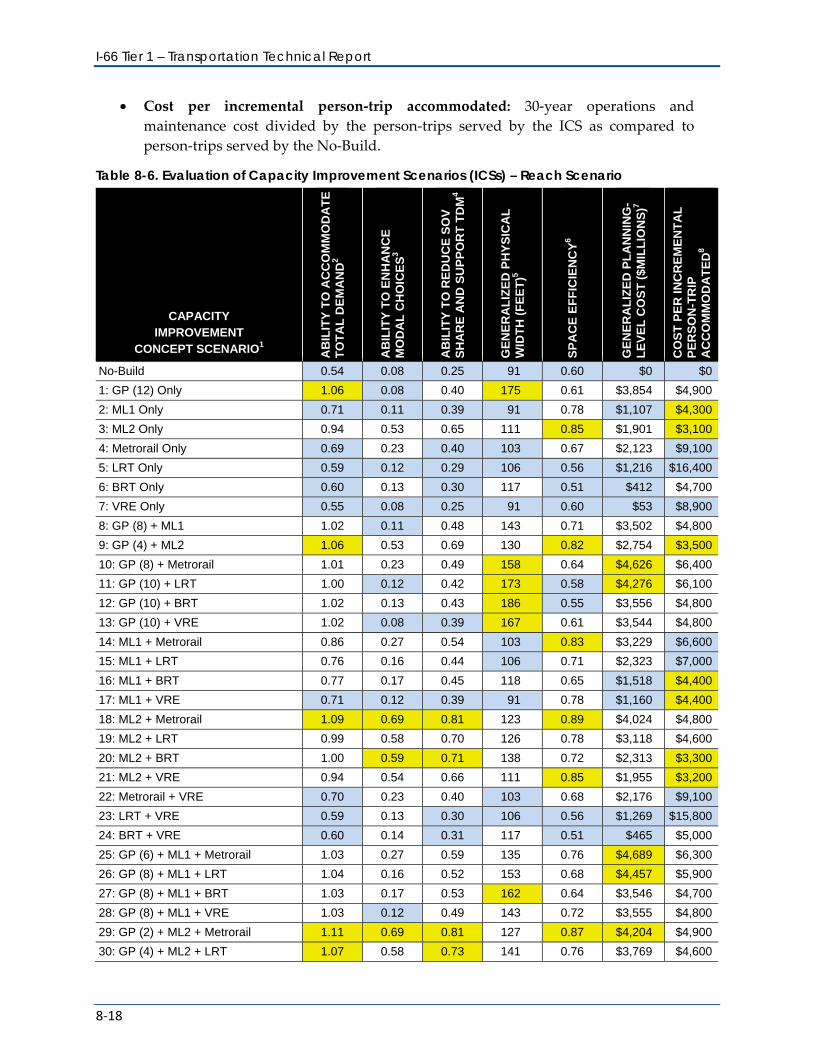
I-66 Tier 1 – Transportation Technical Report
8-18
• Cost per incremental person-trip accommodated: 30-year operations and maintenance cost divided by the person-trips served by the ICS as compared to person-trips served by the No-Build.
Table 8-6. Evaluation of Capacity Improvement Scenarios (ICSs) – Reach Scenario
CAPACITY IMPROVEMENT
CONCEPT SCENARIO1 AB
ILIT
Y T
O A
CC
OM
MO
DA
TE
T
OT
AL
DE
MA
ND
2
AB
ILIT
Y T
O E
NH
AN
CE
M
OD
AL
CH
OIC
ES
3
AB
ILIT
Y T
O R
ED
UC
E S
OV
S
HA
RE
AN
D S
UP
PO
RT
TD
M4
GE
NE
RA
LIZ
ED
PH
YS
ICA
L
WID
TH
(F
EE
T)5
SP
AC
E E
FF
ICIE
NC
Y6
GE
NE
RA
LIZ
ED
PL
AN
NIN
G-
LE
VE
L C
OS
T (
$MIL
LIO
NS
)7
CO
ST
PE
R I
NC
RE
ME
NT
AL
P
ER
SO
N-T
RIP
A
CC
OM
MO
DA
TE
D8
No-Build 0.54 0.08 0.25 91 0.60 $0 $0
1: GP (12) Only 1.06 0.08 0.40 175 0.61 $3,854 $4,900
2: ML1 Only 0.71 0.11 0.39 91 0.78 $1,107 $4,300
3: ML2 Only 0.94 0.53 0.65 111 0.85 $1,901 $3,100
4: Metrorail Only 0.69 0.23 0.40 103 0.67 $2,123 $9,100
5: LRT Only 0.59 0.12 0.29 106 0.56 $1,216 $16,400
6: BRT Only 0.60 0.13 0.30 117 0.51 $412 $4,700
7: VRE Only 0.55 0.08 0.25 91 0.60 $53 $8,900
8: GP (8) + ML1 1.02 0.11 0.48 143 0.71 $3,502 $4,800
9: GP (4) + ML2 1.06 0.53 0.69 130 0.82 $2,754 $3,500
10: GP (8) + Metrorail 1.01 0.23 0.49 158 0.64 $4,626 $6,400
11: GP (10) + LRT 1.00 0.12 0.42 173 0.58 $4,276 $6,100
12: GP (10) + BRT 1.02 0.13 0.43 186 0.55 $3,556 $4,800
13: GP (10) + VRE 1.02 0.08 0.39 167 0.61 $3,544 $4,800
14: ML1 + Metrorail 0.86 0.27 0.54 103 0.83 $3,229 $6,600
15: ML1 + LRT 0.76 0.16 0.44 106 0.71 $2,323 $7,000
16: ML1 + BRT 0.77 0.17 0.45 118 0.65 $1,518 $4,400
17: ML1 + VRE 0.71 0.12 0.39 91 0.78 $1,160 $4,400
18: ML2 + Metrorail 1.09 0.69 0.81 123 0.89 $4,024 $4,800
19: ML2 + LRT 0.99 0.58 0.70 126 0.78 $3,118 $4,600
20: ML2 + BRT 1.00 0.59 0.71 138 0.72 $2,313 $3,300
21: ML2 + VRE 0.94 0.54 0.66 111 0.85 $1,955 $3,200
22: Metrorail + VRE 0.70 0.23 0.40 103 0.68 $2,176 $9,100
23: LRT + VRE 0.59 0.13 0.30 106 0.56 $1,269 $15,800
24: BRT + VRE 0.60 0.14 0.31 117 0.51 $465 $5,000
25: GP (6) + ML1 + Metrorail 1.03 0.27 0.59 135 0.76 $4,689 $6,300
26: GP (8) + ML1 + LRT 1.04 0.16 0.52 153 0.68 $4,457 $5,900
27: GP (8) + ML1 + BRT 1.03 0.17 0.53 162 0.64 $3,546 $4,700
28: GP (8) + ML1 + VRE 1.03 0.12 0.49 143 0.72 $3,555 $4,800
29: GP (2) + ML2 + Metrorail 1.11 0.69 0.81 127 0.87 $4,204 $4,900
30: GP (4) + ML2 + LRT 1.07 0.58 0.73 141 0.76 $3,769 $4,600
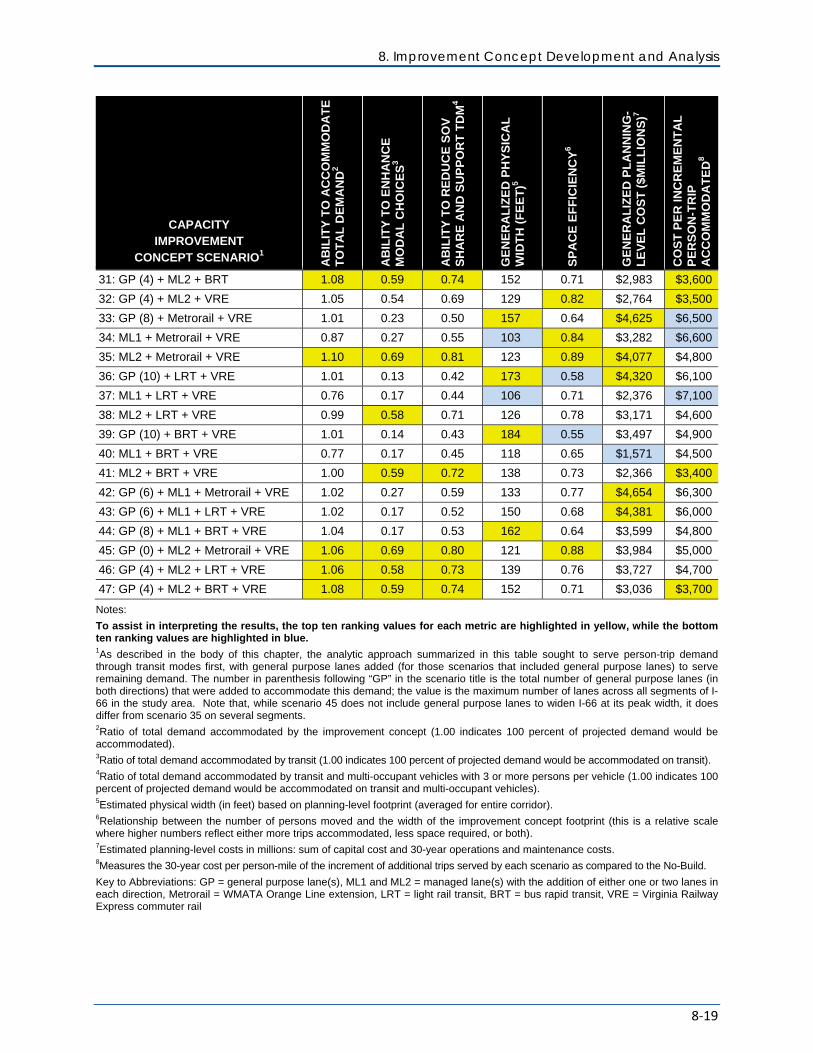
8. Improvement Concept Development and Analysis
8-19
CAPACITY IMPROVEMENT
CONCEPT SCENARIO1 AB
ILIT
Y T
O A
CC
OM
MO
DA
TE
T
OT
AL
DE
MA
ND
2
AB
ILIT
Y T
O E
NH
AN
CE
M
OD
AL
CH
OIC
ES
3
AB
ILIT
Y T
O R
ED
UC
E S
OV
S
HA
RE
AN
D S
UP
PO
RT
TD
M4
GE
NE
RA
LIZ
ED
PH
YS
ICA
L
WID
TH
(F
EE
T)5
SP
AC
E E
FF
ICIE
NC
Y6
GE
NE
RA
LIZ
ED
PL
AN
NIN
G-
LE
VE
L C
OS
T (
$MIL
LIO
NS
)7
CO
ST
PE
R I
NC
RE
ME
NT
AL
P
ER
SO
N-T
RIP
A
CC
OM
MO
DA
TE
D8
31: GP (4) + ML2 + BRT 1.08 0.59 0.74 152 0.71 $2,983 $3,600
32: GP (4) + ML2 + VRE 1.05 0.54 0.69 129 0.82 $2,764 $3,500
33: GP (8) + Metrorail + VRE 1.01 0.23 0.50 157 0.64 $4,625 $6,500
34: ML1 + Metrorail + VRE 0.87 0.27 0.55 103 0.84 $3,282 $6,600
35: ML2 + Metrorail + VRE 1.10 0.69 0.81 123 0.89 $4,077 $4,800
36: GP (10) + LRT + VRE 1.01 0.13 0.42 173 0.58 $4,320 $6,100
37: ML1 + LRT + VRE 0.76 0.17 0.44 106 0.71 $2,376 $7,100
38: ML2 + LRT + VRE 0.99 0.58 0.71 126 0.78 $3,171 $4,600
39: GP (10) + BRT + VRE 1.01 0.14 0.43 184 0.55 $3,497 $4,900
40: ML1 + BRT + VRE 0.77 0.17 0.45 118 0.65 $1,571 $4,500
41: ML2 + BRT + VRE 1.00 0.59 0.72 138 0.73 $2,366 $3,400
42: GP (6) + ML1 + Metrorail + VRE 1.02 0.27 0.59 133 0.77 $4,654 $6,300
43: GP (6) + ML1 + LRT + VRE 1.02 0.17 0.52 150 0.68 $4,381 $6,000
44: GP (8) + ML1 + BRT + VRE 1.04 0.17 0.53 162 0.64 $3,599 $4,800
45: GP (0) + ML2 + Metrorail + VRE 1.06 0.69 0.80 121 0.88 $3,984 $5,000
46: GP (4) + ML2 + LRT + VRE 1.06 0.58 0.73 139 0.76 $3,727 $4,700
47: GP (4) + ML2 + BRT + VRE 1.08 0.59 0.74 152 0.71 $3,036 $3,700
Notes:
To assist in interpreting the results, the top ten ranking values for each metric are highlighted in yellow, while the bottom ten ranking values are highlighted in blue. 1As described in the body of this chapter, the analytic approach summarized in this table sought to serve person-trip demand through transit modes first, with general purpose lanes added (for those scenarios that included general purpose lanes) to serve remaining demand. The number in parenthesis following “GP” in the scenario title is the total number of general purpose lanes (in both directions) that were added to accommodate this demand; the value is the maximum number of lanes across all segments of I-66 in the study area. Note that, while scenario 45 does not include general purpose lanes to widen I-66 at its peak width, it does differ from scenario 35 on several segments. 2Ratio of total demand accommodated by the improvement concept (1.00 indicates 100 percent of projected demand would be accommodated). 3Ratio of total demand accommodated by transit (1.00 indicates 100 percent of projected demand would be accommodated on transit). 4Ratio of total demand accommodated by transit and multi-occupant vehicles with 3 or more persons per vehicle (1.00 indicates 100 percent of projected demand would be accommodated on transit and multi-occupant vehicles). 5Estimated physical width (in feet) based on planning-level footprint (averaged for entire corridor). 6Relationship between the number of persons moved and the width of the improvement concept footprint (this is a relative scale where higher numbers reflect either more trips accommodated, less space required, or both). 7Estimated planning-level costs in millions: sum of capital cost and 30-year operations and maintenance costs. 8Measures the 30-year cost per person-mile of the increment of additional trips served by each scenario as compared to the No-Build.
Key to Abbreviations: GP = general purpose lane(s), ML1 and ML2 = managed lane(s) with the addition of either one or two lanes in each direction, Metrorail = WMATA Orange Line extension, LRT = light rail transit, BRT = bus rapid transit, VRE = Virginia Railway Express commuter rail
I-66 Tier 1 – Transportation Technical Report
8-20
It is important to note that the purpose of the evaluation was not to definitively identify one or more improvement concepts as being the “best,” but rather to illustrate the effects of combining the improvement concepts into various ICSs and to objectively incorporate the experience and knowledge of the study team as well as members of the participating agencies and the general public. Note that this analysis is provided as an illustration of how the various modes interact and, in accordance with the MOA, a specific ICS will not be selected as part of this Tier 1 study.
8.9 KEY FINDINGS The process and findings of the concept analysis described above provide a method for reviewing a large number of possible improvements (and combinations of improvements) at a level appropriate to a Tier 1 EIS and the desired decisions with respect to modal solutions that would be required to address the transportation needs in the study corridor. The process provided the opportunity to incorporate the experience and expertise of the study team as well as members of the Cooperating, Participating, and Scoping Agencies. A key consideration in interpreting results is that choosing one or more particular improvement concepts is not the overall goal of the process; rather, it is the ability of the various travel modes (as represented by one or more building blocks) to accommodate demand and relate to other evaluation and consideration measures that is of importance. The following bullet items summarize findings of the analysis:
• The No-Build Concept does not satisfy the purpose and need.
• None of the improvement concepts, as stand-alone concepts, fully satisfy the purpose and need.
• While travel demand management does not meet the purpose and need as a stand-alone improvement concept, TDM features are incorporated in all improvement concepts and enhance their effectiveness.
• Other than the two-lane Managed Lanes concept (ML2) which accommodates autos and buses alike, single mode improvement concepts result in large corridor width, high cost, poor efficiency, and/or inability to serve total demand. Fully meeting demand with these single-mode improvements is unlikely given the constraints within the corridor; multimodal solutions would be most effective in addressing transportation needs in the corridor.
• The projected peak period travel demands in the corridor highlight the need for a transportation solution in the corridor that provides space efficiency – the ability to carry large numbers of persons within limited spaces. Managed lanes and fixed-guideway transit (in descending order of carrying capacity: heavy rail, BRT, and light rail) provide space efficiency.
• A two-lane (in each direction) managed lanes system would address projected demands in a more space-efficient manner than would general purpose lanes. A general purpose lanes only solution would require up to nine travel lanes in each direction to meet project demand.
8. Improvement Concept Development and Analysis
8-21
• The share of trips made either by transit or in multi-occupant vehicles for those ICSs that perform best against the Table 3-4 metrics reach over 80 percent. While accommodating such high percentages of trips by transit and multi-occupant vehicles would be very difficult30, the fact that these percentages are so high is indicative of the benefit of including transit and managed lanes that can carry large numbers of person-trips as part of any solution.
30 As noted earlier, the methodology used for the analysis first seeks to accommodate person-trips on transit or in multi-
occupant vehicles. The high percentages of trips accommodated on these modes for many of the ICS’s reflect this approach.

I-66 Tier 1 – Transportation Technical Report
8-22
9-1
9 PRELIMINARY ANALYSIS OF THE EFFECTS OF TOLLING
Based on the Memorandum of Agreement (MOA) between FHWA, VDOT, VDPRT, and FTA that outlines the roles of each agency during the Tier 1 NEPA process and the decisions to be made following completion of the Tier 1 study, one of these decisions is “advancing tolling for subsequent study in Tier 2 NEPA document(s).” The tolling analysis performed for this Tier 1 study sought to assess, at a generalized level, the impacts of tolls with respect to traffic diversions and resulting environmental consequences that could affect a decision to advance the concept of tolling for more detailed study in Tier 2. The analysis is not intended to support a decision on whether tolling should be implemented or to identify potential toll rates, but rather to support a decision as to whether the concept of tolling merits further study and consideration.
While a primary reason for considering tolling is that tolls present a potential source of funding for improvements in the study corridor, the focus of the Tier 1 analysis of tolling was not to assess potential revenues that could be generated from tolls. Rather, as noted above, the focus of the analysis was on potential diversions and their environmental consequences. The analysis of revenue streams requires more detailed definitions of the improvements to be tolled along with operational details regarding tolling policies and methods; modeling at this higher level of detail would be performed as part of Tier 2 analyses.
The Tier 1 analysis of tolling used the MWCOG Version 2.3 model as described in Section 6 of this report. The 2040 No-Build Concept network was used as the starting point of the analysis; additional lanes and tolls were coded in the model.
The tolling analysis incorporated a number of assumptions, including the following:
• For both HOV and HOT conditions, the managed lanes were assumed to be free for 3+ occupant vehicles (note that, within this document, the term “managed lanes” is used to refer to either HOV or HOT lanes).
• The analysis focused on the AM and PM peak periods since those would be the primary times of the managed lanes usage.
• Options that simply converted existing lanes to tolled lanes were not analyzed; rather it was assumed that any tolling option would require adding additional capacity. Tolling options were configured to add one additional general purpose lane in each direction and to convert the single existing HOV lane (in each direction) into two directional HOT lanes. To allow for direct comparisons with this option, a non-tolled option was run with the same physical configuration but with HOT lanes configured as HOV lanes (i.e., no toll).
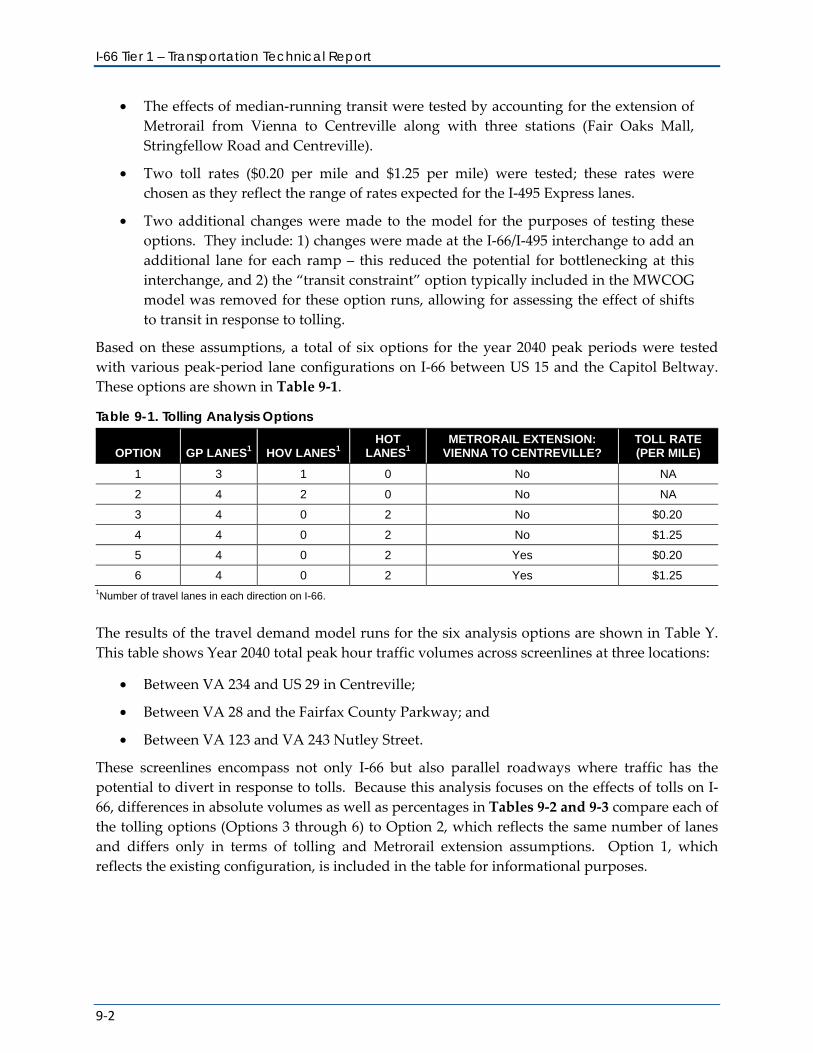
I-66 Tier 1 – Transportation Technical Report
9-2
• The effects of median-running transit were tested by accounting for the extension of Metrorail from Vienna to Centreville along with three stations (Fair Oaks Mall, Stringfellow Road and Centreville).
• Two toll rates ($0.20 per mile and $1.25 per mile) were tested; these rates were chosen as they reflect the range of rates expected for the I-495 Express lanes.
• Two additional changes were made to the model for the purposes of testing these options. They include: 1) changes were made at the I-66/I-495 interchange to add an additional lane for each ramp – this reduced the potential for bottlenecking at this interchange, and 2) the “transit constraint” option typically included in the MWCOG model was removed for these option runs, allowing for assessing the effect of shifts to transit in response to tolling.
Based on these assumptions, a total of six options for the year 2040 peak periods were tested with various peak-period lane configurations on I-66 between US 15 and the Capitol Beltway. These options are shown in Table 9-1.
Table 9-1. Tolling Analysis Options
OPTION GP LANES1 HOV LANES1 HOT
LANES1 METRORAIL EXTENSION:
VIENNA TO CENTREVILLE? TOLL RATE (PER MILE)
1 3 1 0 No NA
2 4 2 0 No NA
3 4 0 2 No $0.20
4 4 0 2 No $1.25
5 4 0 2 Yes $0.20
6 4 0 2 Yes $1.25 1Number of travel lanes in each direction on I-66.
The results of the travel demand model runs for the six analysis options are shown in Table Y. This table shows Year 2040 total peak hour traffic volumes across screenlines at three locations:
• Between VA 234 and US 29 in Centreville;
• Between VA 28 and the Fairfax County Parkway; and
• Between VA 123 and VA 243 Nutley Street.
These screenlines encompass not only I-66 but also parallel roadways where traffic has the potential to divert in response to tolls. Because this analysis focuses on the effects of tolls on I-66, differences in absolute volumes as well as percentages in Tables 9-2 and 9-3 compare each of the tolling options (Options 3 through 6) to Option 2, which reflects the same number of lanes and differs only in terms of tolling and Metrorail extension assumptions. Option 1, which reflects the existing configuration, is included in the table for informational purposes.
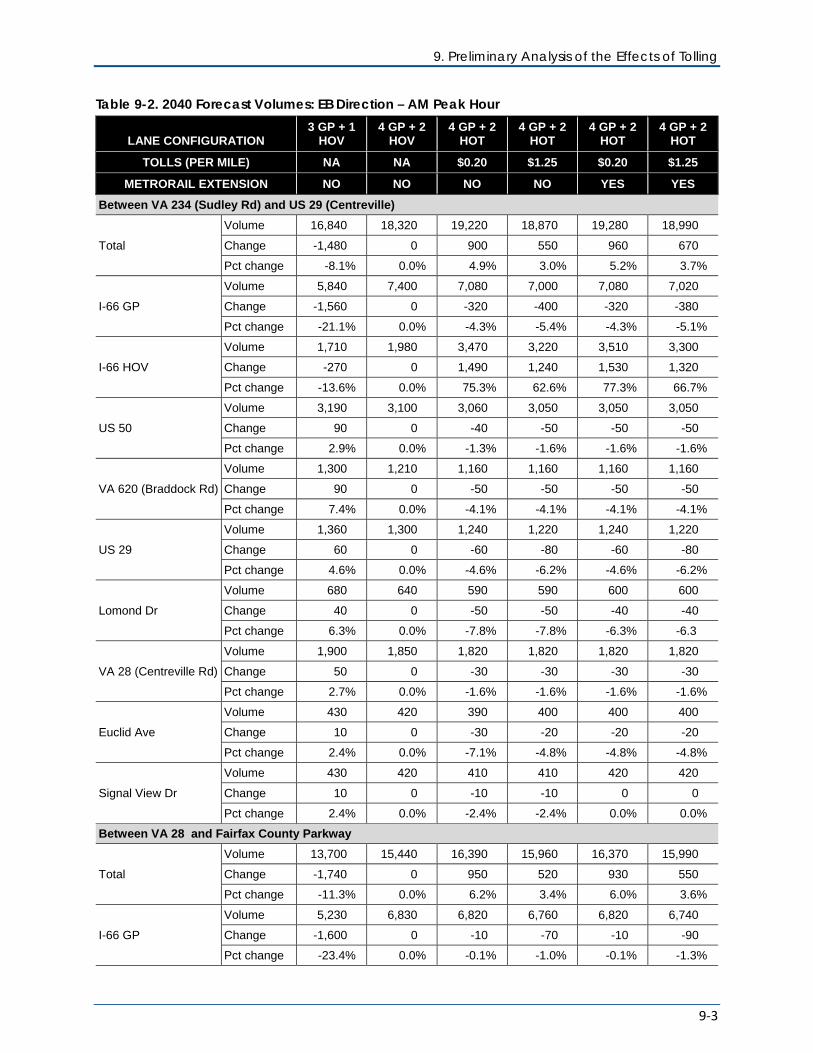
9. Preliminary Analysis of the Effects of Tolling
9-3
Table 9-2. 2040 Forecast Volumes: EB Direction – AM Peak Hour
LANE CONFIGURATION 3 GP + 1
HOV 4 GP + 2
HOV 4 GP + 2
HOT 4 GP + 2
HOT 4 GP + 2
HOT 4 GP + 2
HOT
TOLLS (PER MILE) NA NA $0.20 $1.25 $0.20 $1.25
METRORAIL EXTENSION NO NO NO NO YES YES
Between VA 234 (Sudley Rd) and US 29 (Centreville)
Total
Volume 16,840 18,320 19,220 18,870 19,280 18,990
Change -1,480 0 900 550 960 670
Pct change -8.1% 0.0% 4.9% 3.0% 5.2% 3.7%
I-66 GP
Volume 5,840 7,400 7,080 7,000 7,080 7,020
Change -1,560 0 -320 -400 -320 -380
Pct change -21.1% 0.0% -4.3% -5.4% -4.3% -5.1%
I-66 HOV
Volume 1,710 1,980 3,470 3,220 3,510 3,300
Change -270 0 1,490 1,240 1,530 1,320
Pct change -13.6% 0.0% 75.3% 62.6% 77.3% 66.7%
US 50
Volume 3,190 3,100 3,060 3,050 3,050 3,050
Change 90 0 -40 -50 -50 -50
Pct change 2.9% 0.0% -1.3% -1.6% -1.6% -1.6%
VA 620 (Braddock Rd)
Volume 1,300 1,210 1,160 1,160 1,160 1,160
Change 90 0 -50 -50 -50 -50
Pct change 7.4% 0.0% -4.1% -4.1% -4.1% -4.1%
US 29
Volume 1,360 1,300 1,240 1,220 1,240 1,220
Change 60 0 -60 -80 -60 -80
Pct change 4.6% 0.0% -4.6% -6.2% -4.6% -6.2%
Lomond Dr
Volume 680 640 590 590 600 600
Change 40 0 -50 -50 -40 -40
Pct change 6.3% 0.0% -7.8% -7.8% -6.3% -6.3
VA 28 (Centreville Rd)
Volume 1,900 1,850 1,820 1,820 1,820 1,820
Change 50 0 -30 -30 -30 -30
Pct change 2.7% 0.0% -1.6% -1.6% -1.6% -1.6%
Euclid Ave
Volume 430 420 390 400 400 400
Change 10 0 -30 -20 -20 -20
Pct change 2.4% 0.0% -7.1% -4.8% -4.8% -4.8%
Signal View Dr
Volume 430 420 410 410 420 420
Change 10 0 -10 -10 0 0
Pct change 2.4% 0.0% -2.4% -2.4% 0.0% 0.0%
Between VA 28 and Fairfax County Parkway
Total
Volume 13,700 15,440 16,390 15,960 16,370 15,990
Change -1,740 0 950 520 930 550
Pct change -11.3% 0.0% 6.2% 3.4% 6.0% 3.6%
I-66 GP
Volume 5,230 6,830 6,820 6,760 6,820 6,740
Change -1,600 0 -10 -70 -10 -90
Pct change -23.4% 0.0% -0.1% -1.0% -0.1% -1.3%
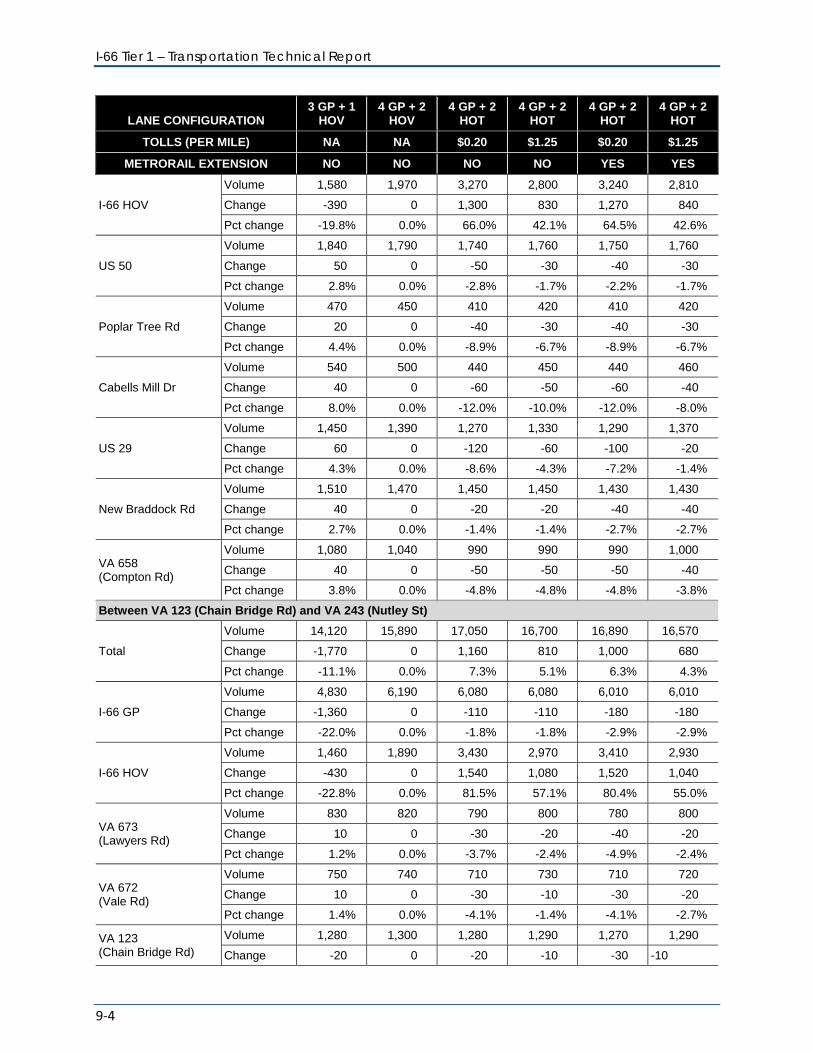
I-66 Tier 1 – Transportation Technical Report
9-4
LANE CONFIGURATION 3 GP + 1
HOV 4 GP + 2
HOV 4 GP + 2
HOT 4 GP + 2
HOT 4 GP + 2
HOT 4 GP + 2
HOT
TOLLS (PER MILE) NA NA $0.20 $1.25 $0.20 $1.25
METRORAIL EXTENSION NO NO NO NO YES YES
I-66 HOV
Volume 1,580 1,970 3,270 2,800 3,240 2,810
Change -390 0 1,300 830 1,270 840
Pct change -19.8% 0.0% 66.0% 42.1% 64.5% 42.6%
US 50
Volume 1,840 1,790 1,740 1,760 1,750 1,760
Change 50 0 -50 -30 -40 -30
Pct change 2.8% 0.0% -2.8% -1.7% -2.2% -1.7%
Poplar Tree Rd
Volume 470 450 410 420 410 420
Change 20 0 -40 -30 -40 -30
Pct change 4.4% 0.0% -8.9% -6.7% -8.9% -6.7%
Cabells Mill Dr
Volume 540 500 440 450 440 460
Change 40 0 -60 -50 -60 -40
Pct change 8.0% 0.0% -12.0% -10.0% -12.0% -8.0%
US 29
Volume 1,450 1,390 1,270 1,330 1,290 1,370
Change 60 0 -120 -60 -100 -20
Pct change 4.3% 0.0% -8.6% -4.3% -7.2% -1.4%
New Braddock Rd
Volume 1,510 1,470 1,450 1,450 1,430 1,430
Change 40 0 -20 -20 -40 -40
Pct change 2.7% 0.0% -1.4% -1.4% -2.7% -2.7%
VA 658 (Compton Rd)
Volume 1,080 1,040 990 990 990 1,000
Change 40 0 -50 -50 -50 -40
Pct change 3.8% 0.0% -4.8% -4.8% -4.8% -3.8%
Between VA 123 (Chain Bridge Rd) and VA 243 (Nutley St)
Total
Volume 14,120 15,890 17,050 16,700 16,890 16,570
Change -1,770 0 1,160 810 1,000 680
Pct change -11.1% 0.0% 7.3% 5.1% 6.3% 4.3%
I-66 GP
Volume 4,830 6,190 6,080 6,080 6,010 6,010
Change -1,360 0 -110 -110 -180 -180
Pct change -22.0% 0.0% -1.8% -1.8% -2.9% -2.9%
I-66 HOV
Volume 1,460 1,890 3,430 2,970 3,410 2,930
Change -430 0 1,540 1,080 1,520 1,040
Pct change -22.8% 0.0% 81.5% 57.1% 80.4% 55.0%
VA 673 (Lawyers Rd)
Volume 830 820 790 800 780 800
Change 10 0 -30 -20 -40 -20
Pct change 1.2% 0.0% -3.7% -2.4% -4.9% -2.4%
VA 672 (Vale Rd)
Volume 750 740 710 730 710 720
Change 10 0 -30 -10 -30 -20
Pct change 1.4% 0.0% -4.1% -1.4% -4.1% -2.7%
VA 123 (Chain Bridge Rd)
Volume 1,280 1,300 1,280 1,290 1,270 1,290
Change -20 0 -20 -10 -30 -10
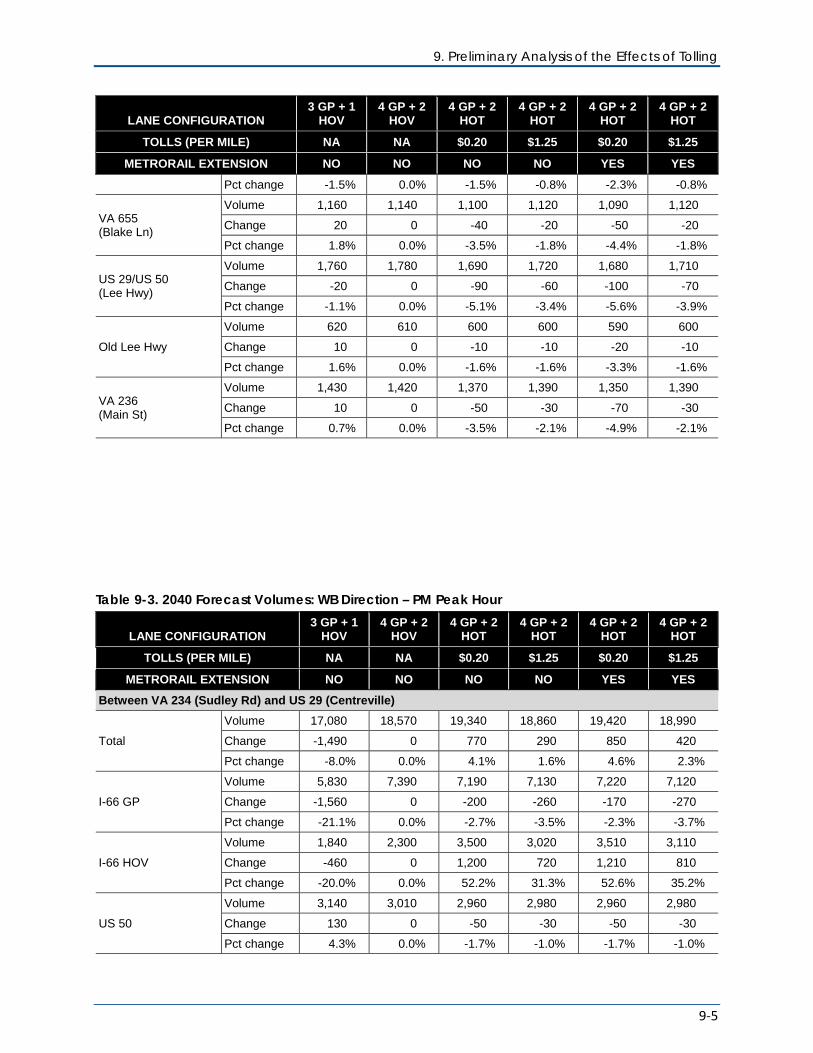
9. Preliminary Analysis of the Effects of Tolling
9-5
LANE CONFIGURATION 3 GP + 1
HOV 4 GP + 2
HOV 4 GP + 2
HOT 4 GP + 2
HOT 4 GP + 2
HOT 4 GP + 2
HOT
TOLLS (PER MILE) NA NA $0.20 $1.25 $0.20 $1.25
METRORAIL EXTENSION NO NO NO NO YES YES
Pct change -1.5% 0.0% -1.5% -0.8% -2.3% -0.8%
VA 655 (Blake Ln)
Volume 1,160 1,140 1,100 1,120 1,090 1,120
Change 20 0 -40 -20 -50 -20
Pct change 1.8% 0.0% -3.5% -1.8% -4.4% -1.8%
US 29/US 50 (Lee Hwy)
Volume 1,760 1,780 1,690 1,720 1,680 1,710
Change -20 0 -90 -60 -100 -70
Pct change -1.1% 0.0% -5.1% -3.4% -5.6% -3.9%
Old Lee Hwy
Volume 620 610 600 600 590 600
Change 10 0 -10 -10 -20 -10
Pct change 1.6% 0.0% -1.6% -1.6% -3.3% -1.6%
VA 236 (Main St)
Volume 1,430 1,420 1,370 1,390 1,350 1,390
Change 10 0 -50 -30 -70 -30
Pct change 0.7% 0.0% -3.5% -2.1% -4.9% -2.1%
Table 9-3. 2040 Forecast Volumes: WB Direction – PM Peak Hour
LANE CONFIGURATION 3 GP + 1
HOV 4 GP + 2
HOV 4 GP + 2
HOT 4 GP + 2
HOT 4 GP + 2
HOT 4 GP + 2
HOT
TOLLS (PER MILE) NA NA $0.20 $1.25 $0.20 $1.25
METRORAIL EXTENSION NO NO NO NO YES YES
Between VA 234 (Sudley Rd) and US 29 (Centreville)
Total
Volume 17,080 18,570 19,340 18,860 19,420 18,990
Change -1,490 0 770 290 850 420
Pct change -8.0% 0.0% 4.1% 1.6% 4.6% 2.3%
I-66 GP
Volume 5,830 7,390 7,190 7,130 7,220 7,120
Change -1,560 0 -200 -260 -170 -270
Pct change -21.1% 0.0% -2.7% -3.5% -2.3% -3.7%
I-66 HOV
Volume 1,840 2,300 3,500 3,020 3,510 3,110
Change -460 0 1,200 720 1,210 810
Pct change -20.0% 0.0% 52.2% 31.3% 52.6% 35.2%
US 50
Volume 3,140 3,010 2,960 2,980 2,960 2,980
Change 130 0 -50 -30 -50 -30
Pct change 4.3% 0.0% -1.7% -1.0% -1.7% -1.0%
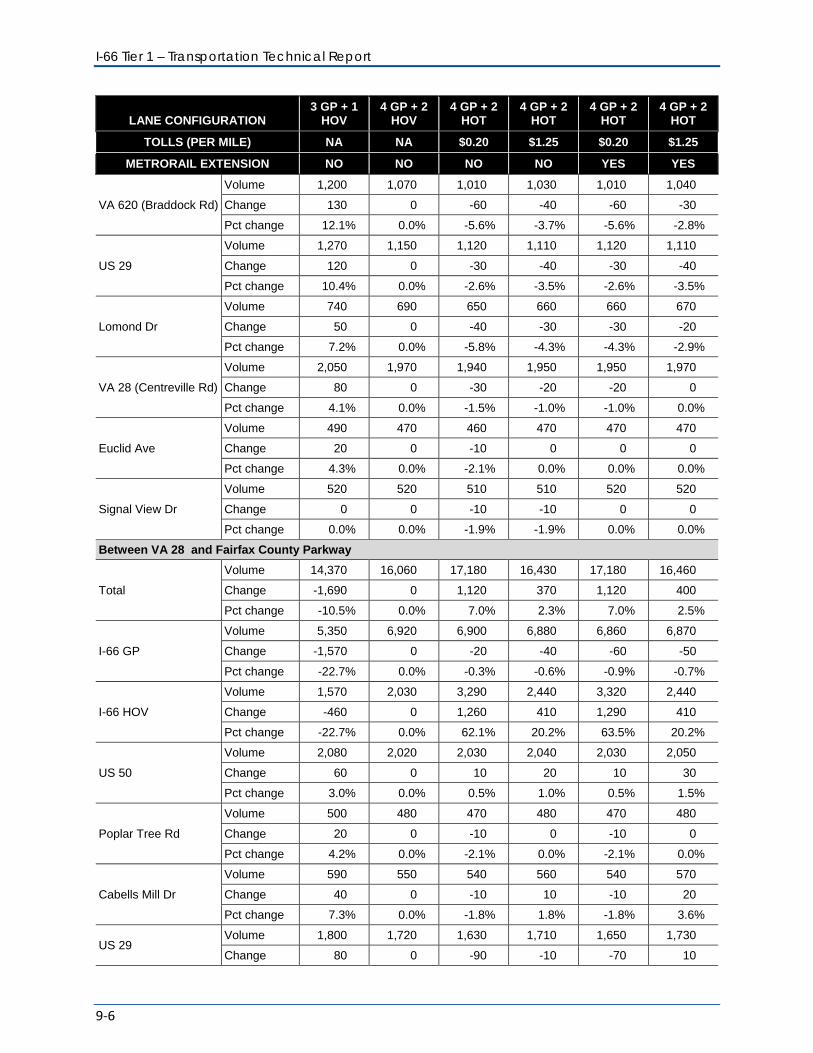
I-66 Tier 1 – Transportation Technical Report
9-6
LANE CONFIGURATION 3 GP + 1
HOV 4 GP + 2
HOV 4 GP + 2
HOT 4 GP + 2
HOT 4 GP + 2
HOT 4 GP + 2
HOT
TOLLS (PER MILE) NA NA $0.20 $1.25 $0.20 $1.25
METRORAIL EXTENSION NO NO NO NO YES YES
VA 620 (Braddock Rd)
Volume 1,200 1,070 1,010 1,030 1,010 1,040
Change 130 0 -60 -40 -60 -30
Pct change 12.1% 0.0% -5.6% -3.7% -5.6% -2.8%
US 29
Volume 1,270 1,150 1,120 1,110 1,120 1,110
Change 120 0 -30 -40 -30 -40
Pct change 10.4% 0.0% -2.6% -3.5% -2.6% -3.5%
Lomond Dr
Volume 740 690 650 660 660 670
Change 50 0 -40 -30 -30 -20
Pct change 7.2% 0.0% -5.8% -4.3% -4.3% -2.9%
VA 28 (Centreville Rd)
Volume 2,050 1,970 1,940 1,950 1,950 1,970
Change 80 0 -30 -20 -20 0
Pct change 4.1% 0.0% -1.5% -1.0% -1.0% 0.0%
Euclid Ave
Volume 490 470 460 470 470 470
Change 20 0 -10 0 0 0
Pct change 4.3% 0.0% -2.1% 0.0% 0.0% 0.0%
Signal View Dr
Volume 520 520 510 510 520 520
Change 0 0 -10 -10 0 0
Pct change 0.0% 0.0% -1.9% -1.9% 0.0% 0.0%
Between VA 28 and Fairfax County Parkway
Total
Volume 14,370 16,060 17,180 16,430 17,180 16,460
Change -1,690 0 1,120 370 1,120 400
Pct change -10.5% 0.0% 7.0% 2.3% 7.0% 2.5%
I-66 GP
Volume 5,350 6,920 6,900 6,880 6,860 6,870
Change -1,570 0 -20 -40 -60 -50
Pct change -22.7% 0.0% -0.3% -0.6% -0.9% -0.7%
I-66 HOV
Volume 1,570 2,030 3,290 2,440 3,320 2,440
Change -460 0 1,260 410 1,290 410
Pct change -22.7% 0.0% 62.1% 20.2% 63.5% 20.2%
US 50
Volume 2,080 2,020 2,030 2,040 2,030 2,050
Change 60 0 10 20 10 30
Pct change 3.0% 0.0% 0.5% 1.0% 0.5% 1.5%
Poplar Tree Rd
Volume 500 480 470 480 470 480
Change 20 0 -10 0 -10 0
Pct change 4.2% 0.0% -2.1% 0.0% -2.1% 0.0%
Cabells Mill Dr
Volume 590 550 540 560 540 570
Change 40 0 -10 10 -10 20
Pct change 7.3% 0.0% -1.8% 1.8% -1.8% 3.6%
US 29 Volume 1,800 1,720 1,630 1,710 1,650 1,730
Change 80 0 -90 -10 -70 10
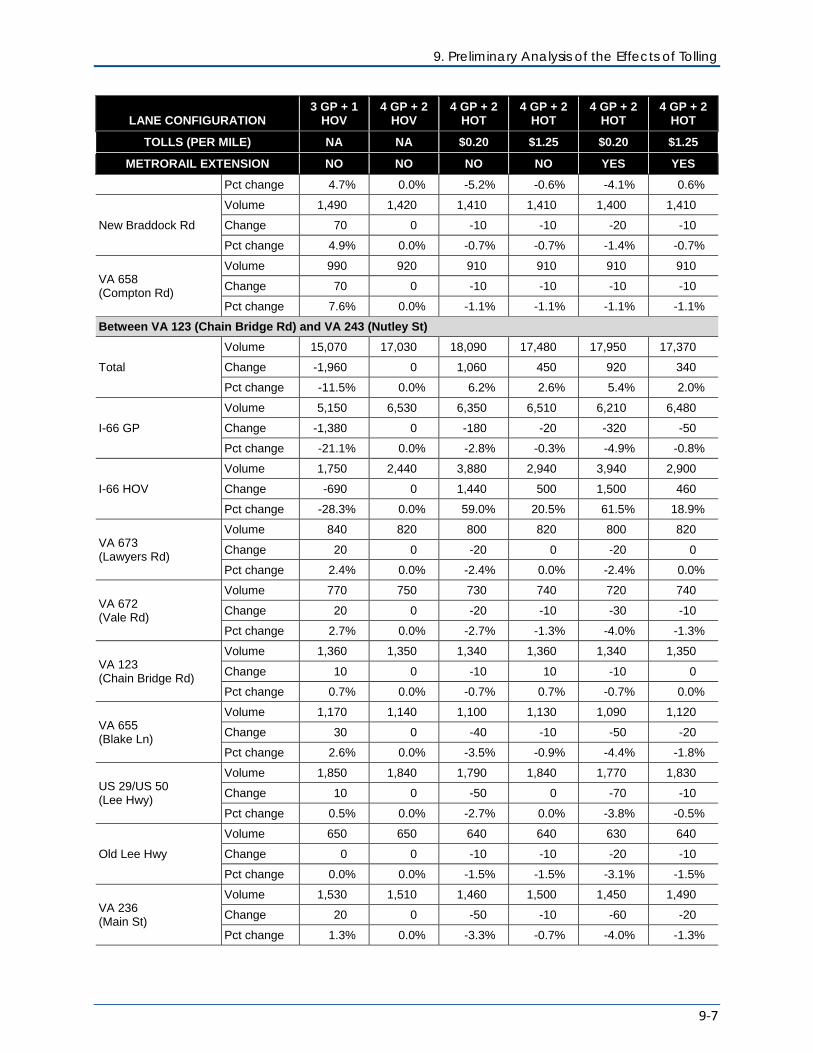
9. Preliminary Analysis of the Effects of Tolling
9-7
LANE CONFIGURATION 3 GP + 1
HOV 4 GP + 2
HOV 4 GP + 2
HOT 4 GP + 2
HOT 4 GP + 2
HOT 4 GP + 2
HOT
TOLLS (PER MILE) NA NA $0.20 $1.25 $0.20 $1.25
METRORAIL EXTENSION NO NO NO NO YES YES
Pct change 4.7% 0.0% -5.2% -0.6% -4.1% 0.6%
New Braddock Rd
Volume 1,490 1,420 1,410 1,410 1,400 1,410
Change 70 0 -10 -10 -20 -10
Pct change 4.9% 0.0% -0.7% -0.7% -1.4% -0.7%
VA 658 (Compton Rd)
Volume 990 920 910 910 910 910
Change 70 0 -10 -10 -10 -10
Pct change 7.6% 0.0% -1.1% -1.1% -1.1% -1.1%
Between VA 123 (Chain Bridge Rd) and VA 243 (Nutley St)
Total
Volume 15,070 17,030 18,090 17,480 17,950 17,370
Change -1,960 0 1,060 450 920 340
Pct change -11.5% 0.0% 6.2% 2.6% 5.4% 2.0%
I-66 GP
Volume 5,150 6,530 6,350 6,510 6,210 6,480
Change -1,380 0 -180 -20 -320 -50
Pct change -21.1% 0.0% -2.8% -0.3% -4.9% -0.8%
I-66 HOV
Volume 1,750 2,440 3,880 2,940 3,940 2,900
Change -690 0 1,440 500 1,500 460
Pct change -28.3% 0.0% 59.0% 20.5% 61.5% 18.9%
VA 673 (Lawyers Rd)
Volume 840 820 800 820 800 820
Change 20 0 -20 0 -20 0
Pct change 2.4% 0.0% -2.4% 0.0% -2.4% 0.0%
VA 672 (Vale Rd)
Volume 770 750 730 740 720 740
Change 20 0 -20 -10 -30 -10
Pct change 2.7% 0.0% -2.7% -1.3% -4.0% -1.3%
VA 123 (Chain Bridge Rd)
Volume 1,360 1,350 1,340 1,360 1,340 1,350
Change 10 0 -10 10 -10 0
Pct change 0.7% 0.0% -0.7% 0.7% -0.7% 0.0%
VA 655 (Blake Ln)
Volume 1,170 1,140 1,100 1,130 1,090 1,120
Change 30 0 -40 -10 -50 -20
Pct change 2.6% 0.0% -3.5% -0.9% -4.4% -1.8%
US 29/US 50 (Lee Hwy)
Volume 1,850 1,840 1,790 1,840 1,770 1,830
Change 10 0 -50 0 -70 -10
Pct change 0.5% 0.0% -2.7% 0.0% -3.8% -0.5%
Old Lee Hwy
Volume 650 650 640 640 630 640
Change 0 0 -10 -10 -20 -10
Pct change 0.0% 0.0% -1.5% -1.5% -3.1% -1.5%
VA 236 (Main St)
Volume 1,530 1,510 1,460 1,500 1,450 1,490
Change 20 0 -50 -10 -60 -20
Pct change 1.3% 0.0% -3.3% -0.7% -4.0% -1.3%
I-66 Tier 1 – Transportation Technical Report
9-8
The screenline results in Tables 9-2 and 9-3 support the following high-level conclusions with respect to the anticipated effects of tolling within the I-66 corridor:
• The conversion of HOV lanes to HOT lanes will increase the amount of travel within the corridor that is accommodated on I-66 itself. This is because the model predicts that HOV demand will not fill the second HOV lane included in Option 2 but the option for using the two HOT lanes by paying a toll would result in 50 percent or more traffic in the managed lanes. The additional “capacity” afforded by the HOT lanes for general purpose (albeit toll) travel would also reduce travel on parallel roads for each of the three screenlines. While the high toll level would result in fewer vehicles within the HOT lanes, it would still reduce travel on parallel roads for each screenline, although at a lower level of reduction.
• Total traffic will be lower with a higher toll rate than with a lower toll rate. Though the capacity is the same with both toll rates tested, more traffic would use the I-66 corridor with a lower toll rate. With a lower toll rate, there is less impedance on the managed lanes for lower occupancy vehicles, which makes these lanes more attractive, leading to more vehicles being assigned to the managed lanes with a lower toll rate. However, even with the higher toll rate, traffic on parallel routes would be reduced as compared to either Option 1 or Option 2.
As noted at the beginning of this section, the tolling scenarios assessed for this high-level Tier 1 tolling analysis do not assume that existing lanes would be tolled, but rather that tolls would be applied to new roadway lanes, with the most likely scenario resulting from tolls applied as part of a HOT lanes system that allow 3+ occupant vehicles to avoid paying the toll. The analysis shows that level of traffic diversion from I-66 as a result of any tolls applied in this manner is either very low or even negative (i.e., at a relatively low level, traffic would be attracted to I-66 and away from local roads). This suggests that potential for significant environmental impacts resulting from traffic diverting to other roads from I-66 based on tolling are low and that tolling could be considered for advancement into Tier 2 analyses.