Embed Size (px)
Citation preview

Visual-XSel Introduction & SixSigma
© Copyright CRGRAPH 2017 www.crgraph.com
Selected statistical methods, examples and SixSigma
with Visual-XSel 14.0
Visual-XSel Introduction & SixSigma
© Copyright CRGRAPH 2017 www.crgraph.com
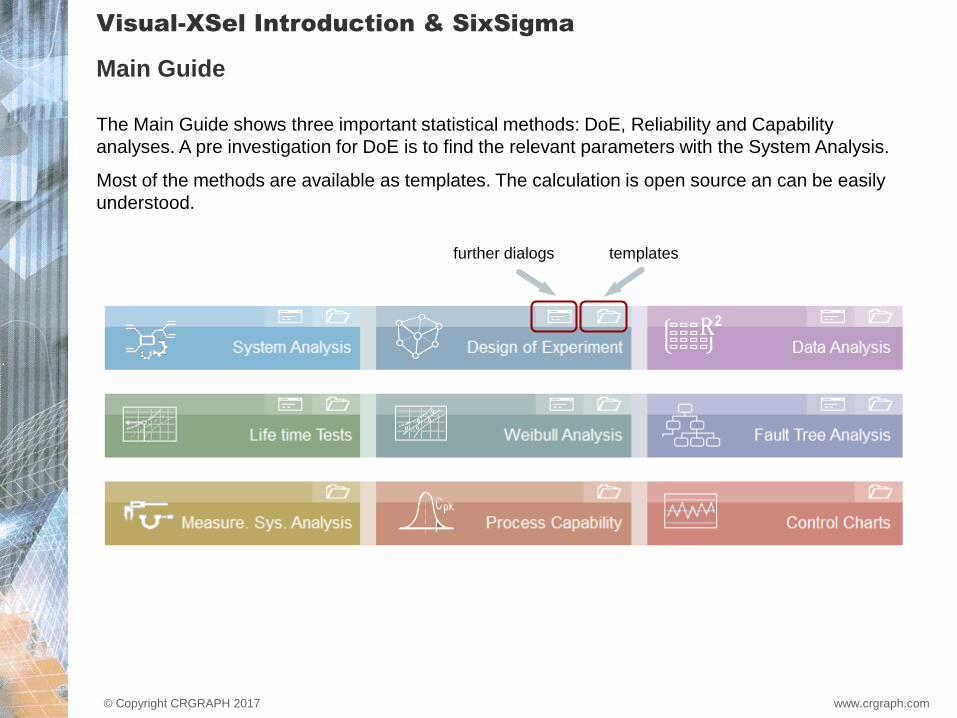
The Main Guide shows three important statistical methods: DoE, Reliability and Capability
analyses. A pre investigation for DoE is to find the relevant parameters with the System Analysis.
Most of the methods are available as templates. The calculation is open source an can be easily
understood.
further dialogs templates
Main Guide

Visual-XSel Introduction & SixSigma
© Copyright CRGRAPH 2017 www.crgraph.com
Main Guide
Hypothesen-
tests
For superior methods and topics, there are detailed descriptions in which the respective
"tools" are linked.

Visual-XSel Introduction & SixSigma
© Copyright CRGRAPH 2017 www.crgraph.com
Data and reprasentation
An Excel-like table is available on the left, whose width is automatically aligned with the data, or
can be adapted manually. On the right there is the main window for all diagramme, output etc.
The representation is exact what you get at printing out.

Visual-XSel Introduction & SixSigma
© Copyright CRGRAPH 2017 www.crgraph.com
Menu bar
click on
table
click to main window
If necessary, additional icons are displayed on the right side. In this example typical icons
for colour, brush and drawing elements are shown.

Visual-XSel Introduction & SixSigma
© Copyright CRGRAPH 2017 www.crgraph.com
Special paste
To paste data from the clipboard use the icon „Paste special“ or the menu Edit/Paste contents/
transform before paste..
With the following dialog the most frequently used transforms are available, e.g. transpose.
Note:
This function should
also be used if you want
to import columns from
PDF files separated by
spaces. Otherwise, all
the columns of the PDF
file are copied into one
column.

Visual-XSel Introduction & SixSigma
© Copyright CRGRAPH 2017 www.crgraph.com
Filter & quick statistics
Click on the first row, or mark the column, a filter symbol appears
Depending on the data, a frequency distribution is
shown (numerical are classified here).
The statistics below show
the most important charac-
teristic values as well as a
statistical test for normal
distribution.
click here to
copy the results
to the clipboard

Visual-XSel Introduction & SixSigma
© Copyright CRGRAPH 2017 www.crgraph.com
Statistical methods/functions
Diagram-functions Internal functions Templates
e.g. test of normality,
hypothesis of equality with
Boxplot or test of normality
Select Diagram
e.g. calculation of distribu-
tions, DoE, regression,
sample size, etc.
Select menu Statistics
e.g. hypothesis-test, or
Weibull-Analysis.
Select menu StatTempl.,
or menu File/Templates
There are three ways to apply statistical methods.
Visual-XSel Introduction & SixSigma
© Copyright CRGRAPH 2017 www.crgraph.com
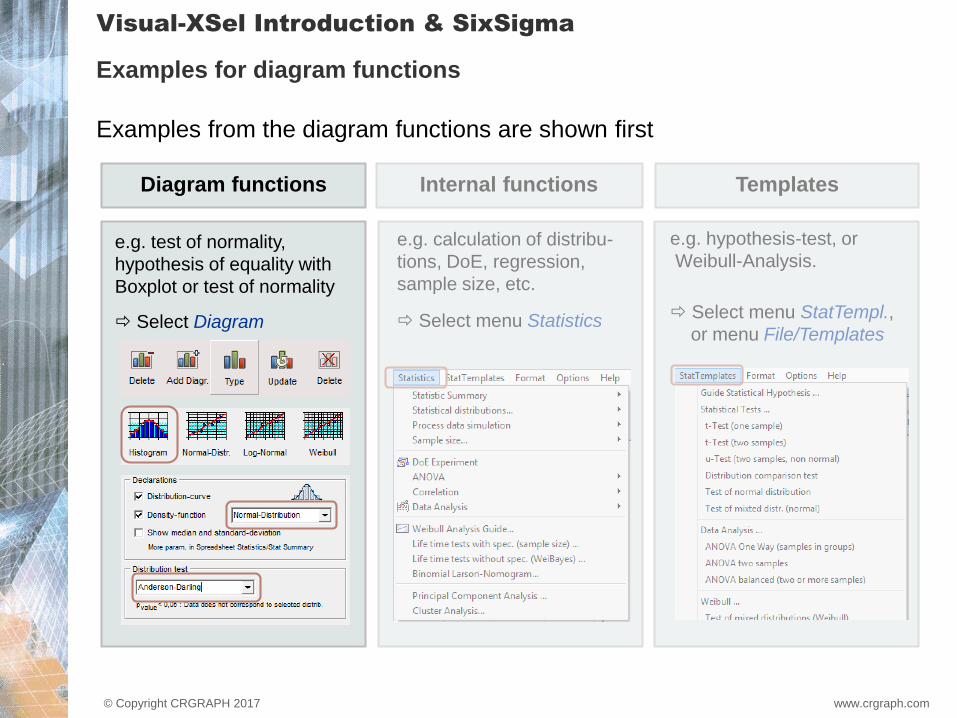
Examples for diagram functions
Diagram functions Internal functions Templates
e.g. test of normality,
hypothesis of equality with
Boxplot or test of normality
Select Diagram
e.g. calculation of distribu-
tions, DoE, regression,
sample size, etc.
Select menu Statistics
e.g. hypothesis-test, or
Weibull-Analysis.
Select menu StatTempl.,
or menu File/Templates
Examples from the diagram functions are shown first
Visual-XSel Introduction & SixSigma
© Copyright CRGRAPH 2017 www.crgraph.com
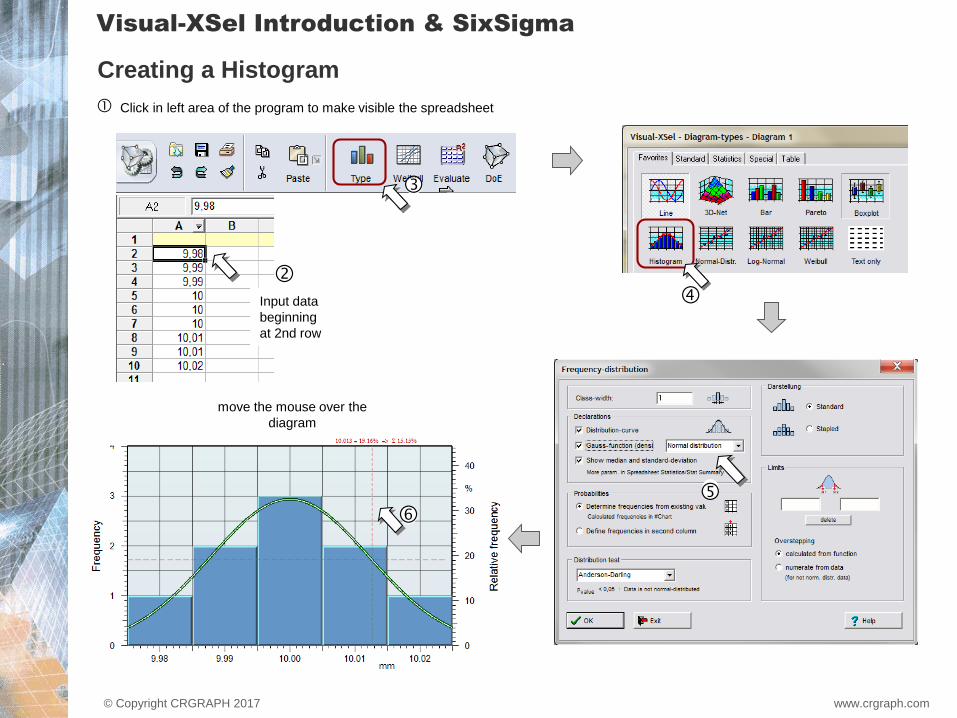
Creating a Histogram
Input data
beginning
at 2nd row
move the mouse over the
diagram
Click in left area of the program to make visible the spreadsheet

Visual-XSel Introduction & SixSigma
© Copyright CRGRAPH 2017 www.crgraph.com
Set a limit, for example for process capability
click the right mouse button and use Limit
(hint: no element has to be clicked before
and the mouse must be over the diagr.)
move mouse along the
gaussian curve

Visual-XSel Introduction & SixSigma
© Copyright CRGRAPH 2017 www.crgraph.com
T 6111.733= b 1.65=
H 100% 1 e
t
T
b-
-·=
t10 = 1568 R² = 0.981
Life time
2000 2500 3000 3500 4500 5500 6500 7500
%
Un
relia
bilit
y
0.01
0.02
0.04
0.1
0.2
0.4
1
2
4
10
20
40
60
99.99
6111.7
33
Creating a Weibull-chart
User File / New

Visual-XSel Introduction & SixSigma
© Copyright CRGRAPH 2017 www.crgraph.com
Boxplot with category „Cylinder“
Menu Data/Spreadsheet and open file:
Example_PLS_Consumption.vxt
Cy=4 Cy=6 Cy=8
Co
ns
2
4
6
8
10
12
14
16
Cy=4 Cy=6 Cy=8
Co
ns
2
4
6
8
10
12
14
16

Visual-XSel Introduction & SixSigma
© Copyright CRGRAPH 2017 www.crgraph.com
4=yC ;sei
D=uF
6=yC ;sei
D=uF
4=yC ;sa
G=u
F
6=yC ;sa
G=u
F
8=yC ;sa
G=u
F
Co
ns
4
6
8
10
12
14
2nd Boxplot with category Fuel
Open Data/Spreadsheet T1 and mark column H
Add diagram with symbol (+)
Green arrows between
Boxplots means that
there is no statistical
difference in consump-
tion (u-Test).
Red lines indicate a
significant difference
two categories

Visual-XSel Introduction & SixSigma
© Copyright CRGRAPH 2017 www.crgraph.com
Examples for diagram functions
Diagram functions Internal functions Templates
e.g. test of normality,
hypothesis of equality with
Boxplot or test of normality
Select Diagram
e.g. calculation of distribu-
tions, DoE, regression,
sample size, etc.
Select menu Statistics
e.g. hypothesis-test, or
Weibull-Analysis.
Select menu StatTempl.,
or menu File/Templates
The following examples show internal functions

Visual-XSel Introduction & SixSigma
© Copyright CRGRAPH 2017 www.crgraph.com
Statistical characteristics
Results in sheet
„Summary“
If the data column has to be
grouped, select additional
columns with attributes

Visual-XSel Introduction & SixSigma
© Copyright CRGRAPH 2017 www.crgraph.com
How to calculate distribution values or the „z“-value
If using the Inverse normal distribution
with mean = 0 and std-dev = 1, the result
x (normally the quantile) has in this case
the meaning of the so called „z“-value

Visual-XSel Introduction & SixSigma
© Copyright CRGRAPH 2017 www.crgraph.com
Standard Regression
Menu Data/Spreadsheet and open file:
Example_PLS_Consumption.vxt
y 1.69580064 e0.0008773 x·
·= r = 0.579
Cons
Weight
1350 1400 1450 1500 1550 1600 1650 1700 1750 1800 1850 1900
Co
ns
4
6
8
10
12
14

Visual-XSel Introduction & SixSigma
© Copyright CRGRAPH 2017 www.crgraph.com
Creating Experiments - DoE
Start the Experiment dialog via icon,
or via Main Guide,
or menu Data
Define Factors and follow the steps marked with
a green triangle
Use adequate Model and Type.
Perhaps define constrains and other options.
Create Experiment with button „Create“.
Input measurements for response column
and start icon Data-Analysis
input data
Visual-XSel Introduction & SixSigma
© Copyright CRGRAPH 2017 www.crgraph.com
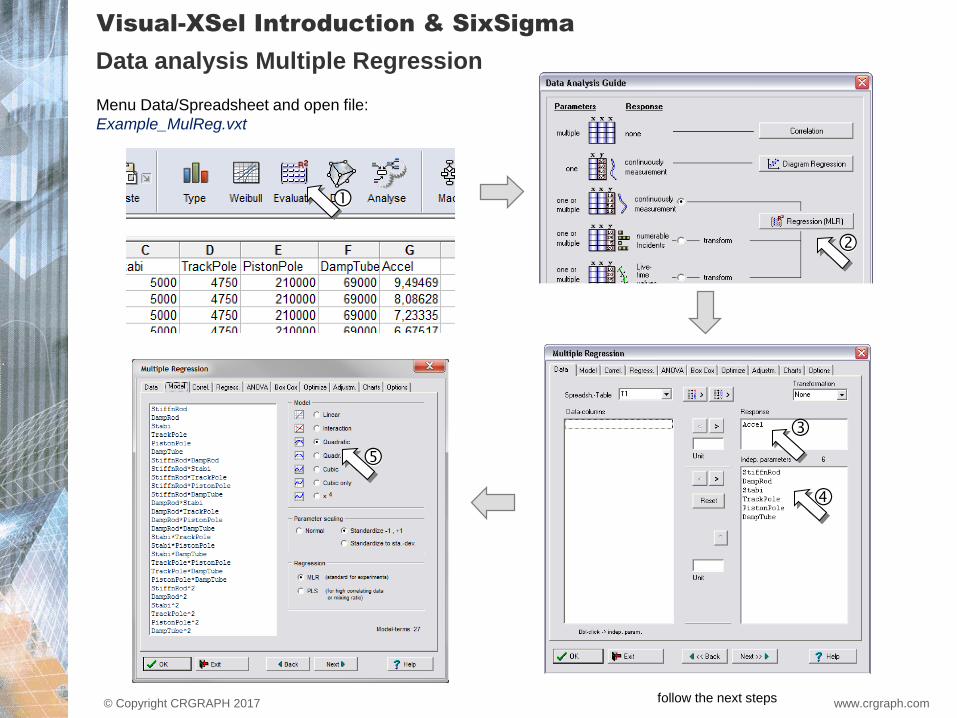
Data analysis Multiple Regression
Menu Data/Spreadsheet and open file:
Example_MulReg.vxt
follow the next steps
Visual-XSel Introduction & SixSigma
© Copyright CRGRAPH 2017 www.crgraph.com
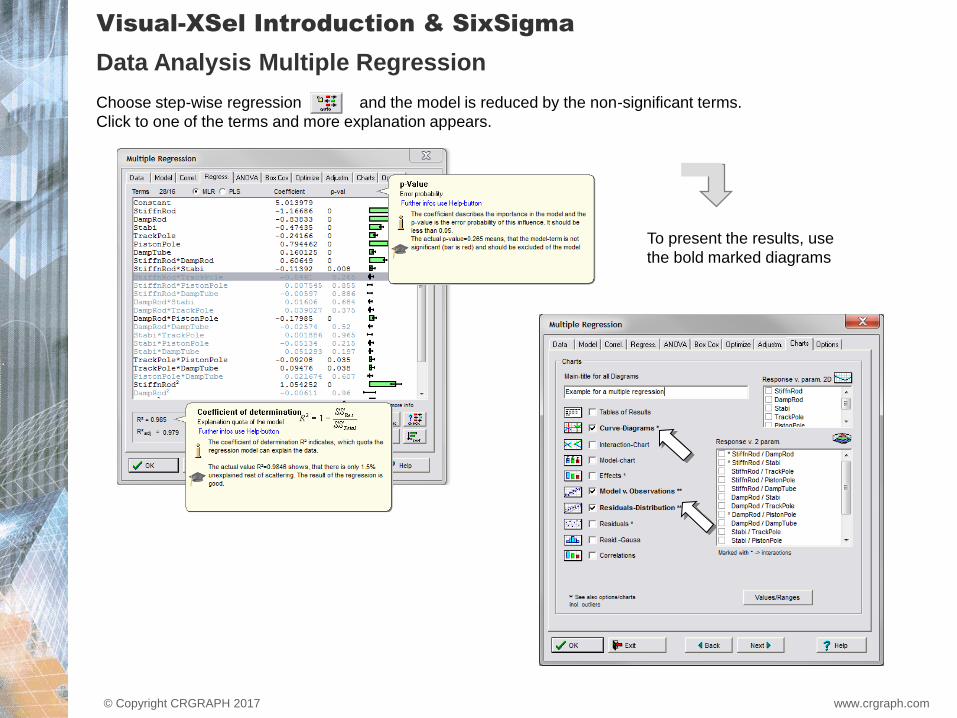
Data Analysis Multiple Regression
Choose step-wise regression and the model is reduced by the non-significant terms.
Click to one of the terms and more explanation appears.
To present the results, use
the bold marked diagrams

Visual-XSel Introduction & SixSigma
© Copyright CRGRAPH 2017 www.crgraph.com
Example car wash: The drying time of a varnish should be examined. It should be reached an exactness
from 0,5 hrs. The drying time has a standard deviation of 2 hrs. How big has to be the necessary sample size?
The calculation can occur with the Calculator (view of the main window):
Calculation of a spot check size
The result of 61.46 is rounded up and proves therefore n=62
Hint: At step there must be clicked
the right mouse button (formula:
Metrical sample size)
Visual-XSel Introduction & SixSigma
© Copyright CRGRAPH 2017 www.crgraph.com
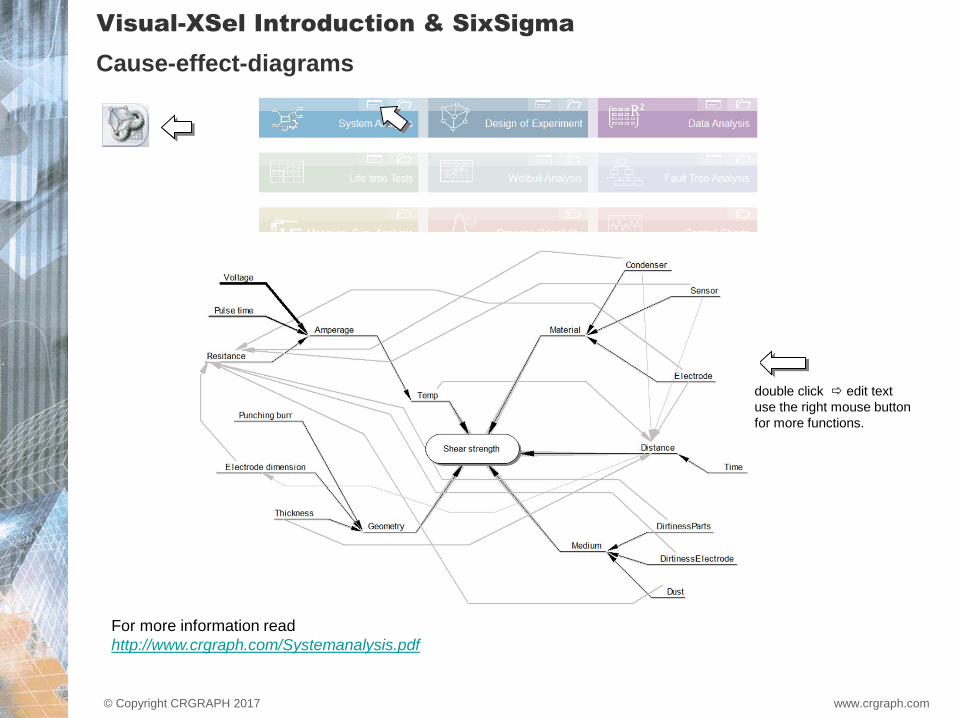
Cause-effect-diagrams
For more information read
http://www.crgraph.com/Systemanalysis.pdf
double click edit text
use the right mouse button
for more functions.

Visual-XSel Introduction & SixSigma
© Copyright CRGRAPH 2017 www.crgraph.com
Click to one of the
elements and use
the right mouse-
button
at basis-events there
can defined a probability
See example in menu File,
Templates,
System-Analysis
For more information read http://www.weibull.de//COM/Fault_Tree_Analysis.pdf
Fault-Tree-Analysis

Visual-XSel Introduction & SixSigma
© Copyright CRGRAPH 2017 www.crgraph.com
Examples for templates
Diagram functions Internal functions Templates
e.g. test of normality,
hypothesis of equality with
Boxplot or test of normality
Select Diagram
e.g. calculation of distribu-
tions, DoE, regression,
sample size, etc.
Select menu Statistics
e.g. hypothesis-test, or
Weibull-Analysis.
Select menu StatTempl.,
or menu File/Templates
The other examples treat templates

Visual-XSel Introduction & SixSigma
© Copyright CRGRAPH 2017 www.crgraph.com
Where can I find the SixSigma-Table?
Sigma
1
1.5
2
2.5
3
3.5
4
4.5
5
5.5
6
*
**
Cp
0.33
0.50
0.67
0.83
1.00
1.17
1.33
1.50
1.67
1.83
2.00
one sided without mean displacement
one sided with mean displacement of 1.5 s
Cpk**
-
0.00
0.17
0.33
0.50
0.67
0.83
1.00
1.17
1.33
1.50
inside %*
84.13
93.32
97.72
99.38
99.87
99.98
99.9968
99.9997
99.99997
99.999998
100
outside %*
15.87
6.68
2.28
0.621
0.135
2.33E-02
3.17E-03
3.40E-04
2.87E-05
1.90E-06
9.87E-08
ppm*
158655
66807
22750
6210
1350
233
32
3.4
0.287
0.019
0.001
ppm-SS**
691462
500000
308538
158655
66807
22750
6210
1350
233
32
3.4
99,9999999
Sigma
inside
outside
Use File/Templates/12_Six Sigma
and open the file
Cpk_Sigma_Table.vxg

Visual-XSel Introduction & SixSigma
© Copyright CRGRAPH 2017 www.crgraph.com
Statistical t-tests via templates
Open the Spreadsheet and the tablewhere
are the sub-groups of the Boxplots.
Mark column A and B.
Note:
The template for the test is embedded
in the actual project. To have a view to
the previous representation an data
select Main-project!

Visual-XSel Introduction & SixSigma
© Copyright CRGRAPH 2017 www.crgraph.com
Check type of distribution
\Templates\10_Distributions\Distribution_Comparison_Test.vxg
The best distribution
is this one with the
greatest pvalue
0 100 200 300 400 500
Fre
qu
en
cy
0
10
20
30
40
50
%
0
10
20
30
40
50x_ = 84.577±18.1 s = 91.88197 pvalue = 0
Distribution Test
0 100 200 300 400 500
0
10
20
30
40
50
%
0
10
20
30
40
50x_
log = 3.9624 slog = 1.029646 pvalue = 0.998
0 100 200 300 400 500
0
10
20
30
40
50
%
0
10
20
30
40
50 = 92.78222 pvalue = 0.00129
0 100 200 300 400 500
0
10
20
30
40
50
%
0
10
20
30
40
50T = 84.70171 b = 1.19 pvalue = 0.0158
0 100 200 300 400 500
0
10
20
30
40
50
%
0
10
20
30
40
50x_
1 = 43.954 s1 = 24.17744 x_
2 = 204.42 s2 = 126.7685 q = 0.73 pvalue = 0.00952
0 100 200 300 400 500
0
10
20
30
40
50
%
0
10
20
30
40
50 = 69.84962 pvalue = 0
Normal- distribution Log- norm al- distribution Folded- normal- distribution
Exponential- distribution W eibull- distribution Mixed- distribution

Visual-XSel Introduction & SixSigma
© Copyright CRGRAPH 2017 www.crgraph.com
Measurement-capability Type 1 Cg/Cgk
Example: \Templates\07_Measurement_System_Analysis\
Measurement_System_Analysis_Type1_CgCgk.vxg

Visual-XSel Introduction & SixSigma
© Copyright CRGRAPH 2017 www.crgraph.com
Be successful and enjoy it….
More information's at
http://www.crgraph.com/Topics.htm
and
http://www.crgraph.com/Software.htm
(on the right side)
Contact: [email protected]