Embed Size (px)
Citation preview
Visual Support for Work Assignment inProcess-Aware Information Systems
Massimiliano de Leoni1, W.M.P. van der Aalst2,3, and A.H.M. ter Hofstede3
1 SAPIENZA - Universita di Roma, Rome, [email protected]
2 Eindhoven University of Technology, Eindhoven, The [email protected]
3 Queensland University of Technology, Brisbane, [email protected]
Abstract. Process-aware information systems ranging from genericworkflow systems to dedicated enterprise information systems use worklists to offer so-called work items to users. The work list handlers typi-cally show a sorted list of work items comparable to the way that e-mailsare presented in most e-mail programs. Since the work list handler is thedominant interface between the system and its users, it is worthwhile toprovide a more advanced graphical interface that uses context informa-tion about work items and users. This paper uses the “map metaphor” tovisualise work items and resources (e.g., users) in a sophisticated man-ner. Moreover, based on “distance notions” work items are visualiseddifferently. For example, urgent work items of a type that suits the userare highlighted. The underlying map and distance notions may be ofa geographical nature (e.g., a map of a city of office building), but mayalso be based on the process design, organisational structures, social net-works, due dates, calenders, etc. The approach presented in this paperis supported by a visualisation framework implemented in the contextof YAWL. The framework is set up in such a way that it can easily becombined with other workflow systems.Keywords: Process-aware Information Systems, work list visualisation,YAWL
1 Introduction
Originally, Process-Aware Information Systems (PAISs) [1] were mainly appliedin the context of administrative processes. Later their application was extendedto cross-organisational processes. Currently, PAISs are starting to be used formore flexible and/or pervasive processes, e.g., disaster management scenarios [2].
Independently on the application domain and underlying technology, a PAISis driven by some process model. The model may be implicit or hidden, but thesystem supports the handling of cases in some (semi-)structured form. PAISshave also in common that they offer work to resources (typically people). Theelementary pieces of work are called work items, e.g., “Approve travel requestXYZ1234”. These work items are offered to the users by the so-called work
list handler. This component takes care of work distribution and authorisationissues. Typically, PAISs use a so-called “pull mechanism”, i.e., work is offered toall resources that qualify and the first resource to select it will be the only oneexecuting it. To allow users to “pull the right work items in the right order”,basic information is provided, e.g., task name, due date, etc. However, giventhe fact that the work list is the main interface of the PAIS with its users itseems important to provide support that goes beyond a sorted list of items. Ifwork items are selected by less qualified users than necessary or if users selectitems in a non-optimal order, then the performance of the overall process ishampered. Assume the situation where multiple resources have overlapping rolesand authorisations and that there are times where work is piling up (i.e., anynormal business). In such a situation the questions listed below are relevant.
– “What is the most urgent work item I can perform?”– “What work item is, geographically speaking, closest to me?”– “Is there another resource that can perform this work item that is closer to
it than me?”– “Is it critical that I handle this work item or are there others that can also
do this?”– “How are the work items divided over the different departments?”
To our knowledge, commercial as well as open source PAISs present worklists simply as a list of work items each with a short textual description. Someproducts sort the work items in a work list using a certain priority schemespecified at design time and not updated at run time. To support the user in abetter way and assist her in answering the above questions, we use maps. A mapcan be a geographical map (e.g., the map of a university’s campus). But othermaps can be used, e.g., process schema’s, organisational diagrams, Gantt charts,etc. Work items can be visualised by dots on the map. By not fixing the type ofmap, but allowing this choice to be configurable, different types of relationshipscan be shown thus providing a deeper insight into the context of the work to beperformed.
Work items are shown on maps. Moreover, for some maps also resources canbe shown, e.g., the geographical position of a user. Besides the “map metaphor”we also use the “distance metaphor”. Seen from the viewpoint of the user somework items are close while others are far away. This distance may be geographic,e.g., a field service engineer may be far away from a malfunctioning printer atthe other side of the campus. However, many other distance metrics are possible.For example, one can support metrics capturing familiarity with certain typesof work, levels of urgency, and organisational distance. It should be noted thatthe choice of metric is orthogonal to the choice of map thus providing a highdegree of flexibility in context visualisation. Resources could for example opt tosee a geographical map where work items, whose position is calculated based ona function supplied at design time, display their level of urgency.
This paper proposes different types of maps and distance metrics. Moreover,the framework has been implemented and integrated in YAWL.4 YAWL is an4 www.yawlfoundation.org
open source workflow system based on the so-called workflow patterns. However,the framework and its implementation are set-up in such a way that it can easilybe combined with other PAISs.
The paper is structured as follows. Section 2 discusses the state of the art inwork list visualisation in PAISs, whereas Section 3 provides a detailed overviewof the general framework. Section 4 focusses on the implementation of the frame-work, highlighting some design choices In Section 5 the framework is illustratedthrough a case study. Section 6 summarises the contributions of the paper andoutlines avenues of future work aimed.
2 Related Work
Little work has been conducted in the field of work list visualisation. Visualisa-tion techniques in the area of PAIS have predominantly been used to aid in theunderstanding of process schemas and their run time behaviour, e.g. throughsimulation [3] or process mining [4]. Although the value of business process visu-alisation is acknowledged, both in literature [5–8] and industry, little work hasbeen done in the context of visualising work items.
The aforementioned body of work does not provide specific support forcontext-dependent work item selection. This is addressed though in the workby Brown and Paik [9], whose basic idea is close to the proposal of this paper.Images can be defined as maps and mappings can be specified between workitems and these maps. Work items are visualised through the use of intuitiveicons and the colour of work items changes according to their state. However,the approach chosen does not work so well in real-life scenarios where many workitems may have the same position (especially in course-grained maps) as iconswith the same position are placed alongside each other. This may lead to a sit-uation where a map is completely obscured by its work items. In our approach,these items are coalesced in a single dot of which the size is proportionate totheir number. By gradually zooming in on such a dot, the individual work itemscam become visible again. In addition, in [9] there is no concept similar to ourdistance notion, which is an ingredient that can provide significant assistancewith work item selection to resources. Finally, the work of Brown and Paik doesnot take the visualisation of the positions of resources into account.
Also related is the work presented in [10], where proximity of work items isconsidered without discussing their visualisation.
Most PAISs present work lists as a simple enumeration of their work items,their textual descriptions, and possibly information about their priority and/ortheir deadlines. This holds both for open source products, as e.g. jBPM5 andTogether Workflow6, as for commercial systems, such as SAP Netweaver7 and
5 jBPM web site - http://www.jboss.com/products/jbpm6 Together Workflow web site - http://www.together.at/together/prod/tws/7 Netweaver web site - http://www.sap.com/usa/platform/netweaver
Flower8. An exception is TIBCO’s iProcess Suite9 which provides a richer typeof work list handler that partially addresses the problem of supporting resourceswith work item selection. For example, the work list handler can show the lengthsof the work queues of other resources or position of work item on a geographicmap at their location of execution. The iProcess Suite also supports a kindof look-head in the form of a list of “predicted” work items and their starttimes. One can also learn about projected deadline expirations and exceptionflows by expected durations specified at design time for the various tasks. Ourvisualisation framework is more accurate as it can take actual execution times ofwork items of a task into account through the use of log files when consideringpredictions for new work items of that task. Basically, the iProcess Suite providessupport for some specific views (geographical position, deadline expiration) butthese are isolated from each other. Our approach generalises over the type ofmaps (not just geographic) and unlike the iProcess Suite it is able to supportmultiple types of maps at the same time. The iProcess Suite is based on GoogleMaps while our framework does not rely on an external service for handlingmaps and positioning work items.
3 The General Framework
The proposed visualisation framework is based on a two-layer approach: (1) mapsand (2) the visualisation of work items based on a distance notion. A work itemis represented as a dot positioned along certain coordinates on a backgroundmap. A map is meant to capture a particular perspective of the context of theprocess. Since a work item can be associated with several perspectives, it canbe visualised in several maps (at different positions). Maps can be designed asneeded. When the use of a certain map is envisaged, the relationship betweenwork items and their position on the map should be specified through a functiondetermined at design time. Table 1 gives some examples of context views andthe corresponding work item mapping.
Several active “views” can be supported whereby users can switch from oneview to another. Resources can (optionally) see their own position on the mapand work items are coloured according to the value of the applicable distancemetric. Additionally, it may be helpful to show executing work items as well asthe position of other resources. Naturally, these visualisations are governed bythe authorisations that are in place.
Our framework assumes the generic lifecycle model as described in [11]. First,a work item is created indicating it is ready for distribution. The item is thenoffered to appropriate resources. A resource can commit to the execution of theitem, after which it moves to the allocated state. The start of its execution leadsit to the next state, started, after which it can successfully complete, it can besuspended (and subsequently resumed) or it can fail altogether. At run time aworkflow engine informs the framework about the lifecyle states of work items.8 Flower web site - http://global.pallas-athena.com/products/bpmflower product/9 iProcess Suite web site - http://www.tibco.com/software/business process management/

Table 1. Examples of maps and mappings.
Process context view Possible map and mappingThe physical environmentwhere tasks are going to beperformed.
A real geographical map (e.g., Google maps). Work items are placedwhere they should be performed and resource are placed where theyare located.
The process schema of thecase that work items belongto.
The process schema is the map and work items are placed on top oftasks that they are an instance of.
Deadline expiration of workitems.
The map is a time-line where the origin is the current time. Workitems are placed on the time-line at the latest moment when they canstart without their deadline expiring.
The organisation that is incharge of carrying out the pro-cess.
The map is an organizational chart. Work items are associated withthe role required for their execution. Resources are also shown basedon their organizational position.
The materials that are neededfor carrying out work items.
The map is a multidimensional graph where the axes are the materialsthat are needed for work item execution. Let us assume that materialsA and B are associated with axes x and y respectively. In this case, awork item is placed on coordinates (x, y) if it needs a quantity of x ofmaterial A and a quantity y of material B.
Costs versus benefits in exe-cuting work items.
In this case, the axes represent “Revenue” (the amount of money re-ceived for the performance of work items) and “Cost” (the expenseof their execution). A work item is placed on coordinates (x, y) if therevenue of its execution is x and its cost is y. In this case one is bestoff executing work items close to the x axis and far from the origin.
3.1 Fundamentals
In this section the various notions used in our framework, e.g. work item andresource, are defined formally.
Definition 1 (Work item). A work item w is a tuple (c, t, i, y, e, l), where:
– c is the identifier of the case that w belongs to.– t is the identifier of the task of which w is an instance.– i is a unique instance number.– y is the timestamp capturing when w moved to the “offered” state.– e is the (optional) deadline of w.– l represents the (optional) GPS coordinates where w should be executed.
Dimensions y and l may be undefined in case work item w is not yet offered or nospecific execution location exists respectively. The e value concerns timers whichmay be defined in YAWL processes. A process region may be associated with atimer. When the timer expires, the work items part of the region are cancelled.Note that a work item can potentially be a part of more than one cancellationregion. In these cases, e is assumed as the latest possible completion time withrespect to every cancellation region the work item is part of.
Definition 2 (Resource). A resource r is a pair (j, l), where:
– j is the identifier of the resource.– l represents the (optional) GPS coordinates where the resource is currently
located.
The notation wx is used to denote the projection on dimension x of work item w,while the notation ry is used to denote the projection on dimension y of resource
r. For example, wt yields the task of which work item w is an instance. Workitems w′ and w′′ are considered to be siblings iff w′t = w′′t . The set Coordinatesconsists of all possible coordinates. Elements of this set will be used to identifyvarious positions on a given map.
Definition 3 (Position function). Let W and R be the set of work items andresources. Let M be the set of available maps. For each available map m ∈ M ,there exists a function positionm : W ∪ R 6→ Coordinates which returns thecurrent coordinates for work items and available resources on map m.
For a map m ∈ M , the function positionm may be partial, since some elementsof W and/or R may not have an associated position. Consider for example thecase where a work item can be performed at any geographical location or whereit does not really make sense to associate a resource with a position on a certainmap. As the various attributes of work items and resources may vary over timeit is important to see the class of functions positionm as time dependent.
To formalise the notion of distance metric, a distance function is definedfor each metric that yields the distance between a work item and a resourceaccording to that metric.
Definition 4 (Distance function). Let W and R be the set of work items andresources. Let D be the set of available distance metrics. For each distance metricd ∈ D, there exists a function distanced : W ×R → [0, 1] that returns a numberin the range [0,1] capturing the distance between work-item w ∈ W and resourcer ∈ R with respect to metric d.10
Given a certain metric d and a resource r, the next work item r should performis a work item w for which the value distanced(w, r) is the closest to 1 amongall offered work items.
3.2 Available Metrics
In Table 2 a number of general-purpose distance metrics are informally explained.These are all provided with the current implementation. Due to the limited space,we will provide more details for only one of these distance metrics. The metricchosen combines the familiarity of a resource with a certain work item and thefamiliarity of other resources that are able to execute that work item. In orderto formalise this notion, two auxiliary functions are introduced.
past execution(w,r) yields the weighted mean of the past execution times ofthe last h-th work items performed by r among all work item siblings ofw. In this context, the past execution time of work item w′ is defined asthe duration that elapsed between its assignment to r and its successfulcompletion. Let timei(w, r) be the execution time of the i-th last work item
10 Please note the value 1 represents the minimum distance while 0 is the maximum.
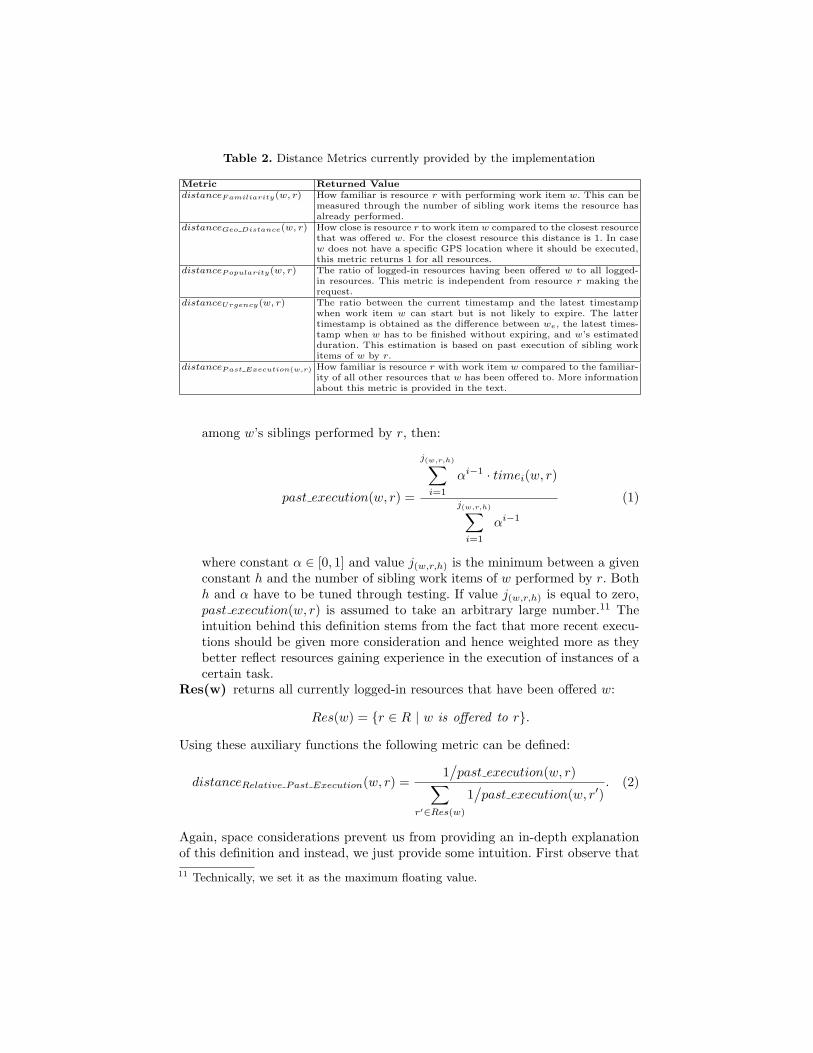
Table 2. Distance Metrics currently provided by the implementation
Metric Returned ValuedistanceF amiliarity(w, r) How familiar is resource r with performing work item w. This can be
measured through the number of sibling work items the resource hasalready performed.
distanceGeo Distance(w, r) How close is resource r to work item w compared to the closest resourcethat was offered w. For the closest resource this distance is 1. In casew does not have a specific GPS location where it should be executed,this metric returns 1 for all resources.
distanceP opularity(w, r) The ratio of logged-in resources having been offered w to all logged-in resources. This metric is independent from resource r making therequest.
distanceUrgency(w, r) The ratio between the current timestamp and the latest timestampwhen work item w can start but is not likely to expire. The lattertimestamp is obtained as the difference between we, the latest times-tamp when w has to be finished without expiring, and w’s estimatedduration. This estimation is based on past execution of sibling workitems of w by r.
distanceP ast Execution(w,r) How familiar is resource r with work item w compared to the familiar-ity of all other resources that w has been offered to. More informationabout this metric is provided in the text.
among w’s siblings performed by r, then:
past execution(w, r) =
j(w,r,h)∑
i=1
αi−1 · timei(w, r)
j(w,r,h)∑
i=1
αi−1
(1)
where constant α ∈ [0, 1] and value j(w,r,h) is the minimum between a givenconstant h and the number of sibling work items of w performed by r. Bothh and α have to be tuned through testing. If value j(w,r,h) is equal to zero,past execution(w, r) is assumed to take an arbitrary large number.11 Theintuition behind this definition stems from the fact that more recent execu-tions should be given more consideration and hence weighted more as theybetter reflect resources gaining experience in the execution of instances of acertain task.
Res(w) returns all currently logged-in resources that have been offered w:
Res(w) = {r ∈ R | w is offered to r}.Using these auxiliary functions the following metric can be defined:
distanceRelative Past Execution(w, r) =1/past execution(w, r)∑
r′∈Res(w)
1/past execution(w, r′)
. (2)
Again, space considerations prevent us from providing an in-depth explanationof this definition and instead, we just provide some intuition. First observe that11 Technically, we set it as the maximum floating value.

if exactly one resource r exists capable of performing work item w, then theequation yields one. If n resources are available and they roughly have the samefamiliarity with performing work item w, then for each of them the distancewill be about 1/n. It is clear then that as n increases in value, the value of thedistance metric approaches zero. If on the other hand many resources exist thatare significantly more effective in performing w than a certain resource r, thenthe value of the denominator increases even more and the value of the metricfor w and r will be closer to zero.
4 Implementation
The general framework described in the previous section has been operationalisedthrough the development of a component that can be plugged into the YAWLsystem. The YAWL environment is an open source PAIS, based on the workflowpatterns12, using a service-oriented architecture. The YAWL engine and all otherservices (work list handler, web-service broker, exception handler, etc.) commu-nicate through XML messages. The YAWL work list handler was developed asa web application. In its graphical interface different tabs are used to show thevarious queues (e.g. offered work items). The visualisation framework can beaccessed through a newly introduced tab and is implemented as a Java Applet.
Section 4.1 illustrates some of the visualisation features provided by the im-plementation, whereas Section 4.2 focusses on how the component fits withinthe YAWL architecture.
4.1 The User Interface
The position and distance functions represent orthogonal concepts that requirejoint visualisation for every map. The position function for a map determineswhere work items and resources will be placed as dots, while the distance functionwill determine the colour of work items. Conceptually, work item informationand resource information is split and represented in different layers. Users canchoose which layers they wish to see and in case they choose both layers whichof them should overlay the other.Work-item Layer. Distances can be mapped to colours for work items througha function colour : [0, 1] → C which associates every metric value with a differentcolour in the set C. In our implementation colours range from white to red, withintermediate shades of yellow and orange. When a resource sees a red work itemthis could for example indicate that the item is very urgent, that it is one ofthose most familiar to this resource, or that it is the closest work item in termsof its geographical position. While the colour of a work item can depend on theresource viewing it, it can also depend on which state of the lifecycle it is in.Special colours are used to represent the various states of the work item lifecycleand Table 3 provides an overview. The various rows correspond to the variousstates and their visualisation. Resources can filter work items depending on the12 www.workflowpatterns.com

Table 3. Visualisation of a work item depending on its state in the life cycle.
Work item state Colour scheme used in the work-list handlerCreated Work item is not shown.
Offered to single/multiple resource(s) The colour is determined by the distance to theresource with respect to the chosen metric. Thecolour ranges from white through various shadesof yellow and orange to red.
Allocated to a single resource Purple.Started Black.
Suspended The same as for offered.Failed Grey.
Completed Work item is not shown.
state of items. This is achieved through the provision of a checkbox for each ofthe states of Table 3. Several checkboxes can be ticked. There is an additionalcheckbox which allows resources to see work items that they cannot execute, butthey are authorised to see.
Resources may be offered work items whose positions are the same or veryclose. In such cases their visualisations may overlap and they are grouped into aso-called “joint dot”. The diameter of a joint dot is proportional to the number ofwork items involved. More precisely, the diameter D of a joint dot is determinedby D = d(1 + lg n), where d is the standard diameter of a normal dot and n isthe number of work items involved. Note that we use a logarithmic (lg) scalingfor the relative size of a composite dot.
Combining several work items int a single dot raises the question of howthe distance of this dot is determined. Four options are offered for defining thedistance of a joint dot, one can take a) the maximum of all the distances of thework items involved, b) their minimum, c) their median, or d) their mean. Whena resource clicks on a joint dot, all work items involved are enumerated in a listand they are coloured according to their value in terms of the distance metricchosen.Resource Layer. When a resource clicks on a work item the positions of theother resources to whom this work item is offered are shown. Naturally this isgoverned by authorisation privileges and by the availability of location informa-tion for resources for the map involved.
Resource visualisation can be customised so that a resource can choose tosee a) only herself, b) all resources, or c) all resources that can perform a certainwork item. The latter option supports the case where a resource clicks on a workitem and wishes to see the locations of the other resources that can do this workitem.
4.2 Architectural Considerations
Figure 1 shows the overall architecture of the visualisation framework and theconnections with other YAWL components. Specifically, the visualisation frame-work comprises:
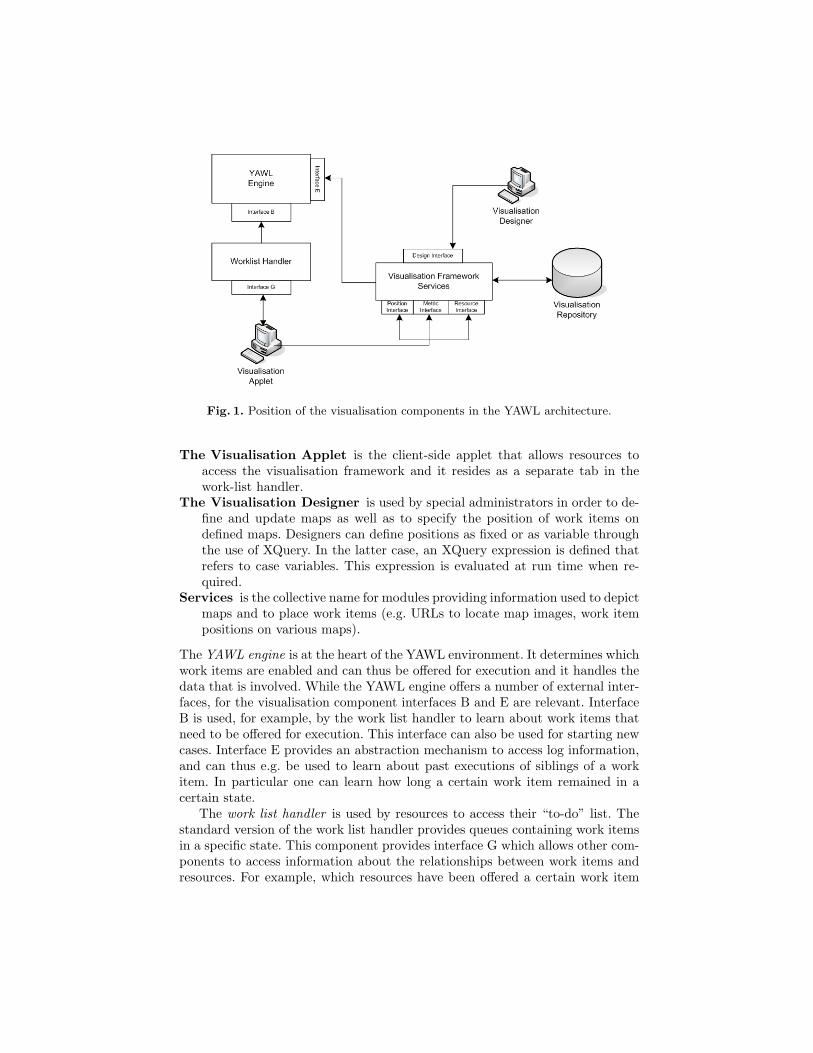
Fig. 1. Position of the visualisation components in the YAWL architecture.
The Visualisation Applet is the client-side applet that allows resources toaccess the visualisation framework and it resides as a separate tab in thework-list handler.
The Visualisation Designer is used by special administrators in order to de-fine and update maps as well as to specify the position of work items ondefined maps. Designers can define positions as fixed or as variable throughthe use of XQuery. In the latter case, an XQuery expression is defined thatrefers to case variables. This expression is evaluated at run time when re-quired.
Services is the collective name for modules providing information used to depictmaps and to place work items (e.g. URLs to locate map images, work itempositions on various maps).
The YAWL engine is at the heart of the YAWL environment. It determines whichwork items are enabled and can thus be offered for execution and it handles thedata that is involved. While the YAWL engine offers a number of external inter-faces, for the visualisation component interfaces B and E are relevant. InterfaceB is used, for example, by the work list handler to learn about work items thatneed to be offered for execution. This interface can also be used for starting newcases. Interface E provides an abstraction mechanism to access log information,and can thus e.g. be used to learn about past executions of siblings of a workitem. In particular one can learn how long a certain work item remained in acertain state.
The work list handler is used by resources to access their “to-do” list. Thestandard version of the work list handler provides queues containing work itemsin a specific state. This component provides interface G which allows other com-ponents to access information about the relationships between work items andresources. For example, which resources have been offered a certain work item
or which work items are in a certain state. Naturally this component is vital tothe Visualisation Applet.
In addition to interface G, the Visualisation Applet also connects to theServices modules through the following interfaces:
The Position Interface provides information about maps and the positioningof work items on these maps. Specifically, it returns an XQuery over theYAWL net variables that the Visualisation Applet has to compute. Thework list handler needs to be consulted to retrieve the current values ofthese variables.
The Metric Interface provides information about available metrics and theirvalues for specific work item - resource combinations.
The Resource Interface is used to update and retrieve information concern-ing positions of active resources on maps.
The visualisation framework was integrated into the standard work list handlerof YAWL through the addition of a JSP (Java Server Page).
All of the services of the visualisation framework share a repository, referredto as Visualisation Repository in Figure 1, which stores, among others, XQueriesto compute positioning information, resource locations in various maps, andnames and URLs of maps. Services periodically retrieve log data through Inter-face E in order to compute distance metric values for offered work items. Forinstance, to compute the metric Relative Past Execution (Equation 2) for a cer-tain resource, one can see from Equation 1 that information is required aboutthe h past executions of sibling work items performed by that resource.
To conclude this section, we would like to stress that the approach and imple-mentation are highly generic, i.e., it is relatively easy to embed the visualisationframework in another PAIS.
5 Example: Emergency Management
In this section we are going to illustrate a number of features of the visualisationframework by considering a potential scenario from emergency management.This scenario stems from a user requirement analysis conducted in the context ofa European-funded project [2]. Teams are sent to an area to make an assessmentof the aftermath of an earthquake. Team members are equipped with a laptopand their work is coordinated through the use of a PAIS.
The main process of workflow for assessing buildings is named Disaster Man-agement. The first task Assess the affected area represents a quick on-the-spotinspection to determine damage to buildings, monuments and objects. For eachobject identified as worthy of further examination an instance of the sub-processAssess every sensible object (of which we do not show the actual decompositionfor space reasons) is started as part of which a questionnaire is filled in and pho-tos are taken. This can be an iterative process as an evaluation is conducted todetermine whether the questionnaire requires further refinement or more photosneed to be taken. After these assessments have finished, the task Send data to

the headquarters can start which involves the collection of all questionnaires andphotos and their subsequent dispatch to headquarters. This information is usedto determine whether these objects are in imminent danger of collapsing and ifso, whether this can be prevented and how that can be achieved. Depending onthis outcome a decision is made to destroy the object or to try and restore it.
For the purposes of illustrating our framework we assume that an earthquakehas occurred in the city of Brisbane. Hence a number of cases are started byinstantiating the Disaster Management workflow described above.
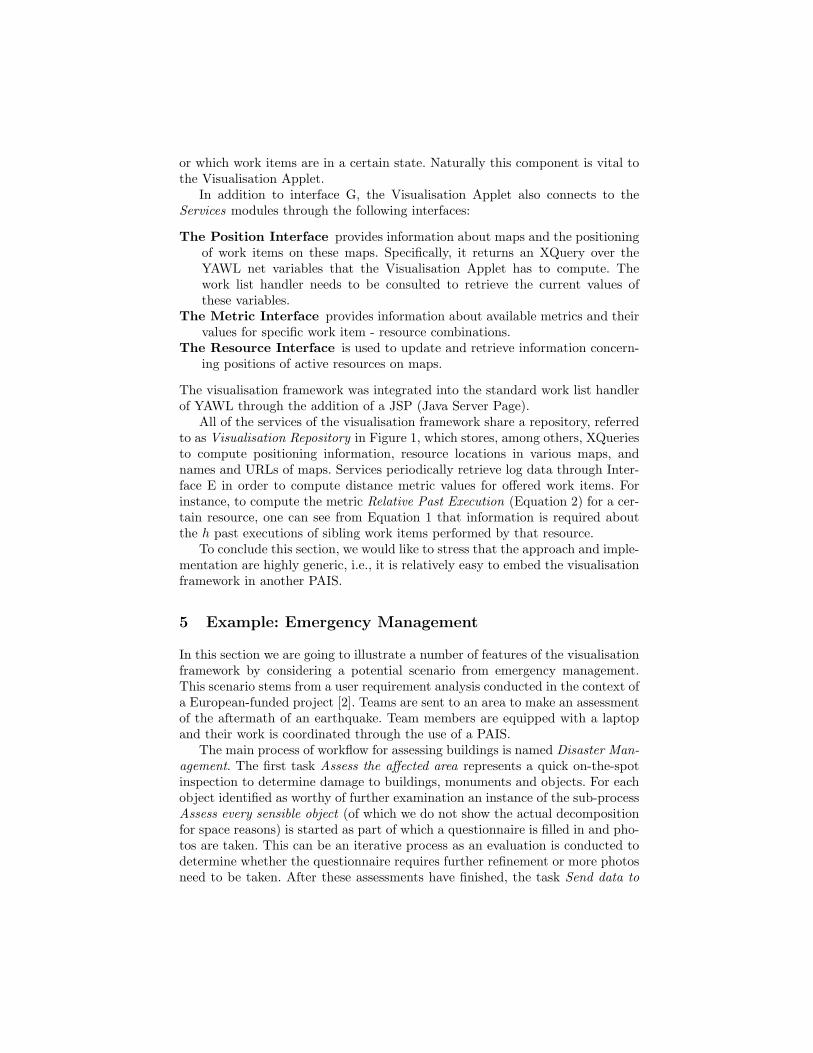
Each case deals with the activities of an inspection teams in a specific zone.Figure 2 shows three maps. In each map, the dots refer to work items. Figure 2(a)shows the main process of the Disaster Management workflow, including eightwork items. Dots for work items which are instances of tasks Assess the affectedarea and Send data to the headquarter are placed on top of these tasks in thisfigure. Figure 2(b) shows the decomposition of the Assess every sensible objectsub-net. Here also eight work items are shown. No resources are shown in thesediagrams. Note that on the left-hand side is shown a list of work items thatare not on the map. For example, the eight work items shown in the map inFigure 2(a) appear in the list of “other work items” in Figure 2(b).
Figure 2(a) uses the urgency distance metric to highlight urgent cases whileFigure 2(b) uses the familiarity metric to highlight cases closer to the user interms of earlier experiences.
As another illustration consider Figure 2(c) where work items are positionedaccording to their deadlines. This can be an important view in the context ofdisaster management where saving minutes may save lives. In the map shown,the x-axis represents the time remaining before a work item expires, while they-axis represents the case number of the case the work item belongs to. A workitem is placed at location (100 + 2 ∗ x, 10 + 4 ∗ y) on that map, if x minutesare remaining to the deadline of the work item and its case number is y. In thisexample, work items are coloured in accordance with the popularity distancemetric.
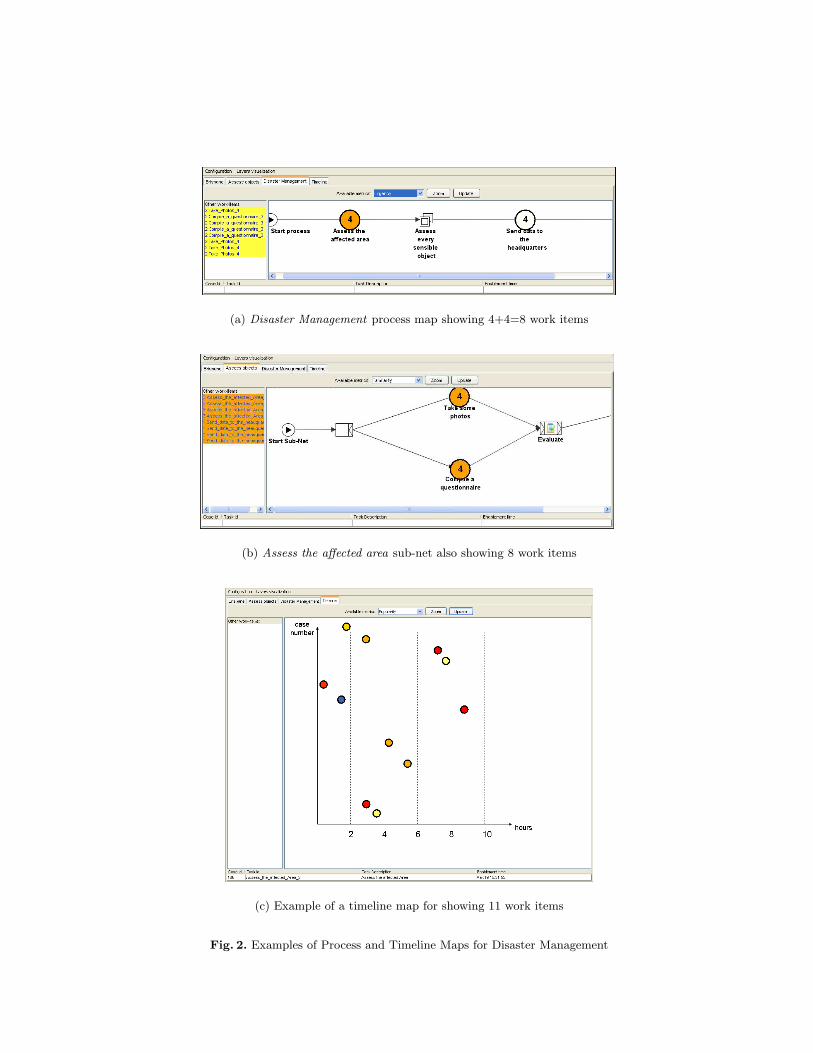
Figures 3 and 4 show some screenshots of a geographical map of the cityof Brisbane. Note that geographic maps are plain JPG images and have beenobtained by capturing some screen shots from Google Maps. On these maps,work items are placed at the location where they should be executed. If theirlocations are so close that their corresponding dots overlap, a larger dot (i.e., ajoint-dot) is used to represent the work items involved and the number insidecorresponds to the number of these items. The green triangle is a representationof the resource whose work list is visualised here. Work items for tasks Assessthe affected area and Send data to the headquarters are not shown on the map asthey can be performed anywhere. In this example, dots are coloured accordingto the familiarity distance metric. A dot that is selected as focus obtains a bluecolour and further information about the corresponding work item is shownat the bottom of the screen (as is the case for work item Take Photos 4 inFigure 3(b)).
(a) Disaster Management process map showing 4+4=8 work items
(b) Assess the affected area sub-net also showing 8 work items
(c) Example of a timeline map for showing 11 work items
Fig. 2. Examples of Process and Timeline Maps for Disaster Management
(a) Map showing the geographic locations of work items and resources:the triangle represents the resource and most work items are shown assingle dots except for the two work items that are clustered into a singledot labeled “2”
(b) Information about the selected dot (blue dot) is shown and also otherresources are shown
Fig. 3. Examples of Geographic Maps for Disaster Management.
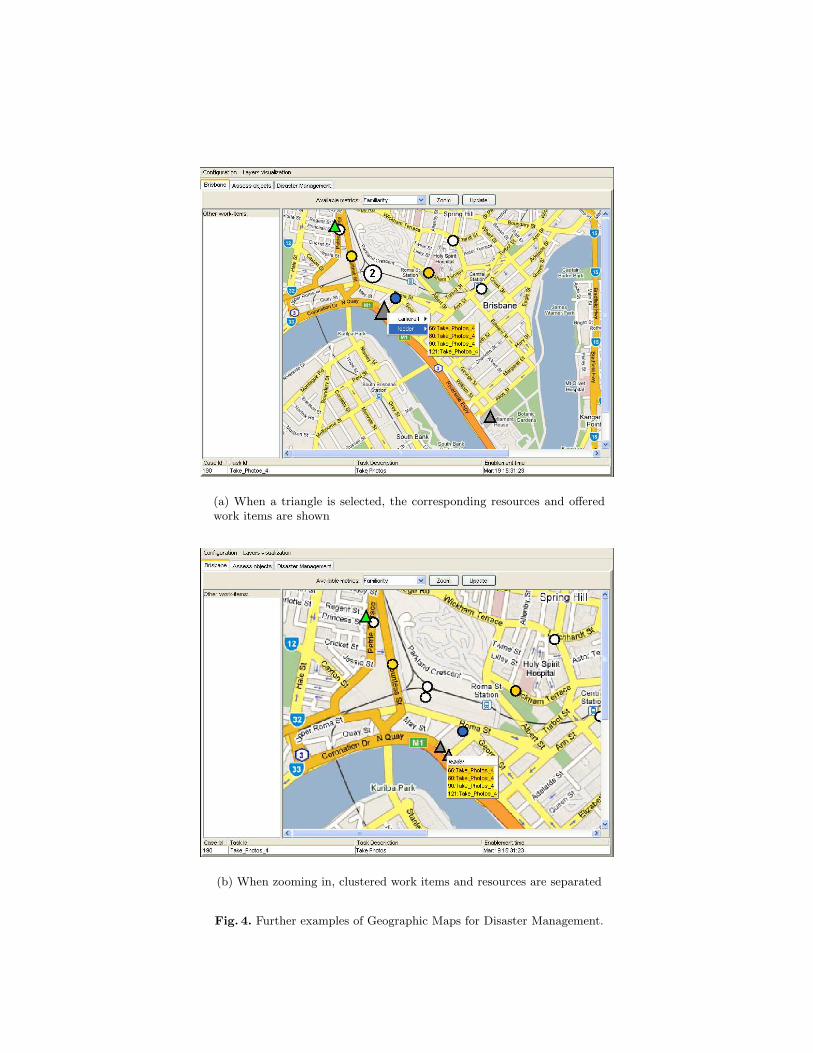
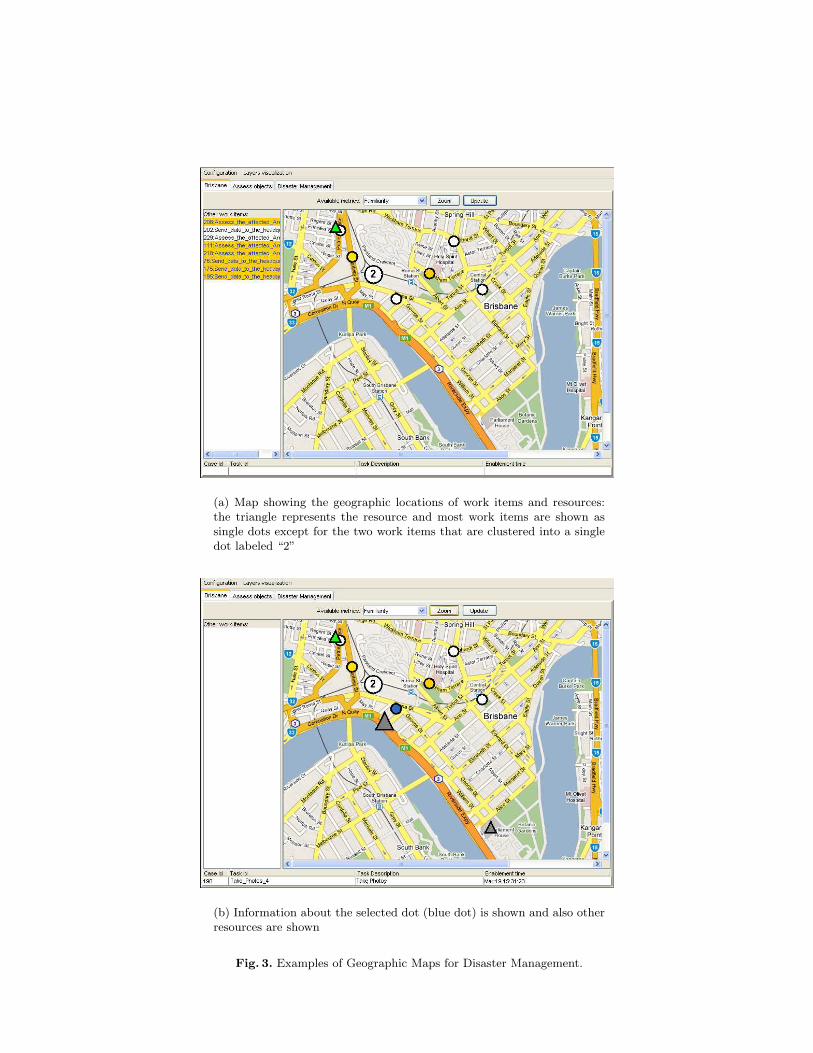
(a) When a triangle is selected, the corresponding resources and offeredwork items are shown
(b) When zooming in, clustered work items and resources are separated
Fig. 4. Further examples of Geographic Maps for Disaster Management.
One can click on a dot and see the positions of other resources that havebeen offered the corresponding work item. For example, by clicking on the dotrepresenting work item Take Photos 4, other resources, represented by triangles,are shown (see Figure 3(b)). As for work items, overlapping triangles representingresources are combined. For examples, the larger triangle shown in Figure 3(b)represents two resources.
Figure 4(a) shows the screen shot after clicking on the joint triangle. A re-source can thus see the list of resources associated with this triangle. By selectingone of the resources shown in the list, the work items offered to that resourcecan be seen. The colour of these work items is determined by their value for thechosen distance metric. A zooming feature is also provided. Figure 4(b) showsthe result of zooming in a bit further on the map of Figure 4(a). As can be seen,no dots nor any triangles are overlapping anymore.
6 Conclusions
In this paper a general visualisation framework is proposed that can aid usersin selecting the “right” work item among a potentially large number of workitems offered to them. The framework uses the “map metaphor” to show thelocations of work items and resources. The “distance metaphor” is used to showwhich work items are “close” (e.g., urgent, similar to earlier work items, or geo-graphically close). Both concepts are orthogonal and this provides a great dealof flexibility when it comes to presenting work to people. For example, one canchoose a geographical map to display work items and resources and use a dis-tance metric capturing urgency. The proposed framework was operationalisedas a component of the YAWL environment. By using well-defined interfaces thecomponent is generic so that in principle it could be exploited by other PAISsas well under the provision that they are sufficiently “open” and provide therequired interface methods. The component is also highly configurable, e.g., itallows resources to choose how distances should be computed for dots represent-ing a number of work items and provides customizable support for determiningwhich resources should be visible. Our operationalisation does not rely on exter-nal services such as Google Maps for map visualisation support. Maps are justimages on which dots representing work items are to be positioned. Hence ourapproach is not restricted to certain types of maps.
Finally, it should be pointed out that the implementation for the Visualisa-tion Designer is still lacking. In the current evaluation, we manually updatedthe information stored in the Visualisation Repository by accessing tables in theDBMS. All other parts are fully operational.
Further research aims at connecting the current framework to geographicalinformation systems and process mining tools like ProM [4]. Geographical infor-mation systems store data based on locations and process mining can be usedto extract data from event logs and visualise this on maps, e.g., it is possible tomake a “movie” showing the evolution of work items based on historic data.
Acknowledgements. The work was primarily conducted during a visit of Mas-similiano de Leoni to the Business Process Management Group at QueenslandUniversity of Technology. His internship has been partly supported by the Eu-ropean Commission through the project FP6-2005-IST-5-034749 WORKPAD.The authors would like to thank Michael Adams for implementing certain re-quired YAWL interfaces and for answering numerous questions. We also grate-fully acknowledge Guy Redding for providing some code to connect to the YAWLinterfaces.
References
1. Dumas, M., van der Aalst, W.M.P., ter Hofstede, A.H.M.: Process-Aware Informa-tion Systems: Bridging People and Software Through Process Technology. Wiley(2005)
2. Catarci, T., de Leoni, M., Marrella, A., Mecella, M., Vetere, G., Salvatore, B.,Dustdar, S., Juszczyk, L., Manzoor, A., Truong, H.L.: Pervasive Software Envi-ronments for Supporting Disaster Responses. IEEE Internet Computing 12 (2008)26–37
3. Hansen, G.: Automated Business Process Reengineering: Using the Power of VisualSimulation Strategies to Improve Performance and Profit. Prentice-Hall, Engle-wood Cliffs (1997)
4. van der Aalst, W.M.P., van Dongen, B., Christian, G., Mans, R.S., Alva deMedeiros, A., Rozinat, A., Rubin, V., Song, M., Verbeek, H.M.W., Weijters,A.J.M.M.: Prom 4.0: Comprehensive support for real process analysis. In: Pro-ceedings of the 28th International Conference on Applications and Theory of PetriNets and Other Models of Concurrency ICATPN 2007. Volume 4546 of LNCS.,Springer (2007) 484–494
5. Bobrik, R., Reichert, M., Bauer, T.: View-based process visualization. In: Proceed-ings of the 5th International Conference on Business Process Management BPM2007. Volume 4714 of LNCS., Springer (2007) 88–95
6. Luttighuis, P., Lankhorst, M., Wetering, R., Bal, R., Berg, H.: Visualising businessprocesses. Computer Languages 27 (2001) 39–59
7. Streit, A., Pham, B., Brown, R.: Visualization support for managing large businessprocess specifications. In: Proceedings of the 3rd International Conference onBusiness Process Management BPM 2005. Volume 3649 of LNCS., Springer (2005)205–219
8. Wright, W.: Business Visualization Adds Value. IEEE Computer Graphics andApplications 18 (1998) 39
9. Brown, R., Paik, H.Y.: Resource-centric worklist visualisation. In: Proceedings ofOTM Confederated International Conferences, CoopIS, DOA, and ODBASE 2005.Volume 3760 of LNCS., Springer (2005) 94–111
10. Kumar, A., van der Aalst, W.M.P., Verbeek, H.: Dynamic Work Distributionin Workflow Management Systems: How to Balance Quality and Performance?Journal of Management Information Systems 18 (2002) 157–193
11. Russell, N., van der Aalst, W.M.P., ter Hofstede, A.H.M., Edmond, D.: Workflowresource patterns: Identification, representation and tool support. In: Proceedingsof 17th International Conference CAiSE 2005. Volume 3520 of LNCS., Springer(2005) 216–232