Embed Size (px)
Citation preview
Visual Means for Collaboration Across Disciplines Mercè Graell-Colas1,2 1 The Ohio State University, USA
2 Visualteamwork, USA and Spain, [email protected]
Abstract The complexity of today’s design problems—the global economy, rate of change in new technologies, the challenges of sustainability development—requires diverse design teams, comprised of multiple disciplines as well as multiple cultures, to look at broader and different perspectives and larger scopes of investigation. Due to the multilayered and multifaceted interactions between team members, effective communication and collaboration among people in multidisciplinary design teams becomes critical to ensure a project’s success, in particular, and for innovation, in general. Research shows that one of the most important aspects of collaboration is effective information sharing—shared knowledge and shared understanding among all team members (Citera, et. al., 1995). Design teams traditionally share information verbally as well as visually through representations such as drawings and sketches, three-dimensional models, project walls, or conceptual maps. Consequently, an important aspect of communication is the role that visual thinking and visual communication practices play in the success of the design team. The exploration and finding of a current frame of reference for creating and utilizing visual tools for communication, capable of serving as a common means of expression for multidisciplinary teams, is the purpose of this research paper. To that end, individual field focused interviews were performed with distinct groups of stakeholders from the business, design and engineering professions. The interview included visual participatory research methods that prompted visual responses and reflected the interviewee’s own use of visual methods for communication. In every case, visual means proved to be valuable thinking and communication assets. Two specific dimensions of communication that allowed team members to define, generate, and communicate innovation opportunities—storytelling and representation—were identified. The research findings and interpretations also generated conclusions and future opportunities for the design manager, for the instructors of design, and for the design, engineering and business professionals.
Keywords
Collective innovation; multidisciplinary collaboration; visual thinking; design management; design thinking
Design problems are unstructured and ill-defined by nature, and, in today’s dynamic and changing world, most of them are also “wicked problems.” Reed (2002) defined an ill-defined problem as one that addresses complex issues and thus cannot easily be described in a concise, complete manner. Wicked problems in design include issues such as sustainability challenges in products with differing regulations as they are assembled and manufactured in different countries, optimizing the features of an existing
car to a new model, a new banking business model, or the visual labeling of universal health-related drugs. The task of designing the outcome at the same time as the context is embedded in wicked design problems. “We have also come to realize that no problem ever exists in complete isolation. Every problem interacts with other problems and is therefore part of a set of interrelated problems…” explained Ackoff (1974, p. 21). Because of this interconnectedness of problems, the design problem-solving process has to be a multidisciplinary endeavor—functional disciplines working in close collaboration across functions, instead of looking in narrow silos like ergonomics, finance, human factors, product design, or marketing, to name a few. (Martin, 2006; Olson et. al., 2001). However, discipline and cultural differences between design team members can create high levels of skepticism that may even extend to the desirability or utility of pursuing collaboration among them (Horn and Weber, 2007). Design problems are hard to solve because, basically, they are inherently complex and this complexity increases the difficulty in understanding them and finding reasonable ways to resolve them. Research shows that for team members to reach a shared understanding of problems and a successful agreement to potential solutions, critical thinking is needed along with innovative problem-solving methods across disciplines (e.g. Citera, et.al. 1995; Diestler, 2004; Feldman, 2002; Sternberg, 1998). In the words of Horn and Weber (2007), to get to the root of ill-defined problems, collaborative reasoning and resolution are needed.
For multidisciplinary teams to collaborate and to obtain insight collectively and successfully, they need to process and develop a shared understanding of all the relevant information involved in the design project (user, concept, context, constraints, team member perspectives, etc..). “All [this] information must be processed by the team so that all team members have a shared understanding… Whether it is a case of dealing with inter- or intra-team communication, visualizing early and often is essential to develop that shared understanding,” described Cagan and Vogel (2002, p.207). Visualizing ideas and displaying them in a clear way that everybody can see, or visualizing concepts in two and three dimensions, are some ways to develop that shared understanding. Typically, design team members communicate face-to-face through verbal explanations but also through the use of visual and physical representations or, in recent studies, a full integration of words, images, and shapes into a single, unified communication unit, which Robert Horn defined as Visual Language (Horn, 1999). This is especially important during the initial stages of the design process. Currently, the starting point of the design process for many design disciplines in the professional practice is the making of the design brief. The design brief is, basically, an early definition of the design problem and the possible descriptions of the strategy to solve it. The design brief corresponds to what some authors have defined as the “fuzzy front end” (e.g. Koen et. al., 2002; Sanders and Stappers, 2008) and others as the formulation phase (e.g. Buijs, 2003; Gill and Lilly, 2008). According to Koen et. al. (2002), the innovation process may be divided into three areas: the fuzzy front end (FFE), the new product development (NPD) process, and commercialization. Koen et. al. described the FFE as “experimental, ambiguous, and often chaotic, with a great deal of uncertainty. In contrast, an efficient NPD part of the innovation process is disciplined and goal-oriented, following a clearly defined process” (2002, p.13). They indicated that is at the FFE of the process where the greatest opportunities for innovation may emerge.
In sum, the need to develop tools and methods that enable clear, effective communication among team members has become essential for the understanding and resolution of complex design problems. The exploration and finding of a current frame of
reference for creating and utilizing visual means for communication and collaboration, capable of serving as a common means of expression for multidisciplinary teams, is the purpose of this research paper. This study will mainly use visual means as a general term to describe the visual products of all the possible interactions between design team members working together in a design project.
Methods and Analysis Overview This paper is a qualitative research study looking at the communication flow and the visual means of communication and idea generation utilized during eighteen different design situations or scenarios by multidisciplinary design teams. This study defined communication flow as the different communication activities and interactions that design team members go through during the process from design problem setting to initial problem-solving proposal.
The intention in this work is to research how multidisciplinary design teams comprised of design, engineering and/or business professionals use visual means for communication and collaboration, identify which ones are used, and when they are used in the process. A pilot-questionnaire was created to identify the scope of the problem, and, from its results, focused one-on-one interviews were developed with open-ended questions and participatory design research methods. The focused interview techniques were chosen because they are helpful in finding out in-depth information about a specific situation—important considerations, consequences and feelings (Zeisel, 2006; Merton, et. al., 1956). The participatory design methods were chosen because their intuitive use of images has the potential to trigger emotions and to understand a specific situation that can aid verbal descriptions (Sanders, 2005). The focused interviews were conducted on 18 design project scenarios from different design, engineering and business professional practices that were representatives of the consumer and service industry, and governmental agencies. The location of the interviewees was in the Columbus and Dayton, Ohio areas.
The data collected were analyzed through abstracted diagrams (visual perspectives) in order to look for patterns and relationships. Three general communication activities among stakeholders emerged to be common to all 18 design project scenarios. Visual means for communication and collaboration utilized by discipline and communication activity were also identified, which resulted in two dimensions of communication as focus areas for this study: storytelling and representation.
Finally, the research findings and interpretations were used to build a current frame of reference for using and generating visual means for effective sharing of information within multidisciplinary teams. The research findings and interpretations also generated conclusions and future opportunities for the design manager, for the instructors of design, and for the design, engineering and business professionals.
Interviews: responses and analysis The interviewees were eighteen professionals: general managers, marketing managers and creative directors with backgrounds in industrial design, interior design, graphic design, marketing strategy, public relations and communications, mechanical
engineering and industrial engineering. The 18 interviewees were asked to describe the different communication activities and interactions that design team members went through during the initial stages of a relevant design project of their choice that included design, engineering and/or business professionals. The interview combined brief questions concerning the interviewee’s discipline, area of specialization, and number of team members by discipline together with open-ended questions, such as reflections on working with other disciplines or how they personally learn about a problem. Primarily, interviewees were asked to explain the communication process from the very first moment they were assigned to work on a design problem until the moment when the design team was ready to provide the initial solutions or recommendations to the client.
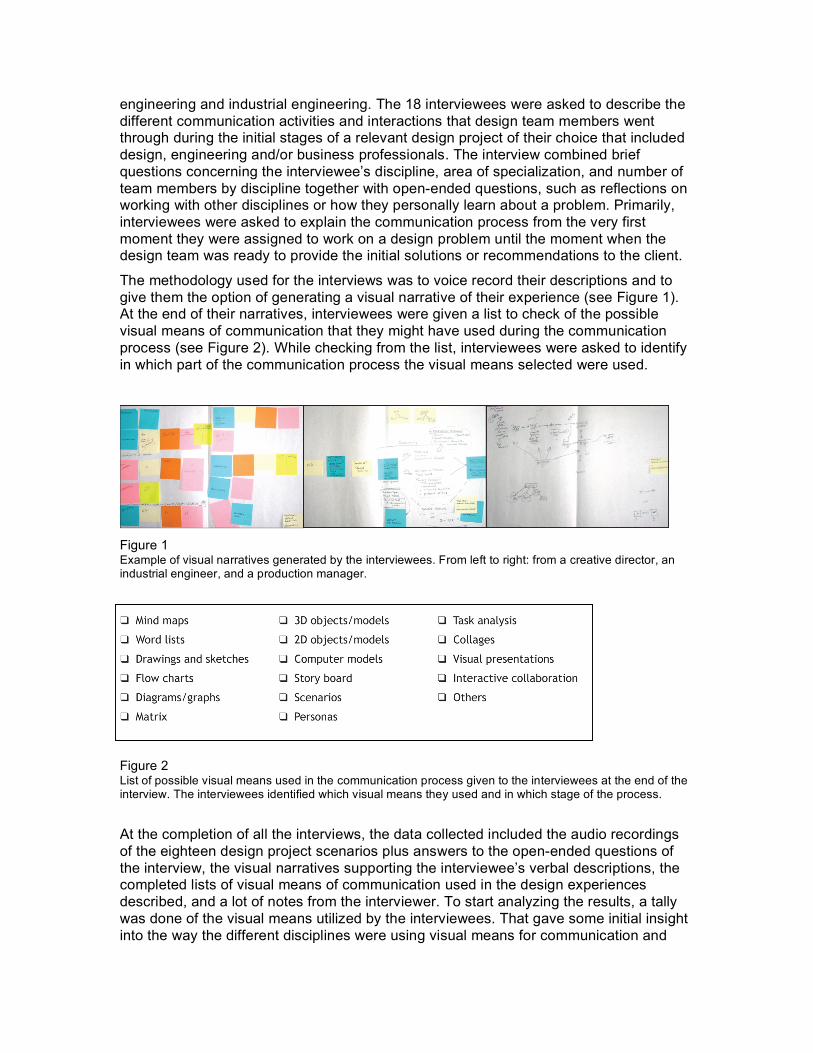
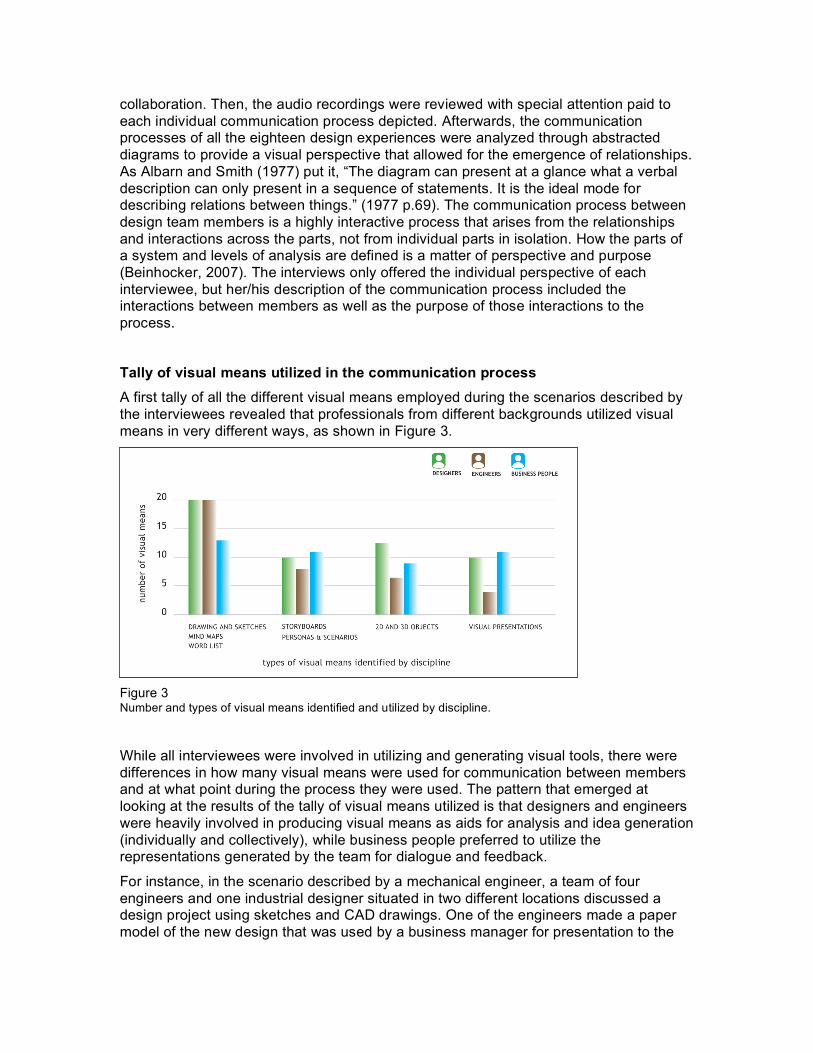
The methodology used for the interviews was to voice record their descriptions and to give them the option of generating a visual narrative of their experience (see Figure 1). At the end of their narratives, interviewees were given a list to check of the possible visual means of communication that they might have used during the communication process (see Figure 2). While checking from the list, interviewees were asked to identify in which part of the communication process the visual means selected were used.
Figure 1 Example of visual narratives generated by the interviewees. From left to right: from a creative director, an industrial engineer, and a production manager.
Figure 2 List of possible visual means used in the communication process given to the interviewees at the end of the interview. The interviewees identified which visual means they used and in which stage of the process.
At the completion of all the interviews, the data collected included the audio recordings of the eighteen design project scenarios plus answers to the open-ended questions of the interview, the visual narratives supporting the interviewee’s verbal descriptions, the completed lists of visual means of communication used in the design experiences described, and a lot of notes from the interviewer. To start analyzing the results, a tally was done of the visual means utilized by the interviewees. That gave some initial insight into the way the different disciplines were using visual means for communication and
collaboration. Then, the audio recordings were reviewed with special attention paid to each individual communication process depicted. Afterwards, the communication processes of all the eighteen design experiences were analyzed through abstracted diagrams to provide a visual perspective that allowed for the emergence of relationships. As Albarn and Smith (1977) put it, “The diagram can present at a glance what a verbal description can only present in a sequence of statements. It is the ideal mode for describing relations between things.” (1977 p.69). The communication process between design team members is a highly interactive process that arises from the relationships and interactions across the parts, not from individual parts in isolation. How the parts of a system and levels of analysis are defined is a matter of perspective and purpose (Beinhocker, 2007). The interviews only offered the individual perspective of each interviewee, but her/his description of the communication process included the interactions between members as well as the purpose of those interactions to the process. Tally of visual means utilized in the communication process
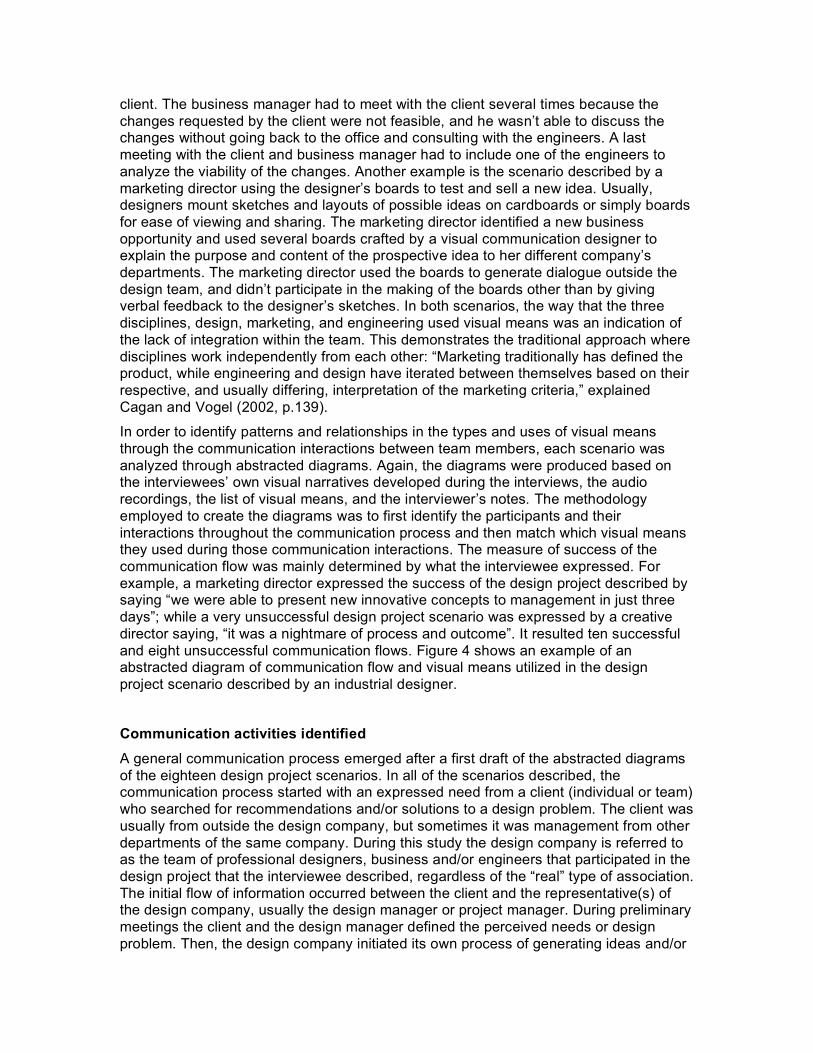
A first tally of all the different visual means employed during the scenarios described by the interviewees revealed that professionals from different backgrounds utilized visual means in very different ways, as shown in Figure 3.
Figure 3 Number and types of visual means identified and utilized by discipline.
While all interviewees were involved in utilizing and generating visual tools, there were differences in how many visual means were used for communication between members and at what point during the process they were used. The pattern that emerged at looking at the results of the tally of visual means utilized is that designers and engineers were heavily involved in producing visual means as aids for analysis and idea generation (individually and collectively), while business people preferred to utilize the representations generated by the team for dialogue and feedback.
For instance, in the scenario described by a mechanical engineer, a team of four engineers and one industrial designer situated in two different locations discussed a design project using sketches and CAD drawings. One of the engineers made a paper model of the new design that was used by a business manager for presentation to the
client. The business manager had to meet with the client several times because the changes requested by the client were not feasible, and he wasn’t able to discuss the changes without going back to the office and consulting with the engineers. A last meeting with the client and business manager had to include one of the engineers to analyze the viability of the changes. Another example is the scenario described by a marketing director using the designer’s boards to test and sell a new idea. Usually, designers mount sketches and layouts of possible ideas on cardboards or simply boards for ease of viewing and sharing. The marketing director identified a new business opportunity and used several boards crafted by a visual communication designer to explain the purpose and content of the prospective idea to her different company’s departments. The marketing director used the boards to generate dialogue outside the design team, and didn’t participate in the making of the boards other than by giving verbal feedback to the designer’s sketches. In both scenarios, the way that the three disciplines, design, marketing, and engineering used visual means was an indication of the lack of integration within the team. This demonstrates the traditional approach where disciplines work independently from each other: “Marketing traditionally has defined the product, while engineering and design have iterated between themselves based on their respective, and usually differing, interpretation of the marketing criteria,” explained Cagan and Vogel (2002, p.139).
In order to identify patterns and relationships in the types and uses of visual means through the communication interactions between team members, each scenario was analyzed through abstracted diagrams. Again, the diagrams were produced based on the interviewees’ own visual narratives developed during the interviews, the audio recordings, the list of visual means, and the interviewer’s notes. The methodology employed to create the diagrams was to first identify the participants and their interactions throughout the communication process and then match which visual means they used during those communication interactions. The measure of success of the communication flow was mainly determined by what the interviewee expressed. For example, a marketing director expressed the success of the design project described by saying “we were able to present new innovative concepts to management in just three days”; while a very unsuccessful design project scenario was expressed by a creative director saying, “it was a nightmare of process and outcome”. It resulted ten successful and eight unsuccessful communication flows. Figure 4 shows an example of an abstracted diagram of communication flow and visual means utilized in the design project scenario described by an industrial designer.
Communication activities identified
A general communication process emerged after a first draft of the abstracted diagrams of the eighteen design project scenarios. In all of the scenarios described, the communication process started with an expressed need from a client (individual or team) who searched for recommendations and/or solutions to a design problem. The client was usually from outside the design company, but sometimes it was management from other departments of the same company. During this study the design company is referred to as the team of professional designers, business and/or engineers that participated in the design project that the interviewee described, regardless of the “real” type of association. The initial flow of information occurred between the client and the representative(s) of the design company, usually the design manager or project manager. During preliminary meetings the client and the design manager defined the perceived needs or design problem. Then, the design company initiated its own process of generating ideas and/or
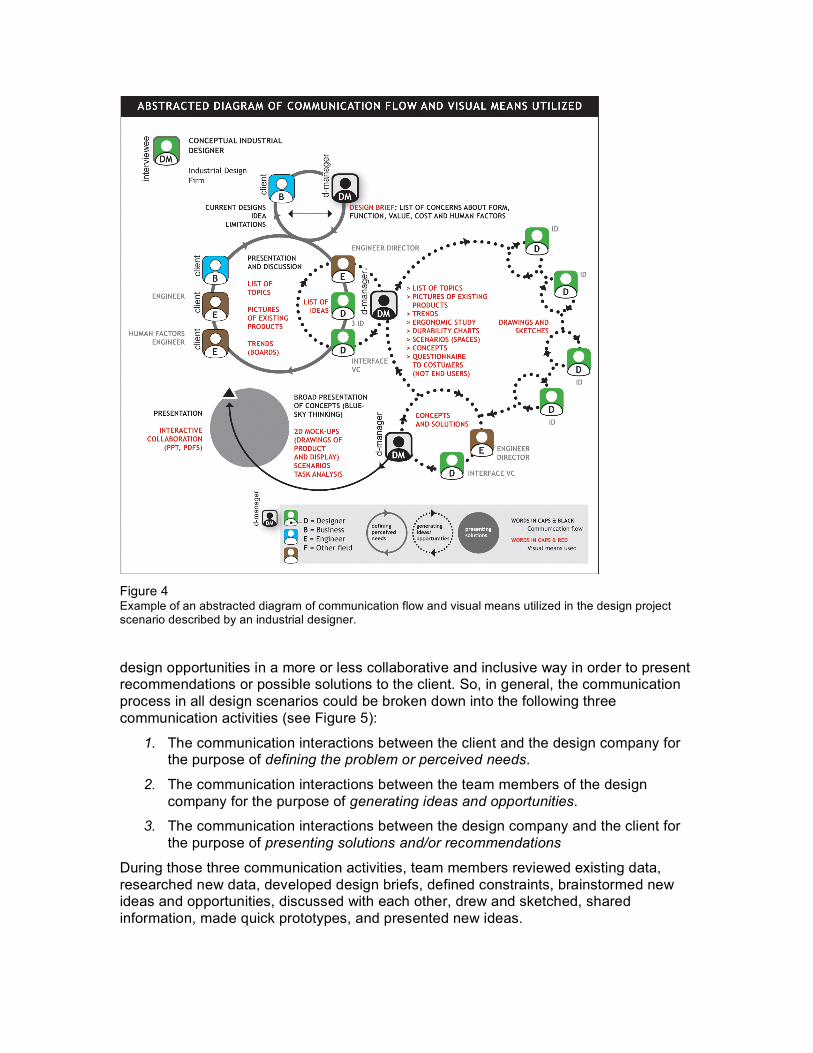
Figure 4 Example of an abstracted diagram of communication flow and visual means utilized in the design project scenario described by an industrial designer.
design opportunities in a more or less collaborative and inclusive way in order to present recommendations or possible solutions to the client. So, in general, the communication process in all design scenarios could be broken down into the following three communication activities (see Figure 5):
1. The communication interactions between the client and the design company for the purpose of defining the problem or perceived needs.
2. The communication interactions between the team members of the design company for the purpose of generating ideas and opportunities.
3. The communication interactions between the design company and the client for the purpose of presenting solutions and/or recommendations
During those three communication activities, team members reviewed existing data, researched new data, developed design briefs, defined constraints, brainstormed new ideas and opportunities, discussed with each other, drew and sketched, shared information, made quick prototypes, and presented new ideas.
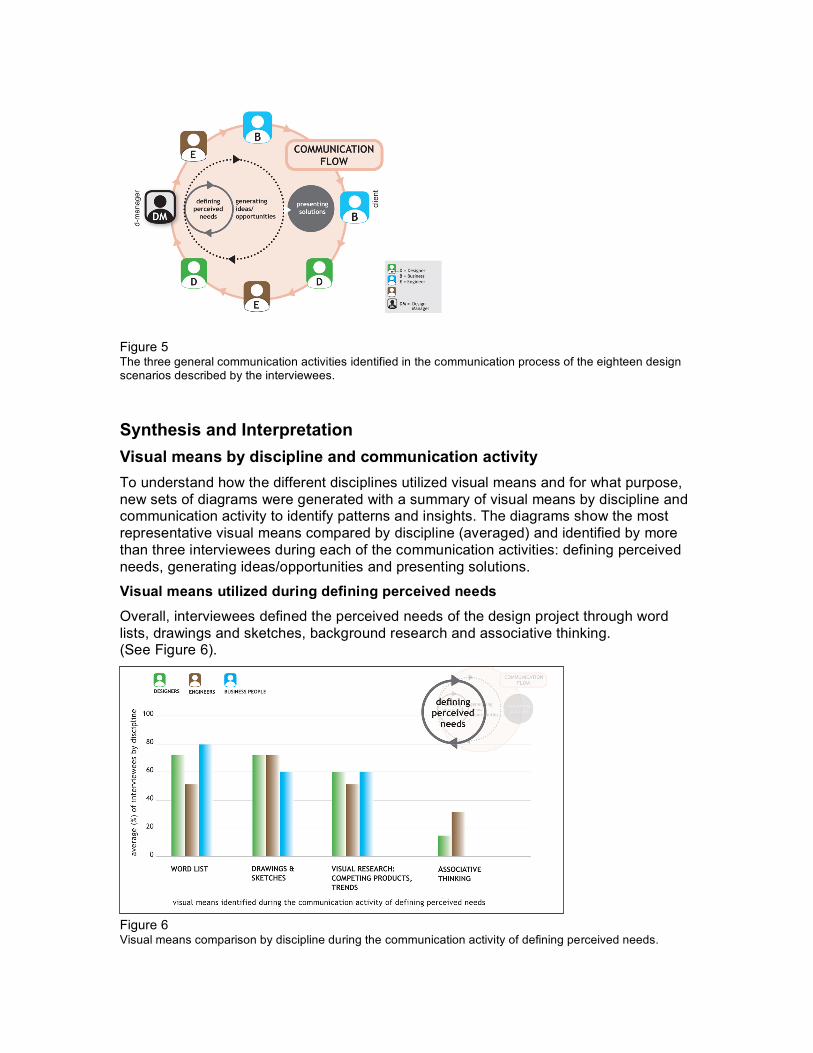
Figure 5 The three general communication activities identified in the communication process of the eighteen design scenarios described by the interviewees.
Synthesis and Interpretation Visual means by discipline and communication activity To understand how the different disciplines utilized visual means and for what purpose, new sets of diagrams were generated with a summary of visual means by discipline and communication activity to identify patterns and insights. The diagrams show the most representative visual means compared by discipline (averaged) and identified by more than three interviewees during each of the communication activities: defining perceived needs, generating ideas/opportunities and presenting solutions.
Visual means utilized during defining perceived needs
Overall, interviewees defined the perceived needs of the design project through word lists, drawings and sketches, background research and associative thinking. (See Figure 6).
Figure 6 Visual means comparison by discipline during the communication activity of defining perceived needs.
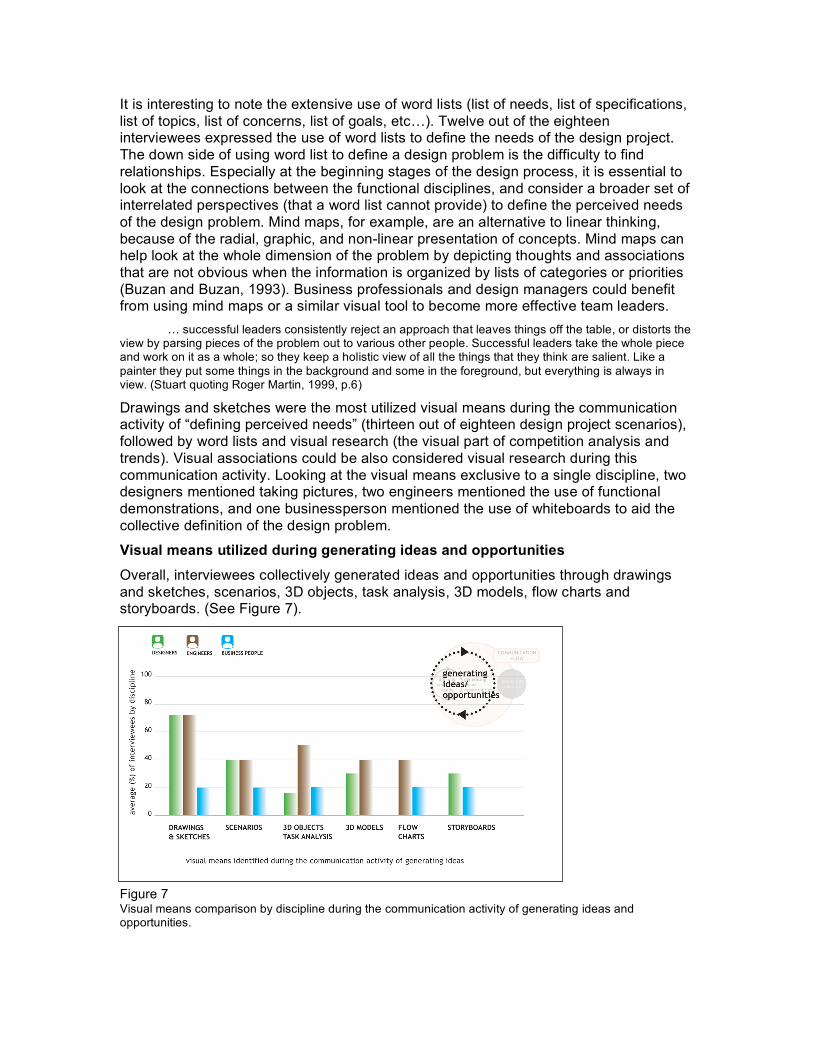
It is interesting to note the extensive use of word lists (list of needs, list of specifications, list of topics, list of concerns, list of goals, etc…). Twelve out of the eighteen interviewees expressed the use of word lists to define the needs of the design project. The down side of using word list to define a design problem is the difficulty to find relationships. Especially at the beginning stages of the design process, it is essential to look at the connections between the functional disciplines, and consider a broader set of interrelated perspectives (that a word list cannot provide) to define the perceived needs of the design problem. Mind maps, for example, are an alternative to linear thinking, because of the radial, graphic, and non-linear presentation of concepts. Mind maps can help look at the whole dimension of the problem by depicting thoughts and associations that are not obvious when the information is organized by lists of categories or priorities (Buzan and Buzan, 1993). Business professionals and design managers could benefit from using mind maps or a similar visual tool to become more effective team leaders. … successful leaders consistently reject an approach that leaves things off the table, or distorts the view by parsing pieces of the problem out to various other people. Successful leaders take the whole piece and work on it as a whole; so they keep a holistic view of all the things that they think are salient. Like a painter they put some things in the background and some in the foreground, but everything is always in view. (Stuart quoting Roger Martin, 1999, p.6)
Drawings and sketches were the most utilized visual means during the communication activity of “defining perceived needs” (thirteen out of eighteen design project scenarios), followed by word lists and visual research (the visual part of competition analysis and trends). Visual associations could be also considered visual research during this communication activity. Looking at the visual means exclusive to a single discipline, two designers mentioned taking pictures, two engineers mentioned the use of functional demonstrations, and one businessperson mentioned the use of whiteboards to aid the collective definition of the design problem.
Visual means utilized during generating ideas and opportunities
Overall, interviewees collectively generated ideas and opportunities through drawings and sketches, scenarios, 3D objects, task analysis, 3D models, flow charts and storyboards. (See Figure 7).
Figure 7 Visual means comparison by discipline during the communication activity of generating ideas and opportunities.
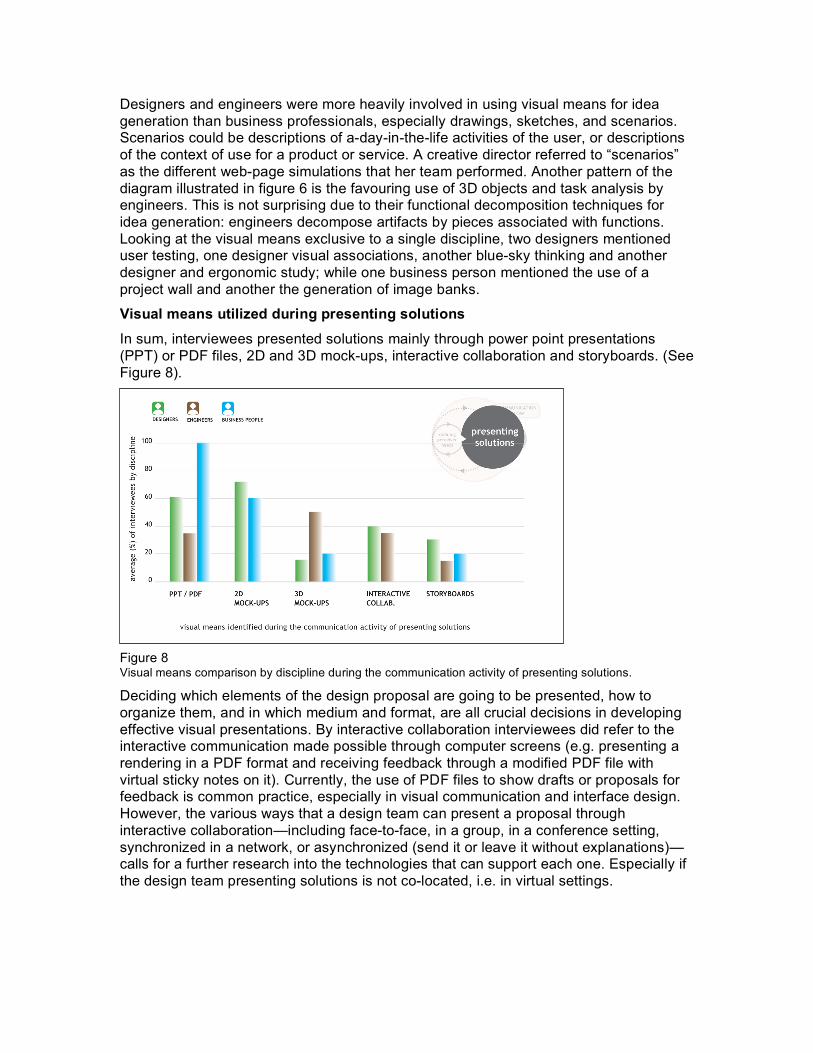
Designers and engineers were more heavily involved in using visual means for idea generation than business professionals, especially drawings, sketches, and scenarios. Scenarios could be descriptions of a-day-in-the-life activities of the user, or descriptions of the context of use for a product or service. A creative director referred to “scenarios” as the different web-page simulations that her team performed. Another pattern of the diagram illustrated in figure 6 is the favouring use of 3D objects and task analysis by engineers. This is not surprising due to their functional decomposition techniques for idea generation: engineers decompose artifacts by pieces associated with functions. Looking at the visual means exclusive to a single discipline, two designers mentioned user testing, one designer visual associations, another blue-sky thinking and another designer and ergonomic study; while one business person mentioned the use of a project wall and another the generation of image banks. Visual means utilized during presenting solutions
In sum, interviewees presented solutions mainly through power point presentations (PPT) or PDF files, 2D and 3D mock-ups, interactive collaboration and storyboards. (See Figure 8).
Figure 8 Visual means comparison by discipline during the communication activity of presenting solutions.
Deciding which elements of the design proposal are going to be presented, how to organize them, and in which medium and format, are all crucial decisions in developing effective visual presentations. By interactive collaboration interviewees did refer to the interactive communication made possible through computer screens (e.g. presenting a rendering in a PDF format and receiving feedback through a modified PDF file with virtual sticky notes on it). Currently, the use of PDF files to show drafts or proposals for feedback is common practice, especially in visual communication and interface design. However, the various ways that a design team can present a proposal through interactive collaboration—including face-to-face, in a group, in a conference setting, synchronized in a network, or asynchronized (send it or leave it without explanations)—calls for a further research into the technologies that can support each one. Especially if the design team presenting solutions is not co-located, i.e. in virtual settings.
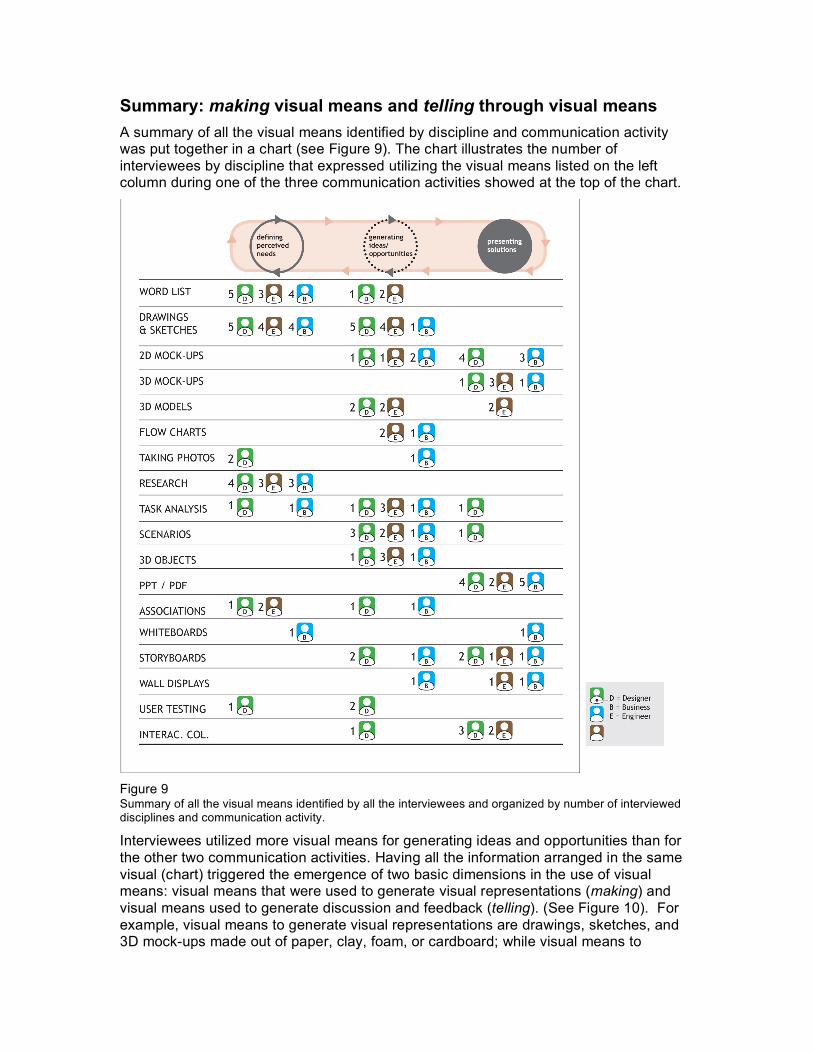
Summary: making visual means and telling through visual means A summary of all the visual means identified by discipline and communication activity was put together in a chart (see Figure 9). The chart illustrates the number of interviewees by discipline that expressed utilizing the visual means listed on the left column during one of the three communication activities showed at the top of the chart.
Figure 9 Summary of all the visual means identified by all the interviewees and organized by number of interviewed disciplines and communication activity.
Interviewees utilized more visual means for generating ideas and opportunities than for the other two communication activities. Having all the information arranged in the same visual (chart) triggered the emergence of two basic dimensions in the use of visual means: visual means that were used to generate visual representations (making) and visual means used to generate discussion and feedback (telling). (See Figure 10). For example, visual means to generate visual representations are drawings, sketches, and 3D mock-ups made out of paper, clay, foam, or cardboard; while visual means to
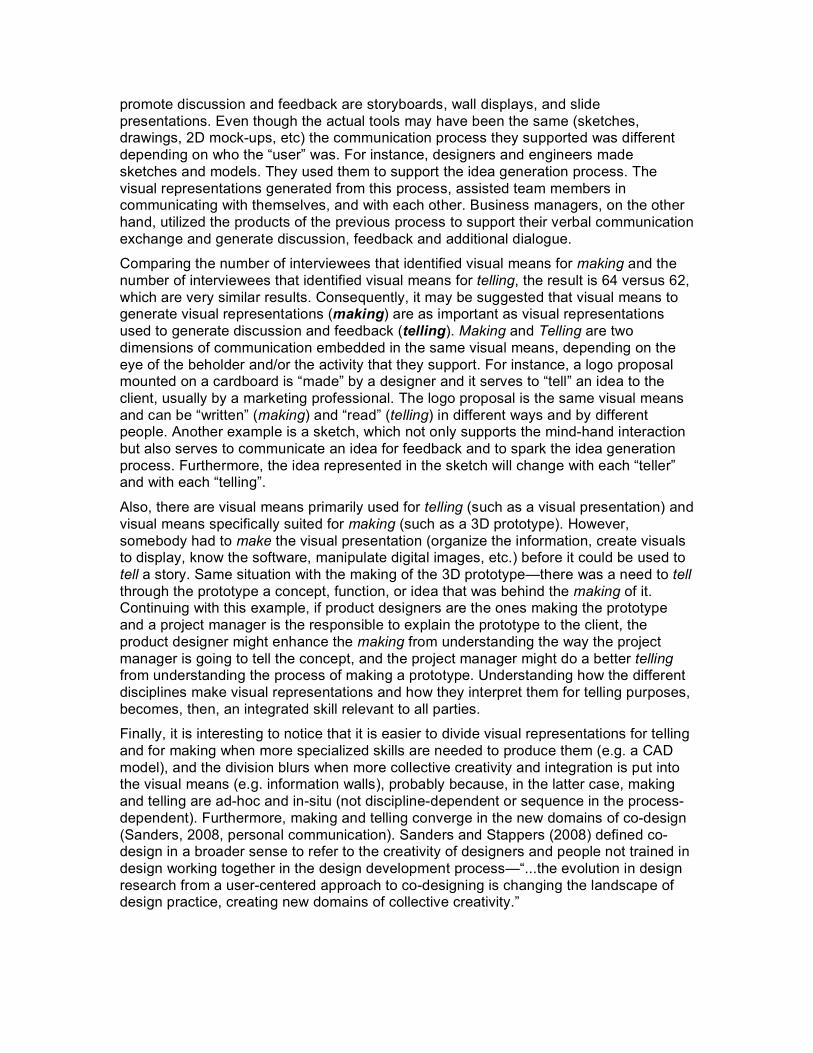
promote discussion and feedback are storyboards, wall displays, and slide presentations. Even though the actual tools may have been the same (sketches, drawings, 2D mock-ups, etc) the communication process they supported was different depending on who the “user” was. For instance, designers and engineers made sketches and models. They used them to support the idea generation process. The visual representations generated from this process, assisted team members in communicating with themselves, and with each other. Business managers, on the other hand, utilized the products of the previous process to support their verbal communication exchange and generate discussion, feedback and additional dialogue.
Comparing the number of interviewees that identified visual means for making and the number of interviewees that identified visual means for telling, the result is 64 versus 62, which are very similar results. Consequently, it may be suggested that visual means to generate visual representations (making) are as important as visual representations used to generate discussion and feedback (telling). Making and Telling are two dimensions of communication embedded in the same visual means, depending on the eye of the beholder and/or the activity that they support. For instance, a logo proposal mounted on a cardboard is “made” by a designer and it serves to “tell” an idea to the client, usually by a marketing professional. The logo proposal is the same visual means and can be “written” (making) and “read” (telling) in different ways and by different people. Another example is a sketch, which not only supports the mind-hand interaction but also serves to communicate an idea for feedback and to spark the idea generation process. Furthermore, the idea represented in the sketch will change with each “teller” and with each “telling”.
Also, there are visual means primarily used for telling (such as a visual presentation) and visual means specifically suited for making (such as a 3D prototype). However, somebody had to make the visual presentation (organize the information, create visuals to display, know the software, manipulate digital images, etc.) before it could be used to tell a story. Same situation with the making of the 3D prototype—there was a need to tell through the prototype a concept, function, or idea that was behind the making of it. Continuing with this example, if product designers are the ones making the prototype and a project manager is the responsible to explain the prototype to the client, the product designer might enhance the making from understanding the way the project manager is going to tell the concept, and the project manager might do a better telling from understanding the process of making a prototype. Understanding how the different disciplines make visual representations and how they interpret them for telling purposes, becomes, then, an integrated skill relevant to all parties.
Finally, it is interesting to notice that it is easier to divide visual representations for telling and for making when more specialized skills are needed to produce them (e.g. a CAD model), and the division blurs when more collective creativity and integration is put into the visual means (e.g. information walls), probably because, in the latter case, making and telling are ad-hoc and in-situ (not discipline-dependent or sequence in the process-dependent). Furthermore, making and telling converge in the new domains of co-design (Sanders, 2008, personal communication). Sanders and Stappers (2008) defined co-design in a broader sense to refer to the creativity of designers and people not trained in design working together in the design development process—“...the evolution in design research from a user-centered approach to co-designing is changing the landscape of design practice, creating new domains of collective creativity.”
Figure 10 Emergence of two dimensions in the use of visual means: visual means that were used to generate visual representations (making) and visual means used to generate discussion and feedback (telling).
Conclusions and future work By understanding how the different disciplines use visual means and at what stages in the communication process, and by identifying the visual means that assist the communication flow within multidisciplinary teams towards effective collaboration, design managers can ensure that information between all the team members reaches across discipline boundaries, and all perspectives are taken into consideration; educators can design interdisciplinary curricula to strengthen visual means for communication and collaboration across disciplines; and professionals in the practice of design, business and engineering can build awareness and understanding of the different disciplinary roles and visual skills involved in the design process.
This study suggests the need for better training in the use of visual means by all disciplines. Some professionals can benefit from learning how to use visual means to
generate representations. This can be a powerful tool when the team member is interested in participating in the generation of ideas. Others can benefit from learning how to better communicate by using visual means as communication vehicles to generate feedback, discussions and to sell ideas to the client (Graell and Gill, 2008.)
This study also emphasized that the very essence of design team visual collaboration and communication resided in the ability to reflect on ideas and give them shape through drawings and sketches, and through new forms of integrating words, visuals and symbols. Understanding the function of rough sketches away from their aesthetic value and leveling differences in the knowledge of graphic languages among design team members may result in a more effective collaborative and communicative design space.
This study has also explored emerging visual means to facilitate collaborative sharing of information, and should continue in the future. As the fuzzy front end of the design process is increasing, design professionals and practitioners have to be prepared to work more effectively in multidisciplinary environments. More visual means to define the design problem and generate ideas collectively are needed. Currently, some new visual tools have been developed to collectively solve more complex problems (e.g. mess mapping), but further research is needed to address the different needs of the design industry—new visual tools that speak to different design backgrounds and levels of expertise.
In sum, visuals that facilitate communication and collaboration among multidisciplinary design teams are intuitive and messy, with new forms being developed as new visual languages (visual information murals, visual generative techniques, visual scenarios) are being brought to play to understand the scope and complexity of the design problem as well as the people to design for. In order to find valid design solutions a wide array of relevant variables are to be taken in consideration. Limiting design considerations to aspects that can be thoroughly quantified or that can follow particular processes, is what Roger (2006) calls the obsession to reliability.
Finally, there are opportunities to expand the context of this research study beyond design, engineering and business. The exploration and formulation of new visual languages capable of serving as a common means of expression for [multidisciplinary] teams, is expanding to areas of study beyond the professional practices. For instance, this researcher is currently exploring visual tools for qualitative research in areas such as literacy studies, macrocognitive processes and co-creation.
Acknowledgements The author gratefully acknowledges the valuable support, comments and suggestions from Carolina Gill, Blaine Lilly and Elizabeth B.-N. Sanders.
References Ackoff, R. L. (1974). Redesigning the Future: A Systems Approach to Societal Problems. John Wiley & Sons, Inc.
Albarn, K. and Smith, J. M. (1977). Diagram: The instrument of Thought. Thames and Hudson.
Beinhocker, E. (2007). The origin of wealth. Harvard Business School Press.
Buijs, J. (2003). “Modelling product Innovation processes, from Linear Logic to Circular Chaos.” Creativity and Innovation Management, v. 12 (2), pp. 76-93.
Buzan, T. and Buzan, B. (1993). The Mind Map Book: How to Use Radiant Thinking to Maximize Your Brain’s Untapped Potential. Plume Book.
Cagan, J. and Vogel, C (2002). Creating Breakthrough Products. Prentice Hall.
Citera, M., McNeese, M.D., Brown, C. E., and Selvaraj, Zaff and Whitaker (1995). Fitting Information Systems to Collaborating Design Teams. Journal of the American Society for Information Science. 46 (7), pp. 551-559.
Diestler, S. (2004). Becoming a Critical Thinker: A User Friendly Manual. Prentice Hall; Fourth edition.
Feldman, D. A. (2002). Crisp: Critical Thinking: Strategies for Decision Making. Crisp Learning.
Gill, C. and Lilly, B. (2008). “Bridging Design Disciplines: Preparing Students for Unpredictable Challenges.” J. of Design Research 2008, v. 7, No 3 , pp.220–237.
Graell-Colas, M. and Gill, C. (2008) “Multidisciplinary Team Communication through Visual Representations” Proceedings of the 10th International Conference on Engineering and Product Design Education, Barcelona, Spain, pp. 555-560
Horn, R.E., and Weber, R.P. (2007) New Tools For Resolving Wicked Problems: Mess Mapping and Resolution Mapping Processes. MacroVU(r), Inc. and Strategy Kinetics, LLC. 31 p.
Horn, R. E. (1999). Visual Language: Global Communication for the 21st Century. Macrovu, Inc.
Koen, P.A., Ajamian, G.M., Boyce, S., Clamen, A., Fisher, E., Fountoulakis, S., Johnson, A., Puri, P., and Seibert, R. (2002). “ Chapter 1: Fuzzy Front End: Effective Methods, Tools, and Techniques”. The PDMA ToolBook 1 for New Product Development, edited by Belliveau, P., Griffin, A., and Somermeyer, S. Wiley
Martin, R. (2006). “Designing in Hostile Territory”. Rotman Magazine. Spring/Summer 06
Merton, R. K., Fiske, M., and Kendall, P.L. (1956) The Focused Interview. New York: Free Press.
Olson, E.M., Walker Jr., O.C., Ruekert, R.W., and Bonner, J.M. (2001). “Patterns of cooperation during new product development among marketing, operations and R&D: Implications for project performance.” The Journal of Product Innovation Management, v. 18, pp.258-271.
Reed, D. (2002). “The use of ill-defined problems for developing problem-solving and empirical skills in CS1.” Journal of Computing Sciences in Colleges, v. 18 (1), pp. 121-133.
Sanders, E.B.-N. (2005) “Information, Inspiration and Co-creation.” Proceedings of the 6th International Conference of the European Academy of Design, University of the Arts, Bremen, Germany.
Sanders, E. B.–N. and Stappers, P. J., (2008), “Co-Creation and the New Landscapes of Design”, to appear in CoDesign, Taylor & Francis.
Sternberg, R. (1998). Thinking and Problem Solving (Handbook of Perception and Cognition). Academic Press; Second edition.
Stuart, S. (1999). “Integrative Thinking.” Director’s Breakfast Summary: Leadership. 3 p.
Zeisel, J. (2006). Inquiry by Design. W. W. Norton & Company.
Author Biography MFA in Design Education by The Ohio State University, design researcher, and visual designer, Mercè has recently relocated to Barcelona, Spain. She is currently exploring integrative visual languages, through generative design thinking and co-creation, for team communication, collaboration and decision-making. Owner of visualteamwork, a freelance co-creation design research company, she also teaches at Elisava Escola Superior de Disseny and at the Istituto Europeo di Design, Barcelona.