Embed Size (px)
Citation preview


Visual Masking

OXFORD PSYCHOLOGY SERIESEditors
Mark D’Esposito Daniel SchacterJon Driver Anne Treisman
Trevor Robbins Lawrence Weiskrantz
1. The neuropsychology of anxiety: anenquiry into the functions of the septohippocampal systemJ.A. Gray
2. Elements of episodic memoryE. Tulving
3. Conditioning and associative learningN. J. Mackintosh
4. Visual Masking: an integrative approachB. G. Breitmeyer
5. The musical mind: the cognitive psychology of musicJ. Sloboda
6. Elements of psychophysical theoryJ.-C. Falmagne
7. Animal intelligenceEdited by L. Weiskrantz
8. Response times: their role in inferringelementary mental organizationR. D. Luce
9. Mental representations: a dual codingapproachA. Paivio
10. Memory, imprinting, and the brainG. Horn
11. Working memoryA. Baddeley
12. Blindsight: a case study and implicationsL. Weiskrantz
13. Profile analysisD. M. Green
14. Spatial VisionR. L. DeValois and K. K. DeValois
15. The neural and behavioural organizationof goal-directed movementsM. Jeannerod
16. Visual pattern analyzersN. V. Graham
17. Cognitive foundations of musical pitchC. L. Krumhansl
18. Perceptual and associative learningG. Hall
19. Implicit learning and tacit knowledgeA. S. Reber
20. Neuromotor mechanisms in humancommunicationD. Kimura
21. The frontal lobes and voluntary actionR. E. Passingham
22. Classification and cognitionW. Estes
23. Vowel perception and productionB. S. Rosner and J. B. Pickering
24. Visual StressA. Wilkins
25. Electrophysiology of mindEdited by M. Rugg and M. Coles
26. Attention and memory: an integratedframeworkN. Cowan
27. The visual brain in actionA. D. Milner and M. A. Goode
28. Perceptual consequences of cochleardamageB. C. J. Moore
29. Binocular vision and stereopsisI. P. Howard
30. The measurement of sensationD. Laming
31. Conditioned taste aversionJ. Bures, F Bermúdez-Rattoni, and T. Yamamoto
32. The developing visual brainJ. Atkinson
33. Neuropsychology of anxiety, second editionJ. A. Gray and N. McNaughton
34. Looking down on human intelligence:from psychometrics to the brainI. J. Deary
35. From conditioning to conscious recollection: memory systems of the brainH. Eichenbaum and N. J. Cohen
36. Understanding figurative language: frommetaphors to idiomsS. Glucksberg
37. Active VisionJ. M. Findlay and I. D. Gilchrist
38. The science of false memoryC J Brainerd & V F Reyna
39. Seeing Black and WhiteA. Gilchrist
40. The case for mental imageryS. Kosslyn
41. Visual masking: time slices through conscious and unconscious visionB. G. Breitmeyer and H. Ögmen
Visual MaskingTime slices throughconscious andunconscious visionSECOND EDITION
BRUNO G. BREITMEYER
and
HALUK ÖGMEN
1
3Great Clarendon Street, Oxford OX2 6DP
Oxford University Press is a department of the University of Oxford.It furthers the University’s objective of excellence in research, scholarship,and education by publishing worldwide in
Oxford New York
Auckland Cape Town Dar es Salaam Hong Kong KarachiKuala Lumpur Madrid Melbourne Mexico City NairobiNew Delhi Shanghai Taipei Toronto
With offices in
Argentina Austria Brazil Chile Czech Republic France GreeceGuatemala Hungary Italy Japan Poland Portugal SingaporeSouth Korea Switzerland Thailand Turkey Ukraine Vietnam
Oxford is a registered trade mark of Oxford University Pressin the UK and in certain other countries
Published in the United Statesby Oxford University Press Inc., New York
© Oxford University Press, 2006
The moral rights of the authors have been assertedDatabase right Oxford University Press (maker)
First published 1984
All rights reserved. No part of this publication may be reproduced,stored in a retrieval system, or transmitted, in any form or by any means,without the prior permission in writing of Oxford University Press,or as expressly permitted by law, or under terms agreed with the appropriatereprographics rights organization. Enquiries concerning reproductionoutside the scope of the above should be sent to the Rights Department,Oxford University Press, at the address above
You must not circulate this book in any other binding or coverand you must impose the same condition on any acquirer
British Library Cataloguing in Publication Data
Data available
Library of Congress Cataloging in Publication Data
Breitmeyer, Bruno G.Visual masking : time slices through conscious and unconscious vision / Bruno G. Breitmeyer
and Haluk Ögmen.—2nd ed.p. ; cm.—(Oxford psychology series ; 41)
Includes bibliographical references and indexes.1. Visual perception. I. Ögmen, Haluk. II. Title. III. Series.[DNLM: 1. Visual Perception. WW 105 B835v 2006]
BF241.B73 2006152.14—dc22
2005031831
Typeset by Newgen Imaging Systems (P) Ltd., Chennai, IndiaPrinted in Great Britainon acid-free paper by Biddles Ltd., King’s Lynn
ISBN 0–19–853067–6 (Hbk.) 978–0–19–853067–1 (Hbk.)
10 9 8 7 6 5 4 3 2 1
Preface
The first Oxford University Press edition of Visual Masking, written byone of us, appeared in 1984. Its intent was to present a scholarly reviewof empirical research and theoretical developments in visual maskingup to that time as well as a description of the by now well known dual-channel transient-sustained approach to masking and informationprocessing. Despite some of its regrettable flaws, the book seems tohave enjoyed a noticeable and gratefully acknowledged impact onresearch in visual perception and cognition over the past two decades.However, over the same two decades the study of visual masking hasbeen marked by several new developments. In the year of the publica-tion of the first edition, a new theoretical approach to the study ofvisual masking and related spatio-temporal phenomena, known asperceptual retouch, was published by Talis Bachmann, followed bymany additional publications, including two book-length monographs(Bachmann 1994, 2000), on the relationship of perceptual retouch tothe microgenesis of perception. Except for this development, however,there generally seems to have been a lull in the study of visual maskinguntil the last decade or so, when additional empirical, methodological,theoretical, and technological innovations occasioned a renewed andvigorous interest in visual masking. In part, new empirical findings onthe effects of attention and perceptual grouping on visual masking(Ramachandran and Cobb 1995; Shelley-Tremblay and Mack 1999)have extended the scope of interest, as has a spate of published find-ings, relevant to the understanding of unconscious visual processing,which have emanated from Odmar Neumann’s laboratory in Bielefeld,Germany, over the past decade and a half. In addition to these humanpsychophysical results, informative findings regarding the neuralcorrelates of masking have been reported in several recent neurophysio-logical investigations of monkey visual cortex (see Chapter 3).
Methodological innovations known as ‘common-onset’ and ‘four-dot’masking (Di Lollo et al. 1993; Enns and Di Lollo 1997) have alsogenerated new findings and a new theoretical approach to masking,
PREFACEvi
known as object-substitution, that emphasized the roles of attentionand re-entrant activation in visual processing (Di Lollo et al. 2000; Ennsand Di Lollo 2000; Enns 2004). Concurrently, new neural-networkmodels of masking were published. One model, developed by Francis(1997), explored the emergent temporal dynamics of the FACADEmodel proposed by Grossberg and colleagues (Grossberg and Mingolla1985a,b; Grossberg 1994). The other model, developed by one of us(Ögmen 1993), explored the retinocortical dynamics of the dual-channel approach originally proposed almost three decades ago byBreitmeyer and Ganz (1976). This was a particularly fortunate event forthe other one of us, who, although mathematically trained, failed toexpress that approach in quantitative neural-network terms. Ourcollaboration, a particularly fruitful and enjoyable one over the past 10years, has itself added to the new interest in visual masking (Breitmeyerand Ögmen 2000). In addition to these empirical and conceptualinnovations, three other developments, each exploiting visual maskingas a methodological tool, conspired to reinvigorate interest in visualmasking. One consists of the many recent explorations of various kindsof unconscious visual processing under the methodological rubricof masked priming (Kinoshita and Lupker 2003; see also Chapter 8).The second is an equally wide use of masking by neuroscientists inrecent brain-mapping studies of the neural correlates of conscious andunconscious vision. The third is its use in the study of visual informa-tion processing in special subject populations (see Chapter 9).
For all of these reasons, the current edition of Visual Masking is notmerely a revision of the first edition, but is basically a new monographon visual masking that could easily have been given another title suchas the subtitle, Time Slices through Conscious and Unconscious Vision.In the current edition, we have retained Chapter 1 of the first edition,covering the history of masking, with only minor changes. The topicsof visual masking by light and of visual integration and persistence,covered in Chapters 2 and 3, respectively, of the first edition, are notcovered here. The reason for this omission is that masking by lightoccurs mainly at peripheral (most likely) retinal levels of visual pro-cessing, and therefore sheds little ‘light’ on the study of central corticalobject-forming processes. Moreover, interest in visual persistence andthe cognate topics of iconic memory and visual short-term store haswaned appreciably since the 1980s (Haber 1985), although visual
PREFACE vii
persistence has retained some currency in relation to motion percep-tion (see Chapter 6). The coverage of topics in the present edition isgiven below.
In Chapter 2 we review methods, findings, and applications of visualmasking. Some material in this chapter is also found in Chapter 4 ofthe first edition, but many other reviewed results and applications ofmasking have been reported only in the last two decades. Chapter 3deals with the neurophysiological correlates of visual masking andinformation processing. The chapter includes neurophysiologicaland neuroanatomical findings obtained from the study of (mainly)the monkey visual system as well as electrophysiological and brain-imaging findings obtained from human observers. We regret thatdiscussion of some of the more interesting brain-imaging resultsknown to us have not been included because they have not yet appearedin published form. Chapter 4 reviews past and recent models of visualmasking, some of which were also covered in Chapter 5 of the firstedition. Despite the consignment, in the fast-paced world of visualneuroscience, of developments older than 5 years to ‘history’, we havedecided to include discussion of the older models in Chapter 4 ratherthan in Chapter 1. Chapter 5 outlines in detail our own preferredmodel, which is an elaboration of the neural-network model proposedby one of us (Ögmen 1993). This model is dynamic not only becauseof its substantive content, retinocortical dynamics, but also in itsdevelopment. Although open to fine tuning based on new findings, itnonetheless draws a conceptual line based on (i) mutual inhibitoryinteraction between sustained and transient channels and (ii) interac-tions between feedforward and feedback neural activations. Chapter 6covers the relationship between motion perception and visual masking.While such relationships have been noted before, here they take onspecial significance because our model outlined in Chapter 5 wasoriginally developed to account for several visual-motion phenomena,in particular motion blur, or more specifically its relative absence,during perceived object motion. With regard to spatiotemporal visualphenomena, this renders an empirical scope to our model which is notlimited to visual masking. Chapter 7 covers the effects of figural(gestalt) context and of selective visual attention on masking. Withregard to figural contexts we review two types of findings, thoseobtained when contexts are provided by the mask configurations and
those provided by target configurations; and for selective visual attentionwe review findings relevant to space-based as well as object- or feature-based attention. Moreover, we assess the role of attention as a mereancillary vs. an essential constitutive process in theoretical accounts ofvisual masking. Chapter 8 reviews recent findings from studies usingvisual masking, particularly metacontrast and backward pattern mask-ing, to explore the types and levels of unconscious visual informationprocessing. This chapter is particularly relevant to those cognitivescientists, philosophers, and neuroscientists interested in the neuralcorrelates of conscious and unconscious vision. In Chapter 9 we coverthe use of visual masking, again mainly metacontrast and backwardpattern masking, in the study of special subject populations, includingthose with neurological, ophthalmological, psychiatric, and readingdeficits. These studies are important not only for their applied signif-icance but also for their theoretical implications. We conclude with anepilogue that places the study of visual masking in a wider cross-discipline context.
Our preface would be incomplete without acknowledging the helpand patience accorded to us by the following individuals. During arecent meeting of the Psychonomics Society, one of us initially pro-posed writing the current revised edition of Visual Masking toCatharine Carlin, the psychology editor of the US branch of OxfordUniversity Press based in New York. Without doubt or hesitation shesupported the proposal, eager to have it published by the US branch.However, since the first edition was published by the UK branch inOxford, the working editorship was assigned to Martin Baum. Wethank both Catharine and Martin for their enthusiastic support, andMartin and his editorial assistant, Carol Maxwell, for generouslyextending the deadline for submitting our manuscript by a little over6 months. Without that concession, the last 2 years of work could easilyhave triggered a ‘peritraumatic’ stress disorder in at least one of us;happily they comprised one of the most productively and creativelyexciting periods of our professional careers. We also thank Alpay Koçfor assisting in the preparation of the final version of the manuscriptand especially the bibliographic references.
Houston, Texas B.G.B.July 2005 H.Ö.
PREFACEviii
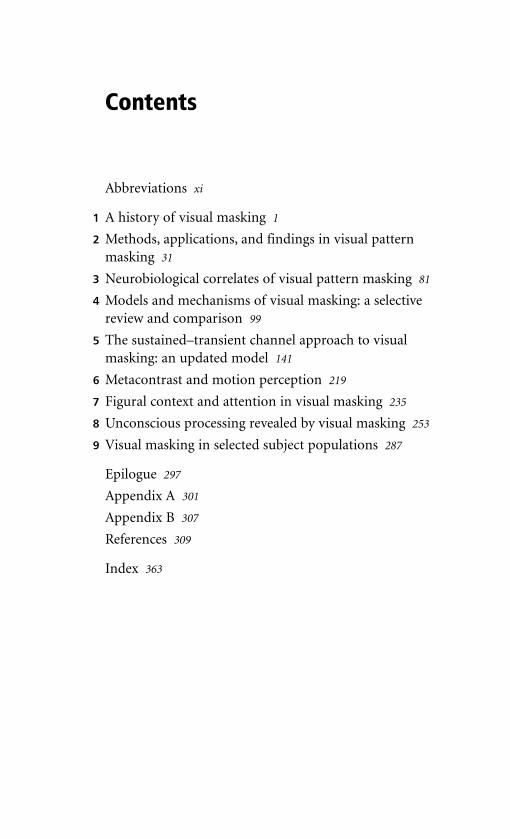
Contents
Abbreviations xi
1 A history of visual masking 1
2 Methods, applications, and findings in visual patternmasking 31
3 Neurobiological correlates of visual pattern masking 81
4 Models and mechanisms of visual masking: a selectivereview and comparison 99
5 The sustained–transient channel approach to visualmasking: an updated model 141
6 Metacontrast and motion perception 219
7 Figural context and attention in visual masking 235
8 Unconscious processing revealed by visual masking 253
9 Visual masking in selected subject populations 287
Epilogue 297
Appendix A 301
Appendix B 307
References 309
Index 363

This page intentionally left blank
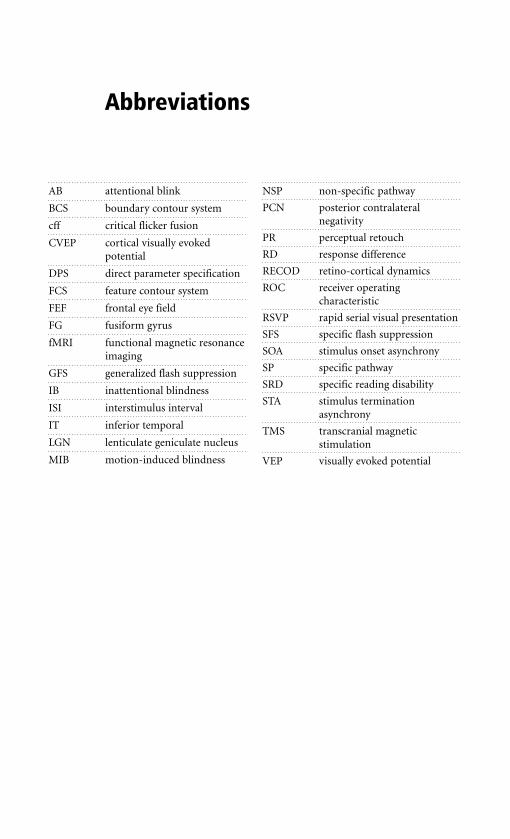
AB attentional blink
BCS boundary contour system
cff critical flicker fusion
CVEP cortical visually evokedpotential
DPS direct parameter specification
FCS feature contour system
FEF frontal eye field
FG fusiform gyrus
fMRI functional magnetic resonanceimaging
GFS generalized flash suppression
IB inattentional blindness
ISI interstimulus interval
IT inferior temporal
LGN lenticulate geniculate nucleus
MIB motion-induced blindness
NSP non-specific pathway
PCN posterior contralateralnegativity
PR perceptual retouch
RD response difference
RECOD retino-cortical dynamics
ROC receiver operatingcharacteristic
RSVP rapid serial visual presentation
SFS specific flash suppression
SOA stimulus onset asynchrony
SP specific pathway
SRD specific reading disability
STA stimulus terminationasynchrony
TMS transcranial magneticstimulation
VEP visually evoked potential
Abbreviations

This page intentionally left blank
Chapter 1
A history of visual masking
1.1. IntroductionScience can be viewed as a means of giving cognitive coherence to ourobservations or perceptions of the world, and the history of science canbe viewed as the study of the evolving contents and modes of suchcognitive structuring. Typically, a science progresses when it confrontspuzzles, problems, or inconsistencies that require solutions or whenfortuitous discoveries are made. The resulting advances are usuallypiecemeal and methodical. By reinforcing and adding to the edifice ofobservations structured around extant theory and method, theseadvances indicate the more or less continuous development of whatKuhn (1962) has called ‘normal science’. However, significant concep-tual or empirical anomalies crop up occasionally and remain deeplyand inextricably rooted within a particular scientific paradigm. Theirdeep-rooted intractability signals an intellectual turning point, whichdemands not only a restructuring of the manifest theoretical andmethodological framework but also a radical shift of the oft-tacitpresuppositions or metatheoretical foundations on which it is based.Relative to the normal-science time frame, such profound resolutionsof scientific anomalies comprise what Kuhn (1962) has termed‘paradigm-shifts’.
What follows from this brief sketch of the scientific enterprise is thatthe history of a science consists not merely of a catalogue and chron-icle of its theories, methods, and observations but also, and moreimportantly, a chronicle of the analysis and interpretation of theirattendant problematic situations (Popper 1972) and fundamental pre-suppositions (Collingwood 1940). Situational analysis and interpreta-tion of this sort is akin to what Hempel (1966) has termed ‘explication’or ‘rational reconstruction’ and to Collingwood’s (1956) method of‘reenactment of past thought’ (for further discussions and critiques ofthese historical methods, see Donagan (1966) and Skagestadt (1975)).
In addition to attempting to render an adequate situational analysisof the science of visual masking, the historical approach adopted herealso highlights numerous significant similarities between past and pres-ent presuppositions, theories, methods, and observations. This tactic isnot premised on an a priori notion of history as recurrent or repetitivebut rather on an a posteriori analysis drawing on relevant prior andcurrent sources. Nor is the approach meant to yield the impression thatin regard to visual perception nothing new is under the sun. On thecontrary, the study of visual perception in the last century, and inparticular in the past five decades, has been marked by vast accumula-tions of new findings and by dramatic conceptual and technical devel-opments (see, for instance, Palmer’s (1999) extensive treatise of recentdevelopments in vision science). Nonetheless, despite many theoretical,methodological, and empirical advances, the claim that nothing asradical or profound as a ‘Copernican Revolution’ (Kuhn 1957a,b) hasoccurred up to now in the science of visual perception or, specifically,visual masking, seems hardly disputable. In fact, the current choice ofhighlighting, whenever possible, significant similarities between pastand recent aspects of the study of visual masking was made to illustrateits piecemeal, continuous, and normal-science mode of development.
1.2. BackgroundVisual masking refers to the reduction of the visibility of one stimulus,called the target, by a spatiotemporally overlapping or contiguoussecond stimulus, called the mask. Historically, masking has playeda leading role in the study of spatial and temporal properties of visualperception. In this role it has remained of great importance to thepresent and promises to continue as such in the future (Breitmeyerand Ögmen 2000). To understand the historical roots of our present andfuture interest in visual masking, we review the scientific context withinwhich masking developed not only as a methodological tool but also asa phenomenon deserving empirical and theoretical investigation per se.
Initially, as now, the use and study of visual masking were grounded inattempts to delineate the temporal stages and parameters of theperceptual process. These attempts involved the conceptual parsing andthe experimental measure of, among others, the following temporalstages: the time for a stimulus to reach focused awareness(Apperceptionzeit), perception time (Wahrnehmungszeit), perceptual
A HISTORY OF VISUAL MASKING2
duration (Wahrnehmungsdauer), sensation time (Empfindungszeit), therise and fall times of sensation, sensory persistence, retinal (transduction)latency, conduction velocity, cortical processing latency, and so on. Cattell(1885a, 1886) condensed these measures into a coarser parsing of fourbasic temporal parameters, each corresponding to one sensory–perceptualoperation or stage.
1. The time that a stimulus must be present in order that a sensationbe excited (threshold level).
2. The duration of a stimulus required to maximize sensory intensity(saturation level).
3. The time required for a stimulus to be changed into a nervousimpulse (transduction latency).
4. The time taken up in the nerve and brain before the stimulus is seen(perceptual latency).
As Baade (1917b) pointed out, this ‘microtomization’ (Mikrotomierung)or temporal slicing of the perceptual process occurred in a contextconcerned with the complementary studies of (a) ‘pure’ sensations and(b) the initial stages in the microgenesis of the perceptual process. Perhapsit is best to quote Baade’s characterization of this context.
Out of the following consideration it will become clear what especially great signific-ance the study of the initial stages of the perceptual process has for the investigationof sensations. The chemist seeks to produce pure chemical bonds; the physicist seeksto free the research-relevant processes from all superfluous and accidental side effects;the bacteriologist seeks to isolate his research objects in a ‘pure culture’ [or medium].Should the psychologist not strive to observe, in an isolated state, a state of purity, orhowever one wishes to express it, those objects of psychology to which he grants thename and role of ‘element’, ‘primitive form’, or something similar? Should one searchfor the above-mentioned isolated sensations, one would naturally expect theirpresence only in the first stages of the perceptual process; for it is, so to say, palpablyclear that nothing of the later stages will be as simple as the initial ones. (Baade 1917b,pp. 99–100; our translation)
Within this microgenetic context, some of the earliest research on theinitial stages and temporal parameters of perceptual processes wasconducted in the latter half of the nineteenth century (Baxt 1871;Cattell 1885a, 1886; Erdmann and Dodge 1898; Exner 1868; Tigerstedtand Bergqvist 1883) and continued well into the initial decades of thetwentieth century (Fröhlich 1923; Monjé 1927). Although these invest-igations were criticized throughout on logical and methodological
BACKGROUND 3

grounds (Cattell 1885a, 1886; Erismann 1935; McDougall 1904b;Rubin 1929; Wundt 1899a,b, 1900), they left in their wake a host ofinteresting experimental techniques and empirical findings. Moreover,they raised persistent theoretical and methodological problems(Gibson 1979; Neisser 1976; Shaw and Bransford 1977; Turvey 1977).
A thorough extensive discussion of these problems is beyond thescope of this chapter. However, briefly, they revolved fundamentallyaround the following questions.
1. Is it desirable or possible to isolate perceptual elements (e.g. puresensations)?
2. Correspondingly, is it desirable or possible to determine the primit-ive stages or mechanisms of the perceptual process in which theelements can be isolated?
3. As a methodological corollary, by employing brief and static(i.e. tachistoscopic) stimuli, is one not introducing into the percep-tual process laboratory artefacts that bear little resemblance orrelevance to more naturalistic extra-laboratory perception?
The recognition of the scientific importance attached to thesequestions (Neisser 1976; Turvey 1977) is a recurrent theme in the studyof perception. To illustrate, let us quote verbatim the introductoryparagraph of Ebbecke’s (1920) article entitled Über das Augenblicksehen(‘On momentary seeing’).
Typically our seeing process is one characterized by a roving view. As soon as one isprevented, through some unnatural way, from running one’s eye over the objects inthe visual field and, so to speak, probing them, all sorts of disturbances intrude intovisual sensation. Under [prolonged] rigid fixation, visibility begins to blur in thatbrightness and hue differences disappear and afterimages appear. Conversely, whenthe eye catches only a brief glimpse of a visual object, the visual impression is renderedinaccurate or altered [relative to free viewing conditions] (Ebbecke 1920, p. 13; ourtranslation, emphasis added).
Despite this time-honored recognition of the problems attendingattempts to delineate stages of the perceptual process and the corollaryuse of the tachistoscopic method, chronometric research on theperceptual process flourished then as it does now (see Ögmen andBreitmeyer 2005; Posner 1978; Shapiro 2001).
With that in mind, we turn to that subclass of tachistoscopictechniques and observations relevant to the historical understanding of
A HISTORY OF VISUAL MASKING4

visual masking. We focus primarily on the following topics:
(1) the types of masking termed metacontrast and paracontrast;
(2) the relation of stroboscopic motion to metacontrast;
(3) the type of masking termed masking by light;
(4) the existence of response persistence and temporal integration invision;
(5) the role of central, cognitive (non-sensory) processes involved invisual masking.
This choice of topics was not arbitrary; rather, it reflects the main thrustof past as well as present research in visual masking and cognate areas.
1.3. Metacontrast and paracontrastBy metacontrast we mean the reduction in the visibility of one brieflypresented stimulus, the target, by a spatially adjacent and temporallysucceeding briefly presented second stimulus, the mask. Thereforemetacontrast is a form of backward masking in so far as the maskingstimulus exerts a retroactive effect on the visibility of the target stimu-lus. By exchanging the temporal order of the above two sequentialstimuli i.e. by designating the first stimulus as the mask and the secondas the target to be masked, the conditions for paracontrast, a type offorward masking, are met.
The coining of the terms metacontrast and paracontrast and the firstextensive investigation of these two masking effects are credited toStigler (1910, 1926). However, as noted in Alpern’s (1952) historicalreview of metacontrast, evidence for these effects predated Stigler’s(1910) work by a decade or two. Moreover, the use and importance ofmetacontrast as a methodological tool in the study of the time courseand elementary processes of visual perception, although explicitlyacknowledged by Stigler (1926) and Piéron (1935) in the early twentiethcentury, was already apparent several decades earlier.
According to Stigler (1908, 1910), Exner (1868) was the first toemploy the experimental technique that eventually developed tobecome known as metacontrast and paracontrast masking. Exner usedthe subjective comparison of two spatially bordering stimuli, one ofwhich was flashed slightly before the other, in order to investigate thetime course of light sensations produced by a brief tachistoscopic light
METACONTRAST AND PARACONTRAST 5

stimulus. Without going into the details of Exner’s rationale andmethod, we shall briefly analyze the following assumptions that hemade to justify his method. Exner assumed that two objectively equaland briefly flashed stimuli, presented sequentially in immediatelyadjacent retinal areas, elicit two equal sensations. What was impliedis that the two sensory effects produced by the brief stimuli areindependent and do not interact spatially. Without this constancyassumption, whether true or not, Exner could not have employed thesensation produced by the second stimulus to monitor the time courseof sensation produced by the spatially bordering first stimulus. Thisworking hypothesis, later also adopted in related investigations byKunkel (1874) and Petrén (1893), may have been premised, additionally,on the then prevailing notion of ‘local signs’ introduced by Lotze(1852) in his Medicinische Psychologie (Medical Psychology). Accordingto Lotze, local signs resulted from stimulation of spatially delimited‘sensory circles’, each of which was connected via a separate independ-ently acting nerve fiber to its appropriate cortical area. Lotze’s notion oflocal signs was adopted and adapted by many of his contemporaries,particularly by the noted nativist Hering and two of the most influen-tial empiricists, Wundt and Helmholtz. Furthermore, to produceindependent local sensory activity, Exner (as well as Kunkel and Petrén)assumed that the use of very briefly flashed stimuli effectively eliminatedreciprocal spatial contrast mechanisms. This assumption was refuted byStigler’s (1910, 1913, 1926) subsequent work on masking. Consequently,it should be clear why the former investigators, who regarded theirwork primarily as a way of determining the time course of isolatablevisual sensations, failed to consider the significance of their investiga-tions in terms of spatial contrast phenomena. Moreover, the use of briefflashes, presumably to circumvent spatial contrast phenomena, impliesthat these investigators were aware of such contrast effects. In fact,Exner (1868, p. 615) makes reference to the existence of edge or bordercontrast effects. As early as 1834, Müller, in his Handbuch derPhysiologie des Menschen (Handbook of Human Physiology) proposedthat spatial contrast phenomena were based on mutual and reciprocalaction between separate retinal areas, and several of Exner’s contempor-aries (Hering 1872, 1878; Hermann 1870; Mach 1865, 1866a,b, 1868)had already published some major works on spatial contrast and thereciprocal dependence and interactions between adjacent retinal areas
A HISTORY OF VISUAL MASKING6
of stimulation. Therefore it seems more credible that Exner, Kunkel, andPetrén, rather than having been entirely ignorant of prior and contem-poraneous work on spatial contrast, simply did not consider it as a sig-nificant factor in their studies.
Be that as it may, it was not until Sherrington’s (1897) work on recip-rocal action in the retina and McDougall’s (1904a,b) investigations ofthe sensory intensity of brief visual stimuli that spatiotemporal contrastphenomena were given due notice in the study of the time course ofvisual sensations. In this regard, Sherrington (1897, p. 33) stated that:
the physiological result of applications of a stimulus to any point of a sensifacientsurface is decided by not only the particular stimulus there and then incident but alsoby circumjacent and immediately antecedent retinal events in determining the finalphysiological or sensory effect produced by a given retinal point of stimulation.
Sherrington’s (1897) definition of ‘simultaneous contrast’ and ‘suc-cessive contrast’ as reciprocal sensory relations or interactions across aninterval of space and time, respectively, also implied the existence ofand distinction between metacontrast (temporally backward masking)and paracontrast (temporally forward masking), although his studyfailed to draw this distinction either conceptually or experimentally.Nonetheless, one can infer from Sherrington’s (1897) and McDougall’s(1904a) investigations (both published prior to Stigler’s work) thatboth investigators were aware of metacontrast and paracontrast effects,although neither named or isolated these effects as such. It was left forStigler (1908, 1910, 1913, 1926) to do so, and for subsequent investig-ators to rediscover, reconceptualize, or elaborate on them (Alpern 1953;Baroncz 1911; Baumgardt and Segal 1942; Fry 1934, 1935; Fry andBartley 1936; Piéron 1935). Some of the major findings, theories, andtechniques are reviewed in the next section.
1.3.1. Principal investigations: findings and theories
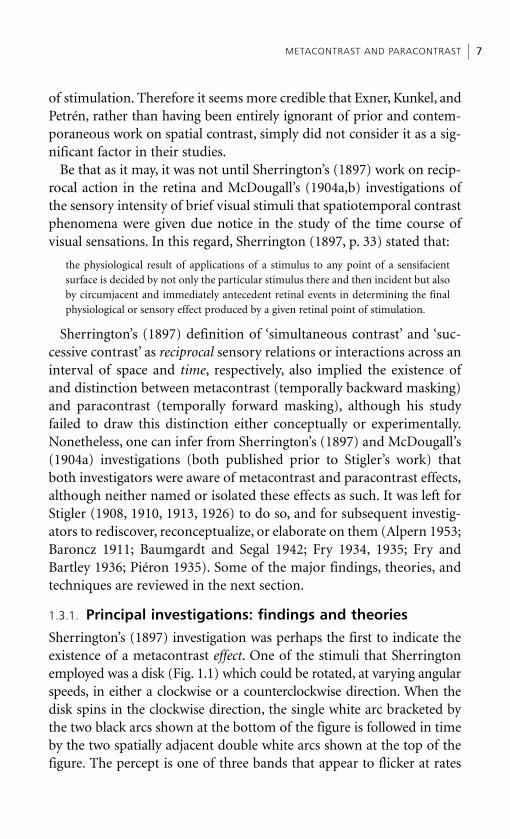
Sherrington’s (1897) investigation was perhaps the first to indicate theexistence of a metacontrast effect. One of the stimuli that Sherringtonemployed was a disk (Fig. 1.1) which could be rotated, at varying angularspeeds, in either a clockwise or a counterclockwise direction. When thedisk spins in the clockwise direction, the single white arc bracketed bythe two black arcs shown at the bottom of the figure is followed in timeby the two spatially adjacent double white arcs shown at the top of thefigure. The percept is one of three bands that appear to flicker at rates
METACONTRAST AND PARACONTRAST 7
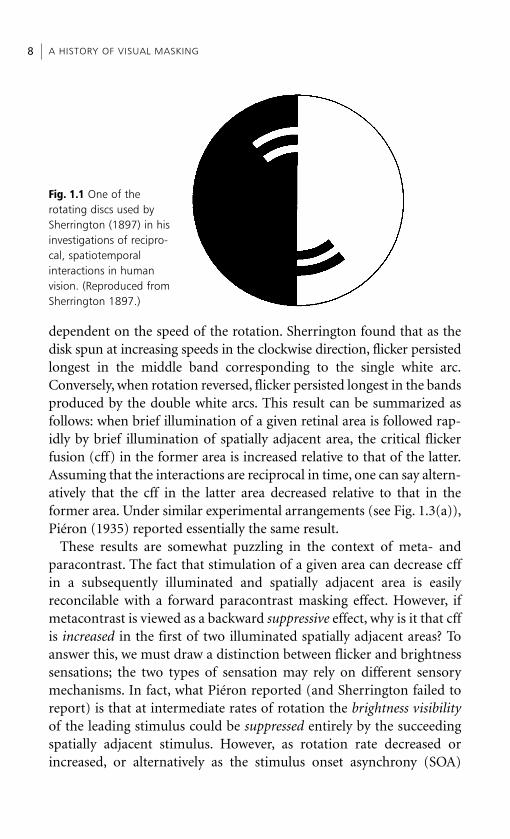
dependent on the speed of the rotation. Sherrington found that as thedisk spun at increasing speeds in the clockwise direction, flicker persistedlongest in the middle band corresponding to the single white arc.Conversely, when rotation reversed, flicker persisted longest in the bandsproduced by the double white arcs. This result can be summarized asfollows: when brief illumination of a given retinal area is followed rap-idly by brief illumination of spatially adjacent area, the critical flickerfusion (cff) in the former area is increased relative to that of the latter.Assuming that the interactions are reciprocal in time, one can say altern-atively that the cff in the latter area decreased relative to that in theformer area. Under similar experimental arrangements (see Fig. 1.3(a)),Piéron (1935) reported essentially the same result.
These results are somewhat puzzling in the context of meta- andparacontrast. The fact that stimulation of a given area can decrease cffin a subsequently illuminated and spatially adjacent area is easilyreconcilable with a forward paracontrast masking effect. However, ifmetacontrast is viewed as a backward suppressive effect, why is it that cffis increased in the first of two illuminated spatially adjacent areas? Toanswer this, we must draw a distinction between flicker and brightnesssensations; the two types of sensation may rely on different sensorymechanisms. In fact, what Piéron reported (and Sherrington failed toreport) is that at intermediate rates of rotation the brightness visibilityof the leading stimulus could be suppressed entirely by the succeedingspatially adjacent stimulus. However, as rotation rate decreased orincreased, or alternatively as the stimulus onset asynchrony (SOA)
A HISTORY OF VISUAL MASKING8
Fig. 1.1 One of the rotating discs used bySherrington (1897) in hisinvestigations of recipro-cal, spatiotemporal interactions in humanvision. (Reproduced fromSherrington 1897.)
between adjacent retinal areas increased or decreased, the brightness ofthe leading stimulus became progressively greater, i.e. the suppressiveeffect that the lagging stimulus had on the leading one decreased.Hence, by taking the perceived brightness of the band produced bythe leading arc as a sensory response index, Piéron obtained a non-monotonic metacontrast suppression as a function of SOA. And, likeSherrington, he reported a complementary facilitatory effect on cff.The empirical and theoretical work discussed in Chapters 4 and 5 clari-fies why flicker sensitivity does not serve as an index of metacontrastsuppression but rather as an index of complementary metacontrastfacilitation. It will also become clear why decreases of flicker andbrightness visibility indicate the existence of two separate mechanismsof paracontrast suppression. To anticipate in summary fashion, weshall make the following two claims.
1. The fast ‘flicker-detectors’, activated by the spatially adjacenttemporally lagging stimulus, suppress, and are also reciprocallysuppressed by, the activity of the slow pattern ‘brightness (or con-trast) detectors’ generated by the leading stimulus.
2. Consequently, this in turn results in (a) an inhibition of the flickerdetectors responding to the lagging stimulus and (b) an inhibitionof the contrast detectors, and thus a simultaneous disinhibition ofthe flicker detectors, responding to the leading stimulus.
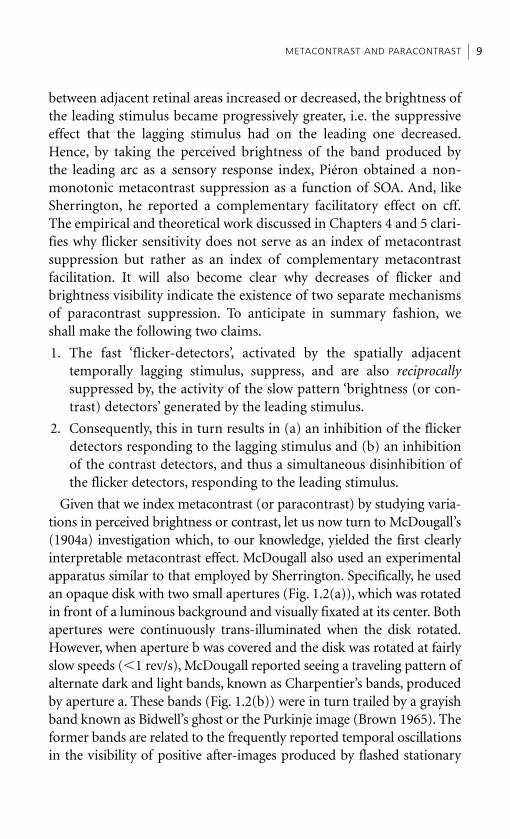
Given that we index metacontrast (or paracontrast) by studying varia-tions in perceived brightness or contrast, let us now turn to McDougall’s(1904a) investigation which, to our knowledge, yielded the first clearlyinterpretable metacontrast effect. McDougall also used an experimentalapparatus similar to that employed by Sherrington. Specifically, he usedan opaque disk with two small apertures (Fig. 1.2(a)), which was rotatedin front of a luminous background and visually fixated at its center. Bothapertures were continuously trans-illuminated when the disk rotated.However, when aperture b was covered and the disk was rotated at fairlyslow speeds (�1 rev/s), McDougall reported seeing a traveling pattern ofalternate dark and light bands, known as Charpentier’s bands, producedby aperture a. These bands (Fig. 1.2(b)) were in turn trailed by a grayishband known as Bidwell’s ghost or the Purkinje image (Brown 1965). Theformer bands are related to the frequently reported temporal oscillationsin the visibility of positive after-images produced by flashed stationary
METACONTRAST AND PARACONTRAST 9
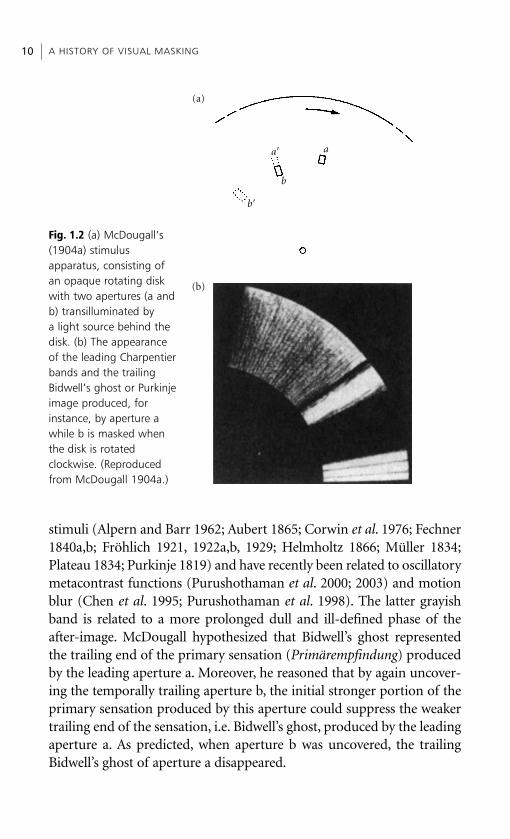
stimuli (Alpern and Barr 1962; Aubert 1865; Corwin et al. 1976; Fechner1840a,b; Fröhlich 1921, 1922a,b, 1929; Helmholtz 1866; Müller 1834;Plateau 1834; Purkinje 1819) and have recently been related to oscillatorymetacontrast functions (Purushothaman et al. 2000; 2003) and motionblur (Chen et al. 1995; Purushothaman et al. 1998). The latter grayishband is related to a more prolonged dull and ill-defined phase of theafter-image. McDougall hypothesized that Bidwell’s ghost representedthe trailing end of the primary sensation (Primärempfindung) producedby the leading aperture a. Moreover, he reasoned that by again uncover-ing the temporally trailing aperture b, the initial stronger portion of theprimary sensation produced by this aperture could suppress the weakertrailing end of the sensation, i.e. Bidwell’s ghost, produced by the leadingaperture a. As predicted, when aperture b was uncovered, the trailingBidwell’s ghost of aperture a disappeared.
A HISTORY OF VISUAL MASKING10
(a)
(b)
b�
a� a
b
Fig. 1.2 (a) McDougall’s(1904a) stimulus apparatus, consisting ofan opaque rotating diskwith two apertures (a andb) transilluminated by a light source behind thedisk. (b) The appearanceof the leading Charpentierbands and the trailingBidwell’s ghost or Purkinjeimage produced, forinstance, by aperture awhile b is masked whenthe disk is rotated clockwise. (Reproducedfrom McDougall 1904a.)
Note that McDougall’s explanation of the ‘backward’ suppression ofBidwell’s ghost rests on the following implicit assumptions: (i) althoughtwo physical stimuli are spatially and temporally segregated, theirsensory responses interact not only via reciprocal lateral interaction butalso via their temporal overlap, thus in effect simulating simultaneousbrightness contrast at the physiological level; (ii) as a corollary, thesensory response of a brief stimulus must persist, in some form or other,beyond the momentary duration of the stimulus.
These assumptions were made explicit and elaborated in subsequentinvestigations of meta- and paracontrast conducted by Stigler (1910,1913, 1926). Based on Exner’s (1868) notion of ‘positive after-image’,Stigler (1910) drew the following distinction between the initial andtrailing portions of the primary sensation produced by a flashed stimulus.The (initial) part of the primary sensation (Primärempfindung), whichwas produced by the presence of the stimulus, was designated thehomophotic image, and the (trailing) part, which outlasts the stimulus,was designated the metaphotic image and corresponded to the Exnerianpositive after-image. As stated by Stigler, the metaphotic image wasfurther distinguishable in that it, relative to the homophotic image, isparticularly susceptible to masking by spatially adjacent stimuli.Although this masking was believed to tap the same mechanisms assimultaneous or homophotic contrast, Stigler named it metaphoticcontrast or metacontrast in order to highlight the fact that themetaphotic image of a temporally leading stimulus was affected by (thehomophotic image of) a succeeding stimulus.
As stated so far, this explanation, based on (i) a form of visualpersistence and (ii) a mechanism related to simultaneous brightnesscontrast, seems reasonably and simply stated in terms of temporalintegration of interactive sensory responses. However, in 1926 Stiglercomplicated this theoretical explanation somewhat by explicitlyacknowledging another possible mechanism which we can alternativelyterm the overtake or delay hypothesis. He states that
metacontrast shows that it is possible for an excitation to be overtaken on its wayfrom the retina to the central organs and masked via a contrast effect [produced] by asucceeding [spatially] neighboring stimulus.
Metacontrast shows further that the visual excitation is
measurably delayed at one and probably several sites along its way from the peripheryto the center [i.e. the brain]. (Stigler 1926, pp. 950–1; our translation, emphasis added)
METACONTRAST AND PARACONTRAST 11
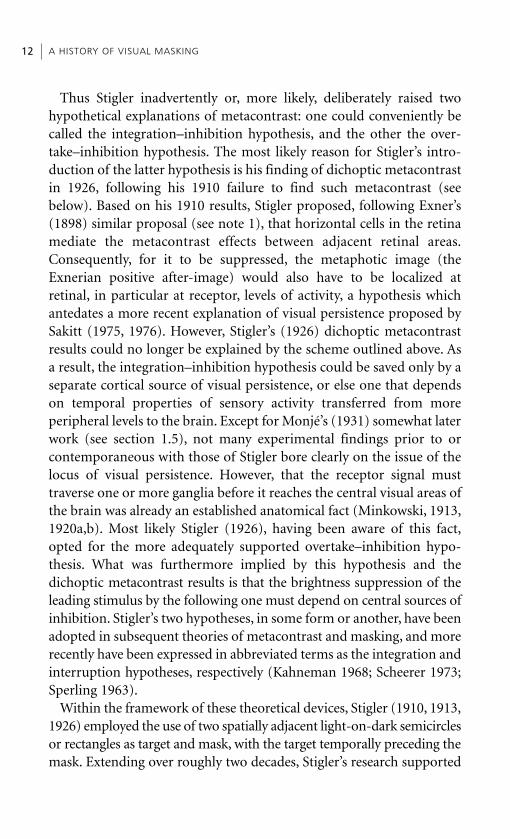
Thus Stigler inadvertently or, more likely, deliberately raised twohypothetical explanations of metacontrast: one could conveniently becalled the integration–inhibition hypothesis, and the other the over-take–inhibition hypothesis. The most likely reason for Stigler’s intro-duction of the latter hypothesis is his finding of dichoptic metacontrastin 1926, following his 1910 failure to find such metacontrast (seebelow). Based on his 1910 results, Stigler proposed, following Exner’s(1898) similar proposal (see note 1), that horizontal cells in the retinamediate the metacontrast effects between adjacent retinal areas.Consequently, for it to be suppressed, the metaphotic image (theExnerian positive after-image) would also have to be localized atretinal, in particular at receptor, levels of activity, a hypothesis whichantedates a more recent explanation of visual persistence proposed bySakitt (1975, 1976). However, Stigler’s (1926) dichoptic metacontrastresults could no longer be explained by the scheme outlined above. Asa result, the integration–inhibition hypothesis could be saved only by aseparate cortical source of visual persistence, or else one that dependson temporal properties of sensory activity transferred from moreperipheral levels to the brain. Except for Monjé’s (1931) somewhat laterwork (see section 1.5), not many experimental findings prior to orcontemporaneous with those of Stigler bore clearly on the issue of thelocus of visual persistence. However, that the receptor signal musttraverse one or more ganglia before it reaches the central visual areas ofthe brain was already an established anatomical fact (Minkowski, 1913,1920a,b). Most likely Stigler (1926), having been aware of this fact,opted for the more adequately supported overtake–inhibition hypo-thesis. What was furthermore implied by this hypothesis and thedichoptic metacontrast results is that the brightness suppression of theleading stimulus by the following one must depend on central sources ofinhibition. Stigler’s two hypotheses, in some form or another, have beenadopted in subsequent theories of metacontrast and masking, and morerecently have been expressed in abbreviated terms as the integration andinterruption hypotheses, respectively (Kahneman 1968; Scheerer 1973;Sperling 1963).
Within the framework of these theoretical devices, Stigler (1910, 1913,1926) employed the use of two spatially adjacent light-on-dark semicirclesor rectangles as target and mask, with the target temporally preceding themask. Extending over roughly two decades, Stigler’s research supported
A HISTORY OF VISUAL MASKING12
the following main conclusions, most of which have been repeatedlycorroborated in later and more recent investigations.
1. Metacontrast can be obtained binocularly as well as monocularly(Stigler 1910).
2. Although initially denied by Stigler (1910), he found later thatmetacontrast could also be obtained dichoptically (Stigler 1926; seealso Kolers and Rosner 1960; May et al. 1980; Schiller and Smith1968; Weisstein 1971; Werner 1940).
3. Metacontrast is not only a dichoptic effect, it is also an interhemi-spheric (transcallosal) effect (Stigler 1926; see also McFadden andGummerman 1973).
4. ‘Metacontrast is exclusively dependent on the luminance of the two[adjacent] contrast fields and [is] essentially unaffected by color. It[i.e. metacontrast] is as evident when one semicircle is red, and theother green as when both are white’ (Stigler 1926; p. 967). However,see Chapter 2, section 2.6.8, for discussions of both corroborativeand disconfirming results reported in more recent studies.
5. Metacontrast depends on the temporal onset asynchronies of thetwo adjacent stimuli, or as Stigler (1910, p. 418) stated: ‘shouldthe time difference between the onsets of the two luminous stimulibe increased beyond the temporal-resolution threshold . . . a differencevalue is finally attained . . . at which Field I [the leading stimulusor target] appears darker than Field II [the succeeding stimulus ormask]’. A reworked version of this ‘SOA law’ has more recently beenstated by Kahneman (1967) and Di Lollo et al (2004) for metacontrastand by Turvey (1973) for central pattern masking.
6. In foveal view, which was employed by Stigler (1910), metacontrastwas eliminated or progressively attenuated when an increasinglywide dark vertical strip separated the two successive and neighbor-ing stimuli, a result also reported more recently by Kolers andRosner (1960) and Bridgeman and Leff (1979).
7. Metacontrast depends on the direction of gaze (Stigler 1910). Whenthe border between the test and mask field was viewed parafoveallyrather than foveally or directly, metacontrast seemed to be strongerand more immune to spatial separation between the two neighbor-ing stimuli (Alpern 1953; Kolers and Rosner 1960; Merikle 1980;Saunders 1977; Stewart and Purcell 1970, 1974).
METACONTRAST AND PARACONTRAST 13
8. The first stimulus can reduce the apparent brightness of thesucceeding one. This latter effect is known as paracontrast (Stigler1926; see also Alpern 1953; Kolers and Rosner 1960; Weisstein 1972).
Before discussing later relevant studies of metacontrast and masking,let us examine one more of Stigler’s (1910) findings that in hindsightseems to be of relevance to his theoretical explanations of metacon-trast. Stigler found that metacontrast obtains not only when the secondstimulus is equal to or greater in intensity than the first, but also whenthe second stimulus is substantially weaker than the first (Stigler 1910,p. 394, Experiment 9, and p. 399, Experiment 45). This raises thefollowing set of problems. Stigler (1910), among others (e.g. Cattell1885b), was aware that a relative increase in stimulus intensity decreasedthe response latency and persistence of a visual sensation. This poses apuzzle for both the integration–inhibition and the overtake–inhibitionhypotheses. With a shorter latency and persistence of the first stimulusrelative to the second, how is it that, according to former hypothesis,the slow and weaker sensory effects of the second stimulus integratetemporally with and inhibit the briefly persisting and stronger ones ofthe first? According to the latter hypothesis, how is it that the weakersensation produced by the second stimulus overtakes and inhibits thefaster stronger one produced by the first? This theoretical puzzle, alsoinherent in a later related theory (Ganz 1975) (see Chapter 4), was notapparent to Stigler, his contemporaries, or his immediate successors,and as such did not attain central status in theories of metacontrastuntil much later (Alpern 1953).
Of additional particular interest to the present historical review oftheories and findings are the studies reported by Fry (1934), Werner(1935), Piéron (1935) and Alpern (1953). Fry (1934), independently ofStigler’s work, rediscovered the metacontrast effect, and his theoreticalexplanation is basically a composite of Stigler’s two hypotheses. Toexplain the temporally backward influence in metacontrast, Fry stated:
what seems to happen is that the response of the retina to the first stimulus isconsiderably delayed and prolonged and overlaps in time the response to the second[spatially adjacent] stimulus and is inhibited by it by some kind of interaction betweenretino-cortical pathways at synapses either at the retina, or at the basal ganglia, or atthe cortex. (Fry 1934, p. 706, emphasis added)
Within this theoretical framework, Fry (1934) extended Stigler’s basicfindings by obtaining the following important quantitative results.
A HISTORY OF VISUAL MASKING14
Similar to Stigler’s (1910) results, Fry (1934) found that parafovealmetacontrast could be obtained when a spatial (dark) gap of up to1.25� was introduced between the target and the mask stimuli. Moreover,Fry found that the strength of metacontrast decreased with the size of thegap, indicating that metacontrast interactions are, relatively speaking,spatially local.
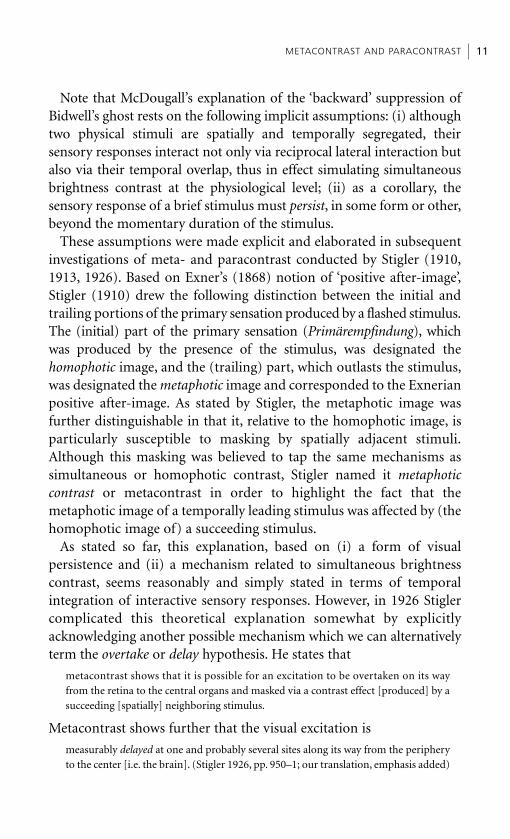
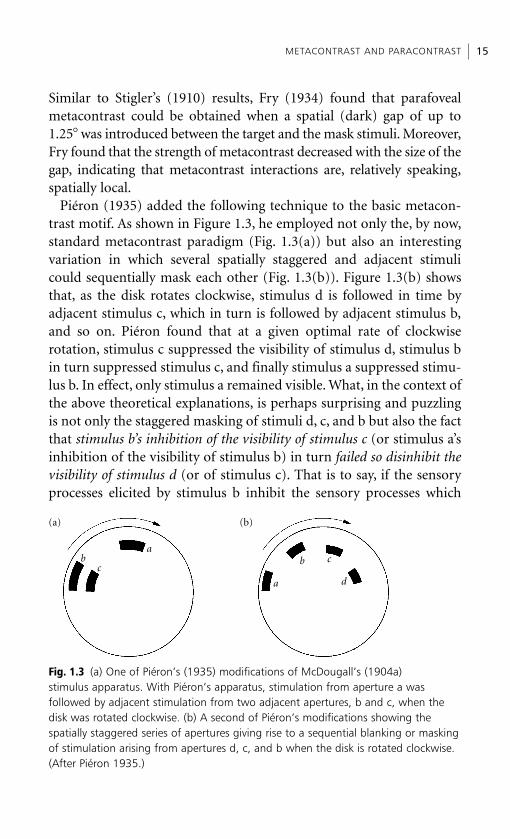
Piéron (1935) added the following technique to the basic metacon-trast motif. As shown in Figure 1.3, he employed not only the, by now,standard metacontrast paradigm (Fig. 1.3(a)) but also an interestingvariation in which several spatially staggered and adjacent stimulicould sequentially mask each other (Fig. 1.3(b)). Figure 1.3(b) showsthat, as the disk rotates clockwise, stimulus d is followed in time byadjacent stimulus c, which in turn is followed by adjacent stimulus b,and so on. Piéron found that at a given optimal rate of clockwiserotation, stimulus c suppressed the visibility of stimulus d, stimulus bin turn suppressed stimulus c, and finally stimulus a suppressed stimu-lus b. In effect, only stimulus a remained visible. What, in the context ofthe above theoretical explanations, is perhaps surprising and puzzlingis not only the staggered masking of stimuli d, c, and b but also the factthat stimulus b’s inhibition of the visibility of stimulus c (or stimulus a’sinhibition of the visibility of stimulus b) in turn failed so disinhibit thevisibility of stimulus d (or of stimulus c). That is to say, if the sensoryprocesses elicited by stimulus b inhibit the sensory processes which
METACONTRAST AND PARACONTRAST 15
(a) (b)
b bc
c
d
a
a
Fig. 1.3 (a) One of Piéron’s (1935) modifications of McDougall’s (1904a) stimulus apparatus. With Piéron’s apparatus, stimulation from aperture a was followed by adjacent stimulation from two adjacent apertures, b and c, when thedisk was rotated clockwise. (b) A second of Piéron’s modifications showing the spatially staggered series of apertures giving rise to a sequential blanking or maskingof stimulation arising from apertures d, c, and b when the disk is rotated clockwise.(After Piéron 1935.)
otherwise would have been elicited by stimulus c, would one not expectthat the sensory processes elicited by stimulus d in turn not be inhibitedsince this inhibition relies on the presence of stimulus c’s sensoryprocesses? As shown in Chapters 5 and 8, the resolution of this puzzledepends on a theoretical reconceptualization of metacontrast, relyingon two separate types of neural processing.
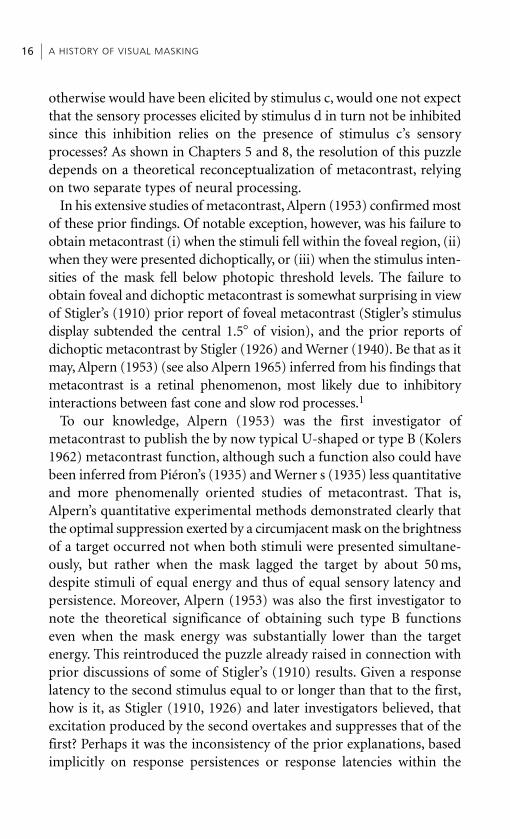
In his extensive studies of metacontrast, Alpern (1953) confirmed mostof these prior findings. Of notable exception, however, was his failure toobtain metacontrast (i) when the stimuli fell within the foveal region, (ii)when they were presented dichoptically, or (iii) when the stimulus inten-sities of the mask fell below photopic threshold levels. The failure toobtain foveal and dichoptic metacontrast is somewhat surprising in viewof Stigler’s (1910) prior report of foveal metacontrast (Stigler’s stimulusdisplay subtended the central 1.5� of vision), and the prior reports ofdichoptic metacontrast by Stigler (1926) and Werner (1940). Be that as itmay, Alpern (1953) (see also Alpern 1965) inferred from his findings thatmetacontrast is a retinal phenomenon, most likely due to inhibitoryinteractions between fast cone and slow rod processes.1
To our knowledge, Alpern (1953) was the first investigator ofmetacontrast to publish the by now typical U-shaped or type B (Kolers1962) metacontrast function, although such a function also could havebeen inferred from Piéron’s (1935) and Werner s (1935) less quantitativeand more phenomenally oriented studies of metacontrast. That is,Alpern’s quantitative experimental methods demonstrated clearly thatthe optimal suppression exerted by a circumjacent mask on the brightnessof a target occurred not when both stimuli were presented simultane-ously, but rather when the mask lagged the target by about 50 ms,despite stimuli of equal energy and thus of equal sensory latency andpersistence. Moreover, Alpern (1953) was also the first investigator tonote the theoretical significance of obtaining such type B functionseven when the mask energy was substantially lower than the targetenergy. This reintroduced the puzzle already raised in connection withprior discussions of some of Stigler’s (1910) results. Given a responselatency to the second stimulus equal to or longer than that to the first,how is it, as Stigler (1910, 1926) and later investigators believed, thatexcitation produced by the second overtakes and suppresses that of thefirst? Perhaps it was the inconsistency of the prior explanations, basedimplicitly on response persistences or response latencies within the
A HISTORY OF VISUAL MASKING16
same types of sensory processes, which led Alpern to posit an alternativeexplanation based on differential temporal response properties of coneand rod processes. As such, Alpern’s (1953) explanation, although onlypartially correct, was in spirit the first to highlight what wassubsequently called the dual-channel approach to metacontrast(Breitmeyer and Ganz 1976; Matin 1975; Weisstein et al. 1975).
Half a century before Alpern’s (1953) work, McDougall (1904a) hadalready implicitly invoked the longer response latency of rod, relative tocone, processes in explanations of his lateral and backward maskingeffects. McDougall hypothesized that many, although not all, of thetrailing Bidwell’s ghost phenomena were due to rod processes, whichhave a longer response latency than the cone processes responsible forthe earlier (Charpentier) bands produced by a rotating illuminatedwindow (Fig. 1.2(b)). Further implied by McDougall’s (1904a) investiga-tion and made explicit by Alpern (1953) is the belief that conemechanisms can inhibit rod mechanisms (and vice versa). In fact the issueof rod–cone interactions was brought into the limelight by Alpern’s(1953) study and, as we shall see, continued to attract appreciable atten-tion (see Chapter 2, section 2.6.8).
1.3.2. Related phenomena: stroboscopic motion, feature inheritance, and standing-wave illusion
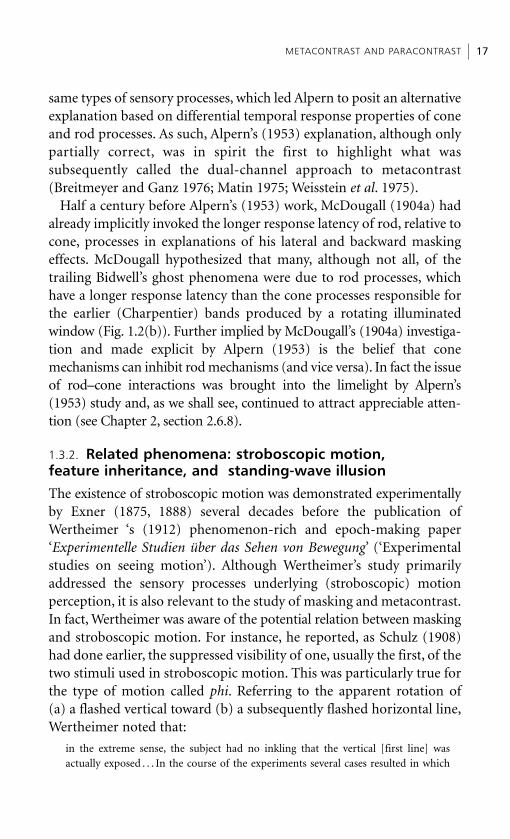
The existence of stroboscopic motion was demonstrated experimentallyby Exner (1875, 1888) several decades before the publication ofWertheimer ‘s (1912) phenomenon-rich and epoch-making paper‘Experimentelle Studien über das Sehen von Bewegung’ (‘Experimentalstudies on seeing motion’). Although Wertheimer’s study primarilyaddressed the sensory processes underlying (stroboscopic) motionperception, it is also relevant to the study of masking and metacontrast.In fact, Wertheimer was aware of the potential relation between maskingand stroboscopic motion. For instance, he reported, as Schulz (1908)had done earlier, the suppressed visibility of one, usually the first, of thetwo stimuli used in stroboscopic motion. This was particularly true forthe type of motion called phi. Referring to the apparent rotation of(a) a flashed vertical toward (b) a subsequently flashed horizontal line,Wertheimer noted that:
in the extreme sense, the subject had no inkling that the vertical [first line] wasactually exposed . . . In the course of the experiments several cases resulted in which
METACONTRAST AND PARACONTRAST 17
one of the two exposed objects plainly was not seen, nor could it be imagined; and thesubject judged that only one was exposed; in regard to the other, perceived one, phimotion was clearly apparent either coming from the first (a) or alternately approachingthe second (b) locus [or stimulus] (Wertheimer 1912, p. 217, our translation).2
Moreover, Wertheimer was aware of prior work reporting maskingphenomena, and he cites Schumann’s description of an apparent explo-sion (Explodieren) or expansion of a stimulus at one location whenfollowed by a masking stimulus. Wertheimer did not emphasize thisaspect of his study, and therefore its importance and relation to meta-contrast and masking does not seem to have been clear to him.
What is important, however, is that, like Exner (1875) and morerecently Anstis and Moulden (1970), Wertheimer demonstrated thatstroboscopic motion could be obtained dichoptically. This, as noted byWertheimer, implicated the involvement of central or cortical mechan-isms in stroboscopic motion perception. Although not explicitly statedby Wertheimer, we can infer that the masking phenomenon accompan-ying stroboscopic motion under monocular or binocular viewing wasalso obtained here. Therefore, by extension of Wertheimer’s conclusion,masking also partakes of a central cortical component. Of additionalimportance is Wertheimer’s finding that differences between the colorsand shapes of the two successive stimuli did not eliminate stroboscopicmotion. What one perceived during the stroboscopic motion whenusing such heterogeneous stimuli was a transformation (Veränderung)from one color or pattern to the other, an observation later replicated byKolers and von Grünau (1976). It was as though the mechanismsproducing stroboscopic motion sensations were more or less unaffectedby those concerned with pattern or color discrimination.
Finally, Wertheimer also noted, as did Kolers and von Grünau (1977)more recently, the importance of attention in stroboscopic motion (and,by inference, in masking). The degree and smoothness of stroboscopicmotion depended on where one directed one’s attention and gaze. Ofcourse, in Wertheimer’s case, changes in the direction of attention andgaze may have been confounded with changes in the retinal location ofstimuli. As reported earlier by Exner (1888), the retinal periphery isparticularly sensitive to stroboscopic motion—an important fact, since,as Stigler (1910) had shown, metacontrast was also stronger under indi-rect rather than direct viewing of the edge separating the test from themasking flash. However, Werner (1935, Experiment 28), anticipating
A HISTORY OF VISUAL MASKING18
more recent findings (Enns and Di Lollo 1997; Ramachandran andCobb 1995), reported that the magnitude of metacontrast suppressiondepended on where an observer’s attention was covertly directed, thesuppression being stronger when spatial attention was directed awayfrom the location of the target.
Among his many phenomenal descriptions of metacontrast, Werner(1935) additionally made two that are particularly relevant to currentstudies of the temporal dynamics of object perception (Herzog and Koch2001; Macknik and Livingstone 1998) (see Chapter 2, sections 2.7.2 and2.7.3). In his Experiment 1, Werner (1935) repeatedly cycled a brief(12–25 ms) black target disk and an equally brief and black mask ringat variable meta- and paracontrast SOAs and observed the effects onthe visibility of the disk and the ring. He found that in certain ranges ofmeta- and paracontrast SOAs, the visibility of the disk was completelysuppressed while that of the ring was left standing. Werner (1935)found that this ‘standing-wave illusion’ (Macknik and Livingstone1998) was optimal when (i) the metacontrast SOA between the diskand the following ring was 120–240 ms and, in turn, (ii) the paracon-trast SOA between the ring and the next presentation of the disk was280–560 ms. In his Experiment 22, Werner (1935) also demonstratedthat the contour features of the target, even when its visibility issuppressed, become phenomenally attached to the contours of the ring.This ‘feature migration’ (Enns 2002), ‘feature inheritance’ (Herzog andKoch 2001), or ‘feature transposition’ (Wilson and Johnson 1985) isimportant not only because it demonstrates that invisible target infor-mation can nonetheless attach to the phenomenal representation of themask, but also because it raises interesting questions about the mechan-isms, and their spatiotemporal properties, that contribute to featureformation and feature binding.
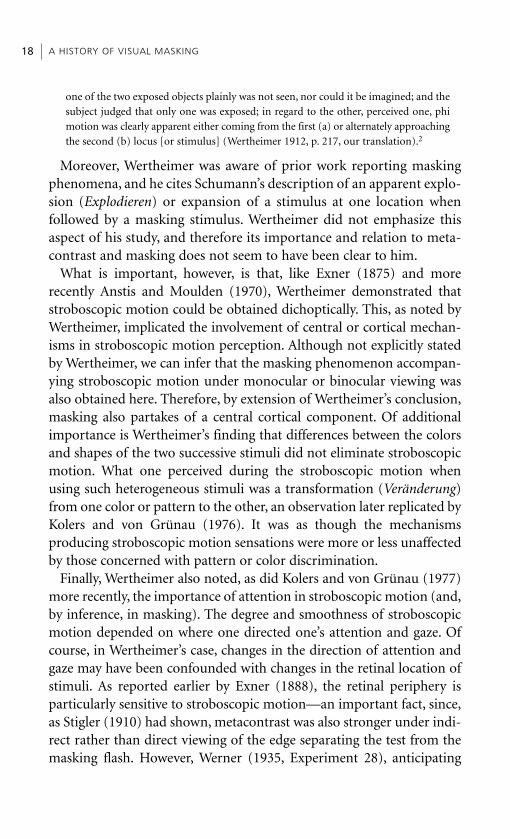
1.4. Masking by lightMasking by light is a form of visual masking in which a briefly flashed,uniformly illuminated field obscures the visibility of a prior or laterflashed target stimulus. In the history of masking, backward maskingby light (mask flash presented after target flash) had been employedextensively ever since Exner’s (1868) pioneering work on the timecourse and fate of visual sensations elicited by the leading target
MASKING BY LIGHT 19
stimulus (Baade 1917a,b; Baxt 1871; Cattell 1885a, 1886; Fröhlich 1923;Monjé 1927; Schumann 1899; Tigerstedt and Bergqvist 1883). The mainfindings of these studies can be summarized as follows: (i) the moreintense the after-coming mask flash, the less the visibility of the priortarget (e.g. another light flash, a letter, or a word (Baxt 1871; Cattell,1885a, 1886; Sperling 1965 (see his Fig. 2.5)); (ii) the greater thetemporal interval between prior target and succeeding mask, the weakerthe masking magnitude (Cattell 1885a, 1886; Schumann 1899; Sperling1965 (see his Fig. 2.5)). That is, with increasing temporal separation,backward masking by light is a monotonically decreasing or type Afunction (Kolers 1962). Most theoretical explanations of this maskingeffect offered then and subsequently (e.g. Eriksen 1966) followed fromthe sensory persistence hypothesis, according to which the sensoryresponse of the leading target stimulus persists in the form of a decayingpositive after-image that can be suppressed by integrating with theresponse of an after-coming mask.
In these early studies, the mask was used as a tool to monitor thetemporal processing stages (e.g. the response persistence) of the targetstimulus. However, as noted later by Sperling (1964), one can converselyuse the visibility of the target to monitor the time course of the sensoryresponse elicited by the mask. The latter approach was successfullyemployed and exploited by Crawford (1940, 1947) to investigate theeffects on a small test flash produced by the onset, duration, and offsetof a larger bright conditioning flash. Since the on- and offset of a con-ditioning flash produce sudden changes in the adaptation level of thevisual system, related studies on such adaptation effects are of primeimportance in the historical understanding of masking by light.
The study of the sensory effects of sudden changes, particularlysudden increases, in luminance has had a long history. McDougall(1904b) and Stigler (1908) cite the relevant work of Plateau, Exner, andHelmholtz in the first half and middle of the nineteenth century; andMcDougall (1904b) himself investigated the currently well-knowntransient overshoot and sudden decline in visual activity following anabrupt stimulus onset. These overshoots and subsequent declines inbrightness were well documented by Stainton (1928) and related notonly to the Broca–Sulzer effect (Broca and Sulzer 1902) but also tomasking effects such as metacontrast (Baumgardt and Segal 1942).Moreover, both light and dark adaptation were well known and
A HISTORY OF VISUAL MASKING20
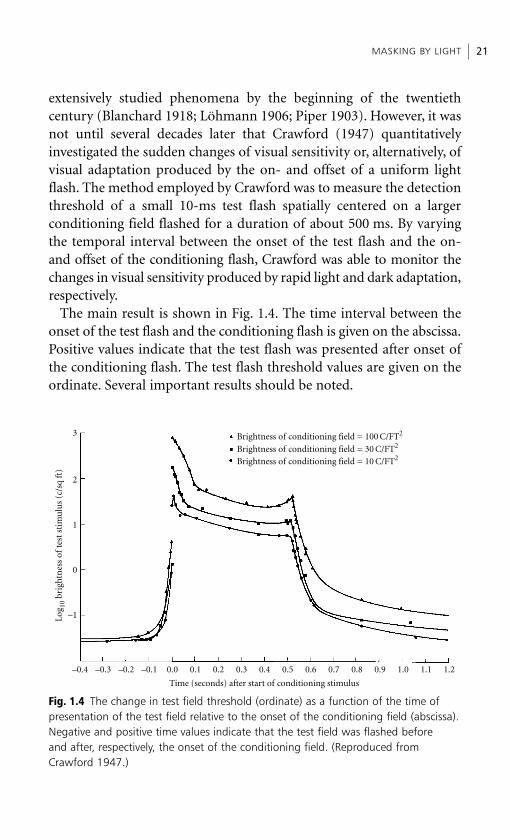
extensively studied phenomena by the beginning of the twentiethcentury (Blanchard 1918; Löhmann 1906; Piper 1903). However, it wasnot until several decades later that Crawford (1947) quantitativelyinvestigated the sudden changes of visual sensitivity or, alternatively, ofvisual adaptation produced by the on- and offset of a uniform lightflash. The method employed by Crawford was to measure the detectionthreshold of a small 10-ms test flash spatially centered on a largerconditioning field flashed for a duration of about 500 ms. By varyingthe temporal interval between the onset of the test flash and the on-and offset of the conditioning flash, Crawford was able to monitor thechanges in visual sensitivity produced by rapid light and dark adaptation,respectively.
The main result is shown in Fig. 1.4. The time interval between theonset of the test flash and the conditioning flash is given on the abscissa.Positive values indicate that the test flash was presented after onset ofthe conditioning flash. The test flash threshold values are given on theordinate. Several important results should be noted.
MASKING BY LIGHT 21
3
2
1
0
–1
–0.4 –0.3 –0.2 –0.1 0.0 0.1 0.2 0.3 0.4 0.5 0.6 0.7 0.8 0.9 1.0 1.1 1.2
Time (seconds) after start of conditioning stimulus
Log 10
bri
ghtn
ess
of te
st s
tim
ulu
s (c
/sq
ft)
Brightness of conditioning field = 100 C/FT2
Brightness of conditioning field = 30 C/FT2
Brightness of conditioning field = 10 C/FT2
Fig. 1.4 The change in test field threshold (ordinate) as a function of the time ofpresentation of the test field relative to the onset of the conditioning field (abscissa).Negative and positive time values indicate that the test field was flashed before and after, respectively, the onset of the conditioning field. (Reproduced fromCrawford 1947.)
1. The greater the intensity of the conditioning or masking flash, thegreater is the overall test flash threshold or, alternatively, the loweris the overall visual sensitivity.
2. The rise in test flash threshold occurs up to 100 ms before the onsetof the conditioning flash.
3. There are transient overshoots of the test flash threshold at and nearthe time of the on- and offset of the conditioning flash.
4. After offset, the immediate sensory effects of the conditioning flashare prolonged on the order of 200–300 ms, before assuming thelonger-lasting phase of dark adaptation.
The first and last of the results are merely replications of aforemen-tioned findings on (a) the increase in mask effectiveness with intensityand (b) sensory response persistence. It is the second and third resultsthat are of greater theoretical importance.
The problem posed to Crawford (1947) by the second result was toexplain how the visibility of a prior test flash is masked by a followingconditioning flash onset. He offered two alternate explanations that aresimilar to Stigler’s (1910) overtake and temporal integration accountsof metacontrast. He maintained that:
either the relatively strong conditioning stimulus overtakes the weaker test stimulus onits way from retina to brain and interferes with its transmission; or the process ofperception of the test stimulus, including the receptive processes in the brain, takes anappreciable time of the order of 0.1 s, so that the impression of the second (large) stimu-lus within this time interferes with the perception of the first. (Crawford 1947, p. 285)
Although Crawford (1947) noted the suddenness of the thresholdrise at onset and the presence of the smaller rise just prior to offset, hedoes not elaborate on these threshold rises or overshoots per se. Withhindsight, however, it turns out that these overshoots play very import-ant roles in theories of light and dark adaptation (Wald 1961; Baker1963). At issue in these theories are the adequacies of photochemicaland neural explanations of visual adaptation. As noted by Wald (1961),disproportionately large rises of visual threshold (e.g. the transientovershoots reported at onset or offset by Crawford (1947)) can accom-pany quite a small amount of bleaching of photopigments. Hence somenon-photochemical neural process also seems to contribute to thesedramatic changes of visual sensitivity. In fact, as Wald (1961) pointsout, evidence for such a neural component can be inferred from
A HISTORY OF VISUAL MASKING22
extrapolation of data reported as early as 1918 by Blanchard. Similarly,extrapolation of the results of Löhmann’s (1906) study suggests thepresence of a neural component in light adaptation; and independent,yet related, work by Bartley (1938) on brightness perception and byBernhard (1940) on electrophysiological correlates of light stimulationindicated that some of these neural components may be centrally orcortically located (Battersby et al. 1964). An earlier related view on therole of central mechanisms in backward masking by light flashes hadalready been expressed by Cattell (1885a, 1886).
1.5. Sensory response persistence and temporal integration in visionAs noted above, Crawford (1947) found that the sensory effectsproduced by a conditioning or masking flash outlasted its offset byseveral hundred milliseconds. The fact that sensory responses elicitedby a brief visual stimulus outlast its duration had been confirmed repeat-edly since the late nineteenth century (Aubert 1865; Baxt 1871; Cattell1885a, 1886; Charpentier 1890; D’Arcy 1773, cited by Boynton 1972;Exner 1868; Fechner 1840a,b; Fröhlich 1921, 1922a,b, 1923, 1929;Helmholtz 1866; Martius 1902; McDougall 1904a,b; Monjé 1931; Müller1834; Plateau 1834; Schumann 1899). Exner (1868) described the bright-ness sensation following a brief light stimulus in terms of a relatively fastrise toward a peak value followed by a more gradual decline or decay. Hedesignated that part of the primary sensation (Primärempfindung) thatoutlasted the stimulus as the ‘positive after-image’, and subsequentlyMonjé (1931) differentiated this primary sensation from the longer-lasting secondary after-images. We have seen above that in some form oranother (e.g. the metaphotic image) such visual persistence was an integ-ral part of theoretical explanations of metacontrast (Fry 1934; Stigler1910, 1926). In more recent nomenclature, Exner’s positive after-imageor Stigler’s metaphotic image correspond to what is termed iconicpersistence (Coltheart 1980; Neisser 1967). In fact, one of the major con-ceptualizations of iconic persistence is that it is basically a type of after-image (Hochberg 1968, 1978) whose source is, at least in one version,thought to reside in retinal receptor activity (Sakitt 1976; Turvey 1977).
The issue of whether iconic persistence is based on peripheral (retinal)or central (cortical) processes, or perhaps both—an issue which was
SENSORY RESPONSE PERSISTENCE AND TEMPORAL INTEGRATION 23
central to recent theories of iconic persistence (reviewed by Coltheart1980; Long 1980)—was already implied or even made explicit(Schumann 1899, cited by Baade 1917b, p. 123) in many of the investi-gations of the late nineteenth century cited previously. In order toaddress this issue historically, we shall introduce a more recent distinc-tion between previsible or neural and visible or phenomenal persistence(Coltheart 1980; Turvey 1978). By previsible persistence we meanthe neural response persistence at peripheral sites which, althoughcontributing to visible persistence, does not constitute it; by visiblepersistence we mean the persisting phenomenally observable image asso-ciated with some central cortical process activated by a brief stimulusflash. Such a distinction is not entirely without historical foundation, sinceit was at least implicit in the work of Baxt (1871), Cattell (1885a, 1886),Tigerstedt and Bergqvist (1883), Baade (1917b), and Monjé (1931).
Keeping this distinction in mind, let us look at the following methodsand principal findings on response persistence in vision that werereported between the mid-1800s and the early decades of the twentiethcentury. To our knowledge, four main methods of investigating visualpersistence were employed at or near the start of the twentieth century.One was a variation of the backward masking method introduced byExner (1868). The rationale of this method ran something as follows. Ifa brief stimulus is followed at some temporal interval by a maskingflash, the latter will in effect disrupt the processing of the positive after-image produced by the former stimulus. By determining the minimalinterval after offset of the first stimulus at which the later flash nolonger exerted its masking effect, one could infer that the sensoryeffects elicited by the prior stimulus must have persisted for at least thatminimal duration (Baade 1917b; Baxt 1871). A lower bound of visualpersistence could thus be established.
A second method, an adaptation of the one initially employed byD’Arcy (1773, cited by Boynton 1972), was to exploit the presence ofBidwell’s ghost and Charpentier bands produced by a rotating stimulus(see Fig. 1.2). Fröhlich (1921, 1922a,b, 1923, 1929) proposed the followingrationale. By measuring the spatial extent of the bands or ghosts trailinga moving stimulus (and subtracting the time required for the entirestimulus to move across a given point), one can, with knowledge ofthe velocity of the stimulus, determine the duration of any portionof the primary sensation that outlasts the presence of the stimulus.
A HISTORY OF VISUAL MASKING24

A third method was to measure the cff of a light source. The cff isdefined as the frequency at and above which the flickering stimulusappears steady rather than flickering. For example, Ferry (1892) reasonedthat one can estimate retinal persistence by measuring the temporalinterval between successive isochronal exposures of a flickering stimulusat which perceptual fusion just occurs. Finally, a fourth procedure relieson what is called the ‘seeing-more-than-there-is’ phenomenon(McCloskey and Watkins 1978) in which either a narrow vertical slit-aperture is moved left or right in front of a much wider stationarypattern display or the slit-aperture is stationary and the pattern display ismoved behind the aperture. At any moment, an observer has only a smallportion of the otherwise occluded pattern in view. However, despite thesemomentary limited views, as the aperture or the display move at optimalspeeds, the observer perceives the entire pattern of the display. Sincesome of the partial views of the pattern occur later in the motionsequence than others, these separate views must be integrated over timeto form a complete pattern percept, suggesting that at some level of thevisual system the activity produced by earlier views persists until at leastthe onset of the activity produced by later views. This phenomenon wasreported as early as the 1860s by, among others, Zöllner (1862),Helmholtz (1866), and Vierordt (1868). In addition to newer methods,variations of these four procedures have been employed more recently toinvestigate response persistence in vision (Allport 1970; Erwin 1976;Haber and Nathanson 1968; Meyer and Maguire 1977; Parks 1965; 1968,1970; Spencer 1969). These early methods yielded the following mainfindings that have been replicated more recently (see Coltheart 1980).
1. As the intensity of a stimulus increases, response persistencedecreases (Bowen et al. 1974; Exner 1868; Ferry 1892; Martius 1902;Monjé 1931).
2. As the photopic luminosity or physiological efficacy of a band-limited light source increases, persistence decreases (Ferry 1892).
3. As a corollary, variations in persistence are not attributable tovariations in wavelength (color) but rather to the covariations inphotopic luminosity (Ferry 1892).
4. Persistence decreases as light adaptation level increases (Fröhlich1923; Haber and Standing 1970; Schumann 1899, cited by Baade1917b, p. 111).
SENSORY RESPONSE PERSISTENCE AND TEMPORAL INTEGRATION 25
5. For durations smaller than the critical duration limiting temporalintegration (Bloch’s law; see McDougall (1904b)), persistencedecreases with increases in stimulus duration (Baroncz 1911;Bowen et al. 1974; Fröhlich 1923; Haber and Standing 1970;Martius 1902).
6. According to Exner (1868) persistence is greater foveally thanextrafoveally (Breitmeyer and Halpern 1978; Mezrich 1984),although subsequent work by Fröhlich (1923) indicated contraryfindings.
7. Visual persistence, at least for stimuli of intermediate intensity, islonger (by a factor of 21/2, indicating central binocular brightnesssummation between the two eyes) under monocular than underbinocular vision (Monjé 1931).
Up to now, these results, except the last one, indicate the importanceof peripheral sensory variables in determining persistence in vision. Assuch, they refer to what we have called previsible or neural persistence.The seventh or last finding pointed out the importance of binocularcompared with monocular vision, and suggested the possibility ofcentral cortical processes involved in determining brightness andpersistence. In fact, the work of Baxt (1871), Cattell (1885a, 1886), andSchumann (1899, cited by Baade 1917b) also pointed tentatively tothe involvement of such central processes.
Baxt (1871) used a backward masking technique to study the tempo-ral parameters of persistence in vision. When using three letters as atarget stimulus presented for 12.9 ms followed at varying interstimulusintervals (ISIs) by a second uniform flash of light of duration 55 ms,Baxt found that the target escaped the backward mask’s influence whenthe ISI was at least 57.9 ms. On the other hand, when, other things beingequal, the same subjects were required to recognize a more complicatedand hence difficult Lissajous figure, the critical ISI value increased to195.6 ms. Apparently the difficulty of the task determined how long thesensory trace must persist in order to recognize a stimulus correctly.
Unfortunately, a Lissajous figure is not only more complicated thanalphabetic characters but also contains finer detail and more figuralelaboration. Thus the greater difficulty associated with the Lissajousfigure may have tapped sensory rather than cognitive sources ofdifficulty. Baxt (1871) himself notes the fact that a stimulus containing
A HISTORY OF VISUAL MASKING26
small spatial differences, i.e. detail, requires a longer exposure durationor integration time in order to be recognized than do larger stimuli(Kahneman 1964). It follows that the longer mask-escape ISI and hencethe greater inferred response persistence of a Lissajous figure may becorrelated with a concomitant increase in the required temporal inte-gration time (Bowling and Lovegrove 1980, 1981). Related findings,interpretable along similar lines, can be found in Cattell’s (1885a, 1886)comparison of backward masking effects on letters composed of thesimpler Latin type as opposed to the more complicated and detailedGothic type.
However, that cognitive difficulty per se may affect response persist-ence in vision was demonstrated by Schumann (1899) in the followingstatement regarding recognition performance on words of (equal typebut) varying difficulty.
When, for example, one [briefly] exposes a word which is difficult to recognize, theexperimental subject experiences recognition problems when a mask follows the wordby 0.2 sec; whereas with a more easily recognized word, the perceptual image seemsalready to have decayed completely (cited by Baade 1917b, p. 123; our translation).
Baade stresses and elaborates this finding as follows: ‘the finding, thatthe afterimage of words read with difficulty persists longer than that ofeasily read ones, points via this strong influence of central factors, tothe fact that one must seek its seat at a central level’ (Baade 1917b,p. 123; our translation), a conclusion similarly and more recentlyarrived at by Erwin (1976).
What, if any, were some of the central factors one can infer from theseand contemporaneous works? Of prime significance was the factor ofeffort or activity (Tätigkeit) and attention (Aufmerksamkeit). We haveseen how this latter factor, in the form of directed gaze, played a role instroboscopic motion and metacontrast (Stigler 1910; Wertheimer1912). Reference to attentional variables in the study of basic sensoryprocesses had been made on numerous other occasions (Baade1917a,b; Exner 1888; Rubin 1929; Tigerstedt and Bergqvist 1883).Particularly significant is Baade’s (1917a,b) distinction between thepossible sensory and attentional effects of an after-coming mask onthe visibility of the prior target stimulus. Baade (1917a,b) notes that thesensory consequences of such a mask are often confounded with itsability to evoke and thus divert attention from the target or test stimulus.As such, Baade implicitly raised the possibility of non-sensory
SENSORY RESPONSE PERSISTENCE AND TEMPORAL INTEGRATION 27
cognitive masking mechanisms (Enns and Di Lollo 1997; Michaels andTurvey 1979), and hence undermined his own rationale of using back-ward masking to index visuosensory persistence and his conclusionthat such persistence is influenced by central factors.
The stage of visual processing at which such attentional maskingmight play its role was, to our knowledge, not made explicit in any ofthe above investigations. However, there is some implicit indicationthat it was conceived of as intervening between conscious registrationof a stimulus and its recognition or cognitive categorization (Cattell1885a, 1886; Tigerstedt and Bergqvist 1883). Tigerstedt and Bergqvistemployed the following distinction initially made by Wundt in histreatise Physiologische Psychologie (Physiological Psychology). Wundtpartitioned the psychophysical process into three stages of which thefirst two were (i) the entry of the visual impression into consciousness,otherwise designated perception, and (ii) the entry of the consciousimpression into the focal point of awareness, otherwise designatedapperception. The former is similar to Neisser’s (1967) and Treisman’s(1988) more recent notion of preattentive process; the latter, of course,is similar to a focally attentive process. An alternative to Wundt’sperception stage or the preattentive process is the notion of iconicmemory or persistence, a level of (parallel) visual processing at whicha literal visual and visible representation of the stimulus is givenwithout its yet being further processed, identified, or cognitively cat-egorized. The latter focal recognition process presumably requireseffort or attention. It is at this transitional stage from perception(iconic memory) to apperception (focal awareness or recognition)where, according to Tigerstedt and Bergqvist (1883), attention wouldexert its role. In more recent masking terminology, attention isdiverted from or interrupted at this stage so that, in turn, the transferof information from a precategorical feature representation or icon ofthe stimulus to a higher object or categorical representation is alsointerrupted (Enns and Di Lollo 1997; Michaels and Turvey 1979). Inthis regard, using a backward masking technique, Tigerstedt andBergqvist (1883) determined that the rate at which information istransferred from the perception to the apperception stage averagedone stimulus item per 13.8 ms; a rate very similar to that determinedby Sperling (1963), Scharf et al. (1966), and Scharf and Lefton (1970)in more recent times.
A HISTORY OF VISUAL MASKING28
What is the fate of items not so transferred? Cattell made the followingrelevant observations on what he called ‘the limits of consciousness’:
In making these experiments I notice that the impressions [of briefly exposed letters,words, or sentences] crowd simultaneously into my consciousness, but beyond acertain number, leave traces too faint for me to grasp. Though unable to give theimpression, I can often tell, if asked, whether a certain one was present or not. This isespecially marked in the case of long sentences; I have a curious feeling of havingknown the sentence and having forgotten it. The traces of impressions beyond the lim-its of consciousness seem very similar to those left by my dreams. (Cattell 1885a; p.312)
One can infer from Cattell’s observation that the process of focallyattending to and cognitively grasping these visual impressions or iconstakes time and effort; and since these iconic impressions decay ratherrapidly, not all of them can be transferred into focal awareness.
1.6. SummaryOne of the major tasks undertaken by visual scientists in the latter halfof the nineteenth century was the identification of (i) perceptualelements or building blocks and (ii) the stage or stages at which theseelemental components were processed during perceptual microgenesis.Under various guises this program has continued to the present,although its limitations were pointed out then as they still are now.
The initial emphasis of this program was on establishing the timecourse of sensation and perception. In this context, the discovery thatthe duration of sensations could outlast that of the brief stimuli pro-ducing them gave visual persistence a central role. Determining itsintensive and temporal properties was a major project in which twovarieties of masking were employed. For instance, we noted that lateralmasking (para- and metacontrast) was unwittingly employed by,among others, Exner to index sensory intensity over time, since heassumed the absence of spatial contrast effects. However, at about thesame time, estimates of visual persistence also quite wittingly employedbackward masking by light.
The former paradigm, with a shift of emphasis to spatial interactions,led to the early twentieth century studies of meta- and paracontrast byStigler, although both lateral masking effects had already been investig-ated several decades earlier, without naming them as such, bySherrington and McDougall. The latter paradigm of masking by lighthighlights, for one, its disruptive effects on central cognitive processes
SUMMARY 29

such as attention and, what has been called more recently, read-out oficonic information. Moreover, it took a significant turn in Crawford’sinvestigation of early light and dark adaptation. Here the mask orconditioning flash was no longer used to index the persisting responseto a brief prior stimulus; instead, a brief test probe—flashed before,during, and after the mask—was employed to monitor the response ofthe visual system to the mask.
Besides anticipating and defining many of the more global issues,problems, and paradigms surrounding visual information processingas presently studied, the history of visual masking and persistence alsoshows that many of the specific findings, methods, and theoriesreported in the past anticipated those found in the more recently pub-lished literature (e.g. Geremek et al. 2002). Although many new empir-ically and theoretically important findings in the study of visual mask-ing and related phenomena have been placed under the spotlight, theirconnection to the past, although not always acknowledged, is one ofmethodical and gradual refinement and elaboration. Consequently, ourhistory of visual masking exemplifies the history of a scientific disciplinein its normal-science phase.
Notes1. In his initial metacontrast investigation Stigler (1910) also failed to obtain dichoptic
metacontrast. He, like Alpern (1953), interpreted this result as indicating a peripheralretinal locus of metacontrast interaction. However, Stigler’s explanation differed fromAlpern’s in that the response integration hypothesis was maintained in the context ofhypothetical inhibitory lateral interactions transmitted between adjacent receptors viahorizontal cells (Exner 1898), whereas Alpern’s theoretical explanation rests on thefaster cone response being able to overtake and inhibit the slower rod response.
2. Wertheimer (1912, p.226) also notes the disappearance of both vertical and horizontallines when they were presented alternately in back-and-forth sequence. This sequentialblanking is similar to the aforementioned temporally staggered metacontrast effectsreported by Piéron (1935). That is, the two stimuli were alternated at a temporal ratesuch that each was able to mask the brightness and contour aspects of the other, buteach left unmasked the neural information producing stroboscopic motion perception.This and other observations by Wertheimer are, to our knowledge, the first cleardemonstrations of a perceptual dissociation of brightness or contour perception andmotion perception. Unfortunately, Wertheimer failed to explore further this psy-chophysical segregation of figural and motion aspects of a stimulus sequence, and toour knowledge such a segregation or distinction was not made again until it wasmentioned by Saucer (1954).
A HISTORY OF VISUAL MASKING30
Chapter 2
Methods, applications, and findings in visual pattern masking
2.1. IntroductionIn visual pattern masking the visibility of one stimulus pattern, calledthe ‘target’, is reduced by another stimulus pattern, called the ‘mask’.Visual masking has been and continues to be used as a powerfulpsychophysical tool for investigating pattern-processing mechanismsunder steady-state viewing conditions (Dakin and Hess 1997; Foleyand Chen 1997; Glennerster and Parker 1997; McKee et al. 1994a;Mussap and Levi 1997; Stromeyer and Julesz 1972). Although it isimportant for theoretical and practical reasons to understand thesteady-state properties of pattern vision, in this chapter we focus onthe dynamic properties of visual pattern processing.
The rationale for investigating dynamic masking rests on the followingpreconditions. First, some period of time, usually of the order of a fewtens or hundreds of milliseconds, is required after a stimulus impingeson the retinae before it either affects behavior or is consciouslyperceived. Secondly, active processing of the information conveyed by astimulus occurs during the interval between retinal input and behavioror conscious percept. Thirdly, there are several processing pathways,each with several levels or stages of processing required before a behav-ioral response or visual awareness is generated. Fourthly, the responseto a mask stimulus can interact with the response to the target stimulusat specifiable levels of processing and thus affect the visibility of thetarget. Finally, humans are mobile visual explorers and, owing tofrequent shifts of gaze when we inspect the world of objects and events,vision is by definition a highly dynamic process. Given the usual two tofour fixations per second, behaviorally relevant as well as phenomen-ally rich representations must be modified or newly constructed by
the visual system in a period of time lasting from about 250 to 500 ms.Thus even the manifest steady-state properties of visual experienceduring a fixation period rely on highly dynamic underlying neuralprocesses that must be updated several times per second. According tothis dynamical system point of view, the visual system may be operatingdominantly in a transient regime. Within this conceptual framework,various masking methods can be employed to investigate the timecourse, pathways, and stages of visual information processing requiredfor control of behavior or perception. Thus masking provides a powerfultool for studying the microgenesis not only of behavioral control butalso of visual awareness.
The information garnered from such masking studies depends onthe choice of a number of display, stimulus, timing, and task parameters.Display parameters include the luminance and wavelength of the back-ground on which the target and mask stimuli are presented. Stimulusparameters include the shape, size, luminance, wavelength, retinaleccentricity, number, and degree of spatial overlap of the target andmask patterns. Timing parameters include the duration of the targetand mask stimuli as well as the time interval, most commonly expressedin terms of SOA, separating the target and mask stimuli. Task parametersinclude the viewing condition (i.e. monocular, binocular, or dichoptic),and the response (e.g. visibility rating, luminance matching, forced-choice pattern discrimination, or reaction time) used in the maskingstudy. By varying SOA and any one or more of the other parameters,we can infer from the results how, in what pathways, and at what stagesof visual processing the responses to the target and mask interact. Inparticular, by examining how masking magnitude varies with SOA wecan infer the process of object formation, i.e. the microgenesis of objectperception unfolding after a stimulus impinges on the retina until,some 300 ms later, its conscious registration occurs. Of course, suchinferences also rely significantly on our detailed anatomical andphysiological knowledge of the primate visual system and onneuropsychological findings in humans.
Over the years, reviews of methods, findings, and theories relevant tovisual masking have been provided elsewhere (Bachmann 1994;Breitmeyer and Ganz 1976; Breitmeyer and Ögmen 2000; Fox 1978;Kahneman 1968; Lefton 1973; Scheerer 1973; Weisstein 1972). We shallprovide an updated review and analysis of methods and findings in the
METHODS, APPLICATIONS, AND FINDINGS IN VISUAL PATTERN MASKING32
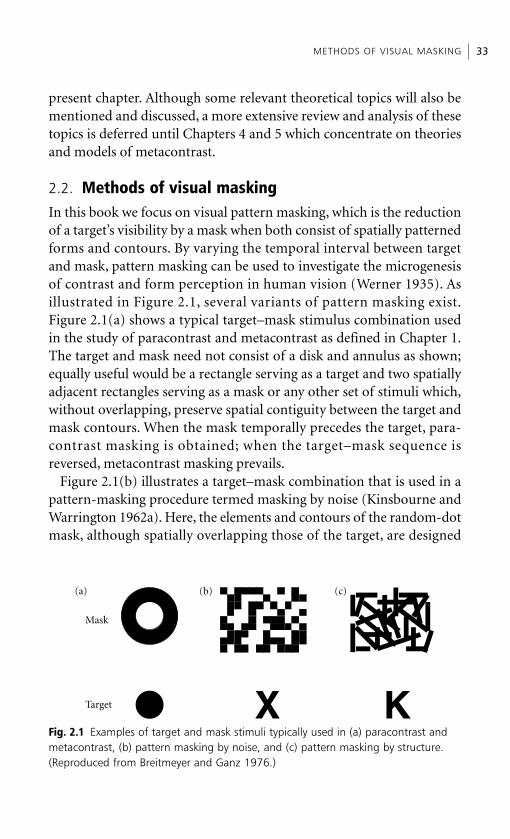
present chapter. Although some relevant theoretical topics will also bementioned and discussed, a more extensive review and analysis of thesetopics is deferred until Chapters 4 and 5 which concentrate on theoriesand models of metacontrast.
2.2. Methods of visual maskingIn this book we focus on visual pattern masking, which is the reductionof a target’s visibility by a mask when both consist of spatially patternedforms and contours. By varying the temporal interval between targetand mask, pattern masking can be used to investigate the microgenesisof contrast and form perception in human vision (Werner 1935). Asillustrated in Figure 2.1, several variants of pattern masking exist.Figure 2.1(a) shows a typical target–mask stimulus combination usedin the study of paracontrast and metacontrast as defined in Chapter 1.The target and mask need not consist of a disk and annulus as shown;equally useful would be a rectangle serving as a target and two spatiallyadjacent rectangles serving as a mask or any other set of stimuli which,without overlapping, preserve spatial contiguity between the target andmask contours. When the mask temporally precedes the target, para-contrast masking is obtained; when the target–mask sequence isreversed, metacontrast masking prevails.
Figure 2.1(b) illustrates a target–mask combination that is used in apattern-masking procedure termed masking by noise (Kinsbourne andWarrington 1962a). Here, the elements and contours of the random-dotmask, although spatially overlapping those of the target, are designed
METHODS OF VISUAL MASKING 33
Mask
Target
(a) (b) (c)
Fig. 2.1 Examples of target and mask stimuli typically used in (a) paracontrast andmetacontrast, (b) pattern masking by noise, and (c) pattern masking by structure.(Reproduced from Breitmeyer and Ganz 1976.)
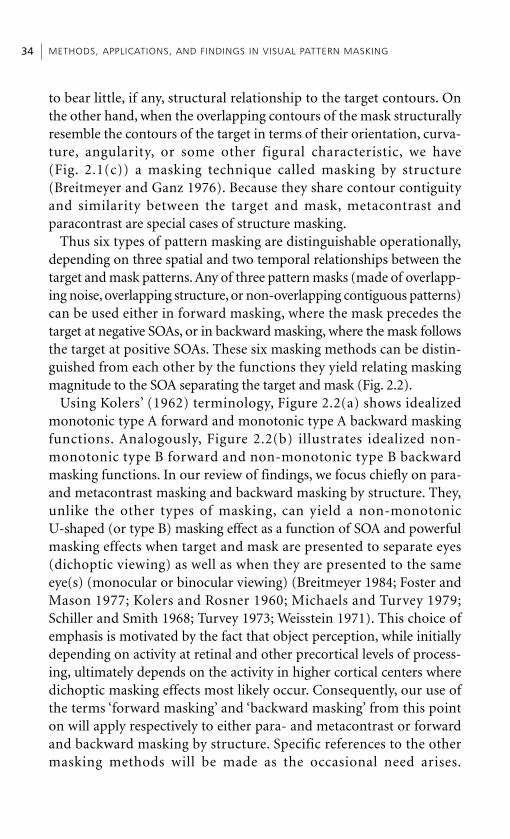
to bear little, if any, structural relationship to the target contours. Onthe other hand, when the overlapping contours of the mask structurallyresemble the contours of the target in terms of their orientation, curva-ture, angularity, or some other figural characteristic, we have(Fig. 2.1(c)) a masking technique called masking by structure(Breitmeyer and Ganz 1976). Because they share contour contiguityand similarity between the target and mask, metacontrast andparacontrast are special cases of structure masking.
Thus six types of pattern masking are distinguishable operationally,depending on three spatial and two temporal relationships between thetarget and mask patterns. Any of three pattern masks (made of overlapp-ing noise, overlapping structure, or non-overlapping contiguous patterns)can be used either in forward masking, where the mask precedes thetarget at negative SOAs, or in backward masking, where the mask followsthe target at positive SOAs. These six masking methods can be distin-guished from each other by the functions they yield relating maskingmagnitude to the SOA separating the target and mask (Fig. 2.2).
Using Kolers’ (1962) terminology, Figure 2.2(a) shows idealizedmonotonic type A forward and monotonic type A backward maskingfunctions. Analogously, Figure 2.2(b) illustrates idealized non-monotonic type B forward and non-monotonic type B backwardmasking functions. In our review of findings, we focus chiefly on para-and metacontrast masking and backward masking by structure. They,unlike the other types of masking, can yield a non-monotonicU-shaped (or type B) masking effect as a function of SOA and powerfulmasking effects when target and mask are presented to separate eyes(dichoptic viewing) as well as when they are presented to the sameeye(s) (monocular or binocular viewing) (Breitmeyer 1984; Foster andMason 1977; Kolers and Rosner 1960; Michaels and Turvey 1979;Schiller and Smith 1968; Turvey 1973; Weisstein 1971). This choice ofemphasis is motivated by the fact that object perception, while initiallydepending on activity at retinal and other precortical levels of process-ing, ultimately depends on the activity in higher cortical centers wheredichoptic masking effects most likely occur. Consequently, our use ofthe terms ‘forward masking’ and ‘backward masking’ from this pointon will apply respectively to either para- and metacontrast or forwardand backward masking by structure. Specific references to the othermasking methods will be made as the occasional need arises.
METHODS, APPLICATIONS, AND FINDINGS IN VISUAL PATTERN MASKING34
METHODS OF VISUAL MASKING 35
Fig. 2.2 Schematic representation of masking functions: (a) unimodal type Aforward and backward; (b) unimodal type B forward and backward; (c) bimodalforward; (d) bimodal backward; (e) multimodal oscillatory backward.
Forward
Targ
et v
isib
ility
Targ
et v
isib
ility
Backward
Type A(a)
Forward Backward
Type B(b)
Backward
Bimodal(d)
Backward
(e) Multimodal(oscillatory)
Forward
Bimodal(c)
Stimulus onset asynchrony
Stimulus onset asynchrony
0 0
0
0
0
Figures 2.2(c), 2.2(d), and 2.2(e) show the finer multimodal structureof masking functions revealed by recent studies. A more detaileddiscussion of the fine morphology of masking functions will be givenin the following sections.
2.3. Applications and uses of pattern maskingThe study of pattern masking is informative for several reasons. First,the phenomenon of backward pattern masking is interesting in its ownright because of the counter-intuitive finding that the mask can impedethe visibility of the target even though the target is presented first(Bachmann 1994; Breitmeyer 1984; Breitmeyer and Ögmen 2000; Ennsand Di Lollo 1997). Several competing quantitative models as wellqualitative explanations of this phenomenon have been proposed inthe last two decades, and of course testing them requires the study ofpattern masking. We will review these models and explanations insubsequent chapters.
Secondly, models of visual pattern masking may be relevant to ourunderstanding of a variety of spatiotemporal phenomena such asmotion perception, visual persistence, on- and offset reaction time, anddiscrimination of temporal order (Breitmeyer 1984). In particular,several recent neural-network models (Bachmann 1994; Francis 1997;Ögmen 1993; Breitmeyer and Ögmen 2000) to be discussed in Chapters4 and 5 can account for backward masking as well as many otherspatiotemporal phenomena.
Thirdly, visual processing is a dynamic temporally evolving phenom-enon (VanRullen and Thorpe 2001), and pattern masking can be a use-ful tool to investigate the temporal sequence and levels of visualinformation processing involved in the recognition of stimuli rangingfrom simple geometric forms to faces (Loffler et al. 2005) or complexscenes (Bacon-Macé et al. 2005; Rieger et al. 2005). Several psychophys-ical (Bachmann 1984; Bowen and Wilson 1994; Michaels and Turvey1979; Muise et al. 1991; Turvey 1973) and neurophysiologicalapproaches (Bridgeman 1975, 1980; Kovács et al. 1995; Macknik andLivingstone 1998; Rolls et al. 1999; Thompson and Schall 1999) havebeen developed. Past and recent psychophysical applications (e.g.Carrasco et al. 2002; Rauschenberger and Yantis 2001) have often sim-ply assumed that the after-coming mask acts to ‘erase’ or add ‘noise’ tovisual information or to ‘interrupt’ or ‘terminate’ its further processing.A clearer understanding of underlying mechanisms producing sucherasure, noise addition, interruption, or termination (Kahneman 1968;Scheerer 1973; Sperling 1963) is required for the informed use ofmasking as a methodological tool.
METHODS, APPLICATIONS, AND FINDINGS IN VISUAL PATTERN MASKING36
Fourthly, higher-level visuocognitive processes can modulate visualmasking and vice versa. For instance, the effects of masking are influ-enced by perceptual grouping and figure–ground segmentation (Calisand Leeuwenberg 1981; Caputo 1998; Kahan and Mathis 2002; Kurylo1997; Wolf et al. 1995), by deployment of selective visual attention(Boyer and Ro, in press; Enns and Di Lollo 1997; Havig et al. 1998;Kirschfeld and Kammer 1999, 2000; Michaels and Turvey 1979;Ramachandran and Cobb 1995; Scharlau and Neumann 2003; Shelley-Tremblay and Mack 1999; P.L. Smith 2000; P.L. Smith and Wolfgang2004; Tata 2002; Tata and Giashi 2004; Weisstein 1966), and by thegeneration of visual imagery (Reeves 1980). As noted by Breitmeyerand Ögmen (2000), the role of gestalt grouping and attention in back-ward masking is currently of particular theoretical interest. Moreover,masking plays a significant role in studies of the temporal parameterscharacterizing visual attention (Shapiro 2001), especially in studies ofthe attentional blink (Brehaut et al. 1999; Breitmeyer et al. 1999;Dehaene et al. 2003; Dell’Acqua et al. 2003; Enns et al. 2001; Giesbrechtand Di Lollo 1998; Giesbrecht et al. 2003; Grandison et al. 1997; Seiffertand Di Lollo 1997) in which a rapid serial visual presentation (RSVP)task is used.
Fifthly, and closely related, backward masking has recently been usedto explore visual awareness (Bachmann 1997; Dennett 1991) and itsimplications for the controversial field of ‘subliminal’ perception(Duncan 1985; Holender 1986; Kihlstrom 1996; Marcel 1983a,b). Thefact that information rendered unavailable to conscious report becauseof visual pattern masking can nonetheless influence a variety of motor,cognitive, and emotional processes has been repeatedly established inrecent years (Ansorge 2003; Ansorge et al. 1998; Dehaene et al. 2001;Dimberg et al. 2000; Dolan 2002; Eimer 1999; Eimer and Schlaghecken1998, 2002; Esteves and Öhman 1993; Klotz and Neumann 1999; Klotzand Wolff 1995; Merikle and Joordens 1997; Morris and Dolan 2001;Neumann and Klotz 1994; Öhman 2002; Ortells et al. 2003; Taylor andMcCloskey 1990; Whalen et al. 1998; Wong and Root 2003).
Sixthly, visual masking has been and continues to be used to studycertain clinical anomalies related to vision and brain function,such as amblyopia (Tytla and McAdie 1981; Tytla and Steinbach1984), closed head injury (Mattson et al. 1994), Parkinson’s disease
APPLICATIONS AND USES OF PATTERN MASKING 37
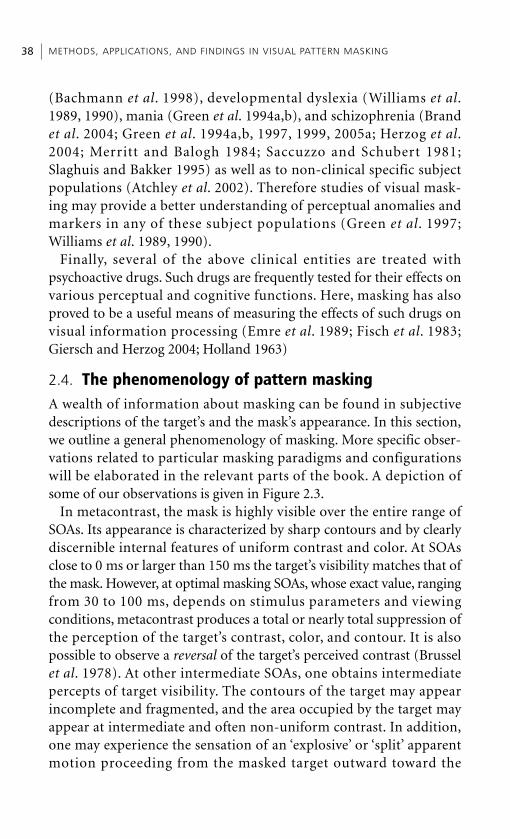
(Bachmann et al. 1998), developmental dyslexia (Williams et al.1989, 1990), mania (Green et al. 1994a,b), and schizophrenia (Brandet al. 2004; Green et al. 1994a,b, 1997, 1999, 2005a; Herzog et al.2004; Merritt and Balogh 1984; Saccuzzo and Schubert 1981;Slaghuis and Bakker 1995) as well as to non-clinical specific subjectpopulations (Atchley et al. 2002). Therefore studies of visual mask-ing may provide a better understanding of perceptual anomalies andmarkers in any of these subject populations (Green et al. 1997;Williams et al. 1989, 1990).
Finally, several of the above clinical entities are treated withpsychoactive drugs. Such drugs are frequently tested for their effects onvarious perceptual and cognitive functions. Here, masking has alsoproved to be a useful means of measuring the effects of such drugs onvisual information processing (Emre et al. 1989; Fisch et al. 1983;Giersch and Herzog 2004; Holland 1963)
2.4. The phenomenology of pattern maskingA wealth of information about masking can be found in subjectivedescriptions of the target’s and the mask’s appearance. In this section,we outline a general phenomenology of masking. More specific obser-vations related to particular masking paradigms and configurationswill be elaborated in the relevant parts of the book. A depiction ofsome of our observations is given in Figure 2.3.
In metacontrast, the mask is highly visible over the entire range ofSOAs. Its appearance is characterized by sharp contours and by clearlydiscernible internal features of uniform contrast and color. At SOAsclose to 0 ms or larger than 150 ms the target’s visibility matches that ofthe mask. However, at optimal masking SOAs, whose exact value, rangingfrom 30 to 100 ms, depends on stimulus parameters and viewingconditions, metacontrast produces a total or nearly total suppression ofthe perception of the target’s contrast, color, and contour. It is alsopossible to observe a reversal of the target’s perceived contrast (Brusselet al. 1978). At other intermediate SOAs, one obtains intermediatepercepts of target visibility. The contours of the target may appearincomplete and fragmented, and the area occupied by the target mayappear at intermediate and often non-uniform contrast. In addition,one may experience the sensation of an ‘explosive’ or ‘split’ apparentmotion proceeding from the masked target outward toward the
METHODS, APPLICATIONS, AND FINDINGS IN VISUAL PATTERN MASKING38
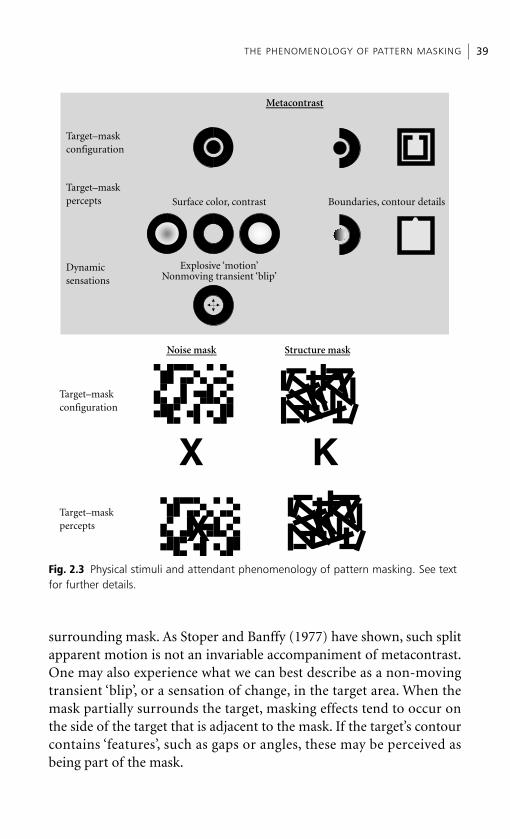
surrounding mask. As Stoper and Banffy (1977) have shown, such splitapparent motion is not an invariable accompaniment of metacontrast.One may also experience what we can best describe as a non-movingtransient ‘blip’, or a sensation of change, in the target area. When themask partially surrounds the target, masking effects tend to occur onthe side of the target that is adjacent to the mask. If the target’s contourcontains ‘features’, such as gaps or angles, these may be perceived asbeing part of the mask.
THE PHENOMENOLOGY OF PATTERN MASKING 39
Fig. 2.3 Physical stimuli and attendant phenomenology of pattern masking. See textfor further details.
Target–maskconfiguration
Target–maskpercepts Surface color, contrast Boundaries, contour details
Dynamicsensations
Explosive ‘motion’Nonmoving transient ‘blip’
Metacontrast
Target–maskconfiguration
Noise mask Structure mask
Target–maskpercepts
2.5. Forward masking (paracontrast)Up to now, the numbers and types of stimulus dimensions that mayaffect the magnitude and form of the paracontrast function have notbeen investigated sufficiently. Although one can infer from resultsreported by Breitmeyer et al. (1981b) that the effective range oftarget–mask spatial separations is more limited in paracontrast than inmetacontrast, systematic research on the effects of stimulus size, retinallocation, target–mask spatial separation, and their interactions remainsto be done. Nevertheless, scattered reports of several stimulus andresponse variables affecting the paracontrast function have beenpublished. For instance, paracontrast can yield either type B or type Amasking functions depending on the experimental task required of theobserver (Alpern 1953; Kolers and Rosner 1960; Lefton and Newman1976; Pulos et al. 1980; Weisstein 1972). When suppression of bright-ness or contrast is used as an indicator of the masking effect, type Bfunctions are obtained (Growney et al. 1977; Kolers and Rosner 1960;Weisstein 1972). Here, target suppression is maximal when the maskleads the target by about 30–50 ms. Moreover, the magnitude of theeffect decreases as target–mask spatial separation increases (Blanc-Garin 1973; Growney et al. 1977; Kolers and Rosner 1960) and increasesas the mask energy increases relative to the target energy (Alpern 1953;Weisstein 1972). As noted, the type B effect can also be obtaineddichoptically (Foster and Mason 1977; Kolers and Rosner 1960), indi-cating that paracontrast occurs when the target and mask responsesinteract at or beyond the level of binocular combination, presumablysomewhere in the visual cortex or beyond.
A type A paracontrast effect has been reported by Lefton andNewman (1976). In this study mask-produced changes of target detec-tion rather than of its perceived brightness or contrast was used as anindicator of masking. At each target–mask SOA, duration thresholdsfor target detection were measured, with longer threshold durationsindicating stronger masking. Masking was strongest near target–masksynchrony and declined monotonically as the temporal intervalseparating the mask from the lagging target increased.
This dependence of the type of paracontrast effect on task variablespoints out the importance of the role of criterion content in visualmasking (Kahneman 1968). Criterion content refers to the stimulusdimension along which an observer makes his or her perceptual
METHODS, APPLICATIONS, AND FINDINGS IN VISUAL PATTERN MASKING40
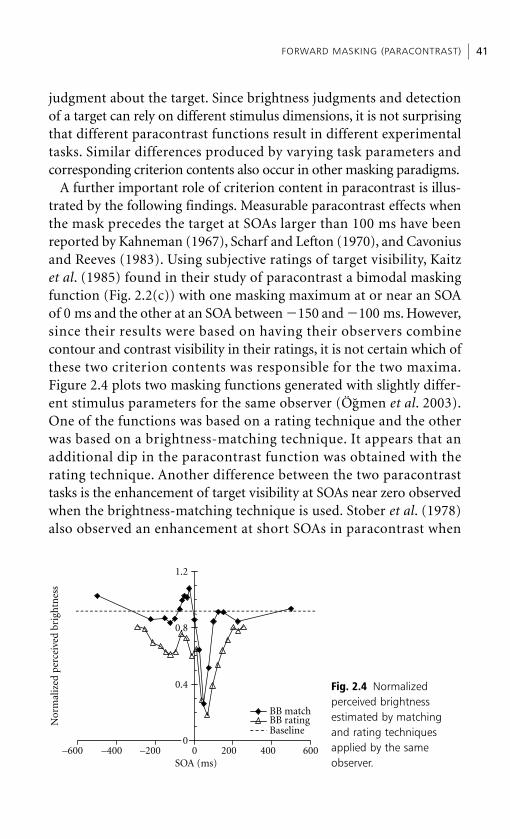
judgment about the target. Since brightness judgments and detectionof a target can rely on different stimulus dimensions, it is not surprisingthat different paracontrast functions result in different experimentaltasks. Similar differences produced by varying task parameters andcorresponding criterion contents also occur in other masking paradigms.
A further important role of criterion content in paracontrast is illus-trated by the following findings. Measurable paracontrast effects whenthe mask precedes the target at SOAs larger than 100 ms have beenreported by Kahneman (1967), Scharf and Lefton (1970), and Cavoniusand Reeves (1983). Using subjective ratings of target visibility, Kaitzet al. (1985) found in their study of paracontrast a bimodal maskingfunction (Fig. 2.2(c)) with one masking maximum at or near an SOAof 0 ms and the other at an SOA between �150 and �100 ms. However,since their results were based on having their observers combinecontour and contrast visibility in their ratings, it is not certain which ofthese two criterion contents was responsible for the two maxima.Figure 2.4 plots two masking functions generated with slightly differ-ent stimulus parameters for the same observer (Ögmen et al. 2003).One of the functions was based on a rating technique and the otherwas based on a brightness-matching technique. It appears that anadditional dip in the paracontrast function was obtained with therating technique. Another difference between the two paracontrasttasks is the enhancement of target visibility at SOAs near zero observedwhen the brightness-matching technique is used. Stober et al. (1978)also observed an enhancement at short SOAs in paracontrast when
FORWARD MASKING (PARACONTRAST) 41
BB match BB ratingBaseline
0.4
0.8
1.2
–600 –400 –200 0 200 400 600SOA (ms)
Nor
mal
ized
per
ceiv
ed b
righ
tnes
s
0
Fig. 2.4 Normalizedperceived brightnessestimated by matchingand rating techniquesapplied by the sameobserver.
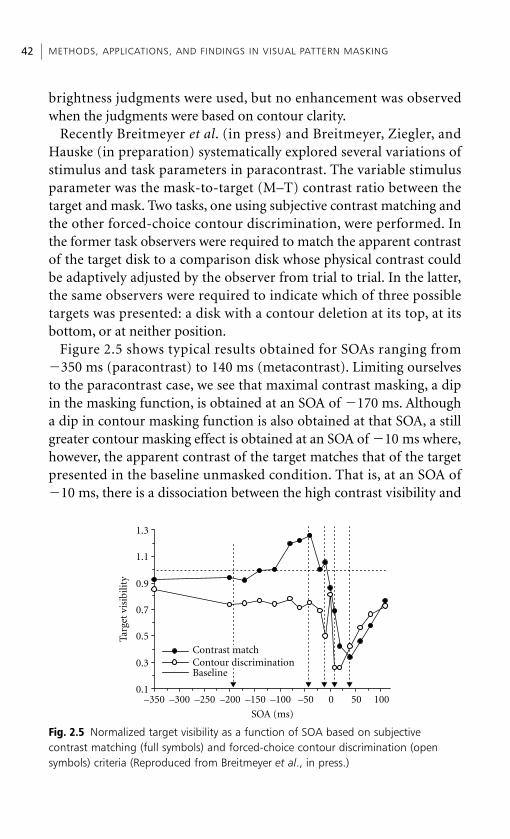
brightness judgments were used, but no enhancement was observedwhen the judgments were based on contour clarity.
Recently Breitmeyer et al. (in press) and Breitmeyer, Ziegler, andHauske (in preparation) systematically explored several variations ofstimulus and task parameters in paracontrast. The variable stimulusparameter was the mask-to-target (M–T) contrast ratio between thetarget and mask. Two tasks, one using subjective contrast matching andthe other forced-choice contour discrimination, were performed. Inthe former task observers were required to match the apparent contrastof the target disk to a comparison disk whose physical contrast couldbe adaptively adjusted by the observer from trial to trial. In the latter,the same observers were required to indicate which of three possibletargets was presented: a disk with a contour deletion at its top, at itsbottom, or at neither position.
Figure 2.5 shows typical results obtained for SOAs ranging from�350 ms (paracontrast) to 140 ms (metacontrast). Limiting ourselvesto the paracontrast case, we see that maximal contrast masking, a dipin the masking function, is obtained at an SOA of �170 ms. Althougha dip in contour masking function is also obtained at that SOA, a stillgreater contour masking effect is obtained at an SOA of �10 ms where,however, the apparent contrast of the target matches that of the targetpresented in the baseline unmasked condition. That is, at an SOA of�10 ms, there is a dissociation between the high contrast visibility and
METHODS, APPLICATIONS, AND FINDINGS IN VISUAL PATTERN MASKING42
0.1
0.3
0.5
0.7
0.9
1.1
1.3
–350 –300 –250 –200 –150 –100 –50 0 50 100
SOA (ms)
Targ
et v
isib
ility
Baseline
Contrast matchContour discrimination
Fig. 2.5 Normalized target visibility as a function of SOA based on subjectivecontrast matching (full symbols) and forced-choice contour discrimination (opensymbols) criteria (Reproduced from Breitmeyer et al., in press.)
the minimal contour visibility of the target. Thus it appears that themaximal paracontrast masking effect is obtained at long SOAs (�200to �100 ms) when apparent contrast is the criterion content, and atshorter SOAs (�40 to 0 ms) when contour or figural identity (Kolersand Rosner 1960) is the criterion content. In agreement with theseresults, Stober et al. (1978) reported stronger paracontrast maskingwith a contour discrimination criterion than with a brightness criterionat SOAs between �50 and 0 ms. However, in their data the dip inparacontrast was at an SOA of 0 ms. Notwithstanding this difference,these data taken together indicate that surface contrast and form con-tour are processed by different neural substrates. Moreover, Breitmeyeret al. (in preparation) showed that both contrast and contour maskingeffects are obtained dichoptically as well as monoptically, thus impli-cating a cortical site for both types of paracontrast masking.
It is also interesting that, at SOAs ranging from �140 to �20 ms,there is a relative enhancement of the target’s contrast visibility but notof its contour visibility. In addition to reinforcing the dissociationbetween contrast and contour visibility, the contrast visibility resultsindicate that a mask preceding the target can enhance the visibility ofsome of its attributes, in this case its contrast. Related enhancements oftarget visibility by a preceding mask have been reported previously byMichaels and Turvey (1979) and Bachmann (1988, 1994), and arerelevant for assessments of Bachmann’s perceptual-retouch approachto masking discussed in Chapter 4, section 4.5.2.
2.6. MetacontrastMetacontrast masking can also produce type A or type B functions,and again the type and magnitude of the function depends on theexperimental task and stimulus parameters. Here we review experi-mental findings of metacontrast in the context of the following generalvariables: task parameters and criterion content, stimulus (target,mask, and background) parameters, and viewing condition.
2.6.1. Task parameters and criterion content
A most crucial, yet little understood and often neglected, aspect ofmasking concerns the range of criterion contents that observers canuse when making perceptual or behavioral decisions about the target(Kahneman 1968). That task parameters and associated criterion
METACONTRAST 43
contents can affect performance in visual masking is a well-documented fact (Bernstein et al. 1973b, 1976; Breitmeyer et al., inpress; Delord 1998; Haber 1969; Hernandez and Lefton 1977; Hoferet al. 1989; Kahneman 1968; Petry 1978; Proctor et al. 1983; Stoberet al. 1978; Ventura 1980). Such effects are most aptly illustrated whenone compares the types of metacontrast functions obtained in a simpletarget detection or target reaction time task with those obtained intasks requiring either subjective judgments of target contrast or forced-choice identification of its form or contour.
Type B metacontrast functions are generally obtained with suppres-sion of the target’s brightness or contrast (Alpern 1953; Flaherty andMatteson 1971; Growney and Weisstein 1972; Ögmen et al. 2003;Weisstein 1972; Weisstein et al. 1970), its contour or contour detail(Breitmeyer 1978a; Breitmeyer et al. 1974; Burchard and Lawson 1973;Enns and Di Lollo 1997; Gilden et al. 1988; Hofer et al. 1989; Stoberet al. 1978; Tata 2002; Werner 1935; Westheimer and Hauske 1975) orof its form or figural identity (Averbach and Coriell 1961; Weissteinand Haber 1965; Weisstein et al. 1970).
Even here, the use of different criterion contents can yield differentmetacontrast functions. In particular, as shown by Stoper andMansfield (1978), metacontrast suppresses the visibility of thecontourless area, usually characterized by a uniform brightness orcolor, enclosed by, and well away from, the edges or boundaries of atarget stimulus. Stoper and Mansfield (1978) called this type of masking‘area suppression’ and argued that masking results depend on twodistinct mechanisms. One processes the contour or boundary contrastof a stimulus, and the other, related to perceptual filling-in (Gerrits andTimmerman 1969; Gerrits and Vendrik 1970), processes the brightnessor area contrast. The distinction between boundary and area contrasthas been known for some time (Hering 1878; Mach 1865), and wasattributed by von Békésy (1969) to ‘Mach-type’ and ‘Hering-type’lateral inhibition. More recently, it has been correlated with corticalneural responses to the boundary of a stimulus that precede the neuralresponses to the interior of the stimulus by about 100 ms (Lee et al.1995). Moreover, as noted by Breitmeyer and Ögmen (2000), the dis-tinction between boundary- and area-contrast effects in metacontrastmay be related conceptually to the distinction between the boundarycontour system (BCS) and the feature contour system (FCS) proposed
METHODS, APPLICATIONS, AND FINDINGS IN VISUAL PATTERN MASKING44
by Grossberg and coworkers (Grossberg 1987, 1994; Grossberg andMingolla 1985a,b; Grossberg and Todorovic 1988). Paradiso andNakayama (1991) investigated the spatial and temporal parametersaffecting brightness perception and filling-in using a forward–backwardmasking paradigm. Related studies of brightness perception andfilling-in have been extended to texture segregation (Caputo 1998;Motoyoshi 1999). Based on their extensive findings, Paradiso andNakayama (1991) and Motoyoshi (1999) note that their results poseproblems for several extant models of masking and metacontrast thatrely on lateral contour-inhibiting processes. Like Stoper and Mansfield(1978), they propose the necessity of filling-in processes to explaintheir results.
The study by Breitmeyer et al. (in press) mentioned previously alsoindicates a distinction between contour-specific and contrast-specificprocesses not only in paracontrast (section 2.4) but also in metacontrast.As Figure 2.5 shows, for identical stimuli, the optimal metacontrast SOAsfor target contrast and target contour suppression are 10 ms and 40 ms,respectively. Together with the paracontrast results, these results suggestthat two separate processes characterized by different temporal para-meters are activated by the target. Whereas the metacontrast data indicatethat the activation of the contour-specific process precedes that ofthe contrast-specific process by about 30 ms, the paracontrast dataindicate that the timing differences between the respective activationsmay be larger. Further research is warranted to clear up these apparentlyconflicting results. Stober et al. (1978) reported metacontrast functionsof different shapes based on brightness versus contour clarity judg-ments. In general, at small SOAs metacontrast was weaker when asubjective contour clarity criterion was used than when a subjectivebrightness criterion was used. Thus, while there is overall agreementbetween studies that different metacontrast functions are obtainedwhen using brightness versus contour judgments, the nature of thedifferences and their relation to stimulus parameters remain to beexplored further.
Type B functions can also be obtained when a choice reaction timetask is employed in which the subject must respond as fast as possibleto one of several possible targets on the basis of its discriminablefigural properties (Eriksen and Eriksen 1972). Here, choice reactiontime to a target can reach a maximum at some intermediate positive
METACONTRAST 45
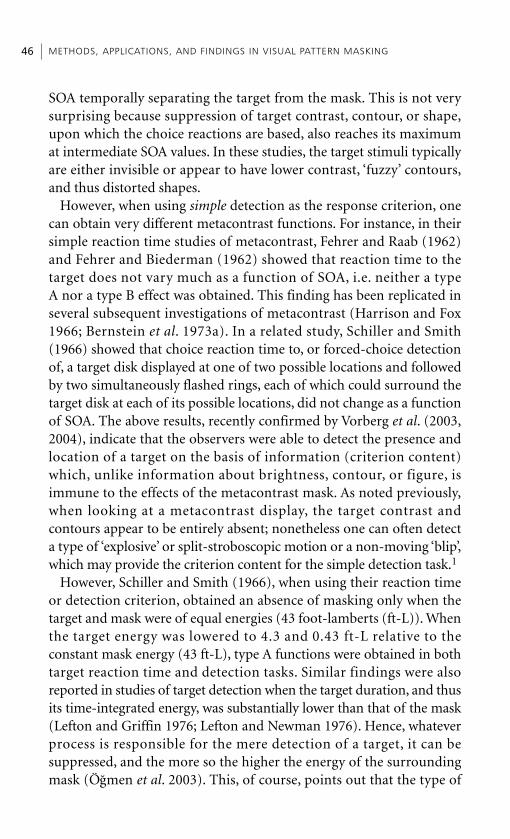
SOA temporally separating the target from the mask. This is not verysurprising because suppression of target contrast, contour, or shape,upon which the choice reactions are based, also reaches its maximumat intermediate SOA values. In these studies, the target stimuli typicallyare either invisible or appear to have lower contrast, ‘fuzzy’ contours,and thus distorted shapes.
However, when using simple detection as the response criterion, onecan obtain very different metacontrast functions. For instance, in theirsimple reaction time studies of metacontrast, Fehrer and Raab (1962)and Fehrer and Biederman (1962) showed that reaction time to thetarget does not vary much as a function of SOA, i.e. neither a typeA nor a type B effect was obtained. This finding has been replicated inseveral subsequent investigations of metacontrast (Harrison and Fox1966; Bernstein et al. 1973a). In a related study, Schiller and Smith(1966) showed that choice reaction time to, or forced-choice detectionof, a target disk displayed at one of two possible locations and followedby two simultaneously flashed rings, each of which could surround thetarget disk at each of its possible locations, did not change as a functionof SOA. The above results, recently confirmed by Vorberg et al. (2003,2004), indicate that the observers were able to detect the presence andlocation of a target on the basis of information (criterion content)which, unlike information about brightness, contour, or figure, isimmune to the effects of the metacontrast mask. As noted previously,when looking at a metacontrast display, the target contrast andcontours appear to be entirely absent; nonetheless one can often detecta type of ‘explosive’ or split-stroboscopic motion or a non-moving ‘blip’,which may provide the criterion content for the simple detection task.1
However, Schiller and Smith (1966), when using their reaction timeor detection criterion, obtained an absence of masking only when thetarget and mask were of equal energies (43 foot-lamberts (ft-L)). Whenthe target energy was lowered to 4.3 and 0.43 ft-L relative to theconstant mask energy (43 ft-L), type A functions were obtained in bothtarget reaction time and detection tasks. Similar findings were alsoreported in studies of target detection when the target duration, and thusits time-integrated energy, was substantially lower than that of the mask(Lefton and Griffin 1976; Lefton and Newman 1976). Hence, whateverprocess is responsible for the mere detection of a target, it can besuppressed, and the more so the higher the energy of the surroundingmask (Ögmen et al. 2003). This, of course, points out that the type of
METHODS, APPLICATIONS, AND FINDINGS IN VISUAL PATTERN MASKING46
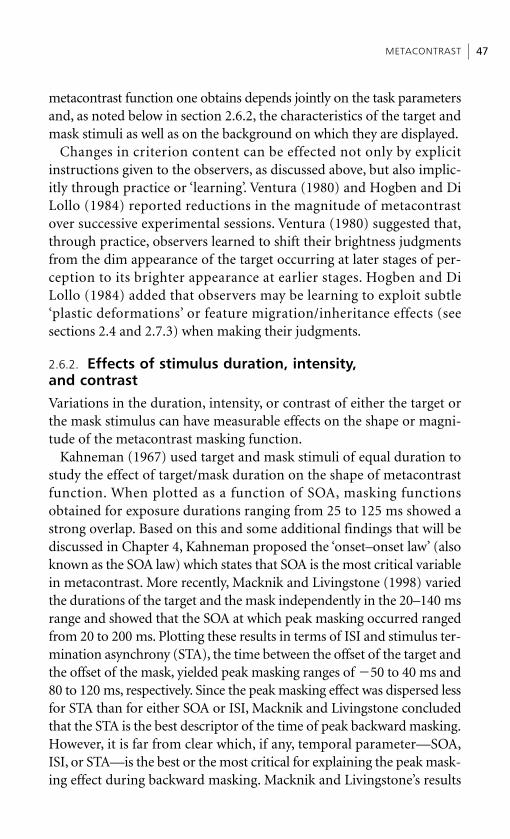
metacontrast function one obtains depends jointly on the task parametersand, as noted below in section 2.6.2, the characteristics of the target andmask stimuli as well as on the background on which they are displayed.
Changes in criterion content can be effected not only by explicitinstructions given to the observers, as discussed above, but also implic-itly through practice or ‘learning’. Ventura (1980) and Hogben and DiLollo (1984) reported reductions in the magnitude of metacontrastover successive experimental sessions. Ventura (1980) suggested that,through practice, observers learned to shift their brightness judgmentsfrom the dim appearance of the target occurring at later stages of per-ception to its brighter appearance at earlier stages. Hogben and DiLollo (1984) added that observers may be learning to exploit subtle‘plastic deformations’ or feature migration/inheritance effects (seesections 2.4 and 2.7.3) when making their judgments.
2.6.2. Effects of stimulus duration, intensity, and contrast
Variations in the duration, intensity, or contrast of either the target orthe mask stimulus can have measurable effects on the shape or magni-tude of the metacontrast masking function.
Kahneman (1967) used target and mask stimuli of equal duration tostudy the effect of target/mask duration on the shape of metacontrastfunction. When plotted as a function of SOA, masking functionsobtained for exposure durations ranging from 25 to 125 ms showed astrong overlap. Based on this and some additional findings that will bediscussed in Chapter 4, Kahneman proposed the ‘onset–onset law’ (alsoknown as the SOA law) which states that SOA is the most critical variablein metacontrast. More recently, Macknik and Livingstone (1998) variedthe durations of the target and the mask independently in the 20–140 msrange and showed that the SOA at which peak masking occurred rangedfrom 20 to 200 ms. Plotting these results in terms of ISI and stimulus ter-mination asynchrony (STA), the time between the offset of the target andthe offset of the mask, yielded peak masking ranges of �50 to 40 ms and80 to 120 ms, respectively. Since the peak masking effect was dispersed lessfor STA than for either SOA or ISI, Macknik and Livingstone concludedthat the STA is the best descriptor of the time of peak backward masking.However, it is far from clear which, if any, temporal parameter—SOA,ISI, or STA—is the best or the most critical for explaining the peak mask-ing effect during backward masking. Macknik and Livingstone’s results
METACONTRAST 47
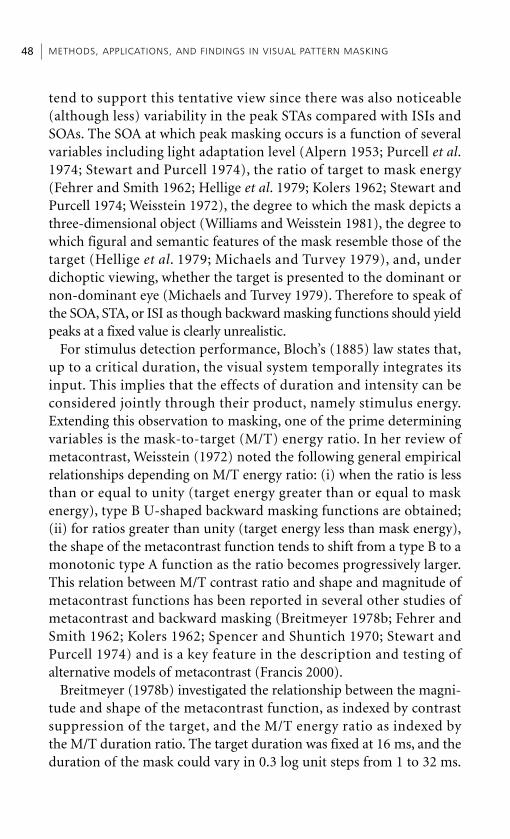
tend to support this tentative view since there was also noticeable(although less) variability in the peak STAs compared with ISIs andSOAs. The SOA at which peak masking occurs is a function of severalvariables including light adaptation level (Alpern 1953; Purcell et al.1974; Stewart and Purcell 1974), the ratio of target to mask energy(Fehrer and Smith 1962; Hellige et al. 1979; Kolers 1962; Stewart andPurcell 1974; Weisstein 1972), the degree to which the mask depicts athree-dimensional object (Williams and Weisstein 1981), the degree towhich figural and semantic features of the mask resemble those of thetarget (Hellige et al. 1979; Michaels and Turvey 1979), and, underdichoptic viewing, whether the target is presented to the dominant ornon-dominant eye (Michaels and Turvey 1979). Therefore to speak ofthe SOA, STA, or ISI as though backward masking functions should yieldpeaks at a fixed value is clearly unrealistic.
For stimulus detection performance, Bloch’s (1885) law states that,up to a critical duration, the visual system temporally integrates itsinput. This implies that the effects of duration and intensity can beconsidered jointly through their product, namely stimulus energy.Extending this observation to masking, one of the prime determiningvariables is the mask-to-target (M/T) energy ratio. In her review ofmetacontrast, Weisstein (1972) noted the following general empiricalrelationships depending on M/T energy ratio: (i) when the ratio is lessthan or equal to unity (target energy greater than or equal to maskenergy), type B U-shaped backward masking functions are obtained;(ii) for ratios greater than unity (target energy less than mask energy),the shape of the metacontrast function tends to shift from a type B to amonotonic type A function as the ratio becomes progressively larger.This relation between M/T contrast ratio and shape and magnitude ofmetacontrast functions has been reported in several other studies ofmetacontrast and backward masking (Breitmeyer 1978b; Fehrer andSmith 1962; Kolers 1962; Spencer and Shuntich 1970; Stewart andPurcell 1974) and is a key feature in the description and testing ofalternative models of metacontrast (Francis 2000).
Breitmeyer (1978b) investigated the relationship between the magni-tude and shape of the metacontrast function, as indexed by contrastsuppression of the target, and the M/T energy ratio as indexed bythe M/T duration ratio. The target duration was fixed at 16 ms, and theduration of the mask could vary in 0.3 log unit steps from 1 to 32 ms.
METHODS, APPLICATIONS, AND FINDINGS IN VISUAL PATTERN MASKING48
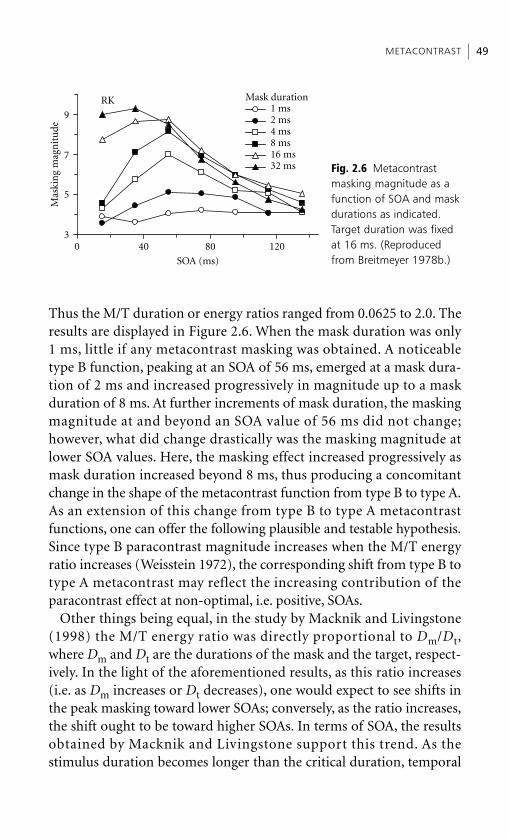
Thus the M/T duration or energy ratios ranged from 0.0625 to 2.0. Theresults are displayed in Figure 2.6. When the mask duration was only1 ms, little if any metacontrast masking was obtained. A noticeabletype B function, peaking at an SOA of 56 ms, emerged at a mask dura-tion of 2 ms and increased progressively in magnitude up to a maskduration of 8 ms. At further increments of mask duration, the maskingmagnitude at and beyond an SOA value of 56 ms did not change;however, what did change drastically was the masking magnitude atlower SOA values. Here, the masking effect increased progressively asmask duration increased beyond 8 ms, thus producing a concomitantchange in the shape of the metacontrast function from type B to type A.As an extension of this change from type B to type A metacontrastfunctions, one can offer the following plausible and testable hypothesis.Since type B paracontrast magnitude increases when the M/T energyratio increases (Weisstein 1972), the corresponding shift from type B totype A metacontrast may reflect the increasing contribution of theparacontrast effect at non-optimal, i.e. positive, SOAs.
Other things being equal, in the study by Macknik and Livingstone(1998) the M/T energy ratio was directly proportional to Dm/Dt,where Dm and Dt are the durations of the mask and the target, respect-ively. In the light of the aforementioned results, as this ratio increases(i.e. as Dm increases or Dt decreases), one would expect to see shifts inthe peak masking toward lower SOAs; conversely, as the ratio increases,the shift ought to be toward higher SOAs. In terms of SOA, the resultsobtained by Macknik and Livingstone support this trend. As thestimulus duration becomes longer than the critical duration, temporal
METACONTRAST 49
SOA (ms)
Mas
kin
g m
agn
itu
de
3
5
7
9
0 40 80 120
1 ms2 ms4 ms8 ms16 ms32 ms
RK Mask duration
Fig. 2.6 Metacontrastmasking magnitude as afunction of SOA and maskdurations as indicated.Target duration was fixedat 16 ms. (Reproducedfrom Breitmeyer 1978b.)
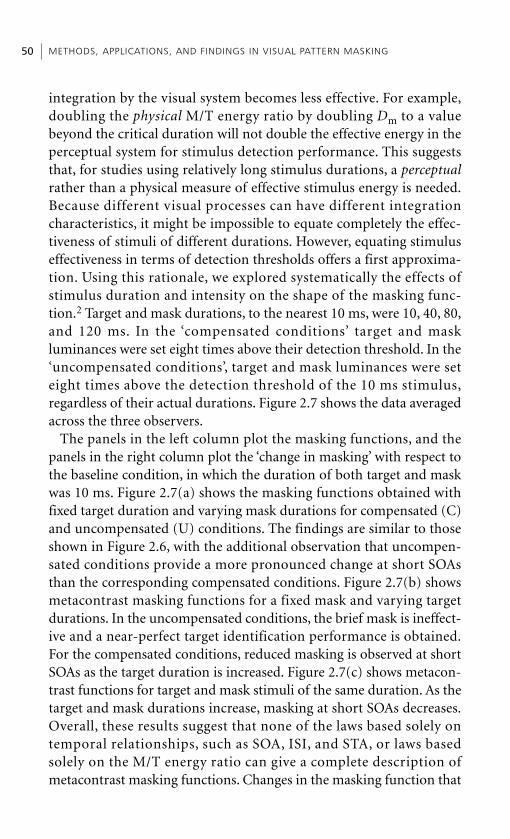
integration by the visual system becomes less effective. For example,doubling the physical M/T energy ratio by doubling Dm to a valuebeyond the critical duration will not double the effective energy in theperceptual system for stimulus detection performance. This suggeststhat, for studies using relatively long stimulus durations, a perceptualrather than a physical measure of effective stimulus energy is needed.Because different visual processes can have different integrationcharacteristics, it might be impossible to equate completely the effec-tiveness of stimuli of different durations. However, equating stimuluseffectiveness in terms of detection thresholds offers a first approxima-tion. Using this rationale, we explored systematically the effects ofstimulus duration and intensity on the shape of the masking func-tion.2 Target and mask durations, to the nearest 10 ms, were 10, 40, 80,and 120 ms. In the ‘compensated conditions’ target and maskluminances were set eight times above their detection threshold. In the‘uncompensated conditions’, target and mask luminances were seteight times above the detection threshold of the 10 ms stimulus,regardless of their actual durations. Figure 2.7 shows the data averagedacross the three observers.
The panels in the left column plot the masking functions, and thepanels in the right column plot the ‘change in masking’ with respect tothe baseline condition, in which the duration of both target and maskwas 10 ms. Figure 2.7(a) shows the masking functions obtained withfixed target duration and varying mask durations for compensated (C)and uncompensated (U) conditions. The findings are similar to thoseshown in Figure 2.6, with the additional observation that uncompen-sated conditions provide a more pronounced change at short SOAsthan the corresponding compensated conditions. Figure 2.7(b) showsmetacontrast masking functions for a fixed mask and varying targetdurations. In the uncompensated conditions, the brief mask is ineffect-ive and a near-perfect target identification performance is obtained.For the compensated conditions, reduced masking is observed at shortSOAs as the target duration is increased. Figure 2.7(c) shows metacon-trast functions for target and mask stimuli of the same duration. As thetarget and mask durations increase, masking at short SOAs decreases.Overall, these results suggest that none of the laws based solely ontemporal relationships, such as SOA, ISI, and STA, or laws basedsolely on the M/T energy ratio can give a complete description ofmetacontrast masking functions. Changes in the masking function that
METHODS, APPLICATIONS, AND FINDINGS IN VISUAL PATTERN MASKING50
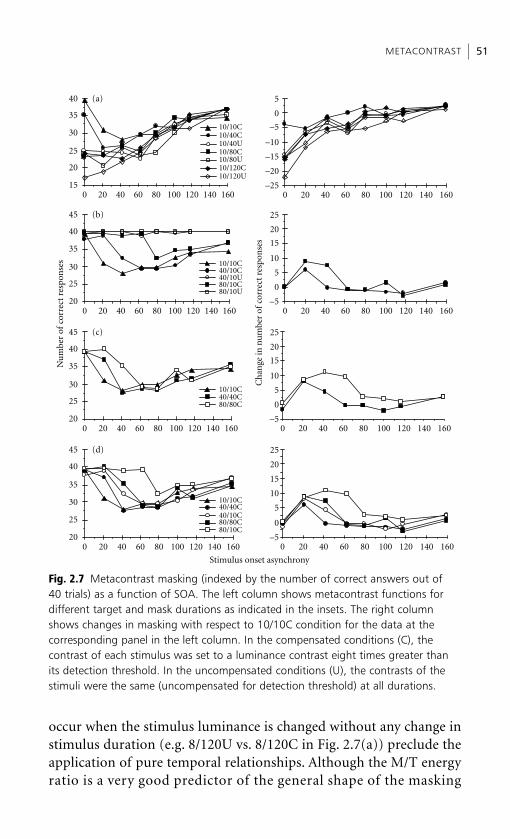
METACONTRAST 51
Fig. 2.7 Metacontrast masking (indexed by the number of correct answers out of 40 trials) as a function of SOA. The left column shows metacontrast functions fordifferent target and mask durations as indicated in the insets. The right columnshows changes in masking with respect to 10/10C condition for the data at the corresponding panel in the left column. In the compensated conditions (C), thecontrast of each stimulus was set to a luminance contrast eight times greater thanits detection threshold. In the uncompensated conditions (U), the contrasts of thestimuli were the same (uncompensated for detection threshold) at all durations.
15
20
25
30
35
40
0 20 40 60 80 100 120 140 160
10/10C10/40C10/40U10/80C10/80U10/120C10/120U
–25
–20
–15
–10
–5
0
5
0 20 40 60 80 100 120 140 160
20
25
30
35
40
45
0 20 40 60 80 100 120 140 160
10/10C40/10C40/10U80/10C80/10U
–5
0
5
10
15
20
25
0 20 40 60 80 100 120 140 160
20
25
30
35
40
45
0 20 40 60 80 100 120 140 160
10/10C40/40C80/80C
–5
0
5
10
15
20
25
0 20 40 60 80 100 120 140 160
20
25
30
35
40
45
0 20 40 60 80 100 120 140 160
10/10C40/40C40/10C80/80C80/10C
–5
0
5
10
15
20
25
0 20 40 60 80 100 120 140 160
Stimulus onset asynchrony
Nu
mbe
r of
cor
rect
res
pon
ses
Ch
ange
in n
um
ber
of c
orre
ct r
espo
nse
s
(a)
(b)
(d)
(c)
occur when the stimulus luminance is changed without any change instimulus duration (e.g. 8/120U vs. 8/120C in Fig. 2.7(a)) preclude theapplication of pure temporal relationships. Although the M/T energyratio is a very good predictor of the general shape of the masking

function, it cannot give a complete description of these functions, ascan be seen by the changes that occur in masking functions withoutany change in the M/T energy ratio (Fig. 2.7(c)). Figure 2.7(d) showsall stimulus conditions where a decrease in masking is observedcompared with the briefest stimulus condition. By inspecting the leftcolumn of Figure 2.7, we can conclude that changes in metacontrastfunction occur at relatively short SOAs. This finding can clearly be seenin the plots in the right column. An increase in mask (target) energy, byan increase either in luminance or in duration, causes an increased(decreased) masking at short SOAs. Furthermore, as can be seen fromFigures 2.7(c) and 2.7(d), an increase in target energy producesa greater change than an equal increase in mask energy.
These findings, as well as related ones recently reported by Di Lolloet al. (2004), are important for several reasons. First, the results of therecent parametric study by Di Lollo et al. suggest that the most suitabletemporal descriptor of peak metacontrast masking takes us back tosquare one; the best descriptor is neither ISI, as argued by Francis(1997), nor STA, as argued by Macknik and Livingstone (1998), butSOA, as originally suggested by Kahneman (1967). A second, metho-logical, reason is that they have clear implications for explanations ofbackward masking and metacontrast. Since, as illustrated above, type Abackward masking effects can obscure type B effects when the M/Tenergy ratio is substantially greater than 1.0, experiments failing toobtain type B effects, without specifying the M/T energy ratio, cannotbe used unequivocally as evidence against possible underlying mechan-isms responsible for generating type B effects (e.g. Eriksen et al.1970). Only a type A metacontrast function obtained with a M/Tenergy ratio less than 1.0 and with a brightness, contour discrimina-tion, or form-identification task would pose a problem for theories oftype B metacontrast. However, to our knowledge no study has everreported such a result. Another reason that they are important is thatthe smooth transition from type B to type A functions as the M/T ratioincreases, of the sort shown in Figures 2.6 and 2.7(a), represents therule. It is important to note that at all SOAs the magnitude of the typeB effect always remains equal to or less than that of the type A effect.However, an important exception to that empirical regularity hasrecently been reported by Francis and Herzog (2004), who comparedthe visibility of a misaligned vernier target when masked by four
METHODS, APPLICATIONS, AND FINDINGS IN VISUAL PATTERN MASKING52
adjacent (metacontrast) elements with its visibility when it was maskedby an overlapping grating mask comprised of 25 aligned vernierelements. In the former case, masking magnitude varied in the typicalU-shaped manner with SOA; in the latter case, it varied in a type Amanner. Despite being less energetic, the four-element mask producedstronger rather than weaker masking at the intermediate SOAs of40–100 ms. Hence these results contradict the general findings shownin Figure 2.3. This is probably because the grating mask, in conjunctionwith the brief 10-ms target, produces a newly discovered phenomenonknown as the shine-through effect (Herzog and Koch, 2001), in whichthe vernier target appears to shine through the grating mask, often inexaggerated form. The shine-through effect and its companion, featureinheritance, are discussed more fully in section 2.6.3 below.
An exception to the broad unimodal (i.e. with a single maximum)type A/type B classification of metacontrast functions occurs forspatiotemporally localized stimuli. In a series of experiments, Vrolijkand van der Wildt (van der Wildt and Vrolijk 1981; Vrolijk and van derWildt 1982, 1985) reported bimodal metacontrast functions, i.e. withtwo extrema (Fig. 2.2(d)). More recently, using similar stimuli,Purushothaman et al. (2000) and Fotowat et al. (in press) showed thatmetacontrast functions can be oscillatory (Fig. 2.2(e)). These findingsand their clinical implications (Green et al. 1999; Wynn et al., 2005)will be discussed in more detail in Chapter 9.
2.6.3. Effects of background luminance and adaptation level
In the above studies, M/T energy ratio varied while the adaptation leveldetermined by the background intensity was generally constant. Purcellet al. (1974) investigated not only the effects of M/T energy ratio butalso the effects of background intensity. They measured metacontrasteffects when the target and mask were flashed against either a darkbackground or a background at a luminance of 40 ft-L. U-shapedmasking functions were obtained at each background intensity and ateach M/T energy ratio. However, at the low background intensity thepeak of the U-shaped metacontrast functions tended to shift to lowerSOA values than at the high background intensity. Similar results havebeen reported by Stewart and Purcell (1974) under transient darkadaptation interposed between target and mask flashes. A similar shift
METACONTRAST 53
toward lower SOA values of peak type B metacontrast occurs when theintensity of the target and mask are both varied from high to lowvalues. In particular, Alpern (1953) found that, as stimulus energiesranged from a high of 3000 ft-L to a low of 3.6 ft-L, not only themetacontrast magnitude decreased but also the SOA at which peakmetacontrast occurred shifted from 125 ms to approximately 75 ms.
2.6.4. Effects of stimulus contrast polarity
Most studies of metacontrast have usually employed target and maskstimuli with a contrast of the same sign, i.e. both stimuli were eitherdark-on-light surrounds or light-on-dark surrounds. Using a detectiontask, Sherrick et al. (1974) reported metacontrast suppression of bothblack and white targets by either black or white masks. However, theyused a target duration of 15 ms, a mask duration of 100 ms, and an ISIof 0 ms (mask onset at target offset). Consequently, only the singleSOA value of 15 ms was sampled and no extensive inferences can bedrawn about the shape or magnitude of the metacontrast functions.
Breitmeyer (1978c) extended the study of metacontrast with black-on-white or white-on-black surrounds. Here the target and mask dura-tions (energies) were equal so as to not obscure type B metacontrasteffects. Moreover, Breitmeyer, instead of employing a simple detectiontask, used a form or contour discrimination task, which, as notedabove, is more likely to yield type B effects. Disk-like targets wereemployed and could be either black or white on a medium gray back-ground. Spatially surrounding rings served as masks and, again, couldbe either black or white on gray. The general findings can be summa-rized as follows: (i) U-shaped metacontrast functions were obtainedfor any combination of target and mask contrasts; (ii) the magnitudeof the masking effect tended to be greater when the target and maskcontrasts had the same sign. These findings indicate that, although themagnitude of type B contour suppression in metacontrast is affectedby contrast–polarity relations between the target and mask, the activa-tion of mechanisms producing these contour-related type B effects per seis largely indifferent to these same relations. However, Becker andAnstis (2004) recently showed that when a target disk’s visibility isassessed by judgments of perceived brightness or contrast, one doesnot obtain metacontrast masking when the contrast polarities of thetarget and mask do not match.3 This result points out two interesting
METHODS, APPLICATIONS, AND FINDINGS IN VISUAL PATTERN MASKING54
properties. First, it again demonstrates that the degree and type ofmasking one obtains depends on task parameters and criterion content(see sections 2.5 and 2.6.1 above); secondly, it suggests that form orcontour properties and surface properties like brightness are processedby different visual channels (see Chapter 8, section 8.4).
2.6.5. Figural variables: stimulus orientation and size
In one of his experiments, Werner (1935, experiment 18) investigatedthe effect of the orientation of internal contours of a target onmetacontrast. The target consisted of either a vertically or a horizont-ally oriented grating. The metacontrast mask consisted of adjacentblack vertically oriented bars flanking the target area. Werner reportedthat although suppression of the vertical target grating was obtained inabout 80 percent of the trials, the horizontal target grating alwaysremained clearly visible. In other words, the magnitude of suppressionof the target’s visibility is orientation specific and depends on thesimilarity between target and mask orientation.
Stimulus size, in particular mask size, has been found to affect themagnitude of metacontrast, but the reported directions of empiricaleffects have not been consistent across studies. Although some investi-gators have reported decreases of metacontrast magnitude as the widthof the surrounding mask increases (Schiller and Greenfield 1969; Sturrand Frumkes 1968; Sturr et al. 1965), others have reported the oppositeeffect (Growney and Weisstein 1972; Kao and Dember 1973; Matteson1969). In fact, several of the results obtained by Growney and Weissteinindicate that masking magnitude may be a U-shaped function of maskwidth. For stimuli centered 1.0� from the fovea, they reported an initialrapid increase of metacontrast magnitude as mask width increasedfrom 1� to about 10�, followed by a more gradual decline in mask effect-iveness as the width increased further. This particular trend may be anindex of the antagonistic processes of spatial summation and spatial(lateral) inhibition found with variation of stimulus size as measuredby the Westheimer function (Teller 1971; Teller et al. 1971). This non-monotonic relationship between mask width and metacontrast magni-tude, in conjunction with the findings of Bridgeman and Leff (1979)that the effects of stimulus size interact with the effects of retinal locus,makes it plausible that variations of mask width across different studiescan yield inconsistent metacontrast effects.
METACONTRAST 55
What seems to be needed is a careful empirical investigation oforthogonal variations of target size, mask size, and retinal locus. A meta-contrast study that closely approximates these conditions has beenreported by Bridgeman and Leff (1979). They showed that largebrightness suppression effects can be obtained in the fovea only whenrelatively small targets (0.25� diameter disks) and masks are used. Asthe target and mask dimensions increased, foveal metacontrast magni-tude decreased substantially, whereas parafoveal and peripheral meta-contrast magnitude remained robust, either not changing noticeably orincreasing slightly. In a related study using a contour discriminationtask, Lyon et al. (1981) also showed strong metacontrast effects inthe fovea. In fact, masking magnitude was found to be a function of thedifficulty of contour discrimination and retinal locus. Foveal metacon-trast was as strong as parafoveal metacontrast when a finer contourdetail had to be discriminated at the fovea rather than in the parafovea(see also Breitmeyer 1978a; Westheimer and Hauske 1975). However,for discrimination of equal contour detail parafoveal metacontrast wasstronger than foveal metacontrast.
2.6.6. Spatial variables: stimulus location and separation
The finding that the magnitude of metacontrast suppression of bright-ness, contour, and figural identity generally increases with increasingeccentricity of the retinal locus of stimulation has been replicated fre-quently (Alpern 1953; Kolers and Rosner 1960; Lefton 1970; Merikle1980; Saunders 1977; Stewart and Purcell 1970, 1974; Stoper andBanffy 1977). Moreover, the fact that several earlier investigationsreported little if any foveal metacontrast (Alpern 1953; Kolers andRosner 1960; Toch 1956) can, in light of the analyses by Bridgeman andLeff (1979), be attributed to the use of excessively large, and thussuboptimal, foveal targets (e.g. in the study by Kolers and Rosner(1960) the smallest foveal target disk was 0. 42� in diameter and thelargest was 1.67� in diameter).
Target–mask spatial separation is also known to affect the magnitudeand form of type B metacontrast functions. Generally, as the spatialseparation of the target and mask increases, the metacontrast magni-tude decreases (Alpern 1953; Blanc-Garin 1973; Breitmeyer andHorman 1981; Breitmeyer et al. 1981b; Growney et al. 1977; Kolers1962; Kolers and Rosner 1960; Levine et al. 1967; Ögmen et al. 2003;
METHODS, APPLICATIONS, AND FINDINGS IN VISUAL PATTERN MASKING56
Weisstein and Growney 1969). Moreover, the peak of the U-shapedmetacontrast function, in addition to decreasing in magnitude, attimes also tends to shift toward shorter SOA values (Alpern 1953;Growney et al. 1977) as the target–mask spatial separation increases,although in other studies (Kolers and Rosner 1960; Weisstein andGrowney 1969) no such trend occurred.
Perhaps of greater significance is the fact that target–mask spatialseparation, like stimulus size, interacts with the retinal locus of stimu-lation. For instance, Kolers and Rosner (1960), like Stigler (1910) in hispioneering work, noted that very small contour separations betweenthe target and mask drastically reduced or even eliminated foveal meta-contrast. In contrast with this finding, for non-foveal stimulus locirobust type B metacontrast functions can be obtained at target–maskspatial separations as large as 2� (Alpern 1953; Breitmeyer et al. 1981b;Growney et al. 1977).
Since the above studies indicate that the effects of stimulus size,target–mask spatial separation, and retinal locus on metacontrastmagnitude mutually interact, it would be desirable in future investiga-tions to study the effects of these variables in greater detail while usingthe same experimental design, method, and observers. Carefully meas-ured results from such intra-experimental comparisons may clear upsome of the ambiguities and contradictions found when comparingthe extant inter-experimental results. These ambiguities are particu-larly important, and their careful consideration is warranted whendrawing conclusions from results produced by varying figural andspatial aspects of the target and mask stimuli. For instance, in hisstudy of the standing-wave illusion, Enns (2002, Experiment 3) drawsconclusions from results produced by varying mask size that may notbe warranted.
2.6.7. Viewing conditions: monoptic, dichoptic, and cyclopean
Although there is little controversy about the existence of monopticmetacontrast, the results of investigations of dichoptic metacontrastare somewhat equivocal. We noted in Chapter 1 that although Stigler’s(1910) original investigation of metacontrast failed to show dichopticmasking effects, his later investigation (Stigler 1926) yielded dichopticmetacontrast. Although some subsequent studies (Alpern 1953) also
METACONTRAST 57
reported an absence of dichoptic metacontrast, the majority of laterstudies obtained dichoptic type B metacontrast effects (Breitmeyer andKersey 1981; Kolers and Rosner 1960; May et al. 1980; Schiller andSmith 1968; Weisstein 1971; Werner 1940). These investigations, and inparticular those showing that dichoptic metacontrast can be as strongas or even stronger than monoptic metacontrast (Schiller and Smith1968; Weisstein 1971), indicate (i) that the site of target–mask interac-tions responsible for generating type B metacontrast effects must be ator beyond the level of binocular combination of the respective monoc-ular inputs and (ii) that binocular rivalry between target and mask maybe an additional source of target suppression under dichoptic comparedwith monoptic viewing (Breitmeyer, et al. in preparation; Schiller andSmith 1968).
Based on these results and interpretations, one might infer that type Bmetacontrast interactions also occur in cyclopean or stereo-spacewhen one uses random-dot stereograms to generate the target andmask patterns. That this is not the case has been shown by investiga-tions of cyclopean metacontrast by Vernoy (1976), Lehmkuhle and Fox(1980), and ourselves (unpublished),4 in all of which only type A back-ward masking effects were obtained. It appears that a necessary condi-tion for obtaining type B metacontrast is that one uses standardfirst-order target and mask stimuli whose edges are defined by lumin-ance or wavelength differences. Thus each stimulus is capable ofgenerating its own non-cyclopean or monocular contrast- and con-tour-forming processes in the visual pathway, although eventually theymay also contribute to binocular stereo-effects (Szoc 1973). Thesecombined findings of dichoptic type B metacontrast when usingstandard stimuli, and the failure to obtain such metacontrast whenusing cyclopean stimuli, indicate that binocular cortical mechanismssensitive to luminance or wavelength contrast are used in generatingtype B metacontrast. Mechanisms sensitive to mere cyclopean depthcontrast (devoid of luminance contrast) are not used in type B meta-contrast, although they are in type A backward masking. Consequently,mechanisms giving rise to type B metacontrast, although located at thelevel of binocular combination, are probably not located at as late alevel of cortical processing as that used in generating cyclopeancontours (spatial boundaries defined solely by binocular image disparityor depth differences).
METHODS, APPLICATIONS, AND FINDINGS IN VISUAL PATTERN MASKING58
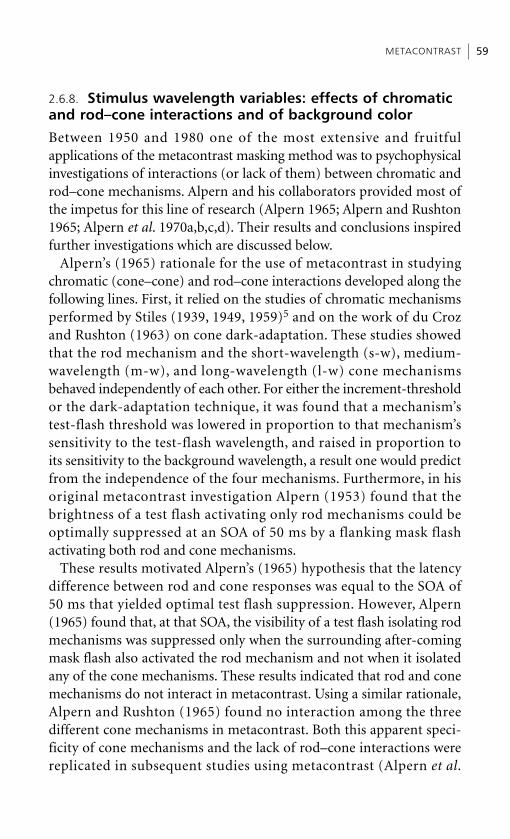
2.6.8. Stimulus wavelength variables: effects of chromaticand rod–cone interactions and of background color
Between 1950 and 1980 one of the most extensive and fruitfulapplications of the metacontrast masking method was to psychophysicalinvestigations of interactions (or lack of them) between chromatic androd–cone mechanisms. Alpern and his collaborators provided most ofthe impetus for this line of research (Alpern 1965; Alpern and Rushton1965; Alpern et al. 1970a,b,c,d). Their results and conclusions inspiredfurther investigations which are discussed below.
Alpern’s (1965) rationale for the use of metacontrast in studyingchromatic (cone–cone) and rod–cone interactions developed along thefollowing lines. First, it relied on the studies of chromatic mechanismsperformed by Stiles (1939, 1949, 1959)5 and on the work of du Crozand Rushton (1963) on cone dark-adaptation. These studies showedthat the rod mechanism and the short-wavelength (s-w), medium-wavelength (m-w), and long-wavelength (l-w) cone mechanismsbehaved independently of each other. For either the increment-thresholdor the dark-adaptation technique, it was found that a mechanism’stest-flash threshold was lowered in proportion to that mechanism’ssensitivity to the test-flash wavelength, and raised in proportion toits sensitivity to the background wavelength, a result one would predictfrom the independence of the four mechanisms. Furthermore, in hisoriginal metacontrast investigation Alpern (1953) found that thebrightness of a test flash activating only rod mechanisms could beoptimally suppressed at an SOA of 50 ms by a flanking mask flashactivating both rod and cone mechanisms.
These results motivated Alpern’s (1965) hypothesis that the latencydifference between rod and cone responses was equal to the SOA of50 ms that yielded optimal test flash suppression. However, Alpern(1965) found that, at that SOA, the visibility of a test flash isolating rodmechanisms was suppressed only when the surrounding after-comingmask flash also activated the rod mechanism and not when it isolatedany of the cone mechanisms. These results indicated that rod and conemechanisms do not interact in metacontrast. Using a similar rationale,Alpern and Rushton (1965) found no interaction among the threedifferent cone mechanisms in metacontrast. Both this apparent speci-ficity of cone mechanisms and the lack of rod–cone interactions werereplicated in subsequent studies using metacontrast (Alpern et al.
METACONTRAST 59
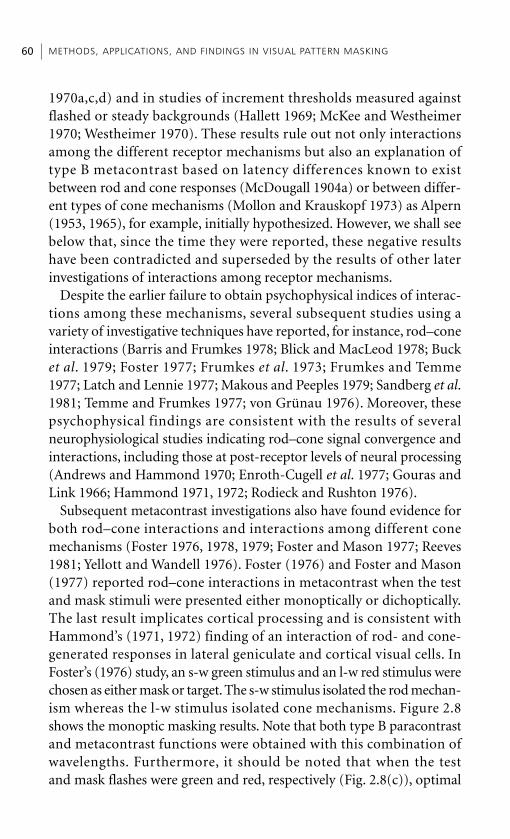
1970a,c,d) and in studies of increment thresholds measured againstflashed or steady backgrounds (Hallett 1969; McKee and Westheimer1970; Westheimer 1970). These results rule out not only interactionsamong the different receptor mechanisms but also an explanation oftype B metacontrast based on latency differences known to existbetween rod and cone responses (McDougall 1904a) or between differ-ent types of cone mechanisms (Mollon and Krauskopf 1973) as Alpern(1953, 1965), for example, initially hypothesized. However, we shall seebelow that, since the time they were reported, these negative resultshave been contradicted and superseded by the results of other laterinvestigations of interactions among receptor mechanisms.
Despite the earlier failure to obtain psychophysical indices of interac-tions among these mechanisms, several subsequent studies using avariety of investigative techniques have reported, for instance, rod–coneinteractions (Barris and Frumkes 1978; Blick and MacLeod 1978; Bucket al. 1979; Foster 1977; Frumkes et al. 1973; Frumkes and Temme1977; Latch and Lennie 1977; Makous and Peeples 1979; Sandberg et al.1981; Temme and Frumkes 1977; von Grünau 1976). Moreover, thesepsychophysical findings are consistent with the results of severalneurophysiological studies indicating rod–cone signal convergence andinteractions, including those at post-receptor levels of neural processing(Andrews and Hammond 1970; Enroth-Cugell et al. 1977; Gouras andLink 1966; Hammond 1971, 1972; Rodieck and Rushton 1976).
Subsequent metacontrast investigations also have found evidence forboth rod–cone interactions and interactions among different conemechanisms (Foster 1976, 1978, 1979; Foster and Mason 1977; Reeves1981; Yellott and Wandell 1976). Foster (1976) and Foster and Mason(1977) reported rod–cone interactions in metacontrast when the testand mask stimuli were presented either monoptically or dichoptically.The last result implicates cortical processing and is consistent withHammond’s (1971, 1972) finding of an interaction of rod- and cone-generated responses in lateral geniculate and cortical visual cells. InFoster’s (1976) study, an s-w green stimulus and an l-w red stimulus werechosen as either mask or target. The s-w stimulus isolated the rod mechan-ism whereas the l-w stimulus isolated cone mechanisms. Figure 2.8shows the monoptic masking results. Note that both type B paracontrastand metacontrast functions were obtained with this combination ofwavelengths. Furthermore, it should be noted that when the testand mask flashes were green and red, respectively (Fig. 2.8(c)), optimal
METHODS, APPLICATIONS, AND FINDINGS IN VISUAL PATTERN MASKING60
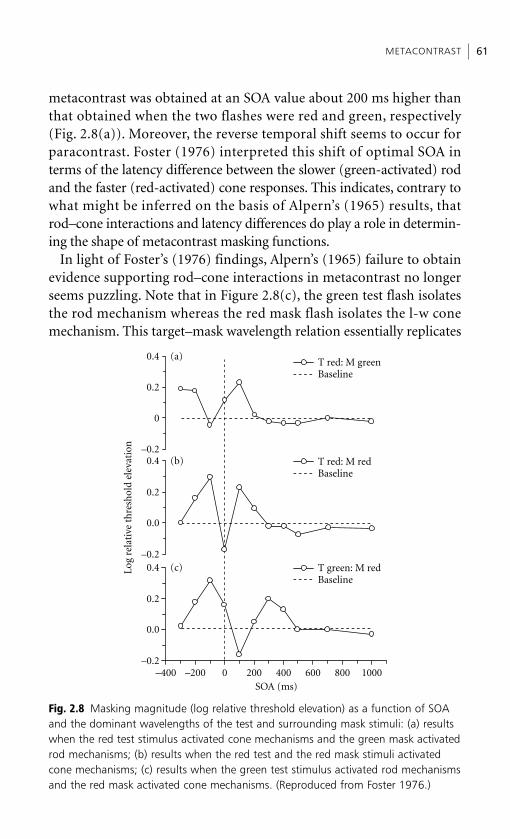
metacontrast was obtained at an SOA value about 200 ms higher thanthat obtained when the two flashes were red and green, respectively(Fig. 2.8(a)). Moreover, the reverse temporal shift seems to occur forparacontrast. Foster (1976) interpreted this shift of optimal SOA interms of the latency difference between the slower (green-activated) rodand the faster (red-activated) cone responses. This indicates, contrary towhat might be inferred on the basis of Alpern’s (1965) results, thatrod–cone interactions and latency differences do play a role in determin-ing the shape of metacontrast masking functions.
In light of Foster’s (1976) findings, Alpern’s (1965) failure to obtainevidence supporting rod–cone interactions in metacontrast no longerseems puzzling. Note that in Figure 2.8(c), the green test flash isolatesthe rod mechanism whereas the red mask flash isolates the l-w conemechanism. This target–mask wavelength relation essentially replicates
METACONTRAST 61
–0.2
0
0.2
0.4T red: M greenBaseline
–0.2
0.0
0.2
0.4
–0.2
0.0
0.2
0.4
–400 –200 0 200 400 600 800 1000SOA (ms)
Log
rel
ativ
e th
resh
old
elev
atio
n
T red: M redBaseline
T green: M redBaseline
(a)
(b)
(c)
Fig. 2.8 Masking magnitude (log relative threshold elevation) as a function of SOAand the dominant wavelengths of the test and surrounding mask stimuli: (a) resultswhen the red test stimulus activated cone mechanisms and the green mask activatedrod mechanisms; (b) results when the red test and the red mask stimuli activatedcone mechanisms; (c) results when the green test stimulus activated rod mechanismsand the red mask activated cone mechanisms. (Reproduced from Foster 1976.)
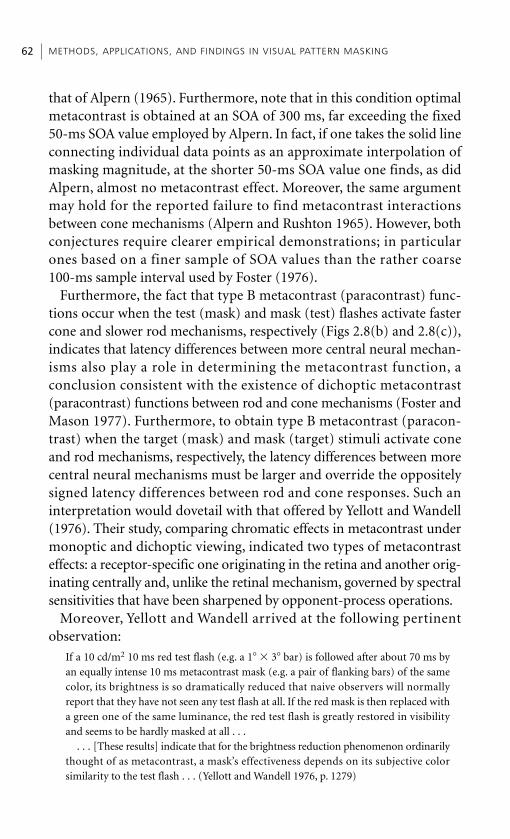
that of Alpern (1965). Furthermore, note that in this condition optimalmetacontrast is obtained at an SOA of 300 ms, far exceeding the fixed50-ms SOA value employed by Alpern. In fact, if one takes the solid lineconnecting individual data points as an approximate interpolation ofmasking magnitude, at the shorter 50-ms SOA value one finds, as didAlpern, almost no metacontrast effect. Moreover, the same argumentmay hold for the reported failure to find metacontrast interactionsbetween cone mechanisms (Alpern and Rushton 1965). However, bothconjectures require clearer empirical demonstrations; in particularones based on a finer sample of SOA values than the rather coarse100-ms sample interval used by Foster (1976).
Furthermore, the fact that type B metacontrast (paracontrast) func-tions occur when the test (mask) and mask (test) flashes activate fastercone and slower rod mechanisms, respectively (Figs 2.8(b) and 2.8(c)),indicates that latency differences between more central neural mechan-isms also play a role in determining the metacontrast function, aconclusion consistent with the existence of dichoptic metacontrast(paracontrast) functions between rod and cone mechanisms (Foster andMason 1977). Furthermore, to obtain type B metacontrast (paracon-trast) when the target (mask) and mask (target) stimuli activate coneand rod mechanisms, respectively, the latency differences between morecentral neural mechanisms must be larger and override the oppositelysigned latency differences between rod and cone responses. Such aninterpretation would dovetail with that offered by Yellott and Wandell(1976). Their study, comparing chromatic effects in metacontrast undermonoptic and dichoptic viewing, indicated two types of metacontrasteffects: a receptor-specific one originating in the retina and another orig-inating centrally and, unlike the retinal mechanism, governed by spectralsensitivities that have been sharpened by opponent-process operations.
Moreover, Yellott and Wandell arrived at the following pertinentobservation:
If a 10 cd/m2 10 ms red test flash (e.g. a 1� � 3� bar) is followed after about 70 ms byan equally intense 10 ms metacontrast mask (e.g. a pair of flanking bars) of the samecolor, its brightness is so dramatically reduced that naive observers will normallyreport that they have not seen any test flash at all. If the red mask is then replaced witha green one of the same luminance, the red test flash is greatly restored in visibilityand seems to be hardly masked at all . . .
. . . [These results] indicate that for the brightness reduction phenomenon ordinarilythought of as metacontrast, a mask’s effectiveness depends on its subjective colorsimilarity to the test flash . . . (Yellott and Wandell 1976, p. 1279)
METHODS, APPLICATIONS, AND FINDINGS IN VISUAL PATTERN MASKING62
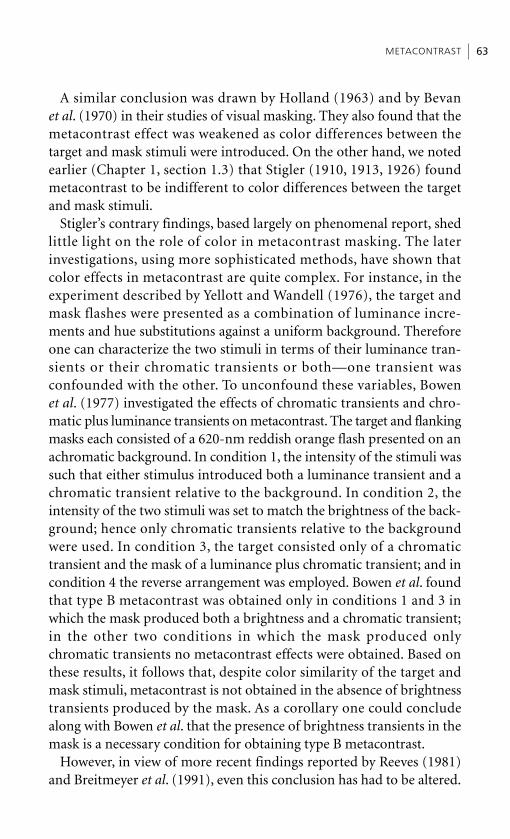
A similar conclusion was drawn by Holland (1963) and by Bevanet al. (1970) in their studies of visual masking. They also found that themetacontrast effect was weakened as color differences between thetarget and mask stimuli were introduced. On the other hand, we notedearlier (Chapter 1, section 1.3) that Stigler (1910, 1913, 1926) foundmetacontrast to be indifferent to color differences between the targetand mask stimuli.
Stigler’s contrary findings, based largely on phenomenal report, shedlittle light on the role of color in metacontrast masking. The laterinvestigations, using more sophisticated methods, have shown thatcolor effects in metacontrast are quite complex. For instance, in theexperiment described by Yellott and Wandell (1976), the target andmask flashes were presented as a combination of luminance incre-ments and hue substitutions against a uniform background. Thereforeone can characterize the two stimuli in terms of their luminance tran-sients or their chromatic transients or both—one transient wasconfounded with the other. To unconfound these variables, Bowenet al. (1977) investigated the effects of chromatic transients and chro-matic plus luminance transients on metacontrast. The target and flankingmasks each consisted of a 620-nm reddish orange flash presented on anachromatic background. In condition 1, the intensity of the stimuli wassuch that either stimulus introduced both a luminance transient and achromatic transient relative to the background. In condition 2, theintensity of the two stimuli was set to match the brightness of the back-ground; hence only chromatic transients relative to the backgroundwere used. In condition 3, the target consisted only of a chromatictransient and the mask of a luminance plus chromatic transient; and incondition 4 the reverse arrangement was employed. Bowen et al. foundthat type B metacontrast was obtained only in conditions 1 and 3 inwhich the mask produced both a brightness and a chromatic transient;in the other two conditions in which the mask produced onlychromatic transients no metacontrast effects were obtained. Based onthese results, it follows that, despite color similarity of the target andmask stimuli, metacontrast is not obtained in the absence of brightnesstransients produced by the mask. As a corollary one could concludealong with Bowen et al. that the presence of brightness transients in themask is a necessary condition for obtaining type B metacontrast.
However, in view of more recent findings reported by Reeves (1981)and Breitmeyer et al. (1991), even this conclusion has had to be altered.
METACONTRAST 63
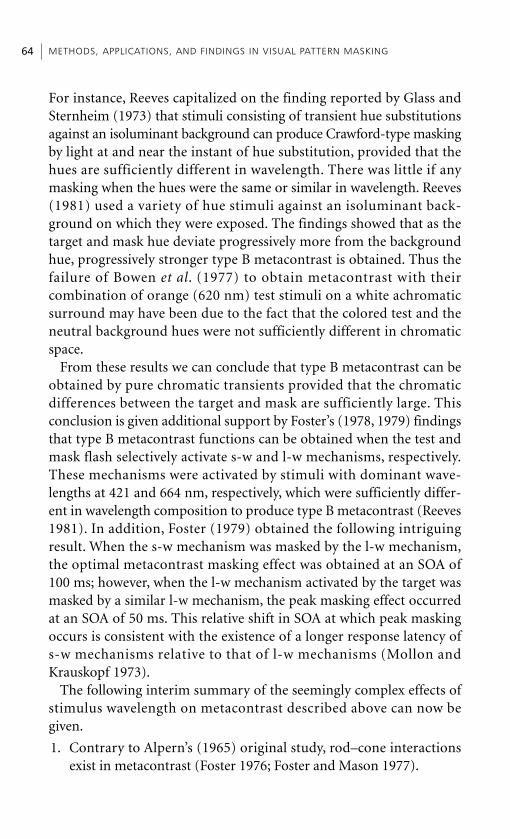
For instance, Reeves capitalized on the finding reported by Glass andSternheim (1973) that stimuli consisting of transient hue substitutionsagainst an isoluminant background can produce Crawford-type maskingby light at and near the instant of hue substitution, provided that thehues are sufficiently different in wavelength. There was little if anymasking when the hues were the same or similar in wavelength. Reeves(1981) used a variety of hue stimuli against an isoluminant back-ground on which they were exposed. The findings showed that as thetarget and mask hue deviate progressively more from the backgroundhue, progressively stronger type B metacontrast is obtained. Thus thefailure of Bowen et al. (1977) to obtain metacontrast with theircombination of orange (620 nm) test stimuli on a white achromaticsurround may have been due to the fact that the colored test and theneutral background hues were not sufficiently different in chromaticspace.
From these results we can conclude that type B metacontrast can beobtained by pure chromatic transients provided that the chromaticdifferences between the target and mask are sufficiently large. Thisconclusion is given additional support by Foster’s (1978, 1979) findingsthat type B metacontrast functions can be obtained when the test andmask flash selectively activate s-w and l-w mechanisms, respectively.These mechanisms were activated by stimuli with dominant wave-lengths at 421 and 664 nm, respectively, which were sufficiently differ-ent in wavelength composition to produce type B metacontrast (Reeves1981). In addition, Foster (1979) obtained the following intriguingresult. When the s-w mechanism was masked by the l-w mechanism,the optimal metacontrast masking effect was obtained at an SOA of100 ms; however, when the l-w mechanism activated by the target wasmasked by a similar l-w mechanism, the peak masking effect occurredat an SOA of 50 ms. This relative shift in SOA at which peak maskingoccurs is consistent with the existence of a longer response latency ofs-w mechanisms relative to that of l-w mechanisms (Mollon andKrauskopf 1973).
The following interim summary of the seemingly complex effects ofstimulus wavelength on metacontrast described above can now begiven.
1. Contrary to Alpern’s (1965) original study, rod–cone interactionsexist in metacontrast (Foster 1976; Foster and Mason 1977).
METHODS, APPLICATIONS, AND FINDINGS IN VISUAL PATTERN MASKING64

2. The latency differences between rods and cones can play a role indetermining the SOA at which peak type B metacontrast maskingoccurs (Foster 1976).
3. Target and mask stimuli of the same or similar wavelength compo-sition can produce type B metacontrast, provided that at least themask stimulus produces a brightness transient (Bowen et al. 1977).
4. Even in the absence of brightness transients, type B metacontrast canbe produced by pure hue transients, provided that the wavelengthcomposition of the target and flanking mask is sufficiently differentfrom that of the background (Breitmeyer et al. 1991; Reeves 1981).
5. Result 4, as well as those of Foster (1978, 1979), show that, contraryto the earlier study by Alpern and Rushton (1965), different conemechanisms can interact to produce type B metacontrast.
6. The latency differences between cone mechanisms play a role indetermining the SOA at which optimal type B metacontrast occurs(Foster 1979).
7. There may be a metacontrast effect specific to peripheral receptorprocesses and another, more centrally located, metacontrast effectexpressing mechanisms with spectral sensitivities that have beensharpened and influenced by opponent processes (Reeves 1981;Yellott and Wandell 1976).
These findings have important implications for theories of metacon-trast, in particular for those based on the sustained–transient channeldistinction proposed by Breitmeyer and Ganz (1976). Because of devel-opments over the past 25 years in the study of parallel pathways inmonkey vision, an updated sustained–transient approach to masking(Breitmeyer 1992) (see Chapter 5) takes the parvocellular (P) and magno-cellular (M) pathways as neural analogs of these channels. It issometimes found (Hicks et al. 1983; Krüger 1979; Lee et al. 1988,1989a,b), and hence claimed (Livingstone and Hubel 1988;Ramachandran 1990; Skottun and Parke 1999), that stimuli producedby isoluminant hue substitutions produce little, if any, activity in the Mpathway. However, neurophysiological evidence indicates that M cellscan indeed respond to isoluminant stimuli varying only in wavelength,provided that the cone contrast is sufficiently high, as it is with stimuliat red–green (or blue–yellow) isoluminance (Krüger 1979; Lee et al.1988; Schiller and Colby 1983). In particular, Lee et al. (1989b) note that
METACONTRAST 65
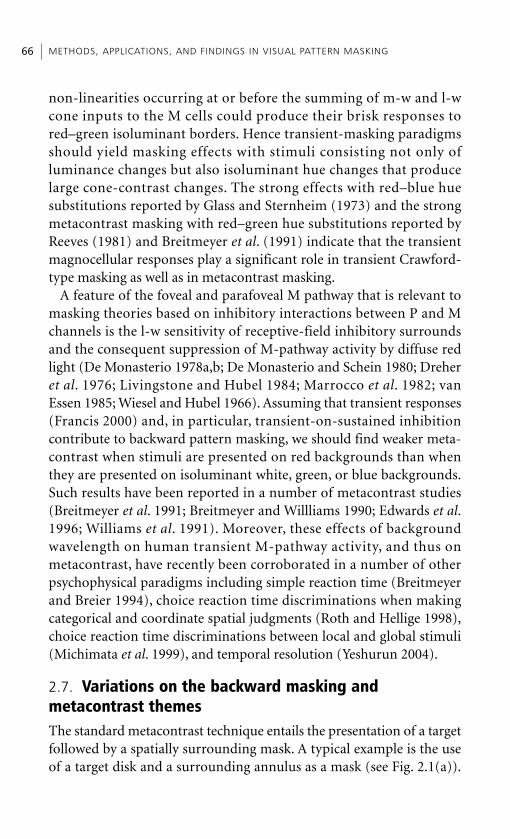
non-linearities occurring at or before the summing of m-w and l-wcone inputs to the M cells could produce their brisk responses tored–green isoluminant borders. Hence transient-masking paradigmsshould yield masking effects with stimuli consisting not only ofluminance changes but also isoluminant hue changes that producelarge cone-contrast changes. The strong effects with red–blue huesubstitutions reported by Glass and Sternheim (1973) and the strongmetacontrast masking with red–green hue substitutions reported byReeves (1981) and Breitmeyer et al. (1991) indicate that the transientmagnocellular responses play a significant role in transient Crawford-type masking as well as in metacontrast masking.
A feature of the foveal and parafoveal M pathway that is relevant tomasking theories based on inhibitory interactions between P and Mchannels is the l-w sensitivity of receptive-field inhibitory surroundsand the consequent suppression of M-pathway activity by diffuse redlight (De Monasterio 1978a,b; De Monasterio and Schein 1980; Dreheret al. 1976; Livingstone and Hubel 1984; Marrocco et al. 1982; vanEssen 1985; Wiesel and Hubel 1966). Assuming that transient responses(Francis 2000) and, in particular, transient-on-sustained inhibitioncontribute to backward pattern masking, we should find weaker meta-contrast when stimuli are presented on red backgrounds than whenthey are presented on isoluminant white, green, or blue backgrounds.Such results have been reported in a number of metacontrast studies(Breitmeyer et al. 1991; Breitmeyer and Willliams 1990; Edwards et al.1996; Williams et al. 1991). Moreover, these effects of backgroundwavelength on human transient M-pathway activity, and thus onmetacontrast, have recently been corroborated in a number of otherpsychophysical paradigms including simple reaction time (Breitmeyerand Breier 1994), choice reaction time discriminations when makingcategorical and coordinate spatial judgments (Roth and Hellige 1998),choice reaction time discriminations between local and global stimuli(Michimata et al. 1999), and temporal resolution (Yeshurun 2004).
2.7. Variations on the backward masking andmetacontrast themesThe standard metacontrast technique entails the presentation of a targetfollowed by a spatially surrounding mask. A typical example is the useof a target disk and a surrounding annulus as a mask (see Fig. 2.1(a)).
METHODS, APPLICATIONS, AND FINDINGS IN VISUAL PATTERN MASKING66
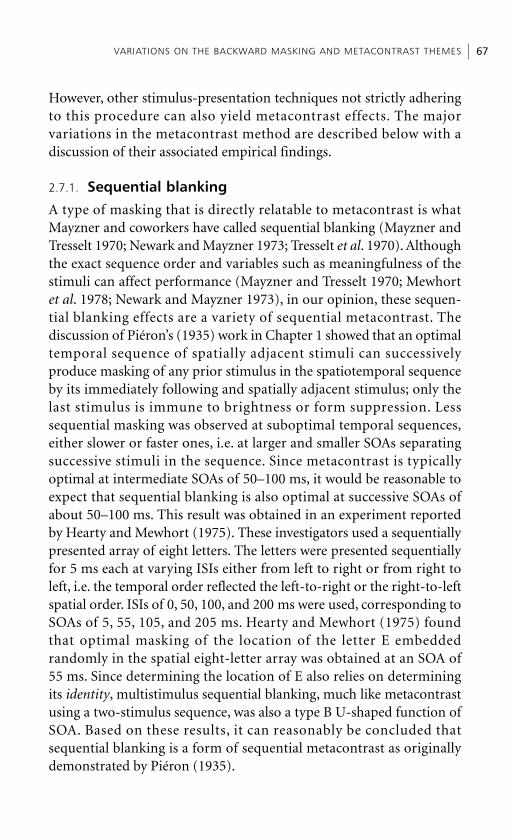
However, other stimulus-presentation techniques not strictly adheringto this procedure can also yield metacontrast effects. The majorvariations in the metacontrast method are described below with adiscussion of their associated empirical findings.
2.7.1. Sequential blanking
A type of masking that is directly relatable to metacontrast is whatMayzner and coworkers have called sequential blanking (Mayzner andTresselt 1970; Newark and Mayzner 1973; Tresselt et al. 1970). Althoughthe exact sequence order and variables such as meaningfulness of thestimuli can affect performance (Mayzner and Tresselt 1970; Mewhortet al. 1978; Newark and Mayzner 1973), in our opinion, these sequen-tial blanking effects are a variety of sequential metacontrast. Thediscussion of Piéron’s (1935) work in Chapter 1 showed that an optimaltemporal sequence of spatially adjacent stimuli can successivelyproduce masking of any prior stimulus in the spatiotemporal sequenceby its immediately following and spatially adjacent stimulus; only thelast stimulus is immune to brightness or form suppression. Lesssequential masking was observed at suboptimal temporal sequences,either slower or faster ones, i.e. at larger and smaller SOAs separatingsuccessive stimuli in the sequence. Since metacontrast is typicallyoptimal at intermediate SOAs of 50–100 ms, it would be reasonable toexpect that sequential blanking is also optimal at successive SOAs ofabout 50–100 ms. This result was obtained in an experiment reportedby Hearty and Mewhort (1975). These investigators used a sequentiallypresented array of eight letters. The letters were presented sequentiallyfor 5 ms each at varying ISIs either from left to right or from right toleft, i.e. the temporal order reflected the left-to-right or the right-to-leftspatial order. ISIs of 0, 50, 100, and 200 ms were used, corresponding toSOAs of 5, 55, 105, and 205 ms. Hearty and Mewhort (1975) foundthat optimal masking of the location of the letter E embeddedrandomly in the spatial eight-letter array was obtained at an SOA of55 ms. Since determining the location of E also relies on determiningits identity, multistimulus sequential blanking, much like metacontrastusing a two-stimulus sequence, was also a type B U-shaped function ofSOA. Based on these results, it can reasonably be concluded thatsequential blanking is a form of sequential metacontrast as originallydemonstrated by Piéron (1935).
VARIATIONS ON THE BACKWARD MASKING AND METACONTRAST THEMES 67
Moreover, our own unpublished observations of the sequentialblanking effect, employing an array of five adjacent vertical barspresented temporally in sequence from left to right, showed thatsequential brightness and form suppression of the first four bars isoptimal at an SOA at which one obtains a perception of rapid formlessmotion (phi motion) proceeding from the first to the fifth bar position,and hence through the fourth position. Moreover, as already reportedby Wertheimer (1912), by alternately flashing two adjacent bars atoptimal rates we were able to produce pure formless phi motion for sometime, after which, in line with the findings of Mewhort et al. (1978),pattern or form was increasingly observable. Contrary to von Grünau’s(1978b) claim, these results suggest that form per se is not necessary toobtain stroboscopic motion. Of course, one could argue that, in theformer five-bar sequence, the form of the final fifth bar is not maskedand therefore is necessary for perceiving motion throughout the firstfour bar positions. Here, one could use an adaptation of von Grünau’s(1978b, 1979, 1981) procedure and mask the final bar by two flankingbars to see if one can nonetheless perceive formless phi movement.
2.7.2. The standing-wave illusion
As noted in Chapter 1, section 1.3.2, Werner (1935) showed that whena sequence composed of a target and a surrounding mask is cycled, onecan adjust the target-to-mask SOA (metacontrast) and separately themask-to-target SOA (paracontrast) to obtain almost complete elimina-tion of the target’s visibility. Related findings were reported by Schillerand Smith (1966). Macknik and Livingstone (1998) fine-tuned thisillusory effect and called it the standing wave of invisibility. Theyreported that the illusion was strongest when the target and mask, atdurations of 60 ms and 110 ms, respectively, were cycled in counter-phase. Using optical imaging techniques and very similar target maskdurations of 50 ms and 100 ms, respectively, Macknik and Haglund(1999) found neural correlates of the standing-wave illusion in V1 ofmonkey. Macknik and Livingstone (1998) argued that the illusion mostlikely occurs because every mask presentation strongly masks not onlythe preceding target via metacontrast but also the following target viaparacontrast. We concur with this interpretation and add the followingelaboration. In our own studies (Breitmeyer et al. 2004a; Ögmen et al2003; see also sections 2.4 and 2.5.1 above) we consistently found
METHODS, APPLICATIONS, AND FINDINGS IN VISUAL PATTERN MASKING68

metacontrast and paracontrast brightness suppression to be maximalat SOAs ranging from 50 to 60 ms and from –120 to –90 ms, respec-tively. Since the effective meta- and paracontrast SOAs used in thestanding-wave illusion reported by Macknik and Livingstone (1998)fall in these ranges, one would expect almost optimal suppression ofthe target’s visibility.
2.7.3. Feature inheritance and shine-through
Another phenomenon noted by Werner (1935; see also Chapter 1,section 1.3.3) was that at times features of the suppressed target weretransferred to the mask. This process, now known as feature inherit-ance (Herzog and Koch 2001), was subsequently also noted by Stewartand Purcell (1970) and Hofer et al. (1989) and was investigated byWilson and Johnson (1985).6 The latter investigators, along with Enns(2002), point out that feature inheritance poses problems for feedfor-ward contour-interaction theories of visual masking. Deferring thesetheoretical issues until Chapter 6, we now turn to some of theproperties characterizing feature inheritance and its close ally theshine-through effect (Herzog and Koch 2001).
Using target and mask durations of 3.5 ms or less, Wilson andJohnston (1985) showed that the inheritance of a gap in a target line byan uninterrupted adjacent mask line is, like metacontrast masking, atype B function of SOA. Gap inheritance was relatively weak at SOAs of0 and 400 ms, but reached a peak at an intermediate SOA of 100 ms.Although Wilson and Johnston (1985) did not measure target visibilityas a function of SOA, it is highly likely that feature inheritance isdirectly related to the extent to which the target’s visibility is suppressedin a similar type B fashion. This indicates that the mechanism responsi-ble for type B metacontrast overlaps substantially with that responsiblefor feature inheritance.
Recently, Herzog and coworkers (Herzog and Fahle 2002; Herzog andKoch 2001; Herzog et al. 2001a,b, 2003a,b,c) have extensively investig-ated properties of feature inheritance and its companion, the shine-through effect. In these studies, the target usually consists of a briefpresentation (e.g. 20 ms) of a pair of line segments and the aftercomingmask, varying in duration from about 30 to 300 ms, is a grating-likestimulus that spatially overlaps the target. Figure 2.9 shows examplesof target and mask stimuli and the attendant percepts when feature
VARIATIONS ON THE BACKWARD MASKING AND METACONTRAST THEMES 69
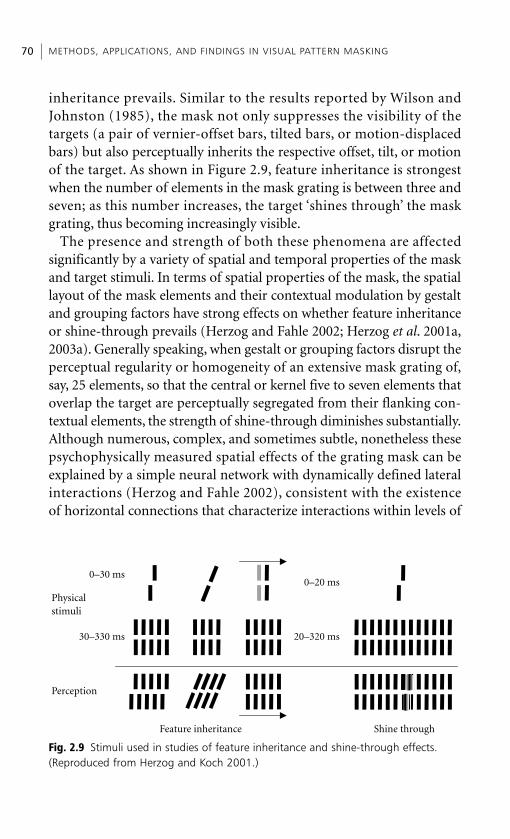
inheritance prevails. Similar to the results reported by Wilson andJohnston (1985), the mask not only suppresses the visibility of thetargets (a pair of vernier-offset bars, tilted bars, or motion-displacedbars) but also perceptually inherits the respective offset, tilt, or motionof the target. As shown in Figure 2.9, feature inheritance is strongestwhen the number of elements in the mask grating is between three andseven; as this number increases, the target ‘shines through’ the maskgrating, thus becoming increasingly visible.
The presence and strength of both these phenomena are affectedsignificantly by a variety of spatial and temporal properties of the maskand target stimuli. In terms of spatial properties of the mask, the spatiallayout of the mask elements and their contextual modulation by gestaltand grouping factors have strong effects on whether feature inheritanceor shine-through prevails (Herzog and Fahle 2002; Herzog et al. 2001a,2003a). Generally speaking, when gestalt or grouping factors disrupt theperceptual regularity or homogeneity of an extensive mask grating of,say, 25 elements, so that the central or kernel five to seven elements thatoverlap the target are perceptually segregated from their flanking con-textual elements, the strength of shine-through diminishes substantially.Although numerous, complex, and sometimes subtle, nonetheless thesepsychophysically measured spatial effects of the grating mask can beexplained by a simple neural network with dynamically defined lateralinteractions (Herzog and Fahle 2002), consistent with the existenceof horizontal connections that characterize interactions within levels of
METHODS, APPLICATIONS, AND FINDINGS IN VISUAL PATTERN MASKING70
Perception
Feature inheritance
0–30 ms0–20 ms
Physical stimuli
Shine through
20–320 ms30–330 ms
Fig. 2.9 Stimuli used in studies of feature inheritance and shine-through effects.(Reproduced from Herzog and Koch 2001.)
visual cortex (Ernst et al. 2001; Hupé et al. 2000; Kapadia et al. 1995; Liand Gilbert 2002; Rossi et al. 2001; Spillmann and Werner 1996; Stettleret al. 2002).
The strength of shine-through also depends on the temporal integrityof the kernel and contextual elements comprising the aftercoming maskgrating. Small asynchronies (from �10 to �30 ms) between the onsetsof the kernel and contextual elements of the mask grating producedramatic reductions in the shine-through effect (Herzog and Koch2001; Herzog et al. 2001b, 2003b). Similarly, increases of asynchronybetween the offsets of a 300-ms kernel and briefer contextual elementsreduced the shine-through effect significantly (Herzog et al. 2001b).
The presence and strength of feature inheritance and shine-throughalso depends on temporal aspects of the target. According to Herzoget al. (2001a,b), neither shine-through nor feature inheritance areobserved consistently for target durations less than 10 ms. With targetdurations of 10–20 ms, shine-through emerges and subsequentlyfeature inheritance also emerges at target durations of 30–50 ms. In sofar as shine-through and feature inheritance are related to feature-segmentation and feature-binding processes, respectively, Herzog et al.(2001b) conclude that feature binding requires more time than featuresegmentation. In either case, we believe that feature binding to percep-tual objects is the key process. In shine-through, the target features arebound to the target object, so that it and the mask are perceived as twoindependent objects; in feature inheritance, the target features areinherited by the perceived mask grating while the target is renderedperceptually invisible. These phenomena present a powerful paradigmfor investigating the spatiotemporal properties of image segmentation,feature binding and feature fusion (Herzog et al. 2001b). Moreover,since feature inheritance implies a key role of re-entrant cortical activityin masking (Enns 2002; Herzog et al. 2001b), it is of particularsignificance to object-substitution models of masking, which will bediscussed more fully in Chapter 4.
2.7.4. Common-onset masking
Equally relevant for object-substitution models of masking are find-ings from a form of masking called common-onset masking (Bischofand Di Lollo 1995; Cohene and Bechtold 1974, 1975; Di Lollo et al.1993, 2000; Enns and Di Lollo 2000; Markoff and Sturr, 1971). In this
VARIATIONS ON THE BACKWARD MASKING AND METACONTRAST THEMES 71
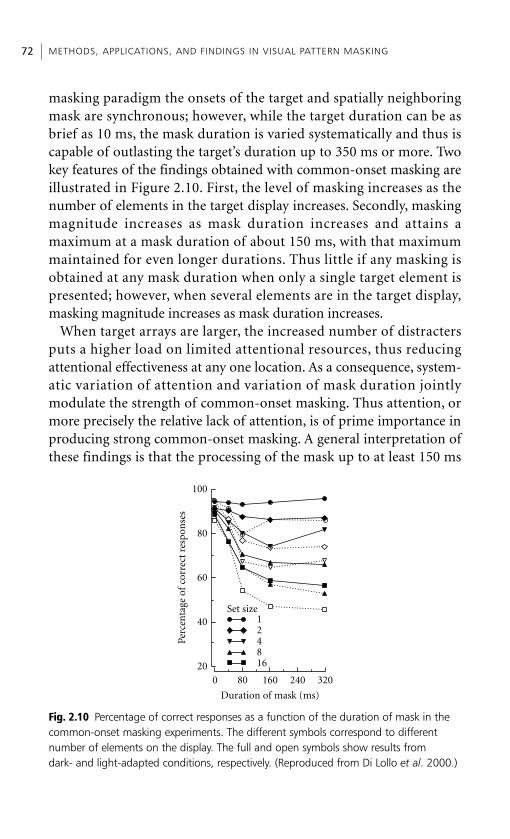
masking paradigm the onsets of the target and spatially neighboringmask are synchronous; however, while the target duration can be asbrief as 10 ms, the mask duration is varied systematically and thus iscapable of outlasting the target’s duration up to 350 ms or more. Twokey features of the findings obtained with common-onset masking areillustrated in Figure 2.10. First, the level of masking increases as thenumber of elements in the target display increases. Secondly, maskingmagnitude increases as mask duration increases and attains amaximum at a mask duration of about 150 ms, with that maximummaintained for even longer durations. Thus little if any masking isobtained at any mask duration when only a single target element ispresented; however, when several elements are in the target display,masking magnitude increases as mask duration increases.
When target arrays are larger, the increased number of distractersputs a higher load on limited attentional resources, thus reducingattentional effectiveness at any one location. As a consequence, system-atic variation of attention and variation of mask duration jointlymodulate the strength of common-onset masking. Thus attention, ormore precisely the relative lack of attention, is of prime importance inproducing strong common-onset masking. A general interpretation ofthese findings is that the processing of the mask up to at least 150 ms
METHODS, APPLICATIONS, AND FINDINGS IN VISUAL PATTERN MASKING72
124816
Set size
100
80
60
Perc
enta
ge o
f co
rrec
t re
spon
ses
Duration of mask (ms)
40
200 80 160 240 320
Fig. 2.10 Percentage of correct responses as a function of the duration of mask in thecommon-onset masking experiments. The different symbols correspond to differentnumber of elements on the display. The full and open symbols show results from dark- and light-adapted conditions, respectively. (Reproduced from Di Lollo et al. 2000.)
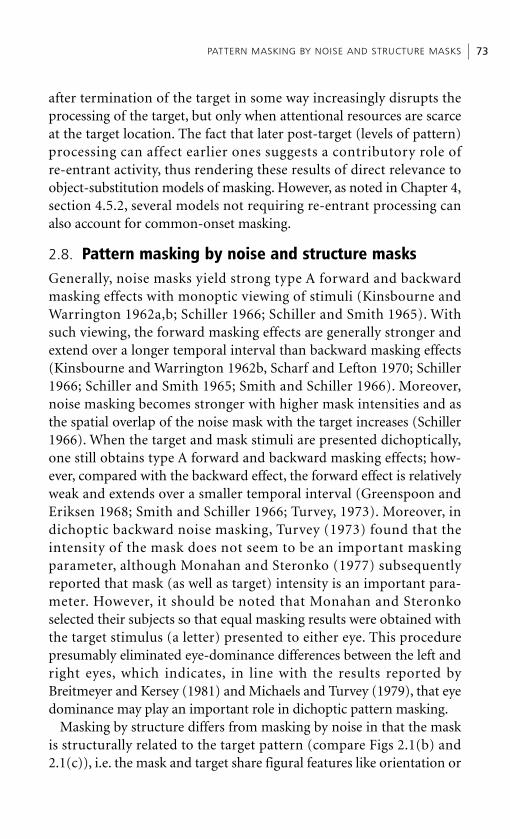
after termination of the target in some way increasingly disrupts theprocessing of the target, but only when attentional resources are scarceat the target location. The fact that later post-target (levels of pattern)processing can affect earlier ones suggests a contributory role ofre-entrant activity, thus rendering these results of direct relevance toobject-substitution models of masking. However, as noted in Chapter 4,section 4.5.2, several models not requiring re-entrant processing canalso account for common-onset masking.
2.8. Pattern masking by noise and structure masksGenerally, noise masks yield strong type A forward and backwardmasking effects with monoptic viewing of stimuli (Kinsbourne andWarrington 1962a,b; Schiller 1966; Schiller and Smith 1965). Withsuch viewing, the forward masking effects are generally stronger andextend over a longer temporal interval than backward masking effects(Kinsbourne and Warrington 1962b, Scharf and Lefton 1970; Schiller1966; Schiller and Smith 1965; Smith and Schiller 1966). Moreover,noise masking becomes stronger with higher mask intensities and asthe spatial overlap of the noise mask with the target increases (Schiller1966). When the target and mask stimuli are presented dichoptically,one still obtains type A forward and backward masking effects; how-ever, compared with the backward effect, the forward effect is relativelyweak and extends over a smaller temporal interval (Greenspoon andEriksen 1968; Smith and Schiller 1966; Turvey, 1973). Moreover, indichoptic backward noise masking, Turvey (1973) found that theintensity of the mask does not seem to be an important maskingparameter, although Monahan and Steronko (1977) subsequentlyreported that mask (as well as target) intensity is an important para-meter. However, it should be noted that Monahan and Steronkoselected their subjects so that equal masking results were obtained withthe target stimulus (a letter) presented to either eye. This procedurepresumably eliminated eye-dominance differences between the left andright eyes, which indicates, in line with the results reported byBreitmeyer and Kersey (1981) and Michaels and Turvey (1979), that eyedominance may play an important role in dichoptic pattern masking.
Masking by structure differs from masking by noise in that the maskis structurally related to the target pattern (compare Figs 2.1(b) and2.1(c)), i.e. the mask and target share figural features like orientation or
PATTERN MASKING BY NOISE AND STRUCTURE MASKS 73
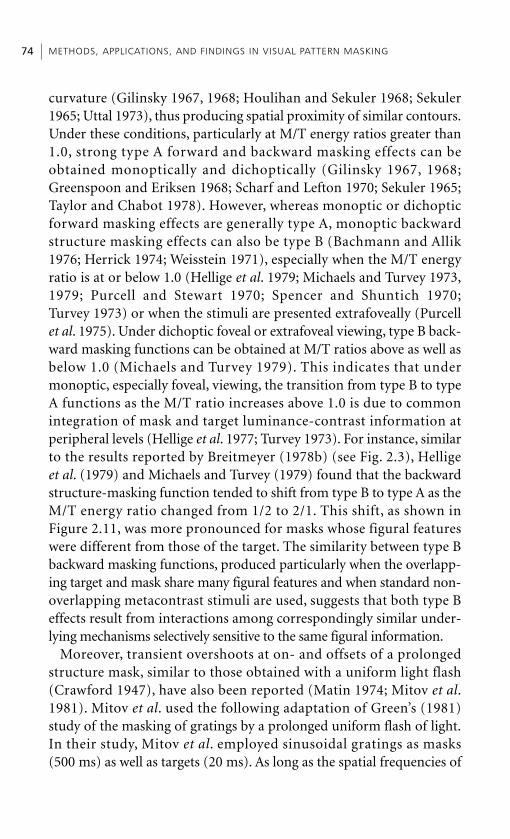
curvature (Gilinsky 1967, 1968; Houlihan and Sekuler 1968; Sekuler1965; Uttal 1973), thus producing spatial proximity of similar contours.Under these conditions, particularly at M/T energy ratios greater than1.0, strong type A forward and backward masking effects can beobtained monoptically and dichoptically (Gilinsky 1967, 1968;Greenspoon and Eriksen 1968; Scharf and Lefton 1970; Sekuler 1965;Taylor and Chabot 1978). However, whereas monoptic or dichopticforward masking effects are generally type A, monoptic backwardstructure masking effects can also be type B (Bachmann and Allik1976; Herrick 1974; Weisstein 1971), especially when the M/T energyratio is at or below 1.0 (Hellige et al. 1979; Michaels and Turvey 1973,1979; Purcell and Stewart 1970; Spencer and Shuntich 1970;Turvey 1973) or when the stimuli are presented extrafoveally (Purcellet al. 1975). Under dichoptic foveal or extrafoveal viewing, type B back-ward masking functions can be obtained at M/T ratios above as well asbelow 1.0 (Michaels and Turvey 1979). This indicates that undermonoptic, especially foveal, viewing, the transition from type B to typeA functions as the M/T ratio increases above 1.0 is due to commonintegration of mask and target luminance-contrast information atperipheral levels (Hellige et al. 1977; Turvey 1973). For instance, similarto the results reported by Breitmeyer (1978b) (see Fig. 2.3), Helligeet al. (1979) and Michaels and Turvey (1979) found that the backwardstructure-masking function tended to shift from type B to type A as theM/T energy ratio changed from 1/2 to 2/1. This shift, as shown inFigure 2.11, was more pronounced for masks whose figural featureswere different from those of the target. The similarity between type Bbackward masking functions, produced particularly when the overlapp-ing target and mask share many figural features and when standard non-overlapping metacontrast stimuli are used, suggests that both type Beffects result from interactions among correspondingly similar under-lying mechanisms selectively sensitive to the same figural information.
Moreover, transient overshoots at on- and offsets of a prolongedstructure mask, similar to those obtained with a uniform light flash(Crawford 1947), have also been reported (Matin 1974; Mitov et al.1981). Mitov et al. used the following adaptation of Green’s (1981)study of the masking of gratings by a prolonged uniform flash of light.In their study, Mitov et al. employed sinusoidal gratings as masks(500 ms) as well as targets (20 ms). As long as the spatial frequencies of
METHODS, APPLICATIONS, AND FINDINGS IN VISUAL PATTERN MASKING74
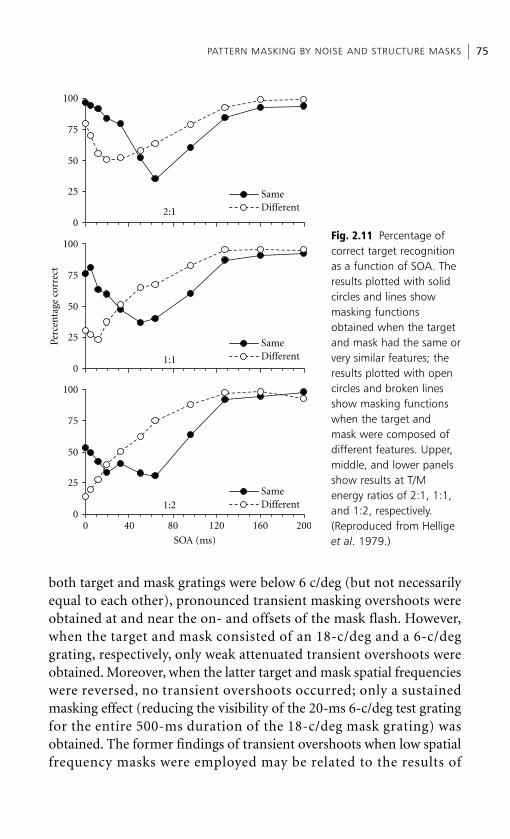
both target and mask gratings were below 6 c/deg (but not necessarilyequal to each other), pronounced transient masking overshoots wereobtained at and near the on- and offsets of the mask flash. However,when the target and mask consisted of an 18-c/deg and a 6-c/deggrating, respectively, only weak attenuated transient overshoots wereobtained. Moreover, when the latter target and mask spatial frequencieswere reversed, no transient overshoots occurred; only a sustainedmasking effect (reducing the visibility of the 20-ms 6-c/deg test gratingfor the entire 500-ms duration of the 18-c/deg mask grating) wasobtained. The former findings of transient overshoots when low spatialfrequency masks were employed may be related to the results of
PATTERN MASKING BY NOISE AND STRUCTURE MASKS 75
0
25
50
75
100
SameDifferent 2:1
1:1
1:2
SameDifferent
SameDifferent
0
25
50
75
100
Perc
enta
ge c
orre
ct
0
25
50
75
100
0 40 80
SOA (ms)
120 160 200
Fig. 2.11 Percentage ofcorrect target recognitionas a function of SOA. Theresults plotted with solidcircles and lines showmasking functionsobtained when the targetand mask had the same orvery similar features; theresults plotted with opencircles and broken linesshow masking functionswhen the target and mask were composed ofdifferent features. Upper,middle, and lower panelsshow results at T/Menergy ratios of 2:1, 1:1,and 1:2, respectively.(Reproduced from Helligeet al. 1979.)
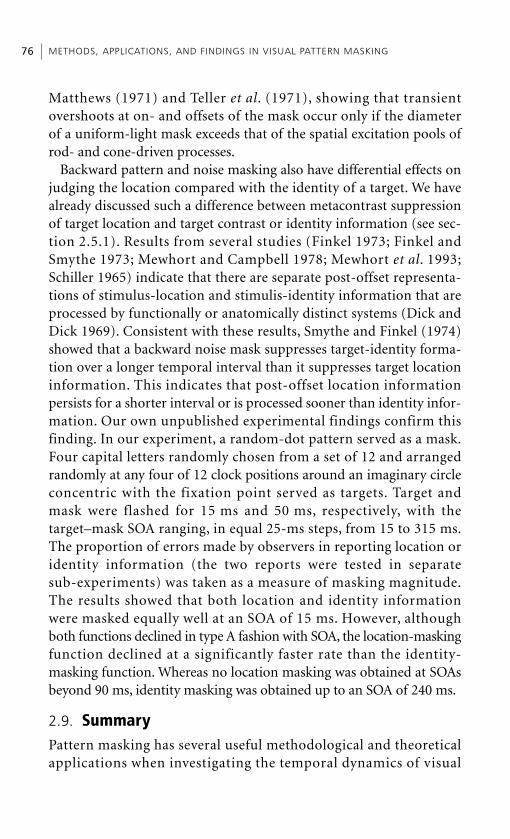
Matthews (1971) and Teller et al. (1971), showing that transientovershoots at on- and offsets of the mask occur only if the diameterof a uniform-light mask exceeds that of the spatial excitation pools ofrod- and cone-driven processes.
Backward pattern and noise masking also have differential effects onjudging the location compared with the identity of a target. We havealready discussed such a difference between metacontrast suppressionof target location and target contrast or identity information (see sec-tion 2.5.1). Results from several studies (Finkel 1973; Finkel andSmythe 1973; Mewhort and Campbell 1978; Mewhort et al. 1993;Schiller 1965) indicate that there are separate post-offset representa-tions of stimulus-location and stimulis-identity information that areprocessed by functionally or anatomically distinct systems (Dick andDick 1969). Consistent with these results, Smythe and Finkel (1974)showed that a backward noise mask suppresses target-identity forma-tion over a longer temporal interval than it suppresses target locationinformation. This indicates that post-offset location informationpersists for a shorter interval or is processed sooner than identity infor-mation. Our own unpublished experimental findings confirm thisfinding. In our experiment, a random-dot pattern served as a mask.Four capital letters randomly chosen from a set of 12 and arrangedrandomly at any four of 12 clock positions around an imaginary circleconcentric with the fixation point served as targets. Target andmask were flashed for 15 ms and 50 ms, respectively, with thetarget–mask SOA ranging, in equal 25-ms steps, from 15 to 315 ms.The proportion of errors made by observers in reporting location oridentity information (the two reports were tested in separatesub-experiments) was taken as a measure of masking magnitude.The results showed that both location and identity informationwere masked equally well at an SOA of 15 ms. However, although both functions declined in type A fashion with SOA, the location-maskingfunction declined at a significantly faster rate than the identity-masking function. Whereas no location masking was obtained at SOAsbeyond 90 ms, identity masking was obtained up to an SOA of 240 ms.
2.9. SummaryPattern masking has several useful methodological and theoreticalapplications when investigating the temporal dynamics of visual
METHODS, APPLICATIONS, AND FINDINGS IN VISUAL PATTERN MASKING76
perception, the interaction of visuosensory with higher visuocognitivefunctions, and the varieties of unconscious and conscious visualprocessing in normal as well as selected subject populations. It can bedifferentiated operationally using several procedures. When the targetand mask patterns share common structural features and overlapspatially, masking by structure prevails. A mask consisting of randomelements with no obvious structural relation to features of the targetpattern is employed in masking by noise. Non-overlapping spatiallyadjacent mask and target patterns are used to investigate (forward)paracontrast and (backward) metacontrast forms of lateral masking.
In para- and metacontrast the type of function one obtains dependson the response criterion adopted by an observer and on several stimulusvariables. Paracontrast is typically type B when brightness ratings/matches, contour discrimination, or form identification are used, andis type A when simple detection is employed. With any of these criteria,the magnitude decreases as mask intensity decreases and spatialseparation between the target and mask stimuli increases. Type B para-contrast can also be obtained dichoptically, implicating mechanisms ator beyond binocular levels of visual processing.
Metacontrast yields type B functions when brightness, color, contrast,contour, or figural identity provide the criterion content. Simpledetection or reaction time tend to yield no masking, indicating thatsome target information is immune to the suppressing effects of themask, or type A masking if the M/T energy ratio is significantly greaterthan 1.0. Without corresponding shifts in criterion content, type Bmetacontrast shifts to a type A function as M/T energy increases from avalue below 1.0 to values above 1.0. For M/T energy ratios less than orequal to 1.0, the SOA at which optimal type B metacontrast occursshifts to lower values as either stimulus or background luminancedecreases. Type B metacontrast suppression of contour is indifferent tothe sign of contrast of the target relative to that of the mask; moreover,metacontrast can be produced by the offset of a prolonged mask, aswell as by the briefly flashed mask that is typically employed. Inaddition to these contrast and intensity variables, spatial variables alsoaffect metacontrast. The magnitude of metacontrast decreases as theorientation or contour difference between target and mask increases,and as the spatial separation between target and mask stimuli increases.Generally, its magnitude is also weakest at the fovea and increases with
SUMMARY 77
retinal eccentricity. Stimulus size is an important variable whichinteracts with retinal location; smaller and larger stimuli are moreeffective foveally and extrafoveally, respectively. Interocular or dichopticpresentation of target and mask stimuli yield type B metacontrastwhich can be of greater magnitude than monocular presentations,indicating interaction of target and mask responses at or beyond thelevel of binocular combination and also the possible additional contri-bution of binocular rivalry. At stereoscopic or cyclopean levels of visualprocessing, which bypass monocular pattern processing, metacontrastyields only type A functions, indicating that the mechanism responsiblefor type B metacontrast (i) requires standard first-order stimuli composedof luminance or chromatic contrast relative to a uniform background and(ii) resides at prestereoptic binocular levels of processing.
Although initial studies failed to yield evidence for metacontrastwhen target and mask stimuli activated different wavelength-selectiveor receptor mechanisms, more recent studies have found thatboth rod–cone interactions and interactions between different conemechanisms can be obtained. Moreover, transients produced by hue-substitution stimuli against isoluminant fields are also capable ofproducing type B metacontrast. Masking phenomena associated withstroboscopic motion and sequential blanking can also be related tometacontrast masking effects. Moreover, recycling target and maskstimuli at optimal para- and metacontrast SOAs can produce a standing-wave illusion in which one perceives only the masks flanking acompletely suppressed target.
Monocular pattern masking by noise or structure is typically a type Aeffect for M/T energy ratios greater than 1.0. This holds for forwardas well as backward masking, although the forward masking effect isusually effective over a larger time interval than backward masking.When the mask energy or contrast is low relative to that of target (M/T �1.0), a backward foveal type B function can result with mono-cular masking, particularly with masking by structure. Moreover, type Beffects are also obtainable extrafoveally with equal energy stimuli. Thisshows that the type B effect obeys similar target energy and retinallocation relationships as does metacontrast. Dichoptic masking bynoise usually also produces type A effects; however, in contrast with themonoptic effects, backward masking is usually stronger than forwardmasking. Furthermore, a backward type B dichoptic structure masking
METHODS, APPLICATIONS, AND FINDINGS IN VISUAL PATTERN MASKING78
effect can also be obtained for equal-energy target and mask stimuli,indicating that this type B effect, like the metacontrast effect, includescentral, cortical levels of processing. Additionally, the attenuation ofmonocular type A effects with relatively weak masks or under dichopticviewing shows that it is due to energy-dependent integration of targetand mask contrast in common peripheral pattern-processing channels.
Both backward structure masking and metacontrast can produce aphenomenon known as feature inheritance whereby the mask inheritsfeatures of the visibly suppressed target. Backward structure maskingcan also yield the phenomenon of shine-through in which the maskappears in a stronger or exaggerated form ‘through’ the veil of the over-lapping mask. These phenomena, which are critically dependent ontiming parameters in the millisecond range, have proved to be a veryuseful means of investigating the temporal and spatial properties offeature coding and feature binding and may also be important in dis-tinguishing between different types of backward masking mechanisms.
A briefly flashed target pattern informs the visual system not only ofits surface (brightness, color) and figural (contour, edge) aspects butalso of its location in the visual field. Masking by noise and structureaffects location and figural identification differentially. The temporalinterval over which one can obtain masking of target location informa-tion is significantly shorter than the interval over which one can obtainmasking of pattern information. This result suggests that channelssignaling the location of a stimulus integrate information over ashorter interval of time than channels carrying pattern information.
Notes1. Cox and Dember (1972) obtained type B metacontrast functions using a detection task;
hence their results are an exception to the general finding that no masking is obtainedwith a detection criterion. This discrepancy can be explained on the basis of employingdifferent criterion contents. Cox and Dember (1972) used black-on-white target andmask stimuli and subjects were required to detect the target. One way of obtaining atype B function in a detection task is to require subjects to detect the presence of a blacktarget rather than just any target presence. In the former case the criterion contentwould be brightness or contrast; in the latter case, it could be apparent movement.Since brightness or contrast reversal can be obtained in backward masking by light andmetacontrast (Barry and Dick 1972; Brussel et al. 1978; Purcell and Dember 1968) at optimal SOAs, the location of the black target will appear even brighter than thebackground. Hence, if a contrast criterion is used, the target will not be detected as black.
SUMMARY 79
2. The stimuli were generated using a Cambridge Research Systems visual stimulus generator (VSG2/3). A Vis Res Graphics VRG2–21 monochrome monitor with P46phosphor driven at a frame rate of 239 Hz was used. The resolution of the monitor was704 pixels and 400 pixels horizontally (H) and vertically (V), respectively. At the viewingdistance of 108 cm, each pixel was 1.65(H) � 1.46(V) min2. VSG2/3 was used in 12-bitluminance resolution mode and the luminance of the monitor was gamma-correctedfor linearity. The background field was of dimensions 19.4(H) � 9.8(V) deg2 and hada luminance of 10 cd/m2. A fixation stimulus was presented at the center of the display.The stimulus configuration was similar to that used by Macknik and Livingstone(1998). The target consisted of two vertical bars presented symmetrically 3.3� to the leftand right of the fixation stimulus. The width of the target bars was 16.5�. One of the target bars (left or right chosen randomly from trial to trial) had a height of 3.9� andthe other had a height of 4.88�. The mask stimuli consisted of two flanking bars foreach target bar. Each of the mask bars was of dimensions 16.5� (H) � 4.88� (V). Thehorizontal center-to-center separation between the target bar and each of the mask barswas 19.86�. The shorter target bar was always presented within the space between themask bars but had a random vertical offset to minimize position cues. The subject’s taskwas to indicate which of the two target bars (left of right) appeared shorter.
3. In our own informal observations using a variety of target and mask shapes and sizes (e. g. vertical and horizontal bars of varying lengths and heights) we have observedcross-polarity metacontrast suppression of brightness or contrast, particularly when the target (and mask) stimuli were relatively small. Thus a more systematic parametricstudy to determine under what task and stimulus conditions one does or does notobtain such metacontrast suppression seems to be in order.
4. While one of us (BGB) was a research associate with Dr Bela Julesz at Bell Laboratories,Murray Hill, NJ, in the year 1973–1974, he conducted an extensive set of unreportedexperiments on backward lateral masking using cyclopean stimuli consisting of a central vertical rectangle flanked by two vertical mask rectangles. Orthogonally varyingparameters such as lateral separation between target and mask stimuli, size of targetand mask stimuli, disparity (crossed or uncrossed) of both the target and mask stimulirelative to the cyclopean background plane, and disparity or depth of the cyclopean target relative to the mask uniformly yielded type A backward masking functions.These results are in line with those of the two experiments published by Vernoy (1976)and Lehmkuhle and Fox (1980).
5. For a more extensive and illustrated account of Stile’s rationale and the accompanyingexperimental results, see Marriott (1962).
6. One of us (BGB) has also noted this effect in his unpublished observations ofmetacontrast. Here, an outline square with a gap in one of the randomly chosen sidesserved as a target and a surrounding larger outline square served as a metacontrastmask. At intermediate SOAs, where metacontrast suppression of the target is pronounced, one could nevertheless determine the position of the gap in the target by the phenomenal presence of an inherited gap or indentation in the adjacent maskcontour (see Fig. 2.2).
METHODS, APPLICATIONS, AND FINDINGS IN VISUAL PATTERN MASKING80
Chapter 3
Neurobiological correlates ofvisual pattern masking
3.1. IntroductionBecause masking is not a unitary phenomenon, the visibility of atarget can be reduced as a result of a large variety of neural factorsincluding light adaptation at the photoreceptors, inhibitory receptive-field surrounds, and sophisticated cortical interactions. Since it isbeyond the scope of this chapter to review all of these mechanisms, wewill focus on neural correlates of visual pattern masking at corticallevels. Within this context, studies that employed a uniform flash oflight as a mask and obtained type A forward and backward maskingfunctions (Coenan and Eijkman 1972; Donchin and Lindsey 1965;Donchin et al. 1963; Fehmi et al. 1969; Lindsey et al. 1967) are notreviewed. Such functions would be expected, since uniform flashesof light typically produce type A forward and backward maskingfunctions when psychophysical indicators of masking are used(e.g. Sperling 1965). Since uniform flashes of light, by definition, donot contain any contours defined by luminance or chromaticcontrasts, the use of such masks renders these results largely irrelevantto pattern masking. Early single-cell studies of visual masking in thelateral geniculate nucleus (LGN) of cat (Schiller 1968) also failed toyield anything other than type A functions of metacontrast or masking by pattern. Schiller (1968) correctly concluded that correlatesof type B brightness suppression characterizing metacontrast are notto be found in single-cell activities of the retina or LGN. Belowwe review more recent studies that have investigated electro-physiological correlates of visual pattern masking at cortical levels inprimates.
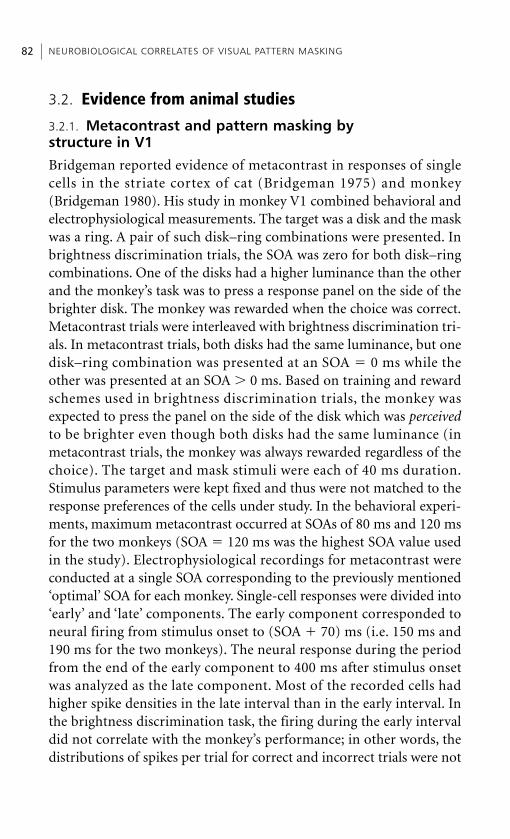
NEUROBIOLOGICAL CORRELATES OF VISUAL PATTERN MASKING82
3.2. Evidence from animal studies
3.2.1. Metacontrast and pattern masking by structure in V1
Bridgeman reported evidence of metacontrast in responses of singlecells in the striate cortex of cat (Bridgeman 1975) and monkey(Bridgeman 1980). His study in monkey V1 combined behavioral andelectrophysiological measurements. The target was a disk and the maskwas a ring. A pair of such disk–ring combinations were presented. Inbrightness discrimination trials, the SOA was zero for both disk–ringcombinations. One of the disks had a higher luminance than the otherand the monkey’s task was to press a response panel on the side of thebrighter disk. The monkey was rewarded when the choice was correct.Metacontrast trials were interleaved with brightness discrimination tri-als. In metacontrast trials, both disks had the same luminance, but onedisk–ring combination was presented at an SOA � 0 ms while theother was presented at an SOA � 0 ms. Based on training and rewardschemes used in brightness discrimination trials, the monkey wasexpected to press the panel on the side of the disk which was perceivedto be brighter even though both disks had the same luminance (inmetacontrast trials, the monkey was always rewarded regardless of thechoice). The target and mask stimuli were each of 40 ms duration.Stimulus parameters were kept fixed and thus were not matched to theresponse preferences of the cells under study. In the behavioral experi-ments, maximum metacontrast occurred at SOAs of 80 ms and 120 msfor the two monkeys (SOA � 120 ms was the highest SOA value usedin the study). Electrophysiological recordings for metacontrast wereconducted at a single SOA corresponding to the previously mentioned‘optimal’ SOA for each monkey. Single-cell responses were divided into‘early’ and ‘late’ components. The early component corresponded toneural firing from stimulus onset to (SOA � 70) ms (i.e. 150 ms and190 ms for the two monkeys). The neural response during the periodfrom the end of the early component to 400 ms after stimulus onsetwas analyzed as the late component. Most of the recorded cells hadhigher spike densities in the late interval than in the early interval. Inthe brightness discrimination task, the firing during the early intervaldid not correlate with the monkey’s performance; in other words, thedistributions of spikes per trial for correct and incorrect trials were not
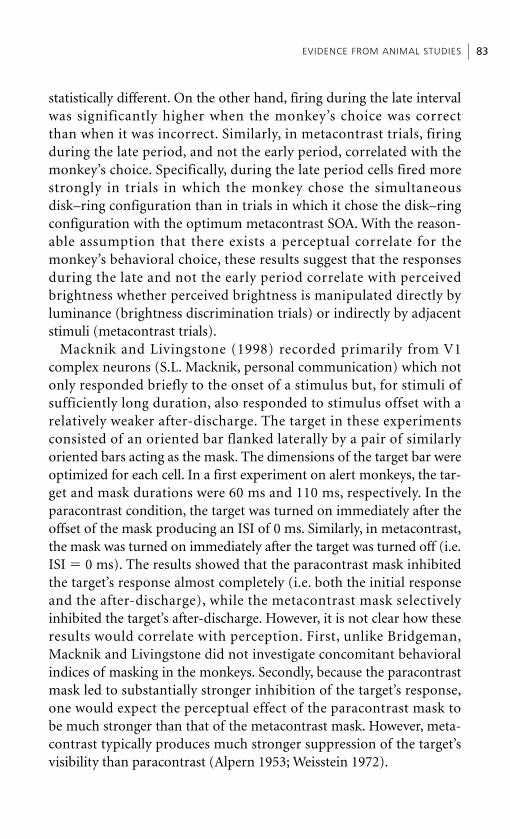
statistically different. On the other hand, firing during the late intervalwas significantly higher when the monkey’s choice was correctthan when it was incorrect. Similarly, in metacontrast trials, firingduring the late period, and not the early period, correlated with themonkey’s choice. Specifically, during the late period cells fired morestrongly in trials in which the monkey chose the simultaneousdisk–ring configuration than in trials in which it chose the disk–ringconfiguration with the optimum metacontrast SOA. With the reason-able assumption that there exists a perceptual correlate for themonkey’s behavioral choice, these results suggest that the responsesduring the late and not the early period correlate with perceivedbrightness whether perceived brightness is manipulated directly byluminance (brightness discrimination trials) or indirectly by adjacentstimuli (metacontrast trials).
Macknik and Livingstone (1998) recorded primarily from V1complex neurons (S.L. Macknik, personal communication) which notonly responded briefly to the onset of a stimulus but, for stimuli ofsufficiently long duration, also responded to stimulus offset with arelatively weaker after-discharge. The target in these experimentsconsisted of an oriented bar flanked laterally by a pair of similarlyoriented bars acting as the mask. The dimensions of the target bar wereoptimized for each cell. In a first experiment on alert monkeys, the tar-get and mask durations were 60 ms and 110 ms, respectively. In theparacontrast condition, the target was turned on immediately after theoffset of the mask producing an ISI of 0 ms. Similarly, in metacontrast,the mask was turned on immediately after the target was turned off (i.e.ISI � 0 ms). The results showed that the paracontrast mask inhibitedthe target’s response almost completely (i.e. both the initial responseand the after-discharge), while the metacontrast mask selectivelyinhibited the target’s after-discharge. However, it is not clear how theseresults would correlate with perception. First, unlike Bridgeman,Macknik and Livingstone did not investigate concomitant behavioralindices of masking in the monkeys. Secondly, because the paracontrastmask led to substantially stronger inhibition of the target’s response,one would expect the perceptual effect of the paracontrast mask tobe much stronger than that of the metacontrast mask. However, meta-contrast typically produces much stronger suppression of the target’svisibility than paracontrast (Alpern 1953; Weisstein 1972).
EVIDENCE FROM ANIMAL STUDIES 83
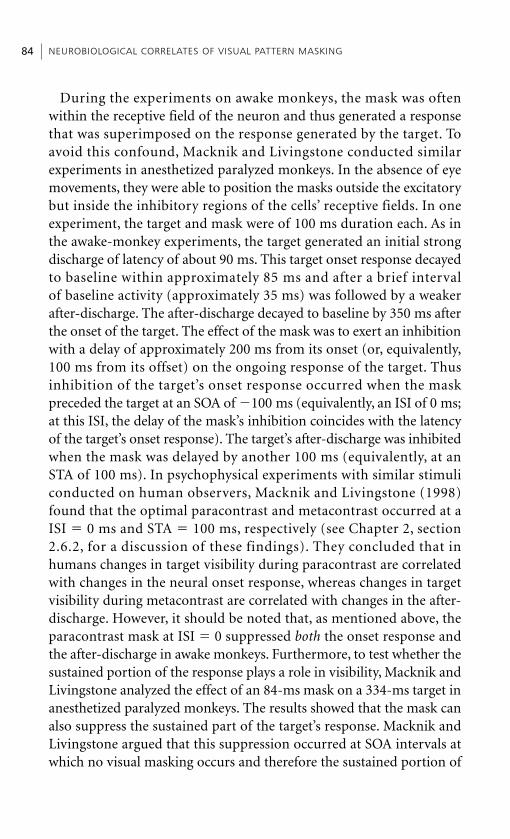
During the experiments on awake monkeys, the mask was oftenwithin the receptive field of the neuron and thus generated a responsethat was superimposed on the response generated by the target. Toavoid this confound, Macknik and Livingstone conducted similarexperiments in anesthetized paralyzed monkeys. In the absence of eyemovements, they were able to position the masks outside the excitatorybut inside the inhibitory regions of the cells’ receptive fields. In oneexperiment, the target and mask were of 100 ms duration each. As inthe awake-monkey experiments, the target generated an initial strongdischarge of latency of about 90 ms. This target onset response decayedto baseline within approximately 85 ms and after a brief intervalof baseline activity (approximately 35 ms) was followed by a weakerafter-discharge. The after-discharge decayed to baseline by 350 ms afterthe onset of the target. The effect of the mask was to exert an inhibitionwith a delay of approximately 200 ms from its onset (or, equivalently,100 ms from its offset) on the ongoing response of the target. Thusinhibition of the target’s onset response occurred when the maskpreceded the target at an SOA of �100 ms (equivalently, an ISI of 0 ms;at this ISI, the delay of the mask’s inhibition coincides with the latencyof the target’s onset response). The target’s after-discharge was inhibitedwhen the mask was delayed by another 100 ms (equivalently, at anSTA of 100 ms). In psychophysical experiments with similar stimuliconducted on human observers, Macknik and Livingstone (1998)found that the optimal paracontrast and metacontrast occurred at aISI � 0 ms and STA � 100 ms, respectively (see Chapter 2, section2.6.2, for a discussion of these findings). They concluded that inhumans changes in target visibility during paracontrast are correlatedwith changes in the neural onset response, whereas changes in targetvisibility during metacontrast are correlated with changes in the after-discharge. However, it should be noted that, as mentioned above, theparacontrast mask at ISI � 0 suppressed both the onset response andthe after-discharge in awake monkeys. Furthermore, to test whether thesustained portion of the response plays a role in visibility, Macknik andLivingstone analyzed the effect of an 84-ms mask on a 334-ms target inanesthetized paralyzed monkeys. The results showed that the mask canalso suppress the sustained part of the target’s response. Macknik andLivingstone argued that this suppression occurred at SOA intervals atwhich no visual masking occurs and therefore the sustained portion of
NEUROBIOLOGICAL CORRELATES OF VISUAL PATTERN MASKING84
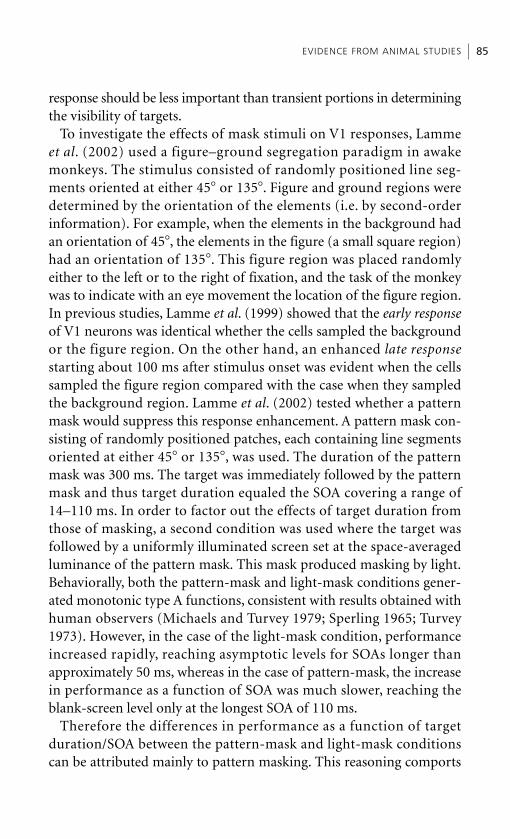
response should be less important than transient portions in determiningthe visibility of targets.
To investigate the effects of mask stimuli on V1 responses, Lammeet al. (2002) used a figure–ground segregation paradigm in awakemonkeys. The stimulus consisted of randomly positioned line seg-ments oriented at either 45� or 135�. Figure and ground regions weredetermined by the orientation of the elements (i.e. by second-orderinformation). For example, when the elements in the background hadan orientation of 45�, the elements in the figure (a small square region)had an orientation of 135�. This figure region was placed randomlyeither to the left or to the right of fixation, and the task of the monkeywas to indicate with an eye movement the location of the figure region.In previous studies, Lamme et al. (1999) showed that the early responseof V1 neurons was identical whether the cells sampled the backgroundor the figure region. On the other hand, an enhanced late responsestarting about 100 ms after stimulus onset was evident when the cellssampled the figure region compared with the case when they sampledthe background region. Lamme et al. (2002) tested whether a patternmask would suppress this response enhancement. A pattern mask con-sisting of randomly positioned patches, each containing line segmentsoriented at either 45� or 135�, was used. The duration of the patternmask was 300 ms. The target was immediately followed by the patternmask and thus target duration equaled the SOA covering a range of14–110 ms. In order to factor out the effects of target duration fromthose of masking, a second condition was used where the target wasfollowed by a uniformly illuminated screen set at the space-averagedluminance of the pattern mask. This mask produced masking by light.Behaviorally, both the pattern-mask and light-mask conditions gener-ated monotonic type A functions, consistent with results obtained withhuman observers (Michaels and Turvey 1979; Sperling 1965; Turvey1973). However, in the case of the light-mask condition, performanceincreased rapidly, reaching asymptotic levels for SOAs longer thanapproximately 50 ms, whereas in the case of pattern-mask, the increasein performance as a function of SOA was much slower, reaching theblank-screen level only at the longest SOA of 110 ms.
Therefore the differences in performance as a function of targetduration/SOA between the pattern-mask and light-mask conditionscan be attributed mainly to pattern masking. This reasoning comports
EVIDENCE FROM ANIMAL STUDIES 85
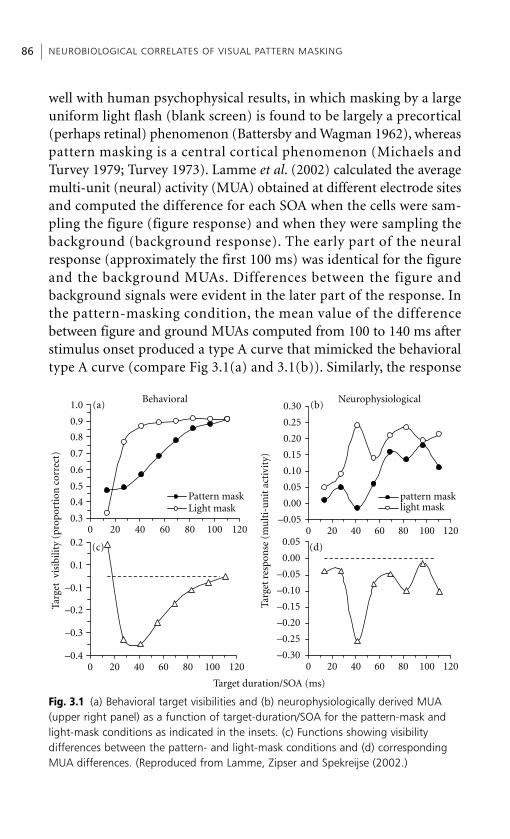
well with human psychophysical results, in which masking by a largeuniform light flash (blank screen) is found to be largely a precortical(perhaps retinal) phenomenon (Battersby and Wagman 1962), whereaspattern masking is a central cortical phenomenon (Michaels andTurvey 1979; Turvey 1973). Lamme et al. (2002) calculated the averagemulti-unit (neural) activity (MUA) obtained at different electrode sitesand computed the difference for each SOA when the cells were sam-pling the figure (figure response) and when they were sampling thebackground (background response). The early part of the neuralresponse (approximately the first 100 ms) was identical for the figureand the background MUAs. Differences between the figure andbackground signals were evident in the later part of the response. Inthe pattern-masking condition, the mean value of the differencebetween figure and ground MUAs computed from 100 to 140 ms afterstimulus onset produced a type A curve that mimicked the behavioraltype A curve (compare Fig 3.1(a) and 3.1(b)). Similarly, the response
NEUROBIOLOGICAL CORRELATES OF VISUAL PATTERN MASKING86
Behavioral Neurophysiological
Targ
et v
isib
ility
(pr
opor
tion
cor
rect
)
Targ
et r
espo
nse
(m
ult
i-u
nit
act
ivit
y)
Target duration/SOA (ms)
0.3
0.4
0.5
0.6
0.7
0.8
0.9
1.0
0 20 40 60 80 100 120 0 20 40 60 80 100 120
0 20 40 60 80 100 1200 20 40 60 80 100 120
Pattern maskLight mask
–0.05
0.00
0.05
0.10
0.15
0.20
0.25
0.30
pattern masklight mask
–0.4
–0.3
–0.2
–0.1
0.1
0.2
–0.30
–0.25
–0.20
–0.15
–0.10
–0.05
0.00
0.05
(a)
(c)
(b)
(d)
Fig. 3.1 (a) Behavioral target visibilities and (b) neurophysiologically derived MUA(upper right panel) as a function of target-duration/SOA for the pattern-mask andlight-mask conditions as indicated in the insets. (c) Functions showing visibility differences between the pattern- and light-mask conditions and (d) correspondingMUA differences. (Reproduced from Lamme, Zipser and Spekreijse (2002.)
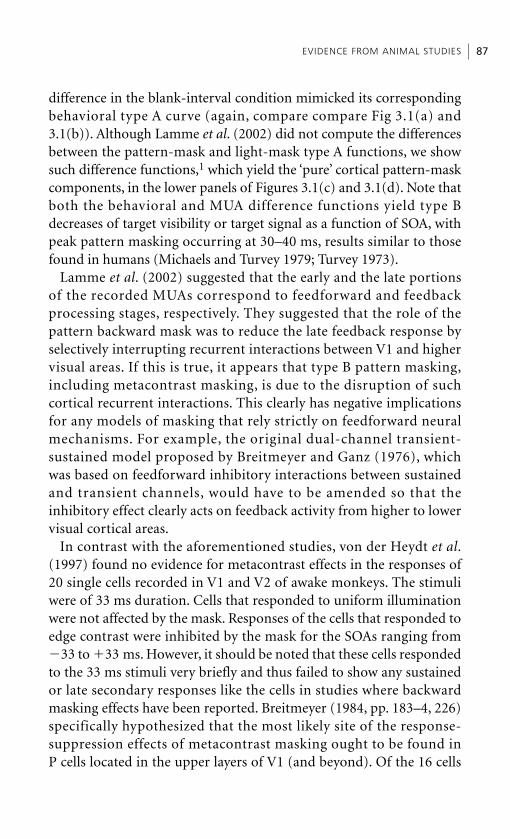
difference in the blank-interval condition mimicked its correspondingbehavioral type A curve (again, compare compare Fig 3.1(a) and3.1(b)). Although Lamme et al. (2002) did not compute the differencesbetween the pattern-mask and light-mask type A functions, we showsuch difference functions,1 which yield the ‘pure’ cortical pattern-maskcomponents, in the lower panels of Figures 3.1(c) and 3.1(d). Note thatboth the behavioral and MUA difference functions yield type Bdecreases of target visibility or target signal as a function of SOA, withpeak pattern masking occurring at 30–40 ms, results similar to thosefound in humans (Michaels and Turvey 1979; Turvey 1973).
Lamme et al. (2002) suggested that the early and the late portionsof the recorded MUAs correspond to feedforward and feedbackprocessing stages, respectively. They suggested that the role of thepattern backward mask was to reduce the late feedback response byselectively interrupting recurrent interactions between V1 and highervisual areas. If this is true, it appears that type B pattern masking,including metacontrast masking, is due to the disruption of suchcortical recurrent interactions. This clearly has negative implicationsfor any models of masking that rely strictly on feedforward neuralmechanisms. For example, the original dual-channel transient-sustained model proposed by Breitmeyer and Ganz (1976), whichwas based on feedforward inhibitory interactions between sustainedand transient channels, would have to be amended so that theinhibitory effect clearly acts on feedback activity from higher to lowervisual cortical areas.
In contrast with the aforementioned studies, von der Heydt et al.(1997) found no evidence for metacontrast effects in the responses of20 single cells recorded in V1 and V2 of awake monkeys. The stimuliwere of 33 ms duration. Cells that responded to uniform illuminationwere not affected by the mask. Responses of the cells that responded toedge contrast were inhibited by the mask for the SOAs ranging from�33 to �33 ms. However, it should be noted that these cells respondedto the 33 ms stimuli very briefly and thus failed to show any sustainedor late secondary responses like the cells in studies where backwardmasking effects have been reported. Breitmeyer (1984, pp. 183–4, 226)specifically hypothesized that the most likely site of the response-suppression effects of metacontrast masking ought to be found inP cells located in the upper layers of V1 (and beyond). Of the 16 cells
EVIDENCE FROM ANIMAL STUDIES 87
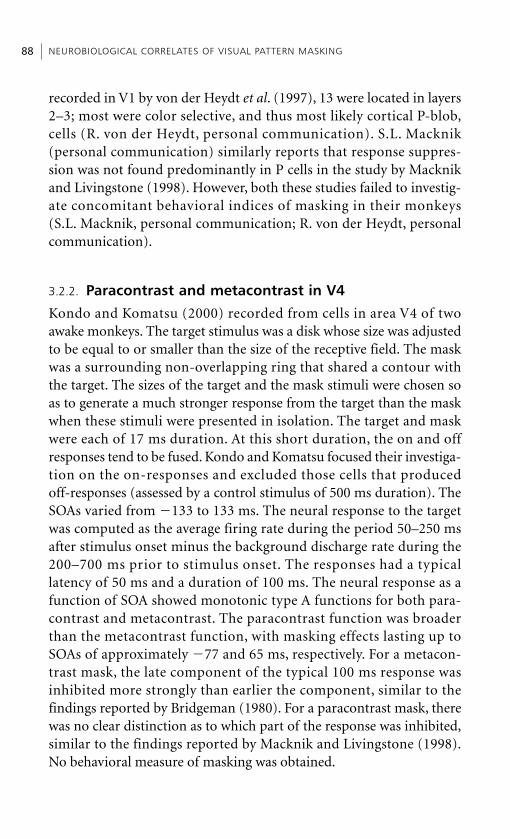
recorded in V1 by von der Heydt et al. (1997), 13 were located in layers2–3; most were color selective, and thus most likely cortical P-blob,cells (R. von der Heydt, personal communication). S.L. Macknik (personal communication) similarly reports that response suppres-sion was not found predominantly in P cells in the study by Macknikand Livingstone (1998). However, both these studies failed to investig-ate concomitant behavioral indices of masking in their monkeys(S.L. Macknik, personal communication; R. von der Heydt, personalcommunication).
3.2.2. Paracontrast and metacontrast in V4
Kondo and Komatsu (2000) recorded from cells in area V4 of twoawake monkeys. The target stimulus was a disk whose size was adjustedto be equal to or smaller than the size of the receptive field. The maskwas a surrounding non-overlapping ring that shared a contour withthe target. The sizes of the target and the mask stimuli were chosen soas to generate a much stronger response from the target than the maskwhen these stimuli were presented in isolation. The target and maskwere each of 17 ms duration. At this short duration, the on and offresponses tend to be fused. Kondo and Komatsu focused their investiga-tion on the on-responses and excluded those cells that produced off-responses (assessed by a control stimulus of 500 ms duration). TheSOAs varied from �133 to 133 ms. The neural response to the targetwas computed as the average firing rate during the period 50–250 msafter stimulus onset minus the background discharge rate during the200–700 ms prior to stimulus onset. The responses had a typicallatency of 50 ms and a duration of 100 ms. The neural response as afunction of SOA showed monotonic type A functions for both para-contrast and metacontrast. The paracontrast function was broaderthan the metacontrast function, with masking effects lasting up toSOAs of approximately �77 and 65 ms, respectively. For a metacon-trast mask, the late component of the typical 100 ms response wasinhibited more strongly than earlier the component, similar to thefindings reported by Bridgeman (1980). For a paracontrast mask, therewas no clear distinction as to which part of the response was inhibited,similar to the findings reported by Macknik and Livingstone (1998).No behavioral measure of masking was obtained.
NEUROBIOLOGICAL CORRELATES OF VISUAL PATTERN MASKING88
3.2.3. Backward pattern masking in frontal eye field
The neurophysiological studies discussed above probed changes inactivities at early cortical levels in correlation with either the expectedor the measured changes in the strength of backward masking. In theirstudy on behaving monkeys, Thompson and Schall (1999, 2000) took adifferent perspective to the problem by recording neural responses inthe frontal eye field (FEF), a subdivision of the prefrontal cortex. Thetarget stimulus was a dim blue square which, when present in a trial,appeared randomly at one of several possible locations. The mask con-sisted of bright white squares of the same dimension as the target butappearing at all possible target locations. The monkey’s task was tomake a saccade after stimulus presentation to the location of the targetwhen the target was present and to maintain fixation when the targetwas absent. Monotonic type A masking functions were obtained inboth monkeys studied. During the electrophysiological experiments,the performance of the monkeys was monitored and the SOA wasadjusted to obtain about 50 percent correct performance in target-present trials. Because both the target and the mask could generateresponses in the neurons, there was significant activity under all stimu-lus—response combinations (‘hit’, ‘miss’, ‘correct rejection’, and ‘falsealarm’ cases). The magnitude of early activity, particularly when aver-aged over a time interval equal to the SOA and immediately precedingthe mask response, correlated with the behavioral response. Thehighest early activity corresponded to hits, and progressively lowerlevels of early activity corresponded to misses, false alarms, and correctrejections. The differences in the early activity for hits vs. misses andfor false alarms vs. correct rejections were small, corresponding to 1–2spikes per trial. Furthermore, in many visual and all eye-movementneurons recorded in the FEF, there was a late response phase whoseamplitude correlated with the behavioral choice of the monkey, i.e.higher activity for hits and false alarms and lower activity for missesand correct rejections. In contrast with the differences observed inearly responses, the differences for hits vs. misses and for false alarmsvs. correct rejections were large in the late responses. Because eye-movement neurons project to oculomotor structures, the lateactivity in these neurons can be interpreted as the motor-commandsignal leading to the behavioral response. Thompson and Schall (1999,2000) suggested that the late activity in visual neurons, which do not
EVIDENCE FROM ANIMAL STUDIES 89
project to the oculomotor centers, initiates feedback signals to theextrastriate visual cortex. Although this study does not address directlythe effect of stimulus timing, a crucial parameter in backward masking,it sheds light on the relation between neural responses and thebehavioral report. From the perspective of signal detection theory(Green and Swets 1966), the simple detection tasks used by Thompsonand Schall imply use of criterion contents and levels that are based onsignificant neural responses even in trials where the monkeys report‘not seeing’ the stimulus.
3.2.4. Backward pattern masking in temporal cortex
One limitation of the study by Thompson and Schall (1999, 2000) wasthat both target and mask stimuli generated responses in neuronsunder study, rendering an isolation of the ‘pure target’ response impos-sible. This problem had been bypassed by other studies that recordedneural responses in macaque temporal cortex under backward maskingconditions (Kovács et al. 1995; Rolls and Tovée 1994; Rolls et al. 1994,1999). Since the temporal cortex contains neurons with a high degreeof shape selectivity (e.g. Desimone et al. 1984; Gross et al., 1972;Pasupathy and Connor 2002; Rolls 1992; Tanaka et al. 1991, Tsunodaet al. 2001), a mask stimulus that generates negligible responses in theneurons under study can be used.
Kovács et al. (1995) recorded from monkey inferior temporal (IT)cortex under a backward pattern-masking paradigm. The task wasshape discrimination. The mask onset immediately followed the targetoffset, and the total duration of the target and mask stimuli was kept at300 ms. Thus variations of SOA produced correlated changes in targetand mask durations. With these stimulus parameters, the behavioralmasking function was type A. To assess the task-related information,the difference between the responses to the shapes that generated thestrongest and weakest activity in the cell was computed. This ‘responsedifference’ (RD) was significant under all conditions, including thosethat induced strong backward masking in psychophysical experiments.Of the four target duration (or SOA) values used in the electrophysio-logical experiments, two (20 and 40 ms) produced masking effects inbehavioral experiments.
To assess the effect of masking on neural responses, Kovács et al. (1995)compared the RD for target-only (unmasked) and target-and-mask
NEUROBIOLOGICAL CORRELATES OF VISUAL PATTERN MASKING90
(masked) conditions for these two durations. For the 20 ms targetduration (or SOA) condition, the RD integrated over 20 ms afterresponse onset was the same for unmasked and masked conditions. Asthe integration period was increased from 20 to 160 ms, the RDincreased for the unmasked condition but remained relatively constantfor the masked condition. Thus the masking effect was significantwhen the RD was integrated for intervals longer than 20 ms. For the40 ms target duration (or SOA), the RD increased for an integrationperiod of up to 80 ms for the masked condition, but over the entirerange (20–160 ms) for the unmasked condition. Thus, while the RDwas about the same in the masked and unmasked conditions for integ-ration periods of 20 and 40 ms, the masking effect became significantfor integration periods longer than 40 ms. Consequently, backwardmasking effects can be observed in IT neurons if one assumes that theneuronal responses are temporally integrated. The integration time forwhich the masking effect becomes apparent depends on the durationof the stimulus. The role of temporal integration was also supported bya receiver operating characteristic (ROC) analysis of the data. Theearliest part of the response (approximately 20 ms) did not containreliable information for accurate discrimination of shapes, sinceintegration of information over longer durations is required. The effectof the mask was to suppress the information available in the later partof the response (or to interrupt the ongoing response), thereby reduc-ing the performance by making temporal integration ineffective.Another finding was that a difference (relative increase) of few spikeswithin an integration interval of 80 ms was a sufficient correlate of ahigh level of discrimination. This finding is in agreement withinformation-theoretic analyses of spike trains which suggest that asingle spike can carry several bits of information when the system issubjected to time-varying stimuli (Rieke et al. 1997).
Rolls and colleagues (Rolls and Tovée 1994; Rolls et al. 1994, 1999;reviewed by Rolls 2005) studied the effect of backward pattern maskingin monkey IT cortex using faces as target stimuli (duration 16 ms) andless effective non-face stimuli or ineffective faces as masks (duration300 ms). These stimulus configurations generated type A maskingfunctions. When the target stimulus was presented alone, neuronsresponded for durations of the order of 200–300 ms. Rolls et al. (1999)applied information-theoretic analysis to neural responses and
EVIDENCE FROM ANIMAL STUDIES 91
quantified the amount of information available under backwardmasking conditions. They found significant responses, even underconditions yielding strong masking as measured by a previous study(Rolls et al. 1994), and concluded that the information is encoded inthe difference of activities and not by simple presence of absence ofactivity. When the firing rate or the cumulative number of spikes wasconsidered, only the responses to the most effective stimulus changedas a function of SOA. The average response of all cells and the responseto the least effective stimulus did not change significantly as a functionof SOA. However, when the amount of information was calculatedusing Shannon ‘s (1948) formulation, SOA had a significant effect notonly on responses to most effective stimulus, but also on averageresponses. Moreover, the attenuation generated by the mask wasstrongest in the part of the response carrying the peak informationabout the stimulus. Consequently, the mask reduced the amount ofinformation more strongly than the firing rate.
3.3. Evidence from human studies
3.3.1. VEP studies of para- and metacontrast
Recordings of cortical visually evoked potentials (CVEPs) have beenused to study both para- and metacontrast. In addition to obtainingsubjective target-visibility ratings, Kaitz et al. (1985) recorded CVEPsduring ring–disk paracontrast. Together with paracontrast maxima ator near target–mask synchrony and at SOAs of �150 to �75 ms whensubjective ratings were used (see Chapter 2, section 2.5), the observersalso tended to yield two similar maxima peaking correspondinglybetween �30 and 0 ms and between �100 and �75 ms when CVEPmeasures were used. According to the findings of Breitmeyer et al. (inpress) and their interpretation of paracontrast, these two maximawould correspond to surface/contrast-specific and contour/form-specific processes, respectively.
The CVEP studies of metacontrast, while more numerous, are lessconsistent in their results and interpretations. In the following, we shalltry to disentangle these inconsistencies, and give plausible reasons forthem. In their CVEP study of metacontrast, Jeffreys and Musselwhite(1986) looked at the effects of a metacontrast mask on the C1 and C2component (Jeffreys and Axford 1972a,b) of the CVEP to the target.
NEUROBIOLOGICAL CORRELATES OF VISUAL PATTERN MASKING92
They assumed that the C1 and C2 components of the CVEP originatefrom the striate cortex (area 17/V1) and the extrastriate cortex (area18/V2 (or beyond?)), respectively. Their results showed that thesecomponents of the target’s pattern-specific CVEP are not affected byan aftercoming mask. Here we issue several caveats. First, Jeffreys andMusselwhite (1986) note that it is difficult to compare their CVEPresults with those of neurophysiological studies of metacontrast sincethe relation of scalp potentials to underlying neural activity is notknown. Hence the ability to localize the components is limited in preci-sion. Therefore it is entirely possible that the C1 and C2 componentsare generated by cortical pattern-specific mechanisms respondingprior to the suppressive effects of the mask. Moreover, there is not evena clear consensus as to the general site of neural generation of the C1and C2 components. While Jeffreys and Musselwhite (1986) favorstriate area 17/V1 and area 18/V2 (and possibly beyond), respectively,the analyses of CVEPs by Drasdo (1980) and Maier et al. (1987) favorarea 18 (or 19) and area 17, respectively.
These localization difficulties aside, other CVEP studies show thatindicators of sequential blanking (Andreassi et al. 1971, 1974) and type Bmetacontrast effects (Andreassi et al. 1975; Schiller and Chorover 1966;Vaughan and Silverstein 1968) can be found in the later (N2 and P2) butnot the earlier (Schwartz and Pritchard 1981) components of the target’sCVEP. The later response components are optimally suppressed at SOAsof 30–60 ms where psychophysical indicators also show optimal mask-ing. Bridgeman’s (1988) reanalysis of Jeffrey and Musselwhite’s (1986)results tend to confirm this finding. However, as noted by Jeffreys andMusselwhite (1986), interpretations of such results are in turn complic-ated by the fact that the target-evoked and mask-evoked responses arenot clearly separable in the later CVEP components. Despite thiscomplication, these CVEP results have important theoretical implicationswhich are discussed more fully in Chapters 4 and 8.
3.3.2. Functional MRI studies of backwardpattern masking
Functional magnetic resonance imaging (fMRI) is a relatively new toolwhich has been used recently to investigate neural correlates of mask-ing. Green et al. (2005a) used a circle with a gap and 12 overlappingcircles as the target and mask stimuli, respectively. The target and mask
EVIDENCE FROM HUMAN STUDIES 93
durations were 34 and 68 ms, respectively. Three SOA values (34, 68,and 102 ms) were used. The observers viewed the stimuli in the scan-ner and their task was to report the location of the gap (top, bottom,left, or right) by pushing one of four coded buttons on a response pad.The masking functions were of type A. Two methods were used toidentify regions of interest. The a priori method identified four areasknown to be involved in visual processing, namely early visual areas(V1 and V2), the motion-sensitive regions in the lateral occipital (LO)lobe (human area MT), and the dorsal and ventral components of theobject-sensitive region in the LO. Among these areas, only the ventralLO region, and to a lesser degree the dorsal LO region, showed acorrelated activity with the masking function, i.e. higher activity forlonger SOAs. The second method, the data-driven approach, identifiedsix regions based on their activation by the stimuli regardless of theirsensitivity to SOAs. These regions were the inferior parietal, anteriorcingulate, precentral insula, thalamic, and occipital areas. Correlationsbetween activity and masking function was observed in the thalamus,inferior parietal, and anterior cingulate.
Since Green et al. (2005a) employed backward masking by overlap-ping pattern, it is not clear to what extent the results they obtainedreflect cortical processes that relate uniquely to type B metacontrastmechanisms rather than other types of pattern-masking mechanisms.Recently, Haynes et al. (2005) obtained fMRI as well as psychophysicaldata on human observers in a masking study that used a clear metacon-trast task in which target and mask elements did not overlap spatially.An illustration of their targets and masks is shown in Figure 3.2(a). Thetargets consisted of a regular honeycomb-like array of white hexagonsthat could be surrounded by white-outlined hexagons. Four such arrayswere presented, one in each visual quadrant, equidistant from fixation.Along either the lower-left to upper-right quadrant axis or the upper-left to lower-right quadrant axis, one of the two target displays had acentral hexagon that was darker (target B) than that of the other display(target A). In the psychophysical task the observer in any trial was givena visual cue as to which quadrant axis to attend to and had to decide inwhich target display of the two cued quadrants the dark central hexagonwas located. The mask display, consisting of four outlined hexagondisplays, one of which surrounded each of the four target displays, waspresented at SOAs of 16.7, 33.3, 66.7, and 100 ms.
NEUROBIOLOGICAL CORRELATES OF VISUAL PATTERN MASKING94
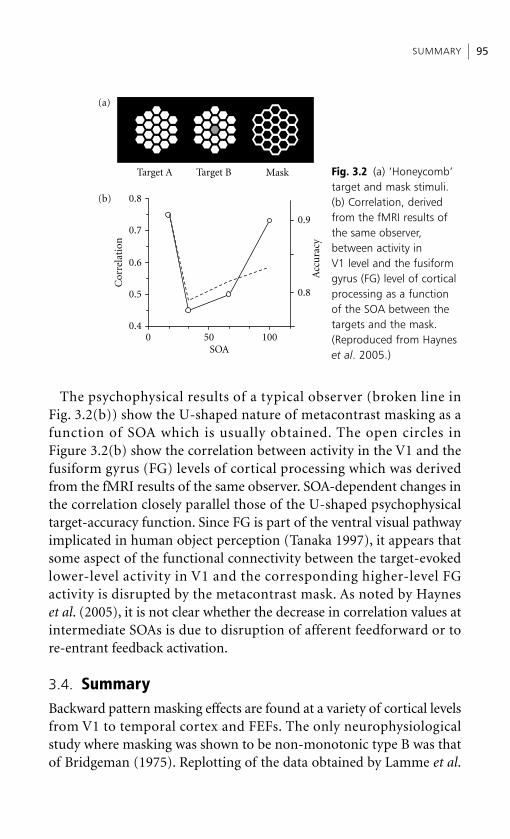
The psychophysical results of a typical observer (broken line inFig. 3.2(b)) show the U-shaped nature of metacontrast masking as afunction of SOA which is usually obtained. The open circles inFigure 3.2(b) show the correlation between activity in the V1 and thefusiform gyrus (FG) levels of cortical processing which was derivedfrom the fMRI results of the same observer. SOA-dependent changes inthe correlation closely parallel those of the U-shaped psychophysicaltarget-accuracy function. Since FG is part of the ventral visual pathwayimplicated in human object perception (Tanaka 1997), it appears thatsome aspect of the functional connectivity between the target-evokedlower-level activity in V1 and the corresponding higher-level FGactivity is disrupted by the metacontrast mask. As noted by Hayneset al. (2005), it is not clear whether the decrease in correlation values atintermediate SOAs is due to disruption of afferent feedforward or tore-entrant feedback activation.
3.4. SummaryBackward pattern masking effects are found at a variety of cortical levelsfrom V1 to temporal cortex and FEFs. The only neurophysiologicalstudy where masking was shown to be non-monotonic type B was thatof Bridgeman (1975). Replotting of the data obtained by Lamme et al.
SUMMARY 95
Target A Target B Mask
0.4
0.5
0.6
0.7
0.8
0 50 100
0.9
0.8
SOA
Cor
rela
tion
Acc
ura
cy
(a)
(b)
Fig. 3.2 (a) ‘Honeycomb’target and mask stimuli.(b) Correlation, derivedfrom the fMRI results ofthe same observer,between activity in V1 level and the fusiformgyrus (FG) level of corticalprocessing as a functionof the SOA between thetargets and the mask.(Reproduced from Hayneset al. 2005.)
(2002) to estimate cortical pattern-masking effects (Fig. 3.1) also showstype B masking function. In other studies, masking was either of type Aor was not explicitly assessed at the behavioral level. In future research,it would be highly desirable to use standard stimuli that reliably gener-ate type B masking. Furthermore, a combination of behavioral andneurophysiological measures would buttress further the relationshipbetween neural activities and masking functions.
One general observation from the studies reviewed here is that thebackward mask tends to inhibit or interrupt ‘late parts’ of the responses.However, the early vs. late distinction varies considerable from area toarea and from study to study, with the demarcation between these twophases ranging from 20 to 190 ms. Another common finding is thatsignificant neural activities exist even under strong masking conditions.Therefore backward masking is not simply related to the presence orabsence of activity but rather depends on quantitative, often small,changes in the activity. The details of neural coding strategies becomeimportant for an analysis of these differences. Methods from signaldetection theory as well as information theory suggest that task-relatedinformation is temporally distributed in neural responses and thattemporal integration is necessary to obtain reliable information. Theeffect of the mask in backward masking appears to make this temporalintegration ineffective.
Distribution of information across cell assemblies and its relation tobackward masking needs further study. If the information is temporallydistributed in neural responses, it remains to be determined whetherthe same information is distributed or different types of informationare represented at different phases of the response. The three-phaseoperation proposed in the retino-cortical dynamics (RECOD) model isan example of how information can be multiplexed in neural responses(see Chapter 5). The responses in the feedforward phase reflect coarseboundary information signaled by afferent connections, while theresponses in the feedback phase reflect fine boundary information sentby efferent connections (see Fig. 5.11). Similarly, the results ofLamme et al. (2002) suggest that the early responses in V1 cellsencode first-order stimulus-related information, while the late(feedback-dependent) responses signal second-order more globalfigure–ground relationships. Another study provides evidence that theinitial part of the responses in macaque IT cortex codes coarse
NEUROBIOLOGICAL CORRELATES OF VISUAL PATTERN MASKING96
information (monkey face vs. human face vs. shape) while the finerinformation about stimulus attributes (identity and expression of theface) is signaled in the part of the response starting approximately50 ms later (Sugase et al. 1999). If information multiplexing is carriedout through ‘traveling waves’ of activity among different neural centers,backward masking might involve multiple neural loci depending onthe SOA, the task, and the criterion content. When corrected forlatencies, backward masking effects are found in earlier parts of neuralresponses in the temporal cortex (within approximately the first80 ms) but in later parts of V1 responses (150 ms and higher).This observation consolidates the suggestion that the suppression oflate activities observed in V1 might be a manifestation of activities atlevels beyond and feeding back to V1 (Bridgeman 1980; Lamme et al.2000; Super et al. 2001). Similarly, Thompson and Schall (1999, 2000)suggest that late activity in visual FEF neurons feeds back to theextrastriate cortex.
Finally, recent fMRI studies are starting to provide a more globalview of masking correlates in terms of their localization and distribu-tion within and among different cortical areas. A combination of thesestudies with approaches that produce high temporal resolution wouldbe key not only in revealing cortical correlates of masking but also inelucidating the distributed architecture of the visual system’s real-timeinformation processing.
Note1. We thank Victor Lamme for making his data available to us.
SUMMARY 97

This page intentionally left blank
Chapter 4
Models and mechanisms of visualmasking: a selective review andcomparison
4.1. IntroductionIn the preceding chapters we reviewed many of the important findingsand only briefly mentioned some of the theories of masking by pattern.In this chapter we provide detailed outlines of recent models of lateralmasking, i.e. para- and metacontrast, as well as a review of several oldermodels. The topics covered in the preceding chapters are important inproviding the empirical framework for assessing the explanatory valid-ity and scope of the proposed mechanisms and models. The empiricalfindings on lateral masking are very extensive, and the significant ones,particularly those reported in the past two decades, are reviewed inChapter 2. Other reviews of past and recent findings have been givenby Breitmeyer (1984), Breitmeyer and Ögmen (2000), and Bachmann(1994). Despite this breadth of coverage, our evaluation of models andmechanisms is intentionally selective since only their most salient fea-tures are discussed. Additional findings will be introduced in laterchapters where we deal with issues of how masking relates to motionperception, conscious and unconscious perception, the control func-tion of attention, visual context and gestalt organization, and visualprocessing in selected subject populations. When appropriate, thetheoretical relevance of these findings will also be noted in the laterchapters. This will place the models and their evaluations in a broaderand richer empirical context. A comparison of mathematicalformalisms used in different models is provided in Appendix A.
Ever since paracontrast, metacontrast, and cognate phenomena werediscovered in the late nineteenth and early twentieth centuries,investigators have speculated about possible masking mechanisms. Forexample, in Chapter 1 we noted that McDougall (1904a) proposed
MODELS AND MECHANISMS OF VISUAL MASKING100
at least one possible mechanism for the suppression of Bidwell’s ghost(also known as the Purkinje image). In his experiment Charpentierbands and the trailing Bidwell’s ghost were produced by a rotatingtrans-illuminated aperture that putatively isolated rod responses.When a spatially displaced and temporally lagging aperture thatactivated cones was added to the display, the visibility of Bidwell’s ghostproduced by the leading aperture was suppressed. McDougall reasonedthat the faster cone response to the temporally lagging aperture sup-pressed the slower rod activity, and thus Bidwell’s ghost, generated by theleading aperture. This mechanism predates a similar one proposed byAlpern (1953) for explaining metacontrast. However, McDougall furthernoted that another masking mechanism, in addition to cone–rod inter-actions, resides in cone–cone interactions since he found that Bidwell’sghost was suppressed when both apertures presumably isolated the sametype of cone activity. Several subsequent studies of metacontrast haveconfirmed this latter conjecture (Foster 1978, 1979).
Regarding interactions among receptor responses, Stigler (1910,1926), following Exner’s (1898) conjecture, proposed that horizontalcells in the retina provided the basis for lateral inhibitory interactionsbetween the neural responses of the spatially adjacent stimuli typicallyused in his para- and metacontrast studies. In his first series of studies,Stigler (1910) failed to demonstrate dichoptic metacontrast effects andthis failure may have motivated his placing the interactive mechanismat a peripheral retinal level. However, his later study (Stigler 1926)demonstrated the existence of dichoptic metacontrast. Although notruling out interactions mediated by horizontal cells, this findingpointed to the existence of additional lateral interactions mediated atpost-retinal and most likely cortical sites of visual processing. It alsosuggested to Stigler two additional and related properties, synapticdelay(s) and overtake of the target response by that of the mask, thatmay contribute significantly to metacontrast. A version of the overtakehypothesis was adopted later by Crawford (1947) to explain maskingwhen the target was presented shortly before a more intense condition-ing or mask flash. In line with Stigler’s (1926) assumption ofpost-retinal lateral interactions, Fry (1934) pointed out that in meta-contrast the lateral effects of a temporally lagging flash on a leadingspatially adjacent flash may be mediated by processes along the entireretino-geniculo-cortical pathway.
In the last two decades, since the publication of the first edition ofthis book (Breitmeyer 1984), several additional models and mech-anisms of para- and metacontrast have been proposed. A few of thesemechanisms either explicitly or implicitly share features with thoseproposed by earlier investigators. Others were briefly mentioned inChapter 2, where we reviewed empirical findings. To accommodatedichoptic masking effects, one feature that past and current modelsshare in common is that their proposed mechanisms responsible forthe type B or U-shaped metacontrast and pattern masking functionsare located at cortical levels. The following models and mechanismsselected for review can be distinguished according to five generalcharacteristics:
(1) models based on spatiotemporal response sequences;
(2) models adopting some version of an overtake hypothesis;
(3) models based on two separate neural processes or channelactivations;
(4) models relying on stimulus or object substitution;
(5) models based on emergent properties of distributed neuralnetworks.
These characteristics are not mutually exclusive; however, they dopoint to differences of theoretical emphasis among the models. As willbe seen, most models rely on some version of the overtake hypothesis.One past model based on spatiotemporal response sequences alsoinvokes separate visual processing channels. Two of the recent modelsexplicitly adopt activation of separate neural channels or pathways toexplain metacontrast and other backward masking phenomena; theother two recent models, while not relying on separate pathway activa-tions, invoke separate neural processes. Although all subscribe to objectsubstitution as a phenomenal description of metacontrast that must beexplained, only two of them take object substitution as an underlyingoperative mechanism. Again in a general sense, all models subscribe tothe notion of distributed neural networks, although they differ in thedegree to which they explicitly formulate the quantitative properties ofthe networks. Our typology is somewhat limited (cf. Bachmann 1994)and arbitrary in that it is guided by what we regard as the distinctivecharacteristics of only the more noteworthy past and recent models.
INTRODUCTION 101
4.2. Spatiotemporal sequence modelsPresenting two spatially adjacent stimuli in rapid succession canproduce not only metacontrast masking of the first stimulus but also astrong sensation of apparent motion (Kolers 1972; Korte 1915). Asnoted in Chapter 1, in his extensive studies of apparent motionWertheimer (1912) had already reported the masking of the firststimulus in the apparent-motion sequence. Wertheimer’s informalobservations have been confirmed subsequently by numerous studiesdemonstrating similarities between apparent motion and metacontrastfunctions (Bischof and Di Lollo 1995; Breitmeyer et al. 1974, 1976;Didner and Sperling 1980; Di Lollo et al. 1993; Fehrer 1966; Fisicaroet al. 1977; Kahneman 1967; von Grünau 1978b; Yantis and Nakama1998). Since backward masking and apparent motion activatespatiotemporal sequence detectors, it seems plausible that the processesunderlying apparent motion and metacontrast are closely linked.Possible links have been proposed in three separate models. Furtherrelations of masking to motion perception are explored more fully inChapter 6.
4.2.1. Kahneman’s impossible motion model
Kahneman (1967) proposed a model of metacontrast in whichstroboscopic motion plays a causal role in metacontrast. Specifically,metacontrast is a special case of impossible stroboscopic motion. Forexample, with the frequently employed metacontrast display in whicha rectangle serves as a target and two spatially flanking rectangles serveas masks, the target–mask sequence activates two oppositely directedstroboscopic motion events of the same object—a physically impossi-ble event. Kahneman (1967) argues that the cognitive–perceptualsystem is unable to resolve these apparently opposite and contradictorymotions of the same stimulus and thus suppresses the perception ofobject motion by suppressing the visibility of the target stimulus.
Although simple and ingenious, this formulation was flawed onseveral counts. First, the empirically based spatiotemporal laws thatgovern apparent motion diverge from those characterizing metacon-trast (Breitmeyer and Horman 1981; Weisstein and Growney 1969).Moreover, split stroboscopic motion from the target to the flankingmasks can be, but need not be, observed in metacontrast (Stoper
MODELS AND MECHANISMS OF VISUAL MASKING102
and Banffy 1977). Consequently, the perceptual system can simultaneouslyaccommodate such apparently contradictory motions as noted earlierby Wertheimer (1912). This perceptual accommodation to the meta-contrast display may use processes responsible for the perception ofecologically possible events such as radial dispersion (explosion) of anobject’s surface (Gibson 1979) or rapid visual expansion (looming) inthe visual field when objects move toward an observer (D.N. Lee 1976,1980; Regan and Cynader 1979). Finally, metacontrast can be obtainedin a two-stimulus display (e.g. two adjacent rectangles or disks) inwhich the perception of stroboscopic motion is readily possible andpresent (Breitmeyer and Horman 1981; Breitmeyer et al. 1974, 1976).These results, as well as those of Stoper and Banffy (1977), do notsupport the causal necessity of any form of impossible or contradictorystroboscopic motion in producing metacontrast. As noted by Stoperand Banffy, the mechanisms underlying stroboscopic motion andmetacontrast are largely independent of each other although undersome favorable stimulus conditions they may interact. In order to showthat such interaction can yield impossible stroboscopic motion andthus also metacontrast, as required by Kahneman’s (1967) cognitivemodel, one may want to adopt the following strategy. What needs to bedemonstrated is (i) that each of two flanking mask stimuli canseparately induce a type B stroboscopic motion function when flashedat varying SOAs after the target stimulus (preferably, but not necessarily,without producing a type B metacontrast effect), but (ii) that in com-bination the two mask stimuli yield a type B metacontrast functionwithout split stroboscopic motion. In view of the findings reviewedabove, such a demonstration would most likely hold only underhighly specific non-generalizable conditions. In hindsight, it wouldnonetheless be more convincing than the equally non-generalizableand fortuitous correlation between type B stroboscopic motion andmetacontrast functions used by Kahneman (1967) to support hiscognitive model.
It also should be mentioned that Kahneman’s (1967) model cannotadequately account for the absence of type B (and type A) metacon-trast when a forced-choice detection or simple reaction time measureis used by an observer. In fact, we noted that the split apparent motion(devoid of target contrast or figural information) generally observed inmetacontrast is most likely a powerful source of information for
SPATIOTEMPORAL SEQUENCE MODELS 103
detecting the mere presence or location of the target. Without suchsplit apparent motion, i.e. with its suppression by the cognitive system,target detection or localization might be greatly impaired. Moreover,even if such motion information were suppressed by the cognitivesystem, it is hard to imagine how it could be recovered to produceapparent stroboscopic motion between a masked target and a thirdstimulus flashed at a locus laterally displaced from the target–maskarea (Kolers 1963; von Grünau 1978b)
4.2.2. Matin’s three-neuron model
Matin (1975) proposed a model of metacontrast based on the existenceof three classes of neurons. In a typical metacontrast experiment, a targetis presented first, followed at a short interval by a laterally displacedmask. Matin assumed that the target activates one class of neurons thatshe calls T neurons. Similarly the mask activates a second class ofneurons that are termed M neurons. Finally, at appropriate temporalintervals the target–mask sequence activates a third class of neuronsthat are called T–M neurons. According to Matin (1975), this last classof neurons could consist of either succession (motion) detectors usedin analyzing object motion or neurons activated during relative imagedisplacement produced by high-velocity saccades. In the former case,activation of succession detectors could, but need not, produce a sensa-tion of (stroboscopic) motion. Via this assumption Matin avoids theproblems of Kahneman’s (1967) model of metacontrast that ascribes acausal role to stroboscopic motion. Saccade neurons comprise part ofthe latter class of T–M neurons and their neural analogs were taken tobe Y or transient neurons, which are assumed to have a shorter responselatency and higher conduction velocity than X or sustained neurons.1
The sustained neurons are further assumed to be neural analogs of Tneurons that are related to the perception of the target. Although notexplicitly stated by Matin (1975), the M neurons could also beidentified with sustained neurons since the mask is typically perceivedin a lateral masking experiment.
With this set of three neural classes, Matin (1975) accounted forseveral findings obtained in lateral masking studies. First, the existenceof T–M neurons could explain the sensation of stroboscopic motionthat generally, although not always (Stoper and Banffy 1977), accom-panies lateral masking. Moreover, several kinds of empirically derived
MODELS AND MECHANISMS OF VISUAL MASKING104
lateral masking findings can be adequately explained. These are type Aand type B metacontrast as well as type A and type B paracontrast.
According to Matin (1975), pronounced type B metacontrast couldbe produced in one of two possible ways. First, Matin notes that thesuppressive effect that T–M neurons exert on T neurons must beretroactive in order to produce type B metacontrast. She states that:
Although the T–M neurons do not fire until the presentation of the mask, themagnitude of response in these neurons would be expected to be greatest at some temporal interval between target and mask other than zero. It could therefore beargued that in those classes of metacontrast experiment for which the presentation ofthe target–mask sequence is an adequate stimulus for the T–M neurons, thepsychophysical metacontrast function peaks at some interval other than zero not perse because the target precedes the mask, but in spite of that fact and because the responsesof the T–M neurons, which are a part of the total mask response, are greater at thatinterval than at some longer or shorter one (Matin 1975, p. 457).
In this case, production of type B metacontrast uses the class of T–Mneurons that are responsible for the detection of succession (with orwithout an accompanying sensation of motion).
In addition to this explanation, Matin (1975) offers a second onerelying on the existence of high velocity saccade neurons that are alsoactivated by the T–M sequence. These saccade neurons are assumed tobe fast-conducting transient cells that can suppress the activity ofslower-conducting sustained cells. Since the former are a class of T–Mneurons and the latter comprises the set of T neurons, the T–M(saccade) neurons would exert optimal suppression of the T neuronswhen the mask is delayed relative to the target, thus producing a type Bmetacontrast effect. Implicit in this additional specification of T–Mneurons is the conclusion that here the metacontrast function peaks atsome SOA other than 0 ms, not despite of but because the target, activ-ating slower T neurons, precedes the mask and in conjunction with themask activates faster T–M (transient) neurons. Consequently, Matin(1975) assumes that two mutually reinforcing mechanisms are used toproduce type B metacontrast.
The existence of type A metacontrast, typically obtained when themask energy is substantially higher than the target energy, is explained asfollows. In type A metacontrast, peak masking occurs at an SOA of 0 ms.Here, the high energy of the mask leads to more vigorous activation of Mneurons than of T–M neurons. Since the T and M neurons are assumedto have similar conduction velocities, we would expect greatest
SPATIOTEMPORAL SEQUENCE MODELS 105
suppression of T neurons by M neurons at target–mask synchrony,i.e. at an SOA of 0 ms. At progressively greater SOAs we would alsoexpect that the suppression of T neuron activity by M neurons declines,thus producing a type A metacontrast function. An additional assump-tion must be made explicit here, namely that at an SOA of 0 ms andwhen the M/T energy ratio is greater than unity, the suppression ofT neurons by M neurons is stronger than the maximal suppression ofT neurons by T–M neurons at some optimal positive SOA value. If thatwere not the case, a type B function would still result.
Type B paracontrast or forward lateral masking effects, which typic-ally are weaker than metacontrast masking effects (Alpern 1953;Kolers and Rosner 1960), can be explained by invoking an essentialasymmetry between the interactions of T and T–M neurons used inparacontrast and metacontrast. Recall that in metacontrast the activityof T–M neurons is not only optimal when the mask follows the targetbut is also conducted faster than the activity of T neurons. In paracon-trast the laterally displaced mask precedes the target in time. Here,T–M neurons are activated by the mask–target sequence. Because theseneurons (transient neurons) conduct more rapidly than T neurons(sustained neurons), the suppressive effects of T–M neurons dissipateto some extent by the time the activity of T neurons arrives at the sitewhere interaction between these two classes of neurons occurs. In fact,if the difference in conduction velocity were sufficiently great, the lateractivity of T neurons could entirely escape the earlier suppressiveeffects of the T–M neurons, and consequently the paracontrast effectwould then be produced only by the M neurons. In the case of eitherpartial or complete escape of T neuron activity from T–M neuronsuppression, one would expect paracontrast to be weaker thanmetacontrast.
Although Matin (1975) does not make the following explicit claimsregarding paracontrast, they are nevertheless implicit in the descrip-tion of her model. In the case of partial escape of T neuron activityfrom T–M neuron suppression, we would expect a type B paracontrasteffect that is weaker than a type B metacontrast effect (see Chapter 2,Figs 2.2(b) and 2.5). Furthermore, if the above escape from T–M neuronsuppression is total and only M neurons inhibit the T neurons, para-contrast ought to be of type A, being optimal at an SOA of 0 ms anddecreasing as the mask-to-target asynchrony increases. An additional
MODELS AND MECHANISMS OF VISUAL MASKING106
implicit aspect of Matin’s model is that the activation of T–M neuralactivity preserves information about the presence and locus of thetarget even when target contrast and figural information processed byT neurons are suppressed during metacontrast. Hence it can explainthe ability to detect the presence of the target even when it cannot beidentified or seen (Fehrer and Biederman 1962; Fehrer and Raab 1962;Schiller and Smith 1966).
Although Matin’s model accounts adequately for major aspects ofmasking and apparent motion, several specific results pose problems.First, Breitmeyer and Rudd (1981) demonstrated that we can obtainsuppression of a target’s visibility in a single-transient paradigm. Herea single brief transient presentation of the surrounding mask reducedthe visibility of a stationary target presented for a prolonged time inter-val. Of course, such suppression could be accounted for by activationof only the M neurons in Matin’s three-neuron model, and hence with-out any activation of T–M neurons. More problematic is the role ofT–M neurons in paracontrast. We would expect the optimal SOAs foractivating the T–M and M–T neurons in meta- and paracontrast,respectively, to be the same, and thus the optimal masking SOAs formeta- and paracontrast likewise to be the same. However, in severalrecent studies (Breitmeyer et al. 2004a, 2005b, in press, in preparation)we found that the optimal masking SOA for paracontrast was maximalat SOAs ranging from 100 to 200 ms while that for metacontrast wasoptimal at SOAs ranging from 20 to 60 ms. Moreover, based on themetacontrast result, Matin’s model states that the strongest activationof spatiotemporal sequence detectors occurs at an SOA of about 70 ms.In contrast, at an SOA of 100–200 ms we would expect little, if any,such activation. Hence, according to the model, paracontrast at theseSOAs should be weak rather than maximal.
4.2.3. Burr’s spatiotemporal receptive-field model
Burr and colleagues (Burr 1984; Burr et al. 1986) proposed a differentversion of the spatiotemporal sequence model to account for metacon-trast as well as apparent motion. They used the notion ofspatiotemporal receptive fields (Burr et al. 1986) to characterize thespatiotemporal response of motion detectors. The receptive fields aremade from alternating regions of opposing (excitatory/inhibitory)polarity, and these regions are elongated in space–time along the
SPATIOTEMPORAL SEQUENCE MODELS 107
preferred velocity axis of the detector (Burr et al. 1986, Figs 6 and 7).This organization allows the analyses of form and motion by the detector.The strength of this model is that, extending beyond explaining detectionof real motion, it can be applied to a variety of associated phenomenaincluding metacontrast (Burr 1984), stroboscopic motion (Burr et al.1986), and the reduction of motion smear (Burr 1980, 1981), topicsthat we will cover more thoroughly in Chapter 6.
Unlike Matin’s spatiotemporal sequence model positing that T–Mneurons inhibit the responses of the form-processing T neurons, Burrdid not introduce such an inhibition to his model. According to Burrand colleagues (Burr 1984; Burr et al. 1986), the spatiotemporalsequence of target and mask stimuli activates receptive fields orientedin space–time, and these receptive fields report the gestalt of a singlebar in motion rather than two bars at separate spatial locations.The result of this gestalt-unit formation is that the two stimuli becomeperceptually merged into one. Burr relates this merging to energysummation of the two stimuli at threshold, a process consistent witha variety of energy models of motion perception (Adelson and Bergen1985, 1986; Watson and Ahumada 1985; see also van Santen andSperling 1985). However, target and mask stimuli, and more generallyany moving stimuli, also activate spatiotemporally unoriented mechan-isms (i.e. ‘static form analyzers’), as well as large number of spatiotem-porally oriented mechanisms, whose tuning matches to varying degreesthe spatiotemporal energy of the stimulus. Without a selection and/orinhibition process, it is not clear how a single gestalt will emerge fromthe activities of a large number of mechanisms. Lacking a clear statementof how or by what underlying mechanism the unitary gestalt is formed,the model remains incomplete.
As noted by Marr and coworkers (Marr 1982; Marr and Ullman1981), workable models of object motion in human vision mustcombine analysis of motion with the analysis of contours or form (seealso Grossberg 1991). In the human visual system this translates intocombining the outputs of separate motion- and form-detectingchannels whose neural analogs may be the magnocellular (M) andparvocellular (P) pathways, respectively (De Yoe and Van Essen1988; Livingstone and Hubel 1987, 1988) (see Chapter 5). Evidenceexists for convergence of M and P inputs in neurons found as earlyas layers 2, 3, and 4B of monkey striate cortex (Ferrera et al. 1992;
MODELS AND MECHANISMS OF VISUAL MASKING108
Nealy and Maunsell 1994; Sawatari and Callaway 1996; Yabuta andCallaway 1998). Evidence for an analogous convergence has beenreported in cortical complex cells of cat (Emerson et al. 1992). Indeed,such neurons could have the space–time oriented receptive fieldsrequired by Burr’s model. Moreover, psychophysical evidence forcombined inputs to directionally sensitive motion analyzers fromtransient (motion) and sustained (form) channels has been reported(Bischof et al. 1996).
Although these results support the existence of space–time orientedreceptive fields and thus Burr’s model, other psychophysical resultsindicate that the relation between metacontrast and motion is morecomplex and that the relation between form- and motion-processingchannels includes mutual suppression of activities (Banta andBreitmeyer 1985; Juola and Breitmeyer 1988; von Grünau 1978a,b).Consistent with the latter findings are the brain scans of human visualcortex reported by Zeki (1999, pp. 154–55) which show that increasesin activity in area V4 (the color- and form-processing area) is accom-panied by decreases in activity in area V5/MT (the motion-processingarea). This indicates that the form- and motion-processing channelsalso interact in a mutually inhibitory manner. Thus an alternativemechanism, namely inter-channel inhibition, as proposed byBreitmeyer and Ganz (1976; see also Matin 1975; Weisstein et al. 1975;Chapter 5) may be responsible for suppression of form information inmetacontrast. Moreover, vivid perception of apparent motion can beobtained by two successive stimuli when their spatial separations are solarge that no metacontrast suppression of the first stimulus is obtained(Breitmeyer and Horman 1981). The puzzle then is: Why can oneperceptually identify the first (as well as the second) stimulus when thetwo-stimulus sequence gives rise to sensations of motion? One way toavoid this problem is to assume that the space–time receptive fieldsproposed by Burr to account for metacontrast only process short-rangeand not long-range displacements of stimuli. Of course, this explanationin turn assumes distinct neural mechanisms underlying the percep-tions of short- and long-range motion (Braddick 1974, 1980), anassumption that may not be warranted (Bischof and Di Lollo 1990;Cavanagh and Mather 1989). Finally, as discussed in Chapter 6, gestaltformation by a spatiotemporally oriented mechanism cannot accountfor masking mechanisms that are implied in motion deblurring.
SPATIOTEMPORAL SEQUENCE MODELS 109
4.3. Two-process models
4.3.1. Ganz’s interactive trace decay and random encoding time model
It is well known from Heinemann’s (1955) work on simultaneousbrightness contrast that a more intense spatially surrounding stimuluscan appreciably reduce the apparent contrast of a central stimulus.Simultaneous brightness contrast is believed to be induced by thelateral inhibitory effect that the surrounding stimulus exerts on thecentral one. Ganz (1975) proposed a model of metacontrast based onthese findings and this assumption, in which the temporally decayingtraces (icons) of the target and mask stimuli interact laterally. As such,it is conceptually an adaptation of Stigler’s (1910) persistence–lateralinhibition explanation of metacontrast. Ganz’s analysis relies on resultsreported in a study of metacontrast conducted by Sukale-Wolf (1971).In that study the target and the mask were of equal energy, a conditionwhich, as noted in Chapter 2, is conducive to the production of type Bmetacontrast.
Furthermore, Ganz’s (1975) model assumes that the followingproperties and events characterize metacontrast. Both the target andmask produce temporally decaying neural traces. Since the target andmask are of equal energy, the proportionality constants and the decayconstants are assumed to be identical for the target and the mask.Moreover, since the mask is presented after the target, the neural traceof the mask ought to be stronger at any positive SOA than that of thetarget. Because the weaker trailing end of the target trace overlapstemporally with the stronger leading part of the mask trace, in effect wehave a case of simultaneous brightness contrast induced via lateralinhibition by the stronger mask trace on the partially decayed targettrace. Hence reduction of the target’s visibility ought to increase pro-gressively as SOA increases. (At an SOA of 0 ms the two equally strongtraces are activated simultaneously and decay at the same rate, and littleif any brightness contrast or masking should occur). Therefore thislateral interactive trace–decay process would be responsible for therising part of the U-shaped metacontrast effect as SOA increases from0 ms to the intermediate value at which optimal masking occurs.
In order to explain the descending portion of the type B metacontrasteffect for progressively greater SOA values, Ganz (1975) incorporates
MODELS AND MECHANISMS OF VISUAL MASKING110
a further assumption stating that the decaying trace of the target needssome minimal time E for its brightness or contrast to be fully encoded.Additionally, the duration of E is assumed to be distributed randomlyin a Gaussian manner. Accordingly, since the encoding probability isvery small at low SOAs and increases as SOA increases, we wouldexpect the metacontrast function to rise initially from an SOA of 0 msto some positive SOA at a rate which is determined by the mean andstandard deviation of the Gaussian distribution of encoding time. Atlonger SOAs the likelihood of encoding becomes increasingly great andmasking ought to decrease, in a statistical sense, after its maximum isattained.
Although this model adequately explains metacontrast when thetarget and mask stimuli are of equal energy, the question remains as tohow well it would fare when the energies of the two stimuli are unequal.In the case of mask energies greater than target energy it is not clearthat it would correctly predict type A metacontrast (Breitmeyer 1978b;Weisstein 1972). Let us assume that the proportionality constant of themask trace is twice that of the target trace. Then we should indeedobtain stronger masking at an SOA of 0 ms. However, since the targettrace decays with time, we additionally obtain increasing masking asSOA increases, since the initial portion of the much stronger masktrace would inhibit a progressively weaker portion of the decayingtarget trace. In other words, the initial portion of the metacontrastfunction ought to rise again—indeed, more steeply—before theencoding process takes over to yield the later descending part of themetacontrast function. Consequently, contrary to the obtained type Ametacontrast function, Ganz’s (1975) model predicts a type B func-tion. One possible way of circumventing this difficulty would be toincorporate a ‘saturation’ parameter so that whenever the mask energybecomes sufficiently large relative to the target energy, its trace inhibitsthe target trace equally well at the lower range of SOAs, thus yieldingan approximation to a type A metacontrast function.
However, a greater difficulty may arise with the model when thetarget energy is greater than that of the mask. In Chapter 2 (see Fig. 2.3)we noted that type B metacontrast functions can be generated whenthe mask energy is only half or a quarter of that of the target. Hence,according to Ganz’s model, we would expect, on the basis ofHeinemann’s (1955) results, that no masking would occur for a range
TWO-PROCESS MODELS 111
of low SOAs which would first have to be exceeded before the weakermask trace becomes effective in suppressing the trailing end of a decay-ing but stronger target trace. In fact, according to Ganz’s model it maybe entirely possible that the target trace is encoded prior to anyinhibitory effects that the mask trace may exert on the trailing end ofthe target trace. Thus type B masking ought to be very weak (especiallyat SOAs ranging from 0 ms to some intermediate value) or entirelyabsent. The fact that empirical findings do not show this trend whenmask energy is reduced by, say, a half or a quarter relative to the targetenergy, but rather reveal a type B function characterized by a risingportion, a peak, and then a declining portion as SOA increases militatesagainst Ganz’s model.
Moreover, Ganz’s model predicts paracontrast effects which verylikely do not match empirical results. Paracontrast brightness suppres-sion, given equal energy target and mask stimuli, is a type B forwardmasking effect; however, it is generally weaker than type B metacontrast.If the target and mask stimuli are of equal energy, we would expectweak simultaneous brightness induction at an SOA of 0 ms, an expecta-tion consistent with the typically weak metacontrast obtained at thatSOA. What, according to Ganz’s model, would be expected to happenas the mask leads the target at progressively greater SOAs? Since theneural trace of the mask and the target are characterized by the sameproportionality and decay constants, we would expect the trailing endof the leading mask’s neural trace, which overlaps in time with theleading end of the target’s trace, to weaken progressively as the SOAincreases. Hence, with target and mask stimuli of equal energy, little, ifany, paracontrast should be obtained. If it is obtained, we would expectit to be at best a type A rather than a type B function, contrary to whatis found (Alpern 1953; Kolers and Rosner 1960).
4.3.2. Reeves’ temporal integration andsegregation model
Despite the failure of Ganz’s (1975) model to account adequately forsome major metacontrast and paracontrast findings, results reportedby Reeves (1982) generally seem to concur with and lend some credenceto Ganz’s (1975) account of metacontrast. In particular, Reeves (1982),adopting Weisstein ‘s (1972) magnitude rating method, requiredhis observers (i) to rate on each trial the brightness of the target as
MODELS AND MECHANISMS OF VISUAL MASKING112
a function of target–mask onset asynchrony, and (ii) to indicate whetherthe two stimuli were perceived as being simultaneous or successive.Although not specified by Reeves, perceived simultaneity would reflectan integrative process which, in turn, based on the discussion ofintegration in Chapter 1, section 1.5, most likely rests on the presenceof visual persistence; however, perceived successions would reflect asegregative process leading to temporally separate encodings and thuspercepts of the two stimuli.
It should be evident that these two processes are analogous to Ganz’s(1975) trace decay and encoding stages for, as one might expect, Reevesfound that the proportion of simultaneity judgments decreased mono-tonically from a constant value of 1.0 obtained at SOAs of 0–40 ms, to0.0 as SOA increased from 40 to 120 ms. Conversely, the proportion ofsuccessiveness judgments increased monotonically from 0 to 1.0 overthe 40–120 ms range of SOAs. The former result indicates that temporalintegration of target and mask stimuli (based on decaying visual per-sistence or visual traces of the target) extends with decreasing strengthup to an SOA of 120 ms; whereas the latter result indicates that separatetarget and mask encoding processes occur with a probability of zerobelow an SOA of 40 ms, but thereafter increase monotonically to avalue of 1.0 at an SOA of 120 ms.
In line with these results, when Reeves separated the overall averagedmetacontrast brightness ratings, characterized by the typical type Bfunction of SOA, on the basis of the type of concurrent temporaljudgment, he found that the type B function could be approximated byseparable monotonic functions. One component showed progressivelyincreasing target-brightness suppression over the corresponding SOArange of 40–120 ms (which yielded a progressive decrease of theproportion simultaneity reports); conversely, the other yieldedprogressively decreasing brightness suppression over the same SOArange (yielding a progressive increase in the proportion of successive-ness reports). At face value this binary decomposition, and evidentcorrelation between changes of target–mask temporal judgment andtarget brightness ratings agree with Reeves’ two-process integration–segregation account, and in particular with Ganz’s more specific two-process model based on an initial stage of lateral interactive tracedecay and a later perceptual encoding and segregation stage. However,we shall see below that these two-process models, in addition to a third
TWO-PROCESS MODELS 113
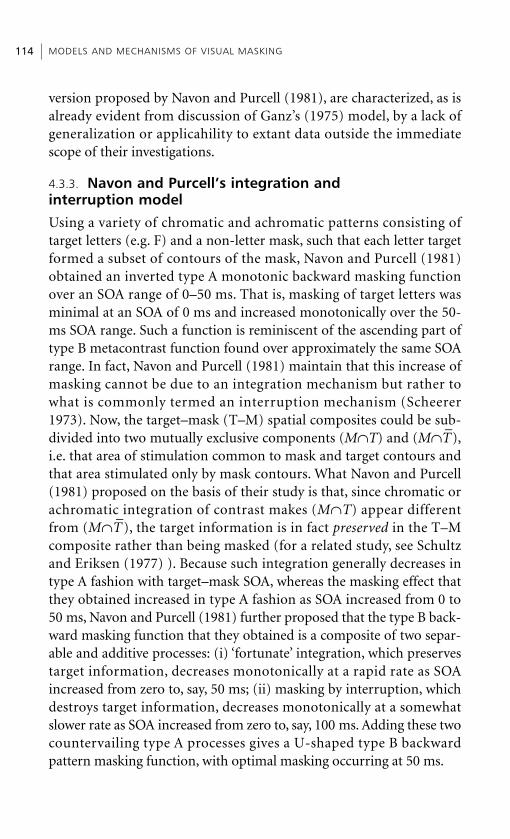
version proposed by Navon and Purcell (1981), are characterized, as isalready evident from discussion of Ganz’s (1975) model, by a lack ofgeneralization or applicahility to extant data outside the immediatescope of their investigations.
4.3.3. Navon and Purcell’s integration and interruption model
Using a variety of chromatic and achromatic patterns consisting oftarget letters (e.g. F) and a non-letter mask, such that each letter targetformed a subset of contours of the mask, Navon and Purcell (1981)obtained an inverted type A monotonic backward masking functionover an SOA range of 0–50 ms. That is, masking of target letters wasminimal at an SOA of 0 ms and increased monotonically over the 50-ms SOA range. Such a function is reminiscent of the ascending part oftype B metacontrast function found over approximately the same SOArange. In fact, Navon and Purcell (1981) maintain that this increase ofmasking cannot be due to an integration mechanism but rather towhat is commonly termed an interruption mechanism (Scheerer1973). Now, the target–mask (T–M) spatial composites could be sub-divided into two mutually exclusive components (M∩T) and (M∩T
–),
i.e. that area of stimulation common to mask and target contours andthat area stimulated only by mask contours. What Navon and Purcell(1981) proposed on the basis of their study is that, since chromatic orachromatic integration of contrast makes (M∩T) appear differentfrom (M∩T
–), the target information is in fact preserved in the T–M
composite rather than being masked (for a related study, see Schultzand Eriksen (1977) ). Because such integration generally decreases intype A fashion with target–mask SOA, whereas the masking effect thatthey obtained increased in type A fashion as SOA increased from 0 to50 ms, Navon and Purcell (1981) further proposed that the type B back-ward masking function that they obtained is a composite of two separ-able and additive processes: (i) ‘fortunate’ integration, which preservestarget information, decreases monotonically at a rapid rate as SOAincreased from zero to, say, 50 ms; (ii) masking by interruption, whichdestroys target information, decreases monotonically at a somewhatslower rate as SOA increased from zero to, say, 100 ms. Adding these twocountervailing type A processes gives a U-shaped type B backwardpattern masking function, with optimal masking occurring at 50 ms.
MODELS AND MECHANISMS OF VISUAL MASKING114
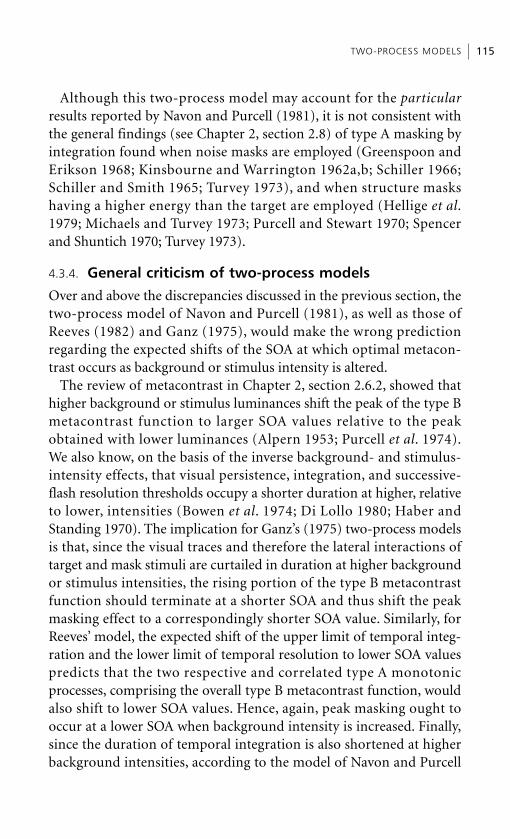
Although this two-process model may account for the particularresults reported by Navon and Purcell (1981), it is not consistent withthe general findings (see Chapter 2, section 2.8) of type A masking byintegration found when noise masks are employed (Greenspoon andErikson 1968; Kinsbourne and Warrington 1962a,b; Schiller 1966;Schiller and Smith 1965; Turvey 1973), and when structure maskshaving a higher energy than the target are employed (Hellige et al.1979; Michaels and Turvey 1973; Purcell and Stewart 1970; Spencerand Shuntich 1970; Turvey 1973).
4.3.4. General criticism of two-process models
Over and above the discrepancies discussed in the previous section, thetwo-process model of Navon and Purcell (1981), as well as those ofReeves (1982) and Ganz (1975), would make the wrong predictionregarding the expected shifts of the SOA at which optimal metacon-trast occurs as background or stimulus intensity is altered.
The review of metacontrast in Chapter 2, section 2.6.2, showed thathigher background or stimulus luminances shift the peak of the type Bmetacontrast function to larger SOA values relative to the peakobtained with lower luminances (Alpern 1953; Purcell et al. 1974).We also know, on the basis of the inverse background- and stimulus-intensity effects, that visual persistence, integration, and successive-flash resolution thresholds occupy a shorter duration at higher, relativeto lower, intensities (Bowen et al. 1974; Di Lollo 1980; Haber andStanding 1970). The implication for Ganz’s (1975) two-process modelsis that, since the visual traces and therefore the lateral interactions oftarget and mask stimuli are curtailed in duration at higher backgroundor stimulus intensities, the rising portion of the type B metacontrastfunction should terminate at a shorter SOA and thus shift the peakmasking effect to a correspondingly shorter SOA value. Similarly, forReeves’ model, the expected shift of the upper limit of temporal integ-ration and the lower limit of temporal resolution to lower SOA valuespredicts that the two respective and correlated type A monotonicprocesses, comprising the overall type B metacontrast function, wouldalso shift to lower SOA values. Hence, again, peak masking ought tooccur at a lower SOA when background intensity is increased. Finally,since the duration of temporal integration is also shortened at higherbackground intensities, according to the model of Navon and Purcell
TWO-PROCESS MODELS 115
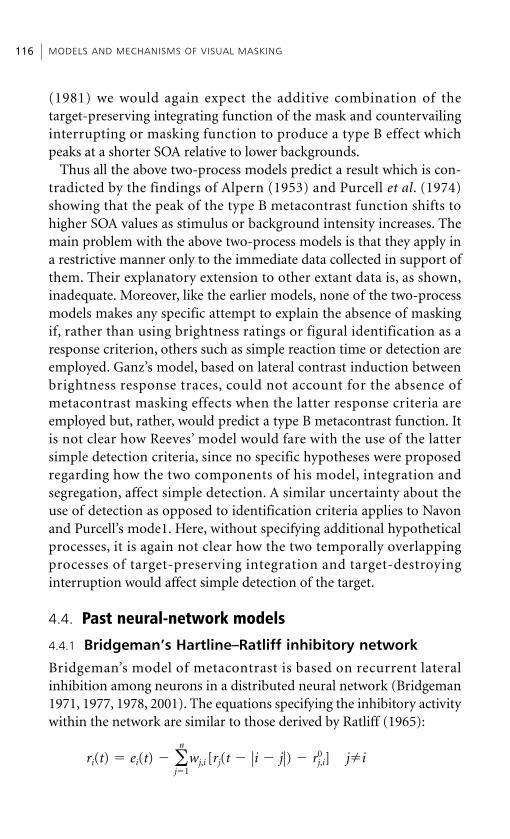
(1981) we would again expect the additive combination of the target-preserving integrating function of the mask and countervailinginterrupting or masking function to produce a type B effect whichpeaks at a shorter SOA relative to lower backgrounds.
Thus all the above two-process models predict a result which is con-tradicted by the findings of Alpern (1953) and Purcell et al. (1974)showing that the peak of the type B metacontrast function shifts tohigher SOA values as stimulus or background intensity increases. Themain problem with the above two-process models is that they apply ina restrictive manner only to the immediate data collected in support ofthem. Their explanatory extension to other extant data is, as shown,inadequate. Moreover, like the earlier models, none of the two-processmodels makes any specific attempt to explain the absence of maskingif, rather than using brightness ratings or figural identification as aresponse criterion, others such as simple reaction time or detection areemployed. Ganz’s model, based on lateral contrast induction betweenbrightness response traces, could not account for the absence ofmetacontrast masking effects when the latter response criteria areemployed but, rather, would predict a type B metacontrast function. Itis not clear how Reeves’ model would fare with the use of the lattersimple detection criteria, since no specific hypotheses were proposedregarding how the two components of his model, integration andsegregation, affect simple detection. A similar uncertainty about theuse of detection as opposed to identification criteria applies to Navonand Purcell’s mode1. Here, without specifying additional hypotheticalprocesses, it is again not clear how the two temporally overlappingprocesses of target-preserving integration and target-destroyinginterruption would affect simple detection of the target.
4.4. Past neural-network models
4.4.1 Bridgeman’s Hartline–Ratliff inhibitory network
Bridgeman’s model of metacontrast is based on recurrent lateralinhibition among neurons in a distributed neural network (Bridgeman1971, 1977, 1978, 2001). The equations specifying the inhibitory activitywithin the network are similar to those derived by Ratliff (1965):
ri(t) � ei(t) � �n
j�1wj,i [rj(t � �i � j�) � r0
j,i] ji
MODELS AND MECHANISMS OF VISUAL MASKING116
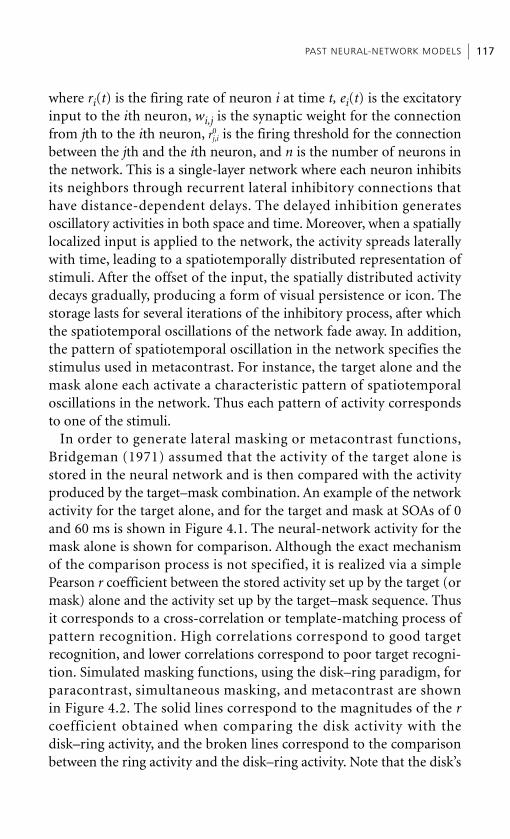
where ri(t) is the firing rate of neuron i at time t, ei(t) is the excitatoryinput to the ith neuron, wi,j is the synaptic weight for the connectionfrom jth to the ith neuron, is the firing threshold for the connectionbetween the jth and the ith neuron, and n is the number of neurons inthe network. This is a single-layer network where each neuron inhibitsits neighbors through recurrent lateral inhibitory connections thathave distance-dependent delays. The delayed inhibition generatesoscillatory activities in both space and time. Moreover, when a spatiallylocalized input is applied to the network, the activity spreads laterallywith time, leading to a spatiotemporally distributed representation ofstimuli. After the offset of the input, the spatially distributed activitydecays gradually, producing a form of visual persistence or icon. Thestorage lasts for several iterations of the inhibitory process, after whichthe spatiotemporal oscillations of the network fade away. In addition,the pattern of spatiotemporal oscillation in the network specifies thestimulus used in metacontrast. For instance, the target alone and themask alone each activate a characteristic pattern of spatiotemporaloscillations in the network. Thus each pattern of activity correspondsto one of the stimuli.
In order to generate lateral masking or metacontrast functions,Bridgeman (1971) assumed that the activity of the target alone isstored in the neural network and is then compared with the activityproduced by the target–mask combination. An example of the networkactivity for the target alone, and for the target and mask at SOAs of 0and 60 ms is shown in Figure 4.1. The neural-network activity for themask alone is shown for comparison. Although the exact mechanismof the comparison process is not specified, it is realized via a simplePearson r coefficient between the stored activity set up by the target (ormask) alone and the activity set up by the target–mask sequence. Thusit corresponds to a cross-correlation or template-matching process ofpattern recognition. High correlations correspond to good targetrecognition, and lower correlations correspond to poor target recogni-tion. Simulated masking functions, using the disk–ring paradigm, forparacontrast, simultaneous masking, and metacontrast are shownin Figure 4.2. The solid lines correspond to the magnitudes of the rcoefficient obtained when comparing the disk activity with thedisk–ring activity, and the broken lines correspond to the comparisonbetween the ring activity and the disk–ring activity. Note that the disk’s
rj,i0
PAST NEURAL-NETWORK MODELS 117
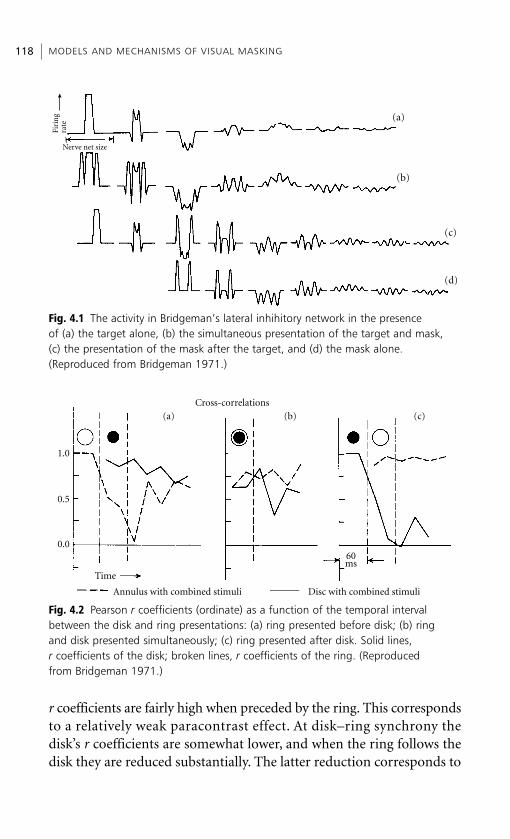
r coefficients are fairly high when preceded by the ring. This correspondsto a relatively weak paracontrast effect. At disk–ring synchrony thedisk’s r coefficients are somewhat lower, and when the ring follows thedisk they are reduced substantially. The latter reduction corresponds to
MODELS AND MECHANISMS OF VISUAL MASKING118Fi
rin
gra
te
Nerve net size
(a)
(b)
(c)
(d)
Fig. 4.1 The activity in Bridgeman’s lateral inhihitory network in the presence of (a) the target alone, (b) the simultaneous presentation of the target and mask,(c) the presentation of the mask after the target, and (d) the mask alone.(Reproduced from Bridgeman 1971.)
Cross-correlations
(a) (b) (c)
1.0
0.5
0.0
Time
60ms
Annulus with combined stimuli Disc with combined stimuli
Fig. 4.2 Pearson r coefficients (ordinate) as a function of the temporal intervalbetween the disk and ring presentations: (a) ring presented before disk; (b) ring and disk presented simultaneously; (c) ring presented after disk. Solid lines, r coefficients of the disk; broken lines, r coefficients of the ring. (Reproduced from Bridgeman 1971.)
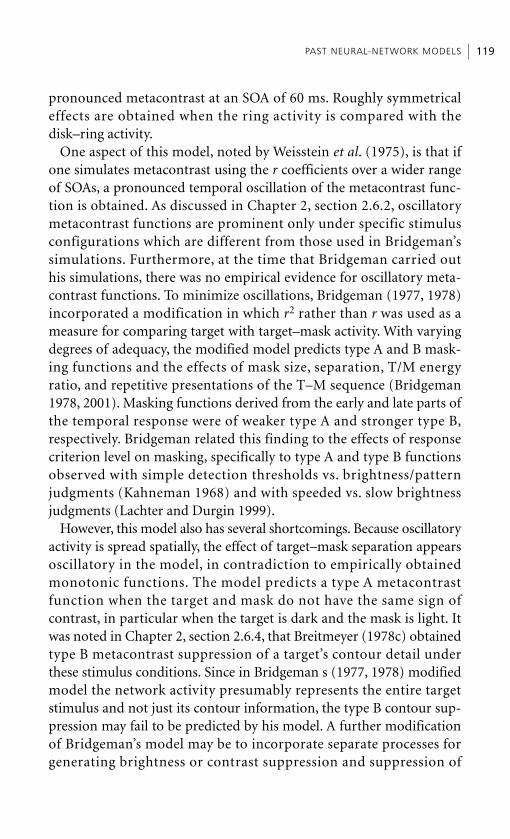
pronounced metacontrast at an SOA of 60 ms. Roughly symmetricaleffects are obtained when the ring activity is compared with thedisk–ring activity.
One aspect of this model, noted by Weisstein et al. (1975), is that ifone simulates metacontrast using the r coefficients over a wider rangeof SOAs, a pronounced temporal oscillation of the metacontrast func-tion is obtained. As discussed in Chapter 2, section 2.6.2, oscillatorymetacontrast functions are prominent only under specific stimulusconfigurations which are different from those used in Bridgeman’ssimulations. Furthermore, at the time that Bridgeman carried outhis simulations, there was no empirical evidence for oscillatory meta-contrast functions. To minimize oscillations, Bridgeman (1977, 1978)incorporated a modification in which r2 rather than r was used as ameasure for comparing target with target–mask activity. With varyingdegrees of adequacy, the modified model predicts type A and B mask-ing functions and the effects of mask size, separation, T/M energyratio, and repetitive presentations of the T–M sequence (Bridgeman1978, 2001). Masking functions derived from the early and late parts ofthe temporal response were of weaker type A and stronger type B,respectively. Bridgeman related this finding to the effects of responsecriterion level on masking, specifically to type A and type B functionsobserved with simple detection thresholds vs. brightness/patternjudgments (Kahneman 1968) and with speeded vs. slow brightnessjudgments (Lachter and Durgin 1999).
However, this model also has several shortcomings. Because oscillatoryactivity is spread spatially, the effect of target–mask separation appearsoscillatory in the model, in contradiction to empirically obtainedmonotonic functions. The model predicts a type A metacontrastfunction when the target and mask do not have the same sign ofcontrast, in particular when the target is dark and the mask is light. Itwas noted in Chapter 2, section 2.6.4, that Breitmeyer (1978c) obtainedtype B metacontrast suppression of a target’s contour detail underthese stimulus conditions. Since in Bridgeman s (1977, 1978) modifiedmodel the network activity presumably represents the entire targetstimulus and not just its contour information, the type B contour sup-pression may fail to be predicted by his model. A further modificationof Bridgeman’s model may be to incorporate separate processes forgenerating brightness or contrast suppression and suppression of
PAST NEURAL-NETWORK MODELS 119
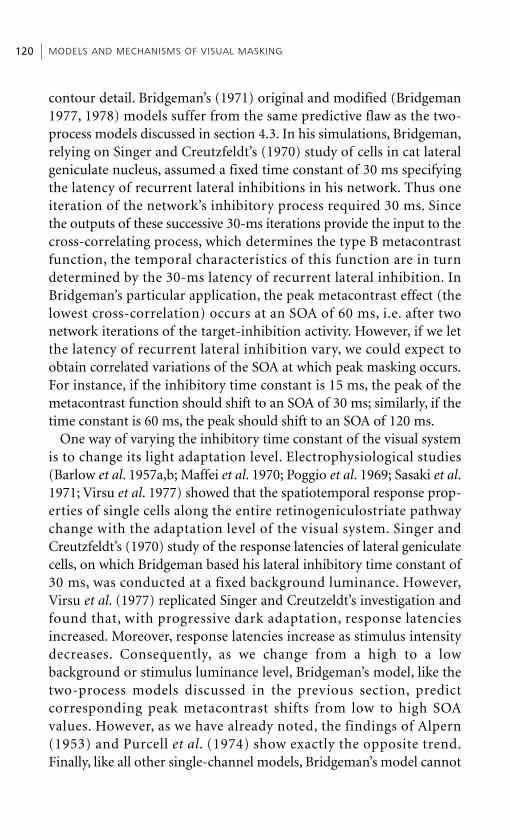
contour detail. Bridgeman’s (1971) original and modified (Bridgeman1977, 1978) models suffer from the same predictive flaw as the two-process models discussed in section 4.3. In his simulations, Bridgeman,relying on Singer and Creutzfeldt’s (1970) study of cells in cat lateralgeniculate nucleus, assumed a fixed time constant of 30 ms specifyingthe latency of recurrent lateral inhibitions in his network. Thus oneiteration of the network’s inhibitory process required 30 ms. Sincethe outputs of these successive 30-ms iterations provide the input to thecross-correlating process, which determines the type B metacontrastfunction, the temporal characteristics of this function are in turndetermined by the 30-ms latency of recurrent lateral inhibition. InBridgeman’s particular application, the peak metacontrast effect (thelowest cross-correlation) occurs at an SOA of 60 ms, i.e. after twonetwork iterations of the target-inhibition activity. However, if we letthe latency of recurrent lateral inhibition vary, we could expect toobtain correlated variations of the SOA at which peak masking occurs.For instance, if the inhibitory time constant is 15 ms, the peak of themetacontrast function should shift to an SOA of 30 ms; similarly, if thetime constant is 60 ms, the peak should shift to an SOA of 120 ms.
One way of varying the inhibitory time constant of the visual systemis to change its light adaptation level. Electrophysiological studies(Barlow et al. 1957a,b; Maffei et al. 1970; Poggio et al. 1969; Sasaki et al.1971; Virsu et al. 1977) showed that the spatiotemporal response prop-erties of single cells along the entire retinogeniculostriate pathwaychange with the adaptation level of the visual system. Singer andCreutzfeldt’s (1970) study of the response latencies of lateral geniculatecells, on which Bridgeman based his lateral inhibitory time constant of30 ms, was conducted at a fixed background luminance. However,Virsu et al. (1977) replicated Singer and Creutzeldt’s investigation andfound that, with progressive dark adaptation, response latenciesincreased. Moreover, response latencies increase as stimulus intensitydecreases. Consequently, as we change from a high to a low background or stimulus luminance level, Bridgeman’s model, like thetwo-process models discussed in the previous section, predictcorresponding peak metacontrast shifts from low to high SOA values. However, as we have already noted, the findings of Alpern(1953) and Purcell et al. (1974) show exactly the opposite trend.Finally, like all other single-channel models, Bridgeman’s model cannot
MODELS AND MECHANISMS OF VISUAL MASKING120
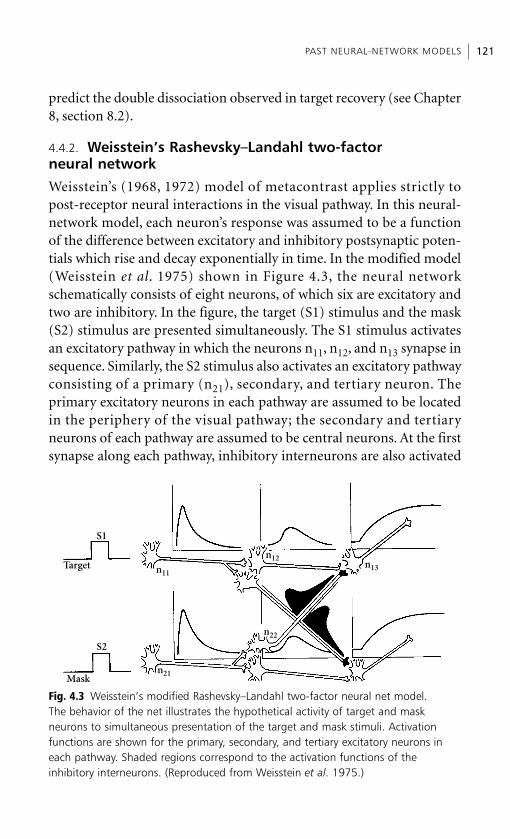
predict the double dissociation observed in target recovery (see Chapter8, section 8.2).
4.4.2. Weisstein’s Rashevsky–Landahl two-factor neural network
Weisstein’s (1968, 1972) model of metacontrast applies strictly to post-receptor neural interactions in the visual pathway. In this neural-network model, each neuron’s response was assumed to be a functionof the difference between excitatory and inhibitory postsynaptic poten-tials which rise and decay exponentially in time. In the modified model(Weisstein et al. 1975) shown in Figure 4.3, the neural networkschematically consists of eight neurons, of which six are excitatory andtwo are inhibitory. In the figure, the target (S1) stimulus and the mask(S2) stimulus are presented simultaneously. The S1 stimulus activatesan excitatory pathway in which the neurons n11, n12, and n13 synapse insequence. Similarly, the S2 stimulus also activates an excitatory pathwayconsisting of a primary (n21), secondary, and tertiary neuron. Theprimary excitatory neurons in each pathway are assumed to be locatedin the periphery of the visual pathway; the secondary and tertiaryneurons of each pathway are assumed to be central neurons. At the firstsynapse along each pathway, inhibitory interneurons are also activated
PAST NEURAL-NETWORK MODELS 121
S1
n11
n21
n22
n12n13
S2
Target
Mask
Fig. 4.3 Weisstein’s modified Rashevsky–Landahl two-factor neural net model. The behavior of the net illustrates the hypothetical activity of target and mask neurons to simultaneous presentation of the target and mask stimuli. Activationfunctions are shown for the primary, secondary, and tertiary excitatory neurons ineach pathway. Shaded regions correspond to the activation functions of theinhibitory interneurons. (Reproduced from Weisstein et al. 1975.)
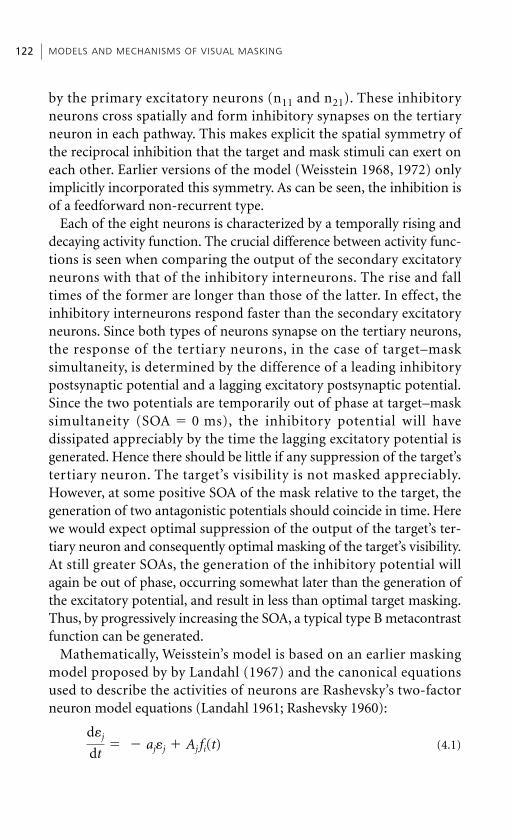
by the primary excitatory neurons (n11 and n21). These inhibitoryneurons cross spatially and form inhibitory synapses on the tertiaryneuron in each pathway. This makes explicit the spatial symmetry ofthe reciprocal inhibition that the target and mask stimuli can exert oneach other. Earlier versions of the model (Weisstein 1968, 1972) onlyimplicitly incorporated this symmetry. As can be seen, the inhibition isof a feedforward non-recurrent type.
Each of the eight neurons is characterized by a temporally rising anddecaying activity function. The crucial difference between activity func-tions is seen when comparing the output of the secondary excitatoryneurons with that of the inhibitory interneurons. The rise and falltimes of the former are longer than those of the latter. In effect, theinhibitory interneurons respond faster than the secondary excitatoryneurons. Since both types of neurons synapse on the tertiary neurons,the response of the tertiary neurons, in the case of target–masksimultaneity, is determined by the difference of a leading inhibitorypostsynaptic potential and a lagging excitatory postsynaptic potential.Since the two potentials are temporarily out of phase at target–masksimultaneity (SOA � 0 ms), the inhibitory potential will havedissipated appreciably by the time the lagging excitatory potential isgenerated. Hence there should be little if any suppression of the target’stertiary neuron. The target’s visibility is not masked appreciably.However, at some positive SOA of the mask relative to the target, thegeneration of two antagonistic potentials should coincide in time. Herewe would expect optimal suppression of the output of the target’s ter-tiary neuron and consequently optimal masking of the target’s visibility.At still greater SOAs, the generation of the inhibitory potential willagain be out of phase, occurring somewhat later than the generation ofthe excitatory potential, and result in less than optimal target masking.Thus, by progressively increasing the SOA, a typical type B metacontrastfunction can be generated.
Mathematically, Weisstein’s model is based on an earlier maskingmodel proposed by by Landahl (1967) and the canonical equationsused to describe the activities of neurons are Rashevsky’s two-factorneuron model equations (Landahl 1961; Rashevsky 1960):
(4.1)dj
dt� � ajj � Aj fi(t)
MODELS AND MECHANISMS OF VISUAL MASKING122
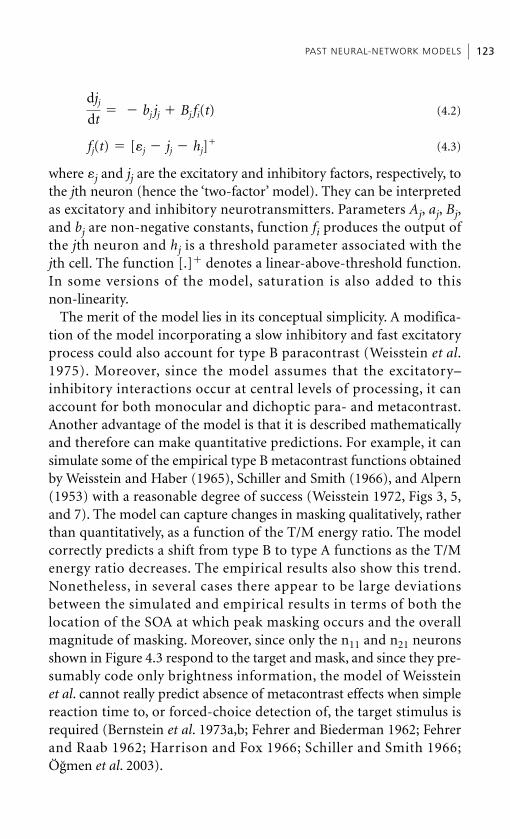
(4.2)
(4.3)
where j and jj are the excitatory and inhibitory factors, respectively, tothe jth neuron (hence the ‘two-factor’ model). They can be interpretedas excitatory and inhibitory neurotransmitters. Parameters Aj, aj, Bj,and bj are non-negative constants, function fi produces the output ofthe jth neuron and hj is a threshold parameter associated with thejth cell. The function [.]� denotes a linear-above-threshold function.In some versions of the model, saturation is also added to this non-linearity.
The merit of the model lies in its conceptual simplicity. A modifica-tion of the model incorporating a slow inhibitory and fast excitatoryprocess could also account for type B paracontrast (Weisstein et al.1975). Moreover, since the model assumes that the excitatory–inhibitory interactions occur at central levels of processing, it canaccount for both monocular and dichoptic para- and metacontrast.Another advantage of the model is that it is described mathematicallyand therefore can make quantitative predictions. For example, it cansimulate some of the empirical type B metacontrast functions obtainedby Weisstein and Haber (1965), Schiller and Smith (1966), and Alpern(1953) with a reasonable degree of success (Weisstein 1972, Figs 3, 5,and 7). The model can capture changes in masking qualitatively, ratherthan quantitatively, as a function of the T/M energy ratio. The modelcorrectly predicts a shift from type B to type A functions as the T/Menergy ratio decreases. The empirical results also show this trend.Nonetheless, in several cases there appear to be large deviationsbetween the simulated and empirical results in terms of both thelocation of the SOA at which peak masking occurs and the overallmagnitude of masking. Moreover, since only the n11 and n21 neuronsshown in Figure 4.3 respond to the target and mask, and since they pre-sumably code only brightness information, the model of Weissteinet al. cannot really predict absence of metacontrast effects when simplereaction time to, or forced-choice detection of, the target stimulus isrequired (Bernstein et al. 1973a,b; Fehrer and Biederman 1962; Fehrerand Raab 1962; Harrison and Fox 1966; Schiller and Smith 1966;Ögmen et al. 2003).
fj(t) � [j � jj � hj]�
djj
dt� � bj jj � Bj fi(t)
PAST NEURAL-NETWORK MODELS 123

4.5. Neural-network models adopting overtake anddual-channel activation hypothesesIt may be intuitively obvious that a mask stimulus that is much moreenergetic (greater contrast or duration) than the target stimulus(Crawford, 1947; Sperling, 1965) activates neural responses that over-take those of the target and thus contribute to backward masking.However, one of the most salient and counter-intuitive features ofmetacontrast is that the perceived contrast and form of the target stimu-lus is optimally suppressed not at an SOA of 0 ms but rather when themask follows the target by 30–100 ms, even when the energy of themask is equal to or even less than that of the target. Here we review twoadditional models that rely most clearly on two of the four propertieslisted above: overtake of slower responses in one neural channel orpathway by activity in a separate and faster responding pathway.Therefore the response overtake is not due to the general finding thatmore intense stimuli activate shorter latency neural responses. Rather,the overtake is ascribed to the faster activation of one channel or path-way compared with a separate one even when the intensity of the maskis less than or equal to that of the target. The models proposed by Matin(1975) and by Weisstein and colleagues (Weisstein 1968, 1972; Weissteinet al. 1975) are also based on an overtake or dual-channel-activationhypothesis. However, since they were discussed in sections 4.1 and 4.2above, they will not be covered here.
4.5.1. The retino-cortical dynamics (RECOD) neural-network model
The retino-cortical dynamics (RECOD) neural-network model is anelaboration and quantification of the dual-channel model based oninhibitory interactions within and between sustained and transientchannels proposed by Breitmeyer and Ganz (1976). We merely list ithere and defer a detailed exposition until Chapter 5.
4.5.2. The perceptual retouch model
A model of visual masking based on perceptual retouch (PR) wasintroduced by Bachmann (1984) and elaborated more recently(Bachmann 1994). In this model, interactions between activities of twoanatomically distinct pathways also assume a key role. Hence we can
MODELS AND MECHANISMS OF VISUAL MASKING124
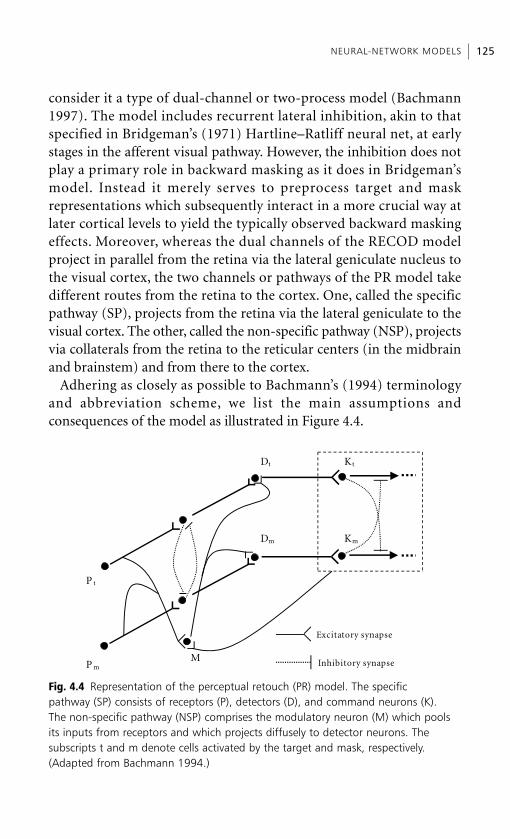
consider it a type of dual-channel or two-process model (Bachmann1997). The model includes recurrent lateral inhibition, akin to thatspecified in Bridgeman’s (1971) Hartline–Ratliff neural net, at earlystages in the afferent visual pathway. However, the inhibition does notplay a primary role in backward masking as it does in Bridgeman’smodel. Instead it merely serves to preprocess target and maskrepresentations which subsequently interact in a more crucial way atlater cortical levels to yield the typically observed backward maskingeffects. Moreover, whereas the dual channels of the RECOD modelproject in parallel from the retina via the lateral geniculate nucleus tothe visual cortex, the two channels or pathways of the PR model takedifferent routes from the retina to the cortex. One, called the specificpathway (SP), projects from the retina via the lateral geniculate to thevisual cortex. The other, called the non-specific pathway (NSP), projectsvia collaterals from the retina to the reticular centers (in the midbrainand brainstem) and from there to the cortex.
Adhering as closely as possible to Bachmann’s (1994) terminologyand abbreviation scheme, we list the main assumptions andconsequences of the model as illustrated in Figure 4.4.
NEURAL-NETWORK MODELS 125
P t
P mM
Dt
Dm
Kt
Km
Inhibitory synapse
Excitatory synapse
Fig. 4.4 Representation of the perceptual retouch (PR) model. The specific pathway (SP) consists of receptors (P), detectors (D), and command neurons (K). The non-specific pathway (NSP) comprises the modulatory neuron (M) which poolsits inputs from receptors and which projects diffusely to detector neurons. The subscripts t and m denote cells activated by the target and mask, respectively.(Adapted from Bachmann 1994.)
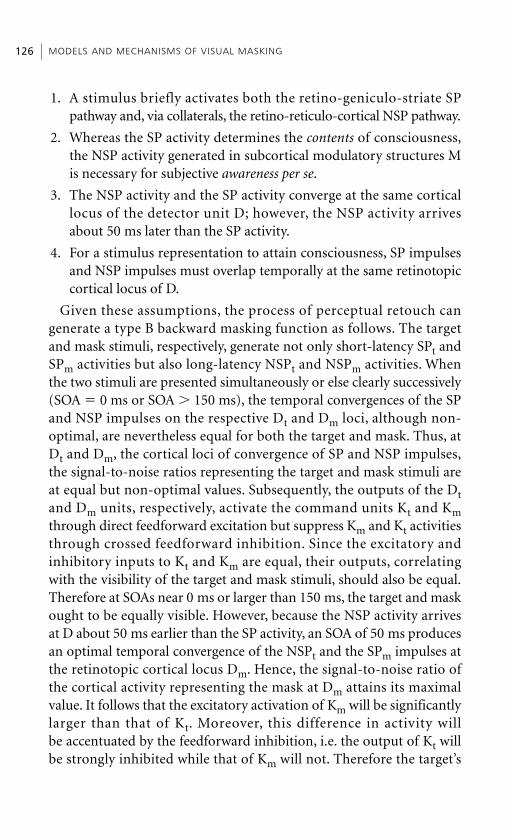
1. A stimulus briefly activates both the retino-geniculo-striate SPpathway and, via collaterals, the retino-reticulo-cortical NSP pathway.
2. Whereas the SP activity determines the contents of consciousness,the NSP activity generated in subcortical modulatory structures Mis necessary for subjective awareness per se.
3. The NSP activity and the SP activity converge at the same corticallocus of the detector unit D; however, the NSP activity arrivesabout 50 ms later than the SP activity.
4. For a stimulus representation to attain consciousness, SP impulsesand NSP impulses must overlap temporally at the same retinotopiccortical locus of D.
Given these assumptions, the process of perceptual retouch cangenerate a type B backward masking function as follows. The targetand mask stimuli, respectively, generate not only short-latency SPt andSPm activities but also long-latency NSPt and NSPm activities. Whenthe two stimuli are presented simultaneously or else clearly successively(SOA � 0 ms or SOA � 150 ms), the temporal convergences of the SPand NSP impulses on the respective Dt and Dm loci, although non-optimal, are nevertheless equal for both the target and mask. Thus, atDt and Dm, the cortical loci of convergence of SP and NSP impulses,the signal-to-noise ratios representing the target and mask stimuli areat equal but non-optimal values. Subsequently, the outputs of the Dtand Dm units, respectively, activate the command units Kt and Kmthrough direct feedforward excitation but suppress Km and Kt activitiesthrough crossed feedforward inhibition. Since the excitatory andinhibitory inputs to Kt and Km are equal, their outputs, correlatingwith the visibility of the target and mask stimuli, should also be equal.Therefore at SOAs near 0 ms or larger than 150 ms, the target and maskought to be equally visible. However, because the NSP activity arrivesat D about 50 ms earlier than the SP activity, an SOA of 50 ms producesan optimal temporal convergence of the NSPt and the SPm impulses atthe retinotopic cortical locus Dm. Hence, the signal-to-noise ratio ofthe cortical activity representing the mask at Dm attains its maximalvalue. It follows that the excitatory activation of Km will be significantlylarger than that of Kt. Moreover, this difference in activity will be accentuated by the feedforward inhibition, i.e. the output of Kt willbe strongly inhibited while that of Km will not. Therefore the target’s
MODELS AND MECHANISMS OF VISUAL MASKING126
visibility will be strongly suppressed while the mask’s visibility isenhanced.
Bachmann’s PR approach has several strengths. First, it is highlyplausible from a neuroscientific standpoint. Well-known anatomicaland electrophysiological findings indisputably establish the existenceof specific retino-geniculo-cortical processing pathways in vision(reviewed by Breitmeyer 1992; Schiller 1986; Shapley 1992). Lesswell known but equally indisputable is the empirical evidence for non-specific afferents that project to visual thalamic and cortical areas fromsubcortical reticular areas of the brainstem and midbrain (Frizzi 1979;Hartveit et al. 1993; Hassler 1978; Purpura 1970; Singer 1977, 1979;Singer et al. 1976; Steriade and McCarley 1990). The reticular complexhas played an increasingly prominent role in recent formulations ofvisual selective attention (Crick 1984; LaBerge 1995; LaBerge andBrown 1989; Singer 1994). Of relevance here is Berson and McIlwain’s(1982) demonstration that collateral fibers provide direct inputs fromtransient Y ganglion cells of the cat retina to neurons in the deep layersof the cat superior colliculus. Moreover, on the basis of physiologicaland cytological criteria, Edwards et al. (1979) have argued that thecells in these deep layers ought to be classified as reticular rather thancollicular. If this scheme generalizes to the primate visual system, we have,as stipulated by Bachmann’s model, the neural bases for the activation ofretino-reticulo-cortical (NSP) as well as retino-geniculo-cortical (SP)pathways when a brief target or mask stimulus is presented.
One of us (Breitmeyer 1984, Chapter 10, 1986) has previouslydiscussed the role of brainstem and midbrain reticular activation invisual masking and information processing. In these discussionsreticular activation served not as a constitutive component of theneural masking process as it does in Bachmann’s model, but rather as acomponent ancillary to the sustained–transient channel interactionsthat constituted the essential neural masking processes in the modelintroduced by Breitmeyer and Ganz (1976). The additions wereintroduced to account for the roles of selective attention and visualexploratory behavior characterized by stimulus-guided fixation-saccade sequences in visual information processing (Breitmeyer 1980).These topics are particularly relevant to our understanding of recentresults showing that the magnitude of metacontrast is reduced byselectively attending to the area or the configuration of the target–mask
NEURAL-NETWORK MODELS 127
display (Boyer and Ro, in press; Enns and Di Lollo 1997; Havig et al.1998; Ramachandran and Cobb 1995; Shelley-Tremblay and Mack1999). Bachmann’s PR approach clearly is consistent with these and anumber of other relevant findings, including results obtained whenpharmacological and neurosurgical interventions produce predictableresponse changes in the NSP activating system (Bachmann 1994).
A second strength is that the PR model accords especially well withthe enhancement of the visibility of the second of two spatiotemporallyproximate stimuli (e.g. a mask following a target) compared with whenthat stimulus is presented alone. Both Michaels and Turvey (1979) andBachmann (1988, 1994) reported that the visibility enhancement of anaftercoming mask is maximal at SOAs at which the visibility of thetarget is optimally suppressed. These mask enhancement effects,related to the paracontrast enhancement effects discussed in Chapter 2,section 2.5, may also be related to the contrast reversals of the (preced-ing) target stimulus reported in several previous investigations (Brusselet al. 1978; Heckenmueller and Dember 1965; Purcell and Dember1968). For example, under suitable conditions and at optimal SOAs, ablack disk-like target followed by a black ring-like surrounding maskactually appears brighter than the white background on which thetarget and mask are presented. In Bachmann’s PR model, boththe enhancement of the second stimulus and the contrast reversal ofthe first stimulus could be explained by the enhanced output of Dmneurons relative to Dt neurons and consequently a strong inhibition ofKt neurons relative to a strong excitation of Km neurons. Of course, inthis interpretation of the PR model it is assumed that the activity levelsof the K neurons determine the perceptual salience (brightness,contrast, clarity) of the stimuli.
However, in Bachmann’s (1994) model, the visibility of a stimulus isnot clearly or consistently tied to the output of its associated K neuron.This ambiguity or inconsistency in Bachmann’s (1994) discussion ofthe PR model is due to a lack of specificity as to which of the two sets ofneurons, D (detection) or K (command), is to be associated with theperceived aspects of the stimuli. At one point, Bachmann (1994, pp.180, 183–4) claims that the perceptual efficiency and subjective clarityof a stimulus is directly proportional to the level of activity producedby the stimulus in the corresponding D neuron. Alternatively, Bachmann(1994, pp. 183, 221) argues that the K neurons (or later-stage gnosticunits) generate responses leading to perceptual categorization and
MODELS AND MECHANISMS OF VISUAL MASKING128
recognition of their corresponding stimuli. We believe that this minorambiguity in the PR model can be resolved by unambiguously takingthe output of K neurons as the correlate of perceived stimulus proper-ties such as the perceptual enhancement of the mask’s contrast and thereversal of target’s contrast. Correcting these ‘tuning’ problems withBachmann ‘s (1994) PR model would be easy and would enhance itsexplanatory power.
The PR model also predicts that the second stimulus appears inconsciousness faster when compared with an isolated presentation ofthe same stimulus. Bachmann (1994, 1997) presents data supportingthis prediction, although the supporting evidence rests on what weconsider to be a questionable rationale (Breitmeyer and Ögmen 2000,footnote 2). As a corollary, the PR model also predicts that the judgedorder of appearance of a target and a following mask stimulus can bereversed with an appropriate choice of SOAs, such as those giving riseto maximum (or near-maximum) metacontrast suppression. Toour knowledge, no extant data bear on this prediction. The relevantexperiment remains to be conducted.
4.6. Object-substitution modelsBachmann’s PR model can be viewed as an object-substitution modelas well as a dual-process model. The target object’s SP activity SPt isreplaced by the mask object’s SP activity SPm as the latter (mis)appro-priates the slower target-activated NSP response at the level of the Dand K neurons. Since combination of SP and NSP activities is requiredfor stimulus information to register as a conscious percept, it followsthat the mask takes the place of the target in perception (Bachman1999, 2000). A model specifically adopting object substitution as amasking mechanism has been proposed recently by Enns and Di Lollo(1997) and elaborated by Di Lollo et al. (2000). The theory is intendedto explain not only what is claimed to be a new type B masking effectwhen the onset of the mask follows that of the target, but also the inter-esting case of simultaneous-onset masking. These two cases are dis-cussed in turn below.
4.6.1. Object substitution and type B backward masking
Regarding the type B backward masking effect, Enns and Di Lollo(1997) investigated contour discriminability of a diamond-shaped
OBJECT-SUBSTITUTION MODELS 129
target with either the left or right corner missing when it was maskedby a surrounding diamond-shaped mask or by a mask made of fourdots falling at the corners of a notional square that would enclose thediamond target. The key results showed that the four-dot mask, like thecontour-adjacent diamond-shaped mask, could produce substantialtype B masking under the following conditions: (i) when the target andmask were presented 3� peripherally but not when they were presentedfoveally; (ii) when attention was distributed over large areas of visualspace, i.e. when attention could not be fully allocated to a given target–mask location. While attributing type B backward masking, obtainedwhen the surrounding mask was used, to interactions between contour-sensitive mechanisms, Enns and Di Lollo attributed a similar effect,found when the four-dot mask was used, to high-level processes ofobject substitution. They argued that their data cannot be explained bycontour-based mechanisms of metacontrast because (a) the four-dotmasking was not significantly affected by varying the spatial separationbetween the target and mask contours, (b) none of the masking modelsbased on contour-sensitive mechanisms predict differential maskingoutcomes as a function of attention, and (c) under conditions ofdistributed attention not only backward masking but also simultaneousand forward masking are obtained.
These findings, as noted by Enns and Di Lollo (1997), can poseproblems for masking models based strictly on contour-sensitivemechanisms. Although the types of contour-sensitive mechanismsare not specified, they would no doubt include a number of proposedmechanisms relying on inhibition between spatially neighboringstimulus activities such as lateral inhibitory networks (e.g. Bridgeman1971; Weisstein 1968) or mechanisms based on (lateral) inter-channelinhibition (e.g. Breitmeyer and Ganz 1976). However, the resultsreported by Enns and Di Lollo, while consistent with the notion ofobject substitution, are damaging to the alternative models only underimplicitly limited interpretations. In particular, two interpretivelimitations are implied: (1) contour interactions are narrowly limitedin spatial extent under all conditions, and (2) contour proximity is asine qua non for obtaining type B metacontrast. Thus, when the targetand mask stimuli are centered at the fovea, strong type B masking withthe surrounding mask but not with the four-dot mask is fully consistentwith previous findings and with limited foveal lateral interactions
MODELS AND MECHANISMS OF VISUAL MASKING130
between the target and mask (Bridgeman and Leff 1979; Kolers andRosner 1960). However, target–mask contour proximity is not a sinequa non for obtaining type B backward masking functions, especiallywhen the stimuli are presented outside the fovea, i.e. in regions of thevisual field where object substitution presumably manifests itself moststrongly. There, substantial metacontrast masking can be obtained attarget–mask contour separations of 1� or more (Alpern 1953;Breitmeyer et al. 1981b; Growney et al. 1977; Weisstein and Growney1969) even when the mask stimulus does not surround the targetstimulus (Breitmeyer et al. 1974, 1976). Hence the presence of four-dotmasking outside but not inside the fovea would be entirely expected in‘standard’ models. In particular, extant models such as thesustained–transient model proposed by Breitmeyer and Ganz (1976)and Matin’s (1975) spatiotemporal sequence model, both of whichallow for spatially extensive lateral effects generated by the transientchannels (see Breitmeyer et al. 1981b, Fig. 7), could account for theextrafoveal surround mask and four-dot mask results.
Enns and Di Lollo (1997) correctly note that most extant theories ofmasking do not generally account for attentional effects. However, onemasking model proposed by Michaels and Turvey (1979) incorporatesattention, but largely as an add-on process working in conjunctionwith spatial inhibitory processes. Such a general add-on role for atten-tion makes sense in light of the fact that facilitative effects of selectiveattention, although found in metacontrast (Boyer and Ro, in press;Havig et al. 1998; Ramachandran and Cobb 1995; Shelley-Tremblayand Mack 1999), are not unique to backward masking tasks. Effects ofselective attention generalize to all sorts of perceptual tasks andcriterion contents (Bashinski and Bacharach 1980; LaBerge 1995;Posner 1980; Sagi and Julesz 1985; P.L. Smith et al. 2004), and beyondthat to many other cognitive tasks. If, for instance, we consider thefinding that focusing attention on the locus of a stimulus increasesdetection sensitivity d’ (Bashinski and Bacharach 1980; P.L. Smith et al.2004), we need not conclude that decreased sensitivity found withdiffuse spatial attention rules out the role of low-level detection unitsand requires a higher-level mechanism that is qualitatively differentfrom them. We need only assume that the output of the low-leveldetectors is modulated by the level of attention. Likewise, a modulationof target visibility when attentional allocation to it varies does not
OBJECT-SUBSTITUTION MODELS 131
warrant ruling out the role of lower-level contour inhibitory mechanisms.These alternative ways of explaining the results reported by Enns andDi Lollo (1997) do not exclude the possible role of object substitutionas a masking mechanism. However, they do point out that the resultsobtained by Enns and Di Lollo (1997) are not decisive in rejectingstandard ‘contour-sensitive’ models of masking.
4.6.2. Object substitution and common-onset masking
Di Lollo et al. (1993, 1995) reported substantial masking of the targetwhen the onsets of the target and mask are simultaneous but theduration of the mask is prolonged relative to the brief target duration.Generally, masking increases with mask duration until a critical maskduration is reached beyond which no further increase in masking isobtained. Di Lollo et al. (2000) extended this paradigm and reportedthe results of a number of parametric experiments showing howsimilar masking functions can be obtained with four-dot and surroundmasks. Their model, now given quantitative expression, distinguishedbetween early masking processes affected by early sensory factors, suchas the level of light adaptation, and later attentional factors, such astarget set size. As well as the attentional component, the modelincorporated cortical processes depending not only on feedforwardmechanisms but also on re-entrant feedback mechanisms that play aprominent role in several approaches to the study of visual perception(Bridgeman 1971; de Kamps and van der Velde 2001; Edelman 1987;Grossberg and Mingolla 1985a,b; Ögmen 1993; Ratliff 1965; Zeki1993). The re-entrant processes play a particularly important role inthe process of object substitution. Di Lollo et al. (2000) claim that theirfindings, expressing the combined effects of common-onset and four-dot masking, not only support their model but also defy explanation byextant feedforward or contour-sensitive models of masking.
However, this claim is somewhat puzzling in view of the fact thatBischof and Di Lollo (1995) had already shown that both metacontrastand common-onset masking are consistent with Bridgeman’s (1971)Hartline–Ratliff neural-network model. Although the model incorp-orates recurrent lateral inhibition that can be expressed as a form ofnegative feedback, it certainly does not qualify as the high-levelattention-dependent re-entrant activity envisaged by Di Lollo et al.(2000) as an essential component of their object-substitution model.
MODELS AND MECHANISMS OF VISUAL MASKING132
In Bridgeman’s model, the recurrent network merely serves to set upand sharpen stimulus-induced neural-network activities, whilecorrelations between target- and mask-induced activities determinethe perceptual status of the target when it is followed by a mask.Recurrent lateral inhibition is a low-level property of vision; versionsof it are implemented in visual systems as simple as that of Limulus(Ratliff 1965). Hence, invoking a high-level mechanism to explainmasking phenomena that a relatively low-level process might explainas well appears unnecessary for explanations of common-onsetmasking. In fact, as shown recently by Francis and Hermens’s (2002)extension of Francis’s (2000) original analysis of quantitative models ofmasking, a number of existing models besides Bridgeman’s (1971) canexplain the major findings of common-onset masking as well asthe four-dot masking reported by Di Lollo et al. (2000). Thus, again,the results, while supporting the object-substitution model, do not ruleout extant lateral inhibitory or feedforward models.
Despite these unresolved issues (Di Lollo et al. 2002), an importantupshot of more recently reported findings by Enns and Di Lollo (1997),Di Lollo et al. (2000), Lleras and Moore (2003) and Enns (2002, 2004)for visual masking theories is the sharper focus they place on lateobject-specific (Williams and Weisstein 1981) and attentional(Michaels and Turvey 1979) levels of cortical processing that cannot beexplained by cortical contour-interactive processes alone (Breitmeyer1984, pp. 256–61). Such an approach dovetails nicely with evidence foran interruptive mechanism of visual masking located in or probably nolater than the inferotemporal cortex (Kovács et al. 1995; Rolls andTovée 1994; Rolls et al. 1999). Spatial selective attention powerfullymodulates the responses of visual cells there and in other extrastriatecortical areas (Moran and Desimone 1995; Motter 1993; Sato 1988;Schiller and Lee 1991). Hence such interruptive masking would beparticularly consistent with the view of an attention-modulated maskingat these later levels of cortical processing and, specifically, with a mech-anism of object substitution. On the other hand, in a recent studyKahan and Mathis (2002) showed that the strength of common-onsetmasking did not depend on gestalt grouping factors such as form,similarity in color, position, luminance polarity, and common region,thus providing evidence against the role of object-specific factors incommon-onset masking.
OBJECT-SUBSTITUTION MODELS 133
4.7. Emergent dynamic properties of the boundarycontour system (BCS) neural networkThe boundary contour system (BCS) is a model of a cortical neuralnetwork proposed by Grossberg and Mingolla (1985a,b) to account forspatial aspects of the visual perception of stationary steady-statestimuli. By exploring its dynamic properties, Francis and colleagues(Francis 1996a,b, 1997; Francis and Grossberg 1996a,b; Francis et al.1994) have demonstrated its ability to account also for a variety ofempirical findings obtained when visual inputs change rapidly overtime. The model is a cooperative–competitive network incorporating,in addition to the obvious afferent feedforward excitatory drive, threekey properties: excitatory feedback, feedforward inhibition, andinhibitory feedback. Since the BCS, at least with respect to formperception of stationary stimuli, relies on the cortical P pathway(Grossberg 1994), we can consider these mechanisms to operate withina single channel. Figure 4.5 shows a schematic diagram of the BCSmodel. At the earliest levels of processing, it consists of unorientedcontrast-specific filters (on-center off-surround cells) whose outputs feedinto oriented contrast-specific simple cells. In turn, the rectified outputsof these units feed into complex cells selective for the same orientationbut insensitive to contrast polarity. At the first competitive stage, thecomplex cells project their outputs via on-center off-surround connec-tions to first-level hypercomplex cells. Because of the off-surroundconnections, these hypercomplex cells, while remaining orientationselective, additionally are selective for end-stopped stimuli (Hubel1988; Hubel and Wiesel 1965). At the next stage, competition amongorientations results when higher-order hypercomplex cells are activatedvia antagonistic inputs from the lower-order hypercomplex cells tunedto different orientations. The outputs of these higher-order hypercom-plex cells, which specify the location of oriented stimulus boundaries inthe visual field, feed into cooperative bipole cells. The bipole cells generatefeedback which, on the one hand, excites location- and orientation-consistent patterns of activity and, on the other, inhibits inconsistentpatterns of activity.
The temporal dynamics of this model account for a number of empir-ical regularities characterizing visual persistence (Francis 1996a,b).Persistence arises through activation of the excitatory feedback loopsresulting in long-lasting reverberatory activity in the BCS network. When
MODELS AND MECHANISMS OF VISUAL MASKING134
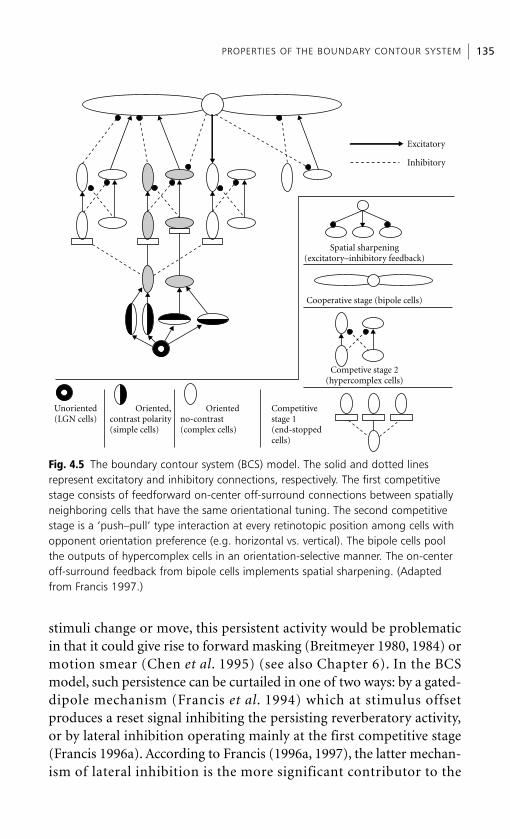
stimuli change or move, this persistent activity would be problematicin that it could give rise to forward masking (Breitmeyer 1980, 1984) ormotion smear (Chen et al. 1995) (see also Chapter 6). In the BCSmodel, such persistence can be curtailed in one of two ways: by a gated-dipole mechanism (Francis et al. 1994) which at stimulus offsetproduces a reset signal inhibiting the persisting reverberatory activity,or by lateral inhibition operating mainly at the first competitive stage(Francis 1996a). According to Francis (1996a, 1997), the latter mechan-ism of lateral inhibition is the more significant contributor to the
PROPERTIES OF THE BOUNDARY CONTOUR SYSTEM 135
Excitatory
Inhibitory
Spatial sharpening(excitatory–inhibitory feedback)
Cooperative stage (bipole cells)
Competive stage 2(hypercomplex cells)
Unoriented(LGN cells)
Oriented,contrast polarity(simple cells)
Orientedno-contrast (complex cells)
Competitivestage 1(end-stoppedcells)
Fig. 4.5 The boundary contour system (BCS) model. The solid and dotted lines represent excitatory and inhibitory connections, respectively. The first competitivestage consists of feedforward on-center off-surround connections between spatiallyneighboring cells that have the same orientational tuning. The second competitivestage is a ‘push–pull’ type interaction at every retinotopic position among cells withopponent orientation preference (e.g. horizontal vs. vertical). The bipole cells poolthe outputs of hypercomplex cells in an orientation-selective manner. The on-centeroff-surround feedback from bipole cells implements spatial sharpening. (Adaptedfrom Francis 1997.)
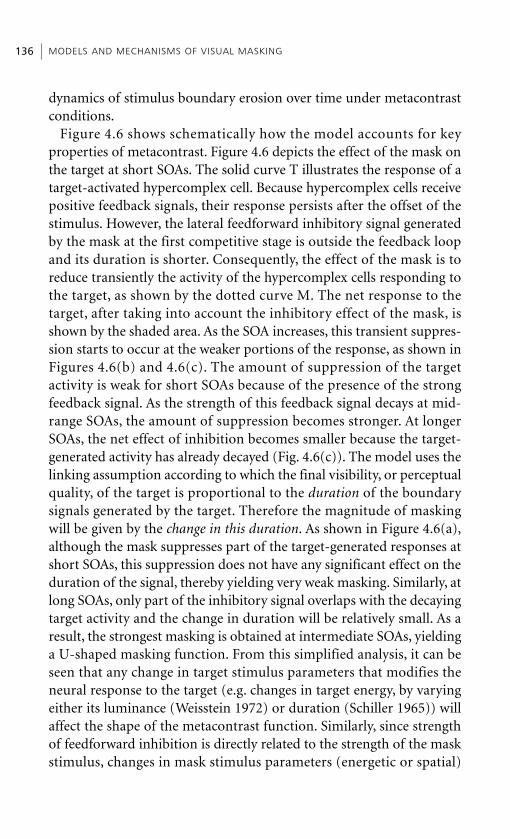
dynamics of stimulus boundary erosion over time under metacontrastconditions.
Figure 4.6 shows schematically how the model accounts for keyproperties of metacontrast. Figure 4.6 depicts the effect of the mask onthe target at short SOAs. The solid curve T illustrates the response of atarget-activated hypercomplex cell. Because hypercomplex cells receivepositive feedback signals, their response persists after the offset of thestimulus. However, the lateral feedforward inhibitory signal generatedby the mask at the first competitive stage is outside the feedback loopand its duration is shorter. Consequently, the effect of the mask is toreduce transiently the activity of the hypercomplex cells responding tothe target, as shown by the dotted curve M. The net response to thetarget, after taking into account the inhibitory effect of the mask, isshown by the shaded area. As the SOA increases, this transient suppres-sion starts to occur at the weaker portions of the response, as shown inFigures 4.6(b) and 4.6(c). The amount of suppression of the targetactivity is weak for short SOAs because of the presence of the strongfeedback signal. As the strength of this feedback signal decays at mid-range SOAs, the amount of suppression becomes stronger. At longerSOAs, the net effect of inhibition becomes smaller because the target-generated activity has already decayed (Fig. 4.6(c)). The model uses thelinking assumption according to which the final visibility, or perceptualquality, of the target is proportional to the duration of the boundarysignals generated by the target. Therefore the magnitude of maskingwill be given by the change in this duration. As shown in Figure 4.6(a),although the mask suppresses part of the target-generated responses atshort SOAs, this suppression does not have any significant effect on theduration of the signal, thereby yielding very weak masking. Similarly, atlong SOAs, only part of the inhibitory signal overlaps with the decayingtarget activity and the change in duration will be relatively small. As aresult, the strongest masking is obtained at intermediate SOAs, yieldinga U-shaped masking function. From this simplified analysis, it can beseen that any change in target stimulus parameters that modifies theneural response to the target (e.g. changes in target energy, by varyingeither its luminance (Weisstein 1972) or duration (Schiller 1965)) willaffect the shape of the metacontrast function. Similarly, since strengthof feedforward inhibition is directly related to the strength of the maskstimulus, changes in mask stimulus parameters (energetic or spatial)
MODELS AND MECHANISMS OF VISUAL MASKING136
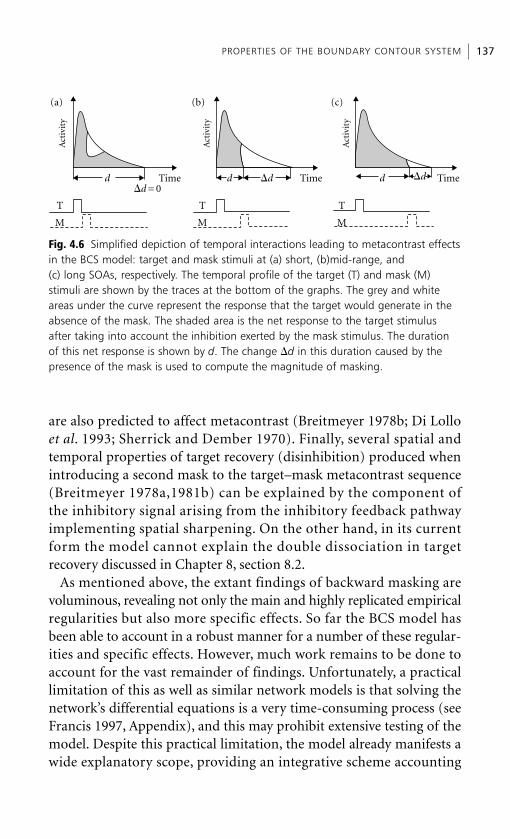
are also predicted to affect metacontrast (Breitmeyer 1978b; Di Lolloet al. 1993; Sherrick and Dember 1970). Finally, several spatial andtemporal properties of target recovery (disinhibition) produced whenintroducing a second mask to the target–mask metacontrast sequence(Breitmeyer 1978a,1981b) can be explained by the component ofthe inhibitory signal arising from the inhibitory feedback pathwayimplementing spatial sharpening. On the other hand, in its currentform the model cannot explain the double dissociation in targetrecovery discussed in Chapter 8, section 8.2.
As mentioned above, the extant findings of backward masking arevoluminous, revealing not only the main and highly replicated empiricalregularities but also more specific effects. So far the BCS model hasbeen able to account in a robust manner for a number of these regular-ities and specific effects. However, much work remains to be done toaccount for the vast remainder of findings. Unfortunately, a practicallimitation of this as well as similar network models is that solving thenetwork’s differential equations is a very time-consuming process (seeFrancis 1997, Appendix), and this may prohibit extensive testing of themodel. Despite this practical limitation, the model already manifests awide explanatory scope, providing an integrative scheme accounting
PROPERTIES OF THE BOUNDARY CONTOUR SYSTEM 137A
ctiv
ity
Act
ivit
y
Act
ivit
y
d dd�d = 0
�d �dTime Time Time
T
M
T
M
T
M
(a) (b) (c)
Fig. 4.6 Simplified depiction of temporal interactions leading to metacontrast effectsin the BCS model: target and mask stimuli at (a) short, (b)mid-range, and (c) long SOAs, respectively. The temporal profile of the target (T) and mask (M) stimuli are shown by the traces at the bottom of the graphs. The grey and whiteareas under the curve represent the response that the target would generate in theabsence of the mask. The shaded area is the net response to the target stimulusafter taking into account the inhibition exerted by the mask stimulus. The durationof this net response is shown by d. The change �d in this duration caused by thepresence of the mask is used to compute the magnitude of masking.
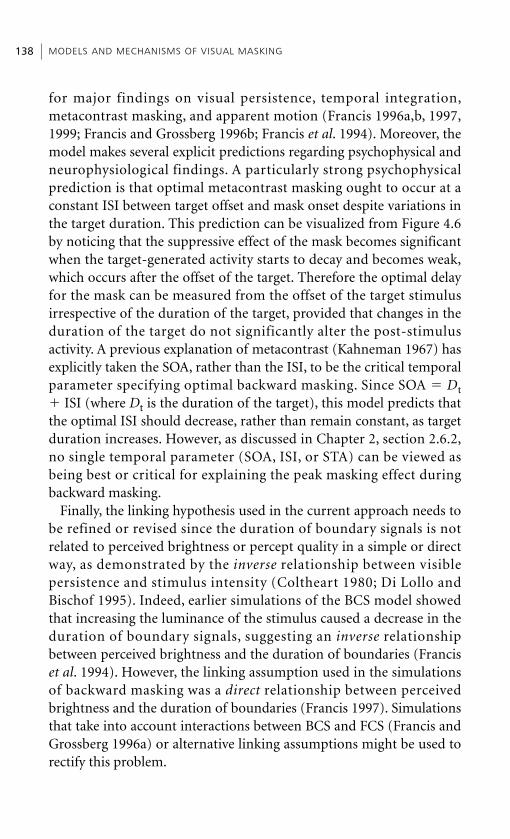
for major findings on visual persistence, temporal integration,metacontrast masking, and apparent motion (Francis 1996a,b, 1997,1999; Francis and Grossberg 1996b; Francis et al. 1994). Moreover, themodel makes several explicit predictions regarding psychophysical andneurophysiological findings. A particularly strong psychophysicalprediction is that optimal metacontrast masking ought to occur at aconstant ISI between target offset and mask onset despite variations inthe target duration. This prediction can be visualized from Figure 4.6by noticing that the suppressive effect of the mask becomes significantwhen the target-generated activity starts to decay and becomes weak,which occurs after the offset of the target. Therefore the optimal delayfor the mask can be measured from the offset of the target stimulusirrespective of the duration of the target, provided that changes in theduration of the target do not significantly alter the post-stimulusactivity. A previous explanation of metacontrast (Kahneman 1967) hasexplicitly taken the SOA, rather than the ISI, to be the critical temporalparameter specifying optimal backward masking. Since SOA � Dt� ISI (where Dt is the duration of the target), this model predicts thatthe optimal ISI should decrease, rather than remain constant, as targetduration increases. However, as discussed in Chapter 2, section 2.6.2,no single temporal parameter (SOA, ISI, or STA) can be viewed asbeing best or critical for explaining the peak masking effect duringbackward masking.
Finally, the linking hypothesis used in the current approach needs tobe refined or revised since the duration of boundary signals is notrelated to perceived brightness or percept quality in a simple or directway, as demonstrated by the inverse relationship between visiblepersistence and stimulus intensity (Coltheart 1980; Di Lollo andBischof 1995). Indeed, earlier simulations of the BCS model showedthat increasing the luminance of the stimulus caused a decrease in theduration of boundary signals, suggesting an inverse relationshipbetween perceived brightness and the duration of boundaries (Franciset al. 1994). However, the linking assumption used in the simulationsof backward masking was a direct relationship between perceivedbrightness and the duration of boundaries (Francis 1997). Simulationsthat take into account interactions between BCS and FCS (Francis andGrossberg 1996a) or alternative linking assumptions might be used torectify this problem.
MODELS AND MECHANISMS OF VISUAL MASKING138
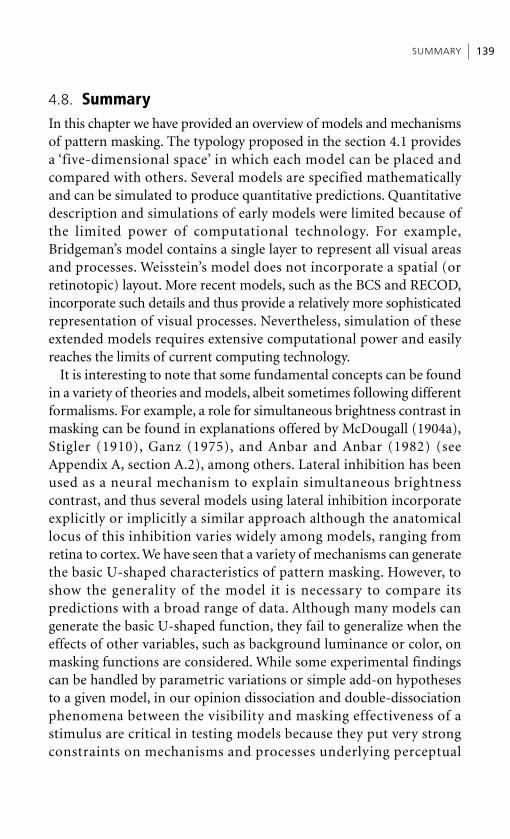
4.8. SummaryIn this chapter we have provided an overview of models and mechanismsof pattern masking. The typology proposed in the section 4.1 providesa ‘five-dimensional space’ in which each model can be placed andcompared with others. Several models are specified mathematicallyand can be simulated to produce quantitative predictions. Quantitativedescription and simulations of early models were limited because ofthe limited power of computational technology. For example,Bridgeman’s model contains a single layer to represent all visual areasand processes. Weisstein’s model does not incorporate a spatial (orretinotopic) layout. More recent models, such as the BCS and RECOD,incorporate such details and thus provide a relatively more sophisticatedrepresentation of visual processes. Nevertheless, simulation of theseextended models requires extensive computational power and easilyreaches the limits of current computing technology.
It is interesting to note that some fundamental concepts can be foundin a variety of theories and models, albeit sometimes following differentformalisms. For example, a role for simultaneous brightness contrast inmasking can be found in explanations offered by McDougall (1904a),Stigler (1910), Ganz (1975), and Anbar and Anbar (1982) (seeAppendix A, section A.2), among others. Lateral inhibition has beenused as a neural mechanism to explain simultaneous brightnesscontrast, and thus several models using lateral inhibition incorporateexplicitly or implicitly a similar approach although the anatomicallocus of this inhibition varies widely among models, ranging fromretina to cortex. We have seen that a variety of mechanisms can generatethe basic U-shaped characteristics of pattern masking. However, toshow the generality of the model it is necessary to compare itspredictions with a broad range of data. Although many models cangenerate the basic U-shaped function, they fail to generalize when theeffects of other variables, such as background luminance or color, onmasking functions are considered. While some experimental findingscan be handled by parametric variations or simple add-on hypothesesto a given model, in our opinion dissociation and double-dissociationphenomena between the visibility and masking effectiveness of astimulus are critical in testing models because they put very strongconstraints on mechanisms and processes underlying perceptual
SUMMARY 139
effects. As discussed throughout this book, very few models canaccommodate such dissociation phenomena.
Note1. X and Y neurons correspond to two major classes of retinal ganglion cells identified in
the cat (Enroth-Cugell and Robson 1966). Among the differences in their responsecharacteristics are the latencies and transience. Y cells have shorter latencies andrespond more transiently than X cells. In Chapter 5, section 5.2.1, we review theproperties of primate P and M cells with long-latency sustained and short-latencytransient responses. However, although X/Y and P/M classifications have severalsimilarities, the correspondence is not one-to-one (see Chapter 5, note 1).
MODELS AND MECHANISMS OF VISUAL MASKING140
Chapter 5
The sustained–transient channelapproach to visual masking: anupdated model
5.1. IntroductionThe fact that a mask presented later in time can be optimal in suppressingthe visibility of a target which had already reached the cortex had beena puzzling aspect of masking. If we conceptualize neural and perceptualphenomena as instantaneous events, then notions of arrow of time andcausality appear to be at stake. However, if we take into considerationthe fact that transmission and processing of a stimulus takes time, thenan after-coming mask need not work backwards in time: It simply inter-feres with the ongoing response to the target. This is the fundamentalrationale of single-channel models. Dual-channel models add anotherdimension to this framework by highlighting that a given stimulus canactivate more than one process and therefore the timing relations needto be analyzed in terms of not only the timing of stimuli but also therelative timing of these processes. In this chapter, we will review twodual-channel models. We note that the models proposed by Matin(1975) and Weisstein et al. (1975) also adopt a dual-channel ordual-process structure, as does the perceptual retouch approach(Bachmann 1984). Although these models bear some resemblance tothe models outlined below, we will not discuss them here, since we havealready done so in Chapter 4, sections 4.1.2, 4.2.2, and 4.3.2.
5.2. Parvocellular/magnocellular pathways andsustained/transient channels in the primate visual systemThe two models to be discussed connect their structures directly withparvocellular (P) and magnocellular (M) afferent pathways as well as
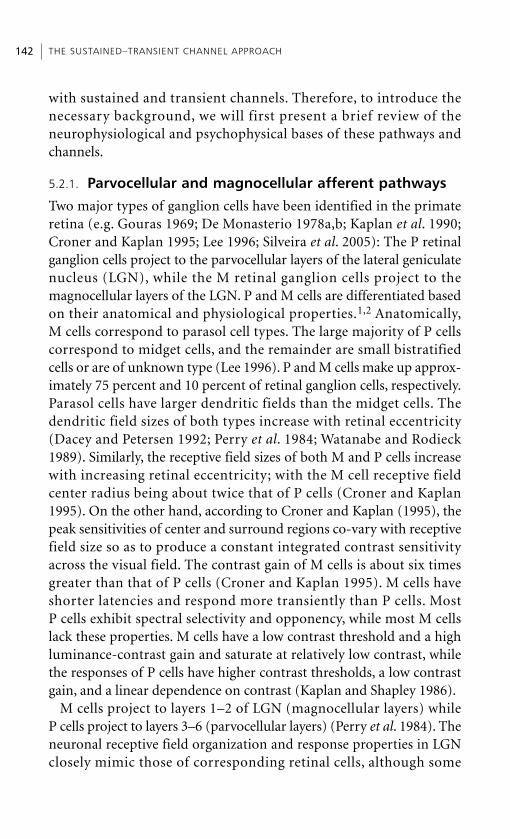
with sustained and transient channels. Therefore, to introduce thenecessary background, we will first present a brief review of theneurophysiological and psychophysical bases of these pathways andchannels.
5.2.1. Parvocellular and magnocellular afferent pathways
Two major types of ganglion cells have been identified in the primateretina (e.g. Gouras 1969; De Monasterio 1978a,b; Kaplan et al. 1990;Croner and Kaplan 1995; Lee 1996; Silveira et al. 2005): The P retinalganglion cells project to the parvocellular layers of the lateral geniculatenucleus (LGN), while the M retinal ganglion cells project to themagnocellular layers of the LGN. P and M cells are differentiated basedon their anatomical and physiological properties.1,2 Anatomically,M cells correspond to parasol cell types. The large majority of P cellscorrespond to midget cells, and the remainder are small bistratifiedcells or are of unknown type (Lee 1996). P and M cells make up approx-imately 75 percent and 10 percent of retinal ganglion cells, respectively.Parasol cells have larger dendritic fields than the midget cells. Thedendritic field sizes of both types increase with retinal eccentricity(Dacey and Petersen 1992; Perry et al. 1984; Watanabe and Rodieck1989). Similarly, the receptive field sizes of both M and P cells increasewith increasing retinal eccentricity; with the M cell receptive fieldcenter radius being about twice that of P cells (Croner and Kaplan1995). On the other hand, according to Croner and Kaplan (1995), thepeak sensitivities of center and surround regions co-vary with receptivefield size so as to produce a constant integrated contrast sensitivityacross the visual field. The contrast gain of M cells is about six timesgreater than that of P cells (Croner and Kaplan 1995). M cells haveshorter latencies and respond more transiently than P cells. Most P cells exhibit spectral selectivity and opponency, while most M cellslack these properties. M cells have a low contrast threshold and a highluminance-contrast gain and saturate at relatively low contrast, whilethe responses of P cells have higher contrast thresholds, a low contrastgain, and a linear dependence on contrast (Kaplan and Shapley 1986).
M cells project to layers 1–2 of LGN (magnocellular layers) while P cells project to layers 3–6 (parvocellular layers) (Perry et al. 1984). Theneuronal receptive field organization and response properties in LGNclosely mimic those of corresponding retinal cells, although some
THE SUSTAINED–TRANSIENT CHANNEL APPROACH 142
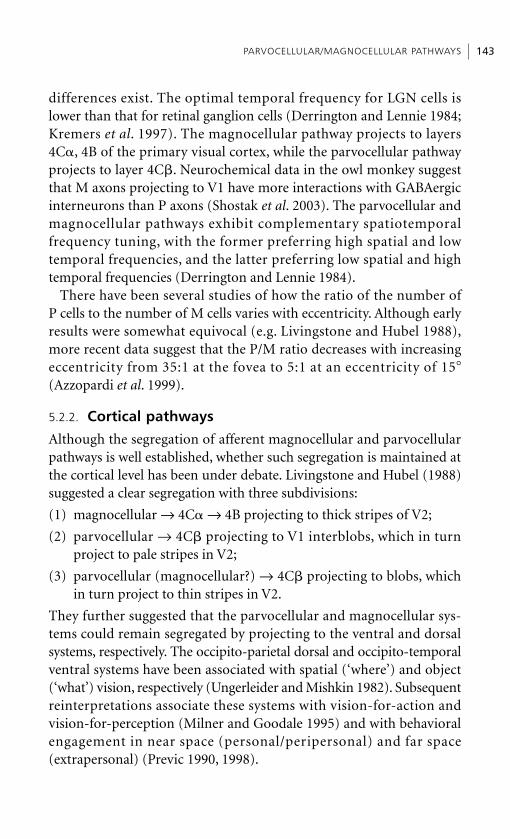
differences exist. The optimal temporal frequency for LGN cells islower than that for retinal ganglion cells (Derrington and Lennie 1984;Kremers et al. 1997). The magnocellular pathway projects to layers4C�, 4B of the primary visual cortex, while the parvocellular pathwayprojects to layer 4C . Neurochemical data in the owl monkey suggestthat M axons projecting to V1 have more interactions with GABAergicinterneurons than P axons (Shostak et al. 2003). The parvocellular andmagnocellular pathways exhibit complementary spatiotemporalfrequency tuning, with the former preferring high spatial and lowtemporal frequencies, and the latter preferring low spatial and hightemporal frequencies (Derrington and Lennie 1984).
There have been several studies of how the ratio of the number ofP cells to the number of M cells varies with eccentricity. Although earlyresults were somewhat equivocal (e.g. Livingstone and Hubel 1988),more recent data suggest that the P/M ratio decreases with increasingeccentricity from 35:1 at the fovea to 5:1 at an eccentricity of 15�(Azzopardi et al. 1999).
5.2.2. Cortical pathways
Although the segregation of afferent magnocellular and parvocellularpathways is well established, whether such segregation is maintained atthe cortical level has been under debate. Livingstone and Hubel (1988)suggested a clear segregation with three subdivisions:
(1) magnocellular → 4C� → 4B projecting to thick stripes of V2;
(2) parvocellular → 4C projecting to V1 interblobs, which in turnproject to pale stripes in V2;
(3) parvocellular (magnocellular?) → 4C projecting to blobs, whichin turn project to thin stripes in V2.
They further suggested that the parvocellular and magnocellular sys-tems could remain segregated by projecting to the ventral and dorsalsystems, respectively. The occipito-parietal dorsal and occipito-temporalventral systems have been associated with spatial (‘where’) and object(‘what’) vision, respectively (Ungerleider and Mishkin 1982). Subsequentreinterpretations associate these systems with vision-for-action andvision-for-perception (Milner and Goodale 1995) and with behavioralengagement in near space (personal/peripersonal) and far space(extrapersonal) (Previc 1990, 1998).
PARVOCELLULAR/MAGNOCELLULAR PATHWAYS 143
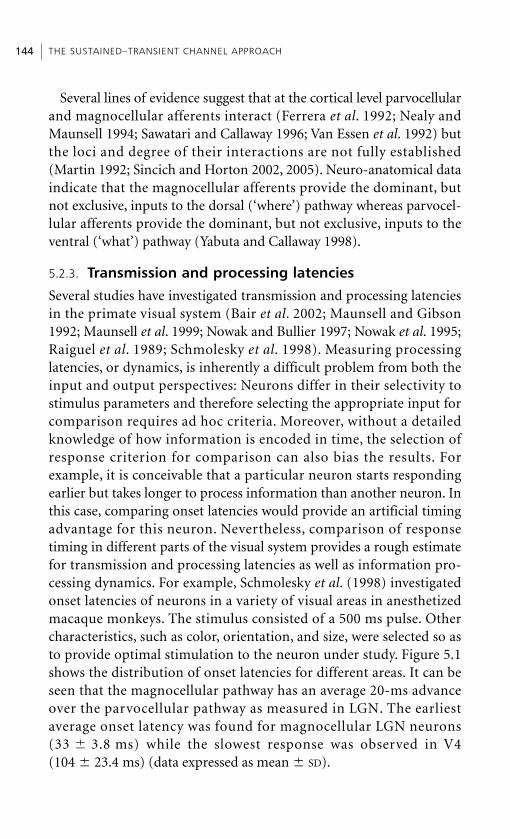
Several lines of evidence suggest that at the cortical level parvocellularand magnocellular afferents interact (Ferrera et al. 1992; Nealy andMaunsell 1994; Sawatari and Callaway 1996; Van Essen et al. 1992) butthe loci and degree of their interactions are not fully established(Martin 1992; Sincich and Horton 2002, 2005). Neuro-anatomical dataindicate that the magnocellular afferents provide the dominant, butnot exclusive, inputs to the dorsal (‘where’) pathway whereas parvocel-lular afferents provide the dominant, but not exclusive, inputs to theventral (‘what’) pathway (Yabuta and Callaway 1998).
5.2.3. Transmission and processing latencies
Several studies have investigated transmission and processing latenciesin the primate visual system (Bair et al. 2002; Maunsell and Gibson1992; Maunsell et al. 1999; Nowak and Bullier 1997; Nowak et al. 1995;Raiguel et al. 1989; Schmolesky et al. 1998). Measuring processinglatencies, or dynamics, is inherently a difficult problem from both theinput and output perspectives: Neurons differ in their selectivity tostimulus parameters and therefore selecting the appropriate input forcomparison requires ad hoc criteria. Moreover, without a detailedknowledge of how information is encoded in time, the selection ofresponse criterion for comparison can also bias the results. Forexample, it is conceivable that a particular neuron starts respondingearlier but takes longer to process information than another neuron. Inthis case, comparing onset latencies would provide an artificial timingadvantage for this neuron. Nevertheless, comparison of responsetiming in different parts of the visual system provides a rough estimatefor transmission and processing latencies as well as information pro-cessing dynamics. For example, Schmolesky et al. (1998) investigatedonset latencies of neurons in a variety of visual areas in anesthetizedmacaque monkeys. The stimulus consisted of a 500 ms pulse. Othercharacteristics, such as color, orientation, and size, were selected so asto provide optimal stimulation to the neuron under study. Figure 5.1shows the distribution of onset latencies for different areas. It can beseen that the magnocellular pathway has an average 20-ms advanceover the parvocellular pathway as measured in LGN. The earliestaverage onset latency was found for magnocellular LGN neurons(33 � 3.8 ms) while the slowest response was observed in V4(104 � 23.4 ms) (data expressed as mean � SD).
THE SUSTAINED–TRANSIENT CHANNEL APPROACH 144
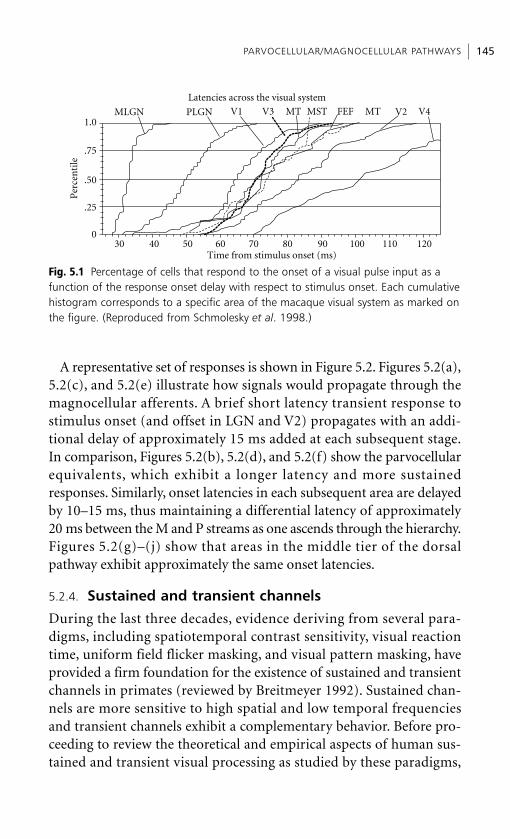
A representative set of responses is shown in Figure 5.2. Figures 5.2(a),5.2(c), and 5.2(e) illustrate how signals would propagate through themagnocellular afferents. A brief short latency transient response tostimulus onset (and offset in LGN and V2) propagates with an addi-tional delay of approximately 15 ms added at each subsequent stage.In comparison, Figures 5.2(b), 5.2(d), and 5.2(f) show the parvocellularequivalents, which exhibit a longer latency and more sustainedresponses. Similarly, onset latencies in each subsequent area are delayedby 10–15 ms, thus maintaining a differential latency of approximately20 ms between the M and P streams as one ascends through the hierarchy.Figures 5.2(g)–(j) show that areas in the middle tier of the dorsalpathway exhibit approximately the same onset latencies.
5.2.4. Sustained and transient channels
During the last three decades, evidence deriving from several para-digms, including spatiotemporal contrast sensitivity, visual reactiontime, uniform field flicker masking, and visual pattern masking, haveprovided a firm foundation for the existence of sustained and transientchannels in primates (reviewed by Breitmeyer 1992). Sustained chan-nels are more sensitive to high spatial and low temporal frequenciesand transient channels exhibit a complementary behavior. Before pro-ceeding to review the theoretical and empirical aspects of human sus-tained and transient visual processing as studied by these paradigms,
PARVOCELLULAR/MAGNOCELLULAR PATHWAYS 145
.75
.50
.25
40 50 60 70 80 90 100 110
Latencies across the visual system
MLGN PLGN V1 V3 MTMT MST FEF V4V2
30 120Time from stimulus onset (ms)
1.0
0
Per
cen
tile
Fig. 5.1 Percentage of cells that respond to the onset of a visual pulse input as afunction of the response onset delay with respect to stimulus onset. Each cumulativehistogram corresponds to a specific area of the macaque visual system as marked onthe figure. (Reproduced from Schmolesky et al. 1998.)
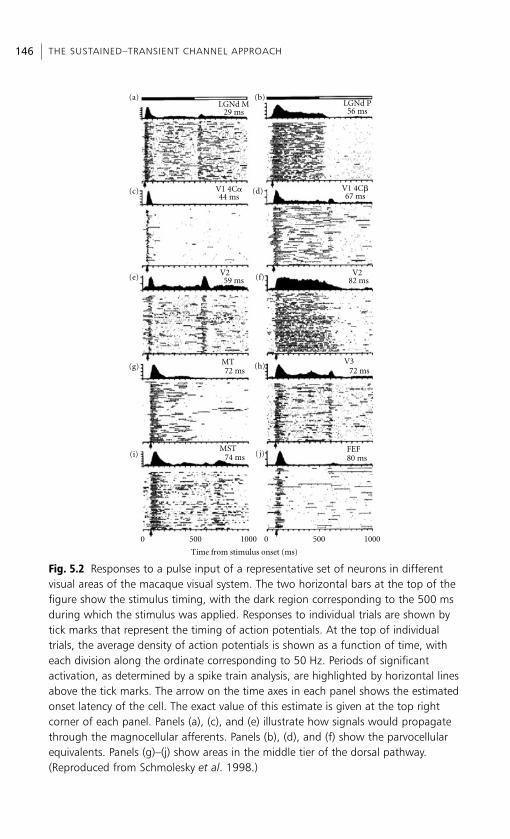
THE SUSTAINED–TRANSIENT CHANNEL APPROACH 146
(a) (b)
(c) (d)
(e)
(g)
(f)
MT (h)
(i) ( j)
0 500 1000 0 500 1000
LGNd M29 ms
V1 4C�44 ms
59 ms
72 ms
MST74 ms
72 ms
82 msV2 V2
V3
V1 4C�67 ms
LGNd P56 ms
FEF80 ms
Time from stimulus onset (ms)
Fig. 5.2 Responses to a pulse input of a representative set of neurons in differentvisual areas of the macaque visual system. The two horizontal bars at the top of thefigure show the stimulus timing, with the dark region corresponding to the 500 msduring which the stimulus was applied. Responses to individual trials are shown bytick marks that represent the timing of action potentials. At the top of individual trials, the average density of action potentials is shown as a function of time, witheach division along the ordinate corresponding to 50 Hz. Periods of significant activation, as determined by a spike train analysis, are highlighted by horizontal linesabove the tick marks. The arrow on the time axes in each panel shows the estimatedonset latency of the cell. The exact value of this estimate is given at the top rightcorner of each panel. Panels (a), (c), and (e) illustrate how signals would propagatethrough the magnocellular afferents. Panels (b), (d), and (f) show the parvocellularequivalents. Panels (g)–(j) show areas in the middle tier of the dorsal pathway.(Reproduced from Schmolesky et al. 1998.)
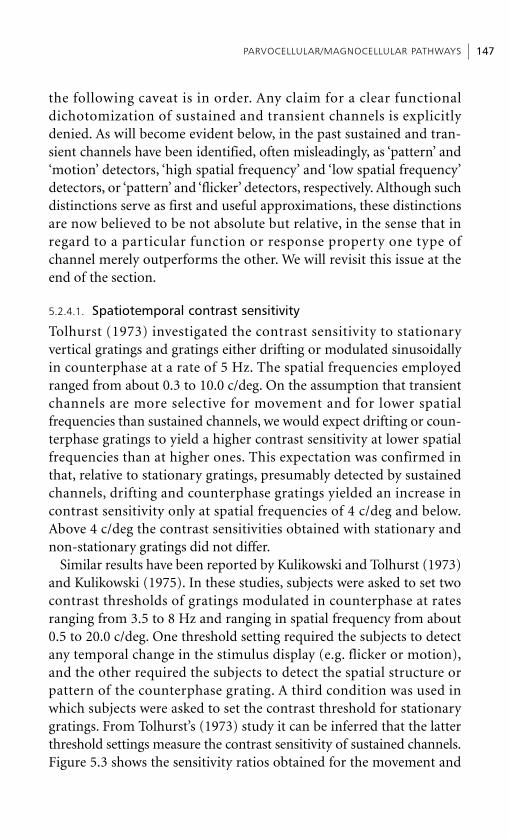
the following caveat is in order. Any claim for a clear functionaldichotomization of sustained and transient channels is explicitlydenied. As will become evident below, in the past sustained and tran-sient channels have been identified, often misleadingly, as ‘pattern’ and‘motion’ detectors, ‘high spatial frequency’ and ‘low spatial frequency’detectors, or ‘pattern’ and ‘flicker’ detectors, respectively. Although suchdistinctions serve as first and useful approximations, these distinctionsare now believed to be not absolute but relative, in the sense that inregard to a particular function or response property one type ofchannel merely outperforms the other. We will revisit this issue at theend of the section.
5.2.4.1. Spatiotemporal contrast sensitivity
Tolhurst (1973) investigated the contrast sensitivity to stationaryvertical gratings and gratings either drifting or modulated sinusoidallyin counterphase at a rate of 5 Hz. The spatial frequencies employedranged from about 0.3 to 10.0 c/deg. On the assumption that transientchannels are more selective for movement and for lower spatialfrequencies than sustained channels, we would expect drifting or coun-terphase gratings to yield a higher contrast sensitivity at lower spatialfrequencies than at higher ones. This expectation was confirmed inthat, relative to stationary gratings, presumably detected by sustainedchannels, drifting and counterphase gratings yielded an increase incontrast sensitivity only at spatial frequencies of 4 c/deg and below.Above 4 c/deg the contrast sensitivities obtained with stationary andnon-stationary gratings did not differ.
Similar results have been reported by Kulikowski and Tolhurst (1973)and Kulikowski (1975). In these studies, subjects were asked to set twocontrast thresholds of gratings modulated in counterphase at ratesranging from 3.5 to 8 Hz and ranging in spatial frequency from about0.5 to 20.0 c/deg. One threshold setting required the subjects to detectany temporal change in the stimulus display (e.g. flicker or motion),and the other required the subjects to detect the spatial structure orpattern of the counterphase grating. A third condition was used inwhich subjects were asked to set the contrast threshold for stationarygratings. From Tolhurst’s (1973) study it can be inferred that the latterthreshold settings measure the contrast sensitivity of sustained channels.Figure 5.3 shows the sensitivity ratios obtained for the movement and
PARVOCELLULAR/MAGNOCELLULAR PATHWAYS 147

pattern thresholds of the counterphase gratings relative to the contrastthreshold for the stationary gratings. It should be noted that the pat-tern sensitivity ratio is almost 1.0 at all spatial frequencies of the coun-terphase grating. However, the movement sensitivity ratio is roughly2.0 at the lowest spatial frequencies and does not attain a value of 1.0until spatial frequencies of about 5 c/deg and above are reached. Thisindicates that movement or transient channels respond preferably tothe lower range of spatial frequencies, whereas sustained channelsrespond preferably to intermediate and higher spatial frequencies,although they can also respond to the lower range of spatial frequen-cies (see section 5.2.4.3). Similar conclusions have been reached byNagano (1980) who measured the duration threshold of gratings as afunction of their spatial frequency and contrast. He also used the two-threshold criterion employed by Kulikowski and Tolhurst (1973) andfound that the sensitivity ratio of the transient to the pattern criterion
THE SUSTAINED–TRANSIENT CHANNEL APPROACH 148
1.0
2.0
1 3 10
(a) Subject J. J. k.
(b) Subject C. F.
0.3 30Spatial frequency (c/deg)
2.0
1.0
Con
tras
t se
nsi
tivi
ty r
atio
Fig. 5.3 The sensitivity ratio for threshold pattern recognition and flicker detectionas a function of spatial frequency. The full symbols represent the sensitivity ratio offlicker detection of counterphase gratings relative to pattern detection of stationarygratings, and the open symbols represent the sensitivity ratio of pattern detection ofcounterphase gratings relative to pattern detection of stationary gratings.(Reproduced from Kulikowski and Tolhurst 1973.)
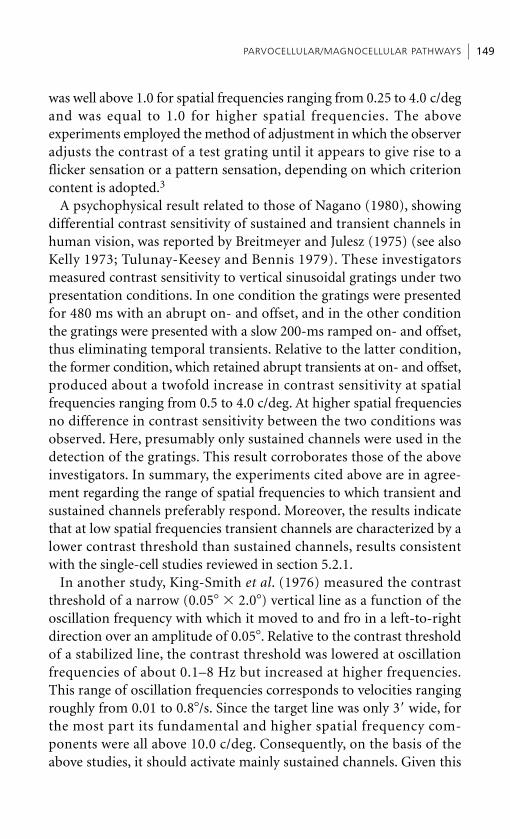
was well above 1.0 for spatial frequencies ranging from 0.25 to 4.0 c/degand was equal to 1.0 for higher spatial frequencies. The aboveexperiments employed the method of adjustment in which the observeradjusts the contrast of a test grating until it appears to give rise to aflicker sensation or a pattern sensation, depending on which criterioncontent is adopted.3
A psychophysical result related to those of Nagano (1980), showingdifferential contrast sensitivity of sustained and transient channels inhuman vision, was reported by Breitmeyer and Julesz (1975) (see alsoKelly 1973; Tulunay-Keesey and Bennis 1979). These investigatorsmeasured contrast sensitivity to vertical sinusoidal gratings under twopresentation conditions. In one condition the gratings were presentedfor 480 ms with an abrupt on- and offset, and in the other conditionthe gratings were presented with a slow 200-ms ramped on- and offset,thus eliminating temporal transients. Relative to the latter condition,the former condition, which retained abrupt transients at on- and offset,produced about a twofold increase in contrast sensitivity at spatialfrequencies ranging from 0.5 to 4.0 c/deg. At higher spatial frequenciesno difference in contrast sensitivity between the two conditions wasobserved. Here, presumably only sustained channels were used in thedetection of the gratings. This result corroborates those of the aboveinvestigators. In summary, the experiments cited above are in agree-ment regarding the range of spatial frequencies to which transient andsustained channels preferably respond. Moreover, the results indicatethat at low spatial frequencies transient channels are characterized by alower contrast threshold than sustained channels, results consistentwith the single-cell studies reviewed in section 5.2.1.
In another study, King-Smith et al. (1976) measured the contrastthreshold of a narrow (0.05� � 2.0�) vertical line as a function of theoscillation frequency with which it moved to and fro in a left-to-rightdirection over an amplitude of 0.05�. Relative to the contrast thresholdof a stabilized line, the contrast threshold was lowered at oscillationfrequencies of about 0.1–8 Hz but increased at higher frequencies.This range of oscillation frequencies corresponds to velocities rangingroughly from 0.01 to 0.8�/s. Since the target line was only 3� wide, forthe most part its fundamental and higher spatial frequency com-ponents were all above 10.0 c/deg. Consequently, on the basis of theabove studies, it should activate mainly sustained channels. Given this
PARVOCELLULAR/MAGNOCELLULAR PATHWAYS 149
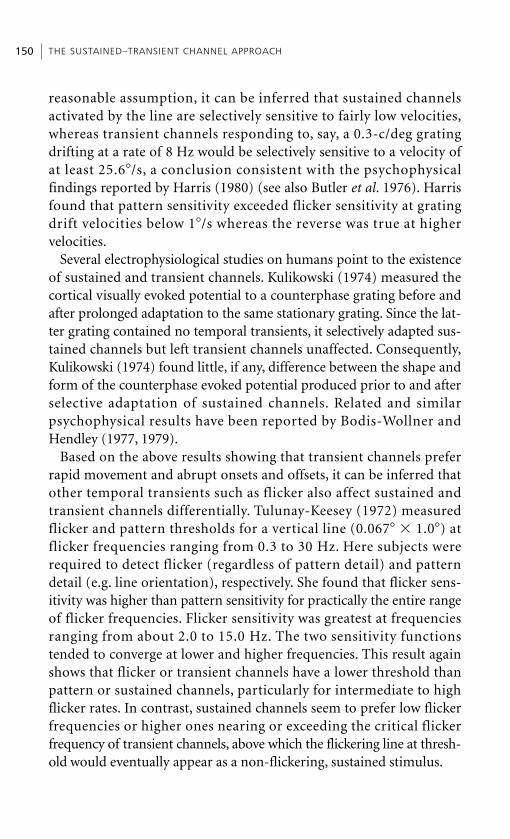
reasonable assumption, it can be inferred that sustained channelsactivated by the line are selectively sensitive to fairly low velocities,whereas transient channels responding to, say, a 0.3-c/deg gratingdrifting at a rate of 8 Hz would be selectively sensitive to a velocity ofat least 25.6�/s, a conclusion consistent with the psychophysicalfindings reported by Harris (1980) (see also Butler et al. 1976). Harrisfound that pattern sensitivity exceeded flicker sensitivity at gratingdrift velocities below 1�/s whereas the reverse was true at highervelocities.
Several electrophysiological studies on humans point to the existenceof sustained and transient channels. Kulikowski (1974) measured thecortical visually evoked potential to a counterphase grating before andafter prolonged adaptation to the same stationary grating. Since the lat-ter grating contained no temporal transients, it selectively adapted sus-tained channels but left transient channels unaffected. Consequently,Kulikowski (1974) found little, if any, difference between the shape andform of the counterphase evoked potential produced prior to and afterselective adaptation of sustained channels. Related and similarpsychophysical results have been reported by Bodis-Wollner andHendley (1977, 1979).
Based on the above results showing that transient channels preferrapid movement and abrupt onsets and offsets, it can be inferred thatother temporal transients such as flicker also affect sustained andtransient channels differentially. Tulunay-Keesey (1972) measuredflicker and pattern thresholds for a vertical line (0.067� � 1.0�) atflicker frequencies ranging from 0.3 to 30 Hz. Here subjects wererequired to detect flicker (regardless of pattern detail) and patterndetail (e.g. line orientation), respectively. She found that flicker sens-itivity was higher than pattern sensitivity for practically the entire rangeof flicker frequencies. Flicker sensitivity was greatest at frequenciesranging from about 2.0 to 15.0 Hz. The two sensitivity functionstended to converge at lower and higher frequencies. This result againshows that flicker or transient channels have a lower threshold thanpattern or sustained channels, particularly for intermediate to highflicker rates. In contrast, sustained channels seem to prefer low flickerfrequencies or higher ones nearing or exceeding the critical flickerfrequency of transient channels, above which the flickering line at thresh-old would eventually appear as a non-flickering, sustained stimulus.
THE SUSTAINED–TRANSIENT CHANNEL APPROACH 150
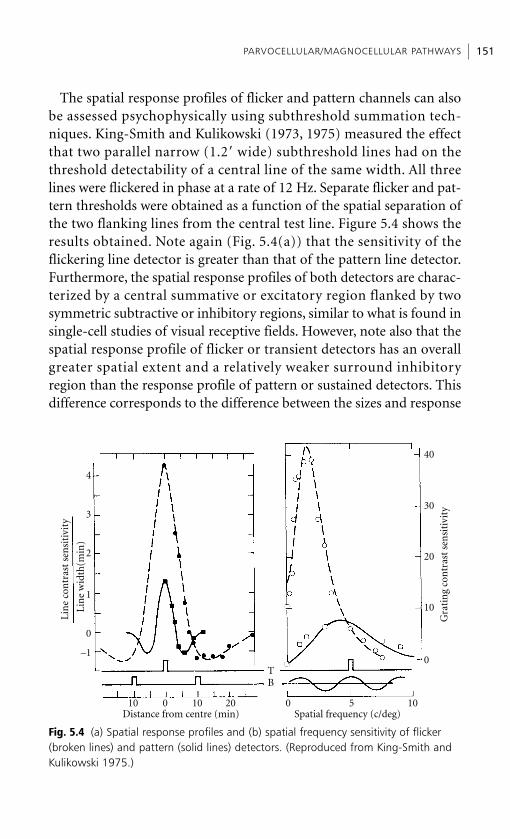
The spatial response profiles of flicker and pattern channels can alsobe assessed psychophysically using subthreshold summation tech-niques. King-Smith and Kulikowski (1973, 1975) measured the effectthat two parallel narrow (1.2� wide) subthreshold lines had on thethreshold detectability of a central line of the same width. All threelines were flickered in phase at a rate of 12 Hz. Separate flicker and pat-tern thresholds were obtained as a function of the spatial separation ofthe two flanking lines from the central test line. Figure 5.4 shows theresults obtained. Note again (Fig. 5.4(a)) that the sensitivity of theflickering line detector is greater than that of the pattern line detector.Furthermore, the spatial response profiles of both detectors are charac-terized by a central summative or excitatory region flanked by twosymmetric subtractive or inhibitory regions, similar to what is found insingle-cell studies of visual receptive fields. However, note also that thespatial response profile of flicker or transient detectors has an overallgreater spatial extent and a relatively weaker surround inhibitoryregion than the response profile of pattern or sustained detectors. Thisdifference corresponds to the difference between the sizes and response
PARVOCELLULAR/MAGNOCELLULAR PATHWAYS 151L
ine
con
tras
t se
nsi
tivi
ty
Lin
e w
idth
(min
)
4
3
2
1
0
–1
10 0 0 5 1010 20Distance from centre (min) Spatial frequency (c/deg)
TB
40
30
20
10
Gra
tin
g co
ntr
ast
sen
siti
vity
0
Fig. 5.4 (a) Spatial response profiles and (b) spatial frequency sensitivity of flicker(broken lines) and pattern (solid lines) detectors. (Reproduced from King-Smith andKulikowski 1975.)
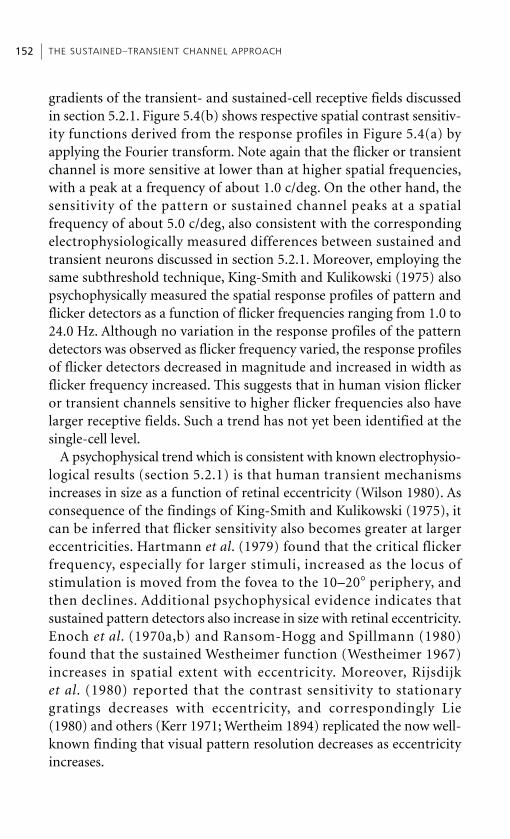
gradients of the transient- and sustained-cell receptive fields discussedin section 5.2.1. Figure 5.4(b) shows respective spatial contrast sensitiv-ity functions derived from the response profiles in Figure 5.4(a) byapplying the Fourier transform. Note again that the flicker or transientchannel is more sensitive at lower than at higher spatial frequencies,with a peak at a frequency of about 1.0 c/deg. On the other hand, thesensitivity of the pattern or sustained channel peaks at a spatialfrequency of about 5.0 c/deg, also consistent with the correspondingelectrophysiologically measured differences between sustained andtransient neurons discussed in section 5.2.1. Moreover, employing thesame subthreshold technique, King-Smith and Kulikowski (1975) alsopsychophysically measured the spatial response profiles of pattern andflicker detectors as a function of flicker frequencies ranging from 1.0 to24.0 Hz. Although no variation in the response profiles of the patterndetectors was observed as flicker frequency varied, the response profilesof flicker detectors decreased in magnitude and increased in width asflicker frequency increased. This suggests that in human vision flickeror transient channels sensitive to higher flicker frequencies also havelarger receptive fields. Such a trend has not yet been identified at thesingle-cell level.
A psychophysical trend which is consistent with known electrophysio-logical results (section 5.2.1) is that human transient mechanismsincreases in size as a function of retinal eccentricity (Wilson 1980). Asconsequence of the findings of King-Smith and Kulikowski (1975), itcan be inferred that flicker sensitivity also becomes greater at largereccentricities. Hartmann et al. (1979) found that the critical flickerfrequency, especially for larger stimuli, increased as the locus ofstimulation is moved from the fovea to the 10–20� periphery, andthen declines. Additional psychophysical evidence indicates thatsustained pattern detectors also increase in size with retinal eccentricity.Enoch et al. (1970a,b) and Ransom-Hogg and Spillmann (1980)found that the sustained Westheimer function (Westheimer 1967)increases in spatial extent with eccentricity. Moreover, Rijsdijk et al. (1980) reported that the contrast sensitivity to stationarygratings decreases with eccentricity, and correspondingly Lie(1980) and others (Kerr 1971; Wertheim 1894) replicated the now well-known finding that visual pattern resolution decreases as eccentricityincreases.
THE SUSTAINED–TRANSIENT CHANNEL APPROACH 152
Another psychophysical means of demonstrating the existence anddifferential properties of human sustained and transient channels is tomeasure spatial frequency contrast sensitivity as a function of gratingduration. Such contrast sensitivity functions have been reported bySchober and Hilz (1965), Nachmias (1967), and Legge (1978). In gen-eral, contrast sensitivity at all spatial frequencies increases up to a limit-ing value as duration increases. However, whereas a low-frequencyattenuation of sensitivity is present at longer durations, it is absent atshorter ones where only a high-frequency attenuation prevails. If wewere to measure changes in contrast threshold as a function of dura-tion for a range of spatial frequencies, we could obtain theduration–contrast reciprocity function, which specifies temporalintegration in spatial frequency channels according to Bloch’s law. Thisempirical law states that, at threshold, contrast and duration can betraded off reciprocally up to a critical duration. Breitmeyer and Ganz(1977) measured duration–contrast reciprocity functions for verticalsinusoidal gratings at spatial frequencies of 0.5, 2.8, and 15.0 c/deg.The results indicate that the critical duration for which duration–contrast reciprocity holds is determined by spatial frequency. Thecritical durations at frequencies of 0.5, 2.8. and 15.0 c/deg are 60 ms,150 ms, and 200 ms, respectively; above these values threshold contrastseems to level off or decrease at only a low rate (Legge 1978). Theseresults show that low spatial frequency transient channels are charac-terized by a shorter integration time than are higher spatial frequencysustained channels; this result was also reported by Legge (1978) and isconsistent with Hood’s (1973) finding that optically blurred stimuliyield a shorter integration time than sharply focused ones. Similarpsychophysical results derived from monkey have been reported byHarwerth et al. (1980). Since, as discussed in sections 5.2.1 and 5.2.2,monkeys have anatomically and physiologically distinct populations ofsustained and transient cells in their visual system, these and otheranalogies (see below) between human and monkey psychophysicalresults reinforce the interpretation of the human findings in terms ofthe sustained–transient channel approach.
Psychophysical evidence also indicates that human transient channelsare characterized by different impulse responses than those of sustainedchannels. Kelly (1971a) measured uniform field flicker sensitivityfunctions and, via the Fourier transform, derived the impulse response
PARVOCELLULAR/MAGNOCELLULAR PATHWAYS 153
corresponding to the flicker detector. He found that at high backgroundluminance the impulse response could be characterized by initialexcitatory phase followed by an inhibitory phase, which in turn wasfollowed by a smaller excitatory phase. The temporal interval i betweenthe primary and secondary excitatory phases of the damped oscillatingimpulse response defined the temporal frequency i�1 at which peak flicker sensitivity was attained. However, as background luminancewas decreased progressively, the duration of the impulse response and iincreased. Moreover, the inhibiting phases eventually attenuated until,at scotopic levels, only a monophasic excitatory component like thatcharacterizing the impulse response of pattern detectors was evident. Inother words, the transient flicker detectors become more sluggish or‘sustained’ as background luminance decreases, a result consistent withsingle-cell recordings (B.B. Lee et al. 1990, 1994; Purpura et al. 1990).
Rashbass (1970), used a subthreshold summation technique similar tothat employed by Ikeda (1965) to measure the interaction of two impulseresponses produced by two consecutively flashed subthreshold stimuli.He also found that the impulse response to transient changes ofluminance can be characterized by a triphasic excitatory–inhibitoryoscillation. Manahilov (1995) estimated the suprathreshold impulseresponse by using a brightness-matching technique and found a triphasictemporal profile. Similar oscillating functions have been empiricallyderived by Grossberg (1970) and Ueno (1977) using visual reaction timeto two sequentially and briefly flashed light stimuli. On the assumptionthat human transient channels are the primary flicker and transientdetectors, their impulse response ought to oscillate from excitation toinhibition as described above. Moreover, by employing the subthresholdtechnique, measures of the impulse responses of transient and sustainedchannels can be obtained by varying the spatial frequency of a gratingfrom low to high values. Breitmeyer and Ganz (1977) and Watson andNachmias (1977) used this technique and found distinct differencesbetween impulse responses at low and high spatial frequencies. Theresults of the latter study are shown in Figure 5.5. Note that at the lowestspatial frequency the interaction of the two subthreshold impulseresponses can be characterized as an initial summative or excitatoryphase followed by a weaker subtractive or inhibitory phase. As spatialfrequency increases, the inhibitory phase attenuates and the impulseresponse assumes a monophasic excitatory shape. A similar result
THE SUSTAINED–TRANSIENT CHANNEL APPROACH 154
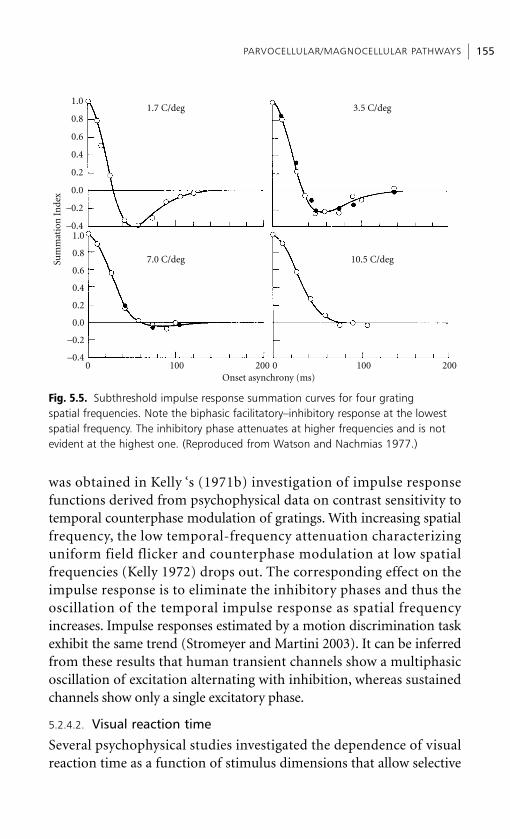
was obtained in Kelly ‘s (1971b) investigation of impulse responsefunctions derived from psychophysical data on contrast sensitivity totemporal counterphase modulation of gratings. With increasing spatialfrequency, the low temporal-frequency attenuation characterizinguniform field flicker and counterphase modulation at low spatialfrequencies (Kelly 1972) drops out. The corresponding effect on theimpulse response is to eliminate the inhibitory phases and thus theoscillation of the temporal impulse response as spatial frequencyincreases. Impulse responses estimated by a motion discrimination taskexhibit the same trend (Stromeyer and Martini 2003). It can be inferredfrom these results that human transient channels show a multiphasicoscillation of excitation alternating with inhibition, whereas sustainedchannels show only a single excitatory phase.
5.2.4.2. Visual reaction time
Several psychophysical studies investigated the dependence of visualreaction time as a function of stimulus dimensions that allow selective
PARVOCELLULAR/MAGNOCELLULAR PATHWAYS 155
0.8
0.6
0.4
0.2
0.0
–0.2
–0.41.0
0.8
0.6
0.4
0.2
0.0
–0.2
100 200 0 1000Onset asynchrony (ms)
200
1.0
–0.4
Sum
mat
ion
In
dex
1.7 C/deg
7.0 C/deg
3.5 C/deg
10.5 C/deg
Fig. 5.5. Subthreshold impulse response summation curves for four grating spatial frequencies. Note the biphasic facilitatory–inhibitory response at the lowestspatial frequency. The inhibitory phase attenuates at higher frequencies and is notevident at the highest one. (Reproduced from Watson and Nachmias 1977.)

activation of parvocellular vs. magnocellular systems and sustained vs.transient channels. Breitmeyer (1975) measured the visual reaction timeto the onset of a 50-ms presentation of sinusoidal gratings at a contrast ofabout 60 percent and at spatial frequencies ranging from 0.5 to 11.0 c/deg.He found that reaction times over this range increased monotonicallyfrom about 200 to 350 ms. Since contrast sensitivity declines at higherspatial frequencies, Breitmeyer (1975) also measured reaction times to thesame gratings but with their individual physical contrasts adjusted so thattheir apparent contrasts were equal. Despite this canceling out of differ-ences in contrast sensitivity, Breitmeyer (1975) found that the reactiontimes increased by about 40 ms over the same range of spatial frequenciesemployed. Similar and related psychophysical results have subsequentlybeen reported by several other investigators (Breitmeyer et al. 1981a; Leviet al. 1979; Lupp et al. 1976; Tartaglione et al. 1975; Vassilev and Mitov1976). These findings are indicative of a shorter response latency of lowspatial frequency, transient as compared with high spatial frequency, sus-tained channels. Moreover, similar increases in reaction times as a func-tion of spatial frequency can be obtained when a subject is asked torespond to the sudden offset or contrast reversal of a grating (Breitmeyeret al. 1981a; Long and Gildea 1981; Parker 1980).
A more telling set of experiments which indicated that sustained andtransient channels differ in response latency as a function of spatialfrequency has been reported by Lupp (1977) and Lupp et al. (1978).The latter investigators used the following technique to measure visualreaction times to the onset of a sinusoidal grating. A grating at a spatialfrequency of 1.0–16.0 c/deg and with a contrast 1.6 times above itsthreshold value was presented abruptly for 500 ms. The abrupt onset ofa 1000-ms grating of the same respective spatial frequency and at acontrast of 0.6 times (i.e. below) its threshold value occurred at temporalintervals ranging from 500 ms before the onset of the suprathresholdgrating to 250 ms after its onset. It was reasoned that the addition ofthe subthreshold grating would facilitate or increase the response rateof the respective spatial frequency channels and thus facilitate ordecrease reaction time. The changes in reaction time as a function ofonset asynchrony of the subthreshold gratings are shown for the 1.0,2.0, 5.3, and 16.0 c/deg gratings in Figure 5.6.
Note that at a spatial frequency of 1.0 c/deg, the subthreshold gratingfacilitates reaction time only transiently at asynchronies ranging
THE SUSTAINED–TRANSIENT CHANNEL APPROACH 156
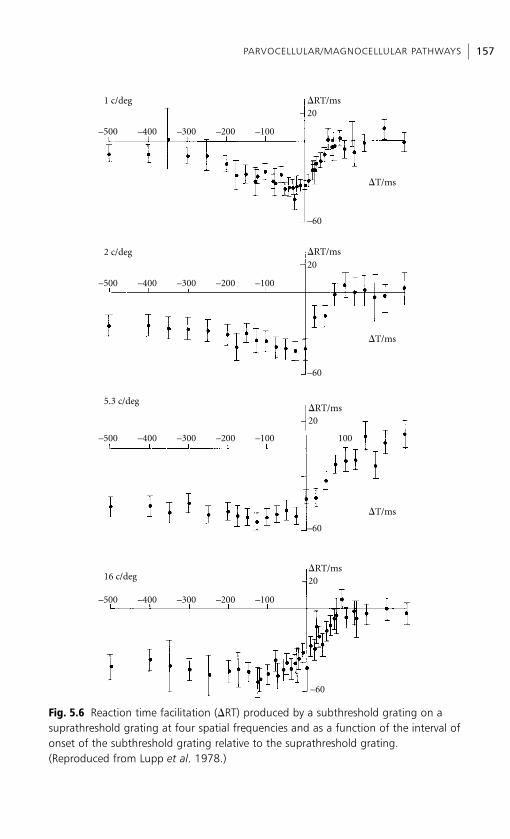
PARVOCELLULAR/MAGNOCELLULAR PATHWAYS 157
�RT/ms
�RT/ms
�RT/ms
�T/ms
�T/ms
�T/ms
–60
20
20
20
�RT/ms20
–60
–60
–60
–500 –400 –300 –200 –100
–500 –400 –300 –200 –100
–500 –400 –300 –200 –100
–500 –400 –300 –200 –100
100
1 c/deg
2 c/deg
5.3 c/deg
16 c/deg
Fig. 5.6 Reaction time facilitation (�RT) produced by a subthreshold grating on asuprathreshold grating at four spatial frequencies and as a function of the interval ofonset of the subthreshold grating relative to the suprathreshold grating.(Reproduced from Lupp et al. 1978.)
from �200 ms (subthreshold grating onset precedes suprathresholdgrating onset) to about 50 ms (subthreshold onset follows suprathresholdonset). The largest facilitation was obtained at an asynchrony of about�30 to �40 ms. On the other hand, with higher spatial frequencies,the facilitation became more sustained; in particular, with the 5.3 and16.0 c/deg gratings, reaction time facilitation was sustained over theentire 500 ms interval preceding the onset of the suprathresholdgrating and was eliminated at an asynchrony of about 100 ms. Thesepsychophysical results clearly demonstrate that the facilitation by lowspatial frequency gratings occurs within transient channels, whereasthe facilitation by high spatial frequency gratings occurs withinsustained channels, and that the summation or integration time oftransient channels, in line with the results reported by Breitmeyer andGanz (1977) and Legge (1978), is shorter than that of sustainedchannels (see section 5.2.4.1).
Harwerth and Levi (1978) investigated reaction times to vertical sinewave gratings as a function of spatial frequency and contrast, amongother variables. For 500-ms flashes of gratings, the reaction time at lowspatial frequencies (e.g. 0.5 c/deg) and high spatial frequencies (e.g.12 c/deg) generally decreased continuously and exponentially withincreases of contrasts that ranged from the respective threshold valuesto 45 percent. However, for intermediate spatial frequencies (1–8 c/deg)the decrease in reaction time with similar increases of contrast wascharacterized by a discontinuity revealing that one exponentiallydecaying function dominated up to a contrast value of about 5–10percent, followed by another function which dominated at highercontrast values. Analogous psychophysical findings have been reportedby Harwerth et al. (1980) in their study of monkey vision. The biphasicrelationship between reaction time and contrast has been replicatedand extended in subsequent studies (Felipe et al. 1993; Murray andPlainis 2003).
Schwartz (1992) studied the distributions of reaction times inresponse to stimuli selectively activating achromatic and chromaticsystems. Homochromatic pulses (white on white, 620 on 620 nm, or540 on 540 nm) of 1 and 1.5 s were used to activate the achromaticsystem. Heterochromatic pulses (680, 620, 440, and 400 nm on white)were used to activate the chromatic system. Reaction time distributionsfor the achromatic conditions peaked earlier and were narrower than
THE SUSTAINED–TRANSIENT CHANNEL APPROACH 158
PARVOCELLULAR/MAGNOCELLULAR PATHWAYS 159
those for the chromatic conditions. Moreover, reaction time distributionsfor the achromatic conditions were bimodal, reflecting stimulus on- and offset. On the other hand, the reaction time distributions forthe chromatic conditions were unimodal reflecting stimulus onset.Based on the temporal response properties and chromatic sensitivitiesof parvocellular and magnocellular systems reviewed in section 5.2.1,these results support selective contributions of parvocellular andmagnocellular systems to visual reaction time.
The above psychophysical reaction time results also have beencorroborated in several electrophysiological studies. Spehlmann (1965)demonstrated that the late-component waves of the human CVEPshifted to longer latencies as the size of the elements in a flashedcheckerboard pattern became smaller. Similarly, several investigators(Jones and Keck 1978; Kulikowski 1977; Parker and Salzen 1977a,b,1982; Vassilev and Strashimirov 1979) have investigated the latency ofthe CVEP to on- and offset of sinusoidal gratings varying in spatial fre-quency. Typical results showed that the latency of major positive-wavecomponents of the evoked potential (e.g. P1, P2) increased by about100 ms as spatial frequency increased from 0.5 to 10 c/deg or more.The relatively weaker N0–P0 components, which are particularly inter-esting because they are the earliest waves in the potential, can beevoked strongly only by low spatial frequency gratings (Jones and Keck1978; Kulikowski 1977), and therefore may reflect the earlier activity ofmore sparsely distributed transient channels.4 Correlates of the spatialfrequency selective and biphasic characteristic of reaction times as afunction of contrast have also been observed in CVEP waveforms(Baseler and Sutter 1997; Hartwell and Cowan 1993; Murray andKulikowski 1983; Rudvin et al. 2000).
The fact that physiological measures of visual latency correspondwell to psychophysical measures has been demonstrated for bothneuroelectric and neuromagnetic potentials. Hartwell and Cowan(1993) plotted reaction times as a function of CVEP response timesand found a linear relationship. This relationship was the same regardlessof contrast, spatial frequency, and the temporal profile of the stimulus.Instead of measuring the cortically evoked neuroelectric potential,Williamson et al. (1977, 1978) measured the latency of the humancortical neuromagnetic response to 66 percent contrast gratings as afunction of spatial frequency ranging from about 0.2 to 11.0 c/deg,
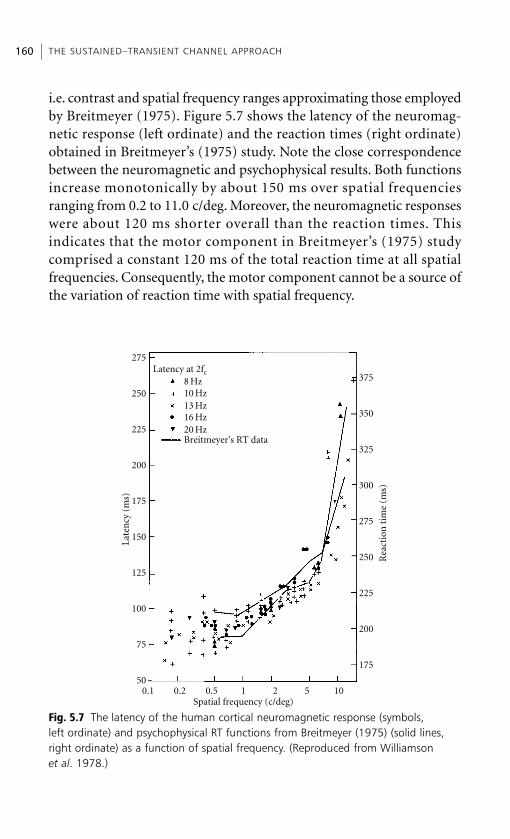
i.e. contrast and spatial frequency ranges approximating those employedby Breitmeyer (1975). Figure 5.7 shows the latency of the neuromag-netic response (left ordinate) and the reaction times (right ordinate)obtained in Breitmeyer’s (1975) study. Note the close correspondencebetween the neuromagnetic and psychophysical results. Both functionsincrease monotonically by about 150 ms over spatial frequenciesranging from 0.2 to 11.0 c/deg. Moreover, the neuromagnetic responseswere about 120 ms shorter overall than the reaction times. Thisindicates that the motor component in Breitmeyer’s (1975) studycomprised a constant 120 ms of the total reaction time at all spatialfrequencies. Consequently, the motor component cannot be a source ofthe variation of reaction time with spatial frequency.
THE SUSTAINED–TRANSIENT CHANNEL APPROACH 160
Latency at 2fc
250
225
200
175
150
125
100
75
0.2 0.5 1 2 50.1Spatial frequency (c/deg)
10
375
350
325
300
275
250
225
200
175
Breitmeyer's RT data
8 Hz10 Hz13 Hz16 Hz20 Hz
275
50
Late
ncy
(m
s)
Rea
ctio
n t
ime
(ms)
Fig. 5.7 The latency of the human cortical neuromagnetic response (symbols,left ordinate) and psychophysical RT functions from Breitmeyer (1975) (solid lines,right ordinate) as a function of spatial frequency. (Reproduced from Williamson et al. 1978.)
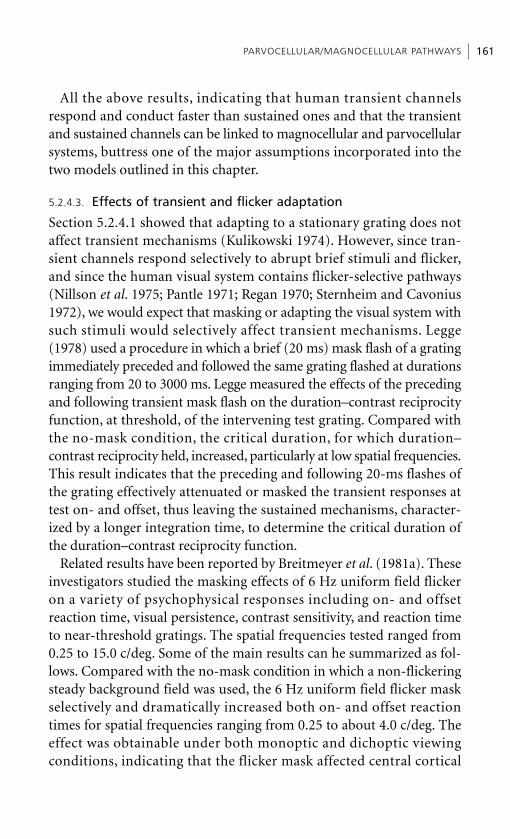
All the above results, indicating that human transient channelsrespond and conduct faster than sustained ones and that the transientand sustained channels can be linked to magnocellular and parvocellularsystems, buttress one of the major assumptions incorporated into thetwo models outlined in this chapter.
5.2.4.3. Effects of transient and flicker adaptation
Section 5.2.4.1 showed that adapting to a stationary grating does notaffect transient mechanisms (Kulikowski 1974). However, since tran-sient channels respond selectively to abrupt brief stimuli and flicker,and since the human visual system contains flicker-selective pathways(Nillson et al. 1975; Pantle 1971; Regan 1970; Sternheim and Cavonius1972), we would expect that masking or adapting the visual system withsuch stimuli would selectively affect transient mechanisms. Legge(1978) used a procedure in which a brief (20 ms) mask flash of a gratingimmediately preceded and followed the same grating flashed at durationsranging from 20 to 3000 ms. Legge measured the effects of the precedingand following transient mask flash on the duration–contrast reciprocityfunction, at threshold, of the intervening test grating. Compared withthe no-mask condition, the critical duration, for which duration–contrast reciprocity held, increased, particularly at low spatial frequencies.This result indicates that the preceding and following 20-ms flashes ofthe grating effectively attenuated or masked the transient responses attest on- and offset, thus leaving the sustained mechanisms, character-ized by a longer integration time, to determine the critical duration ofthe duration–contrast reciprocity function.
Related results have been reported by Breitmeyer et al. (1981a). Theseinvestigators studied the masking effects of 6 Hz uniform field flickeron a variety of psychophysical responses including on- and offsetreaction time, visual persistence, contrast sensitivity, and reaction timeto near-threshold gratings. The spatial frequencies tested ranged from0.25 to 15.0 c/deg. Some of the main results can he summarized as fol-lows. Compared with the no-mask condition in which a non-flickeringsteady background field was used, the 6 Hz uniform field flicker maskselectively and dramatically increased both on- and offset reactiontimes for spatial frequencies ranging from 0.25 to about 4.0 c/deg. Theeffect was obtainable under both monoptic and dichoptic viewingconditions, indicating that the flicker mask affected central cortical
PARVOCELLULAR/MAGNOCELLULAR PATHWAYS 161
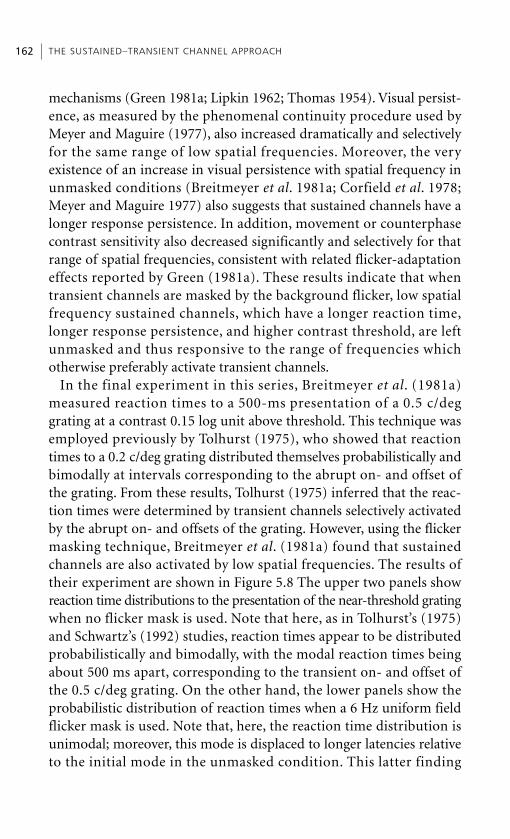
mechanisms (Green 1981a; Lipkin 1962; Thomas 1954). Visual persist-ence, as measured by the phenomenal continuity procedure used byMeyer and Maguire (1977), also increased dramatically and selectivelyfor the same range of low spatial frequencies. Moreover, the veryexistence of an increase in visual persistence with spatial frequency inunmasked conditions (Breitmeyer et al. 1981a; Corfield et al. 1978;Meyer and Maguire 1977) also suggests that sustained channels have alonger response persistence. In addition, movement or counterphasecontrast sensitivity also decreased significantly and selectively for thatrange of spatial frequencies, consistent with related flicker-adaptationeffects reported by Green (1981a). These results indicate that whentransient channels are masked by the background flicker, low spatialfrequency sustained channels, which have a longer reaction time,longer response persistence, and higher contrast threshold, are leftunmasked and thus responsive to the range of frequencies whichotherwise preferably activate transient channels.
In the final experiment in this series, Breitmeyer et al. (1981a)measured reaction times to a 500-ms presentation of a 0.5 c/deggrating at a contrast 0.15 log unit above threshold. This technique wasemployed previously by Tolhurst (1975), who showed that reactiontimes to a 0.2 c/deg grating distributed themselves probabilistically andbimodally at intervals corresponding to the abrupt on- and offset ofthe grating. From these results, Tolhurst (1975) inferred that the reac-tion times were determined by transient channels selectively activatedby the abrupt on- and offsets of the grating. However, using the flickermasking technique, Breitmeyer et al. (1981a) found that sustainedchannels are also activated by low spatial frequencies. The results oftheir experiment are shown in Figure 5.8 The upper two panels showreaction time distributions to the presentation of the near-threshold gratingwhen no flicker mask is used. Note that here, as in Tolhurst’s (1975)and Schwartz’s (1992) studies, reaction times appear to be distributedprobabilistically and bimodally, with the modal reaction times beingabout 500 ms apart, corresponding to the transient on- and offset ofthe 0.5 c/deg grating. On the other hand, the lower panels show theprobabilistic distribution of reaction times when a 6 Hz uniform fieldflicker mask is used. Note that, here, the reaction time distribution isunimodal; moreover, this mode is displaced to longer latencies relativeto the initial mode in the unmasked condition. This latter finding
THE SUSTAINED–TRANSIENT CHANNEL APPROACH 162
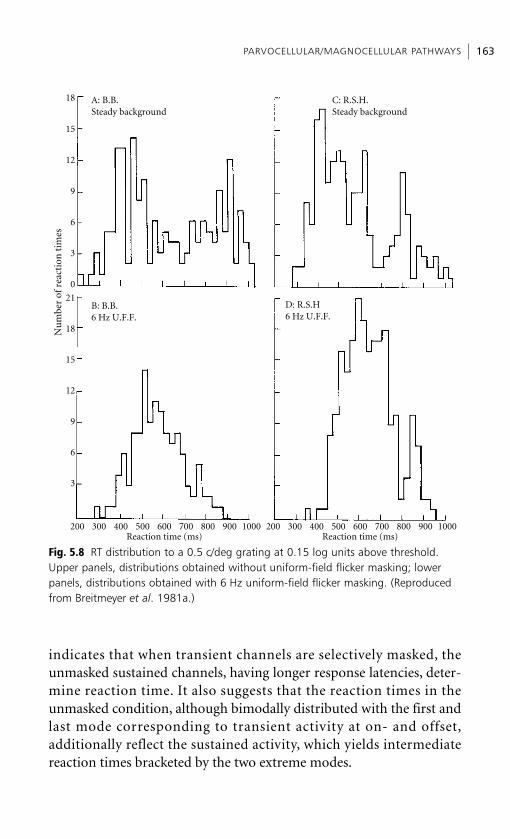
indicates that when transient channels are selectively masked, theunmasked sustained channels, having longer response latencies, deter-mine reaction time. It also suggests that the reaction times in theunmasked condition, although bimodally distributed with the first andlast mode corresponding to transient activity at on- and offset,additionally reflect the sustained activity, which yields intermediatereaction times bracketed by the two extreme modes.
PARVOCELLULAR/MAGNOCELLULAR PATHWAYS 163
A: B.B.Steady background
B: B.B.6 Hz U.F.F.
D: R.S.H6 Hz U.F.F.
C: R.S.H.Steady background
18
15
12
9
6
3
0
21
18
15
12
9
6
3
300 400 500 700600 800 900 300 400 500 700600 800 900200Reaction time (ms)
1000Reaction time (ms)
200 1000
Nu
mbe
r of
rea
ctio
n t
imes
Fig. 5.8 RT distribution to a 0.5 c/deg grating at 0.15 log units above threshold.Upper panels, distributions obtained without uniform-field flicker masking; lowerpanels, distributions obtained with 6 Hz uniform-field flicker masking. (Reproducedfrom Breitmeyer et al. 1981a.)
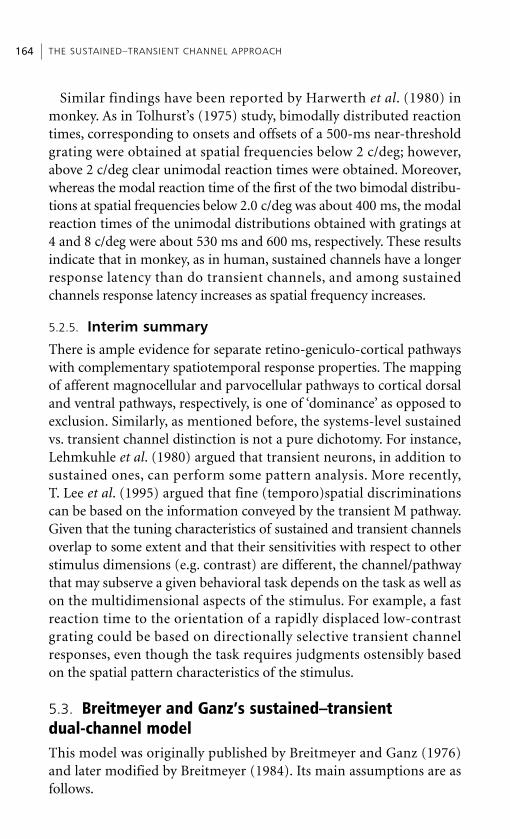
Similar findings have been reported by Harwerth et al. (1980) inmonkey. As in Tolhurst’s (1975) study, bimodally distributed reactiontimes, corresponding to onsets and offsets of a 500-ms near-thresholdgrating were obtained at spatial frequencies below 2 c/deg; however,above 2 c/deg clear unimodal reaction times were obtained. Moreover,whereas the modal reaction time of the first of the two bimodal distribu-tions at spatial frequencies below 2.0 c/deg was about 400 ms, the modalreaction times of the unimodal distributions obtained with gratings at4 and 8 c/deg were about 530 ms and 600 ms, respectively. These resultsindicate that in monkey, as in human, sustained channels have a longerresponse latency than do transient channels, and among sustainedchannels response latency increases as spatial frequency increases.
5.2.5. Interim summary
There is ample evidence for separate retino-geniculo-cortical pathwayswith complementary spatiotemporal response properties. The mappingof afferent magnocellular and parvocellular pathways to cortical dorsaland ventral pathways, respectively, is one of ‘dominance’ as opposed toexclusion. Similarly, as mentioned before, the systems-level sustainedvs. transient channel distinction is not a pure dichotomy. For instance,Lehmkuhle et al. (1980) argued that transient neurons, in addition tosustained ones, can perform some pattern analysis. More recently,T. Lee et al. (1995) argued that fine (temporo)spatial discriminationscan be based on the information conveyed by the transient M pathway.Given that the tuning characteristics of sustained and transient channelsoverlap to some extent and that their sensitivities with respect to otherstimulus dimensions (e.g. contrast) are different, the channel/pathwaythat may subserve a given behavioral task depends on the task as well ason the multidimensional aspects of the stimulus. For example, a fastreaction time to the orientation of a rapidly displaced low-contrastgrating could be based on directionally selective transient channelresponses, even though the task requires judgments ostensibly basedon the spatial pattern characteristics of the stimulus.
5.3. Breitmeyer and Ganz’s sustained–transient dual-channel modelThis model was originally published by Breitmeyer and Ganz (1976)and later modified by Breitmeyer (1984). Its main assumptions are asfollows.
THE SUSTAINED–TRANSIENT CHANNEL APPROACH 164
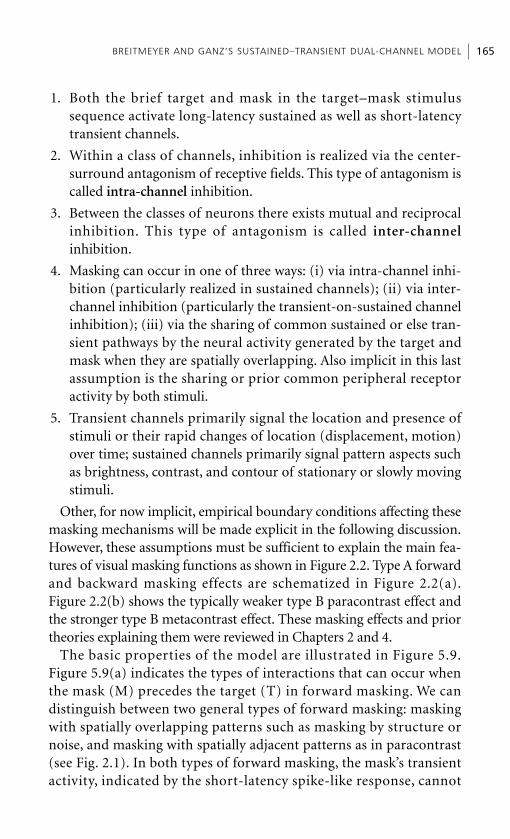
1. Both the brief target and mask in the target–mask stimulussequence activate long-latency sustained as well as short-latencytransient channels.
2. Within a class of channels, inhibition is realized via the center-surround antagonism of receptive fields. This type of antagonism iscalled intra-channel inhibition.
3. Between the classes of neurons there exists mutual and reciprocalinhibition. This type of antagonism is called inter-channelinhibition.
4. Masking can occur in one of three ways: (i) via intra-channel inhi-bition (particularly realized in sustained channels); (ii) via inter-channel inhibition (particularly the transient-on-sustained channelinhibition); (iii) via the sharing of common sustained or else tran-sient pathways by the neural activity generated by the target andmask when they are spatially overlapping. Also implicit in this lastassumption is the sharing or prior common peripheral receptoractivity by both stimuli.
5. Transient channels primarily signal the location and presence ofstimuli or their rapid changes of location (displacement, motion)over time; sustained channels primarily signal pattern aspects suchas brightness, contrast, and contour of stationary or slowly movingstimuli.
Other, for now implicit, empirical boundary conditions affecting thesemasking mechanisms will be made explicit in the following discussion.However, these assumptions must be sufficient to explain the main fea-tures of visual masking functions as shown in Figure 2.2. Type A forwardand backward masking effects are schematized in Figure 2.2(a).Figure 2.2(b) shows the typically weaker type B paracontrast effect andthe stronger type B metacontrast effect. These masking effects and priortheories explaining them were reviewed in Chapters 2 and 4.
The basic properties of the model are illustrated in Figure 5.9.Figure 5.9(a) indicates the types of interactions that can occur whenthe mask (M) precedes the target (T) in forward masking. We candistinguish between two general types of forward masking: maskingwith spatially overlapping patterns such as masking by structure ornoise, and masking with spatially adjacent patterns as in paracontrast(see Fig. 2.1). In both types of forward masking, the mask’s transientactivity, indicated by the short-latency spike-like response, cannot
BREITMEYER AND GANZ’S SUSTAINED–TRANSIENT DUAL-CHANNEL MODEL 165
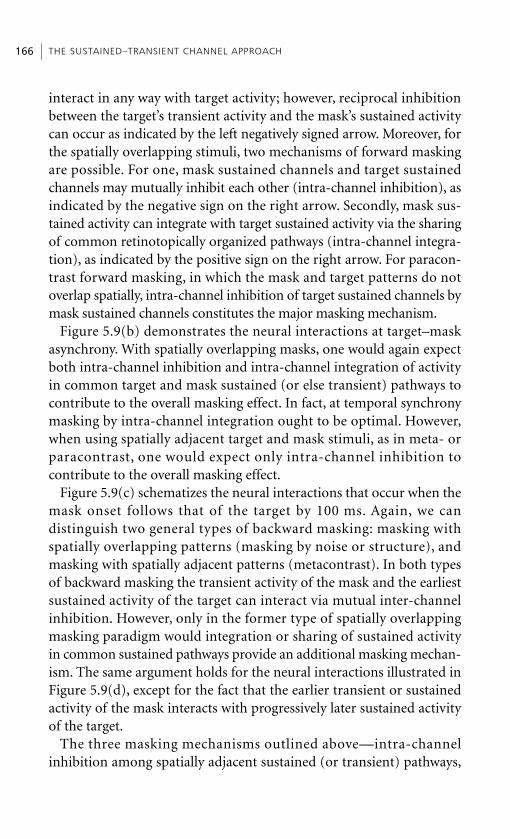
interact in any way with target activity; however, reciprocal inhibitionbetween the target’s transient activity and the mask’s sustained activitycan occur as indicated by the left negatively signed arrow. Moreover, forthe spatially overlapping stimuli, two mechanisms of forward maskingare possible. For one, mask sustained channels and target sustainedchannels may mutually inhibit each other (intra-channel inhibition), asindicated by the negative sign on the right arrow. Secondly, mask sus-tained activity can integrate with target sustained activity via the sharingof common retinotopically organized pathways (intra-channel integra-tion), as indicated by the positive sign on the right arrow. For paracon-trast forward masking, in which the mask and target patterns do notoverlap spatially, intra-channel inhibition of target sustained channels bymask sustained channels constitutes the major masking mechanism.
Figure 5.9(b) demonstrates the neural interactions at target–maskasynchrony. With spatially overlapping masks, one would again expectboth intra-channel inhibition and intra-channel integration of activityin common target and mask sustained (or else transient) pathways tocontribute to the overall masking effect. In fact, at temporal synchronymasking by intra-channel integration ought to be optimal. However,when using spatially adjacent target and mask stimuli, as in meta- orparacontrast, one would expect only intra-channel inhibition tocontribute to the overall masking effect.
Figure 5.9(c) schematizes the neural interactions that occur when themask onset follows that of the target by 100 ms. Again, we candistinguish two general types of backward masking: masking withspatially overlapping patterns (masking by noise or structure), andmasking with spatially adjacent patterns (metacontrast). In both typesof backward masking the transient activity of the mask and the earliestsustained activity of the target can interact via mutual inter-channelinhibition. However, only in the former type of spatially overlappingmasking paradigm would integration or sharing of sustained activityin common sustained pathways provide an additional masking mechan-ism. The same argument holds for the neural interactions illustrated inFigure 5.9(d), except for the fact that the earlier transient or sustainedactivity of the mask interacts with progressively later sustained activityof the target.
The three masking mechanisms outlined above—intra-channelinhibition among spatially adjacent sustained (or transient) pathways,
THE SUSTAINED–TRANSIENT CHANNEL APPROACH 166

inter-channel inhibition between transient and sustained pathways,and integration or sharing of common activity within sustained (ortransient) pathways—are intended to account, respectively, for themain features of the masking phenomena shown in Figure 2.2: type Bforward masking or paracontrast, type B backward masking ormetacontrast, and type A forward and backward masking. It should bementioned that although the designations ‘mask’ and ‘target’ serve avalid methodological distinction, physiologically, in terms of the pos-sible interactions outlined above, that distinction is lost. Consequently,as will become apparent in several cases below, we must considermutual interactions between the physiological activities generatedseparately by the target and the mask stimuli, regardless of the tempo-ral order of their presentation.
BREITMEYER AND GANZ’S SUSTAINED–TRANSIENT DUAL-CHANNEL MODEL 167
T
T T
T(a)
(c)
(b)
(b)
M
M M
M
Su
–
––
±
±
±
–100 0 100 200 300 400 0 100 200 300 400
Fig. 5.9 The hypothetical time course of transient and sustained channels activatedby the target (T) and the mask (M) at various target–mask asynchronies: (a) maskonset precedes target onset; (b) target and mask onsets are synchronous; (c), (d)mask onset follows target onset at increasing temporal asynchronies. The transientresponse is represented by the short-latency spike-like function; the sustainedresponses at increasing spatial frequencies are indicated by the symbol Su in (a). Theinhibitory and excitatory interactions within and between the two types of channelsare indicated by two-way arrows signed negatively and positively, respectively.(Reproduced from Breitmeyer and Ganz 1976.)
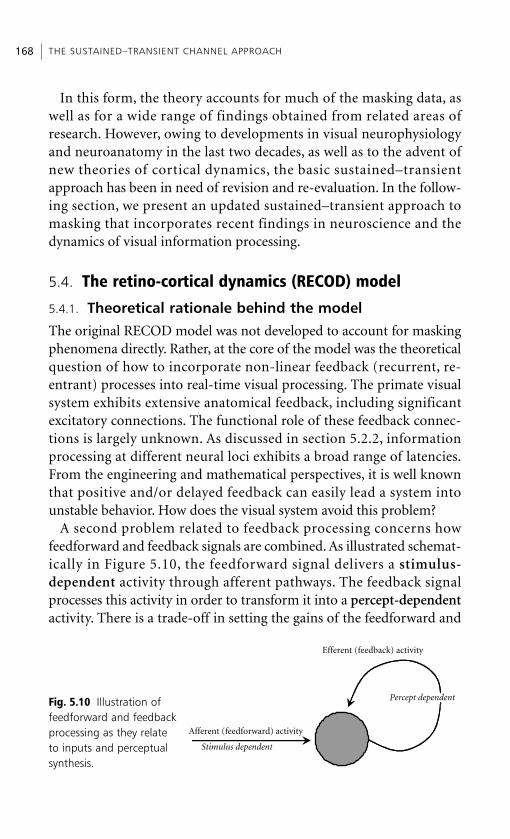
In this form, the theory accounts for much of the masking data, aswell as for a wide range of findings obtained from related areas ofresearch. However, owing to developments in visual neurophysiologyand neuroanatomy in the last two decades, as well as to the advent ofnew theories of cortical dynamics, the basic sustained–transientapproach has been in need of revision and re-evaluation. In the follow-ing section, we present an updated sustained–transient approach tomasking that incorporates recent findings in neuroscience and thedynamics of visual information processing.
5.4. The retino-cortical dynamics (RECOD) model
5.4.1. Theoretical rationale behind the model
The original RECOD model was not developed to account for maskingphenomena directly. Rather, at the core of the model was the theoreticalquestion of how to incorporate non-linear feedback (recurrent, re-entrant) processes into real-time visual processing. The primate visualsystem exhibits extensive anatomical feedback, including significantexcitatory connections. The functional role of these feedback connec-tions is largely unknown. As discussed in section 5.2.2, informationprocessing at different neural loci exhibits a broad range of latencies.From the engineering and mathematical perspectives, it is well knownthat positive and/or delayed feedback can easily lead a system intounstable behavior. How does the visual system avoid this problem?
A second problem related to feedback processing concerns howfeedforward and feedback signals are combined. As illustrated schemat-ically in Figure 5.10, the feedforward signal delivers a stimulus-dependent activity through afferent pathways. The feedback signalprocesses this activity in order to transform it into a percept-dependentactivity. There is a trade-off in setting the gains of the feedforward and
THE SUSTAINED–TRANSIENT CHANNEL APPROACH 168
Stimulus dependent
Afferent (feedforward) activity
Efferent (feedback) activity
Percept dependentFig. 5.10 Illustration offeedforward and feedbackprocessing as they relateto inputs and perceptualsynthesis.
feedback signals. First, assume that the gain of the feedforward signal ismuch higher than the gain of the feedback signal. The stimulus-dependent feedforward activity will energize feedback loops; however,because the feedforward signal has a high gain, it will remain dominantand will interfere with the generation and establishment of percept-dependent activities. This will lead to a failure to attain a perceptualsynthesis. If the gain of the feedback signal is much stronger than thegain of the feedforward signal, perceptual synthesis can occur.However, the percept will be very insensitive to changes in the input:Assume for example that the shape of the stimulus changes from asquare to a triangle. Because afferent signals are relatively weak,the synthesis corresponding to the square will persist in the positivefeedback loops and the percept will be either the continuation of theprevious object (square) or a highly blurred version of the two objects(a combination of a square and a triangle). We call this problem thetrade-off between stimulus read-out and perceptual synthesis in afeedback system.5
5.4.2. A solution: temporal multiplexing of conflictingtendencies
Ögmen (1993) proposed a theory that offers a solution to this trade-offby multiplexing in time the conflicting tendencies, i.e. the need forstrong feedforward signals for a reliable read-out of the input and forenergizing the feedback loops vs. the need for a strong feedback signalto establish activities that underlie perceptual synthesis. According tothis theory, the real-time dynamics of visual processes unfolds in threephases.
1. A feedforward-dominant phase where strong afferent signals travelto higher cortical areas allowing the read-out of the input andenergizing the feedback loops.
2. A feedback-dominant phase during which the afferent signaldecays to a lower plateau value and the feedback, or re-entrant, sig-nals establish perceptual synthesis.
3. A reset phase that is initiated when inputs change. During the resetphase the feedback signals receive a fast transient inhibition so as toallow the dominance of the afferent signals (feedforward-dominantmode) which deliver the new input. By limiting the real-time
THE RETINO-CORTICAL DYNAMICS MODEL 169
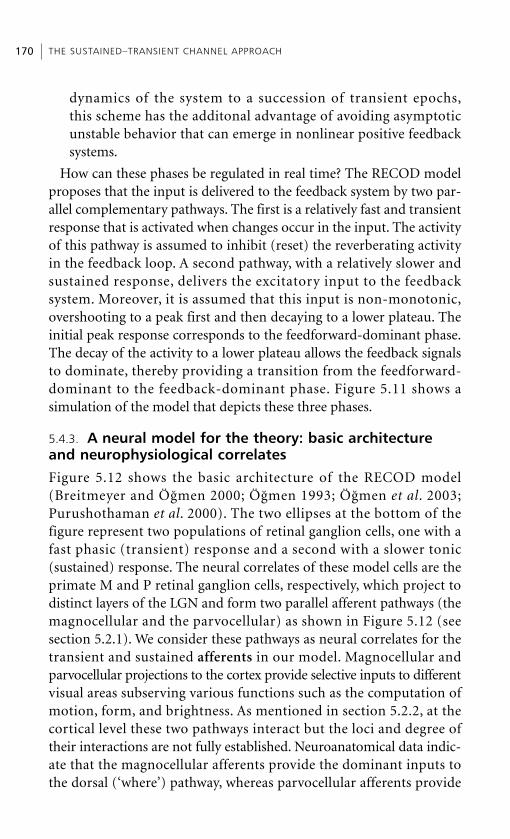
dynamics of the system to a succession of transient epochs,this scheme has the additonal advantage of avoiding asymptoticunstable behavior that can emerge in nonlinear positive feedbacksystems.
How can these phases be regulated in real time? The RECOD modelproposes that the input is delivered to the feedback system by two par-allel complementary pathways. The first is a relatively fast and transientresponse that is activated when changes occur in the input. The activityof this pathway is assumed to inhibit (reset) the reverberating activityin the feedback loop. A second pathway, with a relatively slower andsustained response, delivers the excitatory input to the feedbacksystem. Moreover, it is assumed that this input is non-monotonic,overshooting to a peak first and then decaying to a lower plateau. Theinitial peak response corresponds to the feedforward-dominant phase.The decay of the activity to a lower plateau allows the feedback signalsto dominate, thereby providing a transition from the feedforward-dominant to the feedback-dominant phase. Figure 5.11 shows asimulation of the model that depicts these three phases.
5.4.3. A neural model for the theory: basic architectureand neurophysiological correlates
Figure 5.12 shows the basic architecture of the RECOD model(Breitmeyer and Ögmen 2000; Ögmen 1993; Ögmen et al. 2003;Purushothaman et al. 2000). The two ellipses at the bottom of thefigure represent two populations of retinal ganglion cells, one with afast phasic (transient) response and a second with a slower tonic(sustained) response. The neural correlates of these model cells are theprimate M and P retinal ganglion cells, respectively, which project todistinct layers of the LGN and form two parallel afferent pathways (themagnocellular and the parvocellular) as shown in Figure 5.12 (seesection 5.2.1). We consider these pathways as neural correlates for thetransient and sustained afferents in our model. Magnocellular andparvocellular projections to the cortex provide selective inputs to differentvisual areas subserving various functions such as the computation ofmotion, form, and brightness. As mentioned in section 5.2.2, at thecortical level these two pathways interact but the loci and degree oftheir interactions are not fully established. Neuroanatomical data indic-ate that the magnocellular afferents provide the dominant inputs tothe dorsal (‘where’) pathway, whereas parvocellular afferents provide
THE SUSTAINED–TRANSIENT CHANNEL APPROACH 170
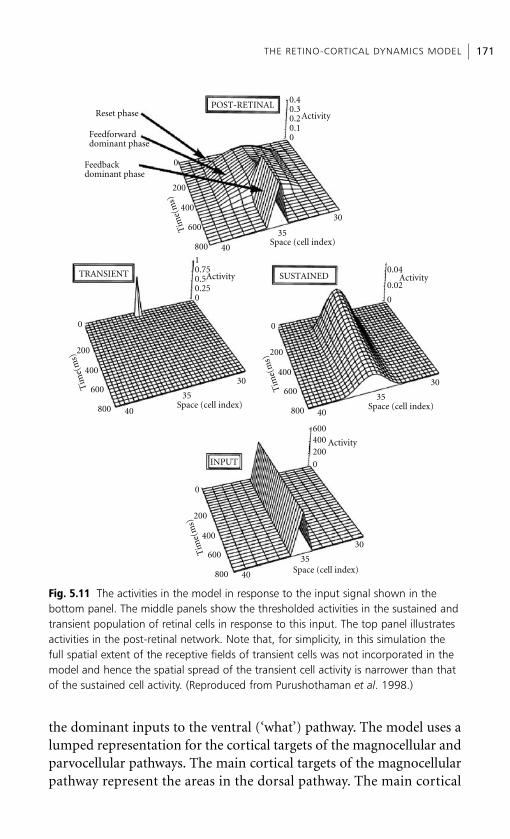
the dominant inputs to the ventral (‘what’) pathway. The model uses alumped representation for the cortical targets of the magnocellular andparvocellular pathways. The main cortical targets of the magnocellularpathway represent the areas in the dorsal pathway. The main cortical
THE RETINO-CORTICAL DYNAMICS MODEL 171
POST-RETINALReset phase
Feedforwarddominant phase
Feedbackdominant phase
Space (cell index)
Space (cell index)
Space (cell index)
Space (cell index)
30
35
40
0
200
400
600
800
Tim
e(m
s)
Activity
0.40.30.20.10
Activity
10.750.50.25
Activity0.04
0.02
0
3030
4040
35
30
40
35
35
0
Activity
0
200
400
600
800
Tim
e(m
s)
0
200
400
600
800
Tim
e(m
s)
0
200
400
600
800
Tim
e(m
s)
600400200
0
TRANSIENT SUSTAINED
INPUT
Fig. 5.11 The activities in the model in response to the input signal shown in the bottom panel. The middle panels show the thresholded activities in the sustained andtransient population of retinal cells in response to this input. The top panel illustratesactivities in the post-retinal network. Note that, for simplicity, in this simulation thefull spatial extent of the receptive fields of transient cells was not incorporated in themodel and hence the spatial spread of the transient cell activity is narrower than thatof the sustained cell activity. (Reproduced from Purushothaman et al. 1998.)
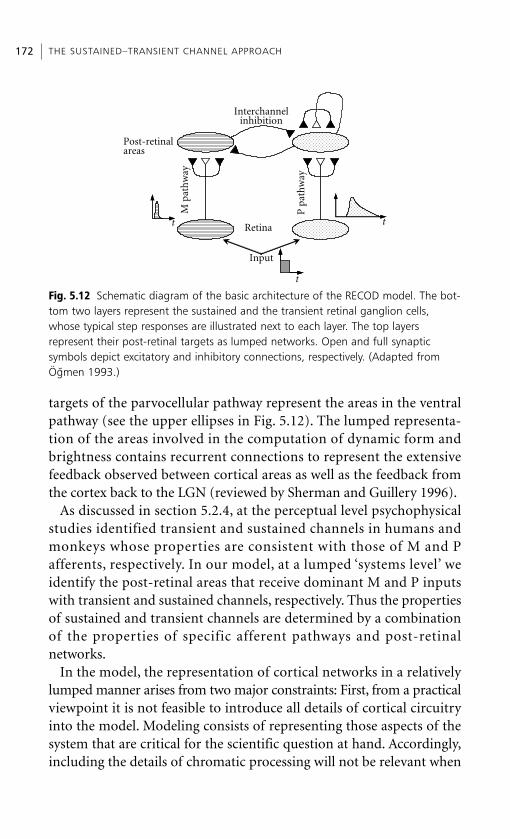
targets of the parvocellular pathway represent the areas in the ventralpathway (see the upper ellipses in Fig. 5.12). The lumped representa-tion of the areas involved in the computation of dynamic form andbrightness contains recurrent connections to represent the extensivefeedback observed between cortical areas as well as the feedback fromthe cortex back to the LGN (reviewed by Sherman and Guillery 1996).
As discussed in section 5.2.4, at the perceptual level psychophysicalstudies identified transient and sustained channels in humans andmonkeys whose properties are consistent with those of M and Pafferents, respectively. In our model, at a lumped ‘systems level’ weidentify the post-retinal areas that receive dominant M and P inputswith transient and sustained channels, respectively. Thus the propertiesof sustained and transient channels are determined by a combinationof the properties of specific afferent pathways and post-retinal networks.
In the model, the representation of cortical networks in a relativelylumped manner arises from two major constraints: First, from a practicalviewpoint it is not feasible to introduce all details of cortical circuitryinto the model. Modeling consists of representing those aspects of thesystem that are critical for the scientific question at hand. Accordingly,including the details of chromatic processing will not be relevant when
THE SUSTAINED–TRANSIENT CHANNEL APPROACH 172
Post-retinalareas
t
t
tRetina
P p
ath
way
M p
ath
way
Input
Interchannelinhibition
Fig. 5.12 Schematic diagram of the basic architecture of the RECOD model. The bot-tom two layers represent the sustained and the transient retinal ganglion cells,whose typical step responses are illustrated next to each layer. The top layers represent their post-retinal targets as lumped networks. Open and full synaptic symbols depict excitatory and inhibitory connections, respectively. (Adapted fromÖgmen 1993.)
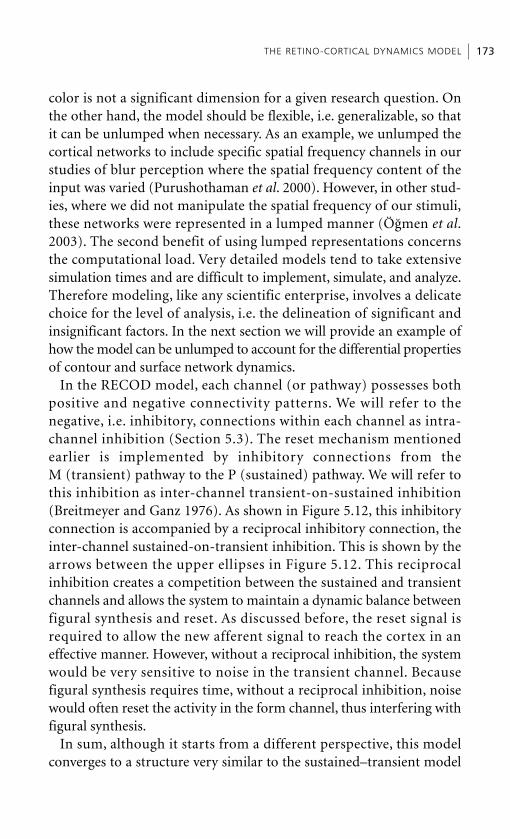
color is not a significant dimension for a given research question. Onthe other hand, the model should be flexible, i.e. generalizable, so thatit can be unlumped when necessary. As an example, we unlumped thecortical networks to include specific spatial frequency channels in ourstudies of blur perception where the spatial frequency content of theinput was varied (Purushothaman et al. 2000). However, in other stud-ies, where we did not manipulate the spatial frequency of our stimuli,these networks were represented in a lumped manner (Ögmen et al.2003). The second benefit of using lumped representations concernsthe computational load. Very detailed models tend to take extensivesimulation times and are difficult to implement, simulate, and analyze.Therefore modeling, like any scientific enterprise, involves a delicatechoice for the level of analysis, i.e. the delineation of significant andinsignificant factors. In the next section we will provide an example ofhow the model can be unlumped to account for the differential propertiesof contour and surface network dynamics.
In the RECOD model, each channel (or pathway) possesses bothpositive and negative connectivity patterns. We will refer to thenegative, i.e. inhibitory, connections within each channel as intra-channel inhibition (Section 5.3). The reset mechanism mentionedearlier is implemented by inhibitory connections from theM (transient) pathway to the P (sustained) pathway. We will refer tothis inhibition as inter-channel transient-on-sustained inhibition(Breitmeyer and Ganz 1976). As shown in Figure 5.12, this inhibitoryconnection is accompanied by a reciprocal inhibitory connection, theinter-channel sustained-on-transient inhibition. This is shown by thearrows between the upper ellipses in Figure 5.12. This reciprocalinhibition creates a competition between the sustained and transientchannels and allows the system to maintain a dynamic balance betweenfigural synthesis and reset. As discussed before, the reset signal isrequired to allow the new afferent signal to reach the cortex in aneffective manner. However, without a reciprocal inhibition, the systemwould be very sensitive to noise in the transient channel. Becausefigural synthesis requires time, without a reciprocal inhibition, noisewould often reset the activity in the form channel, thus interfering withfigural synthesis.
In sum, although it starts from a different perspective, this modelconverges to a structure very similar to the sustained–transient model
THE RETINO-CORTICAL DYNAMICS MODEL 173
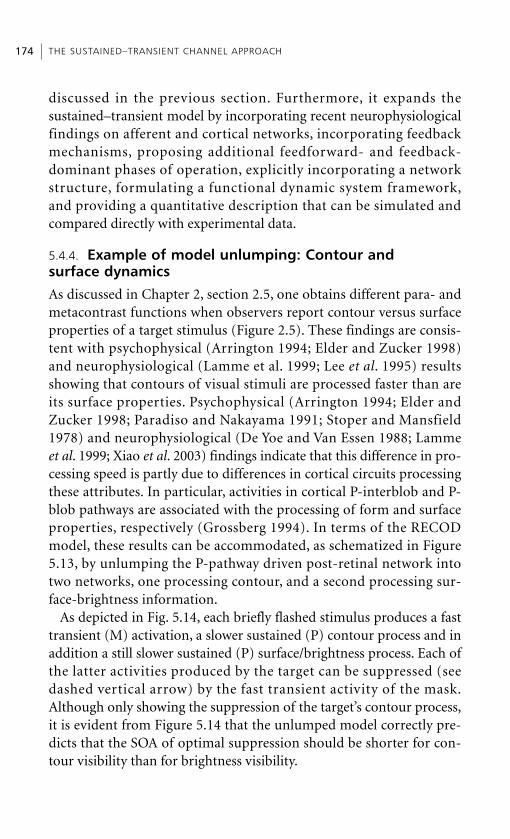
discussed in the previous section. Furthermore, it expands thesustained–transient model by incorporating recent neurophysiologicalfindings on afferent and cortical networks, incorporating feedbackmechanisms, proposing additional feedforward- and feedback-dominant phases of operation, explicitly incorporating a networkstructure, formulating a functional dynamic system framework,and providing a quantitative description that can be simulated andcompared directly with experimental data.
5.4.4. Example of model unlumping: Contour and surface dynamics
As discussed in Chapter 2, section 2.5, one obtains different para- andmetacontrast functions when observers report contour versus surfaceproperties of a target stimulus (Figure 2.5). These findings are consis-tent with psychophysical (Arrington 1994; Elder and Zucker 1998)and neurophysiological (Lamme et al. 1999; Lee et al. 1995) resultsshowing that contours of visual stimuli are processed faster than areits surface properties. Psychophysical (Arrington 1994; Elder andZucker 1998; Paradiso and Nakayama 1991; Stoper and Mansfield1978) and neurophysiological (De Yoe and Van Essen 1988; Lammeet al. 1999; Xiao et al. 2003) findings indicate that this difference in pro-cessing speed is partly due to differences in cortical circuits processingthese attributes. In particular, activities in cortical P-interblob and P-blob pathways are associated with the processing of form and surfaceproperties, respectively (Grossberg 1994). In terms of the RECODmodel, these results can be accommodated, as schematized in Figure5.13, by unlumping the P-pathway driven post-retinal network intotwo networks, one processing contour, and a second processing sur-face-brightness information.
As depicted in Fig. 5.14, each briefly flashed stimulus produces a fasttransient (M) activation, a slower sustained (P) contour process and inaddition a still slower sustained (P) surface/brightness process. Each ofthe latter activities produced by the target can be suppressed (seedashed vertical arrow) by the fast transient activity of the mask.Although only showing the suppression of the target’s contour process,it is evident from Figure 5.14 that the unlumped model correctly pre-dicts that the SOA of optimal suppression should be shorter for con-tour visibility than for brightness visibility.
THE SUSTAINED–TRANSIENT CHANNEL APPROACH 174
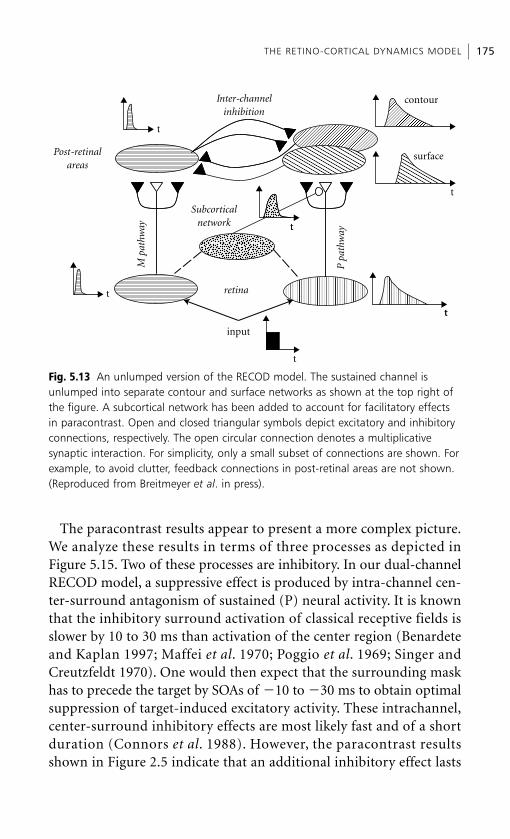
The paracontrast results appear to present a more complex picture.We analyze these results in terms of three processes as depicted inFigure 5.15. Two of these processes are inhibitory. In our dual-channelRECOD model, a suppressive effect is produced by intra-channel cen-ter-surround antagonism of sustained (P) neural activity. It is knownthat the inhibitory surround activation of classical receptive fields isslower by 10 to 30 ms than activation of the center region (Benardeteand Kaplan 1997; Maffei et al. 1970; Poggio et al. 1969; Singer andCreutzfeldt 1970). One would then expect that the surrounding maskhas to precede the target by SOAs of �10 to �30 ms to obtain optimalsuppression of target-induced excitatory activity. These intrachannel,center-surround inhibitory effects are most likely fast and of a shortduration (Connors et al. 1988). However, the paracontrast resultsshown in Figure 2.5 indicate that an additional inhibitory effect lasts
THE RETINO-CORTICAL DYNAMICS MODEL 175
input
t
Post-retinal areas
retina
M p
athw
ay
P p
athw
ay
t
Subcortical network
t
t
t
t
Inter-channel inhibition
t
contour
surface
t
Fig. 5.13 An unlumped version of the RECOD model. The sustained channel isunlumped into separate contour and surface networks as shown at the top right ofthe figure. A subcortical network has been added to account for facilitatory effectsin paracontrast. Open and closed triangular symbols depict excitatory and inhibitoryconnections, respectively. The open circular connection denotes a multiplicativesynaptic interaction. For simplicity, only a small subset of connections are shown. Forexample, to avoid clutter, feedback connections in post-retinal areas are not shown.(Reproduced from Breitmeyer et al. in press).
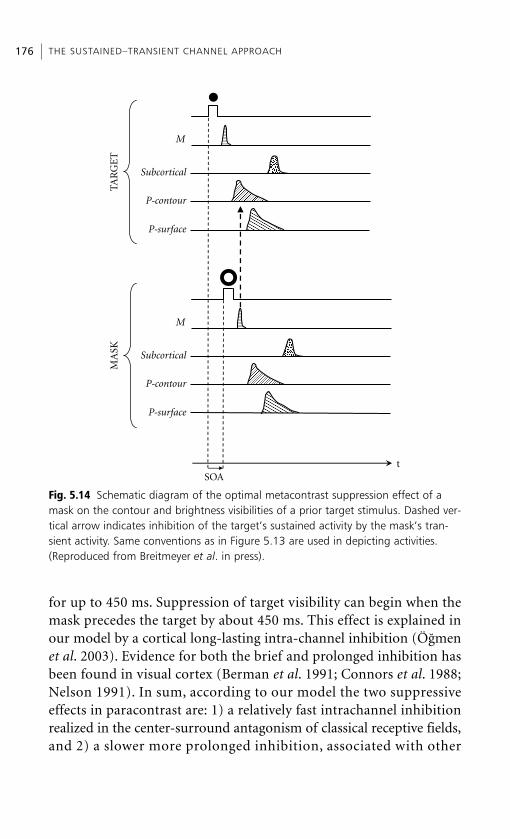
for up to 450 ms. Suppression of target visibility can begin when themask precedes the target by about 450 ms. This effect is explained inour model by a cortical long-lasting intra-channel inhibition (Ögmenet al. 2003). Evidence for both the brief and prolonged inhibition hasbeen found in visual cortex (Berman et al. 1991; Connors et al. 1988;Nelson 1991). In sum, according to our model the two suppressiveeffects in paracontrast are: 1) a relatively fast intrachannel inhibitionrealized in the center-surround antagonism of classical receptive fields,and 2) a slower more prolonged inhibition, associated with other
THE SUSTAINED–TRANSIENT CHANNEL APPROACH 176
t
P-contour
M
Subcortical
P-surface
P-contour
M
Subcortical
P-surface
TAR
GE
TM
ASK
SOA
Fig. 5.14 Schematic diagram of the optimal metacontrast suppression effect of amask on the contour and brightness visibilities of a prior target stimulus. Dashed ver-tical arrow indicates inhibition of the target’s sustained activity by the mask’s tran-sient activity. Same conventions as in Figure 5.13 are used in depicting activities.(Reproduced from Breitmeyer et al. in press).
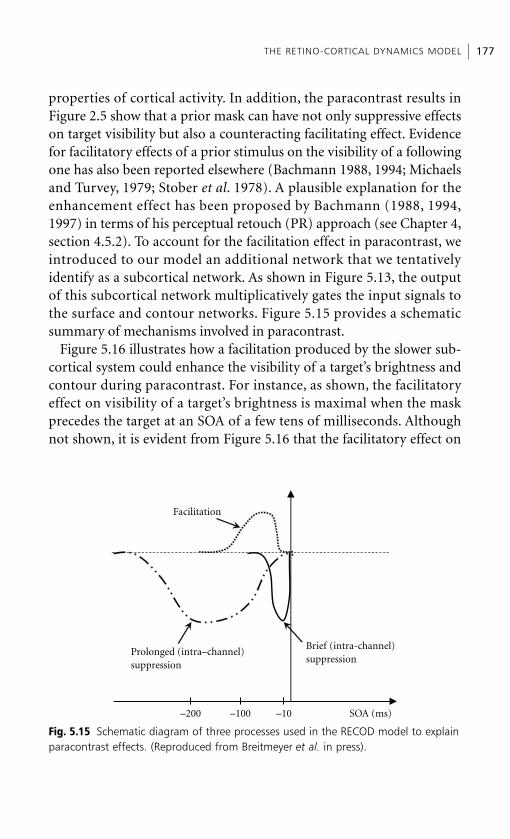
properties of cortical activity. In addition, the paracontrast results inFigure 2.5 show that a prior mask can have not only suppressive effectson target visibility but also a counteracting facilitating effect. Evidencefor facilitatory effects of a prior stimulus on the visibility of a followingone has also been reported elsewhere (Bachmann 1988, 1994; Michaelsand Turvey, 1979; Stober et al. 1978). A plausible explanation for theenhancement effect has been proposed by Bachmann (1988, 1994,1997) in terms of his perceptual retouch (PR) approach (see Chapter 4,section 4.5.2). To account for the facilitation effect in paracontrast, weintroduced to our model an additional network that we tentativelyidentify as a subcortical network. As shown in Figure 5.13, the outputof this subcortical network multiplicatively gates the input signals tothe surface and contour networks. Figure 5.15 provides a schematicsummary of mechanisms involved in paracontrast.
Figure 5.16 illustrates how a facilitation produced by the slower sub-cortical system could enhance the visibility of a target’s brightness andcontour during paracontrast. For instance, as shown, the facilitatoryeffect on visibility of a target’s brightness is maximal when the maskprecedes the target at an SOA of a few tens of milliseconds. Althoughnot shown, it is evident from Figure 5.16 that the facilitatory effect on
THE RETINO-CORTICAL DYNAMICS MODEL 177
Brief (intra-channel) suppression
Prolonged (intra–channel) suppression
Facilitation
SOA (ms)–200 –100 –10
Fig. 5.15 Schematic diagram of three processes used in the RECOD model to explainparacontrast effects. (Reproduced from Breitmeyer et al. in press).

visibility of a target’s contour is maximal when the mask precedes thetarget by a slightly larger SOA.
5.4.5. Mathematical basis of the model
The computational structure of the model is constructed by specifying,according to neurophysiological, neuroanatomical, and functionalconstraints, some canonical equations that describe basic aspects ofneuronal dynamics. We review these equations below and discuss theirgeneral properties that contribute to masking effects. The first type of
THE SUSTAINED–TRANSIENT CHANNEL APPROACH 178
t
P-contour
M
Subcortical
P-surface
P-contour
M
Subcortical
P-surface
TAR
GE
TM
ASK
SOA
Fig. 5.16 Schematic diagram of the optimal paracontrast enhancement effect of amask on the contour and brightness visibilities of a following target stimulus.Dashed vertical arrow indicates facilitation of the target’s sustained activity by themask generated sub-cortical activity. Same conventions as in Figure 5.13 are used indepicting activities. (Reproduced from Breitmeyer et al. in press).
equation used in the model has the form of a generic Hodgkin–Huxleyequation
(5.1)
where Vm is the membrane potential, gp, gd, and gh are the conductancesfor passive, depolarizing, and hyperpolarizing channels, respectively,and Ep, Ed, and Eh are their Nernst potentials. This equation has beenused extensively in neural modeling to characterize the dynamics ofmembrane patches, single cells, and networks of cells (reviewed byGrossberg 1988; Koch and Segev 1989). For simplicity, we will assumethat Ep � 0 and use the symbols B, D, and A for Ed, Eh, and gp, respect-ively, to obtain the generic form of the ‘multiplicative’ or ‘shunting’equation (Grossberg 1988):
(5.2)
The depolarizing and hyperpolarizing conductances are used to repres-ent the excitatory and inhibitory inputs, respectively.
The second type of equation is a simplified version of equation (5.1),called the ‘additive’ or ‘leaky-integrator’ model, where the externalinputs influence the activity of the cell not through conductancechanges but directly as depolarizing and hyperpolarizing currents,yielding the form:
(5.3)
Mathematical analyses showed that, with appropriate connectivitypatterns, shunting networks can automatically adjust their dynamicrange to process small and large inputs (Grossberg 1988). Accordingly,we use shunting equations when we have interactions among a largenumber of neurons so that a given neuron can maintain its sensitivityto a small subset of its inputs without becoming saturated when a largenumber of inputs become active. We use the simplified additive equa-tions when the interactions involve few neurons.
With non-linearities, these equations can generate extremely richand complex behavior. In terms of masking, many of these complexproperties can be understood as variants of three fundamental waysmasking effects can be obtained: masking by inhibition, by normaliza-tion, and by integration. An input to the inhibitory term (activated by
dVm/dt � � AVm � excitatory inputs � inhibitory inputs.
dVm/dt � � AVm � (B � Vm)gd � (D � Vm)gh.
dVm/dt � � (Ep � Vm)gp � (Ed � Vm)gd � (Eh � Vm)gh
THE RETINO-CORTICAL DYNAMICS MODEL 179
the mask) will reduce the response generated by the excitatory term(activated by the target). This inhibition can be additive or multiplic-ative. Multiplicative inhibition can lead to activity normalization(Grossberg 1988; Ögmen 1993) which can be viewed as another formof masking. If more than one input is applied to the excitatory term,their effects will be integrated and thus their responses will be fused bytemporal integration. These equations are leaky integrators because ofthe presence of the decay term (the first term on the right-hand side),and thus integration effects have a time span determined by the timeconstant of this term. A difference between shunting and additivenetworks is that the additive network has a single fixed time constantwhile the shunting network has a variable input-dependent timeconstant (Grossberg 1988; Ögmen 1993).
Finally, a third type of equation is used to express biochemicalreactions of the form
S � Z →� Y →� X →� S � Z
where a biochemical agent S, activated by the input, interacts with a trans-ducing agent Z (e.g. a neurotransmitter) to produce an ‘active complex’ Ywhich carries the signal to the next processing stage. This active complexdecays to an inactive state X, which in turn dissociates back into S and Z.It can be shown (Sarikaya et al. 1998, Appendix) that when the active stateX decays very fast, the dynamics of this system can be written as
(5.4)
with the output given by
(5.5)
where s, z, and y represent the concentrations of S, Z, and Y, respectivelyand �, �, and � denote rates of complex formation, decay to inactivestate, and dissociation, respectively. This equation has been used in avariety of neural models, in particular to represent temporal adapta-tion, or the gain control property, occurring for example throughsynaptic depression (Abbott et al. 1997; Carpenter and Grossberg 1981;Gaudiano 1992; Grossberg 1972; Ögmen 1993; Ögmen and Gagné1990). This equation contributes to masking through gain control. As
y(t) �y
�z(t)s(t)
dzdt
� �( � z) � �sz
THE SUSTAINED–TRANSIENT CHANNEL APPROACH 180
can be seen from equation (5.5), the input s(t) is transmitted to thenext stage via the ‘gain’ (�/�)z(t). It can be mathematically shown thatwhen an additional input (mask) is applied, z(t) decays to a lowervalue, thereby reducing the gain of the signal transmission. As a result,the effective signal transmitted by the target becomes smaller, leadingto its masked state.
As discussed before, the level of lumping and unlumping in themodel depends on the specific phenomena under analysis. To illustratesome key properties of the model, we provide below details of a versionthat was used in a recent study (Ögmen et al. 2003). The retinal networkis designed to capture the basic spatiotemporal properties of the retinaloutput without necessarily incorporating all details of the retinalcircuitry. To the extent possible, parameters of the model reflect thephysiologically measured parameters of the primate retina.
Retinal cells with sustained activities (parvocellular pathway)
The activities of sustained retinal cells are described in three functionalstages.
Stage I. Temporal adaptation (gain control)We use equation (5.4) to achieve temporal adaptation (gain control):
(5.6)
where zi represents the concentration of a transducing agent at the ithspatial location, J is a baseline input generating a dark current and Ii isthe external input (luminance value) at the ith spatial position. Thistemporal adaptation, or gain control, stage causes the neural activity todecay to a plateau level after an initial peak response to a sustainedinput, as observed in sustained retinal ganglion cell responses. Theparameter � adjusts the time constant of the decaying response. Thisequation can account for some of the effects of masking by light. Whena large uniform field is superimposed on a target stimulus, the inputgenerated by this light mask will reduce the gain of cells transmittingthe response of the target and thus make it a less effective stimulus.
Stage 2. Spatial center–surround organizationSignals from the first stage are convolved by the kernels Gk
se and Gksi
which represent the excitatory-center and the inhibitory-surround of
1�
dzi
dt� �( � zi) � �(J � Ii)zi
THE RETINO-CORTICAL DYNAMICS MODEL 181

the receptive field. The kernels are Gaussian functions of the formGk
se � Ampseexp(k2/sdsen2), and the parameters Ampse and sdse were
selected according to the receptor spacing at the fovea (Coletta andWilliams 1987; Dacey 1993) and the physiologically measured recept-ive field characteristics at the corresponding region of the primateretina (Croner and Kaplan 1995). For simplicity, only the on-centeroff-surround-cells were considered. The membrane potential wi of theith sustained cell is described by
(5.7)
where the center and surround convolution sums provide the excitatoryand inhibitory inputs to a shunting equation (compare equations (5.2) and(5.7)). The input signal is processed by a second-order polynomial�(.) whose coefficients were determined by fitting the contrast responseof the model neurons to the physiological data from Kaplan and Shapley(1986) (see Purushothaman et al. 2000, Appendix A.1 and Fig. 6).
As discussed before, this equation provides several mechanismswhereby masking can be obtained: masking by integration, masking byinhibition, and masking by gain control. All these mechanisms arewithin the sustained system and are of the intra-channel type. Receptivefield kernels provide limits on the lateral extent of these effects and canexplain the dependence of masking magnitude on target–mask spatialseparation. Furthermore, by introducing an additional delay to theinhibitory term to represent the center–surround delay of the receptivefields (Benardete and Kaplan 1997), we obtain peak masking at anegative SOA in the vicinity of the center–surround delay.
Stage 3. Quadratic non-linearity with threshold and persistenceThe ‘membrane potential’ of the ith cell is transformed into an outputsignal (e.g. spike frequency) through a quadratic non-linearity withthreshold �([wi � �s]
�)2, where [a]� denotes the threshold or half-wave rectification function (i.e. [a]� � a if a � 0, and [a]� � 0otherwise). Parameters � and �s represent the gain and the thresholdlevel of this function, respectively. The thresholded signal provides theinput to the additive equation
� (Ds � wi) �i�ns
j�i�ns
G sij�1�(Js � Ij)zj
1�
dwi
dt� � Aswi � (Bs � wi) �
i�ns
j�i�ns
G sej�1�(Js � Ij)zj
THE SUSTAINED–TRANSIENT CHANNEL APPROACH 182
(5.8)
where the parameter � determines the overall temporal persistence ofthe signal in the parvocellular pathway. For simplicity, the main persist-ence terms have been lumped into a single equation. A more detailedversion can incorporate additional stages using equations similar toequation (5.7) to represent the details of masking obtained in LGN forexample.
Retinal cells with transient activities (magnocellular pathway)
The equation for retinal cells with transient activities is similar to thatfor sustained activities except that it is tailored to produce transientresponses and its Gaussian kernel parameters reflect physiologicallymeasured receptive field characteristics of the transient cells in theprimate retina (Croner and Kaplan 1995).
Post-retinal cells mainly driven by the parvocellular pathway (post-retinal sustained cells)
The activity pi of the ith cell is given by the shunting equation
d�i
dt� �( � �i � �([wi � �s]
�)2)
THE RETINO-CORTICAL DYNAMICS MODEL 183
1�
dpi
dt� � Appi � (Bp � pi)[�(pi) � 2�i(t � �)]
� pi[ �i�npf
j�i�npf; j1�(pj) � �
i�np
j�i�np
Hpij�i�j(t � � � �p)
(5.9)� �i�np
j�i�np
Qmpj�imj]
where the excitation consists of the afferent parvocellular signal and afeedback signal. The inhibitory signal consists of feedback, feedforwardand inter-channel terms. Excitatory and inhibitory recurrent (feedback,re-entrant) signals are carried out through the non-linear function�(a) � 10a[(a � 1)2 � 1] if a � 0.05, and �(a) � a(a � 0.975)otherwise. The inhibitory kernels Hk
pi and Qkmp determine the spatial
spread of intra-channel and inter-channel inhibition, respectively. Theparameter � represents the relative delay between the parvocellularand magnocellular signals, and the parameter �p reflects the relativedelay of the inter-channel inhibitory signal with respect to the excitatorysignal.
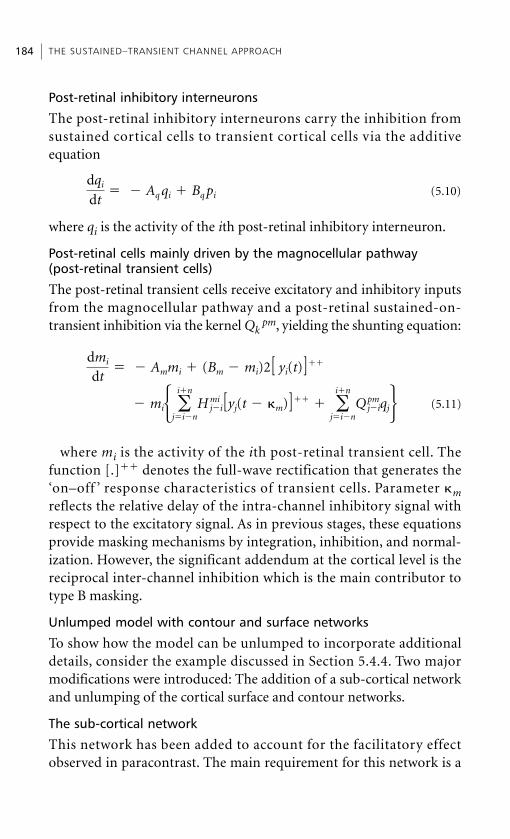
Post-retinal inhibitory interneurons
The post-retinal inhibitory interneurons carry the inhibition fromsustained cortical cells to transient cortical cells via the additiveequation
(5.10)
where qi is the activity of the ith post-retinal inhibitory interneuron.
Post-retinal cells mainly driven by the magnocellular pathway (post-retinal transient cells)
The post-retinal transient cells receive excitatory and inhibitory inputsfrom the magnocellular pathway and a post-retinal sustained-on-transient inhibition via the kernel Qk
pm, yielding the shunting equation:
dqi
dt� � Aq qi � Bq pi
THE SUSTAINED–TRANSIENT CHANNEL APPROACH 184
dmi
dt� � Ammi � (Bm � mi)2[ yi(t)]��
(5.11)� mi� �i�n
j�i�nH mi
j�i[yj(t � �m)]�� � �i�n
j�i�nQpm
j�iqj�where mi is the activity of the ith post-retinal transient cell. The
function [.]�� denotes the full-wave rectification that generates the‘on–off ’ response characteristics of transient cells. Parameter �mreflects the relative delay of the intra-channel inhibitory signal withrespect to the excitatory signal. As in previous stages, these equationsprovide masking mechanisms by integration, inhibition, and normal-ization. However, the significant addendum at the cortical level is thereciprocal inter-channel inhibition which is the main contributor totype B masking.
Unlumped model with contour and surface networks
To show how the model can be unlumped to incorporate additionaldetails, consider the example discussed in Section 5.4.4. Two majormodifications were introduced: The addition of a sub-cortical networkand unlumping of the cortical surface and contour networks.
The sub-cortical network
This network has been added to account for the facilitatory effectobserved in paracontrast. The main requirement for this network is a
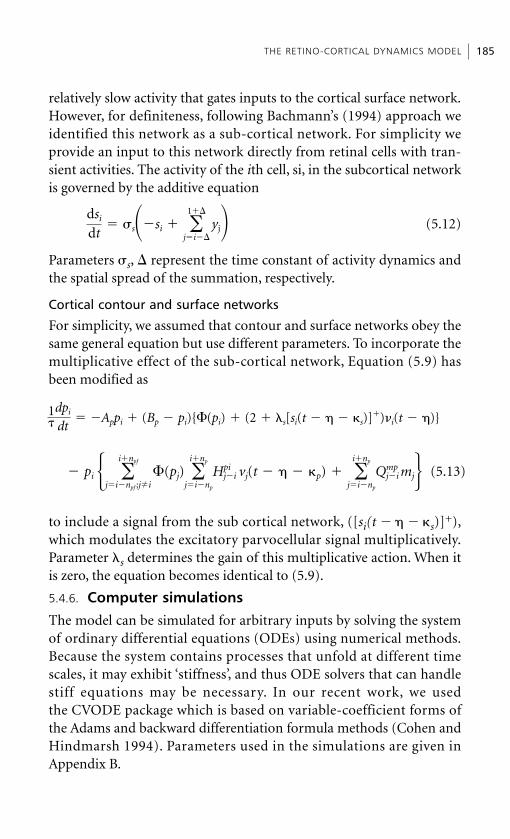
relatively slow activity that gates inputs to the cortical surface network.However, for definiteness, following Bachmann’s (1994) approach weidentified this network as a sub-cortical network. For simplicity weprovide an input to this network directly from retinal cells with tran-sient activities. The activity of the ith cell, si, in the subcortical networkis governed by the additive equation
(5.12)
Parameters �s, � represent the time constant of activity dynamics andthe spatial spread of the summation, respectively.
Cortical contour and surface networks
For simplicity, we assumed that contour and surface networks obey thesame general equation but use different parameters. To incorporate themultiplicative effect of the sub-cortical network, Equation (5.9) hasbeen modified as
dsi
dt� �s��si � �
1��
j�i��
yj�
THE RETINO-CORTICAL DYNAMICS MODEL 185
(5.13)� pi � �i�npf
j�i�npf ;ji�(pj) �
i�np
j�i�np
Hpij�i vj(t � � � �p) � �
i�np
j�i�np
Qmpj�i mj�
1�
dpi
dt� �Appi � (Bp � pi){�(pi) � (2 � �s[si(t � � � �s)]�)�i(t � �)}
to include a signal from the sub cortical network, ([si(t � � � �s)]+),which modulates the excitatory parvocellular signal multiplicatively.Parameter �s determines the gain of this multiplicative action. When itis zero, the equation becomes identical to (5.9).
5.4.6. Computer simulations
The model can be simulated for arbitrary inputs by solving the systemof ordinary differential equations (ODEs) using numerical methods.Because the system contains processes that unfold at different timescales, it may exhibit ‘stiffness’, and thus ODE solvers that can handlestiff equations may be necessary. In our recent work, we usedthe CVODE package which is based on variable-coefficient forms ofthe Adams and backward differentiation formula methods (Cohen andHindmarsh 1994). Parameters used in the simulations are given inAppendix B.
5.5. Explanatory scope of the dual-channel RECOD modelBecause the original sustained–transient model and the more recentRECOD model share common mechanisms critical to masking, mostof the material in this section applies to both models. The extensiveexplanatory scope of these models is developed in the context of theempirical data reviewed in Chapters 1 and 2 and some additionalresults introduced in this chapter. Clearly, it is not possible to reviewand discuss all masking effects and findings published in the literature.The intent is to expose the reader to the scope of these models bydiscussing a representative set of findings. We will also compare theexplanatory power of our model with that of previous models reviewedin Chapter 4. Furthermore, several shortcomings of the models willalso be discussed, and suggestions will be offered for their futuredevelopments and improvements.
(1) In Chapter 1, section 1.3.1, we noted that Sherrington (1897)and subsequently Piéron (1935) reported a facilitatory effect on thecritical flicker frequency (cff ) of the first of two spatially adjacentstimuli flashed in recycled sequence relative to an inhibitory effecton cff of the second of the two stimuli. As noted, the latter effect isconsistent with a form of paracontrast suppression; however, theformer result is not consistent with a form of metacontrast suppres-sion, but rather with its opposite metacontrast facilitation. UnlikeSherrington (1897), Piéron (1935) investigated the effect of suchrepetitively cycled sequential and spatially adjacent stimuli not onlyon cff but also on brightness perception. With the brightness criterion,a metacontrast suppression was obtained. The dual-channel RECODmodel can account for these differential criterion-dependent findingsin the following manner.
1. Metacontrast suppression of the brightness of a preceding flash oflight by a subsequent spatially adjacent flash is a direct consequenceof the faster transient activity generated by the lagging flash inhibit-ing the slower sustained response of the leading flash.
2. Conversely, the paracontrast suppression of cff of the second of twospatially adjacent repetitively flashed stimuli is a direct consequenceof the slower sustained activity generated by the first stimulusreciprocally inhibiting the faster transient (flicker) activity
THE SUSTAINED–TRANSIENT CHANNEL APPROACH 186
generated by the second stimulus. Hence, the first stimulus hasa higher cff relative to the inhibited, i.e. lower, cff of the secondstimulus.
These results can be related to psychophysical studies revealingeffects on the cff of an intermittently flashed stimulus when a secondsteady or sustained neighboring stimulus is present. Several investig-ators (Berger 1954; Fry and Bartley 1936; Geldard 1932, 1934; Grahamand Granit 1931) have reported enhancement of the cff of an intermit-tently flashed test stimulus when the brightness of the steady neighbor-ing mask stimulus increased to slightly above the Talbot level of theflickering stimulus, followed by a suppression of the cff as thebrightness of the steady mask stimulus increased further.
What processes contribute to this non-monotonic effect of steadysurround or adjacent luminance on the cff of a flickering stimulus? Inour opinion there may be at least two processes which contribute to theinitial rise in cff as the surround luminance increases to slightly abovethe Talbot brightness of the flickering stimulus. First, as the intensityof the steady stimulus increases, there is an increase in the local lightadaptation level of neural summation pools (Rushton 1965; Rushtonand Westheimer 1962; Westheimer 1968) which intrude into the areasspatially adjacent to the steady stimulus. Since, according to theFerry–Porter law, cff is directly proportional to the light adaptationlevel, we would expect the cff to increase as the luminance of the steadystimulus increases. Secondly, despite an increase in cff, the apparentbrightness of the flickering stimulus simultaneously decreases as theluminance of the steady stimulus increases. Since, according to ourmodel, longer persistent sustained channels are primarily involved indetermining brightness or contrast of a stimulus, the more sluggishsustained activity of the flickering stimulus, persisting from oneflash to another, would be increasingly inhibited via simultaneousbrightness induction (Heinemann 1955), i.e. via lateral intra-channelinhibition, by the adjacent steady stimulus. This in turn should resultin a reduced inter-channel sustained-on-transient inhibition producedbetween successive flashes of the flickering test stimulus. Such adisinhibition of transient channels would also be expected to result inan increase in their activity as reflected in the initial increase of cff.
However, as a countervailing process, when the luminance of thesteady surround increases, it also exerts progressively more lateral
EXPLANATORY SCOPE OF THE DUAL-CHANNEL RECOD MODEL 187
inter-channel sustained-on-transient inhibition on the flickeringstimulus. Thus, as the brightness of the steady stimulus exceeds theTalbot brightness of the flickering stimulus, the transient activitygenerated by the latter stimulus also ought to he laterally inhibited. Onthe assumption that this latter countervailing lateral inter-channelinhibition of transient channels eventually outweighs the facilitatoryeffects on flicker of light adaptation and the simultaneous lateraldisinhibitory effect produced by lateral intra-channel sustained inhibi-tion, we would expect an initial rise or facilitation of cff followed by itssuppression as the luminance of the steady stimulus increases.
(2) In Chapter 1 we mentioned that pattern can be masked byuniform light flashes. Masking by light refers to the reduction invisibility of a test flash by a mask flash consisting of a uniform field(Sperling 1965). Typically, the test stimulus is relatively small and isspatially superimposed on a much larger mask field. When the testflash itself consists of a spatially uniform stimulus and the observer isrequired simply to detect the presence of the test stimulus, theparadigm is called masking of light by light. Masking by light, devoidof contour interactions, is of peripheral prechiasmic origin (Battersbyand Wagman 1962; Battersby et al. 1964). When the test stimulusconsists of a pattern or form, such as an alphabetic character, theparadigm is called masking of pattern by light. For example, suddenluminance changes produced by the abrupt on- and offset of a pro-longed masking flash are known to produce transient masking ofpatterns such as wide-stroke letters (Boynton and Miller 1963). Green(1981b) showed that these transient masking effects on the on- andoffset of a prolonged luminance flash are specific to the spatialfrequency of a sinusoidal test grating. He found that a brief 30-ms testgrating at 1.0 c/deg yielded transient masking overshoots at abrupton-and offset of a 700-ms luminance flash set at 58.4 cd/m2. However,for the same masking flash, no transient mask overshoots were obtainedwhen a 7.8-c/deg test grating was employed; here sustained and equalmasking was obtained for the duration of the flash. If we assume thatthe on- and offsets of the luminance flash activate peripheral (e.g. retinal)transient channels and that the 1.0- and 7.8-c/deg gratings predomin-antly activate low spatial frequency transient and high spatialfrequency sustained channels, respectively, then the peripheraltransient activity generated by the mask flash adds ‘noise’ to the ‘signal’
THE SUSTAINED–TRANSIENT CHANNEL APPROACH 188

of transient channels activated by the 1.0-c/deg test grating, but not tothe sustained channels activated by the 7.8-c/deg grating. In effect, intransient channels the internal signal-to-noise or Weber ratio isreduced, yielding transient masking overshoots at on- and offset.Conversely, since the sustained response component of the mask flash(recall that a stimulus can activate both transient and sustainedchannels) adds ‘noise’ only to the ‘signal’ in the sustained channelsactivated by the 7.8-c/deg test grating, only a sustained masking effectwithout transient overshoots at onset or offset of the mask flash oughtto occur.
We may wonder why the transient activity generated at on- and offsetof the luminance mask do not inhibit, via inter-channel inhibition, thesustained activity generated by the 7.8-c/deg test grating and thus alsoproduce transients near the abrupt luminance transitions of the mask.Recall first that masking by light, devoid of contour interactions, is ofperipheral prechiasmic origin (Battersby and Wagman 1962; Battersbyet al. 1964). However, since masking by pattern can be obtained withdichoptic presentations of mask and target stimuli (see Chapter 2,sections 2.2 and 2.6.7), we would expect the existence of mask contoursto be a crucial aspect of dichoptic masking effects. Thus, if contourinteractions also play a role in masking by light, we would expecttransient-on-sustained inter-channel inhibition to contribute to mask-ing by light only if the spatial separation between contours of the testpattern and the border edge of the uniform mask flash are sufficientlysmall (Battersby and Wagman 1962; Markoff and Sturr 1971; Weisstein1971). Since the stimulus field used by Green (1981b) was 4.5� indiameter, visibility of the 7.8-c/deg test grating may have been appre-ciably suppressed by transient channels activated at the border of thefield; however, in the interior of the test field, such suppression wouldbe absent or, at best, highly attenuated. In summary, masking by lightcan be explained by several mechanisms whose activations dependcritically on the nature of the stimuli.
(3) In order to produce contour proximity and overlap of mask andtarget stimuli Mitov et al. (1981) altered Green’s (1981b) technique byemploying the masking-by-pattern paradigm in which a 500-ms flashof one grating and a 20-ms flash of another grating served as maskand test stimuli, respectively. Their results can be summarized asfollows. When the spatial frequency of the mask was 6 c/deg or lower,
EXPLANATORY SCOPE OF THE DUAL-CHANNEL RECOD MODEL 189
the magnitude of the transient overshoots at mask on- and offsets wereinversely proportional to the spatial frequency of the test grating;specifically, the magnitude was largest for a 2-c/deg test grating,smaller, but pronounced, for a 6-c/deg test grating, and smallest foran 18-c/deg test grating. We would expect such a result if transientchannels are preferentially activated at spatial frequencies at and below6 c/deg and if the magnitude of transient activation decreases withspatial frequency while that of sustained channels increases. Since theseexperiments were conducted under binocular viewing, which usesperipheral luminance, as well as central contour masking mechanisms,the role of more central transient-on-sustained inter-channelinhibition cannot be assessed. A similar study, using dichoptic viewingof target and mask stimuli, may reveal such target–mask inhibitoryinteractions.
Moreover, the study of Mitov et al. (1981) dovetails neatly with resultsreported by Teller et al. (1971), employing scotopic luminance, andMatthews (1971), employing photopic luminance. These authorsreported that conditioning or mask flashes of relatively small diameter(e.g. �30’) produced no transient masking overshoots at their onset oroffset; however, such transient overshoots were obtained with relativelylarge-diameter mask flashes (e.g. �60’). Since larger diameter masks,like lower spatial frequency gratings, are optimal for activating transientchannels, we would expect pronounced transient activity at on- andoffset of a large conditioning flash to produce such transient maskingovershoots. However, smaller or high spatial frequency stimuli areeither suboptimal for or incapable of activating transient channels (seesection 5.2.4.1); hence transient mask overshoots are attenuated orabsent.
Moreover, based on the related results of Breitmeyer and Julesz(1975) and Tulunay-Keesey and Bennis (1979) (see section 5.2.4.1), wecan infer that the transient overshoots at on- and offset of the maskflashes employed by Green (1981b) and Mitov et al. (1981) depend onthe rise and fall times of the mask at its on- and offsets. In particular,since slowly ramped, relative to abrupt, on- and offsets attenuate thetransient response, we would expect a corresponding attenuation ofthe transient masking overshoots reported by these authors. Suchattenuations of transient masking overshoots have been reported
THE SUSTAINED–TRANSIENT CHANNEL APPROACH 190

by Matsumura (1976) in his investigation of masking of light byluminance increments and decrements.
(4) In the review of pattern masking in Chapter 2, it was noted thattype B paracontrast masking is optimal when the onset of the spatiallyflanking mask precedes that of the central target by several tens ofmilliseconds (Alpern 1953; Kolers and Rosner 1960; Pulos et al. 1980;Weisstein 1972). The mechanism responsible for this effect is intra-channel inhibition within sustained pathways. Recall from section 5.4.4that the surround activity of sustained retinal ganglion cells lags thecenter by several tens of milliseconds (Benardete and Kaplan 1997).Consequently, to have an optimal inhibitory effect on a sustainedneuron, the stimulus activating the surround must precede the centerstimulus by a corresponding asynchrony. At longer or shorterasynchronies, less than optimal inhibition of the center response isproduced. Consequently, in paracontrast an optimal type B maskingeffect should also be produced when the mask precedes the target byseveral tens of milliseconds. In addition to peak paracontrast effects inthe SOA range �30 to �20 ms, it was also noted that peak paracon-trast effects were also found in the �150 to �100 ms range (Breitmeyeret al., in press; Cavonius and Reeves 1983; Ögmen et al. 2003) (seeChapter 2, section 2.5).
Figure 5.17 shows the data averaged across two observers togetherwith the model prediction (Ögmen et al. 2003). Overall, the modelpredictions match the data well in terms of the location of the dips inthe masking function. In the model, paracontrast masking at relativelylarge SOA magnitudes arises from a slow intra-channel cortical inhibi-tion which was not included in the earlier versions of the dual-channelmasking models. In our simulations, the relative delay of this intra-channel inhibition was 144 ms. As mentioned before, the estimateddelays for antagonistic interactions (center–surround) in the earlyvisual pathways are at least an order of magnitude less than this value(Benardete and Kaplan, 1997). However, our paracontrast resultsindicate that such inhibition can last for several hundreds of millisec-onds. Evidence for both the short- and long-lasting inhibition has beenfound in visual cortex (Berman et al. 1991; Connors et al. 1988; Nelson1991). Therefore we propose two suppressive effects in paracontrast:(i) a relatively fast effect realized in the local center–surround antagonism
EXPLANATORY SCOPE OF THE DUAL-CHANNEL RECOD MODEL 191
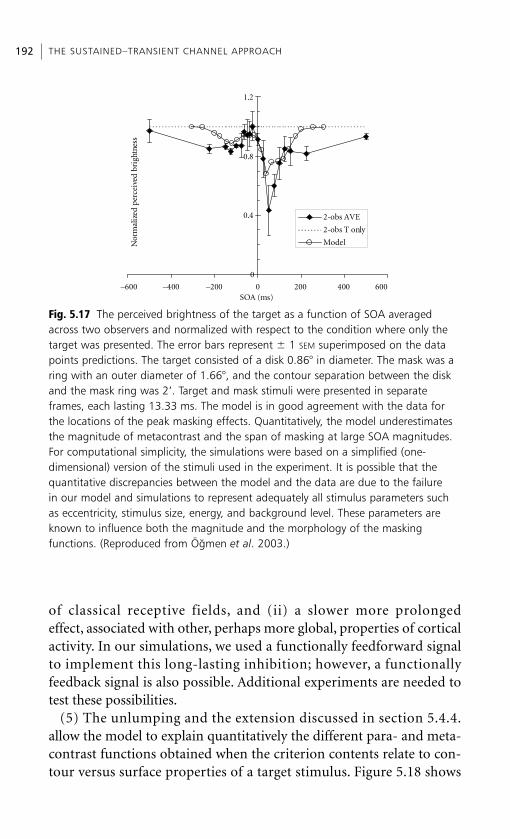
of classical receptive fields, and (ii) a slower more prolongedeffect, associated with other, perhaps more global, properties of corticalactivity. In our simulations, we used a functionally feedforward signalto implement this long-lasting inhibition; however, a functionallyfeedback signal is also possible. Additional experiments are needed totest these possibilities.
(5) The unlumping and the extension discussed in section 5.4.4.allow the model to explain quantitatively the different para- and meta-contrast functions obtained when the criterion contents relate to con-tour versus surface properties of a target stimulus. Figure 5.18 shows
THE SUSTAINED–TRANSIENT CHANNEL APPROACH 192
0
0.4
0.8
1.2
–600 –400 –200 0 200 400 600SOA (ms)
Nor
mal
ized
per
ceiv
ed b
righ
tnes
s
2-obs AVE
2-obs T only
Model
Fig. 5.17 The perceived brightness of the target as a function of SOA averagedacross two observers and normalized with respect to the condition where only thetarget was presented. The error bars represent � 1 SEM superimposed on the datapoints predictions. The target consisted of a disk 0.86� in diameter. The mask was aring with an outer diameter of 1.66�, and the contour separation between the diskand the mask ring was 2’. Target and mask stimuli were presented in separateframes, each lasting 13.33 ms. The model is in good agreement with the data forthe locations of the peak masking effects. Quantitatively, the model underestimatesthe magnitude of metacontrast and the span of masking at large SOA magnitudes.For computational simplicity, the simulations were based on a simplified (one-dimensional) version of the stimuli used in the experiment. It is possible that thequantitative discrepancies between the model and the data are due to the failure in our model and simulations to represent adequately all stimulus parameters suchas eccentricity, stimulus size, energy, and background level. These parameters areknown to influence both the magnitude and the morphology of the masking functions. (Reproduced from Ögmen et al. 2003.)
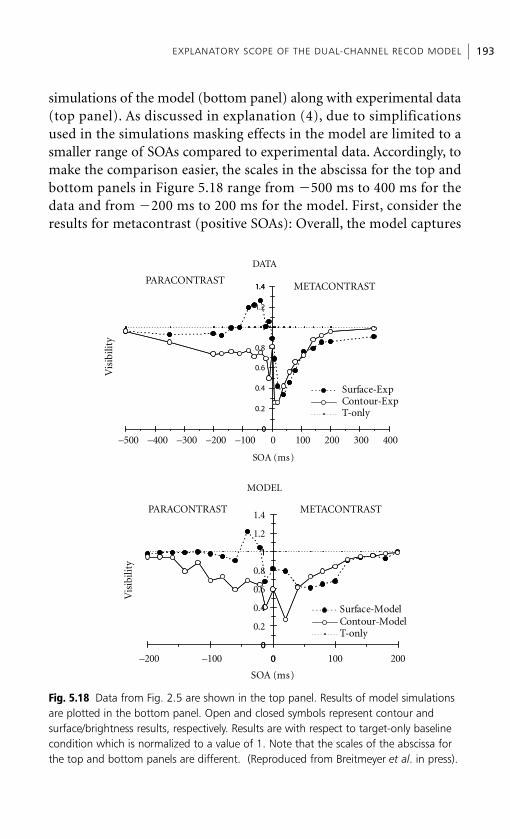
simulations of the model (bottom panel) along with experimental data(top panel). As discussed in explanation (4), due to simplificationsused in the simulations masking effects in the model are limited to asmaller range of SOAs compared to experimental data. Accordingly, tomake the comparison easier, the scales in the abscissa for the top andbottom panels in Figure 5.18 range from �500 ms to 400 ms for thedata and from �200 ms to 200 ms for the model. First, consider theresults for metacontrast (positive SOAs): Overall, the model captures
EXPLANATORY SCOPE OF THE DUAL-CHANNEL RECOD MODEL 193
0
1
0
Surface-Model
Contour-Model
T-only
METACONTRASTPARACONTRAST
0
1
1.4
Surface-Exp
Contour-Exp
T-only
MODEL
0
0.2
0.4
0.6
0.8
1
1.2
1.4
–200 –100 0 100 200
SOA (ms)
Vis
ibili
ty
Surface-ModelContour-ModelT-only
DATA
0
0.2
0.4
0.6
0.8
1
1.2
1.4
–500 –400 –300 –200 –100 0 100 200 300 400
SOA (ms)
Vis
ibili
ty
Surface-ExpContour-ExpT-only
METACONTRASTPARACONTRAST
Fig. 5.18 Data from Fig. 2.5 are shown in the top panel. Results of model simulationsare plotted in the bottom panel. Open and closed symbols represent contour and surface/brightness results, respectively. Results are with respect to target-only baselinecondition which is normalized to a value of 1. Note that the scales of the abscissa forthe top and bottom panels are different. (Reproduced from Breitmeyer et al. in press).
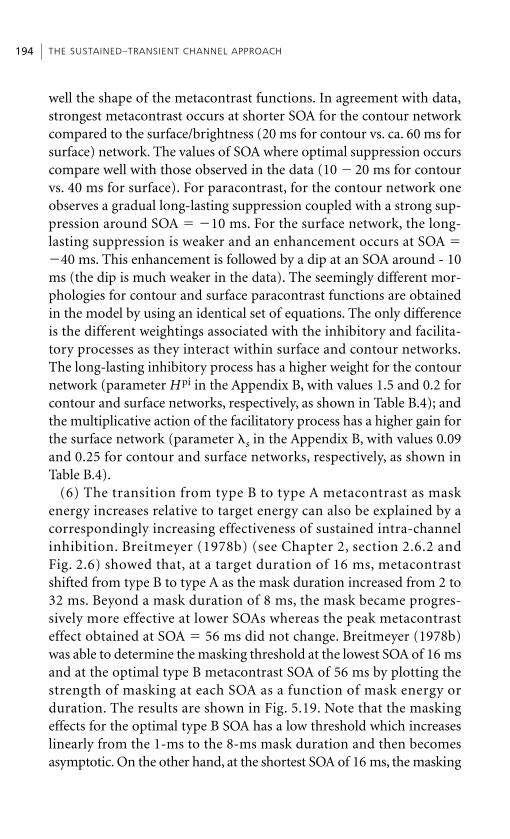
well the shape of the metacontrast functions. In agreement with data,strongest metacontrast occurs at shorter SOA for the contour networkcompared to the surface/brightness (20 ms for contour vs. ca. 60 ms forsurface) network. The values of SOA where optimal suppression occurscompare well with those observed in the data (10 � 20 ms for contourvs. 40 ms for surface). For paracontrast, for the contour network oneobserves a gradual long-lasting suppression coupled with a strong sup-pression around SOA � �10 ms. For the surface network, the long-lasting suppression is weaker and an enhancement occurs at SOA ��40 ms. This enhancement is followed by a dip at an SOA around - 10ms (the dip is much weaker in the data). The seemingly different mor-phologies for contour and surface paracontrast functions are obtainedin the model by using an identical set of equations. The only differenceis the different weightings associated with the inhibitory and facilita-tory processes as they interact within surface and contour networks.The long-lasting inhibitory process has a higher weight for the contournetwork (parameter Hpi in the Appendix B, with values 1.5 and 0.2 forcontour and surface networks, respectively, as shown in Table B.4); andthe multiplicative action of the facilitatory process has a higher gain forthe surface network (parameter �s in the Appendix B, with values 0.09and 0.25 for contour and surface networks, respectively, as shown inTable B.4).
(6) The transition from type B to type A metacontrast as maskenergy increases relative to target energy can also be explained by acorrespondingly increasing effectiveness of sustained intra-channelinhibition. Breitmeyer (1978b) (see Chapter 2, section 2.6.2 andFig. 2.6) showed that, at a target duration of 16 ms, metacontrastshifted from type B to type A as the mask duration increased from 2 to32 ms. Beyond a mask duration of 8 ms, the mask became progres-sively more effective at lower SOAs whereas the peak metacontrasteffect obtained at SOA � 56 ms did not change. Breitmeyer (1978b)was able to determine the masking threshold at the lowest SOA of 16 msand at the optimal type B metacontrast SOA of 56 ms by plotting thestrength of masking at each SOA as a function of mask energy orduration. The results are shown in Fig. 5.19. Note that the maskingeffects for the optimal type B SOA has a low threshold which increaseslinearly from the 1-ms to the 8-ms mask duration and then becomesasymptotic. On the other hand, at the shortest SOA of 16 ms, the masking
THE SUSTAINED–TRANSIENT CHANNEL APPROACH 194
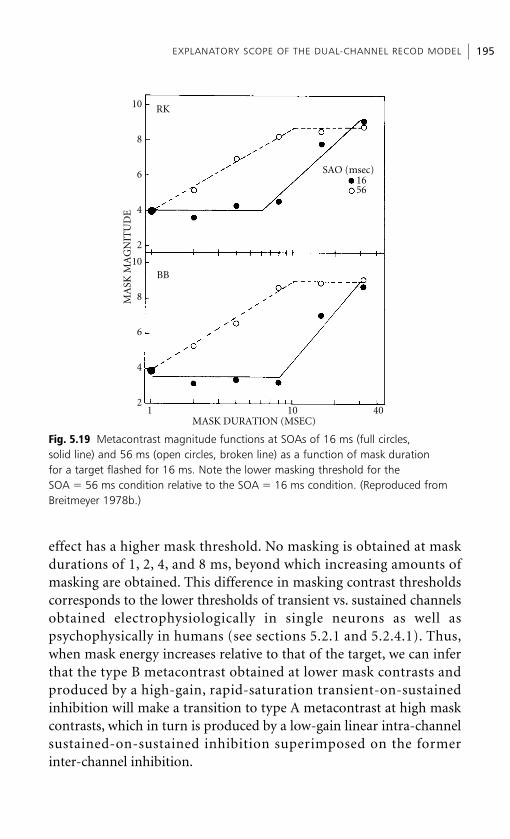
effect has a higher mask threshold. No masking is obtained at maskdurations of 1, 2, 4, and 8 ms, beyond which increasing amounts ofmasking are obtained. This difference in masking contrast thresholdscorresponds to the lower thresholds of transient vs. sustained channelsobtained electrophysiologically in single neurons as well aspsychophysically in humans (see sections 5.2.1 and 5.2.4.1). Thus,when mask energy increases relative to that of the target, we can inferthat the type B metacontrast obtained at lower mask contrasts andproduced by a high-gain, rapid-saturation transient-on-sustainedinhibition will make a transition to type A metacontrast at high maskcontrasts, which in turn is produced by a low-gain linear intra-channelsustained-on-sustained inhibition superimposed on the formerinter-channel inhibition.
EXPLANATORY SCOPE OF THE DUAL-CHANNEL RECOD MODEL 195
10
8
6
4
2
10
8
6
4
21 10 40
RK
BB
MASK DURATION (MSEC)
MA
SK M
AG
NIT
UD
E
SAO (msec)1656
Fig. 5.19 Metacontrast magnitude functions at SOAs of 16 ms (full circles, solid line) and 56 ms (open circles, broken line) as a function of mask duration for a target flashed for 16 ms. Note the lower masking threshold for theSOA � 56 ms condition relative to the SOA � 16 ms condition. (Reproduced fromBreitmeyer 1978b.)

(7) Dichoptic type A forward masking by noise or structure istypically weaker than type A backward masking (Greenspoon andEriksen 1968; Schiller and Smith 1965; Turvey 1973). This can beexplained by invoking an essential asymmetry between forward andbackward masking (Fig. 5.20) that depends on the effectiveness of thetarget’s transient activity in inhibiting the mask’s sustained activity. Inforward masking by structure or noise, post-retinal transient activitygenerated by the target can locally inhibit post-retinal sustainedactivity of the mask. Therefore the intrusion at cortical levels of masksustained activity into the sustained channels shared with the targetshould be less than maximal and hence there should be less masking byintegration (Fig. 5.20, open circles). On the other hand, in backwardmasking by noise or structure, not only does the sustained activityof the mask intrude unobstructed into the sustained channels of thetarget, but also, at post-retinal levels, the transient activity of the maskcan inhibit the sustained activity of the target and facilitate thisintrusion; thus, there should be more masking (Fig. 5.20, full circles).Moreover, since these interactions are obtained dichoptically, they verylikely exist at cortical levels.
THE SUSTAINED–TRANSIENT CHANNEL APPROACH 196
Lagging TargetLeading Target
20 40 60 80 100 200150
80
60
40
20
0SOA (ms)
250
100
0
Per
cen
tage
lett
ers
corr
ectl
y id
enti
fied
Fig. 5.20 The effect, as a function of SOA, on visibility of a consonant-trigram target, measured in percentage correct letter identification, produced by a spatiallyoverlapping pattern mask when the target temporally lags (open circles) or leads (full circles) the mask. (Reproduced from Michaels and Turvey 1979.)
(8) Under monoptic viewing conditions type A forward masking istypically stronger than type A backward masking (Kinsbourne andWarrington 1962a,b; Scharf and Lefton 1970: Schiller and Smith 1965;Turvey 1973). The explanation for this difference between dichopticand monoptic masking by structure or noise is attributable to the factthat under monoptic conditions integration of target and mask activitycan occur as early as the photoreceptor level and at post-receptorneural levels prior to the centrally located sustained–transientinhibitory interactions. The inference that these masking effects entailintegration of target and mask information in common peripheralpathways prior to the later inhibitory interactions among sustained ortransient channels is consistent with the finding that these powerfuland long-lasting peripheral on-effects produced by mask onset are notobtained dichoptically (Battersby et al. 1964; Turvey 1973), whereasinteractions among and between sustained and transient channels canbe demonstrated dichoptically (see explanation (10)).
(9) The fact that transient-on-sustained inhibition occurs inbackward masking by noise and structure has been demonstrated byMichaels and Turvey (1973, 1979) and Turvey (1973). In these studiesthe energy or contrast of the masks was appreciably lower than thatof the target. Here one would expect not only weak peripheral(photoreceptor) on-effects produced by the mask but also a weakactivation of the sustained channels of the mask relative to the target,and consequently little masking by integration should occur in com-mon post-receptor sustained pathways. However, based on Breitmeyer’s(1978b) study (see Chapter 2, Fig. 2.6), we know that even withmonoptic viewing lower-energy masks can yield type B metacontrastfunctions which are produced by transient on sustained inhibition.Michaels and Turvey (1973) and Turvey (1973) also reported type Bbackward masking functions when a low-energy structure or noisemask was used, indicating that this form of inter-channel inhibitionwas also involved in producing their results. This interpretation wasgiven additional clarification by Michaels and Turvey (1979). Theyshowed that with a target/mask energy ratio of 1/2, a type B functionwas generated under dichoptic viewing whereas a type A function wasgenerated under monoptic viewing. Presumably here the monoptictype A effect, especially at low SOA values, was due to peripheralprocesses such as photoreceptor on-effects produced by the mask
EXPLANATORY SCOPE OF THE DUAL-CHANNEL RECOD MODEL 197
and common integration of weak-target and strong-mask sustainedactivity, whereas the dichoptic type B effect was produced by a morecentral mask transient-on-target sustained inhibition isolated from theperipheral energy-dependent integrative effects obtained monoptically(Battersby et al. 1964; Turvey 1973).
In this connection, Purcell et al. (1975) showed that in backwardmasking by pattern, moving the retinal location of the target and maskstimuli from the fovea to extrafoveal areas can facilitate production oftype B masking functions. In section 5.2.1 it was indicated that the P/Mcell ratio decreases with retinal eccentricity. Hence, in comparison withfoveal stimuli, extrafoveal stimuli should yield weak type A masking bycommon integration of target and mask sustained pattern informationbut relatively stronger type B masking produced by transient-on-sustained inhibition.
(10) Type A forward and backward pattern masking as well as type Bpara- and metacontrast are obtained dichoptically and monoptically(Alpern 1953; Kinsbourne and Warrington 1962a; Kolers and Rosner1960; Michaels and Turvey 1973; Schiller and Smith 1965, 1968; Turvey1973; Weisstein 1972; Werner 1940). We know that sustained andtransient neurons exist in the primary visual cortex where a majorityof visual cells already receive binocular innervation (Hubel 1988;Hubel and Wiesel 1962, 1968, 1977). Consequently, both dichopticand monoptic masking effects due to either integration in commonsustained pathways or inter-channel inhibition should be obtainable.
(11) Type B metacontrast effects decrease in magnitude as the spatialseparation between the target and mask stimuli increases (Alpern 1953;Breitmeyer and Horman 1981; Breitmeyer et al. 1981b; Weisstein andGrowney 1969). This can be explained on the basis of the spatiallyrestricted receptive fields of sustained and transient neurons and thetopographic mapping from the retina to the visual cortex (Brooks andJung 1973). Although transient receptive fields are larger and exerttheir influence over greater distances than sustained channels (seesection 5.2.1), at increasingly larger distances between stimuli theirinhibitory effects on sustained neurons should attenuate. In particular,at the cortical level inter-channel inhibition should be maximal withina cortical column of cells and should decrease as the physical separa-tion of retinotopically organized columns subserving different regionsof visual space (Hubel and Wiesel 1977) increases. These properties
THE SUSTAINED–TRANSIENT CHANNEL APPROACH 198
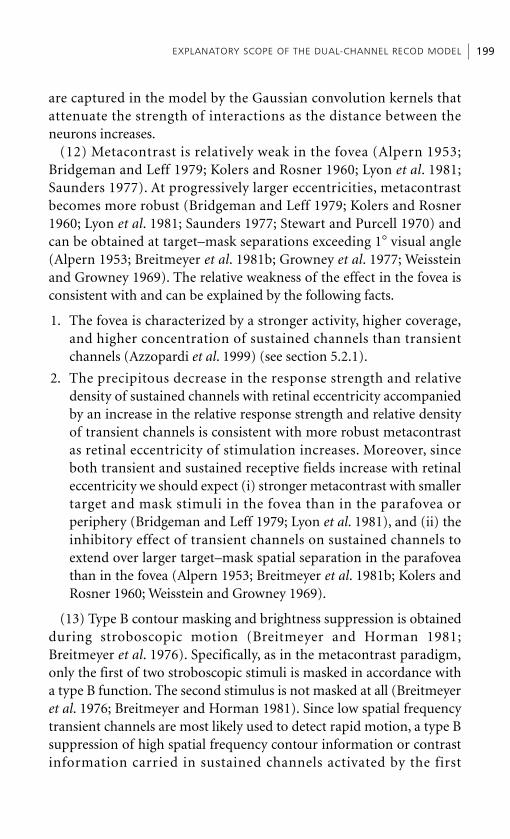
are captured in the model by the Gaussian convolution kernels thatattenuate the strength of interactions as the distance between theneurons increases.
(12) Metacontrast is relatively weak in the fovea (Alpern 1953;Bridgeman and Leff 1979; Kolers and Rosner 1960; Lyon et al. 1981;Saunders 1977). At progressively larger eccentricities, metacontrastbecomes more robust (Bridgeman and Leff 1979; Kolers and Rosner1960; Lyon et al. 1981; Saunders 1977; Stewart and Purcell 1970) andcan be obtained at target–mask separations exceeding 1� visual angle(Alpern 1953; Breitmeyer et al. 1981b; Growney et al. 1977; Weissteinand Growney 1969). The relative weakness of the effect in the fovea isconsistent with and can be explained by the following facts.
1. The fovea is characterized by a stronger activity, higher coverage,and higher concentration of sustained channels than transientchannels (Azzopardi et al. 1999) (see section 5.2.1).
2. The precipitous decrease in the response strength and relativedensity of sustained channels with retinal eccentricity accompaniedby an increase in the relative response strength and relative densityof transient channels is consistent with more robust metacontrastas retinal eccentricity of stimulation increases. Moreover, sinceboth transient and sustained receptive fields increase with retinaleccentricity we should expect (i) stronger metacontrast with smallertarget and mask stimuli in the fovea than in the parafovea orperiphery (Bridgeman and Leff 1979; Lyon et al. 1981), and (ii) theinhibitory effect of transient channels on sustained channels toextend over larger target–mask spatial separation in the parafoveathan in the fovea (Alpern 1953; Breitmeyer et al. 1981b; Kolers andRosner 1960; Weisstein and Growney 1969).
(13) Type B contour masking and brightness suppression is obtainedduring stroboscopic motion (Breitmeyer and Horman 1981;Breitmeyer et al. 1976). Specifically, as in the metacontrast paradigm,only the first of two stroboscopic stimuli is masked in accordance witha type B function. The second stimulus is not masked at all (Breitmeyeret al. 1976; Breitmeyer and Horman 1981). Since low spatial frequencytransient channels are most likely used to detect rapid motion, a type Bsuppression of high spatial frequency contour information or contrastinformation carried in sustained channels activated by the first
EXPLANATORY SCOPE OF THE DUAL-CHANNEL RECOD MODEL 199

stimulus would be expected during stroboscopic motion, just as inmetacontrast. Moreover, since a type B masking function was obtainedas long as the spatial separation between the first and second stimulidid not exceed a value of about 1.5–2.0�, it is clear that strict contourproximity is not a necessary condition for obtaining such maskingfunctions (see also explanation (12) ).
(14) In Chapter 2, section 2.6.1, we noted that simple reaction timeto the target (Bernstein et al. 1973a,b; Fehrer and Biederman 1962;Fehrer and Raab 1962; Harrison and Fox 1966; May and Grannis,unpublished observations) or forced-choice detection of target location(Schiller and Smith 1966; Ögmen et al. 2003) are unaffected inmetacontrast masking. However, when a pattern discrimination task isused, type B choice reaction time functions can be generated (Eriksenand Eriksen 1972; May and Grannis, unpublished observations). Ourmodel states that, since optimal intra-channel inhibition is obtainedwhen the mask precedes the target, transient channels activated by thetarget are immune to the intra-channel inhibition by the followingtransient activity generated by the mask. Moreover, because of thelonger response latency of sustained compared with transient channels,the sustained activity of the later flashed mask cannot inhibit thetransient activity of the preceding target. Therefore, since both intra-and inter-channel inhibition of the target’s transient response areeffectively eliminated, the activity generated by the abrupt onset of thetarget could easily be detected by transient channels in the visual cortexor the superior colliculus, activated either via direct retinocollicularprojections (Hoffmann 1973; McIlwain and Lufkin 1976) or indirectlyvia corticofugal projections from transient cells in the ipsilateral cortex(Bunt et al. 1975; Finlay et al. 1976; Leventhal and Hirsch 1978; Palmerand Rosenquist 1974; Rosenquist and Palmer 1971). In contrast, thetype B reaction time function obtained when pattern discrimination isemployed is consistent with the existence of inter-channel transient-on-sustained inhibition in metacontrast. These results again indicatethat figural information is carried mainly in sustained channels, whilelocation information is carried mainly in transient channels. Thisconclusion is further corroborated by the fact that in backward mask-ing by noise location information is masked for a shorter interval thanis pattern or figural information (Breitmeyer, unpublished findings;Smythe and Finkel 1974) (see Chapter 2, section 2.8), indicating that
THE SUSTAINED–TRANSIENT CHANNEL APPROACH 200
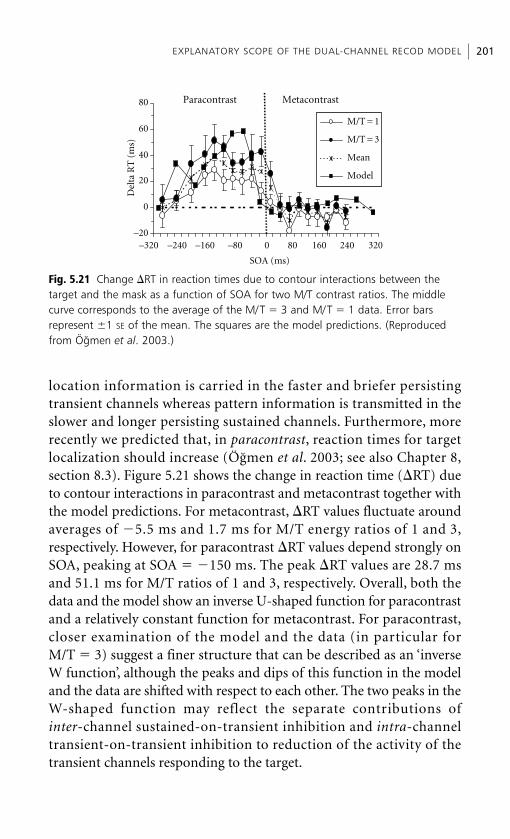
location information is carried in the faster and briefer persistingtransient channels whereas pattern information is transmitted in theslower and longer persisting sustained channels. Furthermore, morerecently we predicted that, in paracontrast, reaction times for targetlocalization should increase (Ögmen et al. 2003; see also Chapter 8,section 8.3). Figure 5.21 shows the change in reaction time (�RT) dueto contour interactions in paracontrast and metacontrast together withthe model predictions. For metacontrast, �RT values fluctuate aroundaverages of �5.5 ms and 1.7 ms for M/T energy ratios of 1 and 3,respectively. However, for paracontrast �RT values depend strongly onSOA, peaking at SOA � �150 ms. The peak �RT values are 28.7 msand 51.1 ms for M/T ratios of 1 and 3, respectively. Overall, both thedata and the model show an inverse U-shaped function for paracontrastand a relatively constant function for metacontrast. For paracontrast,closer examination of the model and the data (in particular forM/T � 3) suggest a finer structure that can be described as an ‘inverseW function’, although the peaks and dips of this function in the modeland the data are shifted with respect to each other. The two peaks in theW-shaped function may reflect the separate contributions ofinter-channel sustained-on-transient inhibition and intra-channeltransient-on-transient inhibition to reduction of the activity of thetransient channels responding to the target.
EXPLANATORY SCOPE OF THE DUAL-CHANNEL RECOD MODEL 201
–320 –240 –160 –80 0 80 160 240 320
SOA (ms)
M/T = 1
M/T = 3
Mean
Model
0
20
40
60D
elta
RT
(m
s)
–20
80 Paracontrast Metacontrast
Fig. 5.21 Change �RT in reaction times due to contour interactions between the target and the mask as a function of SOA for two M/T contrast ratios. The middlecurve corresponds to the average of the M/T � 3 and M/T � 1 data. Error bars represent �1 SE of the mean. The squares are the model predictions. (Reproducedfrom Ögmen et al. 2003.)
(15) Kolers (1963) and von Grünau (1978b, 1981) report that whenthe shape or contour of either of two spatially separated and sequentialstimuli is masked by metacontrast, it can still contribute to the percep-tion stroboscopic motion when the second stimulus follows the first atoptimal SOAs. Explanation (14) stated that transient activity generatedby a given stimulus can escape the masking effects produced by the fol-lowing metacontrast mask. Furthermore, since transient channels arepresumably involved in spatiotemporal sequence detection (Matin1975) or the detection of stroboscopic motion (see explanation (13)),the results obtained by Kolers (1963) and von Grünau (1978b, 1981)can be readily explained in terms of the strong (unmasked) transientactivity generated by the two sequential stimuli.
(16) Both on- and off-center sustained and transient cells can befound long the entire visual pathway. Moreover, as one progresses upthe visual pathway, transient neural responses become progressivelymore indifferent to the sign of the stimulus contrast (Citron et al. 1981;Schiller et al. 1976). Additionally, since transient channels characterist-ically respond to onset as well as offset of stimuli (Enroth-Cugell andRobson 1966) (see also section 5.2.3), we should be able to obtainmetacontrast contour masking irrespective of the sign of mask contrastas shown by Breitmeyer (1978c) and with mask offset as demonstratedby Breitmeyer and Kersey (1981) and suggested earlier by Turvey et al.(1974). We noted in Chapter 2, section 2.6.4, that Becker and Anstis(2004) recently failed to obtain brightness suppression in metacontrastwhen the target and mask had opposite contrast signs. As noted, thismay be due to the use of different criterion contents in visual maskingor to the use of large vs. small stimuli (Chapter 2, note 3).
(17) Werner’s (1935) investigation of metacontrast indicated that themagnitude of metacontrast suppression of a target pattern is inverselyrelated to the orientation difference between target and mask stimuli.Alternatively, his results indicated that metacontrast is orientationspecific. This finding is readily explained by the facts that corticaltransient as well as sustained neurons are orientation selective (Ikedaand Wright 1975; Stone and Dreher 1973), and that mutual inhibitionamong cortical orientation-selective cells is itself orientation selective(Benevento et al. 1972; Blakemore et al. 1970; Blakemore and Tobin1972; Creutzfeldt et al. 1974; Nelson and Frost 1978) extending up toorientation differences of about 30–40�.
THE SUSTAINED–TRANSIENT CHANNEL APPROACH 202
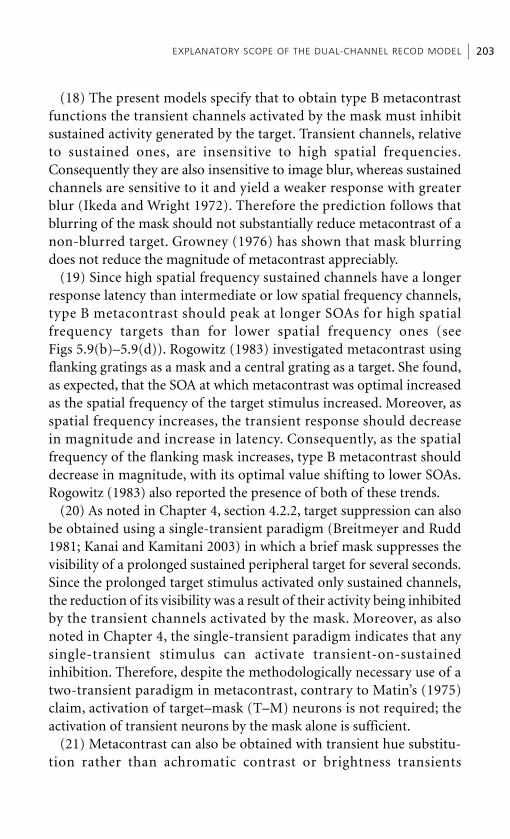
(18) The present models specify that to obtain type B metacontrastfunctions the transient channels activated by the mask must inhibitsustained activity generated by the target. Transient channels, relativeto sustained ones, are insensitive to high spatial frequencies.Consequently they are also insensitive to image blur, whereas sustainedchannels are sensitive to it and yield a weaker response with greaterblur (Ikeda and Wright 1972). Therefore the prediction follows thatblurring of the mask should not substantially reduce metacontrast of anon-blurred target. Growney (1976) has shown that mask blurringdoes not reduce the magnitude of metacontrast appreciably.
(19) Since high spatial frequency sustained channels have a longerresponse latency than intermediate or low spatial frequency channels,type B metacontrast should peak at longer SOAs for high spatialfrequency targets than for lower spatial frequency ones (seeFigs 5.9(b)–5.9(d)). Rogowitz (1983) investigated metacontrast usingflanking gratings as a mask and a central grating as a target. She found,as expected, that the SOA at which metacontrast was optimal increasedas the spatial frequency of the target stimulus increased. Moreover, asspatial frequency increases, the transient response should decreasein magnitude and increase in latency. Consequently, as the spatialfrequency of the flanking mask increases, type B metacontrast shoulddecrease in magnitude, with its optimal value shifting to lower SOAs.Rogowitz (1983) also reported the presence of both of these trends.
(20) As noted in Chapter 4, section 4.2.2, target suppression can alsobe obtained using a single-transient paradigm (Breitmeyer and Rudd1981; Kanai and Kamitani 2003) in which a brief mask suppresses thevisibility of a prolonged sustained peripheral target for several seconds.Since the prolonged target stimulus activated only sustained channels,the reduction of its visibility was a result of their activity being inhibitedby the transient channels activated by the mask. Moreover, as alsonoted in Chapter 4, the single-transient paradigm indicates that anysingle-transient stimulus can activate transient-on-sustainedinhibition. Therefore, despite the methodologically necessary use of atwo-transient paradigm in metacontrast, contrary to Matin’s (1975)claim, activation of target–mask (T–M) neurons is not required; theactivation of transient neurons by the mask alone is sufficient.
(21) Metacontrast can also be obtained with transient hue substitu-tion rather than achromatic contrast or brightness transients
EXPLANATORY SCOPE OF THE DUAL-CHANNEL RECOD MODEL 203
THE SUSTAINED–TRANSIENT CHANNEL APPROACH 204
(Breitmeyer et al. 1991; Reeves 1981). Reeves obtained type B metacon-trast when parafoveal target and mask stimuli (white, yellow, blue, orred) were briefly substituted against a green background of equivalentbrightness. Optimal masking was obtained when red target andmask stimuli were substituted against the green background. This maycorrelate with the fact that, at and near the fovea, most broad-bandcolor-opponent transient cells as well as narrow-band color-opponentsustained cells are maximally sensitive to red and green light. Moreover,such hue-substitution masking is consistent with the fact, noted inChapter 2, section 2.6.8, that the transient M neurons can respond tohue-substitution stimuli (Krüger 1979; B.B. Lee et al. 1988; Schiller andColby 1983).
(22) In Chapter 2, section 2.6.3, we indicated that background andstimulus luminances affect the locus of the peak metacontrast onthe SOA axis. In particular, at lower relative to higher backgroundluminances (Purcell et al. 1974) or stimulus luminances (Alpern 1953),the peak effect occurs at shorter SOAs. Since neurophysiologicalfindings show that the temporal response characteristics of transientneurons tend to converge toward those of sustained neurons as adapta-tion level (background luminance) decreases, we would expect, amongother things (Breitmeyer 1992), the response latencies of transient andsustained channels to converge at lower adaptation levels. Hence,according to our model, the SOA at which peak metacontrast maskingoccurs should correspondingly shift toward a value of 0 ms. It maybe worthwhile reiterating that several prior theoretical explanationsproposed by Bridgeman (1971, 1977, 1978), Ganz (1975), Navon andPurcell (1981), and Reeves (1982) predict the opposite shift of the SOAat which optimal metacontrast occurs.
Moreover, Matin’s (1975) model, discussed in explanation (20), facesdifficulties here. With a reduction of background luminance, optimalvelocity sensitivity to real and apparent motion shifts toward lowervalues (Breitmeyer 1973; Crook 1937; Oyama 1970). This may relate tothe following facts.
1. The fusion velocity, i.e. the velocity at or above which a movinggrating is no longer distinguishable from a uniform field, decreaseslinearly with decreases of log background luminance (Crook 1937;Oyama 1970), in line with the Ferry–Porter law, which was origin-

ally formulated to account for similar background-luminancedependent changes in the cff (Ferry 1892; Kelly 1961).
2. The respective upper-limit velocities at which sustained andtransient neural responses are barely activated decreases asbackground luminance decreases (Cleland et al. 1973). Therefore,since the optimal ‘velocity’ characterizing stroboscopic motion aswell as the optimal temporal resolution decrease as backgroundluminance decreases, the SOA at which we obtain either optimalstroboscopic motion or optimal T–M neuron activation corres-pondingly increases. Accordingly, of Matin’s two proposed T–Mneuron properties contributing to metacontrast, the first, specify-ing their optimal response to a given SOA, would predict incorrectlythat the corresponding optimal metacontrast effect also shifts to ahigher SOA as background luminance decreases, whereas thesecond property (response latency) would predict correctly ashift to a lower SOA. Here, and possibly also in other situations,Matin’s (1975) model faces the problem of stating which propertydominates under high compared with low background luminanceand how such shifts from presumably bilateral co-operative tounilateral countervailing interactions of the two properties arise. Itwould seem from a standpoint of parsimony that the responselatency property by itself readily accounts for these background-dependent results without the complications arising when theoptimal SOA property is also invoked. Parenthetically, it also maybe worth mentioning that Kahneman’s (1967) impossible-motionformulation of type B metacontrast suffers on the same grounds asMatin’s (1975) formulation based on an optimal SOA-dependentresponse magnitude of T–M neurons. Of course, deciding toeliminate this latter process from explanations of metacontrastdoes not, as yet, necessitate its elimination in Matin’s (1975)explanation of type B paracontrast. A systematic, heretoforeunperformed, investigation of type B paracontrast as a function ofbackground luminance should yield the relevant answers.
(23) Besides background luminance, the wavelength or color of abackground also affects the magnitude of metacontrast masking, withgreen or blue backgrounds yielding stronger masking than red ones(Breitmeyer and Willliams 1990; Breitmeyer et al. 1991; Edwards et al.
EXPLANATORY SCOPE OF THE DUAL-CHANNEL RECOD MODEL 205
1996; Williams et al. 1991). This result, as noted in Chapter 2, section2.6.8, is consistent with the fact that uniform red light is known tosuppress the activity of M neurons (De Monasterio 1978a,b;De Monasterio and Schein 1980; Dreher et al. 1976; Livingstone and Hubel1984; Marrocco et al. 1982; Van Essen 1985; Wiesel and Hubel 1966).
(24) Pantle (1971) and Nillson et al. (1975) demonstrated theexistence of selective flicker adaptation (see section 5.2.4.3). The latterinvestigators found in particular that flicker frequencies ranging fromabout 8.0 to 24.0 Hz produced the largest adaptation effect. Sincetransient cells are selectively sensitive to the higher range of flickerfrequencies, flicker adaptation should produce a weaker response intransient channels (Breitmeyer et al. 1981a; Green 1981a). Therefore,if flicker adaptation is used prior to a metacontrast presentation, themagnitude of transient-on-sustained inhibition, and hence metacon-trast, should decrease. Indeed, Petry et al. (1979) confirmed thisprediction in their study of metacontrast.
(25) In Chapter 7, we will review data showing that attention andfigural grouping effects can modulate the magnitude of masking func-tions. Our model can explain these findings if we consider attentionand figural effects as ancillary modulatory factors influencing basicmechanisms underlying visual masking. For example, if we assumethat attention enhances the activity in the sustained channel at thelocation of the target, this enhancement would give a competitiveadvantage to sustained channels over transient channels and therebyreduce the magnitude of the masking effect. An interesting predictionof this formulation is that if attention favors the sustained channels inthe sustained–transient competition, attention should degrade taskscarried out by the transient channels. Recently, Yeshurun and colleaguespresented evidence in support of this prediction. When two briefpulses are presented at the same spatial location, because of temporalintegration they are perceived as a single pulse until the ISI reaches acritical value (two-pulse fusion threshold). By using a spatial cueingparadigm, Yeshurun and Levy (2003) showed that the two-pulse fusionthreshold was higher when attention was allocated to the spatiallocation of the target. Furthermore, Yeshurun (2004) showed that sucha degradation in temporal resolution was not apparent when stimuliwere chosen so as to bias the task toward the parvocellular system(by using isoluminant stimuli or a red background). In summary, our
THE SUSTAINED–TRANSIENT CHANNEL APPROACH 206
model can explain the influence of spatial attention on masking as abias for the parvocellular system in the parvo–magno competition.(For further effects of attention on masking see Chapter 7.)
(26) Since sequential blanking (Mayzner and Tresselt 1970; Newarkand Mayzner 1973) (see Chapter 2, section 2.7.1) can be identified withtype B metacontrast (Hearty and Mewhort 1975; Mewhort et al. 1978;Piéron 1935), it also falls easily into the explanatory scope of our model.
(27) A further implication of the sustained-on-transient approach tohuman visual information processing for iconic or visible persistenceconcerns the decrease of visible persistence both as stimulus durationincreases (Haber and Standing 1970; Bowen et al. 1974) and as thespatial frequency of a prolonged stimulus decreases (Bowling et al.1979; Breitmeyer et al. 1981a; Corfield et al. 1978; Meyer and Maguire1977) (see section 5.2.4.3). In explanation (16), we noted that patternstimulus offsets can produce type B backward masking (Breitmeyerand Kersey 1981). As noted in section 5.2.3, stimulus offsets can activ-ate the transient M neurons and thus produce transient-on-sustainedinhibition. Consequently, as stimulus duration increases, transientchannels activated at offset of the stimulus should retroactively inhibitsustained channels and thus curtail their response persistence beyondthe offset of the stimulus. A related line of reasoning applies to thedecrement of visual persistence of prolonged low spatial frequencystimuli. Since transient cells are selectively sensitive to low spatialfrequencies, their activation at stimulus offset would again retroact-ively suppress the activity of low spatial frequency sustained channelsand thus curtail their persistence beyond stimulus offset. At highspatial frequencies this inhibitory mechanism at grating offset wouldbe absent or greatly attenuated since transient channels are relativelyinsensitive to these spatial frequencies.
Moreover, Meyer et al. (1975, 1979) found that orientation andspatial frequency adaptation decreased visible persistence selectively.Since selective adaptation for prolonged periods of time reduces thesensitivity of sustained channels but leaves that of transient channelsunaffected (Bodis-Wollner and Hendley 1979; Kulikowski 1974)(see section 5.2.4.1), visible persistence in sustained channels shoulddecrease since, because of their lower response after adaptation, theycan be more effectively inhibited by the non-adapted transient channelsactivated at grating offset.
EXPLANATORY SCOPE OF THE DUAL-CHANNEL RECOD MODEL 207
(28) The ‘four-dot masking’ paradigm discussed in Chapter 4,section 4.5, can be readily explained by our model by considering thefact that at eccentric locations target–mask contour proximity andsimilarity becomes less critical for metacontrast (explanation (12)).Similarly, as noted in explanation (25), distributed spatial attentionleads to stronger masking.
(29) The common-onset masking discussed in Chapter 4, section4.5.2, can be explained by feedforward as well as feedback mechanisms.
1. Consider the possibility that ‘equalization methods’, whether by thecriterion of equal perceived brightness or the equal level abovedetection-threshold, do not fully control for temporal integrationof the mask stimulus at all levels of visual processing. Accordingly,one way our model can explain increased masking as a function ofmask duration at SOA � 0 is by an increased effectiveness ofsustained intra-channel inhibition by the mask on the target(see explanation (6)).
2. Another factor that can lead to masking is feedback inhibition bythe prolonged presentation of the mask signal.
3. Finally, for intermediate mask durations, inter-channel transient-on-sustained inhibition due to mask offset can contribute tomasking.
(30) The findings of Lamme et al. (2002), discussed in Chapter 3,section 3.2.1, provide support for the existence of feedforward- andfeedback-dominant phases of cortical processing predicted by theRECOD model. Our model can account for their findings by(i) unlumping the cortical network so that V1 is represented separatelyfrom subsequent areas and (ii) applying transient-on-sustained inhibi-tion directly to the feedback signals from higher areas back to V1.
(31) As discussed below in Chapter 8, section 8.2, the addition of asecond mask (M2) to a target (T) and a primary metacontrast mask(M1) sequence can lead to the recovery of the visibility of the target. Inparticular, Breitmeyer et al. (1981b) investigated the timing of targetrecovery in metacontrast and found that M2 had to be presentedbefore M1 in order to lead to target recovery. Furthermore, they foundthat, when the visibility of the target recovered, there was no concomit-ant change in the visibility of the primary mask M1. This indicates adissociation between the visibility of M1 and its masking effectiveness.
THE SUSTAINED–TRANSIENT CHANNEL APPROACH 208
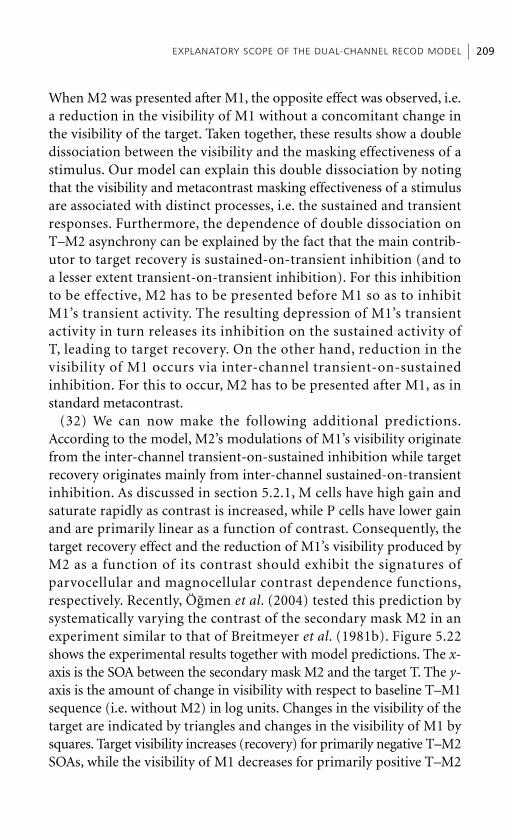
When M2 was presented after M1, the opposite effect was observed, i.e.a reduction in the visibility of M1 without a concomitant change inthe visibility of the target. Taken together, these results show a doubledissociation between the visibility and the masking effectiveness of astimulus. Our model can explain this double dissociation by notingthat the visibility and metacontrast masking effectiveness of a stimulusare associated with distinct processes, i.e. the sustained and transientresponses. Furthermore, the dependence of double dissociation onT–M2 asynchrony can be explained by the fact that the main contrib-utor to target recovery is sustained-on-transient inhibition (and toa lesser extent transient-on-transient inhibition). For this inhibitionto be effective, M2 has to be presented before M1 so as to inhibitM1’s transient activity. The resulting depression of M1’s transientactivity in turn releases its inhibition on the sustained activity ofT, leading to target recovery. On the other hand, reduction in thevisibility of M1 occurs via inter-channel transient-on-sustainedinhibition. For this to occur, M2 has to be presented after M1, as instandard metacontrast.
(32) We can now make the following additional predictions.According to the model, M2’s modulations of M1’s visibility originatefrom the inter-channel transient-on-sustained inhibition while targetrecovery originates mainly from inter-channel sustained-on-transientinhibition. As discussed in section 5.2.1, M cells have high gain andsaturate rapidly as contrast is increased, while P cells have lower gainand are primarily linear as a function of contrast. Consequently, thetarget recovery effect and the reduction of M1’s visibility produced byM2 as a function of its contrast should exhibit the signatures ofparvocellular and magnocellular contrast dependence functions,respectively. Recently, Ögmen et al. (2004) tested this prediction bysystematically varying the contrast of the secondary mask M2 in anexperiment similar to that of Breitmeyer et al. (1981b). Figure 5.22shows the experimental results together with model predictions. The x-axis is the SOA between the secondary mask M2 and the target T. The y-axis is the amount of change in visibility with respect to baseline T–M1sequence (i.e. without M2) in log units. Changes in the visibility of thetarget are indicated by triangles and changes in the visibility of M1 bysquares. Target visibility increases (recovery) for primarily negative T–M2SOAs, while the visibility of M1 decreases for primarily positive T–M2
EXPLANATORY SCOPE OF THE DUAL-CHANNEL RECOD MODEL 209
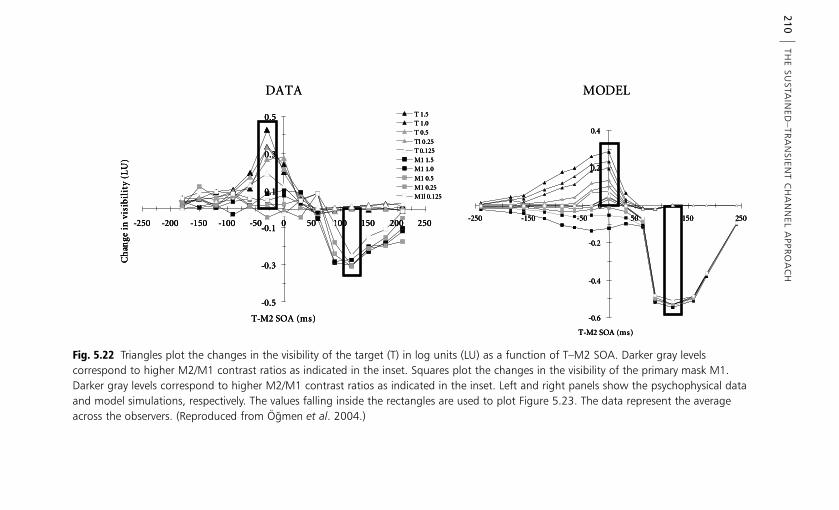
THE SU
STAIN
ED–TR
AN
SIENT C
HA
NN
EL APPR
OA
CH
210
Fig. 5.22 Triangles plot the changes in the visibility of the target (T) in log units (LU) as a function of T–M2 SOA. Darker gray levels correspond to higher M2/M1 contrast ratios as indicated in the inset. Squares plot the changes in the visibility of the primary mask M1.Darker gray levels correspond to higher M2/M1 contrast ratios as indicated in the inset. Left and right panels show the psychophysical dataand model simulations, respectively. The values falling inside the rectangles are used to plot Figure 5.23. The data represent the averageacross the observers. (Reproduced from Ögmen et al. 2004.)
DATA MODEL
-0.5
-0.3
-0.1
0.1
0.3
0.5
-250 -200 -150 -100 -50 0 50 100 150 200 250
T-M2 SOA (ms)
Ch
ange
in
vis
ibil
ity
(LU
)T 1.5T 1.0
T 0.5
Tl 0.25T 0.125
M1 1.5M1 1.0
M1 0.5
M1 0.25M1l 0.125
-0.6
-0.4
-0.2
0
0.2
0.4
-250 -150 -50 50 150 250
T-M2 SOA (ms)
DATA MODEL
-0.5
-0.3
-0.1
0.1
0.3
0.5
-250 -200 -150 -100 -50 0 50 100 150 200 250
T-M2 SOA (ms)
Ch
ange
in
vis
ibil
ity
(LU
)T 1.5T 1.0
T 0.5
Tl 0.25T 0.125
M1 1.5M1 1.0
M1 0.5
M1 0.25M1l 0.125
-0.5
-0.3
-0.1
0.1
0.3
0.5
-250 -200 -150 -100 -50 0 50 100 150 200 250
T-M2 SOA (ms)
Ch
ange
in
vis
ibil
ity
(LU
)T 1.5T 1.0
T 0.5
Tl 0.25T 0.125
M1 1.5M1 1.0
M1 0.5
M1 0.25M1l 0.125
-0.6
-0.4
-0.2
0
0.2
0.4
-250 -150 -50 50 150 250
T-M2 SOA (ms)
-0.6
-0.4
-0.2
0
0.2
0.4
-250 -150 -50 50 150 250
T-M2 SOA (ms)
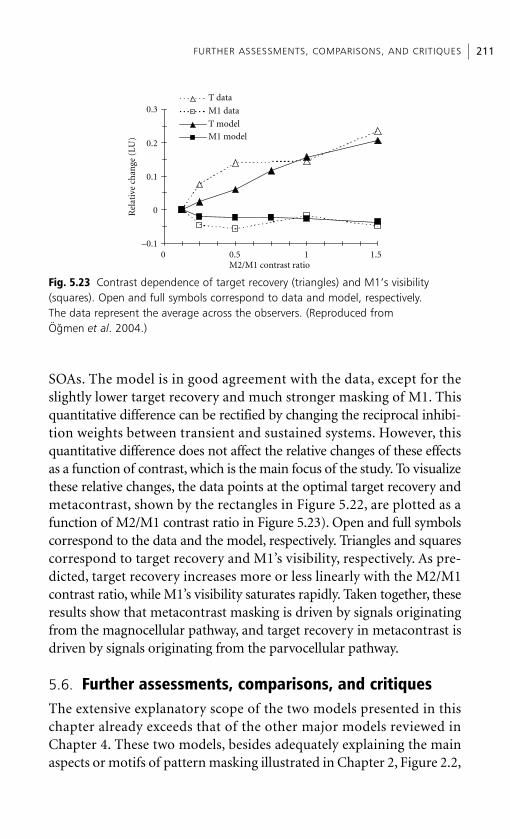
SOAs. The model is in good agreement with the data, except for theslightly lower target recovery and much stronger masking of M1. Thisquantitative difference can be rectified by changing the reciprocal inhibi-tion weights between transient and sustained systems. However, thisquantitative difference does not affect the relative changes of these effectsas a function of contrast, which is the main focus of the study. To visualizethese relative changes, the data points at the optimal target recovery andmetacontrast, shown by the rectangles in Figure 5.22, are plotted as afunction of M2/M1 contrast ratio in Figure 5.23). Open and full symbolscorrespond to the data and the model, respectively. Triangles and squarescorrespond to target recovery and M1’s visibility, respectively. As pre-dicted, target recovery increases more or less linearly with the M2/M1contrast ratio, while M1’s visibility saturates rapidly. Taken together, theseresults show that metacontrast masking is driven by signals originatingfrom the magnocellular pathway, and target recovery in metacontrast isdriven by signals originating from the parvocellular pathway.
5.6. Further assessments, comparisons, and critiquesThe extensive explanatory scope of the two models presented in thischapter already exceeds that of the other major models reviewed inChapter 4. These two models, besides adequately explaining the mainaspects or motifs of pattern masking illustrated in Chapter 2, Figure 2.2,
FURTHER ASSESSMENTS, COMPARISONS, AND CRITIQUES 211
0.5 1
T data
M1 data
T model
M1 model
0
0.1
0.2R
elat
ive
chan
ge (
LU)
–0.1
0.3
0 1.5M2/M1 contrast ratio
Fig. 5.23 Contrast dependence of target recovery (triangles) and M1’s visibility(squares). Open and full symbols correspond to data and model, respectively. The data represent the average across the observers. (Reproduced from Ögmen et al. 2004.)
can also give adequate accounts of many variations on those motifs,which reflect mainly the effects of correlated variations of boundaryconditions such as wavelength, intensity, spatial frequency, retinaleccentricity, etc. on the responses of transient and sustained cells. Theeffects of each of these variables can be specified on the basis of eitherelectrophysiological or related psychophysical results.
The most closely related of the models reviewed in this and theprevious chapter are Breitmeyer’s sustained–transient model andÖgmen’s RECOD model. The revised version (Weisstein et al. 1975) ofWeisstein’s original Rashevsky–Landahl neural-net simulation ofmetacontrast (Weisstein 1968, 1972) also has similarities with thesemodels. Weisstein’s older model was a fast-inhibition slow-excitationmodel. In the newer version it is realized, for metacontrast, bytransient-on-sustained inhibition of the non-recurrent forward type(negative feedforward as opposed to recurrent inhibition or negativefeedback) and for paracontrast by the reverse sustained-on-transientinhibition, implicitly also of the non-recurrent forward type. Theseassumed reciprocal inhibitory mechanisms correspond to Assumption3 specifying Breitmeyer and Ganz’s model (see section 5.3). Moreover,as noted in Chapter 4, the revised version by Weisstein et al. (1975)explicitly incorporates the symmetrical physiological masking effectsthat the stimuli arbitrarily designated as ‘target’ and ‘mask’ can exerton each other. This assumption of the model of Weisstein et al. corres-ponds to Assumption 1 of Breitmeyer and Ganz’s model. Where themodels differ is in combined Assumptions 2 and 4, which in Breitmeyerand Ganz’s model states that paracontrast is realized via intra-channelinhibition, effected particularly in sustained channels, rather thanWeisstein et al.’s corresponding assumption of inter-channel, sustained-on-transient inhibition. Only future research can decide on which ofthe two alternatives is more viable in explaining paracontrast bright-ness suppression. Even if the intra-channel hypothesis is correct, thisdoes not necessarily imply that sustained-on-transient inhibition failsto manifest itself in pattern masking; in fact, as shown in explanation(31) above and Chapter 8, section 8.2, this particular inter-channelinhibition can manifest itself in the recovery or disinhibition of thetarget rather than in target-masking effects. Moreover, as argued inexplanation (1) above, it may also he involved in a suppression of thecff of the second of two spatially adjacent repetitively flashed stimuli.
THE SUSTAINED–TRANSIENT CHANNEL APPROACH 212
However, as it stands now, Weisstein et al.’s model cannot adequatelyaccount for the absence of type B metacontrast when simple reactiontime or detection rather than brightness perception are used as crit-erion responses. This is because her initially activated primary targetand mask neurons n1 and n21 (see Fig. 5.1) produce a single responseto each stimulus and therefore cannot differentiate between fasttransient activity and separate slow sustained activity. Moreover, at thelevel of the secondary neurons where the first differentiation of fast(transient) and slow (sustained) activity is specified, the fast activityacts only to inhibit the central tertiary slow activity laterally withoutitself being separately channelled to a central tertiary detector level.Hence the fast activity serves only to produce type B metacontrastbrightness or contrast suppression, but does not serve to detect themere presence or location of the target as would be required to accountfor the fact that simple reaction time and target detection tasks yield nometacontrast. Of course, minor modifications of Weisstein et al.’smodel could incorporate these required features.
The similarity between Matin’s (1975) model and the sustained–transient models is more remote, particularly in regard to her model’srequired activation of T–M neurons. In so far as Matin identifies T–Mneurons with transient ones and T neurons with sustained ones, herassumption of a shorter response latency of T–M neurons comparedwith T neurons does bear a similarity to the sustained–transientmodel. In fact, this latter hypothesized response latency differencewhen combined with inter-channel inhibition is essentially equivalentto Assumptions 1 and 3 of the sustained–transient model and thefast-inhibition hypothesis of the model of Weisstein et al. (1975).Consequently, based on these similarities, the three models would, atleast qualitatively, make the same predictions of type B metacontrastvariations with experimental variations of the stimulus conditionslisted in the relevant explanations reviewed in section 5.5.
As noted before, although the RECOD model starts from a dif-ferent perspective, it converges to a structure very similar to thesustained–transient model. Furthermore, it expands the sustained–transient model by incorporating recent neurophysiological findingson afferent and cortical networks, by incorporating feedback mech-anisms, by proposing additional feedforward, feedback-dominantphases of operation, by explicitly incorporating a network structure, by
FURTHER ASSESSMENTS, COMPARISONS, AND CRITIQUES 213
formulating a functional dynamic system framework, and by providinga quantitative description that can be simulated and compared directlywith experimental data.
The feedback structure of the RECOD model makes this class ofmodels more comparable to other feedback models reviewed inChapter 4. Nonetheless, the dual-channel aspect of this model makesit significantly different from Bridgeman’s (1971, 1977, 1978) neural-network model, Ganz’s (1975) trace decay–lateral inhibition model,and the non-neural models of Reeves (1981) or Navon and Purcell(1981) discussed in Chapter 4. None of the neural or non-neuralmodels incorporate the distinction between transient responsecomponents and slow sustained ones which can reciprocally inhibiteach other. Specifically, Bridgeman’s model is based on a single-channelrather than dual-channel approach. His Hartline–Ratliff neural netmodel assumes a spatially and temporally isotropic excitatory–inhibitory interactive net, for example like that characterizing the eyeof Limulus. A time constant, tying the latency of lateral inhibition, anda space constant, specifying the variations of lateral interaction withvariations of spatial separation between the target and mask, character-ize the lateral inhibitory network. The role of lateral inhibition is notto suppress the target’s pattern information, and thus decrease itssignal-to-noise ratio, as in the dual-channel models, but rather todistribute and store target–mask pattern information in the network’sbriefly persisting spatiotemporal activity. As a consequence, the role ofthe mask activity, rather than to suppress the target activity, is to buryor alter it in the persisting spatiotemporal distribution of combinedtarget and mask activities, thus reducing the target’s signal-to-noiseratio by increasing the mask-generated noise. It is the subsequentprocess of template matching or cross-correlation of this combinediconic representation (Bridgeman 1978) with a more permanentlystored target representation, rather than any latency differencesbetween antagonistic target and mask response components, whichyields the type B metacontrast (and paracontrast) functions. Hence itshould be apparent that the dual-channel neural models andBridgeman’s single-channel model of lateral masking are conceptuallyquite distinct. The RECOD model incorporates feedback (recurrent)connections as in Bridgeman’s model because they are viewed asessential components of visual information processing. However, it
THE SUSTAINED–TRANSIENT CHANNEL APPROACH 214
incorporates a dual-channel structure to avoid the type of spatiotem-poral blurring that occurs in Bridgeman’s model so that perceptualdynamics can be organized into transient epochs in which stimuli canbe processed individually. Let us note that the problem of blurringbetween the target and mask processing also exist in the re-entrantmodel of Enns and DiLollo. In the simulations of their model, Di Lolloet al. (2000, p. 497) state that ‘At the outset of a new series of iterativecycles, corresponding to the onset of a new perceptual event, thecontents of W [working space] are reset to zero’. Thus the fundamentalproblem of delineating perceptual cycles corresponding to newperceptual events is done by the modeler and not by the model itself.When a reset mechanism is incorporated directly into the model, as inRECOD, type B backward pattern masking becomes an emergentproperty of the model, which in turn relegates other mechanisms, suchas attention, to secondary modulatory roles.
5.7. SummaryA review of psychophysical studies of spatiotemporal properties ofhuman vision, as measured by separate pattern and movement orflicker thresholds, temporal integration and persistence, reaction time,and the effects of flicker adaptation, all as a function of spatialfrequency, points to the existence of sustained and transient channelsin the visual system of humans. The existence of sustained and transientchannels is also supported by primate neurophysiological data showingtwo parallel afferent pathways with similar characteristics. Thetwo models discussed in this chapter are based on a dual-channelsustained/transient structure.
Breitmeyer’s original masking model was based on five majorassumptions or initial conditions.
1. Both target and mask stimuli activate sustained and transient channels.
2. Within channels, inhibition is realized via the center–surroundantagonism of neural receptive fields.
3. Mutual and reciprocal inhibition exists between transient andsustained channels.
4. Masking occurs in one of three ways: (i) via intra-channelinhibition, (ii) via inter-channel inhibition, and (iii) via sharing in
SUMMARY 215
common sustained or transient pathways of the respective neuralactivities generated by spatially overlapping target and maskstimuli.
5. Whereas transient channels primarily signal the sudden appearanceat a given location or the sudden change of location (motion) of astimulus, sustained cells process its figural attributes such asbrightness, contrast, and contour.
The RECOD model expands the sustained–transient model byincorporating recent neurophysiological findings on afferent andcortical networks, by incorporating feedback mechanisms, by propos-ing additional feedforward, feedback-dominant phases of operation,by explicitly incorporating a network structure, by formulating afunctional dynamic system framework, and by providing a quantitativedescription that can be simulated and compared directly with experi-mental data. This model can give an adequate account of the widerange of visual masking phenomena discussed throughout this book.
Notes1. A third type of retino-geniculate-cortical pathway is the koniocellular pathway
(reviewed by Hendry and Reid 2000). Currently, relatively little is known about thispathway with respect to the other two pathways. The properties of cells in this pathwaytend to be more mixed and typically intermediate between M and P cells.
2. Initially, the cat X/Y classification was considered analogous to primate P/M classification. However, more recent research suggested that M cells would be representative of cat X and Y cells while the primate P cell would represent a new group specific to primates (Benardete et al. 1992).
3. Burbeck (1981) reported that, when using a criterion-free forced-choice procedure,pattern thresholds were actually lower than flicker thresholds, contrary to the reportsof Tolhurst (1973) and Kulikowski and Tolhurst (1973). Burbeck’s (1981) criterion-freeprocedure employed the following rationale. In order to establish pattern-detectionthresholds of a counterphase flickering grating, observers were asked to discriminatebetween the counterphase grating and a uniform field flickering at the same temporalfrequency and set slightly above threshold contrast. Conversely, to establish flickerthresholds of a counterphase flickering grating, observers were asked to discriminatebetween the counterphase grating and a stationary grating of the same spatial frequency also set slightly above threshold.
Let us examine the pattern threshold procedure first. In our own observations,a counterphase flickering (or moving) grating does not mimic uniform field flickerunless the grating is of sufficiently low spatial frequency; in fact, at higher frequenciesone usually sees a ‘ripple’ effect at threshold spread throughout the viewing field ratherthan uniform field flicker. Since Burbeck (1981) used a field of diameter 8º and a lowest
THE SUSTAINED–TRANSIENT CHANNEL APPROACH 216
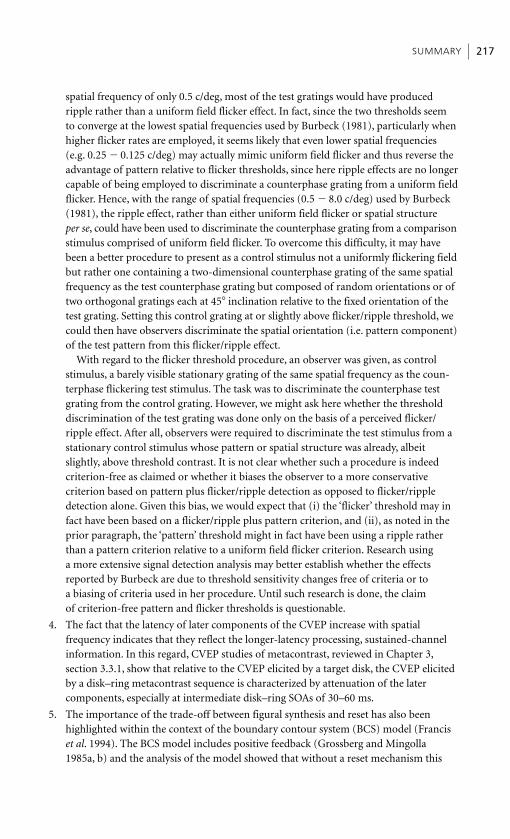
spatial frequency of only 0.5 c/deg, most of the test gratings would have produced ripple rather than a uniform field flicker effect. In fact, since the two thresholds seemto converge at the lowest spatial frequencies used by Burbeck (1981), particularly whenhigher flicker rates are employed, it seems likely that even lower spatial frequencies(e.g. 0.25 � 0.125 c/deg) may actually mimic uniform field flicker and thus reverse theadvantage of pattern relative to flicker thresholds, since here ripple effects are no longercapable of being employed to discriminate a counterphase grating from a uniform fieldflicker. Hence, with the range of spatial frequencies (0.5 � 8.0 c/deg) used by Burbeck(1981), the ripple effect, rather than either uniform field flicker or spatial structureper se, could have been used to discriminate the counterphase grating from a comparisonstimulus comprised of uniform field flicker. To overcome this difficulty, it may havebeen a better procedure to present as a control stimulus not a uniformly flickering fieldbut rather one containing a two-dimensional counterphase grating of the same spatialfrequency as the test counterphase grating but composed of random orientations or oftwo orthogonal gratings each at 45� inclination relative to the fixed orientation of thetest grating. Setting this control grating at or slightly above flicker/ripple threshold, wecould then have observers discriminate the spatial orientation (i.e. pattern component)of the test pattern from this flicker/ripple effect.
With regard to the flicker threshold procedure, an observer was given, as controlstimulus, a barely visible stationary grating of the same spatial frequency as the coun-terphase flickering test stimulus. The task was to discriminate the counterphase testgrating from the control grating. However, we might ask here whether the thresholddiscrimination of the test grating was done only on the basis of a perceived flicker/ripple effect. After all, observers were required to discriminate the test stimulus from astationary control stimulus whose pattern or spatial structure was already, albeitslightly, above threshold contrast. It is not clear whether such a procedure is indeed criterion-free as claimed or whether it biases the observer to a more conservative criterion based on pattern plus flicker/ripple detection as opposed to flicker/rippledetection alone. Given this bias, we would expect that (i) the ‘flicker’ threshold may infact have been based on a flicker/ripple plus pattern criterion, and (ii), as noted in theprior paragraph, the ‘pattern’ threshold might in fact have been using a ripple ratherthan a pattern criterion relative to a uniform field flicker criterion. Research usinga more extensive signal detection analysis may better establish whether the effectsreported by Burbeck are due to threshold sensitivity changes free of criteria or to a biasing of criteria used in her procedure. Until such research is done, the claim of criterion-free pattern and flicker thresholds is questionable.
4. The fact that the latency of later components of the CVEP increase with spatial frequency indicates that they reflect the longer-latency processing, sustained-channelinformation. In this regard, CVEP studies of metacontrast, reviewed in Chapter 3,section 3.3.1, show that relative to the CVEP elicited by a target disk, the CVEP elicitedby a disk–ring metacontrast sequence is characterized by attenuation of the later components, especially at intermediate disk–ring SOAs of 30–60 ms.
5. The importance of the trade-off between figural synthesis and reset has also been highlighted within the context of the boundary contour system (BCS) model (Franciset al. 1994). The BCS model includes positive feedback (Grossberg and Mingolla 1985a, b) and the analysis of the model showed that without a reset mechanism this
SUMMARY 217
feedback causes extensive persistence (Francis et al. 1994). In the BCS model, a competition between orientationally selective (cortical) mechanisms implements thereset. Francis and colleagues showed that this reset mechanism can form the basis ofseveral visual illusions (Francis and Kim 1999; 2001; Francis and Rothmayer 2003;Kim and Francis 1998).
Given that numerous cortical feedback circuits exist, it is highly likely that the nervous system uses multiple reset mechanisms. In the RECOD model, we used a reset mechanism that is outside the feedback loops and directly driven by the externalinput. A static input can generate time-varying cortical activity, such as oscillatorypotentials. Since the transient activity in the M pathway is closely related to the transients of the input (rather than intrinsic cortical time-varying activity), our resetmechanism is designed so that intrinsic cortical time-varying activity does not interfere with figural synthesis. On the other hand, a reset mechanism such as the oneused in the BCS model can account for bistable percepts, i.e. switches in perceptualorganization in response to certain static stimuli.
THE SUSTAINED–TRANSIENT CHANNEL APPROACH 218
Chapter 6
Metacontrast and motionperception
6.1. IntroductionAs discussed in Chapter 1, section 1.3.2, similarities between maskingand stroboscopic motion were noted by early investigators suchas Wertheimer. From the perspective of the stimulus, studies ofmetacontrast and motion typically use very similar displays consistingof sequential stimulation of adjacent spatial positions. However, onedistinction is that a typical motion stimulus is spatially asymmetric,i.e. directional (e.g. proceeding from left to right), while a typicalmetacontrast stimulus is symmetric (e.g. a disk and a surroundingring). In Chapter 4, section 4.2, we reviewed theoretical approaches tometacontrast based on activation of spatiotemporal sequence ormotion detectors. In the current chapter we revisit only the approachadopted by Burr and coworkers (Burr 1984; Burr et al. 1986) and theRECOD model discussed in the previous chapter, as they are mostrelevant to the topics covered here.
The perceived clarity/blur of moving targets is another phenom-enon that reveals a close relationship between metacontrast andmotion. A briefly presented stimulus remains visible for a significanttime period after its offset, a phenomenon known as visible persist-ence (see Chapter 1, section 1.5). A direct application of visiblepersistence to moving stimuli would predict that moving targetsshould appear highly blurred. This is analogous to taking picturesof moving objects at low shutter speeds. Yet under normal viewingconditions, the perceived blur of moving targets is negligiblewhen compared with estimates derived from the duration of visiblepersistence. This phenomenon is known as motion deblurring(Burr 1980).

6.2. Motion deblurring and metacontrast
6.2.1. Basic findings
Several studies have shown that the visual persistence of stationarytargets is approximately 120 ms under daylight viewing conditions(Haber and Standing 1970; see also Coltheart 1980). Based on this dura-tion of visual persistence, we would expect that moving objects shouldappear highly smeared. For example, a target moving at a speed of 10�/sshould generate a comet-like trailing smear of extent 1.2�. However,under normal viewing conditions, objects in motion usually look sharpand clear, even if the moving object is physically blurred to some degree(Bex et al. 1994; Hammet 1997; Ramachandran et al. 1974). Burr (1980)and Hogben and Di Lollo (1985) measured the perceived extent of themotion smear produced by a field of moving dots as a function ofexposure duration. For exposure durations shorter than approximately40 ms, the extent of perceived smear increased with exposure duration,as would be expected from the visible persistence of static objects.However, for exposure durations longer than 40 ms, the length of theperceived smear was much less than predicted from the persistence ofstatic displays. This reduction of perceived smear for moving objects iscalled ‘motion deblurring’ (Burr 1980).
Contrary to the reports of motion deblurring, it has long beenknown that isolated targets in real motion exhibit extensive smear,within which lighter and darker regions known as Charpentier’s bands(see Chapter 1, Fig. 1.2(b)) can often be identified (Bidwell 1899;McDougall 1904a). The phenomenon was described by McDougallas follows:
A radial slit 2� in width and 7 cm in length, its mid point 15 cm from the center of thedisk, rotating at the rate of 1 rev per 3� before the glass lit by four burners, appears asa fanlike bundle of narrow bright rays of diminishing brightness from before back-wards. Four such rays can usually be distinguished with certainty at this speed [about9�/s]. They are not separated by distinct dark intervals but appear to overlap oneanother, and together they fill a sector about 12� width [equivalent to a duration of100 ms]. (McDougall 1904a, p. 91)
Isolated targets in sampled motion also exhibit prolonged persistence,particularly when the spatial separation between successively presentedtargets is greater than about 10� (Castet 1994; Di Lollo and Hogben1985; Dixon and Hammond 1972; Farrell 1984; Farrell et al. 1990).
METACONTRAST AND MOTION PERCEPTION220
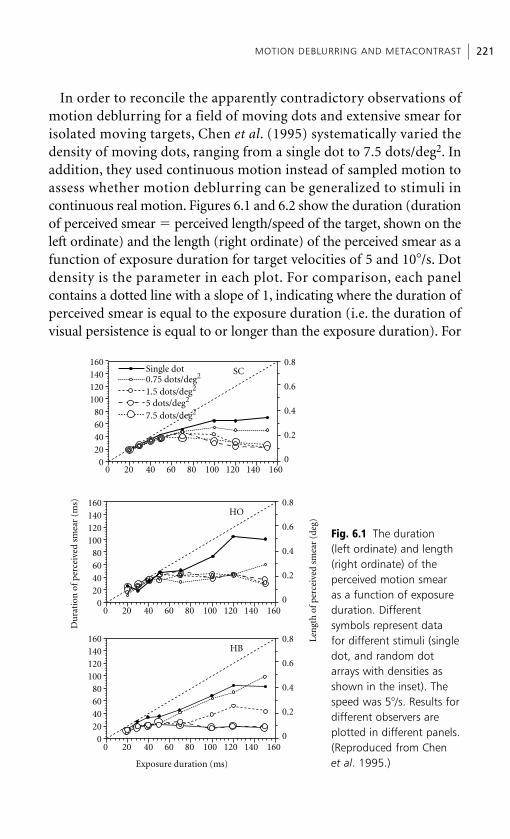
In order to reconcile the apparently contradictory observations ofmotion deblurring for a field of moving dots and extensive smear forisolated moving targets, Chen et al. (1995) systematically varied thedensity of moving dots, ranging from a single dot to 7.5 dots/deg2. Inaddition, they used continuous motion instead of sampled motion toassess whether motion deblurring can be generalized to stimuli incontinuous real motion. Figures 6.1 and 6.2 show the duration (durationof perceived smear � perceived length/speed of the target, shown on theleft ordinate) and the length (right ordinate) of the perceived smear as afunction of exposure duration for target velocities of 5 and 10�/s. Dotdensity is the parameter in each plot. For comparison, each panelcontains a dotted line with a slope of 1, indicating where the duration ofperceived smear is equal to the exposure duration (i.e. the duration ofvisual persistence is equal to or longer than the exposure duration). For
MOTION DEBLURRING AND METACONTRAST 221
SCSingle dot0.75 dots/deg2
7.5 dots/deg25 dots/deg21.5 dots/deg2
0 20 40 60 80 100 120 140 160
0.8
0.6
0.4
0.2
0
HO
0 20 40 60 80 100 120 140 160
0.8
0.6
0.4
0.2
0
Du
rati
on o
f per
ceiv
ed s
mea
r (m
s)
Len
gth
of p
erce
ived
sm
ear
(deg
)
HB160140120100
80604020
0
160140120100
80604020
0
160140120100
80604020
0
0 20 40 60 80 100 120 140 160
0.8
0.6
0.4
0.2
0
Exposure duration (ms)
Fig. 6.1 The duration (left ordinate) and length(right ordinate) of the perceived motion smear as a function of exposureduration. Different symbols represent data for different stimuli (singledot, and random dotarrays with densities asshown in the inset). Thespeed was 5�/s. Results fordifferent observers areplotted in different panels.(Reproduced from Chenet al. 1995.)
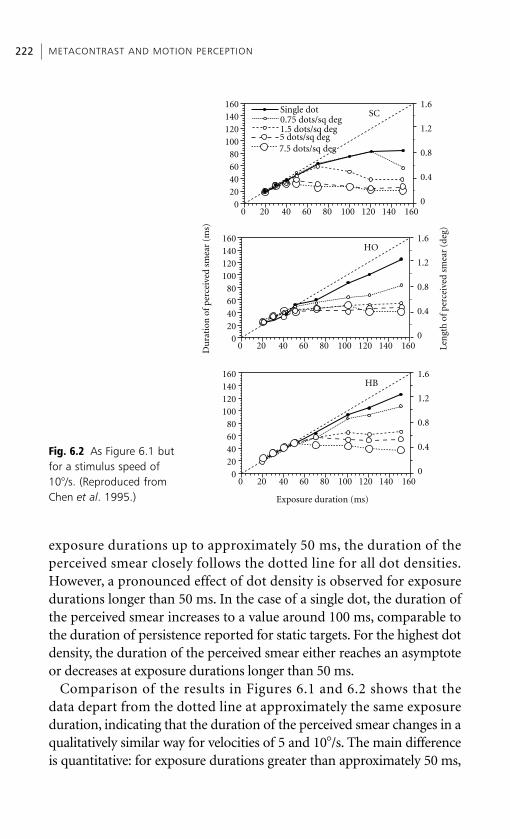
exposure durations up to approximately 50 ms, the duration of theperceived smear closely follows the dotted line for all dot densities.However, a pronounced effect of dot density is observed for exposuredurations longer than 50 ms. In the case of a single dot, the duration ofthe perceived smear increases to a value around 100 ms, comparable tothe duration of persistence reported for static targets. For the highest dotdensity, the duration of the perceived smear either reaches an asymptoteor decreases at exposure durations longer than 50 ms.
Comparison of the results in Figures 6.1 and 6.2 shows that thedata depart from the dotted line at approximately the same exposureduration, indicating that the duration of the perceived smear changes in aqualitatively similar way for velocities of 5 and 10�/s. The main differenceis quantitative: for exposure durations greater than approximately 50 ms,
METACONTRAST AND MOTION PERCEPTION222
SCSingle dot0.75 dots/sq deg
7.5 dots/sq deg5 dots/sq deg1.5 dots/sq deg
0 20 40 60 80 100 120 140 160
1.6
1.2
0.8
0.4
0
HO
0 20 40 60 80 100 120 140 160
1.6
1.2
0.8
0.4
0
HB160140120100
80604020
0
160140120100
80604020
0
160140120100
80604020
0
0 20 40 60 80 100 120 140 160
1.6
1.2
0.8
0.4
0
Exposure duration (ms)
Du
rati
on o
f per
ceiv
ed s
mea
r (m
s)
Len
gth
of p
erce
ived
sm
ear
(deg
)Fig. 6.2 As Figure 6.1 butfor a stimulus speed of10�/s. (Reproduced fromChen et al. 1995.)
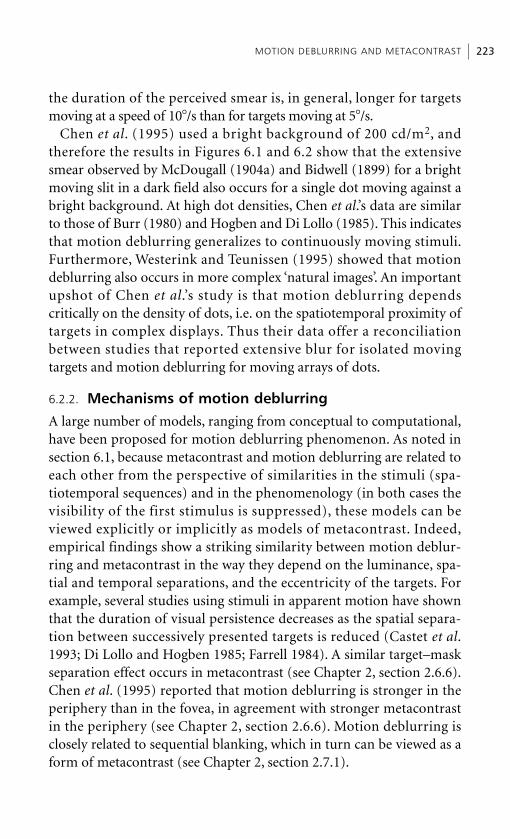
the duration of the perceived smear is, in general, longer for targetsmoving at a speed of 10�/s than for targets moving at 5�/s.
Chen et al. (1995) used a bright background of 200 cd/m2, andtherefore the results in Figures 6.1 and 6.2 show that the extensivesmear observed by McDougall (1904a) and Bidwell (1899) for a brightmoving slit in a dark field also occurs for a single dot moving against abright background. At high dot densities, Chen et al.’s data are similarto those of Burr (1980) and Hogben and Di Lollo (1985). This indicatesthat motion deblurring generalizes to continuously moving stimuli.Furthermore, Westerink and Teunissen (1995) showed that motiondeblurring also occurs in more complex ‘natural images’. An importantupshot of Chen et al.’s study is that motion deblurring dependscritically on the density of dots, i.e. on the spatiotemporal proximity oftargets in complex displays. Thus their data offer a reconciliationbetween studies that reported extensive blur for isolated movingtargets and motion deblurring for moving arrays of dots.
6.2.2. Mechanisms of motion deblurring
A large number of models, ranging from conceptual to computational,have been proposed for motion deblurring phenomenon. As noted insection 6.1, because metacontrast and motion deblurring are related toeach other from the perspective of similarities in the stimuli (spa-tiotemporal sequences) and in the phenomenology (in both cases thevisibility of the first stimulus is suppressed), these models can beviewed explicitly or implicitly as models of metacontrast. Indeed,empirical findings show a striking similarity between motion deblur-ring and metacontrast in the way they depend on the luminance, spa-tial and temporal separations, and the eccentricity of the targets. Forexample, several studies using stimuli in apparent motion have shownthat the duration of visual persistence decreases as the spatial separa-tion between successively presented targets is reduced (Castet et al.1993; Di Lollo and Hogben 1985; Farrell 1984). A similar target–maskseparation effect occurs in metacontrast (see Chapter 2, section 2.6.6).Chen et al. (1995) reported that motion deblurring is stronger in theperiphery than in the fovea, in agreement with stronger metacontrastin the periphery (see Chapter 2, section 2.6.6). Motion deblurring isclosely related to sequential blanking, which in turn can be viewed as aform of metacontrast (see Chapter 2, section 2.7.1).
MOTION DEBLURRING AND METACONTRAST 223
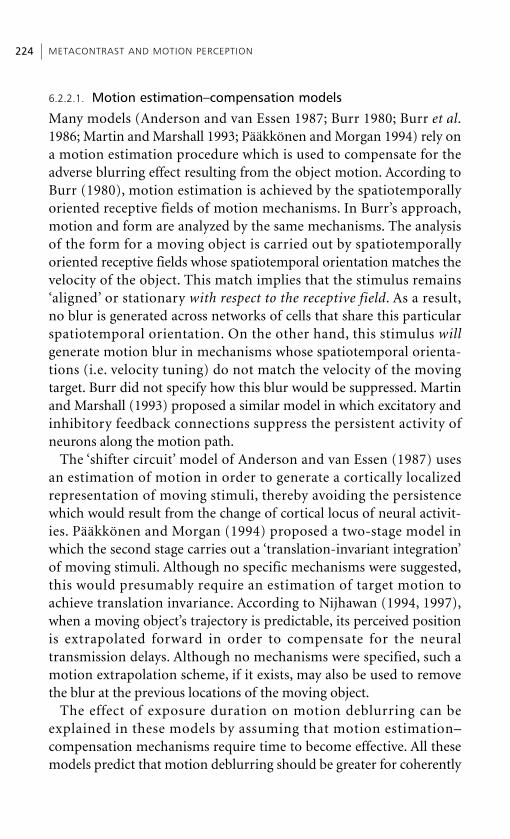
6.2.2.1. Motion estimation–compensation models
Many models (Anderson and van Essen 1987; Burr 1980; Burr et al.1986; Martin and Marshall 1993; Pääkkönen and Morgan 1994) rely ona motion estimation procedure which is used to compensate for theadverse blurring effect resulting from the object motion. According toBurr (1980), motion estimation is achieved by the spatiotemporallyoriented receptive fields of motion mechanisms. In Burr’s approach,motion and form are analyzed by the same mechanisms. The analysisof the form for a moving object is carried out by spatiotemporallyoriented receptive fields whose spatiotemporal orientation matches thevelocity of the object. This match implies that the stimulus remains‘aligned’ or stationary with respect to the receptive field. As a result,no blur is generated across networks of cells that share this particularspatiotemporal orientation. On the other hand, this stimulus willgenerate motion blur in mechanisms whose spatiotemporal orienta-tions (i.e. velocity tuning) do not match the velocity of the movingtarget. Burr did not specify how this blur would be suppressed. Martinand Marshall (1993) proposed a similar model in which excitatory andinhibitory feedback connections suppress the persistent activity ofneurons along the motion path.
The ‘shifter circuit’ model of Anderson and van Essen (1987) usesan estimation of motion in order to generate a cortically localizedrepresentation of moving stimuli, thereby avoiding the persistencewhich would result from the change of cortical locus of neural activit-ies. Pääkkönen and Morgan (1994) proposed a two-stage model inwhich the second stage carries out a ‘translation-invariant integration’of moving stimuli. Although no specific mechanisms were suggested,this would presumably require an estimation of target motion toachieve translation invariance. According to Nijhawan (1994, 1997),when a moving object’s trajectory is predictable, its perceived positionis extrapolated forward in order to compensate for the neuraltransmission delays. Although no mechanisms were specified, such amotion extrapolation scheme, if it exists, may also be used to removethe blur at the previous locations of the moving object.
The effect of exposure duration on motion deblurring can beexplained in these models by assuming that motion estimation–compensation mechanisms require time to become effective. All thesemodels predict that motion deblurring should be greater for coherently
METACONTRAST AND MOTION PERCEPTION224
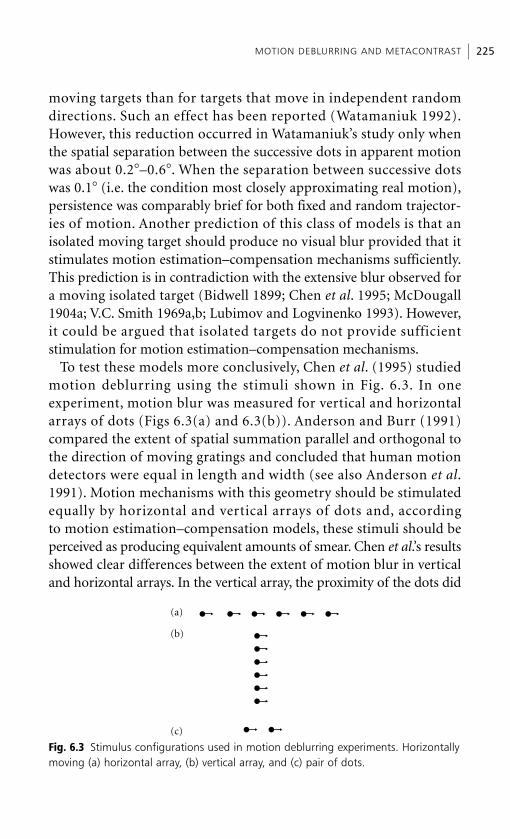
moving targets than for targets that move in independent randomdirections. Such an effect has been reported (Watamaniuk 1992).However, this reduction occurred in Watamaniuk’s study only whenthe spatial separation between the successive dots in apparent motionwas about 0.2�–0.6�. When the separation between successive dotswas 0.1� (i.e. the condition most closely approximating real motion),persistence was comparably brief for both fixed and random trajector-ies of motion. Another prediction of this class of models is that anisolated moving target should produce no visual blur provided that itstimulates motion estimation–compensation mechanisms sufficiently.This prediction is in contradiction with the extensive blur observed fora moving isolated target (Bidwell 1899; Chen et al. 1995; McDougall1904a; V.C. Smith 1969a,b; Lubimov and Logvinenko 1993). However,it could be argued that isolated targets do not provide sufficientstimulation for motion estimation–compensation mechanisms.
To test these models more conclusively, Chen et al. (1995) studiedmotion deblurring using the stimuli shown in Fig. 6.3. In oneexperiment, motion blur was measured for vertical and horizontalarrays of dots (Figs 6.3(a) and 6.3(b)). Anderson and Burr (1991)compared the extent of spatial summation parallel and orthogonal tothe direction of moving gratings and concluded that human motiondetectors were equal in length and width (see also Anderson et al.1991). Motion mechanisms with this geometry should be stimulatedequally by horizontal and vertical arrays of dots and, accordingto motion estimation–compensation models, these stimuli should beperceived as producing equivalent amounts of smear. Chen et al.’s resultsshowed clear differences between the extent of motion blur in verticaland horizontal arrays. In the vertical array, the proximity of the dots did
MOTION DEBLURRING AND METACONTRAST 225
(a)
(b)
(c)
Fig. 6.3 Stimulus configurations used in motion deblurring experiments. Horizontallymoving (a) horizontal array, (b) vertical array, and (c) pair of dots.
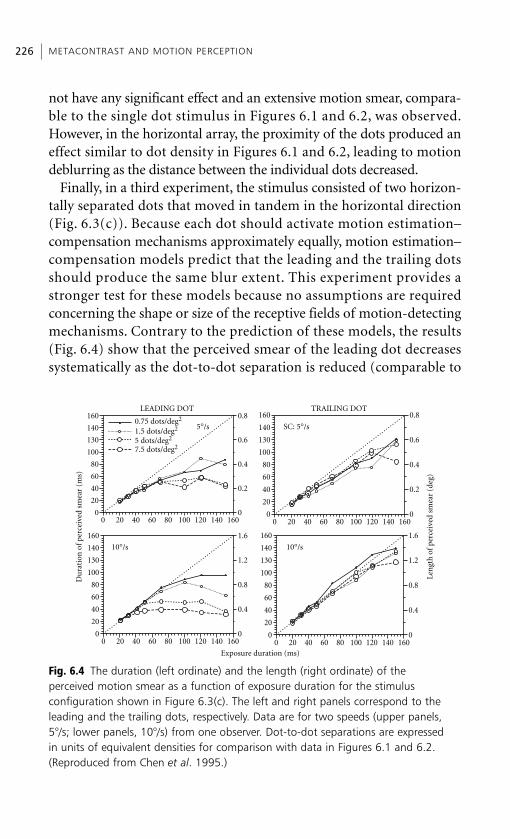
not have any significant effect and an extensive motion smear, compara-ble to the single dot stimulus in Figures 6.1 and 6.2, was observed.However, in the horizontal array, the proximity of the dots produced aneffect similar to dot density in Figures 6.1 and 6.2, leading to motiondeblurring as the distance between the individual dots decreased.
Finally, in a third experiment, the stimulus consisted of two horizon-tally separated dots that moved in tandem in the horizontal direction(Fig. 6.3(c)). Because each dot should activate motion estimation–compensation mechanisms approximately equally, motion estimation–compensation models predict that the leading and the trailing dotsshould produce the same blur extent. This experiment provides astronger test for these models because no assumptions are requiredconcerning the shape or size of the receptive fields of motion-detectingmechanisms. Contrary to the prediction of these models, the results(Fig. 6.4) show that the perceived smear of the leading dot decreasessystematically as the dot-to-dot separation is reduced (comparable to
METACONTRAST AND MOTION PERCEPTION226
1600.75 dots/deg2
1.5 dots/deg2 5°/s
10°/s 10°/s
SC: 5°/s
5 dots/deg2
7.5 dots/deg2
140
130
100
80
60
40
20
0
0.8
0.6
0.4
0.2
00 20 40 60 80 100 120
Exposure duration (ms)
LEADING DOT TRAILING DOT
Du
rati
on o
f per
ceiv
ed s
mea
r (m
s)
Len
gth
of p
erce
ived
sm
ear
(deg
)
140 160
160
140
130
100
80
60
40
20
0
0.8
0.6
0.4
0.2
00 20 40 60 80 100 120 140 160
160
140
130
100
80
60
40
20
0
1.6
1.2
0.8
0.4
00 20 40 60 80 100 120 140 160
160
140
130
100
80
60
40
20
0
1.6
1.2
0.8
0.4
00 20 40 60 80 100 120 140 160
Fig. 6.4 The duration (left ordinate) and the length (right ordinate) of the perceived motion smear as a function of exposure duration for the stimulus configuration shown in Figure 6.3(c). The left and right panels correspond to theleading and the trailing dots, respectively. Data are for two speeds (upper panels,5�/s; lower panels, 10�/s) from one observer. Dot-to-dot separations are expressed in units of equivalent densities for comparison with data in Figures 6.1 and 6.2.(Reproduced from Chen et al. 1995.)
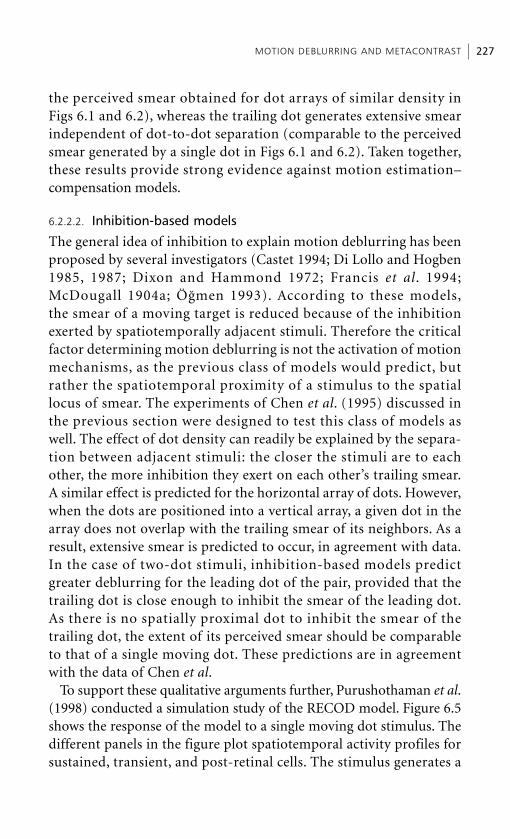
the perceived smear obtained for dot arrays of similar density inFigs 6.1 and 6.2), whereas the trailing dot generates extensive smearindependent of dot-to-dot separation (comparable to the perceivedsmear generated by a single dot in Figs 6.1 and 6.2). Taken together,these results provide strong evidence against motion estimation–compensation models.
6.2.2.2. Inhibition-based models
The general idea of inhibition to explain motion deblurring has beenproposed by several investigators (Castet 1994; Di Lollo and Hogben1985, 1987; Dixon and Hammond 1972; Francis et al. 1994;McDougall 1904a; Ögmen 1993). According to these models,the smear of a moving target is reduced because of the inhibitionexerted by spatiotemporally adjacent stimuli. Therefore the criticalfactor determining motion deblurring is not the activation of motionmechanisms, as the previous class of models would predict, butrather the spatiotemporal proximity of a stimulus to the spatiallocus of smear. The experiments of Chen et al. (1995) discussed inthe previous section were designed to test this class of models aswell. The effect of dot density can readily be explained by the separa-tion between adjacent stimuli: the closer the stimuli are to eachother, the more inhibition they exert on each other’s trailing smear.A similar effect is predicted for the horizontal array of dots. However,when the dots are positioned into a vertical array, a given dot in thearray does not overlap with the trailing smear of its neighbors. As aresult, extensive smear is predicted to occur, in agreement with data.In the case of two-dot stimuli, inhibition-based models predictgreater deblurring for the leading dot of the pair, provided that thetrailing dot is close enough to inhibit the smear of the leading dot.As there is no spatially proximal dot to inhibit the smear of thetrailing dot, the extent of its perceived smear should be comparableto that of a single moving dot. These predictions are in agreementwith the data of Chen et al.
To support these qualitative arguments further, Purushothaman et al.(1998) conducted a simulation study of the RECOD model. Figure 6.5shows the response of the model to a single moving dot stimulus. Thedifferent panels in the figure plot spatiotemporal activity profiles forsustained, transient, and post-retinal cells. The stimulus generates a
MOTION DEBLURRING AND METACONTRAST 227
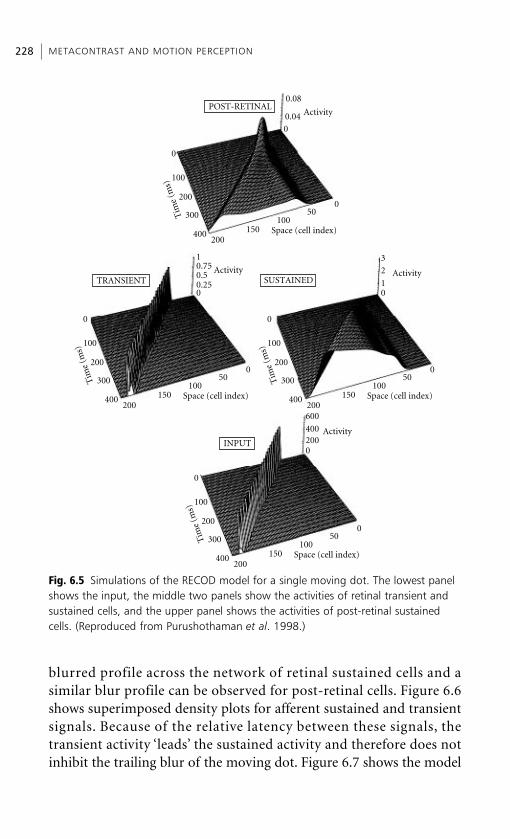
blurred profile across the network of retinal sustained cells and asimilar blur profile can be observed for post-retinal cells. Figure 6.6shows superimposed density plots for afferent sustained and transientsignals. Because of the relative latency between these signals, thetransient activity ‘leads’ the sustained activity and therefore does notinhibit the trailing blur of the moving dot. Figure 6.7 shows the model
METACONTRAST AND MOTION PERCEPTION228
0.08
10.75
0.250 0
0200400
600
1
2
3
0.5
0.04 Activity
Activity Activity
Activity
POST-RETINAL
TRANSIENT SUSTAINED
INPUT
0
050
100
200400
300
200
Space (cell index)
Tim
e (m
s)100
0
150
050
100
200400
300
200
Space (cell index)
Tim
e (m
s)
100
0
150
050
100
200400
300
200
Space (cell index)
Tim
e (m
s)
100
0
150
050
100
200400
300
200
Space (cell index)
Tim
e (m
s)
100
0
150
Fig. 6.5 Simulations of the RECOD model for a single moving dot. The lowest panelshows the input, the middle two panels show the activities of retinal transient andsustained cells, and the upper panel shows the activities of post-retinal sustainedcells. (Reproduced from Purushothaman et al. 1998.)

prediction superimposed on data for a single moving dot. The duration(or spatial extent) of the blur increases with exposure duration.
Figure 6.8 shows model activities for the ‘two-dot’ paradigmfollowing the same conventions as Figure 6.5. While an extensive blurfor the leading and the trailing dot can be observed across the networkof retinal sustained cells, the post-retinal network shows blur only
MOTION DEBLURRING AND METACONTRAST 229
800
600
400
200
00 50 100
Space (cell index)
Tim
e (m
s)
150 200
Fig. 6.6 Superimposeddensity plots of afferentsustained and transientactivities replotted fromthe middle two panels of Figure 6.5 to showtheir spatiotemporal relationship. (Reproducedfrom Purushothamanet al. 1998.)
200
20
40
60
80
100
120
140
Du
rati
on o
f blu
r (m
s)
160
40 60 80Exposure duration (ms)
Model
Data
100 120 140 150
Fig. 6.7 Comparison ofmodel prediction with data from Figure 6.2, averaged across threeobservers. (Reproducedfrom Purushothamanet al. 1998.)
for the trailing dot. Figure 6.9 shows superimposed density plots forafferent sustained and transient signals. It can be seen that the transientactivity of the trailing dot overlaps the smear of the leading dot. As aresult of post-retinal transient-on-sustained inhibition, the smear ofthe leading dot becomes suppressed. However, there is no transientactivity to suppress the smear of the trailing dot, and thus the trailingdot appears blurred. Figure 6.9 also clarifies why motion deblurring
METACONTRAST AND MOTION PERCEPTION230
0.08
10.75
0.250 0
0200400
600
1234
0.5
0.04Activity
Activity Activity
Activity
POST-RETINAL
TRANSIENT SUSTAINED
INPUT
0
050
100
200400
300
200
Space (cell index)
Tim
e (m
s)
100
0
150
050
100
200400
300
200
Space (cell index)
Tim
e (m
s)
100
0
150
050
100
200400
300
200
Space (cell index)
Tim
e (m
s)
100
0
150
050
100
200400
300
200
Space (cell index)
Tim
e (m
s)
100
0
150
Fig. 6.8 Simulations of the RECOD model for a pair of moving dots. Conventions asin Figure 6.5. (Reproduced from Purushothaman et al. 1998.)
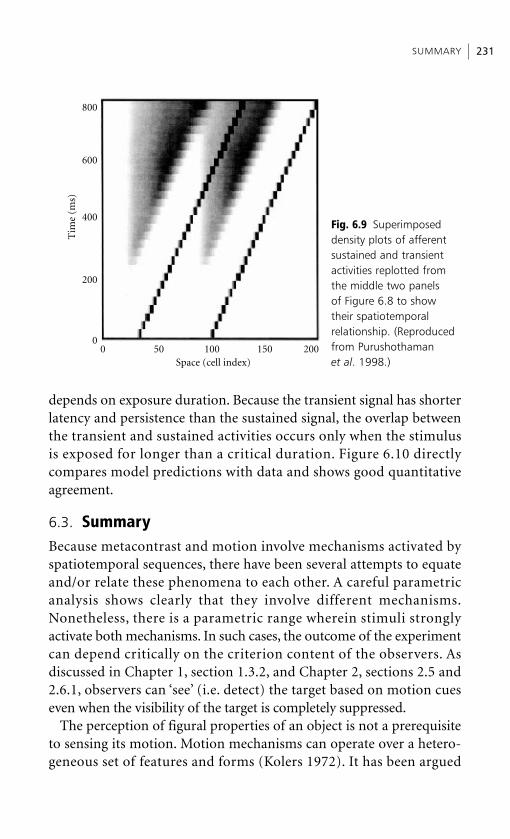
depends on exposure duration. Because the transient signal has shorterlatency and persistence than the sustained signal, the overlap betweenthe transient and sustained activities occurs only when the stimulusis exposed for longer than a critical duration. Figure 6.10 directlycompares model predictions with data and shows good quantitativeagreement.
6.3. SummaryBecause metacontrast and motion involve mechanisms activated byspatiotemporal sequences, there have been several attempts to equateand/or relate these phenomena to each other. A careful parametricanalysis shows clearly that they involve different mechanisms.Nonetheless, there is a parametric range wherein stimuli stronglyactivate both mechanisms. In such cases, the outcome of the experimentcan depend critically on the criterion content of the observers. Asdiscussed in Chapter 1, section 1.3.2, and Chapter 2, sections 2.5 and2.6.1, observers can ‘see’ (i.e. detect) the target based on motion cueseven when the visibility of the target is completely suppressed.
The perception of figural properties of an object is not a prerequisiteto sensing its motion. Motion mechanisms can operate over a hetero-geneous set of features and forms (Kolers 1972). It has been argued
SUMMARY 231
800
600
400
Tim
e (m
s)
200
0 50 100Space (cell index)
150 2000
Fig. 6.9 Superimposeddensity plots of afferentsustained and transientactivities replotted fromthe middle two panels of Figure 6.8 to showtheir spatiotemporal relationship. (Reproducedfrom Purushothamanet al. 1998.)
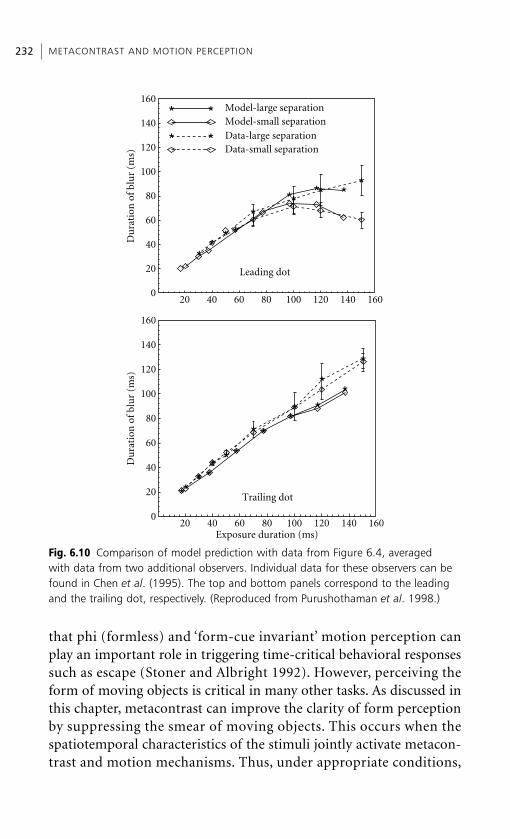
that phi (formless) and ‘form-cue invariant’ motion perception canplay an important role in triggering time-critical behavioral responsessuch as escape (Stoner and Albright 1992). However, perceiving theform of moving objects is critical in many other tasks. As discussed inthis chapter, metacontrast can improve the clarity of form perceptionby suppressing the smear of moving objects. This occurs when thespatiotemporal characteristics of the stimuli jointly activate metacon-trast and motion mechanisms. Thus, under appropriate conditions,
METACONTRAST AND MOTION PERCEPTION232
160
140
120
100
80
Du
rati
on o
f blu
r (m
s)
60
40
20
20 40 60 80 100 120 140 1600
160
140
120
100
80
Du
rati
on o
f blu
r (m
s)
60
40
20
20 40 60 80Exposure duration (ms)
Leading dot
Model-large separationModel-small separation
Data-large separationData-small separation
Trailing dot
100 120 140 1600
Fig. 6.10 Comparison of model prediction with data from Figure 6.4, averaged with data from two additional observers. Individual data for these observers can befound in Chen et al. (1995). The top and bottom panels correspond to the leadingand the trailing dot, respectively. (Reproduced from Purushothaman et al. 1998.)
metacontrast and motion mechanisms can operate in concert togenerate the perception of form in motion. The data discussed in thischapter also showed cases leading to a strong activation of motionmechanisms without a concomitant motion deblurring effect. Thesefindings provide evidence against models where motion plays a causalrole in metacontrast.
SUMMARY 233

This page intentionally left blank
Chapter 7
Figural context and attention invisual masking
7.1. IntroductionThe gestalt rules of perceptual organization and the effects of attentionstudied in the laboratory reflect two constraints: (i) the structuralcorrelation of elements in natural scenes that are exploited for efficientcoding (Geisler and Diehl 2003; Sigman et al. 2001; Simoncelli 2003),and (ii) the capacity limits on focally processing the superabundance ofinformation in such scenes (Posner 1994). Figural context, gestalt rulesof sensory organization, and attention are also known to reflect high-level visual processes and, moreover, to interact with each other(Pomerantz and Pristach 1989) (see section 7.2.1). These are importantconsiderations for visual masking, since it is influenced not only bylow-level bottom-up processes but also by high-level top-down ones.Evidence exists for effects on masking of mechanisms at a number ofvisual processing stages, from the earliest pre-attentive and pre-conscious ones to those that engage gestalt grouping and attentionalprocesses (Bachmann 1994; Boyer and Ro, in press; Breitmeyer 1984;Enns and Di Lollo 1997; Foster 1976, 1977, 1978, 1979; Lamme et al.2002; Michaels and Turvey 1979; Ramachandran and Cobb 1995;Shelley-Tremblay and Mack 1999; Turvey 1973; Vidnyánszky et al.2001; M.C. Williams and Weisstein 1981). In our opinion, these are notunexpected or surprising findings. Since the effects of figural contrast,context, and attention are ubiquitous and known to affect the qualityand quantity of processing in many tasks besides visual masking(Bashinski and Bacharach 1980; Frith and Dolan 1997; Han andHumphreys 1999; Handy et al. 1996; Kapadia et al. 1995; King et al.1993, 1995; Pomerantz and Pristach 1989; Posner and Petersen 1990;Posner and Rothbart 1994; Prinzmetal and Banks 1977; Saarinen et al.1997), there is no a priori reason to rule out such effects in visual
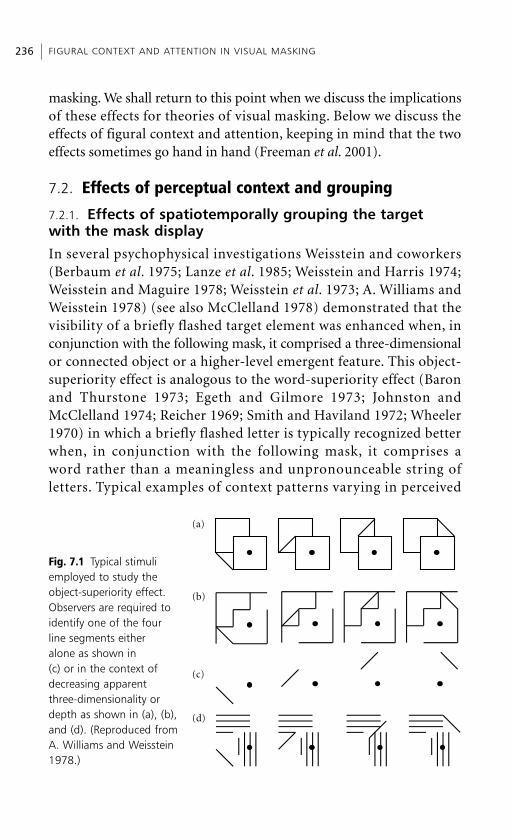
masking. We shall return to this point when we discuss the implicationsof these effects for theories of visual masking. Below we discuss theeffects of figural context and attention, keeping in mind that the twoeffects sometimes go hand in hand (Freeman et al. 2001).
7.2. Effects of perceptual context and grouping
7.2.1. Effects of spatiotemporally grouping the target with the mask display
In several psychophysical investigations Weisstein and coworkers(Berbaum et al. 1975; Lanze et al. 1985; Weisstein and Harris 1974;Weisstein and Maguire 1978; Weisstein et al. 1973; A. Williams andWeisstein 1978) (see also McClelland 1978) demonstrated that thevisibility of a briefly flashed target element was enhanced when, inconjunction with the following mask, it comprised a three-dimensionalor connected object or a higher-level emergent feature. This object-superiority effect is analogous to the word-superiority effect (Baronand Thurstone 1973; Egeth and Gilmore 1973; Johnston andMcClelland 1974; Reicher 1969; Smith and Haviland 1972; Wheeler1970) in which a briefly flashed letter is typically recognized betterwhen, in conjunction with the following mask, it comprises aword rather than a meaningless and unpronounceable string ofletters. Typical examples of context patterns varying in perceived
FIGURAL CONTEXT AND ATTENTION IN VISUAL MASKING236
(a)
(b)
(c)
(d)
Fig. 7.1 Typical stimuliemployed to study theobject-superiority effect.Observers are required toidentify one of the fourline segments either alone as shown in (c) or in the context ofdecreasing apparent three-dimensionality ordepth as shown in (a), (b),and (d). (Reproduced from A. Williams and Weisstein1978.)
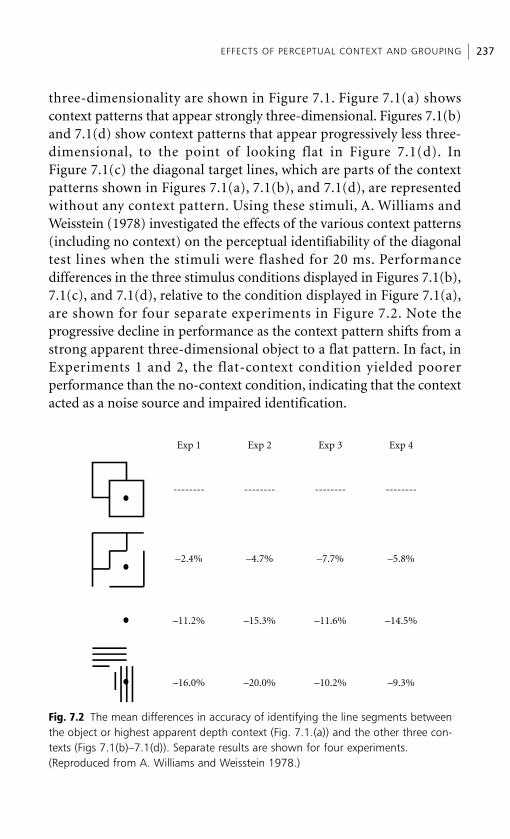
three-dimensionality are shown in Figure 7.1. Figure 7.1(a) showscontext patterns that appear strongly three-dimensional. Figures 7.1(b)and 7.1(d) show context patterns that appear progressively less three-dimensional, to the point of looking flat in Figure 7.1(d). InFigure 7.1(c) the diagonal target lines, which are parts of the contextpatterns shown in Figures 7.1(a), 7.1(b), and 7.1(d), are representedwithout any context pattern. Using these stimuli, A. Williams andWeisstein (1978) investigated the effects of the various context patterns(including no context) on the perceptual identifiability of the diagonaltest lines when the stimuli were flashed for 20 ms. Performancedifferences in the three stimulus conditions displayed in Figures 7.1(b),7.1(c), and 7.1(d), relative to the condition displayed in Figure 7.1(a),are shown for four separate experiments in Figure 7.2. Note theprogressive decline in performance as the context pattern shifts from astrong apparent three-dimensional object to a flat pattern. In fact, inExperiments 1 and 2, the flat-context condition yielded poorerperformance than the no-context condition, indicating that the contextacted as a noise source and impaired identification.
EFFECTS OF PERCEPTUAL CONTEXT AND GROUPING 237
Exp 1 Exp 2
-------- --------
–2.4% –4.7%
Exp 3
--------
–7.7%
Exp 4
--------
–5.8%
–11.2% –15.3% –11.6% –14.5%
–16.0% –20.0% –10.2% –9.3%
Fig. 7.2 The mean differences in accuracy of identifying the line segments betweenthe object or highest apparent depth context (Fig. 7.1.(a)) and the other three con-texts (Figs 7.1(b)–7.1(d)). Separate results are shown for four experiments.(Reproduced from A. Williams and Weisstein 1978.)
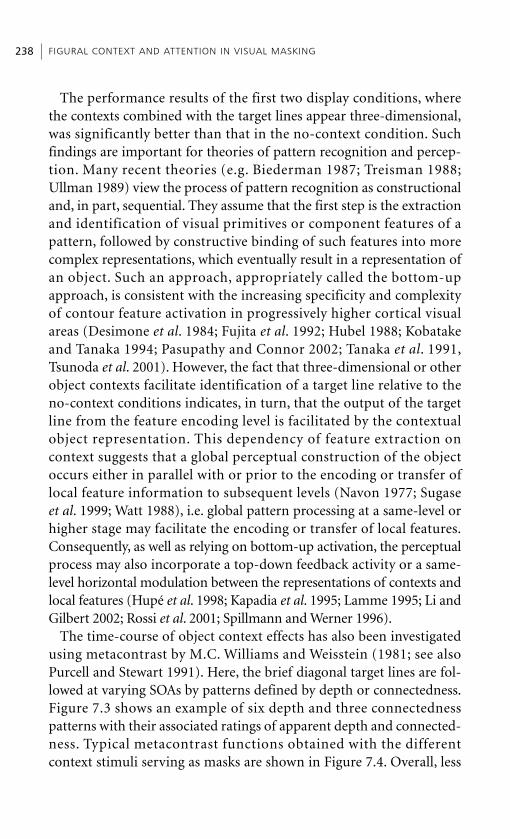
The performance results of the first two display conditions, wherethe contexts combined with the target lines appear three-dimensional,was significantly better than that in the no-context condition. Suchfindings are important for theories of pattern recognition and percep-tion. Many recent theories (e.g. Biederman 1987; Treisman 1988;Ullman 1989) view the process of pattern recognition as constructionaland, in part, sequential. They assume that the first step is the extractionand identification of visual primitives or component features of apattern, followed by constructive binding of such features into morecomplex representations, which eventually result in a representation ofan object. Such an approach, appropriately called the bottom-upapproach, is consistent with the increasing specificity and complexityof contour feature activation in progressively higher cortical visualareas (Desimone et al. 1984; Fujita et al. 1992; Hubel 1988; Kobatakeand Tanaka 1994; Pasupathy and Connor 2002; Tanaka et al. 1991,Tsunoda et al. 2001). However, the fact that three-dimensional or otherobject contexts facilitate identification of a target line relative to theno-context conditions indicates, in turn, that the output of the targetline from the feature encoding level is facilitated by the contextualobject representation. This dependency of feature extraction oncontext suggests that a global perceptual construction of the objectoccurs either in parallel with or prior to the encoding or transfer oflocal feature information to subsequent levels (Navon 1977; Sugaseet al. 1999; Watt 1988), i.e. global pattern processing at a same-level orhigher stage may facilitate the encoding or transfer of local features.Consequently, as well as relying on bottom-up activation, the perceptualprocess may also incorporate a top-down feedback activity or a same-level horizontal modulation between the representations of contexts andlocal features (Hupé et al. 1998; Kapadia et al. 1995; Lamme 1995; Li andGilbert 2002; Rossi et al. 2001; Spillmann and Werner 1996).
The time-course of object context effects has also been investigatedusing metacontrast by M.C. Williams and Weisstein (1981; see alsoPurcell and Stewart 1991). Here, the brief diagonal target lines are fol-lowed at varying SOAs by patterns defined by depth or connectedness.Figure 7.3 shows an example of six depth and three connectednesspatterns with their associated ratings of apparent depth and connected-ness. Typical metacontrast functions obtained with the differentcontext stimuli serving as masks are shown in Figure 7.4. Overall, less
FIGURAL CONTEXT AND ATTENTION IN VISUAL MASKING238
masking of the target lines was obtained with greater depth andconnectedness of the context stimuli. However, two trends may be ofpotential interest. First, while variations of the level of context depthaffected the optimal masking SOA, variations of context connectednessdid not. In particular, the optimal masking SOA decreases from 150 to60 ms as the level of context depth decreases, but maintains a value of80 ms for all levels of context connectedness. On the other hand, themagnitude of masking is affected much more by variation of connect-edness than variation of depth. While masking magnitude increasesonly slightly as depth decreases, it increases markedly as connectednessdecreases. Presumably these differences relate to (as yet unexplored)
EFFECTS OF PERCEPTUAL CONTEXT AND GROUPING 239
Depth rating Connectednessrating
8.77 .7
8. 16.0
7.2 2.4
5.5
3.2
2.9
Fig. 7.3 (a) Six apparent depth context patterns with decreasing associated depthratings from top to bottom as shown. (b) Three apparent connectedness contextpatterns with decreasing connectedness ratings from top to bottom as shown.(Reproduced from M.C. Williams and Weisstein 1981.)
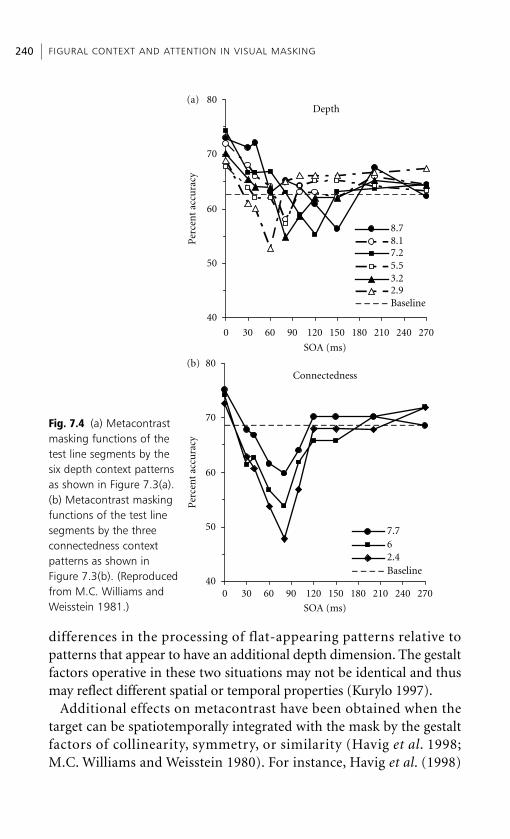
differences in the processing of flat-appearing patterns relative topatterns that appear to have an additional depth dimension. The gestaltfactors operative in these two situations may not be identical and thusmay reflect different spatial or temporal properties (Kurylo 1997).
Additional effects on metacontrast have been obtained when thetarget can be spatiotemporally integrated with the mask by the gestaltfactors of collinearity, symmetry, or similarity (Havig et al. 1998;M.C. Williams and Weisstein 1980). For instance, Havig et al. (1998)
FIGURAL CONTEXT AND ATTENTION IN VISUAL MASKING240
40
50
60
70
80
0 30 60 90 120
SOA (ms)
SOA (ms)
150 180 210 240 270
7.762.4Baseline
40
50
60
70
80(a)
(b)
0 30 60 90 120 150 180 210 240 270
8.78.17.25.53.22.9Baseline
Per
cen
t ac
cura
cyP
erce
nt
accu
racy
Depth
Connectedness
Fig. 7.4 (a) Metacontrastmasking functions of thetest line segments by thesix depth context patternsas shown in Figure 7.3(a).(b) Metacontrast maskingfunctions of the test linesegments by the three connectedness contextpatterns as shown inFigure 7.3(b). (Reproducedfrom M.C. Williams andWeisstein 1981.)
used a target element that was flanked by two mask elements that couldbe located to the right and left of (horizontal alignment), or above andbelow (vertical alignment), the target. Prior to the target–masksequence, a visual cue signaled the horizontal or vertical maskalignment correctly in 80 percent of the trials (valid trials), and incor-rectly in the remainder. The target was significantly easier to detect(weaker masking prevailed) in validly cued than in invalidly cued trials,i.e. when the target was collinear with the validly cued mask alignment.However, Williams and Weisstein (1980) found that spatiotemporalintegration of the target and mask via symmetry and similarity canenhance rather than reduce the masking effect. Specifically, when thetarget elements could be perceptually integrated with the mask, theywere presumably embedded in a larger perceptual grouping thatrendered their detection more difficult in this case1 (Prinzmetal andBanks 1977) rather than easier as in other cases (Pomerantz et al. 1977).
7.2.2. Effects of spatially embedding the target within a larger target gestalt
In recent years, additional studies have shown that a target element’svisibility in backward masking is affected not only by its fit into a largertarget–and–mask configuration but also by how it fits into a target–onlyconfiguration. Although fast and slow response components in areas asearly as V1 may process visual information in a distinct manner(Müller et al. 2001; Lamme et al. 2000), the effects of context on themasking of simple targets like oriented lines or textures manifest them-selves at the earliest (Vidnyánszky et al. 2001) as well as later (Lammeet al. 2002) response levels in cortical processing. These two maskingeffects may in turn depend on distinct forms of contextual modulationproduced by intrinsic horizontal connections (Kapadia et al. 1995) andby feedback from higher to lower visual areas (Lamme et al. 2000). Ourreview below will include context-dependent effects, which probablydepend on both kinds of modulation; however, the extent to whicheach contributes to masking effects is unknown, although intelligentguesses might be made.
One example of target-configuration effects is that inverted faces orfaces with scrambled features are more prone to be masked than areupright unscrambled faces (Purcell and Stewart 1988; Shelley-Tremblayand Mack 1999). Since facial recognition can proceed holistically or by
EFFECTS OF PERCEPTUAL CONTEXT AND GROUPING 241
component features (Cabeza and Kato 2000; Farah et al. 1998; Tanakaand Farah 1993; Tanaka and Sengco 1997), a facial-superiority effect(Homa et al. 1976; van Santen and Jonides 1978), analogous to theobject-superiority effect (Weisstein and Harris 1974), would renderfacial components more visible and thus more useful for the detectabilityof a face.
More directly discernible effects of target configuration have beenreported by Ramachandran and Cobb (1995). In one experiment thecentral of three horizontally collinear disks could be masked by anarray of four vertically aligned rectangles, with the two central rect-angles flanking the central target disk. At a masking SOA of 116 ms, therated visibility of the target disk was significantly higher whenobservers attended to the target array than when they attended to themask array. While both the mask and target arrays produced groupingby collinearity, the grouping of the target array was strengthened by theadditional factor of similarity and thus could lead to increased visibilityof the central disk element when observers attended to the array.
Our own (unpublished) observations of metacontrast masking,using subjective ratings of target visibility, showed that collinearity ofthe target array did not decrease the masking magnitude. Specifically,compared with an isolated horizontal target bar, the same bar embeddedin an array of (horizontally) collinear bars did not decrease masking, oralternatively increase the visibility, of the target element. This is acounterintuitive result since studies of detection thresholds for a brieflyflashed target element embedded in an array of collinear suprathres-hold elements increases its threshold visibility (Dresp 1993; Dresp andGrossberg 1997; Polat and Sagi 1993, 1994). However, effects ofcollinear context may be contrast dependent, varying from facilitationof visibility at lower target contrasts to no change or suppression ofvisibility at higher contrasts (Polat et al. 1997; Wehrhahn and Dresp1998). This is consistent with the finding that grouping of concurrentlypresented high-contrast elements may actually reduce activity to visualelements in primary visual cortex (V1) (Murray et al. 2002). In ourexperiments both the target and mask were at a maximal contrast of 1.0,and therefore we might not have optimized conditions for obtainingfacilitatory effects. However, King et al. (1995) demonstratedindependently that the gestalt factors of similarity and proximity affectthe magnitude of metacontrast. They showed that the masking of
FIGURAL CONTEXT AND ATTENTION IN VISUAL MASKING242
a horizontal target line by two adjacent and collinear mask lines wasreduced when a second line, adjacent and parallel to the target line,was included in the target array. Moreover, this reduction of maskingmagnitude decreased as the separation between the two lines in thetarget array increased.
7.3. Attentional effectsSeveral of the studies cited above (Havig et al. 1998; Ramachandranand Cobb 1995) may have combined the effects of selective attentionand grouping, and others may have confounded what some investiga-tors (Abrams and Law 2000; Duncan 1984; Egly et al. 1994a,b; Ianiet al. 2001; Lamy and Egeth 2002) have termed space- or location-based attention with object- or configuration-based attention.Consequently, it is not entirely clear to what extent the modulation ofmasking magnitude was affected by grouping per se or by space-basedor object-based attention. Below we discuss findings of studies thatmore clearly isolate effects of visual selective attention. Recent electro-physiological and brain-imaging findings indicate that activity in areasas early as V1 (Di Russo and Spinelli 1999; Gilbert et al. 2000; Lammeand Spekreijse 2000; Noesselt et al. 2002; Roelfsema et al. 1998; Somerset al. 1999; Watanabe et al. 1998), and even as early as the LGN(O’Connor et al. 2002), can be modulated by attention, although suchearly modulation may depend on feedback from higher cortical visualareas. Moreover, since the effects of visual selective attention ondetectability of a target may be more prominent when multi-elementtarget displays are used (Di Lollo et al. 2000; Reynolds et al. 1999;Motter 1993; Tata 2002), we would expect the effects of selective atten-tion to interact with the effects of multi-element figural contextdiscussed above. Thus we should be able to discern various attentionaleffects, each depending on the types and levels of visual informationprocessing used in a perceptual task.
7.3.1. Evidence of space-based attentional effects in masking
The results of Experiment 1 of Ramachandran and Cobb (1995),although supporting the existence of attentional effects in metacon-trast, are ambiguous as to their source. The target and mask display isshown in Figure 7.5. The target array consisted of three disks (A, B,
ATTENTIONAL EFFECTS 243
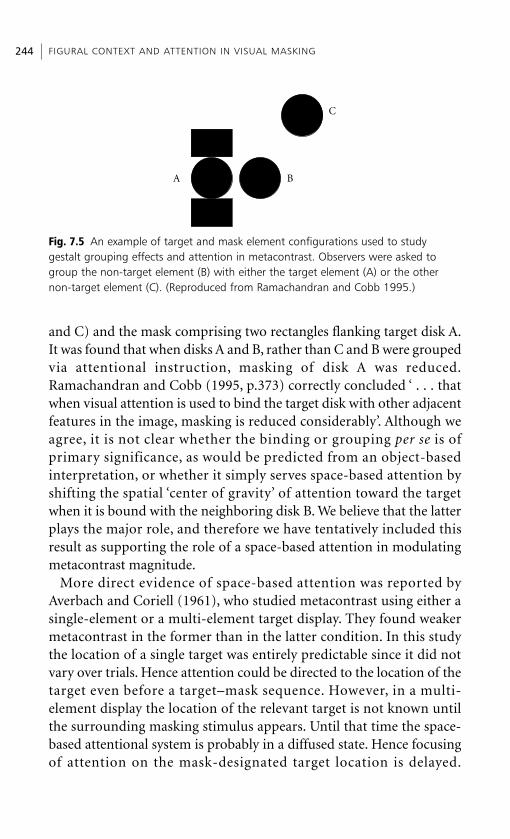
and C) and the mask comprising two rectangles flanking target disk A.It was found that when disks A and B, rather than C and B were groupedvia attentional instruction, masking of disk A was reduced.Ramachandran and Cobb (1995, p.373) correctly concluded ‘ . . . thatwhen visual attention is used to bind the target disk with other adjacentfeatures in the image, masking is reduced considerably’. Although weagree, it is not clear whether the binding or grouping per se is ofprimary significance, as would be predicted from an object-basedinterpretation, or whether it simply serves space-based attention byshifting the spatial ‘center of gravity’ of attention toward the targetwhen it is bound with the neighboring disk B. We believe that the latterplays the major role, and therefore we have tentatively included thisresult as supporting the role of a space-based attention in modulatingmetacontrast magnitude.
More direct evidence of space-based attention was reported byAverbach and Coriell (1961), who studied metacontrast using either asingle-element or a multi-element target display. They found weakermetacontrast in the former than in the latter condition. In this studythe location of a single target was entirely predictable since it did notvary over trials. Hence attention could be directed to the location of thetarget even before a target–mask sequence. However, in a multi-element display the location of the relevant target is not known untilthe surrounding masking stimulus appears. Until that time the space-based attentional system is probably in a diffused state. Hence focusingof attention on the mask-designated target location is delayed.
FIGURAL CONTEXT AND ATTENTION IN VISUAL MASKING244
A B
C
Fig. 7.5 An example of target and mask element configurations used to studygestalt grouping effects and attention in metacontrast. Observers were asked togroup the non-target element (B) with either the target element (A) or the othernon-target element (C). (Reproduced from Ramachandran and Cobb 1995.)
Moreover, since visual pattern sensitivity to stimuli falling at a givenspatial location can be enhanced by the direction of attention to thatlocation (Bashinski and Bacharach 1980; McAdams and Maunsell1999; P.L. Smith 2000; P.L. Smith and Wolfgang 2004; P.L. Smith et al.2004; Treue 2001), the more expeditious allocation of attention to thesingle-target display should enhance sensitivity relative to the laterallocation of attention to the target in the multi-element display.Consequently, metacontrast will be weaker in the former than in thelatter situation.
Additional evidence for this interpretation derives from studiesconducted by Spencer (1969) and Spencer and Shuntich (1970) who,similarly to Averbach and Coriell (1961), investigated backward patternmasking with a single-letter and a 12-letter target array. In particular,Spencer and Shuntich (1970) investigated backward pattern masking atthree mask-energy levels. With the single-letter array, the magnitude ofbackward masking increased as mask energy increased but was elimin-ated for all mask energies at a target–mask asynchrony of about 100 ms.However, with the 12-letter array all three mask energies yielded notonly more pronounced but also more prolonged backward maskingeffects extending up to SOAs of 300 ms. Each of these results has beenreplicated by Enns and Di Lollo (1997, Experiment 3) and Tata (2002,Experiment 1).
Additional direct evidence for space-based attentional modulation ofmetacontrast has also been reported recently (Boyer and Ro, in press;Enns and Di Lollo 1997; Havig et al. 1998; Tata 2002; Tata and Giashi2004). Enns and Di Lollo (1997, Experiment 1) varied spatial attentionby varying the spatial uncertainty of a target–mask sequence.Compared with a condition in which the target–mask sequence waspresented at a spatially uncertain location, masking was weaker in thespatial certainty condition. Moreover, like increases of items in the tar-get array (Averbach and Corriel 1961; Spencer 1969; Spencer andShuntich 1970), an increase in spatial uncertainty shifted the optimalmasking SOA to higher values. Boyer and Ro (in press), Havig et al.(1998), and Tata (2002) used the spatial cueing paradigm developed byPosner (1980) and found, as expected, that when the target–masklocation was validly cued, masking magnitude was weaker than when itwas invalidly cued. In a clever experiment, Tata (2002) additionallymanipulated attentional cueing of location by exploiting the ‘pop-out’
ATTENTIONAL EFFECTS 245
effect, according to which attention is drawn to an ‘odd’ singleton itemembedded in a number of distractor items (Treisman 1988; Treismanand Gelade 1980). The masking was much weaker when the target wasa pop-out item in a multi-item target display (thus attracting attention)than when it did not pop out.
7.3.2. Evidence of object- or feature-based attentionaleffects in masking
Given the existence of inattentional blindness (IB) and, of course,attentional seeing (Mack and Rock 1998), the work reviewed in section7.2.1, especially that of Purcell and Stewart (1988), Havig et al. (1998),Ramachandran and Cobb (1995, Experiment 2), and Shelley-Tremblayand Mack (1999, Experiment 1), indicates that object-based attentioncan modulate backward masking magnitude. From the assumptionthat our perceptual object and scene representations are constrained bymore or less likely (i.e. statistical) spatiotemporal regularities in theworld (Marr 1982), it follows that each of these representations in turnis more or less typical, salient, or familiar to us. Hence, we wouldexpect more familiar, typical, or salient visual objects, in so far as theyresist IB, to be masked less than items that are less resistant to IB.
7.3.3. Evidence for the effects of central attentionalmechanisms in masking
Michaels and Turvey (1979), who explicitly incorporated attentionalmechanisms in their model of backward masking, proposed a multi-process model of masking along the following lines. They argued thatthe masking effects at the shorter SOAs were more likely to be due totarget–mask sensory interactions (integration or suppression of targetactivity with or by the mask activity), whereas the prolonged maskingeffects extending to the longer SOAs, also reported by Spencer andShuntich (1970) and Enns and Di Lollo (1997, Experiment 3), weremore likely to be due to target–mask attentional interactions, in particu-lar to an interruption by the aftercoming mask of central attentionalmechanisms devoted to the transfer of target information from iconicmemory to a level of non-visual categorical representation, such as ver-bal short-term memory (Neisser 1967; Sperling 1960, 1963, 1967), thatis immune to visual masking effects. Arguing that iconic read-outof meaningful information should proceed more efficiently than that
FIGURAL CONTEXT AND ATTENTION IN VISUAL MASKING246
of meaningless information, Michaels and Turvey (1979) found thatthe masking strength and temporal extent depended on higher-ordersemantic information in the letter strings comprising their target andmask stimuli, results and interpretations anticipating related onesreported more recently by Shelley-Tremblay and Mack (1999).
In contrast with Michael and Turvey’s (1979) process of attentionalinterruption, Enns and Di Lollo (1997) prefer to introduce a newprocess called object substitution. This process, based on re-entrantcortical activation (Edelman 1987; Zeki 1993), requires modulation ofcentral attentional states in order to produce modulations of maskingmagnitude (see also Bachmann 1999). Whether object substitution isdistinct from attentional interruption is not clear. Enns and Di Lollo(1997) argue for a distinction between the two. The distinction is basedon analysis of false-positive reports in studies of the attentional blink(AB) in which RSVPs of spatially overlapping items are used(Giesbrecht and Di Lollo 1998; Isaak et al. 1999). Here, the item imme-diately following the designated target acts as an object-substitutionmask. Thus this item, rather than the designated target, is reported.However, subsequent work by Giesbrecht et al. (2003) fails to supportthe hypothesis that object substitution plays a major role in the AB. Infact, these investigators conclude, in line with interpretations proposedby Breitmeyer et al. (1999), that masking effects in the AB are due toearly peripheral rather than late central visual processes.
Nonetheless, subsequent research (Di Lollo et al. 2000), using thecommon-onset masking paradigm (Bischof and Di Lollo 1995;Di Lollo et al. 1993) (see also Chapter 2, section 2.6.4), does point toa distinction between interruption and object-substitution masking.Recall that interruption masking in the Michaels and Turvey (1979)model refers to an interruption in the attentive read-out of informa-tion from iconic memory. Recently, Lamme (2003) proposed thaticonic memory corresponds to what Block (1995, 1996) has termedphenomenal consciousness, whereas post-iconic levels of processingcorrespond to what Block has termed access consciousness. Moreover,Lamme (2003) argues convincingly that only items in phenomenalconsciousness that are attended to can be transferred to accessconsciousness, a line of reasoning that resonates well with the hypothesisthat read-out from iconic memory to more permanent visual (or non-visual) representations available to conscious report requires attention.
ATTENTIONAL EFFECTS 247
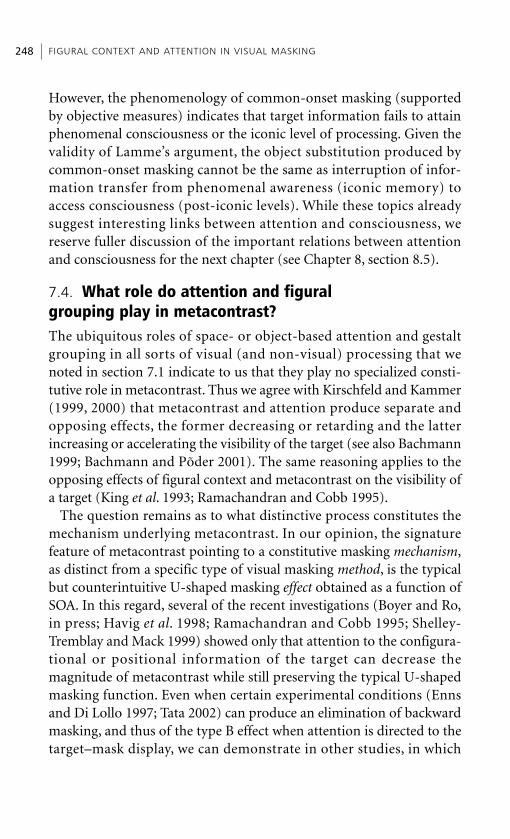
However, the phenomenology of common-onset masking (supportedby objective measures) indicates that target information fails to attainphenomenal consciousness or the iconic level of processing. Given thevalidity of Lamme’s argument, the object substitution produced bycommon-onset masking cannot be the same as interruption of infor-mation transfer from phenomenal awareness (iconic memory) toaccess consciousness (post-iconic levels). While these topics alreadysuggest interesting links between attention and consciousness, wereserve fuller discussion of the important relations between attentionand consciousness for the next chapter (see Chapter 8, section 8.5).
7.4. What role do attention and figural grouping play in metacontrast?The ubiquitous roles of space- or object-based attention and gestaltgrouping in all sorts of visual (and non-visual) processing that wenoted in section 7.1 indicate to us that they play no specialized consti-tutive role in metacontrast. Thus we agree with Kirschfeld and Kammer(1999, 2000) that metacontrast and attention produce separate andopposing effects, the former decreasing or retarding and the latterincreasing or accelerating the visibility of the target (see also Bachmann1999; Bachmann and Põder 2001). The same reasoning applies to theopposing effects of figural context and metacontrast on the visibility ofa target (King et al. 1993; Ramachandran and Cobb 1995).
The question remains as to what distinctive process constitutes themechanism underlying metacontrast. In our opinion, the signaturefeature of metacontrast pointing to a constitutive masking mechanism,as distinct from a specific type of visual masking method, is the typicalbut counterintuitive U-shaped masking effect obtained as a function ofSOA. In this regard, several of the recent investigations (Boyer and Ro,in press; Havig et al. 1998; Ramachandran and Cobb 1995; Shelley-Tremblay and Mack 1999) showed only that attention to the configura-tional or positional information of the target can decrease themagnitude of metacontrast while still preserving the typical U-shapedmasking function. Even when certain experimental conditions (Ennsand Di Lollo 1997; Tata 2002) can produce an elimination of backwardmasking, and thus of the type B effect when attention is directed to thetarget–mask display, we can demonstrate in other studies, in which
FIGURAL CONTEXT AND ATTENTION IN VISUAL MASKING248
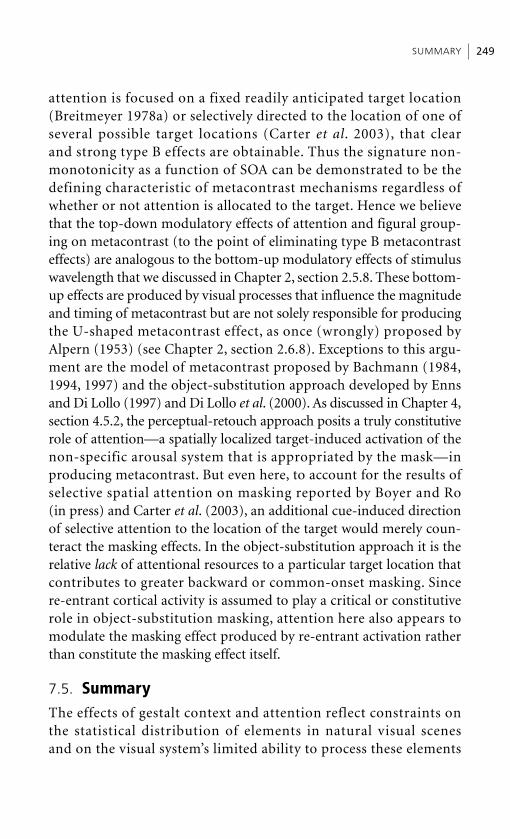
attention is focused on a fixed readily anticipated target location(Breitmeyer 1978a) or selectively directed to the location of one ofseveral possible target locations (Carter et al. 2003), that clearand strong type B effects are obtainable. Thus the signature non-monotonicity as a function of SOA can be demonstrated to be thedefining characteristic of metacontrast mechanisms regardless ofwhether or not attention is allocated to the target. Hence we believethat the top-down modulatory effects of attention and figural group-ing on metacontrast (to the point of eliminating type B metacontrasteffects) are analogous to the bottom-up modulatory effects of stimuluswavelength that we discussed in Chapter 2, section 2.5.8. These bottom-up effects are produced by visual processes that influence the magnitudeand timing of metacontrast but are not solely responsible for producingthe U-shaped metacontrast effect, as once (wrongly) proposed byAlpern (1953) (see Chapter 2, section 2.6.8). Exceptions to this argu-ment are the model of metacontrast proposed by Bachmann (1984,1994, 1997) and the object-substitution approach developed by Ennsand Di Lollo (1997) and Di Lollo et al. (2000). As discussed in Chapter 4,section 4.5.2, the perceptual-retouch approach posits a truly constitutiverole of attention—a spatially localized target-induced activation of thenon-specific arousal system that is appropriated by the mask—inproducing metacontrast. But even here, to account for the results ofselective spatial attention on masking reported by Boyer and Ro(in press) and Carter et al. (2003), an additional cue-induced directionof selective attention to the location of the target would merely coun-teract the masking effects. In the object-substitution approach it is therelative lack of attentional resources to a particular target location thatcontributes to greater backward or common-onset masking. Sincere-entrant cortical activity is assumed to play a critical or constitutiverole in object-substitution masking, attention here also appears tomodulate the masking effect produced by re-entrant activation ratherthan constitute the masking effect itself.
7.5. SummaryThe effects of gestalt context and attention reflect constraints onthe statistical distribution of elements in natural visual scenesand on the visual system’s limited ability to process these elements
SUMMARY 249
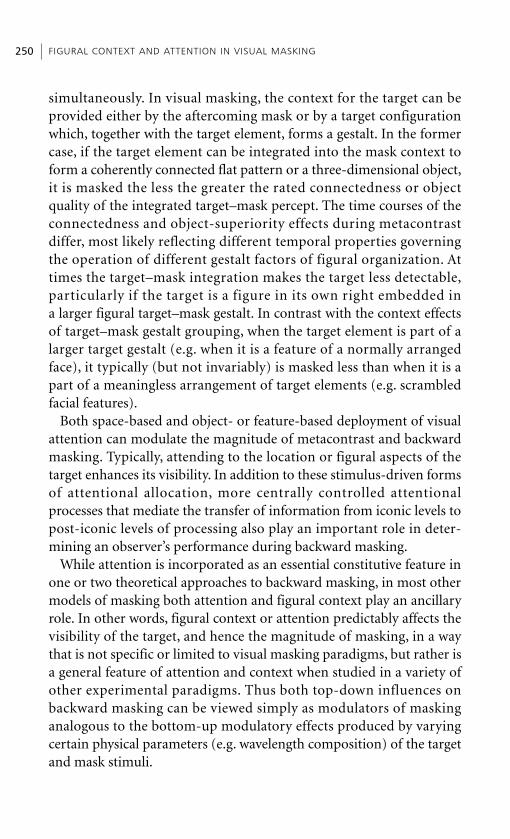
simultaneously. In visual masking, the context for the target can beprovided either by the aftercoming mask or by a target configurationwhich, together with the target element, forms a gestalt. In the formercase, if the target element can be integrated into the mask context toform a coherently connected flat pattern or a three-dimensional object,it is masked the less the greater the rated connectedness or objectquality of the integrated target–mask percept. The time courses of theconnectedness and object-superiority effects during metacontrastdiffer, most likely reflecting different temporal properties governingthe operation of different gestalt factors of figural organization. Attimes the target–mask integration makes the target less detectable,particularly if the target is a figure in its own right embedded ina larger figural target–mask gestalt. In contrast with the context effectsof target–mask gestalt grouping, when the target element is part of alarger target gestalt (e.g. when it is a feature of a normally arrangedface), it typically (but not invariably) is masked less than when it is apart of a meaningless arrangement of target elements (e.g. scrambledfacial features).
Both space-based and object- or feature-based deployment of visualattention can modulate the magnitude of metacontrast and backwardmasking. Typically, attending to the location or figural aspects of thetarget enhances its visibility. In addition to these stimulus-driven formsof attentional allocation, more centrally controlled attentionalprocesses that mediate the transfer of information from iconic levels topost-iconic levels of processing also play an important role in deter-mining an observer’s performance during backward masking.
While attention is incorporated as an essential constitutive feature inone or two theoretical approaches to backward masking, in most othermodels of masking both attention and figural context play an ancillaryrole. In other words, figural context or attention predictably affects thevisibility of the target, and hence the magnitude of masking, in a waythat is not specific or limited to visual masking paradigms, but rather isa general feature of attention and context when studied in a variety ofother experimental paradigms. Thus both top-down influences onbackward masking can be viewed simply as modulators of maskinganalogous to the bottom-up modulatory effects produced by varyingcertain physical parameters (e.g. wavelength composition) of the targetand mask stimuli.
FIGURAL CONTEXT AND ATTENTION IN VISUAL MASKING250

Note1. Analogs of such decreases in the detectability of parts comprising wholes are the visual
puzzles sometimes found in the puzzle pages of newspapers and magazines where thetask is to find the ‘hidden object’ in a larger object array or the embedded-figure testsused in neuropsychological assessments. However, in addition to this general source ofdifficulty in target detection, another reason for the greater masking with mask elementsthat constituted symmetric or similar complements to the target elements may havebeen the greater match between the contour orientations of the target and maskelements, thus rendering the mask more effective (see Chapter 2, sections 2.6.5 and 2.8).
SUMMARY 251

This page intentionally left blank
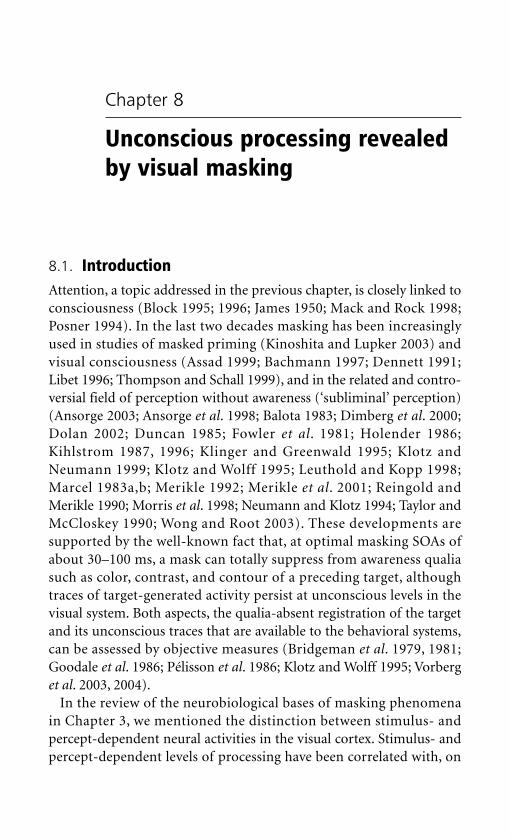
Chapter 8
Unconscious processing revealedby visual masking
8.1. IntroductionAttention, a topic addressed in the previous chapter, is closely linked toconsciousness (Block 1995; 1996; James 1950; Mack and Rock 1998;Posner 1994). In the last two decades masking has been increasinglyused in studies of masked priming (Kinoshita and Lupker 2003) andvisual consciousness (Assad 1999; Bachmann 1997; Dennett 1991;Libet 1996; Thompson and Schall 1999), and in the related and contro-versial field of perception without awareness (‘subliminal’ perception)(Ansorge 2003; Ansorge et al. 1998; Balota 1983; Dimberg et al. 2000;Dolan 2002; Duncan 1985; Fowler et al. 1981; Holender 1986;Kihlstrom 1987, 1996; Klinger and Greenwald 1995; Klotz andNeumann 1999; Klotz and Wolff 1995; Leuthold and Kopp 1998;Marcel 1983a,b; Merikle 1992; Merikle et al. 2001; Reingold andMerikle 1990; Morris et al. 1998; Neumann and Klotz 1994; Taylor andMcCloskey 1990; Wong and Root 2003). These developments aresupported by the well-known fact that, at optimal masking SOAs ofabout 30–100 ms, a mask can totally suppress from awareness qualiasuch as color, contrast, and contour of a preceding target, althoughtraces of target-generated activity persist at unconscious levels in thevisual system. Both aspects, the qualia-absent registration of the targetand its unconscious traces that are available to the behavioral systems,can be assessed by objective measures (Bridgeman et al. 1979, 1981;Goodale et al. 1986; Pélisson et al. 1986; Klotz and Wolff 1995; Vorberget al. 2003, 2004).
In the review of the neurobiological bases of masking phenomenain Chapter 3, we mentioned the distinction between stimulus- andpercept-dependent neural activities in the visual cortex. Stimulus- andpercept-dependent levels of processing have been correlated with, on
UNCONSCIOUS PROCESSING REVEALED BY VISUAL MASKING254
the one hand, early (V1) and later (V4/V5 and beyond) stages of corticalprocessing, respectively (Leopold and Logothetis 1996; Logothetis andSchall 1989; Scheinberg and Logothetis 1997) and, on the other hand,with early and late response components in primary visual cortex (V1),with the later components reflecting re-entrant activation from highervisual brain centers (Lamme 2003; Lamme et al. 2000; Super et al.2001). These observations agree with the suggestion that the suppres-sion of these late response components in V1 is a neural correlate ofbackward masking (Bridgeman 1980; Lamme et al. 2002). Therefore,for object perception, we proceed on the working assumptions that theearly and late components of neural responses are associated withstimulus- and percept-dependent activities and that the stimulus-dependent level is clearly associated with the unconscious and qualia-poor level of processing.1 In this chapter, we review findings ofunconscious information processing in the visual system as it relates tothe metacontrast mechanism per se, the location, color, and form ofphenomenally suppressed targets, and the allocation of attention. Weconclude that metacontrast, in its effects but not its mechanism, is akinto a transient form of blindsight and that it also may share propertieswith binocular rivalry suppression.
8.2. The unconscious mechanism of metacontrastsuppression revealed by target recovery (disinhibition)Studies too numerous to cite (Breitmeyer 1984, pp. 270–84) haveshown that a second mask introduced into the target–mask sequenceused in backward masking can restore (at least partially) the otherwisesuppressed visibility of the target’s contours and surface properties.This phenomenon is referred to as target recovery or target disinhibition.In the following discussion, we designate the primary masking stimulusthat suppresses the visibility of the target by M1, and the secondarymask that produces target recovery by M2. In addition to metacontrastand pattern masking, a number of other methods can be used, to pro-duce backward masking of the target’s visibility; correspondingly, thereare also a number of ways, depending on the type of stimuli used, toproduce target recovery (again, see Breitmeyer 1984, pp. 270–84).We limit ourselves to discussion of target recovery phenomena reported
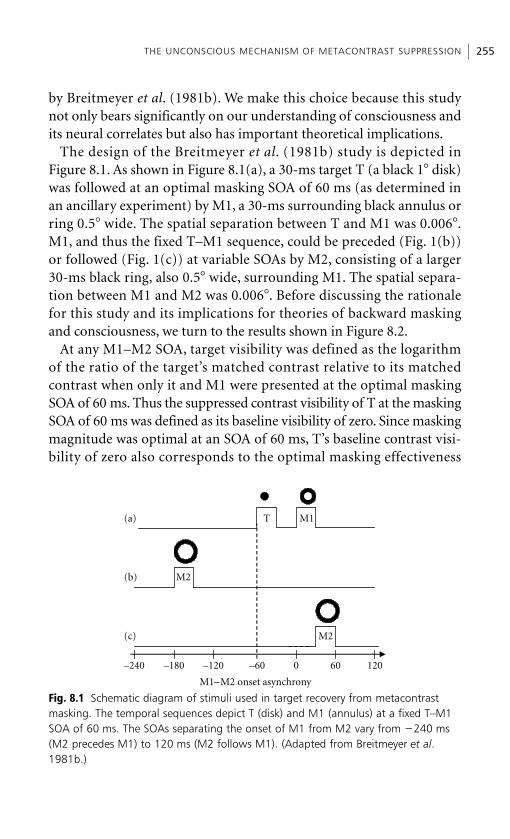
THE UNCONSCIOUS MECHANISM OF METACONTRAST SUPPRESSION 255
by Breitmeyer et al. (1981b). We make this choice because this studynot only bears significantly on our understanding of consciousness andits neural correlates but also has important theoretical implications.
The design of the Breitmeyer et al. (1981b) study is depicted inFigure 8.1. As shown in Figure 8.1(a), a 30-ms target T (a black 1� disk)was followed at an optimal masking SOA of 60 ms (as determined inan ancillary experiment) by M1, a 30-ms surrounding black annulus orring 0.5� wide. The spatial separation between T and M1 was 0.006�.M1, and thus the fixed T–M1 sequence, could be preceded (Fig. 1(b))or followed (Fig. 1(c)) at variable SOAs by M2, consisting of a larger30-ms black ring, also 0.5� wide, surrounding M1. The spatial separa-tion between M1 and M2 was 0.006�. Before discussing the rationalefor this study and its implications for theories of backward maskingand consciousness, we turn to the results shown in Figure 8.2.
At any M1–M2 SOA, target visibility was defined as the logarithmof the ratio of the target’s matched contrast relative to its matchedcontrast when only it and M1 were presented at the optimal maskingSOA of 60 ms. Thus the suppressed contrast visibility of T at the maskingSOA of 60 ms was defined as its baseline visibility of zero. Since maskingmagnitude was optimal at an SOA of 60 ms, T’s baseline contrast visi-bility of zero also corresponds to the optimal masking effectiveness
M1–M2 onset asynchrony
–240 –180 –120 –60 0 12060
T M1
M2
M2
(a)
(b)
(c)
Fig. 8.1 Schematic diagram of stimuli used in target recovery from metacontrastmasking. The temporal sequences depict T (disk) and M1 (annulus) at a fixed T–M1SOA of 60 ms. The SOAs separating the onset of M1 from M2 vary from �240 ms(M2 precedes M1) to 120 ms (M2 follows M1). (Adapted from Breitmeyer et al.1981b.)
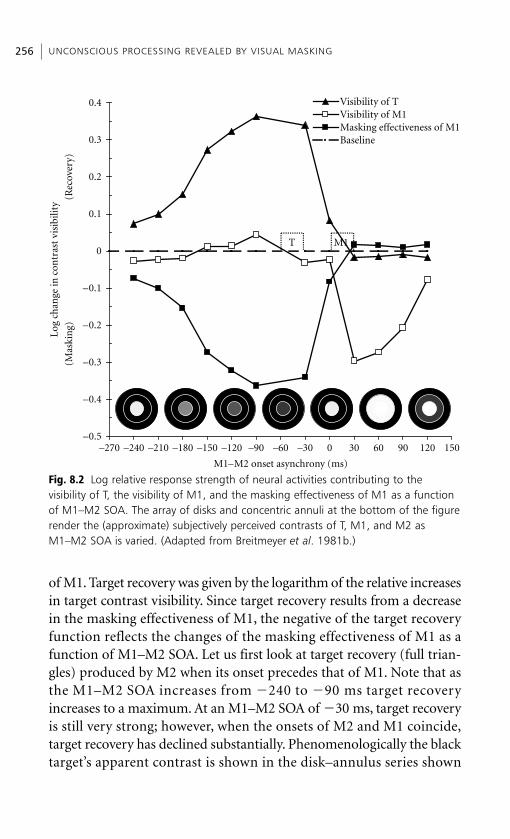
UNCONSCIOUS PROCESSING REVEALED BY VISUAL MASKING256
of M1. Target recovery was given by the logarithm of the relative increasesin target contrast visibility. Since target recovery results from a decreasein the masking effectiveness of M1, the negative of the target recoveryfunction reflects the changes of the masking effectiveness of M1 as afunction of M1–M2 SOA. Let us first look at target recovery (full trian-gles) produced by M2 when its onset precedes that of M1. Note that asthe M1–M2 SOA increases from �240 to �90 ms target recoveryincreases to a maximum. At an M1–M2 SOA of �30 ms, target recoveryis still very strong; however, when the onsets of M2 and M1 coincide,target recovery has declined substantially. Phenomenologically the blacktarget’s apparent contrast is shown in the disk–annulus series shown
–0.5
–0.4
–0.3
–0.2
–0.1
0
0.1
0.2
0.3
0.4
–270 –240 –210 –180 –150 –120 –90 –60 –30 0 30 60 90 120 150
M1–M2 onset asynchrony (ms)
Visibility of TVisibility of M1Masking effectiveness of M1Baseline
M1T
Log
chan
ge in
con
tras
t vi
sibi
lity
(Mas
kin
g)(R
ecov
ery)
Fig. 8.2 Log relative response strength of neural activities contributing to thevisibility of T, the visibility of M1, and the masking effectiveness of M1 as a functionof M1–M2 SOA. The array of disks and concentric annuli at the bottom of the figurerender the (approximate) subjectively perceived contrasts of T, M1, and M2 asM1–M2 SOA is varied. (Adapted from Breitmeyer et al. 1981b.)
THE UNCONSCIOUS MECHANISM OF METACONTRAST SUPPRESSION 257
below the data curves. Its apparent blackness is close to zero at anM1–M2 SOA of �240 ms and is close to maximal at an M1–M2 SOA of�90 ms, after which it declines and is nearly zero again at an M1–M2SOA of 0 ms. Let us now look at target recovery when the onset of M2onset follows that of M1. It can be seen that there is no target recovery atpositive M1–M2 SOAs, i.e. the target’s black contrast stays suppressed.Phenomenologically this is depicted by the unchanged lightness of thecentral disks in the two rightmost disk–annulus displays below the datacurves. The masking effectiveness of M1 as a function of M1–M2 SOAcan be obtained by simply inverting the target recovery function. This isshown by the full squares in Figure 8.2.
In contrast with these mask effectiveness (and target recovery)functions, let us now inspect the effects of M2 on the visibility of M1.At any M1–M2 SOA, M1 visibility is defined as the logarithm of theratio of M1’s matched contrast relative to its matched contrast whenonly the target and M1 are presented at the optimal masking SOA of60 ms. Thus the unsuppressed contrast visibility of M1 at the optimalmasking SOA of 60 ms is defined as its baseline visibility of zero.Inspection of Figure 8.2 shows that at all negative M1–M2 SOAs, M1(including the SOA of 0 ms) the visibility of M1 (open circles) is hardlyaffected by the preceding (or simultaneous) M2.2 Phenomenologically,this is shown by the highly visible inner black annuli depicted belowthe data curves of Figure 8.2 for M1–M2 SOAs ranging from �240 to0 ms. However, when the onset of M2 follows that of M1 at progres-sively larger positive SOAs, M1’s visibility changes are defined by a typ-ical type B U-shaped metacontrast function. Phenomenologically, thisis depicted by the near, if not total, elimination of the blackness of M1at M1–M2 SOAs of 30–60 ms followed by a recovery in the perceivedblackness of M1 as the M1–M2 SOA increases to 120 ms.
The striking feature for consideration of theories of maskingand consciousness and their neural bases is that M2 produces a doubledissociation, at negative and positive M1–M2 SOAs, between changesof M1’s contrast visibility and changes of its masking effectiveness.In other words, over the negative M1–M2 SOA intervals, where onesees almost no changes in M1’s qualia-rich visibility, one neverthelesssees dramatic decreases in M1’s masking effectiveness (correspondingto the increases of recovery of the target’s qualia-rich visibility).However, at positive M1–M2 SOAs, where one obtains a profoundsuppression of M1’s qualia-rich visibility, there is no decrease in M1’s
UNCONSCIOUS PROCESSING REVEALED BY VISUAL MASKING258
masking effectiveness (corresponding to no recovery of T’s qualia-richvisibility). Similar to explanations of double dissociations found inneuropsychological investigations (Teuber 1955), we take the doubledissociation between the decrease in M1’s masking effectivenessand the lack of change in M1’s visibility at negative M1–M2 SOAs, onthe one hand, and the lack of change in M1’s masking effectiveness andthe decrease in M1’s visibility at positive M1–M2 SOAs, on the otherhand, as strong indications for the existence of two separate neuralmechanisms or processes.
The upshot of the above results for theories of consciousness canbe summarized in the following abstract way that does not depend onwhich particular model of masking is adopted. The onset of M1 activatesa neural process S which suppresses target visibility. At negativeM1–M2 SOAs, M1’s process S in turn can be suppressed by M2, butwithout M2 suppressing the visibility of M1. Hence, we can concludethat process S does not contribute to the qualia-rich contour andcontrast visibility of M1. In other words, process S does not register invisual awareness. Similarly, at positive M1–M2 SOAs, the onset of M2suppresses the qualia-rich visibility of M1 but does not interfere withM1’s ability to suppress the qualia-rich visibility of T (as there is norecovery of T’s suppressed visibility). This again shows that the M1-activated process S is invisible and thus does not contribute to thequalia-rich percept of M1. Therefore in each case we postulate a secondstimulus-activated neural process V which does contribute to thequalia-rich awareness of M1.
To convert this abstract scheme into the more concrete RECODmodel of masking we outlined in Chapter 5, we further proposethat processes S and V correspond to neural activities in the transientmagnocellular (M) and parvocellular (P) pathways, respectively. Thisproposal dovetails nicely with (a) the proposal of Crick and Koch(2003), and also of Milner and Goodale (1995), that the activity in thecortical dorsal M-dominant pathway does not contribute substantiallyto conscious vision and (b) evidence derived from blindsight studies(Kentridge et al. 1997, 1999; Sahraie et al. 1997, 1998; Weiskrantz1997). Even with blindsight-induced disruption of the normal corticalM pathway activity, retinal M-cell activity can project directly to thesuperior colliculus (Kaas 1986) and hence, via the pulvinar, to extras-triate visual centers in the cortex. This subcortical M pathway could
UNCONSCIOUS PROCESSING OF OBJECT LOCATION 259
provide a basis for the qualia-poor visual performance found in blind-sight subjects. In normal observers also, the subcortical activity couldcontribute to the qualia-poor performance during metacontrast, ofcourse in addition to the intact dorsal cortical activity. For example,spatiotemporally sequenced activation of this M pathway may give riseto a ‘sense’ of objectless motion reported by blindsight subjects andmay also give rise to the similar objectless ‘pure phi’ sensations reportedin studies of apparent motion in normal observers (Korte 1915;Neuhaus 1930). However, typically we see objects in motion, and forperception of qualia-rich object-in-motion to occur, as already realizedin Marr’s (1982) computational model, the activity of the object-process-ing cortical P channels needs to converge with that of the motion-pro-cessing M channels. Neurophysiological evidence for convergence of Mand P activities has been reported in numerous studies (Ferrera et al.1992; Nealy and Maunsell 1994; Sawatari and Callaway 1996; Yabutaand Callaway 1998).
8.3. Unconscious processing of object locationThe double dissociation discussed above reveals that many aspects orqualities of a stimulus such as its contours and surface properties canbe totally suppressed from conscious perception without changing itseffectiveness as a metacontrast mask. According to the RECODmodel, the transient-channel processes activated by a stimulus areresponsible not only for its metacontrast effects, should that stimulusbe designated as a mask, but also for signaling its location, should itbe designated as the target. Our sketch of the phenomenologyof masking in Chapter 2 indicated that there are three sources ofinformation for detecting the presence or location of a target when itsperception of its qualia is suppressed: (1) a sensation of objectless‘explosive’ or ‘split’ apparent motion proceeding from the location ofthe masked target outward toward the location of the surroundingmask, (2) a paradoxical reversal of the target’s perceived contrast, and(3) the perception of what we can best described as a non-movingtransient ‘blip’ in the target area. The existence of such qualia-suppressed target location representations is reflected in several findingsshowing that some residual target information is immune to meta-contrast masking.
UNCONSCIOUS PROCESSING REVEALED BY VISUAL MASKING260
For instance, Fehrer and Raab (1962) and Fehrer and Biederman(1962) measured simple reaction times to the detection of a targetduring metacontrast and found that the reaction time did not varyappreciably with SOA, contrary to what one would expect if targetreaction time correlated with its subjective visibility. These counter-intuitive findings relating simple reaction time detection to lack ofsubjective awareness have been replicated on several occasions(Bernstein et al. 1973a,b; Harrison and Fox 1966; Lachter and Durgan1999) and in various modalities (Imanaka et al. 2002; Taylor andMcCloskey 1990). Similarly, as shown by Schiller and Smith (1966),even when observers are required to make choice reaction times as towhich of two possible locations the target occupied, the choice reactiontimes did not vary with SOA. On the other hand, when a choice reactiontime is required as to the target’s identity, the reaction times vary inan inverted U-shaped (type B) function with SOA (Eriksen and Eriksen1972). These results, indicating a dissociation between motor responseand conscious percept, may be related to the ability of observersto track or point correctly to the location of target stimuli that arerendered invisible by saccadic suppression (Bridgeman et al. 1981;Goodale et al; 1986; Pélisson et al. 1986). Moreover, they reiterate twoimportant features of metacontrast discussed in Chapter 2. One is thatan observer’s performance depends on the criterion content that he orshe adopts, which in turn depends on the experimental task (Breitmeyer1984; Ventura 1980). Another feature is that, depending on whichcriterion content is adopted, observers are able to detect, on the basisof residual mask-immune information, the mere presence or location ofthe target at metacontrast SOAs at which perception of its qualia-richidentity information is optimally suppressed (Vorberg et al. 2003, 2004).
However, our preceding analysis of target recovery in the context ofthe RECOD model indicates that while metacontrast should not affectthe ability to localize a target, paracontrast should decrease it in a non-monotonic U-shaped manner. This follows from the model’sassumption that the slower sustained-channel activity of a precedingmask suppresses the faster transient-channel activity of a followingtarget stimulus. Consistent with such a decrease, Ögmen et al. (2003)recently reported that paracontrast indeed raises the choice reactiontime to the detection of a target. In this investigation, subjectsresponded as quickly and accurately as possible to the location of atarget appearing randomly to the left or right of the vertical meridian.
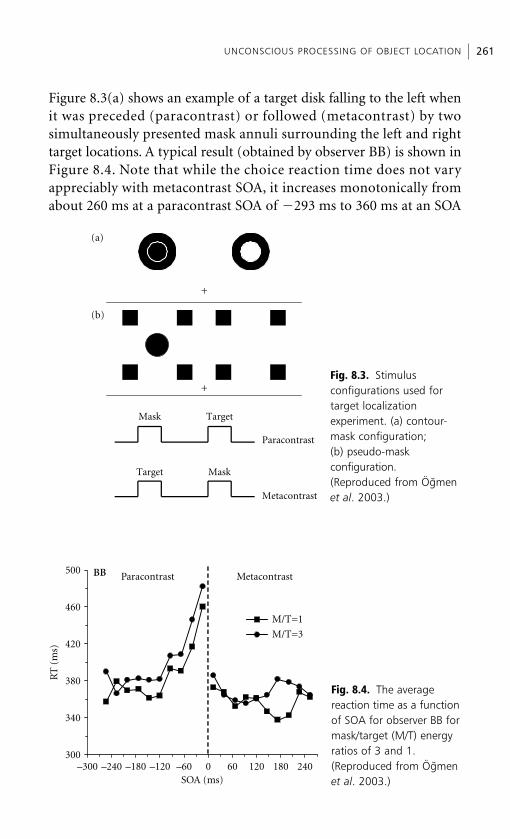
UNCONSCIOUS PROCESSING OF OBJECT LOCATION 261
Figure 8.3(a) shows an example of a target disk falling to the left whenit was preceded (paracontrast) or followed (metacontrast) by twosimultaneously presented mask annuli surrounding the left and righttarget locations. A typical result (obtained by observer BB) is shown inFigure 8.4. Note that while the choice reaction time does not varyappreciably with metacontrast SOA, it increases monotonically fromabout 260 ms at a paracontrast SOA of �293 ms to 360 ms at an SOA
Paracontrast
Metacontrast
Mask
Target
Target
Mask
(a)
(b)
+
+Fig. 8.3. Stimulusconfigurations used fortarget localization experiment. (a) contour-mask configuration; (b) pseudo-mask configuration.(Reproduced from Ögmenet al. 2003.)
300
340
380
420
460
500
–300 –240 –180 –120 –60 0 60 120 180 240SOA (ms)
BB Paracontrast Metacontrast
RT
(m
s)
M/T=1
M/T=3
Fig. 8.4. The average reaction time as a functionof SOA for observer BB formask/target (M/T) energyratios of 3 and 1.(Reproduced from Ögmenet al. 2003.)
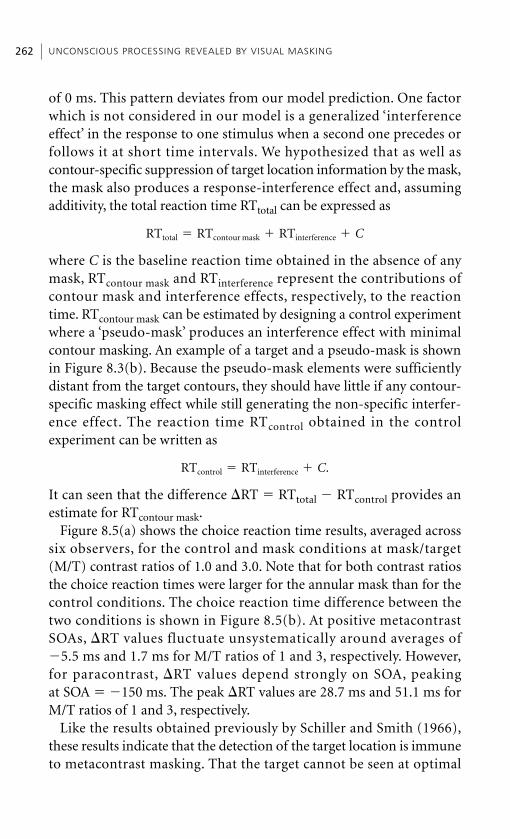
UNCONSCIOUS PROCESSING REVEALED BY VISUAL MASKING262
of 0 ms. This pattern deviates from our model prediction. One factorwhich is not considered in our model is a generalized ‘interferenceeffect’ in the response to one stimulus when a second one precedes orfollows it at short time intervals. We hypothesized that as well ascontour-specific suppression of target location information by the mask,the mask also produces a response-interference effect and, assumingadditivity, the total reaction time RTtotal can be expressed as
where C is the baseline reaction time obtained in the absence of anymask, RTcontour mask and RTinterference represent the contributions ofcontour mask and interference effects, respectively, to the reactiontime. RTcontour mask can be estimated by designing a control experimentwhere a ‘pseudo-mask’ produces an interference effect with minimalcontour masking. An example of a target and a pseudo-mask is shownin Figure 8.3(b). Because the pseudo-mask elements were sufficientlydistant from the target contours, they should have little if any contour-specific masking effect while still generating the non-specific interfer-ence effect. The reaction time RTcontrol obtained in the controlexperiment can be written as
It can seen that the difference �RT � RTtotal � RTcontrol provides anestimate for RTcontour mask.
Figure 8.5(a) shows the choice reaction time results, averaged acrosssix observers, for the control and mask conditions at mask/target(M/T) contrast ratios of 1.0 and 3.0. Note that for both contrast ratiosthe choice reaction times were larger for the annular mask than for thecontrol conditions. The choice reaction time difference between thetwo conditions is shown in Figure 8.5(b). At positive metacontrastSOAs, �RT values fluctuate unsystematically around averages of�5.5 ms and 1.7 ms for M/T ratios of 1 and 3, respectively. However,for paracontrast, �RT values depend strongly on SOA, peakingat SOA � �150 ms. The peak �RT values are 28.7 ms and 51.1 ms forM/T ratios of 1 and 3, respectively.
Like the results obtained previously by Schiller and Smith (1966),these results indicate that the detection of the target location is immuneto metacontrast masking. That the target cannot be seen at optimal
RTcontrol � RTinterference � C.
RTtotal � RTcontour mask � RTinterference � C
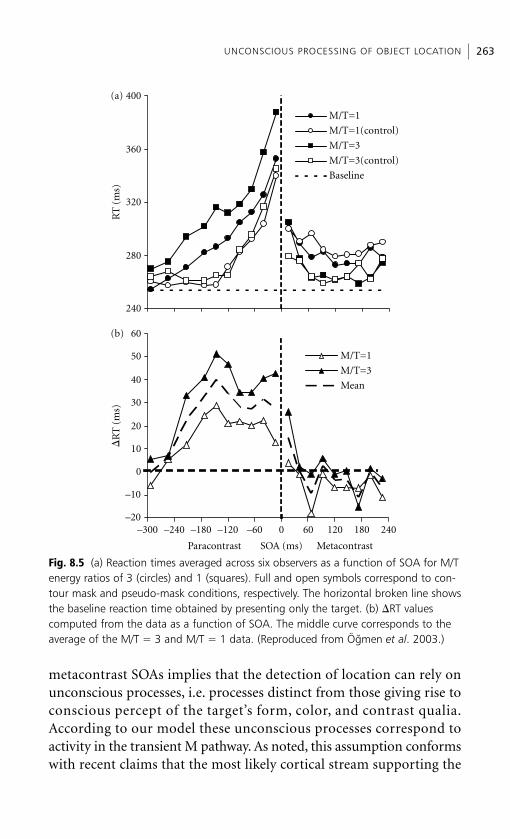
UNCONSCIOUS PROCESSING OF OBJECT LOCATION 263
metacontrast SOAs implies that the detection of location can rely onunconscious processes, i.e. processes distinct from those giving rise toconscious percept of the target’s form, color, and contrast qualia.According to our model these unconscious processes correspond toactivity in the transient M pathway. As noted, this assumption conformswith recent claims that the most likely cortical stream supporting the
240
280
320
360
400(a)
(b)
RT
(m
s)M/T=1
M/T=1(control)
M/T=3
M/T=3(control)
Baseline
–20
–10
0
10
20
30
40
50
60
–300 –240 –180 –120 –60 0 60 120 180 240
�R
T (
ms)
M/T=1
M/T=3
Mean
Paracontrast SOA (ms) Metacontrast
Fig. 8.5 (a) Reaction times averaged across six observers as a function of SOA for M/Tenergy ratios of 3 (circles) and 1 (squares). Full and open symbols correspond to con-tour mask and pseudo-mask conditions, respectively. The horizontal broken line showsthe baseline reaction time obtained by presenting only the target. (b) �RT values computed from the data as a function of SOA. The middle curve corresponds to theaverage of the M/T � 3 and M/T � 1 data. (Reproduced from Ögmen et al. 2003.)
‘zombie’ (Koch and Crick 2001) or unconscious mode of processing isthe dorsal M-dominated stream (Crick and Koch 2003; Milner andGoodale 1995). Of course, studies of blindsight patients indicate thatmidbrain sites such as the superior colliculus, which receives direct M-pathway projections from the retina (Kaas 1986) and interacts withthe dorsal stream, could also contribute to unconscious processingof the location or change of location (motion) of visual stimuli(Ro et al. 2004; Stoerig 1996, 2002; Weiskrantz, 1997).
8.4. Unconscious processing of object-identityinformation: color and formThe perception and identification of objects depends not only on formbut also on color. For instance, we often differentiate ripe from unripefruit or edible from inedible foods not on the basis of form butrather on the basis of color. The ventral cortical stream of processingfor object vision (Ungerleider 1985; Ungerleider and Mishkin 1982) isa P-dominated pathway, which in turn is divided into the ‘blob’ and‘interblob’ pathways processing surface properties of objects, such ascolor and brightness, and form properties, such as oriented edges andcontours, respectively (De Yoe and Van Essen 1988; Xiao et al. 2003).These anatomically and physiologically distinct P pathways compriseanalogues of neural-network models such as the FACADE modeldeveloped by Grossberg and colleagues (Cohen and Grossberg 1984;Grossberg 1994). In this model the blob and interblob P pathwayscorrespond to the feature contour system (FCS) and the boundarycontour system (BCS), with the former processing surface propertiesand the latter edge or contour information of objects. Although activityin the ventral pathway is associated with perception or conscious vision(Crick and Koch 2003; Milner and Goodale 1995), results we reviewindicate that unconscious form and color processing may occur atseveral levels in this pathway.
While a reasonably strong case for unconscious visual processingin blindsight patients has been made over the past several decades(Weiskrantz 1997), in normal observers the case has been moreproblematic if not contentious (Holender 1986; Merikle 1992). Someevidence for unconscious visual processing in normal observers hasalso accumulated over the past two decades (Marcel 1983a,b;
UNCONSCIOUS PROCESSING REVEALED BY VISUAL MASKING264
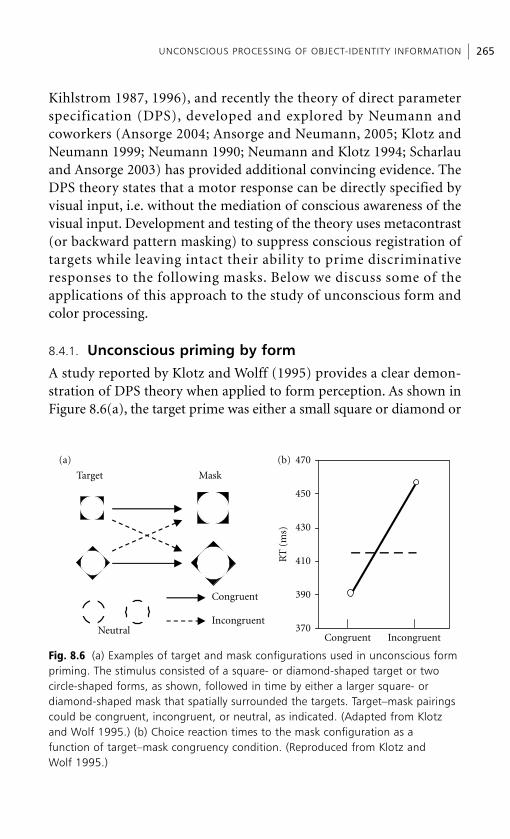
Kihlstrom 1987, 1996), and recently the theory of direct parameterspecification (DPS), developed and explored by Neumann andcoworkers (Ansorge 2004; Ansorge and Neumann, 2005; Klotz andNeumann 1999; Neumann 1990; Neumann and Klotz 1994; Scharlauand Ansorge 2003) has provided additional convincing evidence. TheDPS theory states that a motor response can be directly specified byvisual input, i.e. without the mediation of conscious awareness of thevisual input. Development and testing of the theory uses metacontrast(or backward pattern masking) to suppress conscious registration oftargets while leaving intact their ability to prime discriminativeresponses to the following masks. Below we discuss some of theapplications of this approach to the study of unconscious form andcolor processing.
8.4.1. Unconscious priming by form
A study reported by Klotz and Wolff (1995) provides a clear demon-stration of DPS theory when applied to form perception. As shown inFigure 8.6(a), the target prime was either a small square or diamond or
UNCONSCIOUS PROCESSING OF OBJECT-IDENTITY INFORMATION 265
Target Mask
Congruent
IncongruentNeutral
(a) (b)
RT
(m
s)
370
390
410
430
450
470
Congruent Incongruent
Fig. 8.6 (a) Examples of target and mask configurations used in unconscious formpriming. The stimulus consisted of a square- or diamond-shaped target or twocircle-shaped forms, as shown, followed in time by either a larger square- or diamond-shaped mask that spatially surrounded the targets. Target–mask pairingscould be congruent, incongruent, or neutral, as indicated. (Adapted from Klotzand Wolf 1995.) (b) Choice reaction times to the mask configuration as afunction of target–mask congruency condition. (Reproduced from Klotz and Wolf 1995.)
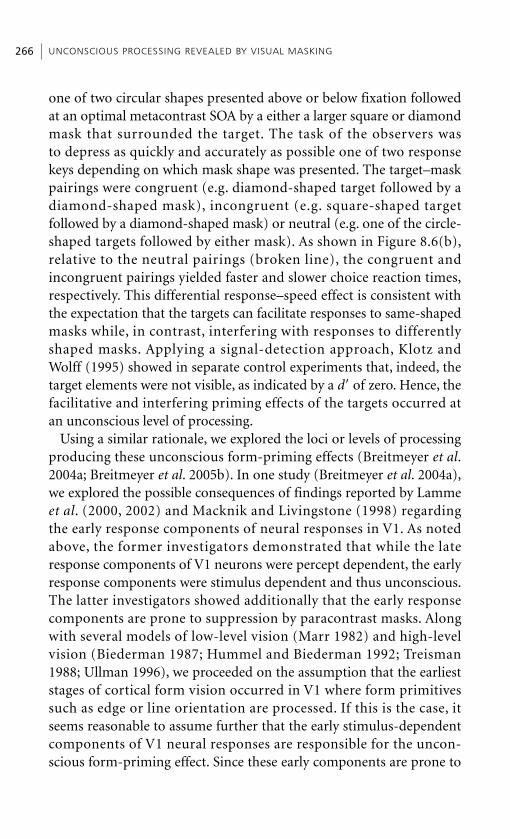
one of two circular shapes presented above or below fixation followedat an optimal metacontrast SOA by a either a larger square or diamondmask that surrounded the target. The task of the observers wasto depress as quickly and accurately as possible one of two responsekeys depending on which mask shape was presented. The target–maskpairings were congruent (e.g. diamond-shaped target followed by adiamond-shaped mask), incongruent (e.g. square-shaped targetfollowed by a diamond-shaped mask) or neutral (e.g. one of the circle-shaped targets followed by either mask). As shown in Figure 8.6(b),relative to the neutral pairings (broken line), the congruent andincongruent pairings yielded faster and slower choice reaction times,respectively. This differential response–speed effect is consistent withthe expectation that the targets can facilitate responses to same-shapedmasks while, in contrast, interfering with responses to differentlyshaped masks. Applying a signal-detection approach, Klotz andWolff (1995) showed in separate control experiments that, indeed, thetarget elements were not visible, as indicated by a d� of zero. Hence, thefacilitative and interfering priming effects of the targets occurred atan unconscious level of processing.
Using a similar rationale, we explored the loci or levels of processingproducing these unconscious form-priming effects (Breitmeyer et al.2004a; Breitmeyer et al. 2005b). In one study (Breitmeyer et al. 2004a),we explored the possible consequences of findings reported by Lammeet al. (2000, 2002) and Macknik and Livingstone (1998) regardingthe early response components of neural responses in V1. As notedabove, the former investigators demonstrated that while the lateresponse components of V1 neurons were percept dependent, the earlyresponse components were stimulus dependent and thus unconscious.The latter investigators showed additionally that the early responsecomponents are prone to suppression by paracontrast masks. Alongwith several models of low-level vision (Marr 1982) and high-levelvision (Biederman 1987; Hummel and Biederman 1992; Treisman1988; Ullman 1996), we proceeded on the assumption that the earlieststages of cortical form vision occurred in V1 where form primitivessuch as edge or line orientation are processed. If this is the case, itseems reasonable to assume further that the early stimulus-dependentcomponents of V1 neural responses are responsible for the uncon-scious form-priming effect. Since these early components are prone to
UNCONSCIOUS PROCESSING REVEALED BY VISUAL MASKING266
paracontrast suppression, it follows that a mask preceding the target atoptimal paracontrast SOAs should reduce the unconscious form-primingeffect that the target has on a mask following at optimal metacontrastSOAs. However, our results showed that a paracontrast mask did notaffect the unconscious form priming; if anything, the priming effectson the choice reaction times were slightly, although not significantly,increased by a paracontrast mask. These findings rule out the earliestcortical response levels as the sites of unconscious form priming.In fact, our follow-up studies (Breitmeyer et al. 2005b) indicated thatunconscious form processing probably occurs at or beyond levelswhere the form primitives of orientation are conjoined or integratedinto representations of more complex form features such as cornersand vertices, or very likely even the whole form, as independentlyindicated by the recent findings of Mitroff and Scholl (2005). Henceunconscious form priming may occur at late whole-form-dependentrather than early feature-dependent levels of processing. Moreover, ourfindings imply that the mechanism responsible for metacontrastsuppression of form (edge and contour information) is located atrelatively late levels of processing. This, as we saw in Chapter 4,has important theoretical consequences, since it, together with otherevidence (Breitmeyer and Ögmen 2000), raises serious doubts con-cerning early cortical sites of metacontrast suppression as proposed byBreitmeyer (1984).
8.4.2. Unconscious priming by color
Different conclusions apply to unconscious processing of chromaticinformation. Evidence supporting direct parameter specification ofcolor information has been reported recently by Schmidt (2000, 2002).These studies showed that, for example, a green target facilitated choicereaction times to following metacontrast masks with a congruentgreen color but interfered with choice reaction times to masks ofan incongruent red mask. Follow-up studies reported by Breitmeyerand coworkers (Breitmeyer et al. 2004a,c) indicate that, unlike formpriming, unconscious color priming occurs at the early stimulus-dependent cortical levels of processing. In particular, Breitmeyer et al.(2004c) showed that a white target prime produced an incongruencyeffect that was significantly larger when the following mask was(a desaturated) blue than when it was (a desaturated) green (Fig. 8.7),
UNCONSCIOUS PROCESSING OF OBJECT-IDENTITY INFORMATION 267
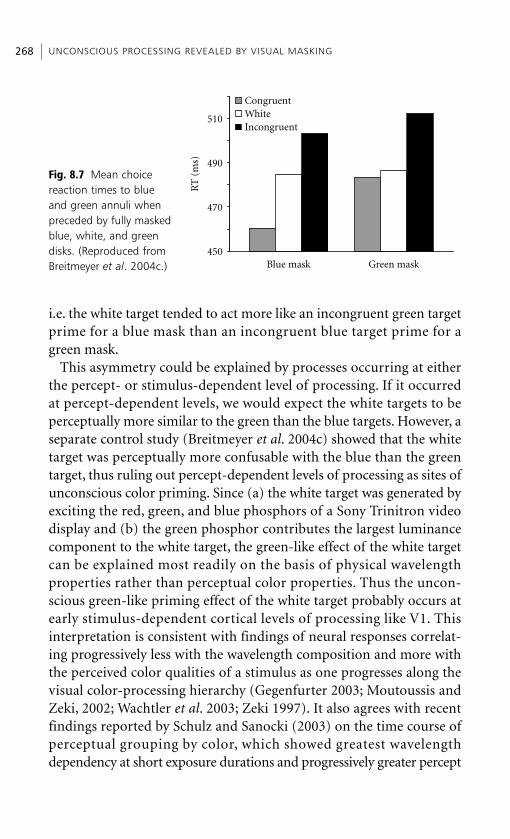
i.e. the white target tended to act more like an incongruent green targetprime for a blue mask than an incongruent blue target prime for agreen mask.
This asymmetry could be explained by processes occurring at eitherthe percept- or stimulus-dependent level of processing. If it occurredat percept-dependent levels, we would expect the white targets to beperceptually more similar to the green than the blue targets. However, aseparate control study (Breitmeyer et al. 2004c) showed that the whitetarget was perceptually more confusable with the blue than the greentarget, thus ruling out percept-dependent levels of processing as sites ofunconscious color priming. Since (a) the white target was generated byexciting the red, green, and blue phosphors of a Sony Trinitron videodisplay and (b) the green phosphor contributes the largest luminancecomponent to the white target, the green-like effect of the white targetcan be explained most readily on the basis of physical wavelengthproperties rather than perceptual color properties. Thus the uncon-scious green-like priming effect of the white target probably occurs atearly stimulus-dependent cortical levels of processing like V1. Thisinterpretation is consistent with findings of neural responses correlat-ing progressively less with the wavelength composition and more withthe perceived color qualities of a stimulus as one progresses along thevisual color-processing hierarchy (Gegenfurter 2003; Moutoussis andZeki, 2002; Wachtler et al. 2003; Zeki 1997). It also agrees with recentfindings reported by Schulz and Sanocki (2003) on the time course ofperceptual grouping by color, which showed greatest wavelengthdependency at short exposure durations and progressively greater percept
UNCONSCIOUS PROCESSING REVEALED BY VISUAL MASKING268
450
470
490
510
Blue mask Green mask
RT
(m
s)
CongruentWhiteIncongruent
Fig. 8.7 Mean choicereaction times to blue and green annuli whenpreceded by fully maskedblue, white, and greendisks. (Reproduced fromBreitmeyer et al. 2004c.)

or color dependency at progressively longer exposure durations.Breitmeyer et al. (2004a) independently confirmed the wavelengthdependency of unconscious color priming by specifically manipulatingthe strength of the early feedforward stimulus-dependent componentof V1 neural responses (Lamme et al. 2000). They showed that a maskpresented at optimal paracontrast SOAs preceding the target primereduces the color priming effect of the target on the subsequently pre-sented metacontrast mask. Such a reduction would be expected if, asshown by Macknik and Livingstone (1998), the early response compo-nent of V1 neurons to the target is suppressed by a paracontrast mask.
Several interesting conclusions can be drawn from the combinedresults of the form- and color-priming studies. First, both types ofpriming are most likely due to the activity in the rapid feedforwardsweep of cortical processing that proceeds unconsciously. The uncon-scious nature of this processing is also supported by recent evidencereported by Lamme (2000) and VanRullen and Koch (2003). Secondly,they show that while unconscious color priming can occur at the earli-est wavelength-dependent levels of processing in V1, unconscious formpriming appears to occur at later levels (e.g. V4 or IT cortex) where atleast conjunctions of simple form primitives if not representations ofwhole forms are processed. Thirdly, they are consistent with the notionthat an object’s surface properties, such as color or contrast, are processedin visual pathways distinct from those processing form properties likeedge orientation, angles, or vertices (De Yoe and Van Essen 1988; Xiaoet al. 2003). Finally, together with the findings reviewed in Chapter 2,sections 2.5 and 2.6.4, they suggest that masking is not a unitaryprocess in that masking of surface properties (e.g. its contrast) is distinctfrom masking of contour properties. However, more research isrequired to elucidate fully the properties of these distinct maskingprocesses.
8.5. Unconscious processing and attentionWe noted above that when conscious registration of a target’s attributesis suppressed by a mask, residual unconsciously processed informationcan nonetheless be made available to a number of behavioral controlsystems. In view of the fact that consciousness and attention are closelyrelated (James 1950; Posner 1994), two interesting questions are raisedby these findings. One is whether the effective use of this residual target
UNCONSCIOUS PROCESSING AND ATTENTION 269
information, being processed preconsciously, is also processedpreattentively, i.e. without the need of visual attention. The otherquestion is whether the unconsciously processed target informationcan be used to control attention. Here we review work indicating thatattention can influence the processing of target information when it isrendered phenomenally invisible to conscious report by the after-coming mask and conversely that fully masked targets can influencethe deployment of visual attention.
The answer to the first question appears to be that the processing ofresidual preconscious information requires attention. In a series ofexperiments, Nacchache et al. (2002) recently examined unconsciouspriming effects of a masked number prime on a number-comparisontask. A briefly flashed number prime (1–4 or 6–9) was immediatelypreceded and followed by a pattern mask, thus rendering the primeinaccessible to consciousness. A clearly visible probe number was pre-sented immediately after the mask, and observers were asked to pressone of two response keys indicating whether the probe was less orgreater than 5. Analyses of the choice reaction times showed thatobtaining unconscious priming effects, in the form of faster responseswhen the prime and probe numbers were both either greater or less than5, requires that observers allocate attention to the temporal intervalduring which the prime–probe pair is presented. In a related study,Ansorge (2004) recently showed that unconscious priming effects of amasked prime are subject to dual-task interference by being reducedwhen a second task interferes with the processing of the prime. Such aresult is not expected if the processing of unconscious information isautomatic or preattentive. Moreover, the belief that the processing ofemotional faces rendered invisible by an aftercoming mask occursautomatically or preattentively (Dolan 2002; Öhman 2002) may haveto be revised, since a recent study on monkey (Pessoa et al. 2002)showed that brain regions responding differentially to emotional faceswere activated only when sufficient levels of attention were availablefor processing the faces.
Results such as these indicating that attention must, and thus can,modulate the unconscious processing of stimuli are consistent with theresults of the investigation of attention in a neurological patient withblindsight (Kentridge et al. 1999). Blindsight results from damagerestricted to sites in area V1 of the visual cortex (Weiskrantz 1997).
UNCONSCIOUS PROCESSING REVEALED BY VISUAL MASKING270
In the patient investigated by Kentridge et al., the reaction times tostimuli presented to the blind field were facilitated by his attending tothe location of a test stimulus presented in the blind field. This showsthat attention directed to a test stimulus can facilitate its unconsciousprocessing.
The second question as to whether the unconsciously processed targetinformation can be used by the visual system to strategically controland direct attention and action can also be answered positively(Ansorge 2004; Ansorge and Neumann, 2005; Jaskowski, Skalska andVorleger, 2003; Jaskowski et al. 2002; Schlotterbeck and Vorleger 2002;Woodman and Luck, 2003). Recording VEPs, Jaskowski et al. (2002)recently explored the posterior contralateral negativity (PCN) knownto reflect attention-controlled stimulus selection (Eimer 1996; Wascheret al. 2001; Wauschkuhn et al. 1998; Woodman and Luck 1999). Theirresults indicate that the form-selective aspects of an invisible prime canactivate attentional processes that modify the PCN to the (mask) stimu-lus following the prime (target). Presumably this form-selective or object-based attentional modulation uses the unconsciously processed forminformation reviewed in section 8.4.1 above.
Similarly, McCormick (1997) and Scharlau and Ansorge (2003)showed that invisible stimuli can activate location-specific attentionalprocesses. The conclusion that attention can be directed to the locationof stimuli rendered invisible by an aftercoming mask is supportedby independent results of studies on neurological blindsight patients.Many of the residual visual abilities of a blindsight patient rely on thespared extrageniculate pathway consisting of direct retinal projectionsto the superior colliculus of the midbrain, in turn projecting to thepulvinar of the thalamus, and hence to spared post-striate visual areasof cortex (Rafal et al. 1990; Weiskrantz 1997). Since evidence implicatesthis pathway in the orienting of attention to visual stimuli and theirfeatures (LaBerge 1995; Posner and Petersen 1990), reaction timebenefits of attention to stimuli presented in the cortical (V1) scotomasof a blindsight subject should be obtainable despite the subject’s beingunaware of the stimuli.
These combined findings—that attention can modulate theunconscious (as well as conscious) processing of visual informationand conversely that unconsciously (as well as consciously) processedinformation can be used to strategically deploy attention—indicate
UNCONSCIOUS PROCESSING AND ATTENTION 271
that attention and consciousness, although typically closely related(James 1950; Posner 1994), are by and large distinct, a point recentlyarticulated more fully by Lamme (2000, 2003). To us it seems fair, onthe basis of the above findings, to claim that attention is necessary butnot sufficient for at least a type of visual consciousness which corres-ponds to what Block (1995, 1996) has termed access consciousness, aform of consciousness that, for example, accompanies retrieval ofinformation from visual short-term (iconic) store for verbal report orphenomenal description about a select few items from a larger arrayof items (Sperling 1960). Whether attention is necessary for whatBlock (1995, 1996) terms phenomenal consciousness (e.g. displayitems present in the phenomenal field that fail to be reported) is debat-able, although recent results reported by Joseph et al. (1997) indicatethat even the putative ‘preattentive’ processing of information in thephenomenal field actually does require some (spatially global or dis-tributed) attention. However, the nature of the extrafoveal ‘preattentive’search task, ancillary to a primary target-identification task in a fovealattentional blink paradigm, would also require the entry of peripheraltargets into access consciousness. This dual task in turn would requirethat at least some attention, perhaps otherwise not available, be madeavailable by the observer for processing of the peripheral target. Hencethe question as to whether phenomenal awareness, i.e. awareness that isnot accessed for report, requires attention remains an open issue.
8.6. Metacontrast and the psychophysics of induced ‘blindness’
8.6.1. Metacontrast and binocular rivalry suppression
There are ways other than metacontrast to ‘skin’ conscious perceptions,thus producing temporary ‘blindness’. One of them is to inducebinocular rivalry, which alternately suppresses from conscious aware-ness the inputs to one eye or the other (Alais and Blake 2005). Recently,Breitmeyer et al. (2005a) combined binocular rivalry suppression withmetacontrast suppression to assess the functional locus of the latter tothe former. The target and mask were each presented for 10 ms ata metacontrast SOA of 50, which produced optimal suppression of thetarget visibility. The target, one of three disk-like stimuli, was presentedto the left eye and the mask, one of three ring-like stimuli to the right
UNCONSCIOUS PROCESSING REVEALED BY VISUAL MASKING272
eye. In the non-rivalrous condition, the target and mask were presentedunder standard dichoptic viewing without binocular rivalry. Based onprior reports of dichoptic metacontrast (see Chapter 2, section 2.6.7),the expected outcome here was a low visibility of the target and a highvisibility of the mask. In the rivalrous condition, the observers wereasked to initiate a target–mask sequence only when the left (target) eyewas in a dominant state and the right (mask) eye was in a suppressedstate during binocular rivalry. Recall from Section 8.2 that a briefstimulus, such as a metacontrast mask, activates two neural processes:one occurring at unconscious levels of processing and giving rise to itseffectiveness as a mask, the other giving rise to its visibility. Here twopredictions are warranted, depending on whether or not binocularrivalry can cancel or suppress the neural mechanism responsible forthe mask’s effectiveness in suppressing the target disk’s visibility.
1. If the cortical metacontrast mechanism, like the process of stead-state (non-transient) dichoptic masking (Westendorf 1989), is itselfsuppressed by binocular rivalry, metacontrast suppression of the disksshould not occur. Consequently, the target should be highly visible.Moreover, the mask should have low visibility, since the activation ofneural processes giving rise to its perception is suppressed when theright (mask) eye is in a suppressed phase of binocular rivalry.
2. In contrast, if binocular rivalry suppression does not suppress thecortical metacontrast process, metacontrast suppression of the diskswill occur, thus rendering a low target visibility. The mask again shouldnot be visible, since it is presented when the right (mask) eye is in asuppressed state of binocular rivalry.
As shown in Figure 8.8, in the non-rivalrous condition, the expecteddichoptic metacontrast effect was obtained: target visibility was lowand mask visibility was high. In the rivalrous condition, Prediction 1was confirmed: the target was highly visible, whereas the visibility ofthe mask was suppressed. Thus, along with the neural processescontributing to the visibility of the mask, the unconscious mechanismresponsible for metacontrast suppression of target visibility can in turnbe suppressed by binocular rivalry. Exactly where binocular rivalry ormetacontrast is resolved is not clear. Several studies indicate thatrivalry is resolved at relatively low levels of cortical processing (Carlsonand He 2004; Lee and Blake 2002, 2004; Polonsky et al. 2000; Tong and
METACONTRAST AND THE PSYCHOPHYSICS OF INDUCED ‘BLINDNESS’ 273
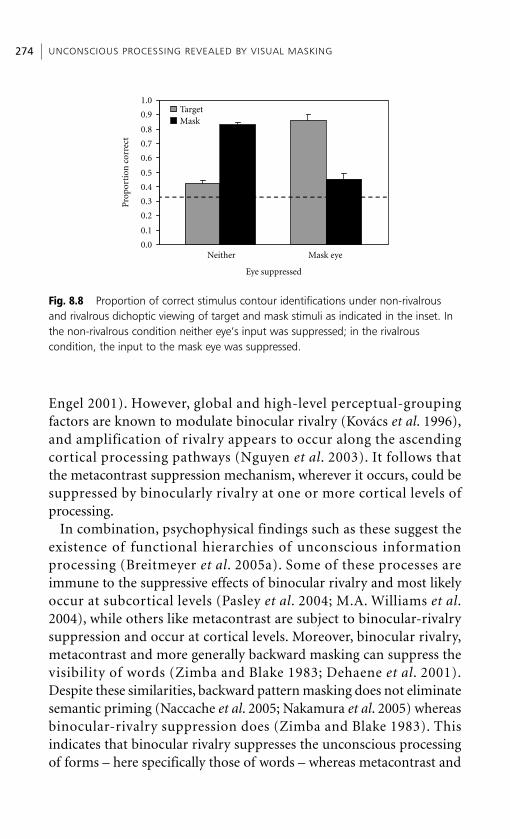
Engel 2001). However, global and high-level perceptual-groupingfactors are known to modulate binocular rivalry (Kovács et al. 1996),and amplification of rivalry appears to occur along the ascendingcortical processing pathways (Nguyen et al. 2003). It follows thatthe metacontrast suppression mechanism, wherever it occurs, could besuppressed by binocularly rivalry at one or more cortical levels ofprocessing.
In combination, psychophysical findings such as these suggest theexistence of functional hierarchies of unconscious informationprocessing (Breitmeyer et al. 2005a). Some of these processes areimmune to the suppressive effects of binocular rivalry and most likelyoccur at subcortical levels (Pasley et al. 2004; M.A. Williams et al.2004), while others like metacontrast are subject to binocular-rivalrysuppression and occur at cortical levels. Moreover, binocular rivalry,metacontrast and more generally backward masking can suppress thevisibility of words (Zimba and Blake 1983; Dehaene et al. 2001).Despite these similarities, backward pattern masking does not eliminatesemantic priming (Naccache et al. 2005; Nakamura et al. 2005) whereasbinocular-rivalry suppression does (Zimba and Blake 1983). Thisindicates that binocular rivalry suppresses the unconscious processingof forms – here specifically those of words – whereas metacontrast and
UNCONSCIOUS PROCESSING REVEALED BY VISUAL MASKING274
Pro
port
ion
cor
rect
0.0
0.1
0.2
0.3
0.4
0.5
0.6
0.7
0.8
0.9
1.0TargetMask
Neither Mask eye
Eye suppressed
Fig. 8.8 Proportion of correct stimulus contour identifications under non-rivalrousand rivalrous dichoptic viewing of target and mask stimuli as indicated in the inset. Inthe non-rivalrous condition neither eye’s input was suppressed; in the rivalrous condition, the input to the mask eye was suppressed.
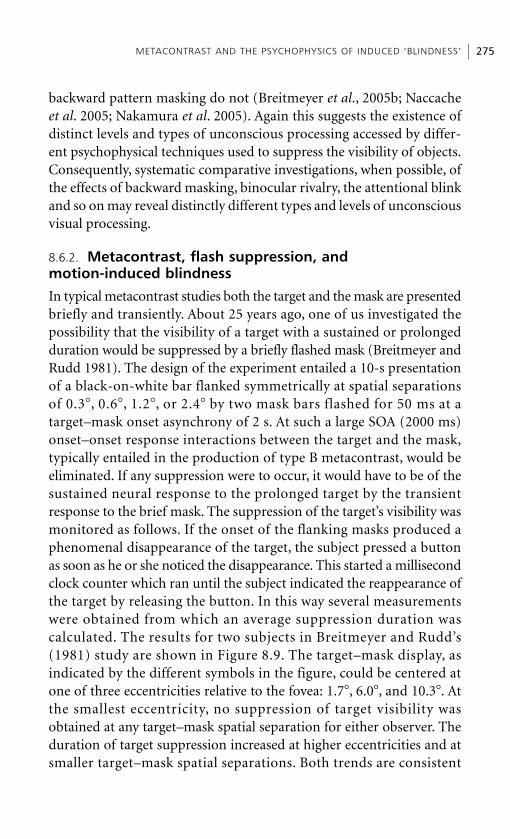
backward pattern masking do not (Breitmeyer et al., 2005b; Naccacheet al. 2005; Nakamura et al. 2005). Again this suggests the existence ofdistinct levels and types of unconscious processing accessed by differ-ent psychophysical techniques used to suppress the visibility of objects.Consequently, systematic comparative investigations, when possible, ofthe effects of backward masking, binocular rivalry, the attentional blinkand so on may reveal distinctly different types and levels of unconsciousvisual processing.
8.6.2. Metacontrast, flash suppression, and motion-induced blindness
In typical metacontrast studies both the target and the mask are presentedbriefly and transiently. About 25 years ago, one of us investigated thepossibility that the visibility of a target with a sustained or prolongedduration would be suppressed by a briefly flashed mask (Breitmeyer andRudd 1981). The design of the experiment entailed a 10-s presentationof a black-on-white bar flanked symmetrically at spatial separationsof 0.3�, 0.6�, 1.2�, or 2.4� by two mask bars flashed for 50 ms at atarget–mask onset asynchrony of 2 s. At such a large SOA (2000 ms)onset–onset response interactions between the target and the mask,typically entailed in the production of type B metacontrast, would beeliminated. If any suppression were to occur, it would have to be of thesustained neural response to the prolonged target by the transientresponse to the brief mask. The suppression of the target’s visibility wasmonitored as follows. If the onset of the flanking masks produced aphenomenal disappearance of the target, the subject pressed a buttonas soon as he or she noticed the disappearance. This started a millisecondclock counter which ran until the subject indicated the reappearance ofthe target by releasing the button. In this way several measurementswere obtained from which an average suppression duration wascalculated. The results for two subjects in Breitmeyer and Rudd’s(1981) study are shown in Figure 8.9. The target–mask display, asindicated by the different symbols in the figure, could be centered atone of three eccentricities relative to the fovea: 1.7�, 6.0�, and 10.3�. Atthe smallest eccentricity, no suppression of target visibility wasobtained at any target–mask spatial separation for either observer. Theduration of target suppression increased at higher eccentricities and atsmaller target–mask spatial separations. Both trends are consistent
METACONTRAST AND THE PSYCHOPHYSICS OF INDUCED ‘BLINDNESS’ 275

with similar variations in the magnitude of metacontrast suppressionobtained when viewing eccentricity or target–mask spatial separationare systematically varied (see Chapter 2, section 2.6.6). Thus it appearsthat the two-transient paradigm is not a necessary condition forobtaining masking effects, but rather that a single transient elicited bythe mask is sufficient. We called this effect specific flash suppression(SFS), since the mask was specifically aimed at (or near) the location ofthe target.
Recently, SFS has been rediscovered by Kanai and Kamitani (2003),and a variation of it has also been reported by May et al. (2003). Otherpsychophysical methods of rendering visual stimuli unconsciousare generalized flash suppression (GFS) (Wilke et al. 2003) and motion-induced blindness (MIB) (Bonneh et al. 2001; Hofstoetter et al. 2004).GFS is akin to SFS in that a large array of incoherently moving dots(similar to Brownian motion) surrounding, but not immediatelyadjacent to, the area of the target is presented a couple of seconds after
UNCONSCIOUS PROCESSING REVEALED BY VISUAL MASKING276
5
4
3
2
1
0
0.6 1.2 1.8
MK
1.7 6.0 10.3
BB
Eccentricity (deg)
0 2.4
Target–mask spatial seperation (deg)
Tar
get
supp
ress
ion
du
rati
on (
s)
6
–1
Fig. 8.9 The duration of suppression of the visibility of the sustained target bar afterpresentation of a 50-ms set of flanking mask bars as a function of target mask spatial separation and viewing eccentricity. Results are shown for two observers.(Reproduced from Breitmeyer and Rudd 1981.)
introduction of the target display. Here too, fading of the target istimed to the onset of the mask, increases with target eccentricity, anddecreases with the spatial separation of the target and the random dots(Wilke et al. 2003). MIB differs from GFS in that the motion of therandom dots is coherent, but it similarly produces target fading whichalso varies with stimulus parameters such as the density and contrast ofthe dots (Bonneh et al. 2001). All three methods (SFS, GFS, and MIB)are closely related to metacontrast suppression. In our opinion theyrely on the activation of the transient- or motion-sensitive M pathway,which in turn suppresses the sustained P activity generated by thetarget. Moreover, we believe that, via this common suppressivemechanism, they exploit the semistabilized nature of extrafovealstationary stimuli and thus are a form of ‘facilitated’ Troxler fading(Troxler 1804).
8.7. The masking of visual targets by transcranialmagnetic stimulationWhile visual masks have been used for over a century to degrade orsuppress the conscious registration of visual targets, recent developmentshave allowed the use of transcranial magnetic stimulation (TMS) todisrupt the brain’s processing of visual targets. In TMS masking amagnetic pulse, applied to the area overlying the occipital lobe,produces a brief and spatially localized scotoma in the visual field(sometimes accompanied by a localized phosphene sensation) thatmasks the visibility of a target falling in the same area as the scotoma.By systematically moving the location of the magnet producing theTMS over the occipital region of the skull, one can (to some extent)vary the location of the scotoma in the visual field. Moreover, byadditionally varying the SOA between the TMS pulse and the target,one can investigate the time course of processing in early (V1/V2)visual areas of the brain (Amassian et al. 1989, 1998; Corthout et al.1999a,b, 2000) and how that processing relates to the microgenesis ofvisual consciousness.
8.7.1. TMS suppression of visual targets
A series of experiments conducted by Corthout et al. (1999a,b)illustrates the masking effects of TMS on foveal targets consisting of
THE MASKING OF VISUAL TARGETS BY TMS 277
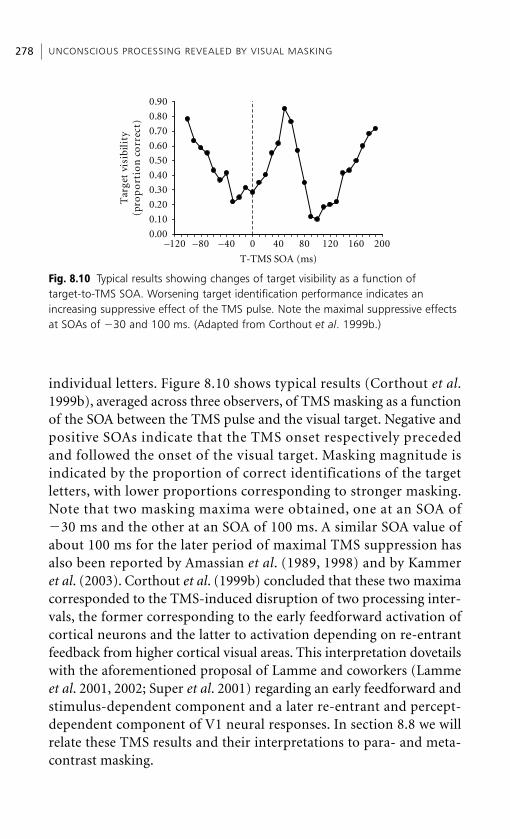
individual letters. Figure 8.10 shows typical results (Corthout et al.1999b), averaged across three observers, of TMS masking as a functionof the SOA between the TMS pulse and the visual target. Negative andpositive SOAs indicate that the TMS onset respectively precededand followed the onset of the visual target. Masking magnitude isindicated by the proportion of correct identifications of the targetletters, with lower proportions corresponding to stronger masking.Note that two masking maxima were obtained, one at an SOA of�30 ms and the other at an SOA of 100 ms. A similar SOA value ofabout 100 ms for the later period of maximal TMS suppression hasalso been reported by Amassian et al. (1989, 1998) and by Kammeret al. (2003). Corthout et al. (1999b) concluded that these two maximacorresponded to the TMS-induced disruption of two processing inter-vals, the former corresponding to the early feedforward activation ofcortical neurons and the latter to activation depending on re-entrantfeedback from higher cortical visual areas. This interpretation dovetailswith the aforementioned proposal of Lamme and coworkers (Lammeet al. 2001, 2002; Super et al. 2001) regarding an early feedforward andstimulus-dependent component and a later re-entrant and percept-dependent component of V1 neural responses. In section 8.8 we willrelate these TMS results and their interpretations to para- and meta-contrast masking.
UNCONSCIOUS PROCESSING REVEALED BY VISUAL MASKING278
T-TMS SOA (ms)
Tar
get
visi
bili
ty(p
rop
ort
ion
co
rrec
t)
0.00
0.10
0.20
0.30
0.40
0.50
0.60
0.70
0.80
0.90
–120 –80 –40 0 40 80 120 160 200
Fig. 8.10 Typical results showing changes of target visibility as a function of target-to-TMS SOA. Worsening target identification performance indicates anincreasing suppressive effect of the TMS pulse. Note the maximal suppressive effectsat SOAs of �30 and 100 ms. (Adapted from Corthout et al. 1999b.)
8.7.2. TMS and the disinhibition or recovery of visually masked targets
In section 8.2 we reviewed findings on how a secondary visual mask,by inhibiting the masking effects of a primary visual mask, canrecover a target’s visibility which would otherwise, in the absence ofthe secondary mask, remain suppressed by the primary mask.In similar fashion a TMS pulse can be used as a secondary mask tosuppress the inhibitory effects of a primary visual mask on a target.In a study by Amassian et al. (1993) a brief target consisting of athree-letter trigram was followed at an SOA of 100 ms by an equallybrief mask also consisting of a three-letter trigram. As noted inChapter 2, section 2.2., this constitutes a case of masking by struc-ture, which would produce not only a minor amount of masking byintegration of target and mask information at peripheral as well ascentral levels, but also a large amount of masking by central inter-ruption of target processing (Breitmeyer 1984; Michaels and Turvey1979). These combined visual masking effects acting to suppress thevisibility of the target were counteracted by a TMS pulse when it waspresented over the occipital cortex 60–140 ms after the onset ofthe visual trigram mask. During these intervals the TMS increased thevisibility of the trigram target while simultaneously suppressing thevisibility of the trigram mask. Peak recovery of target visibilityoccurred when the TMS pulse followed the trigram mask at an SOAof 100 ms.
Since spatially overlapping targets and masks consisting of lettertrigrams were used by Amassian et al. (1993), we cannot concludewith certainty to what respective extents the target recovery pro-duced by the TMS was due to suppression of the mask’s integrationmechanism vs. its interruption mechanism. In order to eliminatespatiotemporal integration as a source of backward masking, Ro et al.(2003) used a disk as a target and a surrounding annulus as a meta-contrast mask. The mask followed the target at an optimal metacontrastSOA of 43 ms. Thus by eliminating the integration of overlappingtarget and mask information, only central interruption could be asource of masking. Ro et al. (2003) measured visibility changes ofthe annular mask and the disk target produced by a TMS pulse asa function of the SOA separating its onset from that of the preced-ing mask.
THE MASKING OF VISUAL TARGETS BY TMS 279
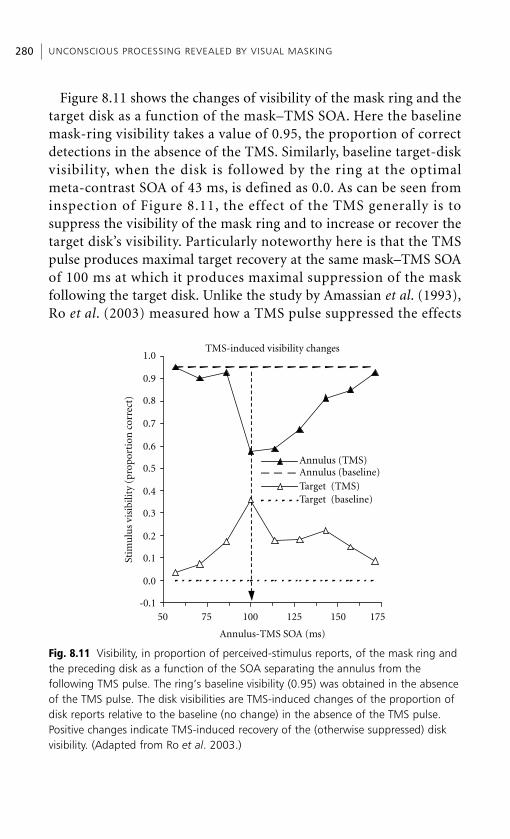
Figure 8.11 shows the changes of visibility of the mask ring and thetarget disk as a function of the mask–TMS SOA. Here the baselinemask-ring visibility takes a value of 0.95, the proportion of correctdetections in the absence of the TMS. Similarly, baseline target-diskvisibility, when the disk is followed by the ring at the optimalmeta-contrast SOA of 43 ms, is defined as 0.0. As can be seen frominspection of Figure 8.11, the effect of the TMS generally is tosuppress the visibility of the mask ring and to increase or recover thetarget disk’s visibility. Particularly noteworthy here is that the TMSpulse produces maximal target recovery at the same mask–TMS SOAof 100 ms at which it produces maximal suppression of the maskfollowing the target disk. Unlike the study by Amassian et al. (1993),Ro et al. (2003) measured how a TMS pulse suppressed the effects
UNCONSCIOUS PROCESSING REVEALED BY VISUAL MASKING280
TMS-induced visibility changes
-0.1
0.0
0.1
0.2
0.3
0.4
0.5
0.6
0.7
0.8
0.9
1.0
50 75 100 125 150 175
Annulus-TMS SOA (ms)
Stim
ulu
s vi
sibi
lity
(pro
port
ion
cor
rect
)
Annulus (TMS)Annulus (baseline)Target (TMS)Target (baseline)
Fig. 8.11 Visibility, in proportion of perceived-stimulus reports, of the mask ring andthe preceding disk as a function of the SOA separating the annulus from the following TMS pulse. The ring’s baseline visibility (0.95) was obtained in the absenceof the TMS pulse. The disk visibilities are TMS-induced changes of the proportion ofdisk reports relative to the baseline (no change) in the absence of the TMS pulse.Positive changes indicate TMS-induced recovery of the (otherwise suppressed) diskvisibility. (Adapted from Ro et al. 2003.)
of the mask’s isolated interruption mechanism. Nevertheless,both studies share a common feature in that the suppression of thevisibility of the visual mask was accompanied by a decrease in itsmasking effectiveness.
As shown by Breitmeyer et al. (2004b), although this positive cor-relation between the visibility of a stimulus and its effectiveness asa mask may at first glance appear obvious and even necessary, it isneither. The reason is that, as shown by Breitmeyer et al. (1981b) (seesection 8.2 and Figs 8.1 and 8.2), the visibility of a primary meta-contrast mask (M1 in Fig. 8.1) can be suppressed by a secondarymetacontrast mask (M2 in Fig. 8.1) without in turn reducing theeffectiveness of the primary mask in suppressing the target’s visibility,i.e. without producing target recovery. We believe this is so for thefollowing reasons. In the two studies in which a TMS pulse was used asa secondary mask, it is highly likely that the pulse had a spatially localbut otherwise non-specific suppressive effect on processing in thevisual cortex. Consequently, it suppressed activity not only in themask-activated P pathway processing the form aspects of the visualmask (letter trigrams or annulus), but also in the mask-activated Mpathway responsible for the central interruption or suppression of target-activated form processing in the P pathway. The latter effect of theTMS pulse on the mask’s M activity leads to less suppression and there-fore greater recovery of the target’s visibility, whereas the former effecton the mask’s P activity leads to suppression of the mask’s visibility.In contrast, in the study by Breitmeyer et al. (1981b), the secondarymetacontrast mask (M2) suppressed the P activity of the primarymetacontrast mask (M1) without suppressing its M activity, and hencethere was a reduction of M1’s visibility without a reduction in itsmasking effectiveness.
If correct, this analysis has important methodological implications.Since current techniques of TMS application do not selectively disruptcortical P or M processing, it may be preferable to use a visual mask toproduce more selective disruption of cortical processing (at least untilsuch time as a more pathway-specific version of TMS masking is devel-oped). By acting more specifically, a visual mask is able to yield moreuseful information than a TMS mask, particularly as applied to studyof unconscious and conscious processes in vision. Of course, this
THE MASKING OF VISUAL TARGETS BY TMS 281
assumes that in other respects the visual mask can replicate the effectsof a TMS on visual processing. We argue below that this is indeed thecase when one is interested in studying the temporal dynamics ofobject vision.
8.8. The relation between visual masking and TMS maskingIn terms of its primary masking effects it appears that a TMS pulse canproduce effects similar to a visual mask. As shown in Figure 8.10,a TMS pulse produces two minima in the function relating a target’svisibility to the SOA separating the onset of the target from theTMS mask. One minimum occurs at a negative SOA, and the other ata positive SOA. The analogy to para- and metacontrast masking effectsis obvious. As noted, Corthout et al. (1999b) concluded that these two‘paracontrast’ and ‘metacontrast’ maxima correspond to the TMS-induced disruption of two processing intervals, the former correspond-ing to the early feedforward activation of cortical neurons and thelatter to activation depending on re-entrant feedback from highercortical visual areas. This interpretation is consistent, on the one hand,with the finding (Macknik and Livingstone 1998) that paracontrastsuppresses the early response component of V1 neurons and, on theother, with the finding that backward pattern masking suppresses thelater response components (Andreassi et al. 1975; Bridgeman 1975,1980, 1988; Lamme et al. 2002; Schiller and Chorover 1966; Schwartzand Pritchard 1981; Vaughan and Silverstein 1968).
Figure 8.12(a), taken from a recent study reported by Breitmeyeret al. (2004b), shows again the results of Corthout et al. (1999b) incomparison with paracontrast and metacontrast masking resultsobtained with visual masks. Corthout et al.’s TMS masking results arebased on averages of three observers. The visual masking results arebased on averages of three observers participating in experiments con-ducted in our laboratory. To make a proper comparison of the two setsof findings (Fig. 8.12b), we shifted the visual masking results so thatthe visual masking SOA of 0 ms aligned with a TMS SOA of 60 ms forthe following reasons. Assuming that the cortical effects of a TMS pulseoccur at very short latencies (e.g. 10 ms or less), we took the value of60 ms as an estimate of the time delay (produced by sensory transduction
UNCONSCIOUS PROCESSING REVEALED BY VISUAL MASKING282

and retino-geniculo-cortical transmission) separating the onset of thecortical TMS effect and the onset of the cortical effects of a visual maskpresented to the retinae (Baseler and Sutter 1997). Despite the use ofdifferent observers and procedures, the two studies yield masking func-tions that agree to a surprising extent, especially regarding the SOAs atwhich masking maxima occur. This result would be expected if theearly and late TMS-suppression maxima and the para- and metacon-trast masking maxima both correspond to the suppression of the earlyand late responses of V1 neurons, respectively.
THE RELATION BETWEEN VISUAL MASKING AND TMS MASKING 283
Unadjusted retinocortical delay
0.0
0.2
0.4
0.6
0.8
1.0
1.2
–200 –160 –120 –80 –40 0 40 80 120 160 200
T-M1 SOA or T-TMS SOA (ms)
Nor
mal
ized
tar
get
visi
bilit
y
Adjusted retinocortical delay
0.0
0.2
0.4
0.6
0.8
1.0
1.2
–200 –160 –120 –80 –40 0 40 80 120 160
SOA (ms)
Nor
mal
ized
tar
get
visi
bilit
y
(a)
(b)
Breitmeyer et al. 2004bCorthout et al.Baseline
Breitmeyer et al. 2004bCorthout et al. 1999bBaseline
Fig. 8.12 (a) Comparison of a typical masking function obtained in our laboratoryusing a visual para- or metacontrast mask with a typical masking function obtainedby Corthout et al. (1999b) using a TMS pulse as a mask. Negative and positive SOAsindicate that the masks were presented before and after the target, respectively.Results are not adjusted for retinocortical transmission delay. (b) As in (a) but withthe results adjusted for a 60-ms delay of cortical M activity due to retinocorticaltransmission time (Baseler and Sutter 1997). (Reproduced from Breitmeyer et al.2004b.)
8.9. SummaryVisual masking can make several significant contributions to ourunderstanding of the types and levels of conscious and unconsciousinformation processing. First, careful analyses of target recoverystudies reveal that the mechanism of metacontrast itself occursat unconscious levels of processing, and this leads to the additionalconclusion that the visual processes responsible for the visibility of astimulus are distinct and dissociable from those responsible for itseffectiveness as a mask. Visual masking techniques applied to the studyof priming effects produced by a masked target stimulus also reveal theunconscious processing of a number of object attributes. Although theunconscious processing of an object’s spatial location can be inferredfrom a number of earlier metacontrast studies, more recent studiesshow additionally that attributes of an object that allow it to be identified,such as its chromatic surface features and form or contour features, canalso be processed at unconscious levels. In addition, the results of thesestudies support the neurophysiological evidence and neural-networkmodels linking distinct cortical levels and pathways to the processing ofform or contour features, on the one hand, and surface features likecolor on the other.
Although priming by color and form can be obtained at unconsciousor, more specifically, preconscious levels, a number of masking studieshave revealed that much of preconscious processing can be or evenmust be accompanied by selective spatial and temporal allocation ofattention. Conversely, a number of other studies have shown thatmasked stimuli can nonetheless be used at unconscious levels by thevisual system for strategic control of attention. Consequently, despitethe close link between attention and consciousness, attentive process-ing appears to be distinct from conscious processing.
TMS masking, recently also used to study the time course of con-scious and unconscious processing, produces at least two epochs ofsuppression when varying the target-to-TMS SOA, with the earlier onecorresponding to the SOA of maximal paracontrast suppression andthe later one to the SOA of maximal metacontrast suppression. Despitethis resemblance between TMS and visual masking, it appears thatfor now visual masks yield suppressive effects that are more pathway-specific than those produced by TMS masks.
UNCONSCIOUS PROCESSING REVEALED BY VISUAL MASKING284

Notes1 We assume that although neural activity is percept related, it can nonetheless occur at
unconscious levels of processing. For instance, percept-dependent activity can be foundin the later response components of V1 neurons (Lamme 2003; Lamme et al. 2000;Super et al. 2001). Nevertheless, as argued by Crick and Koch (1995), V1 neural activityon its own does not give rise to conscious experience, i.e. whereas V1 neural activitymay be necessary it is not sufficient for conscious experience.
2 In fact, if anything a slight enhancement of the visibility of M1 is indicated at M1–M2SOAs of �90 ms. Similar enhancements produced by a preceding mask (in this caseM2) were discussed in Chapter 2, section 2.5, and Chapter 4, section 4.3.2.
SUMMARY 285

This page intentionally left blank
Chapter 9
Visual masking in selectedsubject populations
9.1. IntroductionIn Chapter 2 we noted that visual masking is a useful tool for investigat-ing dynamic temporally evolving sequences and levels of informationprocessing in the visual system. The vast majority of such studies havebeen conducted on human observers with normal visual systems.When applied to subjects who exhibit a variety of clinical anomalies orother distinct but non-clinical characteristics, interesting differencesemerge when comparing masking performance between normal andclinical or special-subject populations. Such comparisons are informat-ive because they allow us to understand how the response propertiesof underlying masking mechanisms express themselves differentially inthe various subject populations. Since, by definition, visual masking isa spatiotemporal phenomenon, the extent to which these differencesare due to the temporal or spatial response properties can also beassessed.
However, a caveat is in order before we proceed to discussion ofvisual masking in specific subject populations. The evidence concern-ing various visuocognitive functions in some special populations isoften ambiguous or mixed; studies either fail to replicate findings orreport contradictory findings. For instance, in schizophrenia, evidenceregarding such functions as gestalt organization (Cox and Leventhal1978; Silverstein et al. 1996, 2000) and forward masking (Green et al.2003, in press; Rassovsky et al. 2004, 2005; Saccuzzo et al. 1996; Slaghuisand Bakker 1995) is mixed. The evidential problem also holds for thestudy of visual deficits in specific reading disability (SRD) or dyslexia(Borsting et al. 1996; Demb et al. 1998; Edwards et al. 1996; Lehmkuhleet al. 1993; Livingstone et al. 1991; Pammer and Lovegrove 2001; Samaret al. 2002; Skottun 2000, 2001; Skottun and Parke 1999; Slaghuis and
VISUAL MASKING IN SELECTED SUBJECT POPULATIONS288
Ryan 1999; Stein and Walsh 1997; Stuart et al. 2001; Victor et al. 1993).This makes it difficult, although not impossible, to specify a set ofempirically based diagnostic and nosological criteria that are charac-terized by discriminative power and reliability. For example, in SRD thevisuocognitive deficits may be limited to a particular subpopulation ofSRD individuals (Borsting et al. 1996; Slaghuis and Ryan 1999), andlikewise deficits in in schizophrenia may also be limited to specific sub-populations of schizophrenics (Green and Walker 1986; Slaghuis andBakker 1995). Therefore, in our opinion, the problem of mixed evi-dence is better viewed as a challenge to broaden and refine thinkingabout how differential diagnosis relates to differential visuocognitivedeficits rather than as a definitive narrowing or elimination of possibil-ities. To that end much diligent and at times painfully systematic workremains to be done. As a starter, a careful and comprehensive meta-analysis of extant findings covering the entire range of experimentalparadigms within each of the various syndromes would clearly be inorder.
9.2. Visual masking in amblyopiaIn humans, amblyopia is an anomaly that is associated with abnormalbinocular visual development induced by strabismus or anisometropia.Nonetheless, the neural bases of amblyopia and binocular visiondeficits are probably different (Blakemore and Eggers 1978). Recentanimal models of amblyopia (reviewed by Kiorpes and McKee 1999)have revealed a physiological correlate of this condition in neuronaldysfunction at cortical levels of visual processing, particularly in theneural representations of the central visual field. The associated lossof visual acuity and spatial contrast sensitivity has been amply docu-mented (Levi 1994; McKee et al. 2003).
An interesting feature of human amblyopia is that usually only oneeye is amblyopic. Hence the non-amblyopic eye can serve as the controlor normal eye against which the performance of the amblyopic eye canbe compared. Together with a number of visual tasks, visual backwardmasking reveals differences between the normal and amblyopic eye.Tytla and Steinbach (1984) investigated metacontrast in both eyes ofhuman amblyopes. As shown in Figure 9.1, the amblyopic eye not onlyyielded a more pronounced type B metacontrast effect but also a shiftin the SOA at which peak masking occurred to higher values. According
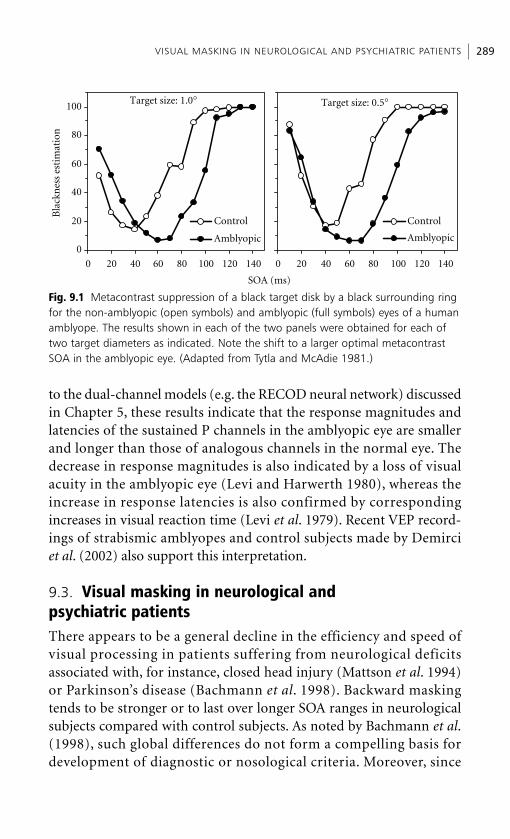
to the dual-channel models (e.g. the RECOD neural network) discussedin Chapter 5, these results indicate that the response magnitudes andlatencies of the sustained P channels in the amblyopic eye are smallerand longer than those of analogous channels in the normal eye. Thedecrease in response magnitudes is also indicated by a loss of visualacuity in the amblyopic eye (Levi and Harwerth 1980), whereas theincrease in response latencies is also confirmed by correspondingincreases in visual reaction time (Levi et al. 1979). Recent VEP record-ings of strabismic amblyopes and control subjects made by Demirciet al. (2002) also support this interpretation.
9.3. Visual masking in neurological and psychiatric patientsThere appears to be a general decline in the efficiency and speed ofvisual processing in patients suffering from neurological deficitsassociated with, for instance, closed head injury (Mattson et al. 1994)or Parkinson’s disease (Bachmann et al. 1998). Backward maskingtends to be stronger or to last over longer SOA ranges in neurologicalsubjects compared with control subjects. As noted by Bachmann et al.(1998), such global differences do not form a compelling basis fordevelopment of diagnostic or nosological criteria. Moreover, since
VISUAL MASKING IN NEUROLOGICAL AND PSYCHIATRIC PATIENTS 289B
lack
nes
s es
tim
atio
n
Target size: 0.5°
Control
Amblyopic
Target size: 1.0°
Control
Amblyopic
SOA (ms)
0 20 40 60 80 100 120 1400 20 40 60 80 100 120 140
0
20
40
60
80
100
Fig. 9.1 Metacontrast suppression of a black target disk by a black surrounding ringfor the non-amblyopic (open symbols) and amblyopic (full symbols) eyes of a humanamblyope. The results shown in each of the two panels were obtained for each oftwo target diameters as indicated. Note the shift to a larger optimal metacontrastSOA in the amblyopic eye. (Adapted from Tytla and McAdie 1981.)
visual information processing includes everything from bottom-upfeedforward sensory coding of stimulus properties to top-down feed-back influences of gestalt organization, figural context, and attention,such differences per se do not allow specification of what mechanismsor stages in visual information processing are affected by the neurolog-ical deficit.
These global decreases in efficiency and speed of processing alsocharacterize psychiatric subjects (Braff 1981; Green et al. 1994a,b, 2000;Merritt and Balogh 1984; Rund and Landrø 1990; Saccuzzo and Braff1980, 1981, 1986; Saccuzzo and Schubert 1981), unaffected siblings ofpsychiatric patients (Green et al. 1997), and non-clinical subjectsfalling within a psychometrically determined psychosis-prone spectrum(Merritt and Balogh 1990). However, there is additional evidencepointing to more specific differences and similarities between variousdiagnostic groups of psychiatric patients and control subjects in themasking functions they yield. For instance, Slaghuis and Bakker (1995)reported that the backward masking functions of positive-symptomschizophrenic patients did not differ significantly relative to the back-ward masking functions obtained by control subjects, whereas those ofnegative-symptom patients did. The negative-symptom group ofpatients was more prone to backward masking than were the controlsubjects. These masking differences may relate to differences in othercognitive functions between positive- and negative-symptom schizo-phrenics (Green and Walker 1986). Moreover, masking research byHerzog and coworkers (Brand et al. 2004; Herzog et al. 2003d, 2004)has shown that although processing of target elements may be abnormalin schizophrenics relative to control subjects, schizophrenics nonethelessseem to possess some normal gestalt grouping (Herzog et al. 2004) andfeature fusion mechanisms (Brand et al. 2004).
Schizotypic and schizophrenic subjects also show differences in theshape of the backward masking function relative to control subjects.Results reported by Merrit and Balogh (1990) illustrate such differ-ences for schizotypics.1 While both types of subject showed similartype A monotonic masking functions for a high spatial frequency mask,a low spatial frequency mask yielded overall weak type A masking forthe control subjects but, in contrast, a strong U-shaped type B maskingeffect for the schizotypic subjects. According to the RECOD model(Purushothaman et al. 2000), it is the activity of low spatial frequency
VISUAL MASKING IN SELECTED SUBJECT POPULATIONS290
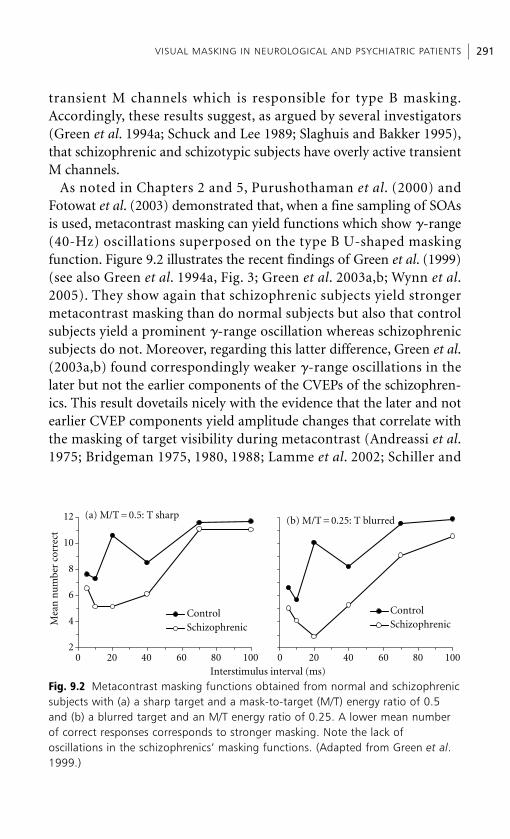
transient M channels which is responsible for type B masking.Accordingly, these results suggest, as argued by several investigators(Green et al. 1994a; Schuck and Lee 1989; Slaghuis and Bakker 1995),that schizophrenic and schizotypic subjects have overly active transientM channels.
As noted in Chapters 2 and 5, Purushothaman et al. (2000) andFotowat et al. (2003) demonstrated that, when a fine sampling of SOAsis used, metacontrast masking can yield functions which show �-range(40-Hz) oscillations superposed on the type B U-shaped maskingfunction. Figure 9.2 illustrates the recent findings of Green et al. (1999)(see also Green et al. 1994a, Fig. 3; Green et al. 2003a,b; Wynn et al.2005). They show again that schizophrenic subjects yield strongermetacontrast masking than do normal subjects but also that controlsubjects yield a prominent �-range oscillation whereas schizophrenicsubjects do not. Moreover, regarding this latter difference, Green et al.(2003a,b) found correspondingly weaker �-range oscillations in thelater but not the earlier components of the CVEPs of the schizophren-ics. This result dovetails nicely with the evidence that the later and notearlier CVEP components yield amplitude changes that correlate withthe masking of target visibility during metacontrast (Andreassi et al.1975; Bridgeman 1975, 1980, 1988; Lamme et al. 2002; Schiller and
VISUAL MASKING IN NEUROLOGICAL AND PSYCHIATRIC PATIENTS 291M
ean
nu
mbe
r co
rrec
t
ControlSchizophrenic
20 40 60 80
ControlSchizophrenic
2
4
6
8
10
12
Interstimulus interval (ms)0 10020 40 60 800 100
(b) M/T = 0.25: T blurred(a) M/T = 0.5: T sharp
Fig. 9.2 Metacontrast masking functions obtained from normal and schizophrenicsubjects with (a) a sharp target and a mask-to-target (M/T) energy ratio of 0.5and (b) a blurred target and an M/T energy ratio of 0.25. A lower mean numberof correct responses corresponds to stronger masking. Note the lack of oscillations in the schizophrenics’ masking functions. (Adapted from Green et al.1999.)
Chorover 1966; Schwartz and Pritchard 1981; Vaughan and Silverstein1968) (see also Chapter 3, section 3.1, and Chapter 8, section 8.6).
Whether or not these and related (Cadenhead et al. 1996) deficits in�-range oscillations are merely symptomatic rather than causal inschizophrenia is open to question. In recent years the existence of�-range oscillations has been tied to a number of perceptuocognitiveprocesses. For instance, �-range oscillations are believed to providenot only the temporal binding of neural activity relevant for featureintegration and conscious perceptual organization (Engel et al. 1999;Fries et al. 1997; Keil et al. 1999; Rodriguez et al. 1999; Tallon-Baudryand Bertrand 1999), but variations of �-range activity are also taken torelate to changes of focused arousal and attention (Engel et al. 1999;Munk et al. 1996; Sheer 1984; Steriade et al. 1996; Tiitinen et al. 1993).Schizophrenics are known to have abnormal cortical–cortical connect-ivity (Parnas et al. 1996), which may underlie their abnormal patternsof �-range oscillations (Clements et al. 1997; Hoffman et al. 1996),attentional deficits (Mori et al. 1996; Nuechterlein and Dawson 1984)as well as their ‘cognitive dysmetria’ (Andreasen et al. 1998).
9.4. Visual masking in subjects with specific reading disability
9.4.1. Is there a transient M-channel deficit in specificreading disability?
The interest in applying visual masking to SRD and dyslexia grewout of a theoretically motivated psychophysical approach originallydeveloped by Lovegrove and followed up by M.C. Williams (Lovegrove1993; Lovegrove and M.C. Williams 1993; Lovegrove et al. 1986;M.C. Williams and LeCluyse 1990; M.C. Williams et al. 1989) to performexperimental investigations of deficits in the transient channels of SRDsubjects. Under a renamed M-channel deficit, this approach was takenup and continued by several other investigators (Breitmeyer 1989,1993a,b, 1994; Demb et al. 1998; Felmingham and Jakobson 1995;Lehmkuhle et al. 1993; Livingstone et al. 1991; Stein 1993; Stein andWalsh 1997; Talcott et al. 1998). This approach has been criticized ontheoretical as well as empirical grounds (Gross-Glenn et al. 1995;Skottun 1997a,b, 2000, 2001; Skottun and Parke 1999; Stuart et al.2001; M.J. Williams et al. 2003).
VISUAL MASKING IN SELECTED SUBJECT POPULATIONS292
Regarding the empirical aspect, we believe that the controversial andunsettled nature of the approach arises mainly from inconsistenciesamong the results of studies comparing psychophysical performancesof SRD and normal readers. However, this chapter is not the place forreviewing and analyzing this vast amount of psychophysical literature.As mentioned above, a critical meta-analysis is still in order. However,several key points should be raised about the M-channel deficitapproach to SRD. First, as mentioned above, the deficit may onlybe evident in certain SRD subgroups. Secondly, to the extent that it isevident, it may show up weakly, if at all, with insensitive psychophysicalmeasures. Stein and Walsh (1997) also made this important point intheir assessment of evidence for and against the M-channel deficitapproach. Hence the procedures applied to the study of visual deficitsin SRD should use optimal psychophysical methods and exploit suffi-ciently sensitive psychophysical measures. While adhering to the tenetof disconfirmability, we maintain that only when the experimentalmethods are convincingly stringent can negative results be informative.Finally, theoretical developments based on the M-channel deficits canremain agnostic vis à vis their etiological relation to SRD. While main-taining the existence of these deficits, we can regard them merely asmarkers rather than causal factors, although speculations as to possibleetiological connections have been made (Breitmeyer 1991, 1993a,b,1994; Stein and Walsh 1997).
Unlike the psychophysical results, results obtained from studies usingCVEP measures point almost unanimously to a transient M-channeldeficit in SRD compared with normal subjects. Of seven such reportedstudies, only one (Victor et al. 1993) reports absence of such a deficitin SRD subjects, whereas the remaining six (Kubová et al. 1996;Lehmkuhle et al. 1993; Livingstone et al. 1991; May et al. 1991, 1992;Samar et al. 2002) obtained CVEP waveform differences consistentwith cortical M-channel deficits in SRD subjects. The CVEP waveformdifferences are particularly evident for the early component peaking atabout 50–75 ms, which represents M-channel activation (Baseler andSutter 1997). Here, the results of Samar et al. (2002) are particularlyinteresting, since these investigators compared CVEP waveforms ofnormal deaf readers with those of disabled deaf readers. Their study,like the studies using hearing subjects (Lehmkuhle et al. 1993;Livingstone et al. 1991), found that the amplitudes of the early CVEP
VISUAL MASKING IN SUBJECTS WITH SPECIFIC READING DISABILITY 293

component (but not of the later components) were lower in deaf SRDreaders than in deaf normal readers.
9.4.2. Metacontrast masking performance in SRD and normal readers
According to original versions of the dual-channel approach to mask-ing (Breitmeyer and Ganz 1976; Matin 1975) and the more recentRECOD version (Ögmen 1993; Purushothaman et al. 2000), the inhibi-tion of the target’s sustained-channel activity by the mask’s transient-channel activity provides the mechanism for type B backward masking.Therefore if SRD subjects suffer a deficit in their transient M channels,their backward masking should be weaker than that in normal readers. Such differences have been reported in a series of maskingstudies conducted by M.C. Williams and coworkers (M.C. Williamsand LeCluyse 1990; M.C. Williams et al. 1989, 1990). Figure 9.3 showsthe results of metacontrast masking reported by M.C. Williams andLeCluyse (1990). Metacontrast functions were obtained for stimulipresented foveally and peripherally. Recall from Chapter 2, section2.6.6, that metacontrast increases in strength with retinal eccentricityof stimulus presentation, consistent, as noted in section 2.6.6, with thestronger ratio of M-channel to P-channel activity in the periphery thanin the fovea. Two aspects of the results of Figure 9.3 are noteworthy.First, the magnitude of metacontrast masking is weaker in SRD
VISUAL MASKING IN SELECTED SUBJECT POPULATIONS294
FovealPeripheralBaseline
0 30 60 90 120 150 180 210
FovealPeripheralBaseline
SOA (ms)0 30 60 90 120 150 180 210
Rel
ativ
e ac
cura
cy (
%)
–25
–20
–15
–10
–5
0
5
10Normal readers Disabled readers
Fig. 9.3 Metacontrast masking functions for foveally and peripherally presentedstimuli obtained from normal and specifically reading disabled subjects. Lower relativetarget identification accuracy corresponds to stronger masking. Note the smallermetacontrast effects obtained by the reading disabled subjects, particularly forperipheral stimulus presentations. (Adapted from Williams and LeCluyse 1990.)
subjects than in normal subjects. Secondly, in normal subjects theperipheral stimulus location yields stronger metacontrast than thefoveal location, as expected; in contrast, in SRD subjects the peripherallocation yields metacontrast that is weaker and almost absentcompared with that yielded by the foveal location. Thus the decreasein metacontrast magnitude found in SRD subjects is particularlymagnified in peripheral areas of the retina where metacontrast andtransient activity are usually quite strong. Similar results confirming aweaker metacontrast masking effect in SRD than in normal subjectswere also reported by Edwards et al. (1996).
9.5. SummaryIn order to be maximally informative, the application of visual maskingto special subject populations depends on (a) sound theoreticalreasoning about masking and the characteristics that distinguishthe visual systems of special subjects from those of normal ones and(b) solid empirical results. Unfortunately, existing empirical findingsare at best mixed, with a significant number of studies reporting nodifferences in visual performance between normal and special subjects.However, negative results should be accepted only when very rigorousmethodological controls have been implemented; the more stringentan experimental test, the more confident one can be about theoreticalimplications of its results. Moreover, given the current state and stageof research in special subject populations, mixed results might be asfruitfully directed to rethinking the etiology, nosology, and differentialdiagnosis applying to a given syndrome as to rethinking theories ofvisual deficits.
Given these caveats, the application of visual masking to amblyopia,neurological and psychiatric disorders, and SRD has revealed interestingand theoretically significant findings. In amblyopia, the shift towardlonger optimal metacontrast SOAs is consistent with weaker or slowerresponses in the P pathway. Schizophrenic and schizotypic subjectstend to yield stronger metacontrast and backward masking functions,which moreover tend to lack the high-frequency � oscillations found innormal subjects. This indicates that schizophrenic subjects may havean overactive transient M-channel and an abnormal synchronizationof neural activity in the object-processing P channel (as well as inother parts of the brain). In contrast with schizophrenic subjects, SRD
SUMMARY 295

subjects tend to be less susceptible to metacontrast and thus to have anunderactive M-channel, a characteristic that has implications for anumber of other visual functions besides those tapped through visualmasking.
Note1 The control groups consisted of a group of normal control subjects (normal controls)
and of subjects identified by the Minnesota Multiphasic Personality Index (MMPI) asbeing prone to antisocial personality disorder but not to schizophrenia (4–9 controls).The experimental groups consisted of two MMPI-identified schizotypic groups ofsubjects: the 8–9 group and the 2–7–8 group.
VISUAL MASKING IN SELECTED SUBJECT POPULATIONS296
Epilogue
Today, as in the past, the value of visual masking lies in its use as aninvestigative tool and its being an interesting phenomenon intrinsicallyworthy of study. Of course, the same applies to numerous other visualphenomena such as optical illusions, after-effects, binocular rivalry,figure–ground reversals, multistable perceptions, etc. Each of these isinteresting in its own right and each has uses as an investigative toolnot only in vision science, of which there are too many to mention, butalso in fields as varied as philosophy and the visual arts. One of usrecalls a conversation held several decades ago with a colleague andrespected vision researcher who opined that interest in metacontrastmasking was misplaced; after all, he maintained, metacontrast ismerely a parlor trick or a puzzling curio that one occasionally displaysfor effect, but otherwise a conceptually vacuous phenomenon. We hopethat the foregoing chapters, particularly those dealing with theories ofvisual masking, have proved this critic wrong by showing that aconceptual grasp of visual masking is not an empty trifle. Instead, itturns out to be a phenomenon whose fullest explanation dependson understanding the complex interplay of sensory, cognitive, andattentional processes, which in turn depend on interactions betweenbottom-up feedforward, lateral/horizontal, and top-down feedbackprocesses.
The subtitle of this book places an understanding of visual masking,both as a phenomenon per se and as an investigative tool, in the broaderframework of the temporal dynamics of conscious and unconsciousvisual processing. Other visual phenomena obtained under freeviewing, such as binocular rivalry, the Troxler fading effect, and theperceptual fluctuations accompanying prolonged viewing of multi-stable visual displays, also deal with the temporal dynamics of perceptualorganization. However, the spontaneous perceptual changes accompany-ing these phenomena are characterized by temporally stochasticproperties; in contrast, visual masking, by precisely controllingtemporal parameters such as SOA, can reveal temporally deterministic
properties of perceptual change. What applies to visual maskingtechniques also applies to the more recently developed technique of‘flash suppression’ during binocular rivalry (Kreiman et al. 2005) andTMS masking, although a more careful psychophysics of TMS maskingmay have to be worked out. Therefore both these techniques areparticularly useful in studying the time course of unconscious andconscious visual processes during the first few hundred millisecondsafter a stimulus impinges on the retinae.
Understanding these processes is important for two reasons. First,normal vision is by nature highly dynamic. Because of the very smallarea of sharpest foveal vision, we usually change our visual fixationssomewhere between two and four times per second in order toscrutinize or ‘read’ the information in a vastly larger visual field. Thusthe processing of visual information must fully occur within the250–500 ms duration of each fixation. It is known that the saccadesseparating two successive fixations can suppress the vision of stimulipresented just before, during, and just after a saccade, and that normallywe are not aware of this suppression (Volkmann 1986; Ross et al. 2001).This is odd, since on the one hand saccadic suppression demonstrates aloss of visibility of stimuli while on the other we are not aware of such aloss in everyday non-laboratory settings. This is akin to the lack ofawareness of an artificially produced or naturally occurring scotomasuch as the ‘blind spot’ in each eye. Perhaps the temporal ‘scotoma’ or‘anesthesia’ (Dodge 1900), i.e. the loss of visibility between successivefixations, is ‘filled in’ by a process akin to the filling in believed to occurwith spatial scotoma (Pessoa and De Weerd 2003). While the detailednature of this temporal trans-saccadic filling in of the stream ofconsciousness remains to be worked out (Irwin 1996), saccadicsuppression also raises the interesting prospect that some informationabout visual stimuli can be processed during the saccade despite theloss of their phenomenal visibility (Bridgeman et al. 1979, 1981).
Since visual masking can also produce suppression of phenomenalvision while leaving unconsciously processed information intact, it isalso important (along with TMS masking) as a powerful tool forstudying not only the time course but also the contents and the levelsof unconscious visual processing (see Chapter 8). Although especiallyuseful in precise studies of the temporal properties of vision,visual masking is not unique in its ability to specify levels or stages of
EPILOGUE298
unconscious processing. In Chapter 8 we were already able to specifysome of these levels of unconscious processing.
Much effort has been devoted in recent years to discovering anddelineating the neural correlates of conscious vision (Koch 2004;Metzinger 2000; Pollen 1999; Weiskrantz 1997) and also of uncon-scious vision (de Gelder et al. 2001; Stoerig 1996), and much workremains to be done in each of these pursuits. Using the variouspsychophysical techniques for suppressing conscious registration ofstimuli, neuroscientists also have tried to specify the cortical levels andloci of processing that are correlated with conscious and unconsciousvision (e.g. Sheinberg and Logothetis 1997; Haynes et al. 2005;Hofstoetter et al. 2004; Wilke et al. 2003). However, since seriousuncertainties remain regarding the cortical sites and levels of thesevisual-suppression mechanisms (e.g. Blake and Logothetis 2002; Tong2001), specifying the levels and loci of conscious and unconsciousprocessing remains equally uncertain.
Be that as it may, we believe that a useful step for studying andclarifying the neural correlates of conscious and unconscious visionis to establish a relational network of unconscious processing produced by these psychophysical techniques. We have already shown thatmetacontrast suppression, itself a mechanism occurring at unconsciouslevels of processing, functionally occurs after binocular rivalrysuppression (Chapter 8, section 8.6). Other known ways of psycho-physically rendering stimuli inaccessible to consciousness dependon pattern rivalry (Andrews and Purves 1997), flash suppression(Breitmeyer and Rudd 1981; Kanai and Kamitani 2003; Kreiman et al.2005; Wilke et al. 2003), motion-induced blindness (Bonneh et al.2001; Hofstoetter et al. 2004), and transient stimulus decrements (Mayet al. 2003). When used in conjunction with neuroscientific techniques,the informative content of each of these techniques would be greatlyenhanced if we could specify where in the functional hierarchy ofvisual information processing each of these suppression mechanismsoccurs relative to the others. For instance, if pattern rivalry wereto occur functionally before motion-induced blindness, and neuro-scientific research were to show that motion-induced blindness occursin, say, area V2, we could fairly confidently maintain that the neuralmechanism of pattern rivalry occurs before V2. Moreover, as well asknowing that the neural correlates for conscious vision reside later
EPILOGUE 299
than the stages of both pattern rivalry suppression and motion-induced blindness, we could also possibly unravel the types ofinformation processed at and between each of these two unconsciousprocessing stages. Such findings may bear relevantly on our under-standing of neurological disorders such as blindsight, neglect, etc. inwhich unconscious forms of visual processing are preserved.Additionally, they could be of interest to the larger community ofcognitive neuroscientists, including those concerned with the distinc-tions between vision for action, vision for perception, and vision foremotion, as well as philosophers grappling with the various (hard andsoft) problems concerning consciousness and body–mind relations.
Even if a functional hierarchy of unconscious visual processing isestablished, it is hard to imagine that a definite site or locus of neuralcorrelates of conscious vision will readily be established. The searchspace may have been narrowed; however, if, as assumed by manycognitive scientists and neuroscientists, consciousness superveneson the exchange of neural signals among the many sites in a highlyinteractive and complex cortico-thalamic network, a definite siteor locus for conscious vision will be hard to pinpoint. Perhaps, atsome time in the future, we will have to be satisfied with specifyingthe various cortical and subcortical loci responsible for rendering thecontents of conscious and unconscious vision, knowing all alongthat consciousness as a state, taken as given, must be differentiatedfrom consciousness as a trait or aspect of at least some visual contents(Stoerig 2002). What we hope that this book demonstrates is thecircumscribed promise that at least one of these psychophysicaltechniques holds for specifying the levels of types of conscious andunconscious processing of visual contents, and the wider promiseit may hold when combined with other psychophysical techniqueswithout, however, solving the critical and hard problems ofconsciousness left to researchers of more optimistic and sanguinetemperament.
EPILOGUE300
Appendix A
Some mathematical aspects ofmasking models
A.1. Multiplicative (shunting) and additive equationsIn Chapter 5, we introduced two ‘generic’ formalisms that havebeen used extensively in neural modeling (e.g. Grossberg 1988; Kochand Segev 1989). The first equation has the form of Hodgkin–Huxleyequation and is written as
(A1)
The physiological interpretation of the variables and parameters isgiven in Chapter 5. In particular, gd and gh represent variable (active)conductances through which input signals modulate the membranepotential Vm. In this sense, this is an ‘active’ model of a neuron. Becauseof the multiplicative interactions between the input and the membranepotential, the model is also known as the multiplicative or shuntingmodel (e.g. Grossberg 1988). A simpler version of this model is the‘additive’ model
(A2)
where conductances are fixed and the input modulates the membranepotential via additive currents.
The BCS model (Chapter 4, section 4.7) and the RECOD model(Chapter 5) build their dynamic network representations usingequations (A1) and (A2). We will show below that the equations usedin Bridgeman’s and Weisstein’s models are of the additive type.
dVm
dt� � AVm � excitatory inputs � inhibitory inputs.
dVm
dt� � AVm � (B � Vm)gd � (D � Vm)gh.
SOME MATHEMATICAL ASPECTS OF MASKING MODELS302
Consider first the equations of Bridgeman’s Hartline–Ratliffinhibitory network:
(A3)
where ri(t) is the firing rate of neuron i at time t, ei(t) is the excitatoryinput to the ith neuron, wj,i is the synaptic weight for the connectionfrom the jth neuron to the ith neuron, rj,i
0 is the firing threshold for theconnection between the jth and the ith neuron, and n is the number ofneurons in the network. Equation (A3) is a difference equation andequation (A2) is a differential equation. The two equations can becompared by approximating the derivative by a backward-differenceformula. Following the transformations used by Grossberg (1988), let
(A4)
Equation (A3) can be written as
(A5)
Using equation (A5), we obtain
(A6)
which has the same form as equation (A2) with A � 1 and with ei(t)and corresponding to the excitatory andinhibitory inputs, respectively. Note that while the state variables in thetwo equations correspond to different physiological variables(membrane potential in equation (A3) and firing rate in equation(A5)), the Hartline–Ratliff model applies thresholds directly to firingrates, while network formulations of equations (A1) and (A2) applythresholds to membrane potentials.
As discussed in Chapter 4, the building blocks of Weisstein’s modelare the two-factor Rashevsky–Landahl equations
(A7)dj
dt� � ajj � Aj fi(t)
�n
j�1wj,i[rj(t � � i � j �) � r0j,i]
dri(t)
dt� � ri(t � 1) � ei(t) � �
n
j�1wj,i[rj(t � � i � j �) � r0
j,i].
� �n
j�1wj,i[rj(t � � i � j �) � r0
j,i].
ri(t) � ri(t � 1) � � ri(t � 1) � ei(t)
dri(t)
dt�ri(t) � ri(t � 1).
ri(t) � ei(t) � �n
j�1wj,i[rj(t � �i � j �) � r0
j,i]
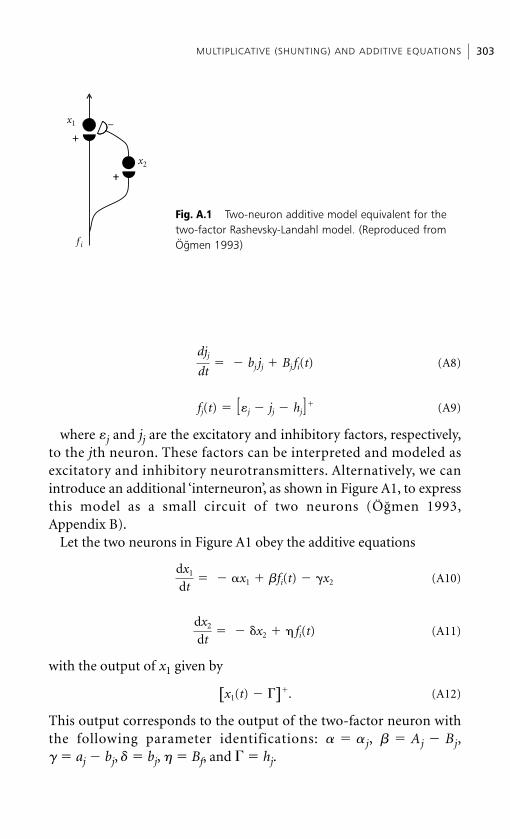
(A8)
(A9)
where j and jj are the excitatory and inhibitory factors, respectively,to the jth neuron. These factors can be interpreted and modeled asexcitatory and inhibitory neurotransmitters. Alternatively, we canintroduce an additional ‘interneuron’, as shown in Figure A1, to expressthis model as a small circuit of two neurons (Ögmen 1993,Appendix B).
Let the two neurons in Figure A1 obey the additive equations
(A10)
(A11)
with the output of x1 given by
(A12)
This output corresponds to the output of the two-factor neuron withthe following parameter identifications: � � �j, � Aj � Bj,� � aj � bj, � � bj, � � Bf, and � � hj.
[x1(t) � �]�.
dx2
dt� � �x2 � � fi(t)
dx1
dt� � �x1 � fi(t) � �x2
fj(t) � [j � jj � hj]�
djj
dt� � bj jj � Bj fi(t)
MULTIPLICATIVE (SHUNTING) AND ADDITIVE EQUATIONS 303
+
+
+–
+
x1
x2
f i
Fig. A.1 Two-neuron additive model equivalent for thetwo-factor Rashevsky-Landahl model. (Reproduced fromÖgmen 1993)
A.2. The approach of Anbar and AnbarAnbar and Anbar (1982) proposed a mathematical model for maskingbased on three assumptions: step visual response function (VRF) andexponential decay, temporal integration, and lateral inhibition.
A.2.1. Step visual response function
The VRF v(t) for an input of intensity I applied at time t � 0 and ofduration t0 is assumed to have the following form:
(A13)
where is a constant and � is a power function of the input, i.e.� � kI� where k and � represent two constants. Thus the response isassumed to increase stepwise to its level while the stimulus is on and todecay exponentially after the stimulus is turned off.
Using equations (A1) and (A2) we also obtain an exponential riseand decay in the response. Anbar and Anbar use step increase as a sim-plification and assume specific power relations for response magnitudeand decay rate.
A.2.2. Temporal integration
Temporal integration is used as a linking assumption for perceivedbrightness V(I):
(A14)
A temporal integration assumption is also used in other models (e.g.Weisstein’s model and the RECOD model) to link neural activities toperceived brightness.
A.2.3. Lateral inhibition
Finally, Anbar and Anbar assume that masking results from a typeof simultaneous brightness contrast effected by lateral inhibitionsuch that the weaker of the two stimuli is suppressed by the stronger.This suppression is assumed to be a step decrease by an amountproportional to the pth power of the ratio between the two VRFs at theonset of the masking stimulus. For example, assume that the target and
V(I) � ��
0v(t)dt � cI t0�1 �
1�t0�.
v(t) � cI for 0 �t �t0 and v(t) � cI exp[ � �(t � t0)] for t0 � t
SOME MATHEMATICAL ASPECTS OF MASKING MODELS304
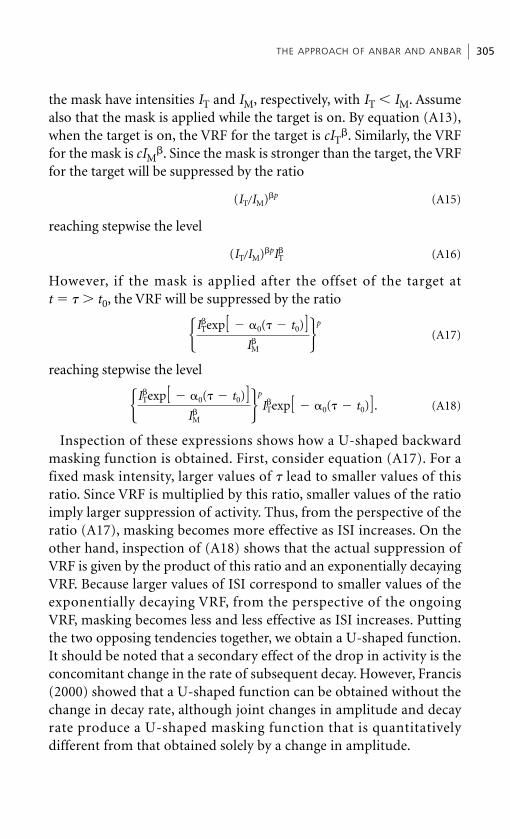
the mask have intensities IT and IM, respectively, with IT � IM. Assumealso that the mask is applied while the target is on. By equation (A13),when the target is on, the VRF for the target is cIT
. Similarly, the VRFfor the mask is cIM
. Since the mask is stronger than the target, the VRFfor the target will be suppressed by the ratio
(A15)
reaching stepwise the level
(A16)
However, if the mask is applied after the offset of the target att � � � t0, the VRF will be suppressed by the ratio
(A17)
reaching stepwise the level
(A18)
Inspection of these expressions shows how a U-shaped backwardmasking function is obtained. First, consider equation (A17). For afixed mask intensity, larger values of � lead to smaller values of thisratio. Since VRF is multiplied by this ratio, smaller values of the ratioimply larger suppression of activity. Thus, from the perspective of theratio (A17), masking becomes more effective as ISI increases. On theother hand, inspection of (A18) shows that the actual suppression ofVRF is given by the product of this ratio and an exponentially decayingVRF. Because larger values of ISI correspond to smaller values of theexponentially decaying VRF, from the perspective of the ongoingVRF, masking becomes less and less effective as ISI increases. Puttingthe two opposing tendencies together, we obtain a U-shaped function.It should be noted that a secondary effect of the drop in activity is theconcomitant change in the rate of subsequent decay. However, Francis(2000) showed that a U-shaped function can be obtained without thechange in decay rate, although joint changes in amplitude and decayrate produce a U-shaped masking function that is quantitativelydifferent from that obtained solely by a change in amplitude.
�IT exp[ � �0(� � t0)]
IM �
p
IT exp[ � �0(� � t0)].
�IT exp[ � �0(� � t0)]
IM �
p
(IT�IM) pIT
(IT�IM) p
THE APPROACH OF ANBAR AND ANBAR 305
A.3. Concepts of mask and target blockingThe simple mathematical formulation of the Anbar and Anbar modelleads to an important insight on how a U-shaped masking functioncan be produced. As mentioned above, because ratio (A15) depends onthe strength of the target, masking is more efficient when the mask isdelayed. However, because the activity is decaying, the mask has to beapplied while the activity remains at a significant level; otherwise, mostof the target’s activity remains intact, leading to a high level of visibility.These two constraints together lead to an ‘optimal’ intermediate ISIwherein maximum masking occurs. Francis (2000) formulated thisintuition into a general property that he called mask blocking. Maskblocking is defined as the blocking of the mask’s inhibitory effect by thetarget’s activity (cf. numerator in equation (A15)). The complementaryconcept, target blocking, occurs when the mask blocks the target signalfrom contributing to the visibility of the target. Assume, for example,that the inhibitory signal of the mask is largely independent of theactivity of the target. In this case the inhibitory activity of the mask willreduce the activity of the target without a reciprocal interference fromthe target and thus target blocking will occur. More detailed analysisand predictions can be found in Francis and Cho (2005).
SOME MATHEMATICAL ASPECTS OF MASKING MODELS306
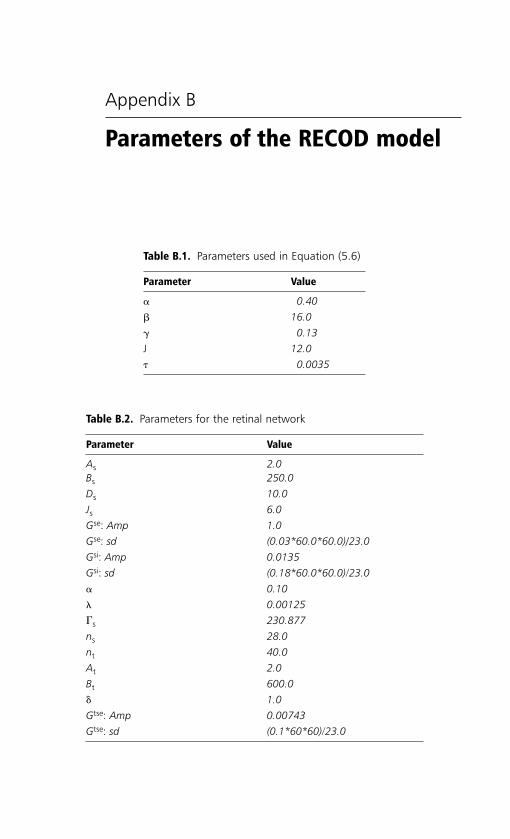
Appendix B
Parameters of the RECOD model
Table B.1. Parameters used in Equation (5.6)
Parameter Value
� 0.40 16.0� 0.13J 12.0� 0.0035
Table B.2. Parameters for the retinal network
Parameter Value
As 2.0Bs 250.0Ds 10.0Js 6.0Gse: Amp 1.0Gse: sd (0.03*60.0*60.0)/23.0Gsi: Amp 0.0135Gsi: sd (0.18*60.0*60.0)/23.0� 0.10� 0.00125�s 230.877ns 28.0nt 40.0At 2.0Bt 600.0� 1.0Gtse: Amp 0.00743Gtse: sd (0.1*60*60)/23.0
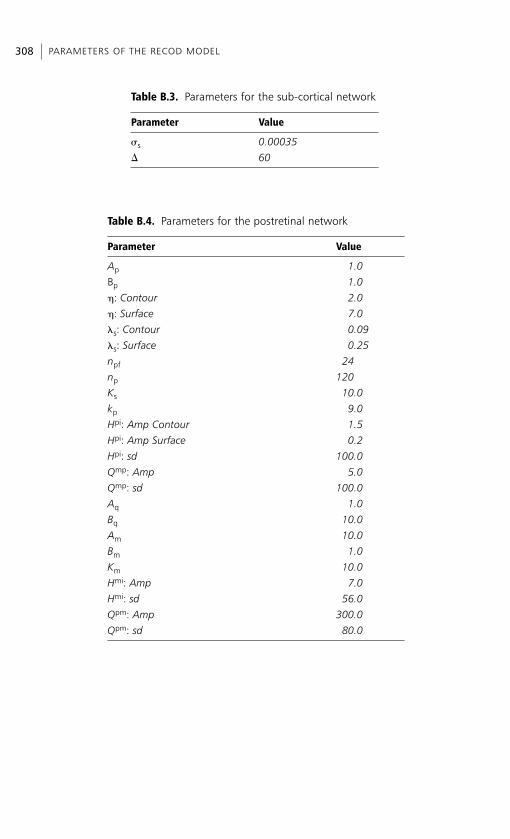
PARAMETERS OF THE RECOD MODEL308
Table B.3. Parameters for the sub-cortical network
Parameter Value
�s 0.00035� 60
Table B.4. Parameters for the postretinal network
Parameter Value
Ap 1.0Bp 1.0�: Contour 2.0�: Surface 7.0�s: Contour 0.09�s: Surface 0.25npf 24np 120Ks 10.0kp 9.0Hpi: Amp Contour 1.5Hpi: Amp Surface 0.2Hpi: sd 100.0Qmp: Amp 5.0Qmp: sd 100.0Aq 1.0Bq 10.0Am 10.0Bm 1.0Km 10.0Hmi: Amp 7.0Hmi: sd 56.0Qpm: Amp 300.0Qpm: sd 80.0
References
Abbott, L.F., Varela, K., Sen, K., and Nelson, S.B. (1997). Synaptic depression and corticalgain control. Science 275, 220–3.
Abrams, R.A. and Law, M.B. (2000). Object-based visual attention with endogenousorienting. Percept Psychophys 62, 818–33.
Adelson, E.H. and Bergen, J.R. (1985). Spatio-temporal energy models for the perceptionof motion. J Opt Soc Am A 2, 284–99.
Adelson, E.H. and Bergen, J.R. (1986).The extraction of spatiotemporal energy in humanand machine vision. In Motion: Representation and Analysis (IEEE WorkshopProceedings). Piscataway, NJ: IEEE Publications, pp. 151–5.
Alais, D. and Blake, R. (2005). Binocular Rivalry. Cambridge, MA: MIT Press.
Allport, D.A. (1970). Temporal summation and phenomenal simultaneity: experimentswith the radius display. Q J Exp Psychol 22, 686–701.
Alpern, M. (1952). Metacontrast: historical introduction. Am J Opt 29, 631–46.
Alpern, M. (1953). Metacontrast. J Opt Soc Am 43, 648–57.
Alpern, M. (1965). Rod–cone independence in the after-flash effect. J Physiol 176, 462–72.
Alpern, M. and Barr, L. (1962). Durations of the after-images of brief light flashes amd thetheory of the Brucker and Sulzer effect. J Opt Soc Am 52, 219–21.
Alpern, M. and Rushton, W.A.H. (1965). The specificity of the cone interaction in theafter-flash effect. J Physiol 176, 473–82.
Alpern, M., Rushton, W.A.H., and Torii, S. (1970a). The size of rod signals. J Physiol 206,193–208.
Alpern, M., Rushton, W.A.H., and Torii, S. (1970b). The attenuation of rod signals bybackgrounds. J Physiol 206, 209–27.
Alpern, M., Rushton, W.A.H., and Torii, S. (1970c). The attenuation of rod signals bybleachings. J Physiol 207, 449–61.
Alpern, M., Rushton, W.A.H., and Torii, S. (1970d). Signals from cones. J Physiol 207,463–75.
Amassian, V.E., Cracco, R.Q., Maccabee, P.J., Cracco, J.B., Rudell, A., and Eberle, L. (1989).Suppression of visual perception by magnetic coil stimulation of human occipitalcortex. Electroencephalogr Clin Neurophysiol 74, 458–62.
Amassian, V.E., Cracco, R.Q., Maccabee, P.J., Cracco, J.B., Rudell, A.P., and Eberle, L.(1993). Unmasking human visual perception with the magnetic coil and its relationship to hemispheric asymmetry. Brain Res 605, 312–16.
Amassian, V.E., Cracco, R.Q., Maccabee, P.J., Cracco, J.B., Rudell, A.P., and Eberle, L.(1998). Transcranial magnetic stimulation in study of the visual pathway. J ClinNeurophysiol 15, 288–304.
Anbar, S. and Anbar, D. (1982). Visual Masking: a unified approach. Perception 11, 427–39.
Anderson, C.H. and van Essen, D.C. (1987). Shifter circuits: a computational strategy fordynamic aspects of visual processing. Proc Natl Acad Sci USA 84, 6297–301.
Anderson, S.J. and Burr, D.C. (1991). Spatial summation properties of directionallyselective mechanisms in human vision. J Opt Soc Am A 8, 1330–9.
Anderson, S.J., Burr, D.C., and Morrone, M.C. (1991). Two-dimensional spatial andspatial-frequency selectivity of motion-sensitive mechanisms in human vision. J OptSoc Am A 8, 1340–51.
Andreasen, N.C., Paradiso, S., and O’Leary, D.S. (1998). ‘Cognitive dysmetria’ as anintegrative theory of schizophrenia: a dysfunction in cortical-subcortical-cerebellarcircuitry? Schizophr Bull 24, 203–18.
Andreassi, J.L., Mayzner, M.S., Beyda, D.R., and Davidovics, S. (1971). Visual cortical evokedpotentials under conditions of sequential blanking. Percept Psychophys 10, 164–8.
Andreassi, J.L., Stern, M., and Okamura, H. (1974). Visual cortical evoked potentials as afunction of intensity variations in sequential blanking. Psychophysiology 11, 336–45.
Andreassi, J.L., De Simone, J.J., and Mellers, B.W. (1975). Amplitude changes in the visualevoked potential with backward masking. Electroencephalogr Clin Neurophysiol 41, 387–98.
Andrews, D.P. and Hammond, P. (1970). Mesopic increment threshold spectral sensitivityof single optic tract fibres in the cat: cone–rod interaction. J Physiol 209, 65–81.
Andrews, T.J. and Purves, D. (1997). Similarities in normal and binocularly rivalrous viewing. Proc Natl Acad Sci USA 94, 99005–8.
Ansorge, U. (2003). Asymmetric influences of temporally vs. nasally presented maskedvisual information: evidence for collicular contributions to nonconscious primingeffects. Brain Cogn 51, 317–25.
Ansorge, U. (2004). Top-down contingencies of nonconscious priming revealed by dual-task interference. Q J Exp Psychol 57A, 1123–48.
Ansorge, U. and Neumann, O. (2005). Intentions determine the effect of nonconsciuslyregistered visual information: evidence for direct parameter specification in themetacontrast dissociation. J Exp Psychol Hum Percept Perform 31, 762–77.
Ansorge, U., Klotz, W., and Neumann, O. (1998). Manual and verbal responses tocompletely masked (unreportable) stimuli: exploring some conditions for themetacontrast dissociation. Perception 27, 1177–89.
Anstis, S.M. and Moulden, B.P. (1970). After effects of seen movement: evidence forperipheral and central components. Q J Exp Psychol 22, 222–9.
Arrington, K.F. (1994). The temporal dynamics of brightness filling-in. Vision Res 34,3371–87.
Assad, J. (1999). Now you see it: frontal eye field responses to invisible targets. NatNeurosci 2, 205–6.
Atchley, P., Grobe, J., and Fields, L.M. (2002). The effect of smoking on sensory andattentional masking. Percept Psychophys 64, 328–36.
Aubert, H. (1865). Physiologie der Netzhaut. Breslau: Morgenstern.
Averbach, E. and Coriell, A.S. (1961). Short-term memory in vision. Bell Syst Tech J 40,309–28.
Azzopardi, P., Jones, K.E., and Cowey, A. (1999). Uneven mapping of magnocellular andparvocellular projections from the lateral geniculate nucleus to the striate cortex in the macaque monkey. Vision Res 39, 2179–89.
REFERENCES310
Baade, W. (1917a). Selbstbeobachtungen und Introvokation. Zeitschr Psychol PhysiolSinnesorg 79, 68–96.
Baade, W. (1917b). Experimentelle Untersuchungen dar darstellenden Psychologie des Wahrnehmungsprozesses. Zeitschr Psychol Physiol Sinnesorg 79, 97–127.
Bachmann, T. (1984). The process of perceptual retouch: nonspecific afferent activationdynamics in explaining visual masking. Percept Psychophys 35, 69–84.
Bachmann, T. (1988). Time course of the subjective contrast enhancement for a secondstimulus in successively paired above-threshold transient forms: perceptual retouchinstead of forward masking. Vision Res 28, 1255–61.
Bachmann, T. (1994). Psychophysiology of Visual Masking: The Fine Structure of ConsciousExperience. Commack, NY: Nova Science.
Bachmann, T. (1997). Visibility of brief images: the dual-process approach. Conscious Cogn 6, 491–518.
Bachmann, T. (1999). Twelve spatiotemporal phenomena and one explanantion. In CognitiveContributions to the Perception of Spatial and Temporal Events (ed G. Aschersleben,T. Bachmann, and J. Muesseler). Amsterdam: Elsevier, pp. 173–206.
Bachmann, T. (2000). Microgenetic Approach to the Conscious Mind. Amsterdam: JohnBenjamins.
Bachmann, T. and Allik, J. (1976). Integration and interruption in the masking of form byform. Perception 5, 79–97.
Bachmann, T. and Põder, E. (2001). Change in feature space is not necessary for the flash-lag effect. Vision Res 41, 1103–6.
Bachmann, T., Asser, T., Sarv, M., et al. (1998). Speed of elementary visual recognitionoperations in Parkinson’s disease as measured by the mutual masking method. J ClinExp Neuropsychol 20, 118–34.
Bacon-Macé, N., Macé, M.J., Fabre-Thorpe, M., and Thorpe, S.J. (2005). The time courseof visual processing: backward masking and natural scene categorisation. Vision Res 45,1459–69.
Bair, W., Cavanaugh, J.R., Smith, M.A., and Movshon, J.A. (2002). The timing of responseonset and offset in macaque visual neurons. J Neurosci 22, 3189–205.
Baker, W. (1963). Initial stages of light and dark adaptation. J Opt Soc Am 53, 98–103.
Balota, D.A. (1983). Automatic semantic activation and episodic memory encoding. J VerbLearn Verb Behav 22, 88–104.
Banta, A. and Breitmeyer, B.G. (1985). Stationary patterns suppress the perception ofstroboscopic motion. Vision Res 25, 1501–5.
Barlow, H.B., Fitzhugh, R., and Kuffler, S.W. (1957a). Dark adaptation, absolute thresholdand Purkinje shift in single units of the cat’s retina. J Physiol 137, 327–37.
Barlow, H.B., Fitzhugh, R., and Kuffler, S.W. (1957b). Change of organization of thereceptive fields of the cat’s retina during dark adaptation. J Physiol 137, 338–54.
Baron, J. and Thurstone, I. (1973). An analysis of the word superioty effect. Cogn Psychol4, 207–28.
Baroncz, Z. (1911). Versuch über den sogenannten Metakontrast. Pflugers Arch GesamtePhysiol 140, 491–507.
Barris, M.C. and Frumkes, T.E. (1978). Rod–cone interaction in human scotopic vision.IV. Cones stimulated by contrast flashes influence rod threshold. Vision Res 18, 801–8.
REFERENCES 311

Barry, S.H. and Dick, O. (1972). On the ‘recovery’ of masked targets. Percept Psychophys12, 117–20.
Bartley, S.H. (1938). A central mechanism in brightness discrimination. Proc Soc Exp BiolMed 38, 535–6.
Baseler, H.A. and Sutter, E.E. (1997). M and P components of the VEP and their visualfield distribution. Vision Res 37, 675–90.
Bashinski, H.S. and Bacharach, V.R. (1980). Enhancement of perceptual sensitivity as theresult of selectively attending to spatial locations. Percept Psychophys 28, 241–8.
Battersby, W.S. and Wagman, I.H. (1962). Neural limitations of visual excitability. IV.Spatial determinants of retrochiasmal interaction. Am J Physiol. 203, 359–65.
Battersby, W.S., Oesterreich, R.E., and Sturr, J.F. (1964). Neural limitations of visualexcitability. VII. Nonhomonymous retrochiasmal interactions. Am J Physiol206, 1181–8.
Baumgardt, E. and Segal, J. (1942). Facilitation et inhibition parameters de la functionvisuelle. Ann Psychol 43–44, 54–102.
Baxt, N. (1871). Über die Zeit, welche nötig ist, damit ein Gesichtseindruck zumBewusstsein kommt und über die Grösse (Extension) der bewussten Wahrnehmungbei einem Gesichtseindruck von gegebener Dauer. Arch Gesamte Psychol 4, 325–36.
Becker, M.W. and Anstis, S.M. (2004). Metacontrast masking is specific to luminancepolarity. Vision Res 44, 2537–43.
Benardete, E.A. and Kaplan, E. (1997). The receptive field of the primate P retinalganglion cell. I. Linear dynamics. Vis Neurosci 14, 169–85.
Benardete, E.A., Kaplan, E., and Knight, B.W. (1992). Contrast gain control in the primateretina: P cells are not X-like, some M cells are. Vis Neurosci 8, 483–6.
Benevento, L.A., Creutzfeldt, O.D., and Kuhnt, U. (1972). Significance of intracorticalinhibition in the visual cortex. Nat New Biol 238, 124–6.
Berbaum, K., Weisstein, N., and Harris, C. (1975). A vertex-superiority effect. Bull PsychonSoc 6, 418.
Berger, C. (1954). Illumination of surrounding field and flicker fusion frequency withfoveal images of different sizes. Acta Physiol Scand 30, 161–70.
Berman, N.J., Douglas, R.J., Martin, K.A., and Whitteridge, D. (1991). Mechanisms ofinhibition in cat visual cortex. J Physiol 440, 697–722.
Bernhard, C.G. (1940). Time correlations in man of electrophysiological and sensoryphenomena following light stimuli. Acta Physiol Scand 1 (Suppl 1), 52–94.
Bernstein, I., Amundson, V.E., and Schurman, D.L. (1973a). Metacontrast inferred fromreaction time and verbal report: replications and comments on the Fehrer–Biedermanexperiment. J Exp Psychol 100, 195–201.
Bernstein, I.H., Proctor, J.D., Proctor, R.W., and Schurman, D.L. (1973b). Metacontrastand brightness discrimination. Percept Psychophys 14, 293–7.
Bernstein, I.H., Fisicaro, S.A., and Fox, J.A. (1976). Metacontrast suppression and criterioncontent: a discriminant function analysis. Percept Psychophys 20, 198–204.
Berson, D.M. and McIlwain, J.T. (1982). Retinal Y-cell activation of deep-layer cells insuperior colliculus of the cat. J Neurophysiol 47, 700–14.
Bevan, W., Jonides, J., and Collyer, S.C. (1970). Chromatic relationships in metacontrastsuppression. Psychon Sci 19, 367–8.
REFERENCES312
Bex, P.J., Edgar, G.K., and Smith, A.T. (1995). Sharpening of drifting blurred images.Vision Res 35, 2539–46.
Bidwell, S. (1899). Curiosities of Light and Sight. London: Swan Sonnenschein & Co. Ltd.
Biederman, I. (1987). Recognition-by-components: a theory of human image understanding.Psychol Rev 94, 115–47.
Bischof, W.F. and Di Lollo, V. (1990). Perception of directional sampled motion in relationto displacement and spatial frequency: evidence for a unitary motion system. VisionRes 30, 1341–62.
Bischof, W.F. and Di Lollo, V. (1995). Motion and metacontrast with simultaneous onsetof stimuli. J Opt Soc Am A 12, 1623–36.
Bischof, W.F., Seiffert, A.E., and Di Lollo, V. (1996). Transient-sustained input todirectionally selective motion mechanisms. Perception 25, 1263–80.
Blake, R. and Logothetis, N.K. (2002). Visual competition. Nat Rev Neurosci 3, 13–23.
Blakemore, C. and Eggers, H.M. (1978). Effects of artificial anisometropia and strabismuson the kitten’s visual cortex. Arch Ital Biol 116, 385–9.
Blakemore, C. and Tobin, E.A. (1972). Lateral inhibition between orientation detectors inthe cat’s visual cortex. Exp Brain Res 15, 439–40.
Blakemore, C., Carpenter, R.H., and Georgeson, M.A. (1970). Lateral inhibition betweenorientation detectors in the human visual system. Nature 228, 37–9.
Blanc-Garin, J. (1973). Effet de la distance spatiale dans le masquage latéral rétroactif etproactive. Perception 1, 441–52.
Blanchard, J. (1918). The brightness sensibility of the retina. Phys Rev 11 (Series 2), 81–99.
Blick, D.W. and MacLeod, D.I.A. (1978). Rod threshold: influence of neighboring cones.Vision Res 18, 1611–16.
Bloch, A.M. (1885). Experience sur la vision. C R Seances Soc Biol Fil 37, 493–5.
Block, N. (1995). On a confusion of a function of consciousness. Behav Brain Sci 18,227–87.
Block, N. (1996). How can we find the neural correlate of consciousness? Trends Neurosci19, 456–9.
Bodis-Wollner, I. and Hendley, C. D. (1977). Relation of evoked potentials to pattern andlocal luminance detectors in the human visual system. In Visual Evoked Potentials inMan: New Developments (ed J.E. Desmedt). Oxford: Clarendon Press, pp. 197–207.
Bodis-Wollner, I. and Hendley, C.D. (1979). On the separability of two mechanismsinvolved in the detection of grating patterns in humans. J Physiol 291, 251–63.
Bonneh, Y.S., Cooperman, A., and Sagi, D. (2001). Motion-induced blindness in normalobservers. Nature 411, 798–801.
Borsting, E., Ridder, W.H., III, Dudeck, K., Kelley, C., Matsui, L., and Motoyama, J. (1996).The presence of a magnocellular defect depends on the type of dyslexia. Vision Res 36,1047–53.
Bowen, R.W. and Wilson, H.R. (1994). A two-process analysis of pattern masking. VisionRes 34, 645–57.
Bowen, R.W., Pola, J., and Matin, L. (1974). Visual persistence effects of flash luminance,duration, and energy. Vision Res 14, 295–303.
Bowen, R.W., Pokorny, J., and Cacciato, D. (1977). Metacontrast masking depends onluminance transients. Vision Res 17, 971–5.
REFERENCES 313
Bowling, A. and Lovegrove, W. (1980). The effect of stimulus duration on the persistenceof gratings. Percept Psychophys 27, 574–8.
Bowling, A. and Lovegrove, W. (1981). Two components to visible persistende: effects oforientation and contrast. Vision Res 21, 1241–51.
Bowling, A., Lovegrove, W., and Mapperson, B. (1979). The effect of spatial frequency andcontrast on visual persistence. Perception 8, 529–39.
Boyer, J. and Ro, T. (in press) Attention attenuates metacontrast masking. J Cogn.
Boynton, R.M. (1972). Discrimination of homogeneous double pulses of light. InHandbook of Sensory Physiology. Vol. 7/4: Visual Psychophysics (ed D. Jameson and L.M.Hurvich). New York: Springer, pp. 202–32.
Boynton, R.M. and Miller, N.D. (1963). Visual performance under condtions of transientadaptation. Illum Eng 58, 541–50.
Braddick, O.J. (1974). A short-range process in apparent motion. Vision Res 14, 519–27.
Braddick, O.J. (1980). Low-level and high-level processes in apparent motion. Philos TransR Soc Lond B 290, 137–51.
Braff, D. L. (1981). Impaired speed of information processing in nonmedicated schizotypalpatients. Schizophr Bull 7, 499–508.
Brand, A., Kopmann, S., and Herzog, M. (2004). Intact feature fusion in schizophrenicpatients. Eur Arch Psychiatry Clin Neurosci 254, 281–8.
Brehaut, J.C., Enns, J.T., and Di Lollo, V. (1999). Visual masking plays two roles in theattentional blink. Percept Psychophys 61, 1436–48.
Breitmeyer, B.G. (1973). A relationship between the detection of size, rate, orientation anddirection in the human visual system. Vision Res 13, 41–58.
Breitmeyer, B.G. (1975). Simple reaction time as a measure of the temporal responseproperties of transient and sustained channels. Vision Res 15, 1411–12.
Breitmeyer, B.G. (1978a). Disinhibition of metacontrast masking of Vernier acuity targets:sustained channels inhibit transient channels. Vision Res 18, 1401–5.
Breitmeyer, B.G. (1978b). Metacontrast masking as a function of mask energy. BullPsychon Soc 12, 50–2.
Breitmeyer, B.G. (1978c). Metacontrast with black and white stimuli: evidence for inhibitionof on and off sustained activity by either on or off transient activity. Vision Res 18,1443–8.
Breitmeyer, B.G. (1980). Unmasking visual masking: a look at the ‘why’ behind the veil ofthe ‘how’. Psychol Rev 87, 52–69.
Breitmeyer, B.G. (1984). Visual Masking. New York: Oxford University Press.
Breitmeyer, B.G. (1989). A visually based deficit in specific reading disability. Ir J Psychol10, 566–73.
Breitmeyer, B.G. (1991). Reality and relevance of sustained and transient channels in read-ing and reading disability. In Oculomotor Control and Cognitive Processes—Normal andPathological Aspects (ed R. Schmid and D.D. Zambarbieri). Amsterdam: Elsevier,pp. 473–83.
Breitmeyer, B.G. (1992). Parallel processing in human vision: history, review, and critique.In Applications of Parallel Processing in Vision (ed J. Brannan). Amsterdam: Elsevier,pp. 37–78.
REFERENCES314
Breitmeyer, B.G. (1993a). Sustained and transient channels in vision: a review andimplications for reading. In Visual Processes in Reading and Spelling (ed D. Willows,E. Corcos, and R. Kruk). Hillsdale, NJ: Erlbaum, pp. 95–110.
Breitmeyer, B.G. (1993b). The roles of sustained (P) and transient (M) channels in readingand reading disability. In Facets of Dyslexia and its Remediation (ed S.F. Wright andR. Groner). Amsterdam: Elsevier, pp. 13–31.
Breitmeyer, B.G. (1994). The role of sustained and transient pathways in reading andreading disability. In Eye Movements in Reading (ed J. Ygge and G. Lennerstrand).Oxford: Elsevier, pp. 219–33.
Breitmeyer, B.G. and Breier, J.I. (1994). Effects of background color on reaction time tostimuli varying in size and contrast: Inferences about human transient channels. VisionRes 34, 1039–45.
Breitmeyer, B.G. and Ganz, L. (1976). Implications of sustained and transient channels fortheories of visual pattern masking, saccadic suppression and information processing.Psychol Rev 83, 1–36.
Breitmeyer, B.G. and Ganz, L. (1977). Temporal studies with flashed gratings: inferencesabout human transient and sustained channels. Vision Res 17, 861–5.
Breitmeyer, B.G. and Halpern, M. (1978). Visual persistence depends on spatial frequencyand retinal locus. Presented at the Annual Meeting of the Psychonomic Society, SanAntonio, TX, November 1978.
Breitmeyer, B.G. and Horman, K. (1981). On the role of stroboscopic motion inmetacontrast. Bull Psychon Soc 17, 29–32.
Breitmeyer, B.G. and Julesz, B. (1975). The role of on and off transients in determiningthe psychological spatial frequency response. Vision Res 15, 411–15.
Breitmeyer, B.G. and Kersey, M. (1981). Backward masking by pattern stimulus offset.J Exp Psychol Hum Percept Perform 7, 972–7.
Breitmeyer, B.G. and Ögmen, H. (2000). Recent models and findings in visual backwardmasking: a comparison, review, and update. Percept Psychophys 62, 1572–95.
Breitmeyer, B.G. and Rudd, M. (1981). A single-transient masking paradigm. PerceptPsychophys 30, 604–6.
Breitmeyer, B.G. and Williams, M.C. (1990). Effects of isoluminant-background color on metacontrast and stroboscopic motion: interactions between sustained (P) andtransient (M) channels. Vision Res 30, 1069–75.
Breitmeyer, B.G., Love, R., and Wepman, B. (1974). Contour masking during stroboscopicmotion and metacontrast. Vision Res 14, 1451–6.
Breitmeyer, B. Battaglia, F., and Weber, C. (1976). U-shaped backward contour maskingduring stroboscopic motion. J Exp Psychol Hum Percept Perform 2, 167–73.
Breitmeyer, B.G., Levi, D.M., and Harwerth, R.S. (1981a). Flicker-masking in sptial vision.Vision Res 21, 1377–85.
Breitmeyer, B.G., Rudd, M., and Dunn, K. (1981b). Metacontrast investigations ofsustained–transient channel inhibitory interactions. J Exp Psychol Hum PerceptPerform 7, 770–9.
Breitmeyer, B.G., May, J.G., and Heller, S.S. (1991). Metacontrast reveals asymmetries atred-green isoluminance. J Opt Soc Am A 8, 1324–9.
REFERENCES 315
Breitmeyer, B., Ehrenstein, A., Pritchard, K., Hiscock, M., and Crisan, J. (1999). The rolesof location specificity and masking mechanisms in the attentional blink. PerceptPsychophys 61, 798–809.
Breitmeyer, B.G., Ögmen, H., and Chen, J. (2004a). Unconscious priming by color andform: different processes and levels. Conscious Cogn 13, 138–57.
Breitmeyer, B.G., Ro, T., and Ögmen, H. (2004b). A comparison of masking by visualand transcranial magnetic stimulation: implications for the study of conscious andunconscious visual processing. Conscious Cogn 13, 829–43.
Breitmeyer, B.G., Ro, T., and Singhal, N. (2004c). Unconscious priming with chromaticstimuli occurs at stimulus- not percept-dependent levels of visual processing. PsycholSci 15, 198–202.
Breitmeyer, B.G., Ögmen, H., and Koc, A. (2005a). Metacontrast and binocular-rivalrysuppression reveal hierarchies of unconscious visual processing. Paper presented at theAnnual Meeting of the Vision Sciences Society, Sarasota, FL, 6–11 May 2005.
Breitmeyer, B.G., Ögmen, H., Ramon, J., and Chen, J. (2005b). Unconscious and consciouspriming by forms and their parts. Vis Cogn 12, 720–36.
Breitmeyer, B.G., Kafaligönül, H., Ögmen, H., Mardon, L., Todd, S., and Ziegler, R. (inpress). Para- and metacontrast masking reveal different effects on brightness and contour visibility. Vision Res
Breitmeyer, B.G., Ziegler, R., and Hauske, G. (in preparation). Monoptic and dichopticparacontrast effects on brightness and contour visibility.
Bridgeman, B. (1971). Metacontrast and lateral inhibition. Psychol Rev 78, 528–39.
Bridgeman, B. (1975). Correlates of metacontrast in single cells of the cat visual system.Vision Res 15, 91–9.
Bridgeman, B. (1977). Reply to Brooks and Fuchs: exogenous and endogenouscontributions to saccadic suppression. Vision Res 17, 323–6.
Bridgeman, B. (1978). Distributed sensory coding applied to simulations of iconic storageand metacontrast. Bull Math Biol 40, 605–23.
Bridgeman, B. (1980). Temporal characteristics of cells in monkey striate cortex measured with metacontrast masking and brightness discrimination. Brain Res 196,347–64.
Bridgeman, B. (1988). Visual evoked potentials: concomitants of metacontrast in latecomponents. Percept Psychophys 43, 401–3.
Bridgeman, B. (2001). A comparison of two lateral inhibitory models of metacontrast.J. Math Psychol 45, 780–8.
Bridgeman, B. and Leff, S. (1979). Interaction of stimulus size and retinal eccentricity inmetacontrast masking. J Exp Psychol Hum Percept Perform 5, 101–9.
Bridgeman, B., Lewis, S., Heit, G., and Nagle, M. (1979). Relation between cognitive andmotor-oriented systems in visual position perception. J Exp Psychol Hum PerceptPerform 5, 692–700.
Bridgeman, B., Kirch, M., and Sperling, A. (1981). Segregation of cognitive and motoraspects of visual function using induced motion. Percept Psychophys 29, 336–42.
Broca, A. and Sulzer, D. (1902). La sensation lumineuse en function du temps. J PhysiolPathol Gen 4, 632–40.
REFERENCES316

Brooks, B. and Jung, R. (1973). Neuronal physiology of the visual cortex. In Handbookof Sensory Physiology. Vol. VII/3: Central Processing of Visual Information. Part B (ed R. Jung). New York: Springer-Verlag pp. 325–440.
Brown, J.L. (1965). Afterimages. In Vision and Visual Perception (ed C.H. Graham).New York: Wiley, pp. 479–503.
Brussel, E.M., Stober, S.R., and Favreau, O.E. (1978). Contrast reversal in backward masking. Vision Res 18, 225–7.
Buck, S.L., Peeples, D.R., and Makous, W. (1979). Spatial patterns of rod–cone interactions. Vision Res 19, 775–82.
Bunt, A.H., Hendrickson, A.E., Lund, J.S., Lund, R.D., and Fuchs, A.F. (1975). Monkeyretinal ganglion cells: morphometric analysis and tracing of axonal projections, with aconsideration of the peroxidase technique. J Comp Neurol 164, 265–85.
Burbeck, C.A. (1981). Criterion-free pattern and flicker thresholds. J Opt Soc Am 71, 1343–50.
Burchard, S. and Lawson, R.B. (1973). A U-shaped detection function for backwardmasking of similar contours. J Exp Psychol 99, 35–41.
Burr, D.C. (1980). Motion smear. Nature 284, 164–5.
Burr, D.C. (1981). Temporal summation of moving images by the human visual system.Proc R Soc Lond B Biol Sci 211, 321–39.
Burr, D.C. (1984). Summation of target and mask metacontrast stimuli. Perception 13,183–92.
Burr, D.C., Ross, J., and Morrone, M.C. (1986). Seeing objects in motion. Proc R Soc LondBiol Sci 227, 249–65.
Butler, P.D., Harkavy-Friedman, J.M., Amador, X.F., and Gorman, J.M. (1996). Backwardmasking in schizophrenia: relationship to medication status, neuropsychologicalfunctioning, and dopamine metabolism. Biol Psychiatry 40, 295–8.
Butler, T.W., King-Smith, P.E., Moore, R.K., and Riggs, L. (1976). Visual sensitivity toretinal image motion. J Physiol 263, 170–1P.
Cabeza, R. and Kato, T. (2000). Features are also important: contributions of featural andconfigural processing to face recognition. Psychol Sci 11, 429–33.
Cadenhead, K.S., Perry, W., and Braff, D.L. (1996). The relationship of information-processing deficits and clinical symptoms in schizotypal personality disorder. BiolPsychiatry 40, 853–8.
Calis, G. and Leeuwenberg, E. (1981). Grounding the figure. J Exp Psychol Hum PerceptPerform 7, 1386–97.
Caputo, G. (1998). Texture brightness filling-in. Vision Res 38, 841–51.
Carlson, T.A. and He, S. (2004). Competing global representations fail to initiate binocularrivalry. Neuron 43, 907–14.
Carpenter, G.A. and Grossberg, S. (1981). Adaptation and transmitter gating in vertebratephotoreceptors. J Theor Neurobiol 1, 1–42.
Carrasco, M., Williams, P.E., and Yeshurun, Y. (2002). Covert attention increases spatialresolution with or without masks: support for signal enhancement. J Vis 2, 467–79.
Carter, M., Brown, V., Breitmeyer, B., and Havig, P. (2003). Allocation of attention affectsthe time-course of metacontrast masking. Paper presented at the Annual Meeting ofthe Visual Sciences Society, Sarasota, FL, May 2003.
REFERENCES 317
Castet, E. (1994). Effect of the ISI on the visible persistence of a stimulus in apparentmotion. Vision Res 34, 2103–14.
Castet, E., Lorenceau, J., and Bonnet, C. (1993). The inverse intensity effect is not lost withstimuli in apparent motion. Vision Res 33, 1697–1708.
Cattell, J.McK. (1885a). The inertia of the eye and brain. Brain 8, 295–312.
Cattell, J.McK. (1885b). The influence of the intensity of the stimulus on the length of thereaction time. Brain 8, 511–15.
Cattell, J.McK. (1886). Über die Trägheit der Netzhaut und des Sehcentrums. Philos Stud3, 94–127.
Cavanagh, P. and Mather, G. (1989). Motion: the long and the short of it. Spat Vis 4, 103–29.
Cavonius, C.R. and Reeves, A.J. (1983). The interpretation of metacontrast and contrast-flash spectral sensitivity functions. In Color Vision: Physiology andPsychophysics (ed J.D. Mollon and L.T. Sharpe). London: Academic Press, pp. 471–8.
Charpentier, A. (1890). Recherches sur la persistence des impressions retiniennes et sur laexcitations lumineuses de courte duree. Arch Ophthalmol 10, 108–35.
Chen, S., Bedell, H.E., and Ögmen, H. (1995). A target in real motion appears blurred inthe absence of other proximal moving targets. Vision Res 35, 2315–28.
Citron, M.C., Emerson, R.C., and Ide, L.S. (1981). Spatial and temporal receptive-fieldanalysis of the cat’s geniculocortical pathway. Vision Res 21, 385–96.
Cleland, B.G., Levick, W.R., and Sanderson, K.J. (1973). Properties of sustained andtransient ganglion cells in the cat retina. J Physiol 228, 649–80.
Clements, B.A., Blumenfeld, L.D., and Cobb, S. (1997). The gamma band response mayaccount for poor P50 suppression in schizophrenia. Neuroreport 8, 3889–93.
Coenan, A.M.L. and Eijkman, E.G.J (1972). Cat optic tract and geniculate unit responsescorresponding to human visual masking effects. Exp Brain Res 15, 441–51.
Cohen, L.S. and Bechtold, H.P. (1974). Visual recognition as a function of stimulus offsetasynchrony and duration. Percept Psychophys 15, 221–6.
Cohen, L.S. and Bechtold, H.P. (1975). Visual recognition of dot pattern bigrams: Anextension and replication. Am J. Psychol 88, 187–99.
Cohen, M.A. and Grossberg, S. (1984). Neural dynamics of brightness perception: features,boundaries, diffusion, and resonance. Percept Psychophys 36, 428–56.
Cohen, S.D. and Hindmarsh, A.C. (1994). CVODE User Guide. Lawrence LivermoreNational Laboratory Tech. Rep. UCRL-MA-118618.
Coletta, N.J. and Williams, D.R. (1987). Psychophysical estimate of extrafoveal conespacing. J Optl Soc Am A 4, 1503–13.
Collingwood, R.G. (1940). Essay on Metaphysics. London: Oxford University Press.
Collingwood, R.G. (1956). The Idea of History. London: Oxford University Press.
Coltheart, M. (1980). Iconic memory and visible persistence. Percept Psychophys 27,183–228.
Connors, B.W., Malenka, R.C., and Silva, L.R. (1988). Two inhibitory postsynapticpotentials, and GABAA and GABAB receptor-mediated responses in neocortex of ratand cat. J Physiol 406, 443–68.
Corfield, R., Frosdick, J.P., and Campbell, F.W. (1978). Grey-out elimination: the roles ofspatial waveform, frequency and phase. Vision Res 18, 1305–11.
REFERENCES318
Corthout, E., Uttl, B., Walsh, V., Hallett, M., and Cowey, A. (1999a). Timing of activityin early visual cortex as revealed by transcranial magnetic stimulation. Neuroreport10, 2631–4.
Corthout, E., Uttl, B., Ziemann, U., Cowey, A., and Hallett, M. (1999b). Two periods ofprocessing in the (circum)striate visual cortex as revealed by transcranial magneticstimulation. Neuropsychologia 37, 137–45.
Corthout, E., Uttl, B., Juan, C.-H., Hallett, M., and Cowey, A. (2000). Suppression of visionby transcranial magnetic stimulation; a third mechanism. Neuroreport 11, 2345–9.
Corwin, T.R., Volpe, L.C., and Tyler, C.W. (1976). Images and after-images of sinusoidalgratings. Vision Res 16, 345–9.
Cox, S.I. and Dember, W.N. (1972). U-shaped metacontrast functions with a detectiontask. J Exp Psychol 95, 327–33.
Cox, M.D. and Leventhal, D.B. (1978). A multivariate analysis and modification of apreattentive, perceptual dysfunction in schizophrenia. J Nerv Ment Dis 166, 709–18.
Crawford, B.H. (1940). The effect of field size and pattern on the change of visual sensitivity with time. Proc R Soc London B Biol Sci 129, 94–106.
Crawford, B.H. (1947). Visual adaptation in relation to brief conditioning stimuli. Proc RSoc London B Biol Sci 134, 283–302.
Creutzfeldt, O.D., Kuhnt, U., and Benevento, L.A. (1974). An intracellular analysis ofvisual cortical neurones to moving stimuli: response in a co-operative neuronal network. Exp Brain Res 21, 251–74.
Crick, F. (1984). Function of the thalamic reticular complex: the searchlight hypothesis.Proc Natl Acad Sci USA 81, 4586–90.
Crick, F. and Koch, C. (1995). Are we aware of neural activity in primary visual cortex?Nature 375, 121–3.
Crick, F. and Koch, C. (2003). A framework for consciousness. Nat Neurosci 6, 119–26.
Croner, L.J. and Kaplan, E. (1995). Receptive fields of P and M ganglion cells across theprimate retina. Vision Res 35, 7–24.
Crook, M.N. (1937). Visual discrimination of movement. J Psychol 3, 541–58.
Dacey, D.M. (1993). The mosaic of midget ganglion cells in the human retina. J Neurosci13, 5334–55.
Dacey, D.M. and Petersen, M.R. (1992). Dendritic field size and morphology of midgetand parasol ganglion cells of the human retina. Proc Natl Acad Sci USA 89, 9666–70.
Dakin, S.C. and Hess, R.F. (1997). The spatial mechanism mediating symmetryperception. Vision Res 37, 2915–30.
De Gelder, B., de Haan, E., and Heywood, C. (2001). Out of Mind. Oxford: OxfordUniversity Press.
Dehaene, S., Naccache, N., Cohen, L., et al. (2001). Cerebral mechanisms of word maskingand unconscious repetition priming. Nat Neurosci 4, 752–8.
Dehaene, S., Sergent, C., and Changeux, J.-P. (2003). A neuronal network model linkingsubjective reports and objective physiological data during conscious perception. ProcNatl Acad Sci USA 100, 8520–5.
De Kamps, M. and van der Velde, F. (2001). Using a recurrent network to bind form, colorand positon into a unified percept. Neurocomputing 38–40, 523–8.
REFERENCES 319
Dell’Acqua, R., Pascali, A., Jolicoeur, P., and Sessa, P. (2003). Four-dot masking producesthe attentional blink. Vision Res 43, 1907–13.
Delord, S. (1998). Which mask is most efficient: a pattern or noise? It depends on the task.Vis Cogn 5, 313–38.
Demb, J.B., Boynton, G.M., Best, M., and Heeger, D.J. (1998). Psychophysical evidence fora magnocellular pathway deficit in dyslexia. Vision Res 38, 1555–9.
Demirci, H., Gezer, A., Sezen, F., Ovali, T., Demiralp, T., and Isoglu-Alkoc, U. (2002).Evaluation of the functions of the parvocellular and magnocellular pathways in stabismicamblyopia. J Pediatr Opthalmol Strabismus 39, 215–21.
De Monasterio, F.M. (1978a). Properties of concentrically organized X and Y ganglioncells of macaque retina. J Neurophysiol 41, 1394–1417.
De Monasterio, F.M. (1978b). Center and surround mechanisms of opponent-color X andY ganglion cells of retina of macaques. J Neurophysiol 41, 1418–34.
De Monasterio, F.M. and Schein, S.J. (1980). Protan-like spectral sensitivity of foveal Yganglion cells of the retina of macaque monkeys. J Physiol 299, 385–96.
Dennett, D.C. (1991). Consciousness Explained. Boston, MA: Little, Brown.
Derrington, A.M. and Lennie, P. (1984). Spatial and temporal contrast sensitivities ofneurones in lateral geniculate nucleus of macaque. J Physiol 357, 219–40.
Desimone, R., Albright, T.D., Gross, C.G., and Bruce, C. (1984). Stimulus-selectiveproperties of inferior temporal neurons in the macaque. J Neurosci 4, 2051–62.
DeYoe, E.A. and Van Essen, D.C. (1988). Concurrent processing streams in monkey visualcortex. Trends Neurosci 11, 219–26.
Dick, A.O. and Dick, S.O. (1969). An analysis of hierarchical processing in visualperception. Can J Psychol 23, 203–11.
Didner, R. and Sperling, G. (1980). Perceptual delay: a consequence of metacontrast andapparent motion. J Exp Psychol Hum Percept Perform 6, 235–43.
Di Lollo, V. (1980). Temporal integration in vision. J Exp Psychol Gen 109, 75–97.
Di Lollo, V. and Bischof, W.F. (1995). Inverse-intensity effect in duration of visiblepersistence. Psychol Bull 118, 223–37.
Di Lollo, V. and Hogben, J.H. (1985). Suppression of visible persistence. J Exp Psychol HumPercept Perform 11, 304–16.
Di Lollo, V. and Hogben, J.H. (1987). Suppression of visible persistence as a function ofspatial separation between inducing stimuli. Percept Psychophys 41, 345–54.
Di Lollo, V., Bischof, W.F., and Dixon, P. (1993). Stimulus-onset asynchrony is notnecessary for motion perception or metacontrast masking. Psychol Sci 4, 260–3.
Di Lollo, V., Enns, J.T., and Rensink, R.A. (2000). Competition for consciousness among visualevents: the psychophysics of reentrant visual processes. J Exp Psychol Gen 129, 481–507.
Di Lollo, V., Enns, J.T., and Rensink, R.A. (2002). Object substitution without reentry?J Exp Psychol Gen 131, 594–6.
Di Lollo, V., von Muhlenen, A., Enns, J.T., and Bridgeman, B. (2004). Decoupling stimulusduration from brightness in metacontrast masking: data and models. J Exp PsycholHum Percept Perform 30, 733–45.
Dimberg, U., Thunberg, M., and Elmehed, K. (2000). Unconscious facial reactions toemotional facial expressions. Psychol Sci 11, 86–9.
REFERENCES320
Di Russo, F. and Spinelli, D. (1999). Electrophysiological evidence for an early attentionalmechanism in visual processing in humans. Vision Res 39, 2975–85.
Dixon, N.F. and Hammond, E.J. (1972). The attenuation of visual persistence. Br J Psychol63, 243–54.
Dodge, R. (1900). Visual perception during eye movement. Psychol Rev 7, 454–65.
Dolan, R.J. (2002). Emotion, cognition, and behavior. Science 298, 1191–4.
Donagan, A. (1966). The Popper–Hempel theory reconsidered. In Philosophical Analysisand History (ed W.H. Dray). New York: Harper and Row, pp.127–59.
Donchin, E. and Lindsey, B.B. (1965). Retroactive brightness enhancement with briefpaired flashes of light. Vision Res 5, 59–70.
Donchin, E., Wicke, J.D., and Lindsey, D.B. (1963). Cortical evoked potentials andperception of paired flashes. Science 141, 1285–6.
Drasdo, N. (1980). Cortical potentials evoked by pattern presentation in the foveal region.In Evoked Potentials (ed C. Barker). Baltimore, MD: University Park Press, pp. 167–74.
Dreher, B., Fukuda, Y., and Rodieck, R.W. (1976). Identification, classification and anatomical segregation of cells with X-like and Y-like properties in the lateral geniculate nucleus of old-world primates. J Physiol 258, 433–52.
Dresp, B. (1993). Bright lines and edges facilitate the detection of small line targets. SpatVis 7, 213–25.
Dresp, B. and Grossberg, S. (1997). Contour integration across polarities and spatial gaps:from local contrast filtering to global grouping. Vision Res 37, 913–24.
du Croz, J.J. and Rushton, W.A.H. (1963). Cone dark-adaptation curves. J Physiol 168, 52P.
Duncan, J. (1984). Selective attention and the organization of visual information. J ExpPsychol Gen 113, 501–17.
Duncan, J. (1985). Two techniques for investigating perception without awareness. PerceptPsychophys 38, 296–8.
Ebbecke, U. (1920). Über das Augenblicksehen. Pflugers Arch Gesamte Physiol 185,181–95.
Edelman, G.M. (1987). Neural Darwinism. New York: Basic Books.
Edwards, S.B., Ginsburgh, C.L., Henkel, C.K., and Stein, B.E. (1979). Sources of subcorticalprojections to the superior colliculus in the cat. J Comp Neurol 184, 309–30.
Edwards, V.T., Hogben, J.H., Clark, C.D., and Pratt, C. (1996). Effects of a red backgroundon magnocellular functioning in average and specifically disabled readers. Vision Res36, 1037–45.
Egeth, H. and Gilmore, G. (1973). Perceptibility of the letters in words and nonwords withcomplete control of redundancy. Bull Psychon Soc 2, 329.
Egly, R., Driver, J., and Rafal, R.D. (1994a). Shifting attention between objects and locations:evidence from normal and parietal lesion subjects. J Exp Psychol Gen 123, 161–77.
Egly, R., Rafal, R., Driver, J., and Starrveveld, Y. (1994b). Covert orienting in the split brainreveals hemispheric specialization for object-based attention. Psychol Sci 5, 380–3.
Eimer, M. (1996). The N2pc component as an indicator of attentional selectivity.Electroencephalogr Clin Neurophysiol 99, 225–34.
Eimer, M. (1999). Facilitatory and inhibitory effects of masked prime stimuli on motoractivation and behavioral performance. Acta Psychol 101, 293–313.
REFERENCES 321
Eimer, M. and Schlaghecken, F. (1998). Effects of masked stimuli on motor activation:behavioral and elctrophysiological evidence. J Exp Psychol Hum Percept Perform 24,1737–47.
Eimer, M. and Schlaghecken, F. (2002). Links between conscious awareness and responseinhibition: evidence from masked priming. Psychol Bull Rev 9, 514–20.
Elder, J.H. and Zucker, S.W. (1998). Evidence for boundary-specific grouping. Vision Res38, 143–52.
Emerson, R.C., Bergen, J.R., and Adelson, E.H. (1992). Directionally selective complexcells and the computation of motion energy in cat visual cortex. Vision Res 32, 203–18.
Emre, M., Groner, M., Hofer, D., Groner, R., and Fisch, H.U. (1989). Effects ofbenzodiazepines on forward and backward visual masking. Clin Vis Sci 4, 257–63.
Engel, A.K., Fries, P., Koenig, P., Brecht, M., and Singer, W. (1999). Temproal binding,binocular rivalry, and consciousness. Conscious Cogn 8, 128–51.
Enns, J.T. (2002). Visual binding in the standing-wave illusion. Psychon Bull Rev 9, 489–96.
Enns, J.T. (2004). Object substitution and its relation to other forms of visual masking.Vision Res 44, 1321–31.
Enns, J.T. and Di Lollo, V. (1997). Object substitution: a new form of masking in unattendedvisual locations. Psychol Sci 8, 135–9.
Enns, J.T. and Di Lollo, V. (2000). What’s new in visual masking? Trends Cogn Sci 4,345–52.
Enns, J.T., Visser, T.A., Kawahara, J., and Di Lollo, V. (2001). Visual masking and taskswitching in the attentional blink. In The Limits of Attention (ed K. Shapiro). Oxford:Oxford University Press, pp. 65–81.
Enoch, J.M., Sunga, R.N., and Bachmann, E. (1970a). A static perimetric techniquebelieved to test receptive field properties. I. Extension of Westheimer’s experiments onspatial interaction. Am J Ophthalmol 70, 113–26.
Enoch, J.M., Sunga, R.N., and Bachmann, E. (1970b). A static perimetric techniquebelieved to test receptive field properties. II. Adaptation of the method to thequantitative perimeter. Am J Ophthalmol 70, 126–37.
Enroth-Cugell, C. and Robson, J.G. (1966). The contrast sensitivity of retinal ganglioncells of the cat. J Physiol 187, 517–52.
Enroth-Cugell, C., Hertz, B.G., and Lennie, P. (1977). Convergence of rod and cone signalsin the cat’s retina. J Physiol 269, 297–318.
Erdmann, B. and Dodge, R. (1898). Psychologische Untersuchungen über das Lesen aufExperimenteller Grundlage. Halle: Max Niemeyer.
Eriksen, C.W. (1966). Temporal luminance summation effects in backward and forwardmasking. Percept Psychophys 1, 87–92.
Eriksen, C.W. and Eriksen, B.A. (1972). Visual backwward masking as revealed by choicereaction time. Percept Psychophys 12, 5–8.
Eriksen, C.W., Becker, B.A., and Hoffman, J.E. (1970). Safari to masking land: a hunt forthe elusive U. Percept Psychophys 8, 245–50.
Erismann, T. (1935). Die Empfindungszeit. Arch Gesamte Psychol 93, 453–519.
Ernst, U.A., Pawelzik, K.R., Sahar-Pikielny, C., and Tsodyks, M.V. (2001). Intracorticalorigin of visual maps. Nat Neurosci 4, 431–6.
REFERENCES322
Erwin, D.E. (1976). Further evidence for two components in visual persistence. J ExpPsychol Hum Percept Perform 2, 191–209.
Esteves, F. and Öhman, A. (1993). Masking the face: recogniton of emotional facialexpressions as a function of parameters of backward masking. Scand J Psychol 34, 1–18.
Exner, S. (1868). Über die zu einer Gesichtswahrnehmung nöthige Zeit. Wiener SitzungsberMath-Naturwiss Cl Kaiserlichen Akad Wiss 58 (Part 2), 601–32.
Exner, S. (1875). Experimentelle Untersuchungen der einfachsten psychischen Prozesse.Pflugers Arch Gesamte Physiol 11, 403–32.
Exner, S. (1888). Über optische Bewegungsempfindungen. Biol Zentralbl (Leipzig) 8, 437–48.
Exner, S. (1898). Studien auf dem Grenzgebiet des lokalisierten Sehens. Pflugers ArchGesamte Physiol 73, 117–71.
Farah, M.J., Wilson, K.D., Drain, M., and Tanaka, J. N. (1998). What is ‘special’ about faceperception? Psychol Rev 105, 482–98.
Farrell, J.E. (1984). Visible persistence of moving objects. J Exp Psychol Hum PerceptPerform 10, 502–11.
Farrell, J.E., Pavel, M., and Sperling, G. (1990). The visible persistence of stimuli instroboscopic motion. Vision Res 30, 921–36.
Fechner, G.T. (1840a). Uber die subjektiven Nachbilder und Nebenbilder I. Poggend AnnPhys Chem 50, 193–221.
Fechner, G.T. (1840b). Uber die subjektiven Nachbilder und Nebenbilder II. Poggend AnnPhys Chem 50, 427–70.
Fehmi, L.G., Adkins, J.W., and Lindsey, D.B. (1969). Electrophysiological correlates ofvisual perceptual masking in monkeys. Exp Brain Res 7, 299–316.
Fehrer, E. (1966). Effect of stimulus similarity on retroactive masking. J Exp Psychol 71,612–15.
Fehrer, E. and Biederman, I. (1962). A comparison of reaction and verbal report in detection of masked stimuli. J Exp Psychol 64, 126–30.
Fehrer, E. and Raab, D. (1962). Reaction time to stimuli masked by metacontrast. J ExpPsychol 63, 143–7.
Fehrer, E. and Smith, E. (1962). Effects of luminance ratio on masking. Percept Mot Skills14, 243–53.
Felipe, A., Buades, M.J., and Artigas, J.M. (1993). Influence of the contrast sensitivity function on the reaction time. Vision Res 33, 2461–6.
Felmingham, K.L. and Jakobson, L.S. (1995). Visual and visuomotor performance indyslexic children. Exp Brain Res 106, 467–74.
Ferrera, V.P., Nealy, T.A., and Maunsell, J.H.R. (1992). Mixed parvocellular and magnocellulargeniculate signals in visual area V4. Nature 358, 756–8.
Ferry, E.S. (1892). Persistence of vision. Am J Sci 44 (Ser. 3), 192–207.
Finkel, D.L. (1973). A developmental comparison of two types of visual information. J ExpChild Psychol 16, 250–66.
Finkel, D.L. and Smythe, L. (1973). Short-term storage of spatial information. Dev Psychol9, 424–8.
Finlay, B.L., Schiller, P.H., and Volman, S.F. (1976). Quantitative studies of single-cellproperties in monkey striate cortex. IV. Corticotectal cells. J Neurophysiol 39, 1352–61.
REFERENCES 323
Fisch, H.U., Groner, M., Groner, R., and Menz, C. (1983). Influence of diazepam andmethylphenidate on identification of rapidly presented letter strings: diazepamenhances visual masking. Psychopharmacology 80, 61–6.
Fisicaro, S.A., Bernstein, I.H., and Narkiewicz, P. (1977). Apparent motion and metacontrast suppression: a decision analysis. Percept Psychophys 22, 517–25.
Flaherty, T.B. and Matteson, H.H. (1971). Comparison of two measures of metacontrast.J Opt Soc Am 61, 828–30.
Foley, J.M. and Chen, C.-C. (1997). Analysis of the effect of pattern adaptation on patternpedestal effects: a two-process model. Vision Res 37, 2779–88.
Foster, D.H. (1976). Rod–cone interaction in the after-flash effect. Vision Res 16, 393–6.
Foster, D.H. (1977). Rod- and cone-mediated interactions in the fine-grain movementillusion. Vision Res 17, 123–7.
Foster, D.H. (1978). Action of red-sensitive colour mechanism on blue-sensitive colourmechanism in visual masking. Opt Acta 25, 1001–4.
Foster, D.H. (1979). Interactions between blue- and red-sensitive colour mechansims inmetacontrast masking. Vision Res 19, 921–31.
Foster, D.H. and Mason, R.J. (1977). Interaction between rod and cone systems indichoptic visual masking. Neurosci Lett 4, 39–42.
Fotowat, H., Ögmen, H., Bedell, H.E., and Breitmeyer, B.G. (in press). Probing oscillatoryvisual dynamics at the perceptual level. In Handbook of Neural Engineering (ed M.Akay). New York: Wiley.
Fowler, C.A., Wolford, G., Slade, R., and Tassinary, L. (1981). Lexical access with andwithout awareness. J Exp Psychol Gen 110, 341–62.
Fox, R. (1978). Visual masking. In Handbook of Sensory Physiology. Vol. 8, Perception (edR. Held, H. Leibowitz, and H.L. Teuber). New York: Springer, pp. 621–53.
Francis, G. (1996a). Cortical dynamics of visual persistence and temporal integration.Percept Psychophys 58, 1203–12.
Francis, G. (1996b). Cortical dynamics of lateral inhibition: visual persistence and ISI.Percept Psychophys 58, 1103–9.
Francis, G. (1997). Cortical dynamics of lateral inhibition: metacontrast masking. PsycholRev 104, 572–94.
Francis, G. (2000). Quantitative theories of metacontrast masking. Psychol Rev 107, 768–85.
Francis, G. and Cho, Y.S. (2005). Computational models of masking. In The First HalfSecond (ed H. Ögmen and B.G. Breitmeyer) Cambridge, MA: MIT Press, pp. 111–26.
Francis, G. and Grossberg, S. (1996a). Cortical dynamics of boundary segmentation andreset: persistence, afterimages, and residual traces. Perception 25, 543–67.
Francis, G. and Grossberg, S. (1996b). Cortical dynamics of form and motion integration:persistence, apparent motion, and illusory contours. Vision Res 36, 149–73.
Francis, G. and Hermens, F. (2002). Comment on ‘Competition for consciousness amongvisual events: the psychophysics of reentrant visual processes’ (Di Lollo, Enns andRensink). J Exp Psychol Gen 131, 590–3.
Francis, G. and Herzog, M. (2004). Testing quantitative models of backward masking.Psychon Bull Rev 11, 104–12.
Francis, G. and Kim, H. (1999). Motion parallel to line orientation: disambiguation ofmotion percepts. Perception 28, 1243–55.
REFERENCES324
Francis, G. and Kim, H. (2001). Perceived motion in orientational afterimages: directionand speed. Vision Res 41, 161–72.
Francis, G. and Rothmayer, M. (2003). Interactions of afterimages for orientation andcolor: experimental data and model simulations. Percept Psychophys 65, 508–22.
Francis, G., Grossberg, S., and Mingolla, E. (1994). Cortical dynamics of feature bindingand reset: control of visual persistence. Vision Res 34, 1089–1104.
Freeman, E., Driver, J., and Sagi, D. (2001). Psychophysical measurement of attentionalmodulation in low-level vision using the lateral-interaction paradigm. In VisualAttention Mechanisms (ed V. Cantoni, M. Marinaro, and A. Petrosino). New York:Plenum, pp. 1–15.
Fries, P., Roelfsema, P.R., Engel, A.E., Koening, P., and Singer, W. (1997). Synchronizationof oscillatory responses in visual cortex correlates with perception in interocularrivalry. Proc Natl Acad Sci USA 94, 12669–704.
Frith, C. and Dolan, R.J. (1997). Brain mechanisms associated with top-down processes inperception. Philos Trans R Soc Lond B Biol Sci 352, 1221–30.
Frizzi, J.T. (1979). Midbrain reticular stimulation and brightness detection. Vision Res19, 123–30.
Fröhlich, F.W. (1921). Untersuchungen über periodische Nachbilder. Zeitschr Sinnesphysiol52, 60–8.
Fröhlich, F.W. (1922a). Über den Einfluss der Hell- und Dunkeladaptation auf den Verlaufder periodischen Nachbilder. Zeitschr Sinnesphysiol 53, 79–107.
Fröhlich, F.W. (1922b). Über die Abhängigkeit der periodischen Nachbilder von der Dauerder Belichtung. Zeitschr Sinnesphysiol 53, 108–21.
Fröhlich, F.W. (1923). Über die Messung der Empfindungszeitr. Zeitschr Sinnesphysiol54, 58–78.
Fröhlich, F.W. (1929). Die Empfindungszeit. Jena: Fischer Verlag.
Frumkes, T.E. and Temme, L.A. (1977). Rod–cone interaction in human scotopic vision.II: Cones influence rod increment thresholds. Vision Res 17, 673–9.
Frumkes, T.E., Sekuler, M.D., Barris, M.C., Reiss, E.H., and Chalupa, L.M. (1973).Rod–cone interaction in human scotopic vision. I: Temporal analysis. Vision Res 13,1269–82.
Fry, G.A. (1934). Depression of the activity aroused by a flash of light by applying a secondflash immediately afterwards to adjacent areas of the retina. Am J Physiol 108, 701–7.
Fry, G.A. (1935). Color sensations produced by intermittent white light and the three-component theory of color vision. Am J Psychol 47, 464–9.
Fry, G.A. and Bartley, S.H. (1936). The effect of steady illumination on one part of theretina upon the critical flicker frequency in another. J Exp Psychol 19, 351–6.
Fujita, I., Tanaka, K., Ito, M., and Cheng, K. (1992). Columns for visual features of objectsin monkey inferotemporal cortex. Nature 360, 343–6.
Ganz, L. (1975). Temporal factors in visual perception. In Handbook of Perception, Vol.5(ed E.C. Carterette and M.P. Friedman). New York: Academic Press, pp. 169–231.
Gaudiano, P. (1992). A unified neural network of spatio-temporal processing in X and Yretinal ganglion cells. II: Temporal adaptation and simulation of experimental data.Biol Cybern 67, 23–34.
Gegenfurter, K.R. (2003). Cortical mechanisms of color vision. Nat Rev 4, 563–72.
REFERENCES 325
Geisler, W.S. and Diehl, R.L. (2003). A Bayesian approach to the evolution of perceptualand cognitive systems. Cogn Sci 27, 379–402.
Geldard, F.A. (1932). Foveal sensitivity as influenced by peripheral stimulation. J GenPsychol 7, 185–9.
Geldard, F.A. (1934). Flicker relations within the fovea. J Opt Soc Am 24, 299–302.
Geremek, A., Stürzel, F., da Pos, O., and Spillmann, L. (2002). Masking, persistence andtransfer in rotating arcs. Vision Res 42, 2509–19.
Gerrits, H.J.M. and Timmerman, G.J.M.E.N. (1969). The filling-in process in patients withretinal scotoma. Vision Res 9, 439–42.
Gerrits, H.J.M. and Vendrik, A.J.H. (1970). Simultaneous contrast, filling-in process andinformation processing in man’s visual system. Exp Brain Res 11, 411–30.
Gibson, J.J. (1979). The Ecological Approach to Visual Perception. Boston, MA: HoughtonMifflin Co.
Giersch, A. and Herzog, M.H. (2004). Lorazepam strongly prolongs visual informationprocessing. Neuropsychopharmacology 29, 1386–94.
Giesbrecht, B.L. and Di Lollo, V. (1998). Beyond the attentional blink: visual masking byobject substitution. J Exp Psychol Hum Percept Perform 24, 1454–66.
Giesbrecht, B.L., Bischof, W.F., and Kingstone, A. (2003). Visual masking during theattentional blink: Tests of the object substitution hypothesis. J Exp Psychol HumPercept Perform 29, 238–58.
Gilbert, C., Ito, M., Kapadia, M., and Westheimer, G. (2000). Interactions betweenattention, context and learning in primary visual cortex. Vision Res 40, 1217–26.
Gilden, D.L., MacDonald, K.E., and Lasaga, M.I. (1988). Masking with minimal contours:selective inhibition with low spatial frequencies. Percept Psychophys 44, 127–32.
Gilinsky, A.S. (1967). Masking of contour-detectors in the human visual system. PsychonSci 8, 395–6.
Gilinsky, A.S. (1968). Orientation-specific effects of patterns of adapting light on spatialacuity. J Opt Soc Am 58, 13–18.
Glass, R.A. and Sternheim, C.E. (1973). Visual sensitivity in the presence of alternatingmonochromatic fields of light. Vision Res 13, 689–99.
Glennerster, A. and Parker, A.J. (1997). Computing stereo channels from masking data.Vision Res 37, 2143–52.
Goodale, M.A., Pélisson, D., and Prablanc, C. (1986). Large adjustments in visually guidedreaching do not depend on vision of the hand or perception of target displacement.Nature 320, 748–50.
Gouras, P. (1969). Antidromic responses of orthodromically identified ganglion cells inmonkey retina. J Physiol 204, 407–419.
Gouras, P. and Link, K. (1966). Rod and cone interaction in dark-adapted monkeyganglion cells. J Physiol 184, 499–510.
Graham, C.H. and Granit, R. (1931). Comparative studies on the peripheral and centralretina. VI: Inhibition, summation, and synchronization of impulses in the retina Am JPhysiol 98, 664–673.
Grandison, T.D., Ghirardelli, T.G., and Egeth, H.E. (1997). Beyond similarity: masking ofthe target is sufficient to cause the attentional blink. Percept Psychophys 59, 266–74.
REFERENCES326
Green, D.M. and Swets, J.A. (1966). Signal Detection Theory and Psychophysics. New York:John Wiley & Sons.
Green, M. (1981a). Psychophysical relationships among mechanisms sensitive to pattern,motion and flicker. Vision Res 21, 971–83.
Green, M. (1981b). Spatial frequency masking in masking by light.Vision Res 21, 861–6.
Green, M.F. and Walker, E. (1986). Symptom correlates of vulnerability to backwardmasking in schizophrenia. Am J Psychiatry 143, 181–6.
Green, M.F., Nuechterlein, H.H., and Mintz, J. (1994a). Backward masking in schizophreniaand mania, I: specifying a mechanism. Arch Gen Psychiatry 51, 939–44.
Green, M.F., Nuechterlein, H.H., and Mintz, J. (1994b). Backward masking in schizophreniaand mania. II: specifying the visual channels. Arch Gen Psychiatry 51, 945–51.
Green, M.F., Nuechterlein, H.H., and Breitmeyer, B. (1997). Backward masking performancein unaffected siblings of schizophrenic patients. Arch Gen Psychiatry 54, 465–72.
Green, M.F., Nuechterlein, H.H., Breitmeyer, B., and Mintz, J. (1999). Backward maskingperformance in remitted, unmedicated schizophrenia: suggestive evidence for aberrantcortical oscillations. Am J Psychiatry 156, 1367–73.
Green, M.F., Kern, R.S., Braff, D.L., and Mintz, J. (2000). Neurocognitive deficits and func-tional outcome in Schizophrenia: are we measuring the ‘right stuff ’? Schizophren Bull26, 119–36.
Green, M.F., Mintz, J., Salveson, D., et al. (2003a). Visual masking as a probe for abnormalgamma range activity in schizophrenia. Biol Psychiatry 53, 1113–19.
Green, M.F., Nuechterlein, K.H., Breitmeyer, B., Tsuang, J., and Mintz, J. (2003b). Forwardand backward visual masking in schizophrenia: influence of age. Psychol Med 33, 887–95.
Green, M.F., Glahn, D., Engel, S.A., et al. (2005a). Regional brain activity associated withvisual backward masking. J Cogn Neurosci 17, 13–23.
Green, M.F., Nuechterlein, K.H., Breitmeyer, B., and Mintz, J. (in press) Forward and back-ward masking in unaffected siblings of schizophrenia pateints. Biol Psychiatry.
Greenspoon, T.S. and Eriksen, C.W. (1968). Interocular non-independence. PerceptPsychophys 3, 93–6.
Gross, C.G., Rocha-Miranda, C.E., and Bender, D.B. (1972). Visual properties of neuronsin inferotemporal cortex of the macaque. J Neurophysiol 35, 96–111.
Grossberg, S. (1970). Neural pattern discrimination. J Theor Biol 27, 291–337.
Grossberg, S. (1972). Neural expectation: cerebellar and retinal analogs of cells fired bylearnable or unlearned pattern classes. Kybernetik 10, 49–57.
Grossberg, S. (1987). Cortical dynamics of three-dimensional form, color, and brightnessperception. I: Monocular theory. Percept Psychophys, 41, 87–116.
Grossberg, S. (1988). Nonlinear neural networks: principles, mechanisms, andarchitectures. Neural Netw 1, 17–61.
Grossberg, S. (1991). Why do parallel cortical systems exist for the perception of staticform and moving form? Percept Psychophys 49, 117–41.
Grossberg, S. (1994). 3-D vision and figure–ground separation by visual cortex. PerceptPsychophys 55, 48–120.
Grossberg, S. and Mingolla, E. (1985a). Neural dynamics of perceptual grouping: textures,boundaries, and emergent segmentations. Percept Psychophys 38, 141–71.
REFERENCES 327
Grossberg, S. and Mingolla, E. (1985b). Neural dynamics of form perception: boundarycompletion, illusory figures, and neon color spreading. Psychol Rev 92, 173–211.
Grossberg, S. and Todorovic, D. (1988). Neural dynamics of 1-D and 2-D brightnessperception: a unified model of classical and recent phenomena. Percept Psychophys43, 241–77.
Gross-Glenn, K., Skottun, B.C., Glenn, W., et al. (1995). Contrast sensitivity in dyslexia.Vis Neurosci 12, 153–63.
Growney, R. (1976). The function of contour in metacontrast. Vision Res 16, 253–61.
Growney, R. and Weisstein, N. (1972). Spatial characteristics of metacontrast. J Opt SocAm 62, 690–6.
Growney, R., Weisstein, N., and Cox, S. I. (1977). Metacontrast as a function of spatialseparation with narrow line targets and masks. Vision Res 17, 1205–10.
Haber, R N. (1969). Repetition, visual persistence, visual noise and information processing.In Information Processing in the Nervous System (ed D.N. Leibovic). New York:Springer, pp. 121–40.
Haber, R.N. (1985). The impending demise of the icon: a critique of the concept of iconicstorage in visual information processing. Behav Brain Sci 6, 1–54.
Haber, R.N. and Nathanson, L.S. (1968). Post-retinal storage? Some further observationson Park’s camel as seen through the eye of a needle. Percept Psychophys 3, 349–55.
Haber, R.N. and Standing, L. (1970). Direct estimates of the apparent duration of a flash.Can J Psychol 24, 216–29.
Hallett, P.E. (1969). Rod increment thresholds on steady and flashed backgrounds. JPhysiol 202, 344–77.
Hammett, S.T. (1997). Motion blur and motion sharpening in the human visual system,Vision Res 37, 2505–10.
Hammond, P. (1971). Chromatic sensitivity and spatial organization of cat visual corticalcells: cone–rod interaction. J Physiol 213, 475–94.
Hammond, P. (1972). Chromatic sensitivity and spatial organization of LGN neuronreceptive fields in cat: cone–rod interaction. J Physiol 225, 391–413.
Han, S. and Humphreys, G.W. (1999). Interactions between perceptual organization based ongestalt laws and those based on hierarchical processing. Percept Pssychophys 61, 1287–98.
Handy, T.C., Kingstone, A., and Mangun, G.R. (1996). Spatial distribution of visual attention:perceptual sensitivity and response latency. Percept Psychophys 58, 613–27.
Harris, M.G. (1980). Velocity specificity of the flicker to pattern sensitivity ratio in humanvision. Vision Res 20, 687–91.
Harrison, K. and Fox, R. (1966). Replication of reaction time to stimuli masked by metacontrast. J Exp Psychol 71, 162–3.
Hartmann, E., Lachenmayr, B., and Brettel, H. (1979). The peripheral critical flicker frequency. Vision Res 19, 1019–23.
Hartveit, E., Ramberg, S.I., and Heggelund, P. (1993). Brainstem modulation of spatialreceptive field properties of single cells in the dorsal lateral geniculate nucleus of thecat. J Neurophysiol 70, 1644–55.
Hartwell, R.C. and Cowan, J.D. (1993). Evoked potentials and simple motor reaction timesto localized visual patterns. Vision Res 33, 1325–37.
REFERENCES328
Harwerth, R.S. and Levi, D.M. (1978). Reaction time as a measure of suprathresholdgrating detection. Vision Res 18, 1579–86.
Harwerth, R.S., Boltz, R.L., and Smith, E.L. (1980). Psychophysical evidence for sustainedand transient channels in the monkey visual system. Vision Res 20, 15–22.
Hassler, R. (1978). Interaction of reticular activating system for vigilance and thetruncothalamic and pallidal systems for directing awareness and attention understriatal control. In Cerebral Correlates of Conscious Experience (ed P.A. Buser andA. Rougeul-Buser). Amsterdam: North-Holland, pp. 111–29.
Havig, P.R., Breitmeyer, B.G., and Brown, V.R. (1998). The effects of pre-cueing attentionon metacontrast masking. Presented at the Annual Meeting of the Association forResearch in Vision and Ophthalmology, Fort Lauderdale, FL, May 1998.
Haynes, J.D., Driver, J., and Rees, G. (2005). Visibility reflects dynamic changes of effectiveconnectivity between V1 and fusiform cortex. Neuron 46, 811–821.
Hearty, P.J. and Mewhort, D.J.K. (1975). Spatial localization in sequential letter displays.Can J Psychol 29, 348–59.
Heckenmueller, E.G. and Dember, W.N. (1965). Paradoxical brightening of a masked blackdisk. Psychon Sci 3, 457–8.
Heinemann, E.G. (1955). Simultaneous brightness induction as a function of inducingand test-field luminances. J Exp Psychol 50, 89–96.
Hellige, J.B., Walsh, D.A., Lawrence, V.S., and Cox, P.J. (1977). The importance of figuralrelationships between target and mask. Percept Psychophys 21, 285–6.
Hellige, J.B., Walsh, D.A., Lawrence, V.S., and Prasse, M. (1979). Figural relationship effects and mechanisms of visual masking. J Exp Psychol Hum Percept Perform 5,88–100.
Helmholtz, H. von (1866). Handbuch der Physiologischen Optik (1st edn). Leipzig: Voss(trans. J.P.C. Southall (1962). Handbook of Physiological Optics (3rd edn). New York:Dover Publications).
Hempel, C.G. (1966). Explanantions in science and history. In Philosophical Analysis andHistory (ed W.H. Dray). New York: Harper and Row, pp. 95–126.
Hendry, S.H. and Reid, R.C. (2000). The koniocellular pathway in primate vision., Ann RevNeurosci 23, 127–53.
Hering, E. (1872). Zuhr Lehre vom Lichtsinn. Über successive Lichtinduction. WienerSitzungsber Math-Naturwiss Cl Kaiserlichen Akad Wiss 66 (Part 3), 5–24.
Hering, E. (1878). Zuhr Lehre vom Lichtsinn. Vienna: Carl Gerold’s Sohn.
Hermann, L. (1870). Eine Erscheining simultanen Kontrastes. Pflugers Arch GesamtePhysiol 3, 13–15.
Hernandez, L.L. and Lefton, L.A. (1977). Metacontrast as measured under signal detectionmodel. Perception 6, 696–702.
Herrick, R.M. (1974). Foveal light-detection thresholds with two temporally placed flashes:a review. Percept Psychophys 15, 361–7.
Herzog, M.H. and Fahle, M. (2002). Effects of grouping on contextual modulation. Nature415, 433–6.
Herzog, M.H. and Koch, C. (2001). Seeing properties of an invisible object: feature inheritance and shine through. Proc Natl Acad Sci USA 98, 4271–5.
REFERENCES 329
Herzog, M.H., Fahle, M., and Koch, C. (2001a). Spatial aspects of object formationrevealed by a new illusion, shine-through. Vision Res 41, 2325–35.
Herzog, M.H., Koch, C., and Fahle, M. (2001b). Shine-through: temporal aspects. VisionRes 41, 2337–46.
Herzog, M.H., Schmonsees, U., and Fahle, M. (2003a). Timing of contextual modulationin the shine-through effect. Vision Res 43, 2039–51.
Herzog, M.H., Schmonsees, U., and Fahle, M. (2003b). Collinear contextual suppression.Vision Res 43, 2915–25.
Herzog, M.H., Harms, M., Ernst, U.A., Eurich, C.W., Mahmud, S.H., and Fahle, M. (2003c).Extending the shine-through to classical masking paradigms. Vision Res 43, 2659–67.
Herzog, M.H., Parish, L., Koch, C., and Fahle, M. (2003d). Fusion of competing features isnot serial. Vision Res 43, 1331–60.
Herzog, M.H., Kopmann, S., and Brand, A. (2004). Intact figure–ground segmentation inschizophrenia. Psychiatry Res 129, 55–63.
Hicks, T.P., Lee, B.B., and Vidyasagar, T.R. (1983). The responses of cells in macaquelateral geniculate nucleus to sinusoidal gratings. J Physiol 337, 183–200.
Hochberg, J. (1968). In the mind’s eye. In Contemporary Theory and Research in VisualPerception (ed R.N. Haber). New York: Holt, Rhinehart and Winston, pp. 309–31.
Hochberg, J. (1978). Perception. Englewood Cliffs, NJ: Prentice-Hall.
Hofer, D., Walder, F., and Groner, M. (1989). Metakontrast: ein berühmtes, aber schwermessbares Phänomen. Schweiz Zeitschr Psychol 48, 219–32.
Hoffmann, K.-P. (1973). Conduction velocity in pathways from retina to superior colliculusin the cat: a correlation with receptive-field properties. J Neurophysiol 36, 409–24.
Hoffman, R.E., Buchsbaum, M.S., Jensen, R.V., Guich, S.M., Tsai, K., and Nuechterlein,K.H. (1996). Dimensional complexity of EEG waveforms in neuroleptic-freeschizophrenic patients and normal control subjects. J Neuropsychiatry 8, 436–41.
Hofstoetter, C., Koch, C., and Kiper, D.C. (2004). Motion-induced blindness does notaffect the formation of negative afterimages. Conscious Cogn 13, 691–708.
Hogben, J.H. and Di Lollo, V. (1984). Practice reduces suppression in metacontrast andapparent motion. Percept Psychophys 35, 441–5.
Hogben, J.H. and Di Lollo, V. (1985). Suppression of visible persistence in apparentmotion. Percept Psychophys 38, 450–60.
Holender, D. (1986). Semantic activation without conscious identification in dichoticlistening, parafoveal vision, and visual masking: a survey and appraisal. Behav BrainSci 9, 1–66.
Holland, H.C. (1963). ‘Visual masking’ and the effects of stimulant and depressant drugs. In Experiments with Drugs (ed H.J. Eysenck). Oxford: Pergamon Press,pp. 69–106.
Homa, D., Haver, B., and Schwartz, T. (1976). Perceptibility of schematic faces: evidencefor a perceptual gestalt. Mem Cognit 4, 176–85.
Hood, D.C. (1973). The effects of edge sharpness and exposure duration on detectionthreshold. Vision Res 13, 759–66.
Houlihan, K. and Sekuler, R.W. (1968). Contour interactions in visual masking. J ExpPsychol 77, 281–5.
REFERENCES330
Hubel, D.H. (1988). Eye, Brain, and Vision. New York: W.H. Freeman and Co.
Hubel, D.H. and Wiesel, T.N. (1962). Receptive fields, binocular interaction and functionalarchitecture in the cat’s visual cortex. J Physiol 160, 106–54.
Hubel, D.H. and Wiesel, T.N. (1965). Binocular interaction in striate cortex of kittensreared with artificial squint. J Neurophysiol 28, 1041–59.
Hubel, D.H. and Wiesel, T.N. (1968). Receptive fields and functional architecture ofmonkey striate cortex. J Physiol 195, 215–43.
Hubel, D.H. and Wiesel, T.N. (1977). Ferrier lecture. Functional architecture of macaquemonkey visual cortex. Proc R Soc Lond B Biol Sci 198, 1–59.
Hummel, J.E. and Biederman, I. (1992). Dynamic binding in a neural network for shaperecognition. Psychol Rev 99, 480–517.
Hupé, J.-M., James, A.C., Payne, B.R., Lomber, S.G., Girard, P., and Bullier, J. (1998).Cortical feedback improves discrimination between figure and background by V1, V2and V3 neurons. Nature 394, 784–7.
Hupé, J.-M., James, A.C., Girard, P., and Bullier, J. (2000). Response modulation by statictexture surround in area V1 of the macaque monkey does not depend on feedbackconnections from V2. J Neurophysiol 85, 146–63.
Iani, C., Nicoletti, R., Rubichi, S., and Umilta, C. (2001). Shifting attention betweenobjects. Brain Res Cogn Brain Res 11, 157–64.
Ikeda, H. and Wright, M.J. (1972). Differential effects of refractive error and receptive fieldorganization on central and peripheral ganglion cells. Vision Res 12, 1465–72.
Ikeda, H. and Wright, M.J. (1975). Spatial and temporal properties of ‘sustained’ and‘transient’ neurones in area 17 of the cat’s visual cortex. Exp Brain Res 22, 363–83.
Ikeda, M. (1965). Temporal summation of positive and negative flashes in the visualsystem. J Opt Soc Am 55, 1527–34.
Imanaka, K., Kita, I., and Suzuki, K. (2002). Effects of nonconscious perception on motorresponse. Hum Mov Sci 21, 541–61.
Irwin, D. (1996). Integrating information across saccadic eye movements. Curr Dir PsycholSci 5, 94–100.
Isaak, M.I., Shapiro, K.L., and Martin, J. (1999). The attentional blink reflects retrievalcompetition among multiple rapid serial visual presentation items: tests of aninterference model. J Exp Psychol Hum Percept Perform 25, 1774–92.
James, W. (1950). Principles of Psychology, Vol. 1. New York: Dover Publications.
Jaskowski, P., Skalska, B., and Verleger, R. (2003). How the self controls its ‘automaticpilot’ when processing subliminal information. J Cogn Neurosci 15, 911–20.
Jaskowski, P., van der Lubbe, R.H.J., Schlotterbeck, E., and Verleger, R. (2002). Traces lefton visual selective attention by stimuli that are not consciously identified. Psychol Sci13, 48–54.
Jeffreys, D.A. and Axford, J.G. (1972a). Source locations of pattern specific components ofhuman visual evoked potentials. I. Components of striate cortical origin. Exp Brain Res16, 1–21.
Jeffreys, D.A. and Axford, J.G. (1972b). Source locations of pattern specific components ofhuman visual evoked potentials. II. Components of extrastriate cortical origin. ExpBrain Res 16, 22–40.
REFERENCES 331
Jeffreys, D.A. and Musselwhite, M.J. (1986). A visual evoked potential study of metacontrastmasking. Vision Res 26, 631–42.
Johnston, J.C. and McClelland, J.L. (1974). Perception of letters in words: Seek not and yeshall find. Science 184, 1192–3.
Jones, R. and Keck, M.J. (1978). Visual evoked response as a function of grating spatialfrequency. Invest Ophthalmol Vis Sci 17, 652–9.
Joseph, J.S., Chun, M.M., and Nakayama, K. (1997). Attentional requirements in a‘preattentive’ search task. Nature 387, 805–7.
Juola, J.F. and Breitmeyer, B.G. (1988). A discussion of models of motion perception. InWorking Models of Human Perception (ed H. Bouma, B.A.G. Elsendorn, D.G. Bowhuis,S.G. Nooteboom, and J.A.J. Roufs). New York: Academic Press, pp. 251–9.
Kaas, J.H. (1986). The structural basis for information processing in the primate visualsystem. In Visual Neuroscience (ed J.D. Pettigrew, K.J. Sanderson, and W.R. Levick).Cambridge: Cambridge University Press, pp. 315–40.
Kahan, T.A. and Mathis, K.M. (2002). Gestalt grouping and common onset masking.Percept Psychophys 64, 1248–59.
Kahneman, D. (1964). Temporal summation in an acuity task at different energy levels—astudy of the determinants of summation. Vision Res 4, 557–66.
Kahneman, D. (1967). An onset–onset law for one case of apparent motion and metacontrast.Percept Psychophys 2, 577–84.
Kahneman, D. (1968). Method, findings, and theory in studies of visual masking. PsycholBull 70, 404–25.
Kaitz, M., Monitz, J., and Nesher, R. (1985). Electrophysiological correlates of visual masking.Int J Neurosci 28, 261–8.
Kammer, T., Scharnowski, F. and Herzog, M.H. (2003). Combining backward masking andtranscranial magnetic stimulation in human observers. Neurosci Let 343, 171–4.
Kanai, R. and Kamitani, Y. (2003). Time-locked perceptual fading induced by visual transients. J Cogn Neurosci 15, 664–72.
Kao, K.C. and Dember, W.N. (1973). Effect of size of ring on backward masking of a diskby a ring. Bull Psychon Soc 2, 15–17.
Kapadia, M.K., Ito, M., Gilbert, C.D., and Westheimer, G. (1995). Improvement in visualsensitivity by changes in local contrast: parallel studies in human observers and in V1of alert monkey. Neuron 15, 843–56.
Kaplan, E. and Shapley, R.M. (1986). The primate retina contains two types of ganglioncells, with high and low contrast sensitivity. Proc Natl Acad Sci USA 83, 2755–7.
Kaplan, E., Barlow, R.B., Renninger, G., and Purpura, K. (1990). Circadian rhythms inLimulus photoreceptors. II. Quantum bumps. J Gen Physiol 96, 665–85.
Keil, A., Müller, M.M., Ray, W.J., Gruber, T., and Elbert, T. (1999). Human gamma bandactivity and perception of a gestalt. J Neurosci 19, 7152–61.
Kelly, D.H. (1961). Flicker fusion and harmonic analysis. J Opt Soc Am 51, 917–18.
Kelly, D.H. (1971a). Theory of flicker and transient responses. I. Uniform fields. J Opt SocAm 61, 537–46.
Kelly, D.H. (1971b). Theory of flicker and transient responses. II. Counterphase gratings.J Opt Soc Am 61, 632–40.
REFERENCES332
Kelly, D.H. (1972). Adaptation effects on spatio-temporal sine-wave thresholds. Vision Res12, 89–101.
Kelly, D.H. (1973). Lateral inhibition in human colour mechanisms. J Physiol 228, 55–72.
Kentridge, R.W., Heywood, C.A., and Weiskrantz, L. (1997). Residual vision in multiple retinallocations within a scotoma: Implications for blindsight. J Cogn Neurosci 9, 191–202.
Kentridge, R.W., Heywood, C.A., and Weiskrantz, L. (1999). Attention without awarenessin blindsight. Proc R Soc Lond B Biol Sci 266, 1805–11.
Kerr, J.L. (1971). Visual resolution in the periphery. Percept Psychophys 9, 375–8.
Kihlstrom, J.F. (1987). The cognitive unconscious. Science 237, 1145–52.
Kihlstrom, J.F. (1996). Perception without awareness of what is perceived, learningwithout awareness of what is learned. In The Science of Consciousness (ed V. Velman).London: Routledge, pp. 23–46.
Kim, H. and Francis, G. (1998). A computational and perceptual account of motion lines.Perception 27, 785–97.
King, D.L., Hicks, H., and Brown, P.D. (1993). Context-produced increase in visibility.Psychol Res 55, 10–14.
King, D.L., Mose, H.F., and Nixon, N.S. (1995). One line decreases the visibility of asimultaneous identical distant second line. Percept Psychophys 57, 393–401.
King-Smith, P.E. and Kulikowski, J.J. (1973). Line, edge and grating detectors in humanvision. J Physiol 230, 23–5.
King-Smith, P.E. and Kulikowski, J.J. (1975). Pattern and flicker detection analysed bysubthreshold summation. J Physiol 249, 519–48.
King-Smith, P.E., More, R.K., and Riggs, L.A. (1976). A new approach to the frequencyresponse of human vision. J Physiol 257, 36–7.
Kinoshita, S. and Lupker, S.J. (2003). Masked Priming. New York: Psychology Press.
Kinsbourne, M. and Warrington, E.K. (1962a). The effect of an aftercoming randompattern on the perception of brief visual stimuli. Q J Exp Psychol 14, 223–34.
Kinsbourne, M. and Warrington, E.K. (1962b). Further studies of visual masking of briefvisual stimuli by a random pattern. Q J Exp Psychol 14, 235–45.
Kiorpes, L. and McKee, S.P. (1999). Neural mechanisms underlying amblyopia. Curr OpinNeurobiol 9, 480–6.
Kirschfeld, K. and Kammer, T. (1999). The Fröhlich effect: a consequence of the interaction of visual focal attention and metacontrast. Vision Res 39, 3702–9.
Kirschfeld, K. and Kammer, T. (2000). Visual attention and metacontrast modify latency toperception in opposite directions. Vision Res 40, 1027–33.
Klinger, M.R., and Greenwald, A.G. (1995). Unconscious priming of association judgments. J Exp Psychol Learn Mem Cogn 21, 569–81.
Klotz, W. and Neumann, O. (1999). Motor activation without conscious discrimination inmetaconttrast masking. J Exp Psychol Hum Percept Perform 25, 976–92.
Klotz, W. and Wolff, P. (1995). The effect of a masked stimulus on the response to themasking stimulus. Psychol Res 58, 92–101.
Kobatake, E. and Tanaka, K. (1994). Neuronal selectivities to complex object features inthe ventral visual pathway of the macaque cerebral cortex. J Neurophysiol 71, 856–67.
REFERENCES 333
Koch, C. (2004). The Quest for Consciousness. Englewood, CO: Roberts & Co.
Koch, C. and Crick, F. (2001). The zombie within. Nature 411, 893.
Koch, C. and Segev, I. (1998). Methods in Neuronal Modeling (2nd Ed.). Cambridge, MA:MIT Press.
Kolers, P. (1962). Intensity and contour effects in visual masking. Vision Res 2, 277–94.
Kolers, P. (1963). Some differences between real and apparent visual movement. Vision Res3, 191–206.
Kolers, P. (1972). Aspects of Motion Perception. Oxford: Pergamon Press.
Kolers, P. and Rosner, B.S. (1960). On visual masking (metacontrast): dichoptic observations. Am J Psychol 73, 2–21.
Kolers, P. and von Grünau, M.W. (1976). Shape and color in apparent motion. Vision Res16, 329–35.
Kolers, P. and von Grünau, M.W. (1977). Fixation and attention in apparent motion.Q J Exp Psychol 29, 389–95.
Kondo, H. and Komatsu, H. (2000). Suppression of neuronal responses by a metacontrastmasking stimulus in monkey v4. Neurosci Res 36, 27–33.
Korte, A. (1915). Kinematoskopische Untersuchungen. Zeitschr Psychol 72, 194–296.
Kovács, G., Vogels, R., and Orban, G.A. (1995). Cortical correlate of pattern backwardmasking. Proc Natl Acad Sci USA 92, 5587–91.
Kovács, I., Papathomas, T.V., Yang, M., and Feher, A. (1996). When the brain changes its mind:interocular grouping during binocular rivalry. Proc Natl Acad Sci USA 93, 15508–11.
Kreiman, G., Fried, I., and Koch, C. (2005). Response of single neurons in the humanbrain during flash suppression. In Binocular Rivalry (ed D. Alais and R. Blake).Cambridge, MA: MIT Press, pp. 213–30.
Kremers, J., Weiss, S., and Zrenner, E. (1997). Temporal properties of marmoset lateralgeniculate cells. Vision Res 37, 2649–60.
Krüger, J. (1979). Responses to wavelength contrast in the afferent visual systems of the catand rhesus monkey. Vision Res 19, 1351–8.
Kubová, Z., Kuba, M., Peregrin, J., and Nováková, V. (1996). Visual evoked potentialevidence for magnocellular system deficit in dyslexia. Physiol Res 45 87–9.
Kuhn, T.S. (1957a). The Copernican Revolution. Cambridge, MA: Harvard University Press.
Kuhn, T.S. (1957b). The Structure of Scientific Revolution. Chicago, IL: University ofChicago Press.
Kuhn, T.S. (1962). Historical structure of scientific discovery. Science 136, 760–4.
Kulikowski, J.J. (1974). Human averaged occipital potentials evoked by pattern and movement. J Physiol 242, 70–1.
Kulikowski, J.J. (1975). Apparent fineness of briefly presented gratings: balance betweenmovement and pattern channels. Vision Res 15, 673–80.
Kulikowski, J.J. (1977). Visual evoked potentials as a measure of visibility. In Visual EvokedPotentials in Man: New Developments (ed J.E. Desmedt). Oxford: Clarendon Press,pp. 168–83.
Kulikowski, J.J. and Tolhurst, D.J. (1973). Psychophysical evidence for sustained andtransient detectors in human vision. J Physiol 232, 149–62.
REFERENCES334
Kunkel, A. (1874). Über die Abhängigkeit der Farbempfinding von der Zeit. Pflugers ArchGesamte Physiol 135, 197–200.
Kurylo, D.D. (1997). Time course of perceptual grouping. Percept Psychophys 59, 142–7.
LaBerge, D. (1995). Attentional Processing: The Brain’s Art of Mindfulness. Cambridge, MA:Harvard University Press.
LaBerge, D. and Brown, V. (1989). Theory of attentional operations in shape identification.Psychol Rev 96, 101–24.
Lachter, J. and Durgin, F.H. (1999). Metacontrast masking functions: a question of speed?J Exp Psychol Hum Percept Perform 25, 1–12.
Lamme, V.A.F. (1995). The neurophysiology of figure–ground segregation in primaryvisual cortex. J Neurosci 15, 1605–15.
Lamme, V.A.F. (2000). Neural mechanisms of visual awareness: a linking hypothesis. BrainMind 1, 385–406.
Lamme, V.A.F. (2003). Why visual attention and awareness are different. Trends Cogn Sci7, 12–18.
Lamme, V.A.F. and Spekreijse, H. (2000). Modulations of primary visual cortex activityrepresenting attentive and conscious scene perception. Front Biosci 5, 232–43.
Lamme, V.A., Rodriguez-Rodriguez, V., and Spekreijse, H. (1999). Separate processingdynamics for texture elements, boundaries and surfaces in primary visual cortex ofthe macaque monkey. Cereb Cortex 9, 406–13.
Lamme, V.A.F., Super, H., Landman, R., Roelfsema, P.R., and Spekreijse, H. (2000). Therole of primary visual cortex (V1) in visual awareness. Vision Res 40, 1507–21.
Lamme, V.A.F., Zipser, K., and Spekreijse, H. (2002). Masking interrupts figure–groundsignals in V1. J Cogn Neurosci 14, 1044–53.
Lamy, D. and Egeth, H. (2002). Object-based selection: the role of attentional shifts.Percept Psychophys 64, 52–66.
Landahl, H.D. (1961). A note on mathematical models for the interaction of neuralelements. Bull Math Biophys 23, 91–7.
Landahl, H.D. (1967). A neural net model for masking phenomena. Bull Math Biophys 29,227–32.
Lanze, M., Maguire, W., and Weisstein, N. (1985). Emergent features: a new factor in theobject-superiority effect? Percept Psychophys 38, 438–42.
Latch, M. and Lennie, P. (1977). Rod–cone interaction in light adaptation. J Physiol269, 517–34.
Lee, B.B., Martin, P.R., and Valberg, A. (1988). The physiological basis of heterochromaticflicker photometry demonstrated in the ganglion cells of the macaque retina. J Physiol404, 323–47.
Lee, B.B., Martin, P.R., and Valberg, A. (1989a). Amplitude and phase of responses ofmacaque retinal ganglion cells to flickering stimuli. J Physiol 414, 245–63.
Lee, B.B., Martin, P.R., and Valberg, A. (1989b). Nonlinear summation of M- and L-coneinputs to phasic retinal ganglion cells of the macaque. J Neurosci 9, 1433–42.
Lee, B.B., Pokorny, J., Smith, V.C., Martin, P.R., and Valberg, A. (1990). Luminance andchromatic modulation sensitivity of macaque ganglion cells and human observers.J Opt Soc Am A 7, 2223–6.
REFERENCES 335
Lee, B.B., Pokorny, J., Smith, V.C., and Kremers, J. (1994). Responses to pulses andsinusoids in macaque ganglion cells. Vision Res 34, 3081–96.
Lee, D.N. (1976). A theory of visual control of braking based on information about time-to-collision. Perception 5, 437–59.
Lee, D.N. (1980). The optic flow field: the foundation of vision. Philos Trans R Soc Lond BBiol Sci 290, 169–79.
Lee, S.H. and Blake, R. (2002). V1 activity is reduced during binocular rivalry. J Vis 2, 618–26.
Lee, S.H. and Blake, R. (2004). A fresh look at interocular grouping during binocularrivalry. Vision Res 44, 983–91.
Lee, T., Mumford, D., and Schiller, P. (1995). Neuronal correlates of boundary and medialaxis representations in primate visual cortex. J Invest Ophthalmol Vis Sci 36, 477.
Lefton, L.A. (1970). Metacontrast: Further evidence for monotonic fucntions. PsychonomSci 21, 85–7.
Lefton, L.A. (1973). Metacontrast: a review. Percept Psychophys 13, 161–71.
Lefton, L.A. and Griffin, J.R. (1976). Metacontrast with internal contours: more evidencefor monotonic functions. Bull Psychon Soc 7, 29–32.
Lefton, L.A. and Newman, Y. (1976). Metacontrast and paracontrast: both photopic andscotopic luminance levels yield monotones. Bull Psychon Soc 8, 435–8.
Legge, G. (1978). Sustained and transient mechanisms in human vision: temporal andspatial properties. Vision Res 18, 341–76.
Lehmkuhle, S. and Fox, R. (1980). Effect of depth separation on metacontrast masking.J Exp Psychol Hum Percept Perform 6, 605–21.
Lehmkuhle, S., Kratz, K.E., Mangel, S.C., and Sherman, S.M. (1980). Spatial and temporalsensitivity of X- and Y-cells in dorsal lateral geniculate nucleus of the cat. JNeurophysiol 43, 520–41.
Lehmkuhle, S., Garzia, R.P., Turner, L., Hash, T., and Baro, J.A. (1993). A defective visualpathway in children with reading disability. N Engl J Med 328, 989–96.
Leopold, D.A. and Logothetis, N.K. (1996). Activity changes in early visual cortex reflectmonkey’s percept during binocular rivalry. Nature 379, 549–52.
Leuthold, H. and Kopp, B. (1998). Mechanisms of priming by masked stimuli: inferencesfrom event-related brain potentials. Psychol Sci 9, 263–9.
Leventhal, A.G. and Hirsch, H.V. (1978). Receptive-field properties of neurons in differentlaminae of visual cortex of the cat. J Neurophysiol 41, 948–62.
Levi, D.M. (1994). Pathophysiology of binocular vision and amblyopia. Curr OpinOphthalmol 5, 3–10.
Levi, D.M. and Harwerth, R.S. (1980). Contrast sensitivity in amblyopia due to stimulusdeprivation. Br J Ophthalmol 64, 15–20.
Levi, D.M., Harwerth, R.S., and Manny, R. (1979). Suprathreshold spatial frequencydetection and binocular interaction in strabismic and anisometropic amblyopia.Invest Ophthalmol Vis Sci 18, 714–25.
Levine, R., Didner, R., and Tobenkin, N. (1967). Backward masking as a function ofinterstimulus distance. Psychon Sci 9, 185–6.
Li, W. and Gilbert, C.D. (2002). Global contour saliency and local collinear interactions.J Neurophysiol 88, 2846–56.
REFERENCES336
Libet, B. (1996). Neural processes in the production of conscious experience. In TheScience of Consciousness (ed V. Velman). London: Routledge, pp. 97–117.
Lie, I. (1980). Visual detection and resolution as a function of retinal locus. Vision Res 20,967–74.
Lindsey, D.B., Fehmi, L.G., and Adkins, J.W. (1967). Visually evoked potentials duringperceptual masking in man and monkey. Electroencephalogr Clin Neurophysiol 23, 79.
Lipkin, B.S. (1962). Monocular flicker discrimination as a function of the luminance andarea of contralateral steady light. I: Luminance. J Opt Soc Am 52, 1287–1300.
Livingstone, M.S. and Hubel, D.H. (1984). Anatomy and physiology of a color sytem inthe primate visual cortex. J Neurosci 4, 309–56.
Livingstone, M.S. and Hubel, D.H. (1987). Psychophysical evidence for separate channelsfor the perception of form color, movement, and depth. J Neurosci 7, 3416–68.
Livingstone, M. and Hubel, D. (1988). Segregation of form, color, movement, and depth:Anatomy, physiology, and perception. Science 240, 740–9.
Livingstone, M.S., Rosen, G.D., Drislane, F.W., and Galaburda, A.M. (1991). Physiologicaland anatomical evidence for a magnocellular defect in developmental dyslexia. ProcNatl Acad Sci USA 88, 7943–7.
Lleras, A. and Moore, C.M. (2003). When the target becomes the mask: using apparentmotion to isolate the object-level component of object substitution masking. J ExpPsychol Hum Percept Perform 29, 106–20.
Loffler, G., Gordon, G.E., Wilkinson, F., Goren, D., and Wilson, H.R. (2005).Configurational masking of faces: Evidence for high-level interactions in face percep-tion. Vision Res 45, 2287–97.
Logothetis, N.K. and Schall, J.D. (1989). Neuronal correlates of subjective visualperception. Science 245, 761–3.
Löhmann, W. (1906). Über Helladaptation. Zeitschr Sinnesphysiol 41, 290–311.
Long, G. (1980). Iconic memory: a review and critique of the study of short-term visualstorage. Psychol Bull 88, 785–820.
Long, G.M. and Gildea, T.J. (1981). Latency for the perceived offset of brief target gratings.Vision Res 21, 1395–9.
Lotze, H. (1852). Medicinische Psychologie oder Physiologie der Seele. Leipzig:Weidmann.
Lovegrove, W. (1993). Weakness in the transient visual system: a causal factor in dyslexia?Ann NY Acad Sci 682, 57–69.
Lovegrove, W.J. and Williams, M.C. (1993). Visual temporal processing deficits in specificreading disability. In Visual Processes in Reading and Reading Disabilities (ed D.M.Willows, R.S. Kruk, and E. Corcos). Hillsdale, NJ: Erlbaum, pp. 311–29.
Lovegrove, W.J., Martin, F., and Slaghuis, W. (1986). A theoretical and experimental casefor visual deficit in specific reading disability. Cogn Neuropsychol 3, 225–67.
Lubimov, V. and Logvinenko, A. (1993). Motion blur revisited. Perception 22 (Suppl): 77.
Lupp, U., Hauske, G., and Wolf, W. (1976). Perceptual latencies to sinusoidal gratings.Vision Res 16, 969–72.
Lupp, U., Hauske, G., and Wolf, W. (1978). Different systems for the visual detection ofhigh and low spatial frequencies. Photogr Sci Eng 22, 80–4.
REFERENCES 337
Lyon, J.E., Matteson, H.H., and Marx, M.S. (1981). Metacontrast in the fovea. Vision Res21, 297–9.
McAdams, C.J. and Maunsell, J.H.R. (1999). Effects of attention on orientation-tuningfunctions of single neurons in macaque cortical area V4. J Neurosci 19, 431–41.
McClelland, J.L. (1978). Perception and masking of wholes and parts. J Exp Psychol HumPercept Perform 4, 210–23.
McCloskey, M. and Watkins, M.J. (1978). The seeing-more-than-is-there phenomenon:implications for the locus of iconic storage. J Exp Psychol Hum Percept Perform 4,553–64.
McCormick, P.A. (1997). Orienting attention without awareness. J Exp Psychol HumPercept Perform 23, 168–80.
McDougall, W. (1904a). The sensations excited by a single momentary stimulation of theeye. Br J Psychol 1, 78–113.
McDougall, W. (1904b). The variations of the intensity of visual sensation with theduration of the stimulus. Br J Psychol 1, 151–89.
McFadden, D. and Gummerman, K. (1973). Monoptic and dichoptic metacontrast acrossthe vertical meridian. Vision Res 13, 185–96.
McIlwain, J.T. and Lufkin, R.B. (1976). Distribution of direct Y-cell inputs to the cat’ssuperior colliculus: are there spatial gradients? Brain Res 103, 133–8.
McKee, S.P. and Westheimer, G. (1970). Specificity of cone mechanisms in lateral interaction. J Physiol 206, 117–28.
McKee, S.P., Bravo, M.J., Taylor, D.G., and Legge, G.E. (1994a). Stereo matching precedesdichoptic masking. Vision Res 34, 1047–60.
McKee, S.P., Levi, D.M., and Movshon, J.A. (1994b). The pattern of visual deficits inamblyopia. J Vis 3, 380–405.
Mach, E. (1865). Über die Wirkung der räumlichen Vertheilung des Lichtreizes auf dieNetzhaut. Wiener Sitzungsber Math-Naturwiss Cl Kaiserlichen Akad Wiss 52, Part 2,303–22.
Mach, E. (1866a). Über den physiologischen Effekt räumlich verteilter Lichtreize (ZweiteAbhandlung). Wiener Sitzungsber Math-Naturwiss Cl Kaiserlichen Akad Wiss 54, Part 2,131–44.
Mach, E. (1866b). Über die physiologische Wirkung räumlich verteilter Lichtreize (Dritte Abhandlung). Wiener Sitzungsber Math-Naturwiss Cl Kaiserlichen Akad Wiss54, Part 2, 393–408.
Mach, E. (1868). Über die physiologische Wirkung räumlich verteilter Lichtreize (Vierte Abhandlung). Wiener Sitzungsber Math-Naturwiss Cl Kaiserlichen Akad Wiss57, Part 2, 11–1.
Mack, A. and Rock, I. (1998). Inattentional Blindness. Cambridge, MA: MIT Press.
Macknik, S.L. and Haglund, M.M. (1999). Optical images of visible and invisible perceptsin the primary visual cortex of primates. Proc Natl Acad Sci USA 96, 15208–10.
Macknik, S.L. and Livingstone, M.S. (1998). Neuronal correlates of visibility and invisibility in the primate visual system. Nat Neurosci 1, 144–9.
Maffei, L., Cervetto, L., and Fiorentini, A. (1970). Transfer characteristics of excitation andinhibition in cat retinal ganglion cells. J Neurophysiol 33, 276–84.
REFERENCES338
Maier, J., Dagnelie, G., Spekreijse, H., and van Dijk, B.W. (1987). Principal componentsanalysis for source localization of VEPs in man. Vision Res 27, 165–77.
Makous, W. and Peeples, D. (1979). Rod–cone interaction: rconciliation with Flamant andStiles. Vision Res 19, 695–8.
Manahilov, V. (1995). Spatiotemporal visual response to suprathreshold stimuli. Vision Res35, 227–37.
Marcel, A.J. (1983a). Conscious and unconscious perception: experiments on visualmasking and word recognition. Cogn Psychol 15, 197–237.
Marcel, A.J. (1983b). Conscious and unconscious perception: an approach to the relationbetween phenomenal experience and perceptual processes. Cogn Psychol 15, 238–300.
Markoff, J.I. and Sturr, J.F. (1971). Spatial and luminance determinants of the incrementthreshold under monoptic and dichoptic viewing. J Opt Soc Am 61, 1530–7.
Marr, D. (1982). Vision. San Francisco, CA: W.H. Freeman & Co.
Marr, D. and Ullman, S. (1981). Directional selectivity and its uses in early visiualprocessing. Proc R Soc Lond B Biol Sci 211, 151–80.
Marriott, F.H.C. (1962). Colour vision: the two-colour threshold technique of Stiles.In The Eye. Vol 2, The Visual Process (ed H. Davson). New York: Academic Press,pp. 251–72.
Marrocco, R.T., McClurkin, J.W., and Young, R.A. (1982). Spatial summation andconduction latency classification of cells of the lateral geniculate of macaques.J Neurosci 2, 1275–91.
Martin, K.A. and Marshall, J.A. (1993). Unsmearing visual motion: development oflong-range horizontal intrinsic connections. In Advances in Neural InformationProcessing Systems, Vol. 5 (ed S. Hanson, J. Cowan, and C. Giles). San Mateo, CA:Morgan Kaufmann.
Martin, K.A.C. (1992). Parallel pathways converge. Curr Biol 2, 555–7.
Martius, G. (1902). Über die Dauer der Lichtempfindungen. Beitr Psychol Physiol Leipzig 1,275–366.
Matin, E. (1974). Light adaptation and the dynamics of induced tilt. Vision Res 14, 255–65.
Matin, E. (1975). The two-transient (masking) paradigm. Psychol Rev 82, 451–61.
Matsumura, M. (1976). Visual masking by luminance increments and decrements: Effectsof rise time and decay time. Tohoku Psychol Folia 34, 95–102
Matteson, H.H. (1969). Effect of surround size and luminance on metacontrast. J Opt SocAm 59, 1461–8.
Matthews, M.L. (1971). Spatial and temporal factors in masking by edges and disks.Percept Psychophys 9, 15–22.
Mattson, A.J., Levin, H.S., and Breitmeyer, B.G. (1994). Visual information processingafter severe closed head injury: effects of forward and backward masking. J NeurolNeurosurg Psychiatry 57, 818–24.
Maunsell, J.H.R. and Gibson, J.R. (1992). Visual response latencies in striate cortex of themacaque monkey. J Neurophysiol 68, 1332–44.
Maunsell, J.H.R., Ghose, G.G., Assas, J.A., McAdams, C.J., Boudreau, C.E., and Noerager, B.D.(1999). Visual response latencies of magnocellular and parvocellular LGN neurons inmacaque monkeys. Vis Neurosci 16, 1–14.
REFERENCES 339
May, J.G., Grannis, S.W., and Porter, R.J., Jr (1980). The lag effect in dichoptic viewing.Brain Lang 11, 19–29.
May, J., Lovegrove, W., Martin, F., and Nelson, W. (1991). Pattern-elicited visual evokedpotentials in good and poor readers. Clin Vis Sci 6, 131–6.
May, J., Dunlap, W., and Lovegrove, W. (1992). Factor scores derived from visual evokedpotential latencies differentiate good and poor readers. Clin Vis Sci 7, 67–70.
May, J.G., Tsiappoutas, K.M., and Flanagan, M.B. (2003). Disappearance elicited bycontrast decrements. Percept Psychophys 65, 763–9.
Mayzner, M.S. and Tresselt, M.E. (1970). Visual information processing with sequentialinputs: a general model for sequential blanking, displacement, and overprintingphenomena. Ann NY Acad Sci 169, 599–618.
Merikle, P.M. (1980). Selective metacontrast. Can J Psychol 34, 196–9.
Merikle, P.M. (1992). Perception without awareness. Am Psychol 47, 792–5.
Merikle, P.M. and Joordens, S. (1997). Parallels between perception without attention andperception without awareness. Conscious Cogn 6, 219–36.
Merikle, P.M., Smilek, D., and Eastwood, J.D. (2001). Perception without awareness:perspectives from cognitive psychology. Cognition 79, 115–34.
Merritt, R.D. and Balogh, D.W. (1984). The use of a backward masking paradigm to assessinformation-processing deficits among schizophrenics: a re-evaluation of Steronko andWoods. J Nerv Ment Dis 172, 216–24.
Merritt, R.D. and Balogh, D.W. (1990). Backward masking as a function of spatialfrequency a comparison of MMPI-identified schizotypics and control subjects.J Nerv Ment Dis 178, 186–93.
Metzinger, T. (2000). Neural Correlates of Consciousness. Cambridge, MA: MIT Press.
Mewhort, D.J. and Campbell, A.J. (1978). Processing spatial information and the selective-masking effect. Percept Psychophys 24, 93–101.
Mewhort, D.J.K., Hearty, P.J., and Powell, J.E. (1978). A note on sequential blanking.Percept Psychophys 23, 132–6.
Mewhort, D.J.K., Huntley, M.F., and Duff-Fraser, H. (1993). Masking disrupts recovery oflocation information. Percept Psychophys 54, 759–62.
Meyer, G.E. and Maguire, W.M. (1977). Spatial frequency and the mediation of short-termvisual storage. Science 198, 524–5.
Meyer, G.E., Lawson, R., and Cohen, W. (1975). The effects of orientation-specific adaptationon the duration of short-term visual storage. Vision Res 15, 569–72.
Meyer, G.E., Jackson, W.E., and Yang, C. (1979). Spatial frequency, orientation and color:interocular effects of adaptation on the perceived duration of gratings. Vision Res 19,1197–1201.
Mezrich, J.J. (1984). The duration of visual persistence. Vision Res 24, 631–2.
Michaels, C.F. and Turvey, M.T. (1973). Hemiretinae and nonmonotonic maskingfunctions with overlapping stimuli. Bull Psychon Soc 2, 163–4.
Michaels, C.F. and Turvey, M.T. (1979). Central sources of visual masking: Indexingstructures supporting seeing at a single, brief glance. Psychol Res 41, 1–61.
Michimata, C., Okubo, M., and Mugishima, Y. (1999). Effects of background color on the global and local processing of hierarchically organized stimuli. J Cogn Neurosci11, 1–8.
REFERENCES340
Milner, A.D. and Goodale, M.A. (1995). The Visual Brain in Action. Oxford: OxfordUniversity Press.
Minkowski, M. (1913). Experimentelle Untersuchungen über die Beziehung derGrosshirnrinde und der Netzhaut zu den primären optischen Zentern, besonders zumCorpus geniculatum externum. Arbeitsbl Hirnanat Inst Zurich 7, 255–62.
Minkowski, M. (1920a). Über den Verlauf, die Endigung und die zentrale Repräsentationvon gekreutzten und ungekreutzten Sehnervenfasern bei einigen Säugetieren und beimMenschen. Schweiz Arch Neurol Psychol 6, 201–52.
Minkowski, M. (1920b). Über den Verlauf, die Endigung und die zentrale Repräsentationvon gekreutzten und ungekreutzten Sehnervenfasern bei einigen Säugetieren und beimMenschen. Schweiz Arch Neurol Psychol 7, 268–303.
Mitov, D., Vassilev, A., and Manahilov, V. (1981). Transient and sustained masking. PerceptPsychophys 30, 205–10.
Mitroff, S.R. and Scholl, B.J. (2005). Forming and updating object representations withoutawareness: evidence from motion-induced blindess. Vision Res 45, 961–7.
Mollon, J.D. and Krauskopf, J. (1973). Reaction time as a measure of the temporalresponse properties of individual color mechanisms. Vision Res 13, 27–40.
Monahan, J.S. and Steronko, R.J. (1977). Stimulus luminance and dichoptic patternmasking. Vision Res 17, 385–90.
Monjé, J. (1927). Die Empfindungszeitmessung mit der Methode des Löschreizes. ZeitschrBiol 87, 23–40.
Monjé, J. (1931). Uber die gegenseitige Beeinflussung der Empfindungen bei binokularemSehen. Zeitschr Biol 91, 387–98.
Moran, J. and Desimone, R. (1985). Selective attention gates visual processing in theextrastriate cortex. Science 229, 782–4.
Mori, S., Tanaka, G., Ayaka, Y., et al. (1996). Preattentive and focal attentional processes inschizophrenia: a visual search study. Schizophr Res 22, 69–76.
Morris, J.S., Öhman, A., and Dolan, R.J. (1998). Conscious and unconscious emotionallearning in the human amygdala. Nature 393, 467–70.
Morris, J. and Dolan, R. (2001). The amygdala and unconscious fear processing. In Out ofMind (ed B. de Gelder, E. de Haan, and C. Heywood). Oxford: Oxford University Press,pp. 185–204.
Motoyoshi, I. (1999). Texture filling-in and texture segregation revealed by transientmasking. Vision Res 39, 1285–91.
Motter, B.C. (1993). Focal attention produces spatially selective processing in visualcortical areas V1, V2, and V4 in the presence of competing stimuli. J Neurophysiol70, 909–19.
Moutoussis, K. and Zeki, S. (2002). Responses of spectrally selective cells in macaque areaV2 to wavelengths and colors. J Neurophysiol 87, 2104–12.
Muise, J.G., LeBlanc, R.S., Lavoie, M.E., and Arsenault, A.S. (1991). Two-stage model ofvisual backward masking: sensory transmission and accrual of effective information asa function of target intensity and similarity. Percept Psychophys 50, 197–204.
Müller, J. (1834). Handbuch der Physiologie des Menschen. Coblenz: Hölscher.
Müller, J.R., Metha, A.B., Krauskopf, J., and Lennie, P. (2001). Information conveyed byonset transients in responses of striate cortical neurons. J Neurosci 21, 6978–90.
REFERENCES 341
Munk, M.H.J., Roelfsema, P.R., Koenig, P., Engel, A.K., and Singer, W. (1996). Role of retic-ular activation in the modulation of intracortical synchronization. Science 272, 271–4.
Murray, I.J. and Kulikowski, J.J. (1983). VEPs and contrast. Vision Res 23, 1741–3.
Murray, I.J. and Plainis, S. (2003). Contrast coding and magno/parvo segregation revealedin reaction time studies. Vision Res 43, 2707–19.
Murray, S.O., Kersten, D., Olshausen, B.A., Schrater, P., and Woods, D.L. (2002). Shapeperception reduces activity in human primary visual cortex. Proc Natl Acad Sci USA 99,15164–9.
Mussap, A.J. and Levi, D.M. (1997). Vernier acuity with plaid masks: the role of orientedfilters in vernier acuity. Vision Res 37, 1325–40.
Nacchache, L., Blandin, E., and Dehaene, S. (2002). Unconscious masked priming dependson temporal attention. Psychol Sci 13, 416–24.
Naccache, L., Gaillard, R., Adam, C., et al. (2005). A direct intracranial record of emotionsevoked by subliminal words. Proc Natl Acad Sci USA 102, 7713–17.
Nachmias, J. (1967). Effect of exposure duration on visual contrast sensitivity with square-wave gratings. J Opt Soc Am A 57, 421–7.
Nagano, T. (1980). Temporal sensitivity of the human visual system to sinusoidal gratings.J Opt Soc Am 70, 711–16.
Nakamura, K., Dehaene, S., Jobert, A., Le Bihan, D., and Kouider, S. (2005). Subliminalconvergence of Kanji and Kana words: further evidence for functional parcellation ofthe posterior temporal cortex in visual word perception. J Cogn Neurosci 17, 954–68.
Navon, D. (1977). Forest before the trees: the precedence of global features in visualperception. Cogn Psychol 9, 353–83.
Navon, D. and Purcell, D. (1981). Does integration produce masking or protect from it?Perception 10, 71–83.
Nealy, T.A. and Maunsell, J.H.R. (1994). Magnocellular and parvocellular contributions tothe responses of neurons in macaque striate cortex. J Neurosci 14, 2069–79.
Neisser, U. (1967). Cognitive Psychology. New York: Appleton-Century-Crofts.
Neisser, U. (1976). Cognition and Reality. San Francisco: W.H. Freeman & Co.
Nelson, J.I. and Frost, B.J. (1978). Orientation-selective inhibition from beyond theclassical receptive field. Brain Res 139, 359–66.
Nelson, S.B. (1991). Temporal interactions in the cat visual system. I: Orientation-selectivesuppression in the visual cortex. J Neurosci 11, 344–56.
Neuhaus, W. (1930). Experimentelle Untersuchungen der Scheinbewegung. Arch GesamtePsychol 75, 315–458.
Neumann, O. (1990). Direct parameter specification and the concept of perception.Psychol Res 52, 207–15.
Neumann, O. and Klotz, W. (1994). Motor responses to nonreportable, masked stimuli.Where is the limit of direct parameter specification? In Attention and Performance XV(ed C. Umilta and M. Moscovitch). Cambridge, MA: MIT Press, pp. 123–50.
Newark, J. and Mayzner, M.S. (1973). Sequential blanking effects for two interleavedwords. Bull Psychon Soc 2, 74–6.
Nguyen, V.A., Freeman, A.W., and Alais, D. (2003). Increasing depth of binocular rivalrysuppression along two visual pathways. Vision Res 43, 2003–8.
REFERENCES342
Nijhawan, R. (1994). Motion extrapolation in catching. Nature 370, 256–7.
Nijhawan, R. (1997). Visual decomposition of colour through motion extrapolation.Nature 386, 66–9.
Nillson T.H., Richmond, C.F., and Nelson, T.M. (1975). Flicker adaptation shows evidence of many visual channels selectively sensitive to temporal frequency. Vision Res 15, 621–4.
Noesselt, T., Hillyard, S.A., Woldorff, M.G., et al. (2002). Delayed striate cortical activationduring spatial attention. Neuron 35, 575–87.
Nowak, L.G. and Bullier, J. (1997). The timing of information transfer in the visual system.In Cerebral Cortex: Extrastriate Cortex in Primates (ed J. Kaas, K. Rockland, and A. Peters). New York: Plenum Press, pp. 205–41.
Nowak, L.G., Munk, M.H., Girard, P., and Bullier, J. (1995). Visual latencies in areas V1and V2 of the macaque monkey. Vis Neurosci 12, 371–84.
Nuechterlein, K.H. and Dawson, M.E. (1984). Information processing and attentionalfunctioning in the developmental course of schizophrenic disorders. Schizophr Bull10, 160–203.
O’Connor, D.H., Fukui, M.M., Pinsk, M.A., and Kastner, S. (2002). Attention modulatesresponses in the human lateral geniculate nucleus. Nat Neurosci 5, 1203–9.
Ögmen, H. (1993). A neural theory of retino-cortical dynamics. Neural Netw 6, 245–73.
Ögmen, H. and Breitmeyer, B.G. (2005). The First Half Second: The Microgenesis andTemporal Dynamics of Unconscious and Conscious Processes. Cambridge, MA: MITPress.
Ögmen, H. and Gagné, S. (1990). Neural models for sustained and on-off units of insectlamina. Biol Cybern 63, 51–60.
Ögmen, H., Breitmeyer, B.G., and Melvin, R. (2003). The what and where in visual masking.Vision Res 43, 1337–50.
Ögmen, H., Breitmeyer, B.G., Todd, S., and Mardon, L. (2004). Double dissociation intarget recovery: effect of contrast. Paper presented at the Annual Meeting of the VisionSciences Society, Sarasota, FL, 30 April–5 May 2004.
Öhman, A. (2002). Automaticity and the amygdala: nonconscious responses to emotionalfaces. Curr Dir Psychol Sci 11, 62–6.
Ortells, J.J., Daza, M.T., and Fox, E. (2003). Semantic activation in the absence of perceptualawareness. Percept Psychophys 65, 1307–17.
Oyama, T. (1970). The visually perceived velocity as a function of aperture size, stripe size,luminance and motion direction. Jpn Psychol Res 12, 163–71.
Pääkkönen, A.K. and Morgan, M.J. (1994). Effects of motion on blur discrimination, J OptSoc Am A 11, 992–1002.
Palmer, L.A. and Rosenquist, A.C. (1974). Visual receptive fields of single striate corticalunits projecting to the superior colliculus in the cat. Brain Res 67, 27–42.
Palmer, S.E. (1999). Vision Science. Cambridge, MA: MIT Press.
Pammer, K. and Lovegrove, W. (2001). The influence of color on transient system activity:implications for dyslexia research. Percept Psychophys 63, 490–500.
Pantle, A. (1971). Flicker adaptation. I: Effect on visual sensitivity to temporal fluctuationsof light intensity. Vision Res 11, 943–52.
REFERENCES 343
Paradiso, M.A. and Nakayama, K. (1991). Brightness perception and filling-in. Vision Res31, 1221–36.
Parker, D.M. (1980). Simple reaction times to the onset, offset, and contrast reversal ofsinusoidal grating stimuli. Percept Psychophys 28, 365–8.
Parker, D.M. and Salzen, E.A. (1977a). The spatial selectivity of early and late waves withinthe human visual evoked response. Perception 6, 85–95.
Parker, D.M. and Salzen, E.A. (1977b). Latency changes in the human visual evokedresponse to sinusoidal gratings. Vision Res 17, 1201–4.
Parker, D.M. and Salzen, E.A. (1982). Evoked potentials and reaction times to the offsetand contrast reversal of sinusoidal gratings. Vision Res 22, 205–7.
Parks, T.E. (1965). Post-retinal visual storage. Am J Psychol 78, 145–7.
Parks, T.E. (1968). Further comments on the evidence for post-retinal storage. PerceptPsychophys 4, 373.
Parks, T.E. (1970). A control for ocular tracking in the demonstration of postretinal visualstorage. Am J Psychol 83, 442–4.
Parnas, J., Bovet, P., and Innocenti, G.M. (1996). Schizophrenic trait features, binding, andcortico-cortical connectivity: a neurodevelopmental pathogenetic hypothesis. NeurolPsychiatr Brain Res 4, 185–96.
Pasley, B.N., Mayes, L.C., and Schultz, R.T. (2004). Subcortical discrimination ofunperceived objects during binocular rivalry. Neuron 42, 163–72.
Pasupathy, A. and Connor, C.E. (2002). Population coding of shape in area V4. NatNeurosci 5, 1332–8.
Pélisson, D., Prablanc, C., Goodale, M.A., and Jeannerod, M. (1986). Visual control ofreaching movements without vision of the limb. II: Evidence of fast unconsciousprocesses correcting the trajectory of the hand to the final position of a double-stepstimulus. Exp Brain Res 62, 303–11.
Perry, V.H., Oehler, R., and Cowey, A. (1984). Retinal ganglion cells that project to thedorsal lateral geniculate nucleus in the macaque monkey. Neuroscience 12, 1101–23.
Pessoa, L., McKenna, M., Gutierrez, E., and Ungerleider, L.G. (2002). Neural processing ofemotional faces requires attention. Proc Natl Acad Sci USA 99, 11458–63.
Pessoa, L. and De Weerd, P. (2003). Filling-in. Oxford: Oxford University Press.
Petrén, K. (1893). Untersuchungen über den Lichtsinn. Skand Arch Physiol 4, 421–47.
Petry, S. (1978). Perceptual changes during metacontrast. Vision Res 18, 1337–41.
Petry, S., Grigonis, A., and Reichert, B. (1979). Decrease in metacontrast masking followingadaptation to flicker. Perception 8, 541–7.
Piéron, H. (1935). Le processus du metacontraste. J Psychol (Paris) 32, 5–24.
Piper, H. (1903). Über Dunkeladaptation. Zeitschr Psychol Physiol Sinnesorg 31,169–214.
Plateau, J. (1834). Über das Phänomen der zufälligen Farben. Poggend Arch Phys Chem 32,543–54.
Poggio, G.F., Baker, F.H., Lamarre, Y., and Sanseverino, E.R. (1969). Afferent inhibition atinput to visual cortex of the cat. J Neurophysiol 32, 892–915.
Polat, U. and Sagi, D. (1993). Lateral interactions between spatial channels: suppressionand facilitation revealed by lateral masking experiments. Vision Res 33, 993–9.
REFERENCES344
Polat, U. and Sagi, D. (1994). Spatial interactions in human vision: from near to far viaexperience-dependent cascades of connections. Proc Natl Acad Sci USA 91, 1206–9.
Polat, U., Sagi, D., and Norcia, A.M. (1997). Abnormal long-range spatial interactions inamblyopia. Vision Res 37, 737–44.
Pollen, D.A. (1999). On the neural correlates of visual perception. Cereb Cortex 9, 4–13.
Polonsky, A., Blake, R., Braun, J., and Heeger, D.J. (2000). Neuronal activity in humanprimary visual cortex correlates with perception during binocular rivalry. Nat Neurosci 3, 1153–9.
Pomerantz, J.R. and Pristach, E.A. (1989). Emergent features, attention, and perceptualglue in visual form perception. J Exp Psychol Hum Percept Perform 15, 635–49.
Pomerantz, J.R., Sager, L.C., and Stoever, R.J. (1977). Perception of whole and theircomponent parts: Some configurational superiority effects. J Exp Psychol HumPercept Perform 3, 422–35.
Popper, K. (1972). Objective Knowledge. Oxford: Oxford University Press.
Posner, M. (1978). Chromometric Explorations of Mind. Hillsdale, NJ: Lawrence Erlbaum &Associates.
Posner, M. (1980). Orienting of attention. Q J Exp Psychol 32, 3–25.
Posner, M.I. (1994). Attention: the mechanism of consciousness. Proc Natl Acad Sci USA91, 7398–403.
Posner, M.I. and Petersen, S.E. (1990). The attention system of the human brain. Ann RevNeurosci 13, 25–42.
Posner, M.I. and Rothbart, M.K. (1994). Constructing neuronal theories of mind. InLarge-Scale Neuronal Theories of the Brain (ed C. Koch and J.L. Davis). Cambridge,MA: MIT Press, pp. 183–99.
Previc, F.H. (1990). Functional specialization in the lower and upper visual fields: its eco-logical origin and neurophysiological implications. Behav Brain Sci 13, 519–41.
Previc, F.H. (1998). The neuropsychology of 3-D space. Psychol Bull 124, 123–64.
Prinzmetal, W. and Banks, W.P. (1977). Good continuation affects visual detection. PerceptPsychophys 21, 389–95.
Proctor, R.W., Nunn, M.B., and Pallos, I. (1983). The influence of metacontrast maskingon detection and spatial-choice judgments: an apparent distinction between automaticand attentive response mechanisms. J Exp Psychol Hum Percept Perf 2, 278–87.
Pulos, E., Raymond, J.E., and Makous, W. (1980). Transient sensitization by a contrastflash. Vision Res 20, 281–8.
Purcell, D.G. and Dember, W.N. (1968). The relation of phenomenal brightness reversaland re-reversal to backward masking and recovery. Percept Psychophys 3, 290–2.
Purcell, D.G. and Stewart, A.L. (1970). U-shaped backward masking functions withnonmetacontrast paradigms. Psychon Sci 21, 361–3.
Purcell, D.G. and Stewart, A.L. (1988). The face-detection effect: configuration enhancesperception. Percept Psychophys 43, 355–66.
Purcell, D.G. and Stewart, A.L. (1991). The object-detection effect: configuration enhancesperception. Percept Psychophys 50, 215–24.
Purcell, D.G., Stewart, A.L., and Brunner, R.L. (1974). Metacontrast target detection underlight and dark adaptation. Bull Psychon Soc 3, 199–201.
REFERENCES 345
Purcell, D.G., Stewart, A.L., Davis, J., et al. (1975). U-shaped masking functions underbackward masking by pattern. Bull Psychon Soc 5, 498–500.
Purkinje, J.E. (1819). Beitrage zur Kenntnis des Sehens in Subjektiver Hinsicht. Prague:J.G. Calve.
Purpura, D.P. (1970). Operations and processes in thalamic and synaptically related neuralsubsystems. In The Neurosciences: Second Study Program (ed F.O. Schmitt). New York:Rockefeller University Press, pp. 458–70.
Purpura, K., Tranchina, D., Kaplan, E., and Shapley, R.M. (1990). Light adaptation inprimate retina: analysis of changes in gain and dynamics of retinal ganglion cells. VisNeurosci 4, 75–93.
Purushothaman, G., Ögmen, H., Chen, S., and Bedell, H.E. (1998). Motion deblurring in aneural network model of retino-cortical dynamics. Vision Res 38, 1827–42.
Purushothaman, G., Ögmen, H., and Bedell, H.E. (2000). Gamma-range oscillations in backwardmasking functions and their putative neural correlates. Psychol Rev 107, 556–77.
Purushothaman, G., Ögmen, H., and Bedell, H.E. (2003). Suprathreshold intrinsicdynamics of the human visual system. Neural Comput 15, 2883–908.
Rafal, R., Smith, J., Krantz, J., Cohen, A., and Brennan, C. (1990). Extrageniculate vision inhemianopic humans: saccade inhibition by signals in the blind field. Science 250, 118–20.
Raiguel, S.E., Lagae, L., Gulyas, B., and Orban, G.A. (1989). Response latencies of visualcells in macaque areas V1, V2 and V5. Brain Res 493, 155–9.
Ramachandran, V.S. (1990). Visual perception in people and machines. In AI and the Eye(ed A. Blake and T. Troscianko). New York: Wiley, pp. 21–77.
Ramachandran, V.S. and Cobb, S. (1995). Visual attention modulates metacontrast masking.Nature 373, 66–8.
Ramachandran, V.S., Rao, V.M., and Vidyasagar, T.R. (1974). Sharpness constancy duringmovement perception. Perception 3, 97–8.
Ransom-Hogg, A. and Spillmann, L. (1980). Perceptive field size in fovea and periphery ofthe light- and dark-adapted retina. Vision Res 20, 221–8.
Rashbass, C. (1970). The visibility of transient changes of luminance. J Physiol 210, 165–86.
Rashevsky, N. (1960). Mathematical Biophysics. New York: Dover Publications.
Rassovsky, Y., Green, M.F., Nuechterlein, K.H., Breitmeyer, B., and Mintz, J. (2004).Paracontrast and metacontrast in schizophrenia: clarifying the mechanism for visualmasking deficits. Schizophr Res 71, 485–92.
Rassovsky, Y., Green, M.F., Nuechterlein, K.H., Breitmeyer, B., and Mintz, J. (2005).Visual processing in schizophrenia: a confirmatory factor analysis of visual maskingparameters. Schizophr Res 78, 251–60.
Ratliff, F. (1965). Mach Bands: Quantitative Studies on Neural Networks in the Retina. SanFrancisco, CA: Holden-Day.
Rauschenberger, R. and Yantis, S. (2001). Masking unveils pre-modal completionrepresentation in visual search. Nature 410, 369–72.
Reeves, A. (1980). Visual imagery in backward masking. Percept Psychophys 28, 118–24.
Reeves, A. (1981). Metacontrast in hue substitution. Vision Res 21, 907–12.
Reeves, A. (1982). Metacontrast U-shaped functions derive from two monotonic functions.Perception 11, 415–26.
REFERENCES346
Regan, D. (1970). Evoked potentials and psychophysical correlates of changes in stimuluscolour and intensity. Vision Res 10, 163–78.
Regan, D. and Cynader, M. (1979). Neurons in area 18 of cat visual cortex selectively sensitive to changing size: nonlinear interactions between responses to two edges.Vision Res 19, 699–711.
Reicher, G.M. (1969). Perceptual recognition as a function of meaningfulnessof stimulusmaterial. J Exp Psychol 81, 275–80.
Reingold, E.M. and Merikle, P.M. (1990). On the inter-relatedness of theory and measurement in in the study of unconscious processes. Mind Lang 5,9–28.
Reynolds, J.H., Chelazzi, L., and Desimone, R. (1999). Competitive mechanisms subserveattention in macaque areas V2 and V4. J Neurosci 19, 1736–53.
Rieger, J.W., Braun, C., Bulthoff, H.H., and Gegenfurtner, K.R. (2005). The dynamics ofvisual pattern masking in natural scene processing: a magnetoencephalography study. JVis 5, 275–86.
Rieke, F., Warland, D., de Ruyter van Stevenick, R., and Bialek, W. (1997). Spikes: Exploringthe Neural Code. Cambridge, MA: MIT Press.
Rijsdijk, J.P., Kroon, J.N., and van der Wildt, G.J. (1980). Contrast sensitivity as a functionof position on the retina. Vision Res 20, 235–41.
Ro, T., Breitmeyer, B., Burton, P., Singhal, N.S., and Lane, D. (2003). Feedback contributionsto visual awareness in human occipital cortex. Curr Biol 11, 1038–41.
Ro, T., Shelton, D., Lee, O.L., and Chang, E. (2004). Extrageniculate mediation ofunconscious vision in transcranial magnetic stimulation-induced blindsight. Proc NatlAcad Sci USA 101, 9933–5.
Rodieck, R.W. and Rushton, W.A.H. (1976). Cancellation of rod signals by cones, and conesignals by rods in the cat retina. J Physiol 254, 775–85.
Rodriguez, E., George, N., Lachaux, J.-P., Martinerie, J., Renault, B., and Varela, F.J. (1999).Perception’s shadow: long-distance synchronization of human brain activity. Nature397, 430–3.
Roelfsema, P.R., Lamme, V.A.F., and Spekreijse, H. (1998). Object-based attention in theprimary visual cortex of the macaque monkey. Nature 395, 376–81.
Rogowitz, B. (1983). Spatial/temporal interactions: backward and forward metacontrastmasking with sine-wave gratings. Vision Res 23, 1057–73.
Rolls, E.T. (1992). Neurophysiological mechanisms underlying face processing withinand beyond the temporal cortical visual areas. Philos Trans R Soc Lond B Biol Sci335, 11–20.
Rolls, E.T. (2005). Consciousness absent and present: a neurophysiological exploration ofmasking. In The First Half Second (ed H. Ögmen and B.G. Breitmeyer). Cambridge,MA: MIT Press, pp. 89–108.
Rolls, E.T. and Tovée, M.J. (1994). Processing speed in the cerebral cortex and the neurophysiology of visual masking. Proc R Soc Lond B Biol Sci 257, 9–15.
Rolls, E.T., Tovee, M.J., Purcell, D.G., Stewart, A.L., and Azzopardi, P. (1994). Theresponses of neurons in the temporal cortex of primates, and face identification anddetection. Exp Brain Res 101, 473–84.
REFERENCES 347
Rolls, E.T., Tovée, M.J., and Panzeri, S. (1999). The neurophysiology of backward visualmasking: information analysis. J Cogn Neurosci 11, 300–11.
Rosenquist, A.C. and Palmer, L.A. (1971). Visual receptive field properties of cells of thesuperior colliculus after cortical lesions in the cat. Exp Neurol 33, 629–52.
Ross, J., Morrone, M.C., Goldberg, M.E., and Burr, D. (2001). Changes in visualperception at the time of saccades. Trends Neurosci 24, 113–21.
Rossi, A.F., Desimone, R., and Ungerleider, L. (2001). Contextual modulation in primaryvisual cortex of macaques. J Neurosci 21, 1698–1709.
Roth, E.C. and Hellige, J.B. (1998). Spatial processing and hemispheric asymmetry:contributions of the transient/magnocellular visual system. J Cogn Neurosci10, 472–84.
Rubin, E. (1929). Kritisches und Experimentelles zur ‘Empfindungszeit’ Fröhlichs. PsycholForsch 13, 101–12.
Rudvin, I., Valberg, A., and Kilavik, B.E. (2000). Visual evoked potentials and magnocellularand parvocellular segregation. Vis Neurosci. 17, 579–90.
Rund, B.R. and Landrø, N.I. (1990). Information processing: a new model forunderstanding cognitive disturbances in psychiatric patients. Acta Psychiatr Scand81, 305–16.
Rushton, W.A.H. (1965). Bleached rhodopsin and visual adaptation. J Physiol 181,645–55.
Rushton, W.A. and Westheimer, G. (1962). The effect upon the rod threshold of bleachingneighbouring rods. J Physiol 164, 318–29.
Saarinen, J., Levi, D.M., and Shen, B. (1997). Integration of local pattern elements intoglobal shape in human vision. Proc Natl Acad Sci USA 94, 8267–71.
Saccuzzo, D.P. and Braff, D.L. (1980). Associative cognitive dysfunction in schizophreniaand old age. J Nerv Ment Dis 168, 41–5.
Saccuzzo, D.P. and Braff, D.L. (1981). Early information processing deficit in schizophrenia.New findings using schizophrenic subgroups and manic control subjects. Arch GenPsychiatry 38, 175–9.
Saccuzzo, D.P. and Braff, D.L. (1986). Information-processing abnormalities: trait- andstate-dependent components. Schizophr Bull 12, 447–59.
Saccuzzo, D.P. and Schubert, D.L. (1981). Backward masking as a measure of slowprocessing in schizophrenia spectrum disorders. J Abnorm Psychol 90, 305–12.
Saccuzzo, D.S., Cadenhead, K.S., and Braff, D.L. (1996). Backward versus forward visualmasking deficits in schizophrenic patients: centrally, not peripherally, mediated? Am JPsychiatry 153, 1564–70.
Sagi, D. and Julesz, B. (1985). Enhanced detection in the aperture of focal attention duringsimple discrimination tasks. Nature 321, 693–5.
Sahraie, A., Weiskrantz, L., Barbur, J.L., Simmons, A., Williams, S.C.R., and Brammer, M.J.(1997). Pattern of neuronal activity associated with conscious and unconsciousprocessing of visual signals. Proc Natl Acad Sci USA 94, 9406–11.
Sahraie, A., Weiskrantz, L., and Barbur, J.L. (1998). Awareness and confidence ratings inmotion perception without geniculo-striate projection. Behav Brain Res 96, 71–7.
Sakitt, B. (1975). Locus of short-term visual storage. Science 190, 1318–19.
REFERENCES348
Sakitt, B. (1976). Iconic memory. Psychol Rev 83, 257–76.
Samar, V.J., Parasnis, I., and Berent, G.P. (2002). Deaf poor readers’ pattern reversal visualevoked potentials suggest magnocellular system deficits: implications for diagnosticneuroimaging of dyslexia in deaf individuals. Brain Lang 80, 21–44.
Sandberg, M.A., Berson, E.L., and Effron, M.H. (1981). Rod–cone interaction in the distalhuman retina. Science 212, 829–31.
Sarikaya, M., Wang, W., and Ögmen, H. (1998). Neural network model of on-off units inthe fly visual system: simulations of dynamic behavior. Biol Cybern 78, 399–412.
Sasaki, H., Saito, Y., Bear, D.M., and Ervin, F.R. (1971). Quantitative variation in striatereceptive fields of cats as a function of light and dark adaptation. Exp Brain Res113, 273–93.
Sato, T. (1988). Effects of attention and stimulus interaction on visual responses of inferiortemporal neurons in macaque. J Neurophysiol 60, 344–64.
Saucer, R.T. (1954). Processes of motion perception. Science 120, 806–7.
Saunders, J. (1977). Foveal and spatial properties of brightness metacontrast. Vision Res17, 375–8.
Sawatari, A. and Callaway, E.M. (1996). Convergence of magno- and parvocellularpathways in layer 4B of macaque primary visual cortex. Nature 380, 442–6.
Scharf, B. and Lefton, L.A. (1970). Backward and forward masking as a function of stimulusand task parameters. J Exp Psychol 84, 331–8.
Scharf, B., Zamansky, H.S., and Brighthill, R.F. (1966). Word recognition with masking.Percept Psychophys 1, 110–2.
Scharlau, I. and Ansorge, U. (2003). Direct parameter specification of an attention shift:evidence from perceptual latency priming. Vision Res 43, 1351–63.
Scharlau, I. and Neumann, O. (2003). Perceptual-latency priming by metacontrast-maskedstimuli: evidence for an attentional interpretation. Psychol Res 67, 184–97.
Scheerer, E. (1973). Integration, interruption and processing rate in visual backwardmasking. Psychol Forsch 36, 71–93.
Scheinberg, D.L. and Logothetis, N.K. (1997). The role of temporal visual areas inperceptual organization. Proc Natl Acad Sci USA 94, 3408–13.
Schiller, P.H. (1965). Backward masking for letters. Percept Mot Skills 20, 47–50.
Schiller, P.H. (1966). Forward and backward masking as a function of relative overlap andintensity of test and masking stimuli. Percept Psychophys 1, 161–4.
Schiller, P.H. (1968). Single unit analysis of backward visual amskingand metacontrast inthe cat lateral geniculate nucleus. Vision Res 8, 855–66.
Schiller, P.H. (1986). The central visual system. Vision Res 26, 1351–86.
Schiller, P.H. and Chorover, S.L. (1966). Metacontrast: its relation to evoked potentials.Science 153, 1398–1400.
Schiller, P.H. and Colby, C.L. (1983). The responses of single cells in the lateral geniculatenucleus of the rhesus monkey to color and luminance contrast. Vision Res 23, 1631–41.
Schiller, P.H. and Greenfield, A. (1969). Visual masking and the recovery phenomenon.Percept Psychophys 6, 182–4.
Schiller, P.H. and Lee, K. (1991). The role of primate extrastriate area V4 in vision. Science251, 1251–3.
REFERENCES 349
Schiller, P.H. and Smith, M.C. (1965). A comparison of forward and backward masking.Psychonomic Sci 3, 77–8.
Schiller, P.H. and Smith, M.C. (1966). Detection in metacontrast. J Exp Psychol 71, 32–9.
Schiller, P.H. and Smith, M.C. (1968). Monoptic and dichoptic metacontrast. PerceptPsychophys 3, 237–9.
Schiller, P.H., Finlay, B.L., and Volman, S.F. (1976). Quantative studies of single cell properties in monkey striate cortex. I–V. J Neurophysiol 39, 1288–1374.
Schmidt, T. (2000). Visual perception without awareness: priming responses by color. InNeural Correlates of Consciousness (ed T. Metzinger). Cambridge, MA: MIT Press,pp. 157–69.
Schmidt, T. (2002). The finger in flight: real-time motor control by visually masked colorstimuli. Psychol Sci 13, 112–18.
Schmolesky, M.T., Wang, Y., Hanes, D.G., et al. (1998). Signal timing across the macaquevisual system. J Neurophysiol 79, 3272–8.
Schober, H.A.W. and Hilz, R. (1965). Contrast sensitivity of the human eye for square-wavegratings. J Opt Soc Am A 55, 1086–91.
Schuck, J.R. and Lee, R.G. (1989). Backward masking, information processing, and schizophrenia. Schizophr Bull 15, 491–500.
Schultz, D.W. and Eriksen, C.W. (1977). Do noise masks terminate target processing? MemCognit 5, 90–6.
Schulz, A.J. (1908). Untersuchungen über die Wirkung gleicher Reize auf die Auffassungbei momentaner Exposition. Zeitschr Psychol 52, 238–96.
Schulz, M.F. and Sanocki, T. (2003). Time course of perceptual grouping by color. PsycholSci 14, 26–30.
Schumann, F. (1899). Sitzungsberichte des Psychologischen Vereins zu Berlin. ZeitschrPsychol 1, 96–100.
Schwartz, M. and Pritchard, W.S. (1981). AERs and detection in tasks yielding U-shapedbackward masking functions. Psychophysiology 18, 678–85.
Schwartz, S.H. (1992). Reaction time distributions and their relationship to thetransient/sustained nature of the neural discharge. Vision Res 32, 2087–92.
Seiffert, A.E. and Di Lollo, V. (1997). Low-level masking in the attentional blink. J ExpPsychol Hum Percept Perform 23, 1061–73.
Sekuler, R.W. (1965). Spatial and temporal determinants of visual backward masking. JExp Psychol 70, 401–6.
Shannon, C.E. (1948). A mathematical theory of communication. Bell Syst Tech J 27,379–423.
Shapiro, K. (2001). The Limits of Attention. Oxford: Oxford University Press.
Shapley, R. (1992). Parallel retinocortical channels: X and Y and P and M. In Applicationsof Parallel Processing in Vision (ed J. Brannan). Amsterdam: Elsevier, pp. 3–36.
Shaw, R. and Bransford, J. (1977). Perceiving, Acting, and Knowing. Hillsdale, NJ: LawrenceErlbaum Associates.
Sheer, D.E. (1984). Focused arousal, 40 Hz EEG, and dysfunction. In Self Regulation of theBrain and Behavior (ed T. Elbert, B. Rockstroh, W. Lutzenberger, and N. Birbaumer).Berlin: Springer, pp. 66–84.
REFERENCES350
Sheinberg, D.L. and Logothetis, N.K. (1997). The role of temporal cortical areas inperceptual organization. Proc Natl Acad Sci USA 94, 3408–13.
Shelley-Tremblay, J. and Mack, A. (1999). Metacontrast masking and attention. Psychol Sci10, 508–15.
Sherman, S.M. and Guillery, R.W. (1996). Functional organization of thalamocorticalrelays. J Neurophysiol 76, 1367–95.
Sherrick, M. and Dember, W. (1970). Completeness and spatial distribution of maskcontorus as factors in backward visual masking. J Exp Psychol 84, 179–80.
Sherrick, M.F., Keating, J.K., and Dember, W.N. (1974). Metacontrast with black and whitestimuli. Can J Psychol 28, 438–45.
Sherrington, C.S. (1897). On the reciprocal action in the retina as studied by means ofsome rotating discs. J Physiol 21, 33–54.
Shostak, Y., Ding, Y., and Casagrande, V.A. (2003). Neurochemical comparison of synapticarrangements of parvocellular, magnocellular, and koniocellular geniculate pathways inowl monkey (Aotus trivirgatus) visual cortex. J Comp Neurol 456, 12–28.
Sigman, M., Cecchi, G.A., Gilbert, C.D., and Magnasco, M.O. (2001). On a common circle:natural scenes and gestalt rules. Proc Natl Acad Sci USA 98, 1935–40.
Silveira, L.C., Grünert, U., Kremers, J., Lee, B.B., and Martin, P.R. (2005). Comparativeanatomy and physiology of the primate retina. In The Primate Visual System: AComparative Approach (ed J. Kremers). Chichester: Wiley pp. 127–60.
Silverstein, S.M., Knight, R.A., Schwarzkopf, S.B., West, L.L., Osborn, L.M., and Kamin, D.(1996). Stimulus configuration and context effects in perceptual organization in schizophrenia. J Abnorm Psychol 105, 410–20.
Silverstein, S.M., Kovács, I., Corry, R., and Valone, C. (2000). Perceptual organization, thedisorganization syndrome, and context processing in chronic schizophrenia. SchizophrRes 43, 11–20.
Simoncelli, E.P. (2003). Vision and the statistics of the visual environment. Curr OpinNeurobiol 13, 144–9.
Sincich, L.C. and Horton, J.C. (2002). Divided by cytochrome oxidase: a map of the projections from V1 to V2 in macaques. Science 295, 1734–7.
Sincich, L.C. and Horton, J.C. (2005). The circuitry of V1 and V2: integration of color,form, and motion. Annu Rev Neurosci 28, 303–26.
Singer, W. (1977). Control of thalamic transmission by corticofugal and ascendingreticular pathways in the visual system. Physiol Rev 57, 386–420.
Singer, W. (1979). Central-core control of visual cortex functions. In The Neurosciences,Fourth Study Program (ed F.O. Schmitt and F.G. Worden). Cambridge, MA: MIT Press,pp. 1093–110.
Singer, W. (1994). Putative functions of temporal correlations in neocortical processing. InLarge-Scale Neuronal Theories of the Braind (ed C. Koch and J.L. Davis). Cambridge,MA: MIT Press, pp. 201–37.
Singer, W. and Creutzfeldt, O.D. (1970). Reciprocal lateral inhibition of on- and off-centerneurones in the lateral geniculate body of the cat. Exp Brain Res 10, 311–30.
Singer, W., Tretter, F., and Cynader, M. (1976). The effect of reticular stimulation onspontaneous and evoked activity in the cat visual cortex. Brain Res 102, 71–90.
REFERENCES 351
Skagestadt, P. (1975). Making Sense of History. Oslo: Universitetsforlaget.
Skottun, B. (1997a). The magnocellular deficit theory of dyslexia. Trends Neurosci20, 397–8.
Skottun, B. (1997b). Some remarks on the magnocellular deficit theory of dyslexia. VisionRes 37, 965–6.
Skottun, B. (2000). On the use of metacontrast to assess magnocellular function indyslexic readers. Percept Psychophys 63,1271–4.
Skottun, B. (2001). Is dyslexia caused by a visual deficit? Vision Res 41, 3069–71.
Skottun, B.C. and Parke, L.A. (1999). The possible relationship between visual deficits anddyslexia: examination of a critical assumption. J Learn Disabil 32, 2–5.
Slaghuis, W.L. and Bakker, V.J. (1995). Forward and backward visual masking of contourby light in positive- and negative-symptom schizophrenia. J Abnorm Psychol 104,41–54.
Slaghuis, W.L and Ryan, J.F. (1999). Spatio-temporal contrast sensitivity, coherent motion,and visible persistence in developmental dyslexia. Vision Res 39, 651–68.
Smith, E.E. and Haviland, S.E. (1972). Why words are perceived more accurately thannonwords: inferences versus unitization. J Exp Psychol 92, 59–64.
Smith, M.C. and Schiller, P.H. (1966). Forward and backward masking: a comparison.Can J Psychol 20, 191–7.
Smith, P.L. (2000). Attention and luminance detection: effects of cues, masks, andpedestals. J Exp Psychol Hum Percept Perform 26, 1401–20.
Smith, P.L. and Wolfgang, B.J. (2004). The attentional dynamics of masked detection.J Exp Psychol Hum Percept Perform 30, 119–36.
Smith, P.L., Wolfgang, B.J., and Sinclair, A.J. (2004). Mask-dependent attentional cuingeffects on visual signal detection: the psychometric function of contrast. PerceptPsychophys 66, 1056–75.
Smith, V.C. (1969a). Scotopic and photopic functions for visual band movement. VisionRes 9, 293–304.
Smith, V.C. (1969b). Temporal and spatial interactions involved in the band movementphenomenon. Vision Res 9, 665–76.
Smythe, L. and Finkel, D.L. (1974). Masking of spatial and identity information fromgeometric forms by a visual noise field. Can J Psychol 28, 399–408.
Somers, D.C., Dale, A.M., Seiffert, A.E., and Tootell, R.B.H. (1999). Functional MRIreveals spatially specific attentional modulation in human primary visual cortex.Proc Natl Acad Sci USA 96, 1663–8.
Spehlmann, R. (1965). The averaged electrical responses to diffuse and to patterned lightin the human. Electroencephalogr Clin Neurophysiol 19, 560–9.
Spencer, T.J. (1969). Some effects of differing masking stimuli on iconic storage. J ExpPsychol 81, 132–40.
Spencer, T.J. and Shuntich, R. (1970). Evidence for an interruption theory of backwardmasking. J Exp Psychol 85, 198–203.
Sperling, G. (1960). The information available in brief visual presentations. PsycholMonogr 74 (498), 1–29.
Sperling, G. (1963). A model for visual memory tasks. Hum Factors 5, 19–31.
REFERENCES352
Sperling, G. (1964). What visual masking can tell us about temporal factors in perception.Proc 17th Int Congr on Psychology. Amsterdam: North Holland, pp. 541–59.
Sperling, G. (1965). Temporal and spatial visual masking. I. Masking by impulse flashes.J Opt Soc Am 55, 541–59.
Sperling, G. (1967). Successive approximations to a model for short-term memory. ActaPsychol 27, 285–92.
Spillmann, L. and Werner, J.S. (1996). Long-range interactions in visual perception.Trends Neurosci 19, 428–34.
Stainton, W.H. (1928). The phenomenon of Broca and Sulzer in foveal vision. J Opt SocAm 16, 26–39.
Stein, J. (1993). Dyslexia—impaired temporal information processing? Ann NY Acad Sci682, 83–6.
Stein, J. and Walsh, V. (1997). To see but not to read: the magnocellular theory of dyslexia.Trends Neurosci 20, 147–52.
Steriade, M. and McCarley, R.W. (1990). Brainstem Control of Wakefulness and Sleep.New York: Plenum Press.
Steriade, M., Contreras, D., Amzica, F., and Timofeev, I. (1996). Synchronization of fast(30–40 Hz) spontaneous oscillations in intrathalamic and thalamocortical networks.J Neurosci 16, 2788–808.
Sternheim, C.E. and Cavonius, C.R. (1972). Sensitivity of the human ERG and VECP tosinusoidally modulated light. Vision Res 12, 1685–95.
Stettler, D.D., Das, A., Bennett, J., and Gilbert, C.D. (2002). Lateral connectivity andcontextual interactions in macaque primary visual cortex. Neuron 36, 739–50.
Stewart, A.L. and Purcell, D.G. (1970). U-shaped masking functions in visual backwardmasking: effects of target configuration and retinal position. Percept Psychophys 7, 253–6.
Stewart, A.L. and Purcell, D.G. (1974). Visual backward masking by a flash of light: astudy of U-shaped detection functions. J Exp Psychol 103, 553–66.
Stigler, R. (1908). Über die Unterschiedsschwelle im aufsteigenden Teile einerLichtempfindung. Pflugers Arch Gesamte Physiol 123, 163–223.
Stigler, R. (1910). Chronotopische Studien über den Umgebungskontrast. Pflugers ArchGesamte Physiol 135, 365–435.
Stigler, R. (1913). Metacontrast (demonstration), IX Congress International dePhysiologie, Gröningen. Arch Int Physiol 14, 78.
Stigler, R. (1926) Die Untersuchungen des zeitlichen Verlaufes der optischen Erregungmittels des Metakontrastes. In Handbuch der Biologischen Arbeitsmethoden, Part 6(ed E. Aberhalden). Berlin: Urban und Schwarzenberg, pp. 949–68.
Stiles, W.S. (1939). The directional sensitivity of the retina and the spectral sensitivities ofthe rods and cones. Proc R Soc Lond B Biol Sci 127, 64–105.
Stiles, W.S. (1949). Increment thresholds and the mechanisms of colour vision. DocOphthalmol 3, 138–63.
Stiles, W.S. (1959). Color vision: the approach through increment threshold sensitivity.Proc Natl Acad Sci USA 45, 100–14.
Stober, R.S., Brussel, E.M., and Komoda, M.K. (1978). Differential effects of metacontraston target brightness and clarity. Bull Psychon Soc 12, 433–6.
REFERENCES 353
Stoerig, P. (1996). Varieties of vision: from blind responses to conscious recognition.Trends Neurosci 19, 401–6.
Stoerig, P. (2002). Neural correlates of consciousness as state and trait. In Encyclopedia ofCognitive Neuroscience (ed L. Nadel). London: MacMillan, pp. 233–40.
Stone, J. and Dreher, B. (1973). Projection of X- and Y-cells of the cat’s lateral geniculatenucleus to areas 17 and 18 of visual cortex. J Neurophysiol 36, 551–67.
Stoner, G.R. and Albright, T.D. (1992). Neural correlates of perceptual motion coherence.Nature. 358, 412–14.
Stoper, A.E. and Banffy, S. (1977). Relation of split apparent motion to metacontrast. J ExpPsychol Hum Percept Perf 3, 258–77.
Stoper, A.E. and Mansfield, J.G. (1978). Metacontrast and paracontrast suppression of acontourless area. Vision Res 18, 1669–74.
Stromeyer, C.F. and Julesz, B. (1972). Spatial-frequency masking in vision: critical bandsand spread of masking. J Opt Soc Am 62, 1221–32.
Stromeyer, C.F., 3rd, and Martini, P. (2003). Human temporal impulse response speeds upwith increased stimulus contrast. Vision Res 43, 285–98.
Stuart, G.W., McAnnaly, K.I., and Castles, A. (2001). Can contrast sensitivity functions indyslexia be explained by inattention rather than a magnocellular deficit? Vision Res 41,3205–11.
Sturr, J.F. and Frumkes, T.E. (1968). Spatial factors in masking with black and whitetargets. Percept Psychophys 4, 282–4.
Sturr, J.F., Frumkes, T.E., and Veneruso, D.M. (1965). Spatial determinants of visualmasking: effects of mask size and retinal position. Psychon Sci 3, 327–8.
Sugase, Y., Yamane, S., Ueno, S., and Kawano, K. (1999). Global and fine informationcoded by single neurons in the temporal visual cortex. Nature 400, 869–73.
Sukale-Wolf, S. (1971). Prediction of the metacontrast phenomenon from simultaneousbrightness contrast. PhD Thesis, Stanford University, Stanford, CA.
Super, H., Spekreijse, H., and Lamme, V.A.F. (2001). Two distinct modes of sensoryprocessing observed in monkey primary visual cortex (V1). Nat Neurosci 4, 304–10.
Szoc, R. (1973). Metacontrast with stereoscopically displayed stimuli. Master’s Thesis,University of California, Santa Barbara, CA.
Talcott, J., Hansen, P., Willis-Owen, C., McKinnell, I., Richardson, A., and Stein, J. (1998).Visual magnocellular impairment in adult developmental dyslexics. Neuro-ophthalmology20, 187–201.
Tallon-Baudry, C. and Bertrand, O. (1999). Oscillatory gamma activity in humans and itsrole in object representation. Trends Cogn Sci 3, 151–62.
Tanaka, J.W. and Farah, M.J. (1993). Parts and wholes in face perception. Q J Exp Psychol46A, 225–45.
Tanaka, J.W. and Sengco J.A. (1993). Features and their configuration in face perception.Mem Cognit 25, 225–45.
Tanaka, K. (1997). Mechanisms of visual object recognition: monkey and human studies.Curr Opin Neurobiol 7, 523–9.
Tanaka, K., Saito, H., Fukuda, Y., and Moriya, M. (1991). Coding visual images of objectsin the inferotemporal cortex. J Neurophsyiol 66, 170–89.
REFERENCES354
Tartaglione, A., Goff, D.P., and Benton, A.L. (1975). Reaction time to square-wave gratingsas a function of spatial frequency, complexity and contrast. Brain Res 100, 111–20.
Tata, M.S. (2002). Attend to it now or lose it forever: selective attention, metacontrastmasking, and object substitution. Percept Psychophys 64, 1028–38.
Tata, M.S. and Giashi, D.E. (2004). Warning: attending to a mask may be hazardous toyour perception. Psychon Bull Rev 11, 262–8.
Taylor, G.A. and Chabot, R.J. (1978). Differential backward masking of words and lettersby masks of varying orthographic structure. Mem Cognit 6, 629–35.
Taylor, J.L. and McCloskey, D.I. (1990). Triggering of preprogrammed movements asreactions to masked stimuli. J Neurophysiol 63, 439–46.
Teller, D.Y. (1971). Sensitization by annular surrounds: temporal (masking) properties.Vision Res 11, 1325–35.
Teller, D.Y., Matthews, C., Phillips, W.D., and Alexander, K. (1971). Sensitization byannular surrounds: sensitization and masking. Vision Res 11, 1445–58.
Temme, L.A. and Frumkes, T.E. (1977). Rod–cone interaction in human scotopic vision.III: Rods influence cone increment thresholds. Vision Res 17, 681–5.
Teuber, H.-L. (1955). Physiological psychology. Annu Rev Psychol 6, 267–96.
Thomas, G.J. (1954). The effect of critical flicker frequency of interocular differences inintensity and in phase relations of flashes of light. Am J Psychol 67, 632–46.
Thompson, K.G. and Schall, J.D. (1999). The detection of visual signals by macaquefrontal eye field during masking. Nat Neurosci 2, 283–8.
Thompson, K.G. and Schall, J.D. (2000). Antecedents and correlates of visual detectionand awareness in macaque prefrontal cortex. Vision Res 40, 1523–38.
Tigerstedt, R. and Bergqvist, J. (1883). Zur Kenntniss der Apperceptionsdauer zusammengesetzter Gesichtsvorstellungen. Zeitschr Biol 19, 5–44.
Tiitinen, H., Sinkkonen, J., Reinikainen, K., Alho, K., Lavikainen, J., and Naataneb, R.(1993). Selective attention enhances the auditory 40-Hz transient response in humans.Nature 364, 59–60.
Toch, H.H. (1956). The perceptual elaboration of stroboscopic presentations. Am J Psychol69, 345–58.
Tolhurst, D.J. (1973). Separate channels for the analysis of the shape and the movement ofmoving visual stimulus. J Physiol 231, 385–402.
Tolhurst, D.J. (1975). Sustained and transient channels in human vision. Vision Res15, 1151–5.
Tong, F. (2001). Competing theories of binocular rivalry: a possible resolution. Brain Mind2, 55–83.
Tong, F. and Engel, S.A. (2001). Interocular rivalry revealed in the human cortical blind-spot representation. Nature 411, 195–9.
Treisman, A. (1988). Features and objects. The 14th Bartlett Memorial Lecture. Q J ExpPsychol 40A, 201–37.
Treisman, A.M. and Gelade, G. (1980). A feature integration theory of attention. CognPsychol 12, 97–136.
Tresselt, M.E., Mayzner, M.S., Schoenberg, K.M., and Waxman, J. (1970). A study ofsequential blanking and overprinting combined. Percept Psychophys 8, 261–4.
REFERENCES 355
Treue, S. (2001). Neural correlates of attention in primate visual cortex. Trends Neurosci24, 295–300.
Troxler, D. (1804). Über das Verschwinden gegebener Gegenstände innerhalb unseresGesichtskreises. In Opthalmologische Bibliothek, vol 2 (eds. K. Himly and J.A. Schmidt).Jena: Fromann, pp. 1–119.
Tsunoda, K., Yamane, Y., Nishizaki, M., and Tanifuji, M. (2001). Complex objects arerepresented in macaque inferotemporal cortex by the combination of feature columns.Nat Neurosci 4, 832–8.
Tulunay-Keesey, U. (1972). Flicker and pattern detection: a comparison of thresholds.J Opt Soc Am 62, 446–8.
Tulunay-Keesey, U. and Bennis, B.J. (1979). Effects of stimulus onset and image motionon contrast sensitivity. Vision Res 19, 767–74.
Turvey, M. (1973). Contrasting orientations to the theory of visual informationprocessing. Psychol Rev 84, 67–88.
Turvey, M. (1977). On peripheral and central processes in vision: inferences from an infor-mation-processing analysis of masking with patterned stimuli. Psychol Rev 80, 1–52.
Turvey, M. (1978). Visual processing and short-term memory. In Handbook of Learningand Cognitive Processes. Vol. 5, Human Information Processing (ed W.K. Estes).Hillsdale, NJ: Erlbaum, pp. 91–142.
Turvey, M.T., Michaels, C.F., and Kewley-Port, D. (1974). Visual storage or visual masking?An analysis of the ‘retroactive contour enhancement’ effect. Q J Exp Psychol 26, 72–81.
Tytla, M.E. and McAdie, P.J. (1981). Metacontrast masking in amblyopia. Paper presentedat the Annual Meeting of the Association for Research in Vision and Ophthalmology,Sarasota, FL, May 1981.
Tytla, M.E. and Steinbach, M.J. (1984). Metacontrast masking in amblyopia. Can J Psychol38, 369–85.
Ueno, T. (1977). Temporal characteristics of the human visual system as revealed byreaction time to double pulses of light. Vision Res 17, 591–6.
Ullman, S. (1989). Aligning pictorial descriptions: an approach to object recognition.Cognition. 32, 193–254.
Ullman, S. (1996). High-Level Vision. Cambridge, MA: MIT Press.
Ungerleider, L.G. (1985). The corticocortical pathways for object recognition and spatialperception. In Pattern Recognition Mechanisms (ed C. Chagas, R. Gattas, and C. Gross ).Vatican City: Pontifical Academy of Sciences, pp. 21–7.
Ungerleider, L.G. and Mishkin, M. (1982). Two cortical visual systems. In Analysis of VisualBehavior (ed D.J. Ingle, M.A. Goodale, and R.J.W. Mansfield). Cambridge, MA: MITPress, pp. 549–86.
Uttal, W. (1973). The Psychobiology of Sensory Coding. New York: Harper and Row.
van der Wildt, G.J. and Vrolijk, P.C. (1981). Propagation of inhibition. Vision Res 21,1765–71.
van Essen, D.C. (1985). Functional organization of primate visual cortex. In CerebralCortex, Vol.3 (ed A. Peters and E.G. Jones). New York: Plenum Press, pp. 259–329.
van Essen D.C., Anderson, C.H., and Felleman, D.J. (1992). Information processing in theprimate visual system: an integrated systems perspective. Science 255, 419–23.
REFERENCES356
VanRullen, R. and Koch, C. (2003). Visual selective behavior can be triggered by a feed-forward process. J Cogn Neurosci 15, 209–17.
VanRullen, R. and Thorpe, S.J. (2001). The time course of visual processing: from earlyperception to decision making. J Cogn Neurosci 13, 454–61.
van Santen, J.P.H. and Jonides, J. (1978). A replication of the face-superiority effect. BullPsychon Soc 12, 378–80.
van Santen, J.P.H. and Sperling, G. (1985). Elaborated Reichardt detectors. J Opt Soc Am A2, 300–21.
Vassilev, A. and Mitov, D. (1976). Perception time and spatial frequency. Vision Res 16, 89–2.
Vassilev, A. and Strashimirov, D. (1979). On the latency of human visually evokedresponse to sinusoidal gratings. Vision Res 19, 843–5.
Vaughan, H.G., Jr. and Silverstein, L. (1968). Metacontrast and evoked potentials: a reappraisal. Science 160, 207–8.
Ventura, J. (1980). Foveal metacontrast. I: Criterion content and practice effects. J ExpPsychol Hum Percept Perform 6, 473–85.
Vernoy, M.W. (1976). Masking by pattern in random-dot stereograms. Vision Res 16, 1183–4.
Victor, J.D., Conte, M.M., Burton, L., and Nass, R.D. (1993). Visual evoked potentials indyslexics and normals: failure to find a difference in transient or steady-state responses.Vis Neurosci 10, 939–46.
Vidnyánszky, Z., Papathomas, T.V., and Julesz, B. (2001). Contextual modulation oforientation discrimination is independent of stimulus processing time. Vision Res41, 2813–17.
Vierordt, K. (1868). Der Zeitsinn. Tübingen: Universität Tübingen.
Virsu, V., Lee, B.B., and Creutzfeldt, O.D. (1977). Dark adaptation and receptive fieldorganisation of cells in the cat lateral geniculate nucleus. Exp Brain Res 27, 35–50.
Volkmann, F.C. (1986). Human visual suppression. Vision Res 26, 1401–16.
von Békésy, G. (1969). Mach- and Hering-type lateral inhibition in vision. Vision Res9, 1483–99.
von der Heydt, R., Friedman, H.S., Zhou, H., Komatsu, H., Hanazawa, A., and Murakami, I.(1997). Neuronal responses in monkeyV1 and V2 unaffected by metacontrast. InvestOphthalmol Vis Sci 38 (Suppl), 2146.
von Grünau, M.W. (1976). The ‘fluttering heart’ and spatio-temporal characteristics ofcolor processing. III: Interactions between the systems of the rods and the long-wavelengthcones. Vision Res 16, 397–401.
von Grünau, M.W. (1978a). Interactions between sustained and transient channels: forminhibits motion in the human visual system. Vision Res 18, 197–201.
von Grünau, M.W. (1978b). Dissociation and interaction of form and motion informationin the human visual system. Vision Res 18, 1485–9.
von Grünau, M.W. (1979). Form information is necessary for the perception of motion.Vision Res 19, 839–41.
von Grünau, M.W. (1981). The origin of pattern information of an apparently movingobject during stroboscopic motion. Percept Psychophys 30, 357–61.
Vorberg, D., Mattler, U., Heinecke, A., Schmidt, T., and Schwarzbach, J. (2003). Different timecourses for visual perception and action priming. Proc Natl Acad Sci USA 100, 6275–80.
REFERENCES 357
Vorberg, D., Mattler, U., Heinecke, A., Schmidt, T., and Schwarzbach (2004). Invarianttime course of priming with and without awareness. In Psychophysics Beyond Sensation.Laws and Invariants of Human Cognition (ed C. Kaernbach, E. Schröger, and H. Müller). Mahwah, NJ: Erlbaum, pp. 271–88.
Vrolijk, P.C. and van der Wildt, G.J. (1982). Propagating inhibition as a function of flashdiameter and duration. Vision Res 22, 401–6.
Vrolijk, P.C. and van der Wildt, G.J. (1985). Foveal inhibition measured with suprathresholdstimuli. Vision Res 25, 1413–21.
Wachtler, T., Sejnowski, T.J., and Albright, T.D. (2003). Representation of color stimuli inawake macaque primary visual cortex. Neuron 37, 681–91.
Wald, G. (1961). Retinal chemistry and the physiology of vision. In Visual Problems ofColor, Symposium, Vol. 1. New York: Chemical Publishing, pp. 15–67.
Wascher, E., Schatz, U., Kuder, T., and Vorleger, R. (2001). Validity and boundaryconditions of automatic response activation in the Simon task. J Exp Psychol HumPercept Perform 27, 731–51.
Watamaniuk, S.N. (1992). Visible persistence is reduced by fixed-trajectory motion but notby random motion. Perception 21, 791–802.
Watanabe, M. and Rodieck, R.W. (1989). Parasol and midget ganglion cells. J Comp Neurol361, 537–51.
Watanabe, T., Sasaki, Y., Miyauchi, S., et al. (1998). Attention-regulated activity in humanprimary visual cortex. J Neurophysiol 79, 2218–21.
Watson, A.B. and Ahumada, A.J. (1985). Model of human visual-motion sensing. J Opt SocAm A 2, 322–41.
Watson, A.B. and Nachmias, J. (1977). Patterns of temporal interaction in the detection ofgratings. Vision Res 17, 893–902.
Watt, T. (1988). Visual Processing. Hove: Erlbaum.
Wauschkuhn, B., Vorleger, R., Wascher, E., et al. (1998). Lateralised human cortical activityfor shifting visuospatial attention and initiating saccades. J Neurophysiol 80,2900–10.
Wehrhahn, C. and Dresp, B. (1998). Detection facilitation by collinear stimuli in humans:dependence on strength and sign of contrast. Vision Res 38, 423–8.
Weiskrantz, L. (1997). Consciousness Lost and Found. Oxford: Oxford University Press.
Weisstein, N. (1966). Backward masking and models of perceptual processing. J ExpPsychol 72, 232–40.
Weisstein, N. (1968). A Rashevsky–Landahl neural net: simulation of metacontrast. PsycholRev 75, 494–521.
Weisstein, N. (1971). W-shaped and U-shaped functions obtained for monoptic anddichoptic disk–disk masking. Percept Psychophys 9, 275–8.
Weisstein, N. (1972). Metacontrast. In Handbook of Sensory Physiology. Vol. 7/4, VisualPsychophysics (ed D. Jameson and L.M. Hurvich). New York: Springer, pp. 233–72.
Weisstein, N. and Growney, R. (1969). Apparent movement and metacontrast: a note onKahneman’s formulation. PerceptPsychophys 5, 321–8.
Weisstein, N. and Haber, R.N. (1965). A U-shaped backward masking function. PsychonSci 2, 75–6.
REFERENCES358
Weisstein, N. and Harris, C. (1974). Visual detection of line segments: an object superior-ity effect. Science 186, 752–5.
Weisstein, N. and Maguire, W. (1978). Computing the next step: psychophysical measuresof representation and interpretation. In Computer Vision Systems (ed A.R. Hanson andE.M. Riseman). New York: Academic Press, pp. 243–60.
Weisstein, N., Jurkens, T., and Onderisin, T. (1970). Effect of forced-choice vs.magnitude-estimation measures on the waveform of metacontrast functions. J OptSoc Am 60, 978–80.
Weisstein, N., Harris, C., and Ruddy, M. (1973). An object superiority effect. Bull PsychonSoc 2, 324.
Weisstein, N., Ozog, G., and Szoc, R. (1975). A comparison and elaboration of two modelsof metacontrast. Psychol Rev 82, 325–43.
Werner, H. (1935). Studies of contour. I: Qualitative analysis. Am J Psychol 47, 40–64.
Werner, H. (1940). Studies on contour strobostereoscopic phenomena. Am J Psychol 53,418–22.
Wertheim, T. (1894). Über die indirekte Sehschärfe. Zeitschr Psychol Physiol Sinnesorg7, 112–89.
Wertheimer, M. (1912). Experimentelle Studien über das Sehen von Bewegung. ZeitschrPsychol 61, 161–265.
Westendorf, D.H. (1989). Binocular rivalry and dichoptic masking: suppressed stimuli do not mask stimuli in a dominating eye. J Exp Psychol Hum Percept Perform15, 485–92.
Westerink, J. and Teunissen, K. (1995). Perceived sharpness in complex moving images.Displays, 2, 89–97.
Westheimer, G. (1967). Spatial interaction in human cone vision. J Physiol 190, 139–54.
Westheimer, G. (1968). Bleached rhodopsin and retinal interaction. J Physiol 195,97–106.
Westheimer, G. (1970). Rod–cone independence for sensitizing interaction in the humanretina. J Physiol 206, 109–16.
Westheimer, G. and Hauske, G. (1975). Temporal and spatial interference with Vernieracuity. Vision Res 15, 1137–41.
Whalen, P.J., Rauch, S.L., Etcoff, N.L., McInerney, S.C., Lee, M.B., and Jenike, M.A. (1998).Masked presentations of emotional facial expressions modulate amygdala activitywithout explicit knowledge. J Neurosci 18, 411–18.
Wheeler, D.D. (1970). Processes in word recognition. Cogn Psychol 1, 59–85.
Wiesel, T.N. and Hubel, D.H. (1966). Spatial and chromatic interactions in the lateralgeniculate body of the rhesus monkey. J Neurophysiol 29, 1115–56.
Wilke, M., Logothetis, N.K., and Leopold, D.A. (2003). Generalized flash suppression ofsalient visual targets. Neuron 39, 1043–52.
Williams, A. and Weisstein, N. (1978). Line segments are perceived better in a coherentcontext than alone: an object-line effect in visual perception. Mem Cognit 6, 85–90.
Williams, M.A., Morris, A.P., McGlone, F., Abbott, D.F., and Mattingley, J.B. (2004).Amygdala responses to fearful and hapy facial expressions under condtions ofbinocular suppression. J Neurosci 24, 2898–904.
REFERENCES 359
Williams, M.C. and LeCluyse, K. (1990). Perceptual consequences of a temporal processingdeficit in reading disabled children. J Am Optom Assoc 61, 111–21.
Williams, M.C. and Weisstein, N. (1980). Perceptual grouping produces spatial frequencyspecific effects on metacontrast. Paper presented at the Annual Annual Meeting of theAssociation for Research in Vision and Ophthalmology, Orlando, FL, May 1980.
Williams, M.C. and Weisstein, N. (1981). Spatial frequency response and perceived depthin the time-course of object superiority. Vision Res 21, 631–46.
Williams, M.C., Molinet, K., and LeCluyse, K. (1989). Visual masking as a measure oftemporal processing in normal and disabled readers. Clin Vision Sci 4, 137–44.
Williams, M.C., LeCluyse, K., and Bologna, N. (1990). Masking by light as a measure ofvisual integration time in normal and disabled readers. Clin Vision Sci 5, 335–43.
Williams, M.C., Breitmeyer, B.G., Lovegrove, W.J., and Gutierrez, C. (1991). Metacontrastwith masks varying in spatial frequency and wavelength. Vision Res 31, 2017–23.
Williams, M.J., Stuart, G.W., Castles, A., and McAnnaly, K.I. (2003). Contrast sensitivity insubgroups of developmental dyslexia. Vision Res 43, 467–77.
Williamson, S.J., Kaufman, L., and Brenner, D. (1977). Magnetic fields of the humanbrain. Naval Res Rev 30, 1–18.
Williamson, S.J., Kaufman, L., and Brenner, D. (1978). Latency of the neuromagneticresponse of the human visual cortex. Vision Res 18, 107–10.
Wilson, H.R. (1980). Spatiotemporal characterization of a transient mechanism in thehuman visual system. Vision Res 20, 443–52.
Wilson, A.E. and Johnson, R.M. (1985). Transposition in backward masking: the case ofthe traveling gap. Vision Res 25, 283–8.
Wolf, J.M., Chun, M.M., and Friedman-Hill, S.R. (1995). Making use of texton gradients:visual search and perceptual grouping exploit the same parallel processes in differentways. In Early Vision and Beyond (ed T.V. Papathomas, C. Chubb, A. Gorea, and E. Kowler). Cambridge, MA: MIT Press, pp. 189–97.
Wong, P.S. and Root, J.C. (2003). Dynamic variations in affective priming. Conscious Cogn12, 147–68.
Woodman, G.F. and Luck, S.J. (1999). Electrophysiological measurement of rapid shifts ofattention during visual search. Nature 400, 867–9.
Woodman, G.F. and Luck, S.J. (2003). Dissociations among attention, perception,awareness during object-substitutiion masking. Psychol Sci 14, 605–11.
Wundt, W. (1899). Zur Kritik tachistoskopischer Versuche I. Philos Stud 15, 287–317.
Wundt, W. (1900). Zur Kritik tachistoskopischer Versuche II. Philos Stud 16, 61–81.
Wynn, J.K., Light, G.K., Breitmeyer, B., Nuechterlein, K.H., and Green, M.F. (2005).Event-related gamma activity in schizophrenia patients during a visual backwardmasking task. Am J Psychiatry 162, 2330–6.
Xiao, Y., Wang, Y., and Felleman, D.J. (2003). A spatially organized representation ofcolour in macaque cortical area V2. Nature 421, 535–9.
Yabuta, N.H. and Callaway, E.M. (1998). Functional streams and local connections of layer4C neurons in primary visual cortex of the macaque monkey. J Neurosci 18, 9489–99.
Yantis, S. and Nakama, T. (1998). Visual interactions in the path of apparent motion. NatNeurosci 1, 508–12.
REFERENCES360

Yellott, J.I., Jr. and Wandell, B.A. (1976). Color properties of the contrast flasheffect:monoptic vs. dichoptic comparisons. Vision Res 16, 1275–80.
Yeshurun, Y. (2004). Isoluminant stimuli and red background attenuate the effects oftransient spatial attention on temporal resolution. Vision Res 44, 1375–87.
Yeshurun, Y. and Levy, L. (2003). Transient spatial attention degrades temporal resolution.Psychol Sci 14, 225–31.
Zeki, S. (1993). A Vision of the Brain. Oxford: Blackwell Science.
Zeki, S. (1997). The color and motion systems as guides to conscious visual perception. InCerebral Cortex. Vol. 12, Extrastriate Cortex of Primates (ed K.S. Rockland, J.H. Kaas,and A. Peters). New York: Plenum Press, pp. 777–809.
Zeki, S. (1999). Inner Vision. Oxford: Oxford University Press.
Zimba, L.D. and Blake, R. (1983). Binocular rivalry and semantic processing: out of sight,out of mind. J Exp Psychol Hum Percept Perform 9, 807–15.
Zöllner, F. (1862). Über eine neue Art anorthoskopischer Zerrbilder. Ann Phys Chem 27,477–84.
REFERENCES 361

This page intentionally left blank
Index
access consciousness 247, 272activity normalization 180adaptation 20–21, 22
level 53–54see also background intensitytemporal 181
additive equations 179, 184, 185,301–303
additive (leaky-integrator) model 179after-image, positive 11, 12, 20, 23
homophotic/metaphotic 11amblyopia 37, 288–289, 295
and metacontrast 288Anbar and Anbar, visual masking model
304–305, 306apparent motion 102, 109, 259
see also phi motion; stroboscopic motion
apperception 28area suppression 44attention 18, 27, 28, 37, 72
and consciousness 253, 269feature-based 246, 250figural context and 235–251and figural grouping 206, 248–249and masking 130and metacontrast 19, 243, 248–249object-based 243, 246, 248, 250space-based 243–246, 248, 250spatial 19, 131, 133, 208, 249unconscious processing and 269–272
attentional blink (AB) 37, 247, 272attentional interruption 247awareness 37, 272
Bachmann’s perceptual retouch model124–129, 177
background color 59–66, 205and magnocellular (M) activity 65and metacontrast 63
background intensitysee also adaptation, leveland metacontrast 53and two-process model of
metacontrast 115background luminance 53–54, 77,
154, 204background wavelength 205
backward masking 5, 19–20, 24, 26–27, 34,52, 66–73
by light 20, 29by noise 196by overlapping patterns 94–95by pattern 198by structure 196object substitution and type B 129–132types of 166
backward masking functionsinverted type A 114type B 114, 126, 197
backward pattern masking 36, 245effects 95in frontal eye field 89–90functional magnetic resonance imaging
(fMRI) studies 93–95, 97and noise masking 76in temporal cortex 90–92
backward structure masking 79behavioral target visibilities 86fBidwell’s ghost 9, 10, 11, 17
mechanism for suppression of 100and visual persistence 24
binocular rivalry, metacontrast and 272–275
binocular vision 26, 58biochemical dynamics 180blindness 246
metacontrast induced 272–277motion-induced 275–277
blindsight 254, 258, 259, 264, 270, 271Bloch’s law 48, 153blocking mask 306blocking target 306blur, image 203blurring 203, 215, 219, 224boundary contour system (BCS) 44, 134–138,
139, 264Breitmeyer and Ganz’s sustained/transient
dual-channel model 164–168, 212,215–216
Bridgeman’s Hartline-Ratliff inhibitorynetwork model 116–121, 139,214, 302
brightness 8, 23, 63, 83brightness contrast 110brightness discrimination trials 82
INDEX364
brightness suppression 12, 56, 113, 199in metacontrast 69, 202in paracontrast 40, 69, 112in stroboscopic motion 199
Broca-Sulzer effect 20Burr’s spatiotemporal receptive-field model
107–109
center-surround organization 181–182see also receptive fields
central attentional mechanisms 246–248channels
sustained 124, 203transient 124, 203
Charpentier bands 9, 10f, 17, 100, 220and visual persistence 24
chromatic interactions see cone-coneinteractions; rod-cone interactions
cognitive masking 28color 25
and metacontrast 13, 63perception and identification of objects
264–269and unconscious priming 267–269, 284see also wavelength
common-onset masking 71–73, 208, 247, 248object substitution and 132–133
computer simulations 185conduction velocity 3cone–cone interactions 59–66, 100
see also rod–cone interactionscone–rod interactions see rod–cone
interactionscongruency effects 267connectedness 238, 239f, 250constancy assumption 6context effects 250
see also connectedness; figural context;object superiority
contextual modulation 70, 241contour interactions 130, 174–178contour masking, type B 199contour proximity 130, 131contour visibility 43contrast
simultaneous 7, 110spatial 7successive 7see also stimulus contrast
contrast reversal 79, 128, 156contrast sensitivity 149, 153
flicker and pattern thresholds 150–151spatiotemporal 147–155
contrast threshold 147, 149contrast visibility 43cortical contour networks 185cortical mechanisms 93
cortical pathways 143–144cortical visually evoked potentials (CVEPs)
92, 150, 159, 293Crawford effect 20criterion content 40–41, 43, 46, 47,
77, 79n, 90criterion-free (thresholds) 216ncritical flicker fusion (CFF) 8, 9, 25, 186, 187
see also flickercyclopean (vision), and metacontrast 57–58
dark adaptation 20, 21, 22, 53delay hypothesis (overtake) 11, 100, 101,
124–129depth rating 238, 239fdetection criterion 46dichoptic metacontrast 12, 16, 30n, 57–58, 62,
100, 273, 274dichoptic viewing 34
and metacontrast 48and paracontrast 43
difference functions 87direct parameter specification (DPS)
theory 265disinhibition see target recoverydisplay parameters 32dorsal pathway 143, 144, 145, 146fdouble dissociation 258, 259drugs 38dual-channel activation hypothesis 124–129duration see stimulus durationduration–contrast reciprocity 153, 161dyslexia 287, 292
evoked potentials 92–93excitatory input 179, 180, 301, 302eye dominance 73
FACADE model 264facial superiority 242facilitatory effects 175, 177, 242feature contour system (FCS) 44, 264feature inheritance 19, 47, 69–71, 79
see also shine-throughfeature migration 19, 47feature transposition 19feature-based attention 246feedback 87, 168feedback dominant phase 169feedback inhibition 208feedforward 87, 168, 169feedforward dominant phase 169Ferry–Porter law 187, 204figural context, and attention 235–251figural grouping, role in metacontrast
248–249figure–ground segmentation 37
figure-ground segregation 85flash suppression 275–277, 298
see also blindnessflicker 8, 9, 150
and paracontrast 9and persistence 8see also critical flicker fusion
flicker adaptation 206transient and 161–164
flicker channels, spatial response profiles151–152
flicker threshold 217nflicker-detectors 9forced-choice contour discrimination 42form
perception and identification of objects264–269
unconscious priming 265–267forward lateral masking effects 106forward masking 5, 34, 40–43
dichoptic type A 196types of 165–166
four-dot masking 130, 131, 132, 208fovea 199
and metacontrast 199frontal eye field (FEF), backward pattern
masking in 89–90functional hierarchy 299functional magnetic resonance imaging
(fMRI) 93–95, 97fusion velocity 204
gain control 180–181, 182ganglion cells 142Ganz’s interactive trace decay and random
encoding time model 110–112, 116gap inheritance 69gap location tasks 94generalized flash suppression 276gestalt 70, 108, 249, 250
formation 109grouping 37, 133, 244f, 248rules 235
grouping 242gestalt 37, 133, 244f, 248perceptual 37
Hartline-Ratliff model 116–121, 139, 214, 302Hering-type lateral inhibition 44history
of masking by light 19–23of meta- and paracontrast 5–19and perceptual stage analysis 3of visual masking 1–30of visual persistence 24
Hodgkin-Huxley equation 179, 301homophotic image 11
horizontal cells 100and metacontrast 12
hue substitution 63, 64, 66, 78, 204see also isoluminance; isoluminant borders
hypercomplex cells 136
icon 28see also persistence
iconic memory 28, 247iconic persistence 23–24, 28, 207impulse response 154, 155inattentional blindness 246inferior temporal cortex (IT) 90, 91inhibition 125inhibition-based models 227–231inhibitory input 179, 301integration 179
temporal 180see also persistence
integration hypothesis 30nintegration and interruption model 114–115integration–inhibition hypothesis 12, 14intensity see background intensity; stimulus
intensityinter-channel inhibition 109, 165, 166,
167, 198see also sustained-on-transient inhibition;
transient-on-sustained inhibitioninteractive trace decay and random encoding
time model 110–112interference effects 262interocular effects see dichoptic viewinginterruption 114, 247interstimulus interval (ISI) 26, 47, 48intra-channel inhibition 165, 166, 173,
191, 194see also sustained-on-sustained inhibition
isoluminance 65isoluminant borders 66, 78
Kahneman’s impossible stroboscopic motionmodel 102–104, 205
latencylateral inhibition 214of neuromagnetic response 160perceptual 3processing 144–145and spatial frequency 160, 203of sustained/transient channels 165transduction 3transmission 144–145
lateral geniculate nucleus (LGN) 81, 125, 142lateral inhibition 55, 116, 133, 135, 139, 214,
304–305Hering-type 44Mach-type 44
INDEX 365
lateral inhibitory interactionsand horizontal cells 100
lateral masking 29, 99leaky-integrator (additive) model 179learning 47light adaptation 20, 21, 22, 23, 25, 120, 187limits of consciousness 29Lissajous figure 26, 27local signs 6location
retinal 18, 56stimulus 56–57
luminance 20, 53–54, 77, 83, 115, 154, 204
Mach-type lateral inhibition 44magnocellular (M) pathways 65, 108, 183, 184mask, definition 2mask blocking 306mask-to-target (M/T)
contrast ratio 42, 262duration ratio 48, 49energy ratio 48, 49, 50, 51–52, 53, 74
maskingattentional effects 243–248backward see backward maskingby gain control 180–181, 182by inhibition 179, 182by integration 179, 182, 279by light 19–23, 29, 188, 189by noise 33, 73–76, 77, 78by normalization 179by structure 33f, 34, 73–76, 77, 78, 82–88common-onset 71–73, 132–133, 208dichoptic 34, 78, 101forward 34, 40–43models 99–140, 301–306monoptic 60–61phenomenology of 38–39
masking by pattern 33, 85, 188, 189applications and uses of 36–38noise and structure masks 73–76, 115
masking functions 47backward 34, 35fbimodal 35f, 41forward 34, 35fmonotonic 34monotonic type A 34, 89multimodal 35fnon-monotonic 34oscillatory 35ftype A 34, 35f, 78, 96type B 34, 35f, 96type B U-shaped 48, 114U-shaped 16, 34, 53, 248, 306U-shaped backward 305, 306unimodal 35f
masking of light by light 188
masking models, mathematical aspects of301–306
masking of pattern by light 188masking threshold 194Matin’s three-neuron model 104–107,
204, 213metacontrast 38, 43–66, 297
and amblyopia 288and attention 243, 248and background intensity 53and backward masking 66–73and binocular rivalry suppression 272–275and color 63and cortical visual evoked potential
(CVEP) 92criterion content in 260cyclopean 57–58definition 5dichoptic 12, 16, 30n, 57–58, 62, 100, 273effects of stimulus wavelength on 64–65flash suppression and motion-induced
blindness 275–277and flicker adaptation 206foveal 16, 56, 57, 199as functions of SOA 50, 51fhistory of 5–19and hue substitution 63, 66and induced blindness 272–277masking performance in SRD and normal
readers 294–295, 296monoptic 57motion deblurring and 220–231and motion perception 219–233and paracontrast 5–19parafoveal 15, 56and pattern masking by structure in V1
82–88and reaction time 46, 201role of attention and figural grouping in
248–249sequential 67and simple detection 44, 46stereoscopic 58and stimulus onset asynchrony 45and stimulus size 55, 78and stroboscopic motion 18, 102, 103suppression 56, 186, 202, 254–259, 272, 274sustained/transient channels 65target recovery 255and target-mask energy ratio 48, 49and target-mask spatial separation 56–57,
199, 223task parameters and criterion content
43–47, 55transition from type B to type A 194–195trials 82, 83type A 105
INDEX366
type B 16, 64, 65, 198in V4 88VEP studies 92–93
metacontrast contour masking 202metacontrast functions 240f
for foveally and peripherally presentedstimuli 294
in normal and schizophrenic subjects291, 295
oscillatory 53, 119type B 44, 45, 56, 57, 62, 77, 79n, 105, 203U-shaped 54, 57
metaphotic image 11, 12, 23microgenesis 29, 32, 33, 277microtomization see temporal slicingmodels
lumping 181unlumping 173, 174–178, 181, 192
models of visual masking 99–140Anbar and Anbar’s 304–305, 306Bachmann’s perceptual retouch
124–129, 177boundary contour system (BCS) 44,
134–138, 139Breitmeyer and Ganz’s sustained/transient
dual-channels 164–168, 212, 215–216Bridgeman’s Hartline-Ratliff inhibitory
network 116–121, 139, 214, 302Burr’s spatiotemporal receptive-fields
107–109Di Lollo and Enn’s object substitution
129–132Ganz’s interactive trace decay and random
encoding time 110–112, 116Kahneman’s impossible stroboscopic
motion 102–104, 205Matin’s three-neuron model 104–107,
204, 213Navon and Purcell’s integration and
interruption model 114–115, 116object-substitution models 129–133Ögmen’s retino-cortical dynamics
(RECOD) neural network see RECODmodel
Reeve’s temporal integration andsegregation model 112–114, 115
spatiotemporal sequence 102–109Weisstein’s Rashevsky–Landahl two-factor
neural network 121–123, 139, 212, 302monocular vision 26monoptic viewing 57–58, 197motion
blurring 219, 224explosive 18, 38, 39f, 259form-cue invariant 232phi 17–18, 68, 232split 38, 39, 102, 103, 104
stroboscopic 17, 18, 68, 102–103, 104, 199,202
motion deblurring 219effect of exposure duration on 224inhibition-based models 227–231mechanisms 223–231and metacontrast 220–231motion estimation–compensation models
224–227motion estimation–compensation models
224–227motion perception, metacontrast and
219–233motion smear 220–223motion-induced blindness 275–277, 299multi-unit activity (MUA) 86, 87multiplicative inhibition 180multiplicative (shunting) equation 179, 183,
301–303multiplicative model see shunting model
Navon and Purcell’s integration andinterruption model 114–115, 116
neural activity 284–285nneural-network models 214neuroelectric response 159neurological patients, visual masking in
289–292neuromagnetic response 160normalization 179
object location, unconscious processing of259–264
object substitution 101, 247and common-onset masking 132–133and type B backward masking 129–132
object substitution models 129–133object superiority 236f, 242, 250
see also connectedness; context effects;figural context
object-based attention 243, 246, 248, 250Ögmen’s retino-cortical dynamics neural
network model see RECOD modelonset–onset law 13, 47oscillations, spatiotemporal 117overtake hypothesis 11, 100, 101, 124–129overtake–inhibition hypothesis 12, 14
paracontrast 40–43criterion content in 40–41dichoptic 43as flicker suppression 9history of 5–19and intra-channel inhibition 191metacontrast and 5–19and reaction time 201reaction times for target localization 201
INDEX 367

paracontrast (cont.)target localization 260and target-mask spatial separation 40type A 40type B 40, 106, 191in V4 88VEP studies 92–93
paracontrast suppression 176, 186parvocellular/magnocellular pathways
141–164afferent 142–143
parvocellular/P pathway 65, 108, 181–183pattern channels, spatial response profiles
151–152pattern discrimination tasks 200pattern masking see masking by patternpattern recognition 238pattern thresholds 150, 216nPearson r coefficient 118fpercept-dependent activity 284nperception 4, 19, 28, 37perception time 29perceptual context, and grouping 236–243perceptual latency 3perceptual retouch model 124–129, 177, 249perceptual stages 3persistence 23, 24, 25, 26, 28, 113, 134, 162,
207, 219, 220see also icon; iconic memory
phenomenal consciousness 247, 272phi motion 17–18, 68, 232
see also apparent motion; stroboscopicmotion
photopic luminance 190positive after-image 11, 12, 20, 23post-iconic processing 247post-retinal cells 183
sustained 183transient 184
post-retinal inhibitory interneurons 184post-retinal network, parameters 308tposterior contralateral negativity (PCN) 271preattentive process 28previsible persistence 24, 26primary sensation 10psychiatric patients, visual masking in
289–292pulvinar 258Purkinje image see Bidwell’s ghost
quadratic non-linearity, with threshold andpersistence 182–183
rapid serial visual presentation (RSVP) 37Rashevsky-Landahl equations 302Rashevsky’s two-factor neuron model
equations 122–123
reaction times 36, 66, 103, 154, 157f, 262changes due to contour interactions 201and cortical visual evoked potential
(CVEP) 159and metacontrast 45, 46and neuromagnetic response 160and paracontrast 262and sustained/transient channels 154to gratings 162, 163fto stimuli activating achromatic and
chromatic systems 158–159to target detection during
metacontrast 260to vertical sine wave gratings 158unconscious priming effects 270
reading 27reading disability, visual masking in subjects
with specific 292–295receptive fields 107, 175
see also center-surround organizationreceptor responses, interactions among 100RECOD model 96, 124, 139, 168–185,
213–214, 216, 258, 259architecture of 170, 172fexplanations 186–211mathematical basis 178–185parameters of 307–308parameters for the retinal network 307tpost-retinal network 308tresponse to single moving dot stimulus
227–229response to two-dot paradigm 229–231simulation study 227–231sub-cortical network 308ttarget recovery 260unlumping 174, 175f
recurrent see feedbackreentrant see feedbackReeve’s temporal integration and segregation
model 112–114, 115reset mechanisms 215, 218nreset phase 169, 173reticular complex 127retinal cells
with sustained activities 181–183with transient activities 183
retinal locus 56, 57retinal network parameters 307tretino-cortical dynamics neural network
model see RECOD modelretino-geniculate-cortical pathway 164, 216nripple effect 217nrod–cone interactions 17, 59–66, 100
see also cone–cone interactions
saccadic suppression 260, 298schizophrenia 38, 287, 288, 290–291
INDEX368
scotoma 271, 298scotopic luminance 190seeing-more-than-there-is 25sensation time 29sensory persistence hypothesis 20sensory response persistence, and temporal
integration in vision 23–29sequential blanking 15f, 30f, 67–68, 93,
207, 223shape discrimination tasks 90shifter-circuit model 224shine-through 53, 69–71, 79
see also feature inheritanceshunting (multiplicative) equation 179, 183,
184, 301–303shunting model 301signal-to-noise ratio 126, 214single-transient masking 107, 203size see stimulus sizeSOA law see onset–onset lawspace-based attention 243–246, 248, 250spatial center–surround organization
181–182spatial frequency 148, 149, 158, 203
and latency 160, 203see also stimulus size
spatial frequency contrast sensitivity 153spatial inhibition see lateral inhibitionspatiotemporal contrast sensitivity
147–155spatiotemporal receptive-field model
107–109spatiotemporal sequence models 102–109specific flash suppression 276specific reading disability (SRD) 287, 288standing-wave illusion 19, 57, 68–69step visual response function (VRF) 304stimulus contrast 47–53
polarity 54–55stimulus duration 26, 47–53stimulus energy 48stimulus intensity 47–53stimulus location 56–57stimulus luminances 77, 115, 204stimulus onset asynchrony (SOA) 8, 32, 42,
46, 48, 49, 52and metacontrast 38, 45and paracontrast 40, 41
stimulus orientation 55–56stimulus parameters 32, 82stimulus separation 56–57stimulus size 55–56, 57, 78stimulus termination asynchrony (STA)
47, 48stimulus wavelength
effects on metacontrast 64–65variables 59–66
stroboscopic motion 17, 18, 68, 102–103, 104,199, 202
see also apparent motion; phi motionsub-cortical network 184–185sub-cortical network, parameters 308tsubjective contrast matching 42superior colliculus 258, 264, 271suppressive effects 105surface dynamics 174–178surface networks 185sustained, and transient channels 65, 145–164sustained-on-sustained inhibition 166
see also intra-channel inhibitionsustained-on-transient inhibition 184, 209
see also inter-channel inhibitionsustained/transient dual-channel model,
Breitmeyer and Ganz 164–168, 212,215–216
tachistoscopic techniques 4Talbot brightness 187, 188target blocking 306target localization, stimulus configurations
used in experiments 261target recovery 137, 187, 208, 254–259,
278–281target suppression 107, 203target visibility 209–211, 255target–mask asynchrony 166target–mask configuration 39ftarget–mask percepts 39ftarget-mask spatial separation 40, 56–57, 77
and metacontrast 56–57and paracontrast 40and retinal locus 57
target-to-mask (T/M) energy ratio 123targets
definition 2spatially embedding within a larger target
gestalt 241–243spatiotemporally grouping with mask
display 236–241TMS and the disinhibition or recovery of
visually masked targets 278–281task parameters 32, 55
and criterion content 43–47, 55techniques
brightness-matching 41, 154forced-choice 42rating 41
temporal adaptation 181temporal cortex, backward pattern masking in
90–92temporal integration 27, 91, 96, 180, 304
see also Bloch’s lawtemporal integration and segregation model
112–114
INDEX 369
temporal parameters 3temporal resolution 66, 97, 115temporal slicing 3time perception 29time sensation 29timing parameters 32transcranial magnetic stimulation
(TMS) 298and disinhibition or recovery of visually
masked targets 278–281masking of visual targets 277–281relation between visual masking and
282–283suppression of visual targets 277–278
transduction latency 3transient, and flicker adaptation 161–164transient channels 131, 187, 203, 207
sustained and 145–164transient M-channel deficit, in specific
disability 292–294transient-on-sustained inhibition 66, 173,
197, 208, 209see also inter-channel inhibition
transient-on-transient inhibition 201Troxler effect 277, 297two-factor neural network model,
Weisstein’s Rashevsky–Landahl 121–123,139, 212
two-process models, general criticism of115–116
two-pulse fusion threshold 206two-transient paradigm 203type of masking see masking function
U-shaped masking see masking functionunconscious priming
by color 267–269, 284by form 265–267, 284
unconscious processing 253–285and attention 269–272
of object location 259–264of object-identity information 264–269
unlumped model, with contour and surfacenetworks 184
V1 see visual cortex, primaryV4, paracontrast and metacontrast in 88ventral pathway 143, 264vision, conscious and unconscious 299visual cortex 253
extrastriate 93primary 82–88, 208, 242, 243, 254, 266striate 93
visual evoked potential (VEP) 289visual masking
definition 2methods of 33–35in neurological and psychiatric patients
289–292relation between transcranial magnetic
stimulation (TMS) and 282–283visual pattern masking, neurobiological
correlates of 81–97visual reaction time 155–161visual response function (VRF) 304, 305visual targets, masking by transcranial
magnetic stimulation 277–281visually evoked potentials (VEPs) 92–93
wavelength 25, 205, 268see also color
Weber ratio 189Weisstein’s Rashevsky–Landahl two-factor
neural network model 121–123, 139,212, 302
word-superiority effect 236
X neurons (sustained) 104, 140n
Y neurons (transient) 104, 140n
INDEX370
Note: Locators followed by f indicate figures (86f ), n indicates chapter notes (79n) and t indicatestables (308t).