Embed Size (px)
Citation preview

Visual Economic Tool FAQ
What is Opportunity Rate?The Visual Economic Tool discounts
future costs to put all values in terms of
their present value in todays dollars. This
is done using the Opportunity Rate to
discount future sums. This accounts for
the ‘time value of money’ allowing
comparison of cash flows from different
years.
Why Do Energy Costs Go Down
Overtime? Even if you have an Electricity Escalation
rate, when you look at the System
Operating Cost Chart, you will probably
see that the green section of the chart
gets smaller each year. This is because
the values in the chart are present
values, meaning the future costs have
been discounted based on the
opportunity rate. You can see your future
value annual cost increase in the center
column of the ‘Yearly Cost Summary’
section. You could also temporarily set
your opportunity rate to zero to prevent
future costs from being discounted.
How Are Maintenance Costs
Determined?Maintenance costs are incurred anytime
a luminaire is cleaned or a lamp or
ballast are replaced. The labor cost is
dependent on the labor rate, and the
time it takes to perform the labor. In
addition to the cost of labor, there may
also be a cost to replace and dispose of
the failed lamp or ballast.
There are 3 relamping strategies which
effect the timing of lamp and ballast
replacement.
• Spot calculates an average quantity
to replace every year based on
lifetime using a formula from RP-31
• Group (custom) let’s you enter an
interval and a percentage to replace.
• Replace all at rated life does a 100%
replacement in the year closest to
the rated life.
You can view the average percentage of
rated life of lamps in each system in the
Lamp Life chart. Remember that rated
life for most lamps is the hours of
operation where 50% of the lamps will
have failed.
Why Is My LED Being Replaced?When using spot (annual), a typical rate of
replacement is calculated and used every
year based on the recommendations of
RP-31.
# Annual Replaced= (# Lamps) / (lamp life / operation hours)
So if you had a 100, 100,000 hour LED
luminaires, running 24 hours a day, using
the formula above, the average annual
replacement would be 8.76 starting year
one. Using this average rate, no lamp will
be in service past its rated life. You can
change your relamping strategy to a
schedule of your if you wish.
What Is Life Cycle Cost?The Life Cycle Cost reported in the green
bar in each system is the result of the
initial cost of a lighting system including
new luminaires, controls, and their
installation, as well as the accumulated
present value of energy, maintenance,
tax, and HVAC costs for every year during
the life cycle period you specify.

Visual Economic Tool FAQ
How Do I Enter An Existing
Luminaire?To include an existing, previously
installed, luminaire in your analysis
simply add it like you would any other
luminaire but be sure to leave the
luminaire Cost and Installation Time as 0.
You existing luminaire should also
typically be your Baseline System. This
will allow you to compare your other
systems purchase and operations costs
to the just the operation cost of the
existing luminaire.
Why Do I Not Have A Payback?If your proposed system costs more than
your baseline system, and has a higher
annual operating cost, it will never
‘payback’. If your proposed system costs
less than your baseline system it has
immediate ‘payback’. If your proposed
system costs more initially and has a
small annual savings, it may not reach
the ‘payback’ point during the life cycle.
Because the calculated cash flows are
used, no data is available past the life
cycle, so the economic tool will report
‘No Payback’.
What is Net Present Value?Net Present Value (NPV) prescribes a
value in today's dollar of making a
decision of one system over another.
NPV sums the discounted annual cash
flows over the life cycle of the system. A
typical retrofit system compared to an
existing system would have a large
negative cash flow initially, then positive
cash flows the following years as energy
and maintenance savings are realized.
The option with the highest NPV is the
most economically viable.
What is Internal Rate of Return?Internal Rate of Return (IRR) attempts to
remove the uncertainty in the
assumption of opportunity rate. The IRR
is the 'annualized effective compounded
return rate' or the rate of return that
makes all cash flows equal to zero. The
IRR is determined using an iterative
process similar to how the Excel IRR
function works. If an IRR is greater than
the 'owners cost of capital' than the IRR
indicates that this option is
economically viable.
What is Discounted Payback?Discounted payback uses discounted
(Present Value) cash flows to calculate
‘Payback’ instead of the ‘Future Values’
cash flows used in the Simple Payback
calculation.
How Are HVAC Cost Determined?HVAC cost are determined using the
method outlined in IES RP-31. This
method determines the number of
heating and cooling hours and then uses a
number of conversion factors to translate
the differences wattage between lighting
systems to heating savings and additional
cooling costs.
For projects where changes to HVAC
system components are included, the
‘New System’ type will also include
savings based on the sizing of HVAC
equipment based on reduced or increased
load. If you are working on a renovation
that does not include changes to the
HVAC system, use the ‘Existing’ type.
By default, HVAC costs are not included in
any lighting system.
If you have questions about HVAC cost
assumptions and calculation procedure
refer to IES RP-31-96

Visual Economic Tool FAQ
What Is Life Cycle Cost?
The Life Cycle Cost reported in the
green bar in each system is the
result of the initial cost of a
lighting system including new
luminaires, controls, and their
installation, as well as the
accumulated present value of
energy, maintenance, tax, and
HVAC costs for every year during
the life cycle period you specify.
The most expensive values are
displayed in RED, the least
expensive in GREEN. Section
headers are color coded to match
the charts.

Visual Economic Tool FAQ
What is Opportunity Rate?The Visual Economic Tool discounts
future costs to put all values in terms of
their present value in todays dollars. This
is done using the Opportunity Rate to
discount future sums. This accounts for
the ‘time value of money’ allowing
comparison of cash flows from different
years.
The opportunity rate discounts
(decreases) the value of costs that occur
in the future. This means that $1000
dollars now, will not be the same as
$1000 dollars in 5 years, and a $1000
dollars in 5 years will not be the same as
$1000 dollars in 6 years. Initial values are
incurred 'now' so they are not
discounted. Using the formula below, we
can calculate that with a opportunity
rate of 10%, in year 5 $1000 has a
present value of $620, and has a present
value of $564 in year 6.

Visual Economic Tool FAQ
Why Do I Not Have A
Payback?
If your proposed system costs
more than your baseline system,
and has a higher annual operating
cost, it will never ‘payback’. If your
proposed system costs less than
your baseline system it has
immediate ‘payback’. If your
proposed system costs more
initially and has a small annual
savings, it may not reach the
‘payback’ point during the life
cycle. Because the calculated cash
flows are used, no data is available
past the life cycle, so the economic
tool will report ‘No Payback’.

Visual Economic Tool FAQ
What is Discounted Payback?
Discounted payback uses
discounted (Present Value) cash
flows to calculate ‘Payback’ instead
of the ‘Future Values’ cash flows
used in the Simple Payback
calculation.

Visual Economic Tool FAQ
Why Do Energy Costs Go
Down Overtime?
Even if you have an Electricity
Escalation rate, when you look at
the System Operating Cost Chart,
you will probably see that the
green section of the chart gets
smaller each year. This is because
the values in the chart are present
values, meaning the future costs
have been discounted based on
the opportunity rate. You can see
your future value annual cost
increase in the center column of
the ‘Yearly Cost Summary’ section.
You could also temporarily set your
opportunity rate to zero to prevent
future costs from being
discounted.

Visual Economic Tool FAQ
How Are Maintenance Costs
Determined?Maintenance costs are incurred anytime
a luminaire is cleaned or a lamp or
ballast are replaced. The labor cost is
dependent on the labor rate, and the
time it takes to perform the labor. In
addition to the cost of labor, there may
also be a cost to replace and dispose of
the failed lamp or ballast.
There are 3 relamping strategies which
effect the timing of lamp and ballast
replacement.
• Spot calculates an average quantity to
replace every year based on lifetime
using a formula from RP-31
• Group (custom) let’s you enter an
interval and a percentage to replace.
• Replace all at rated life does a 100%
replacement in the year closest to the
rated life.
You can view the average percentage of
rated life of lamps in each system in the
Lamp Life chart. Remember that rated
life for most lamps is the hours of
operation where 50% of the lamps will
have failed.
Visual Economic Tool FAQ
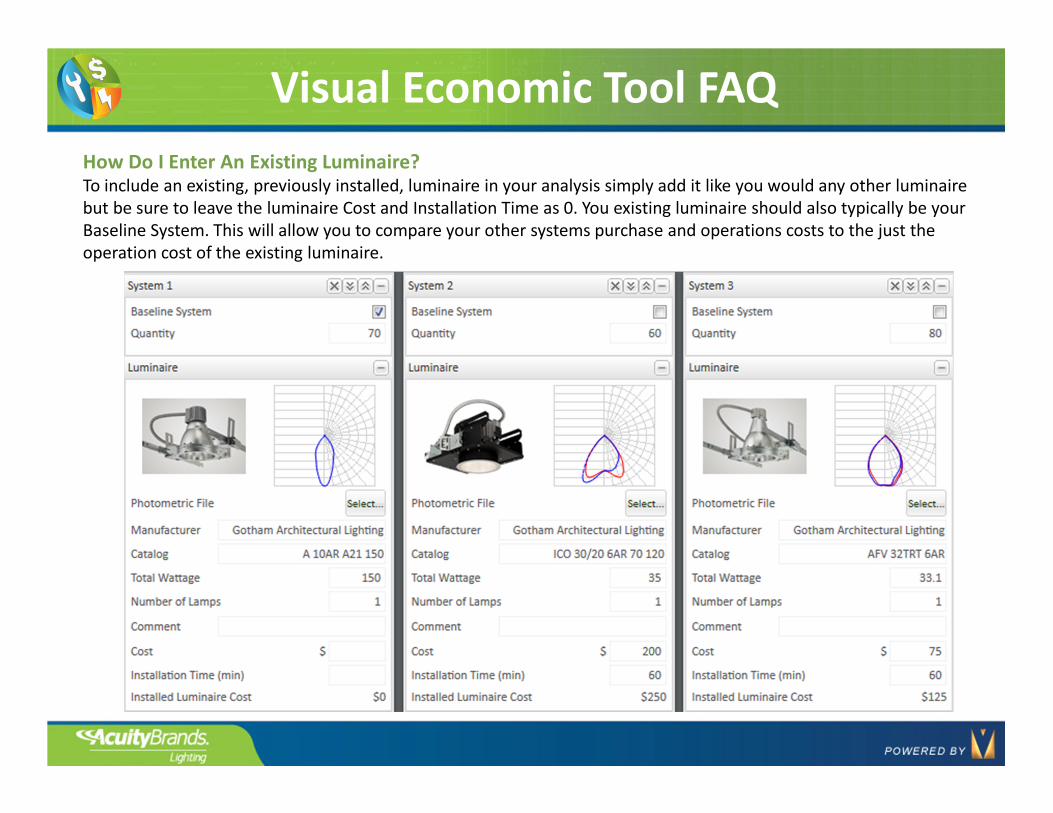
How Do I Enter An Existing Luminaire?
To include an existing, previously installed, luminaire in your analysis simply add it like you would any other luminaire
but be sure to leave the luminaire Cost and Installation Time as 0. You existing luminaire should also typically be your
Baseline System. This will allow you to compare your other systems purchase and operations costs to the just the
operation cost of the existing luminaire.