Embed Size (px)
Citation preview
Singapore Management UniversityInstitutional Knowledge at Singapore Management University
Research Collection School Of Information Systems School of Information Systems
6-2008
Visual analytics for supporting entity relationshipdiscovery on text dataHanbo DAISingapore Management University
Ee Peng LIMSingapore Management University, [email protected]
Hady W. LAUWSingapore Management University, [email protected]
Hwee Hwa PANGSingapore Management University, [email protected]
DOI: https://doi.org/10.1007/978-3-540-69304-8_19
Follow this and additional works at: https://ink.library.smu.edu.sg/sis_researchPart of the Databases and Information Systems Commons, and the Numerical Analysis and
Scientific Computing Commons
This Conference Proceeding Article is brought to you for free and open access by the School of Information Systems at Institutional Knowledge atSingapore Management University. It has been accepted for inclusion in Research Collection School Of Information Systems by an authorizedadministrator of Institutional Knowledge at Singapore Management University. For more information, please email [email protected].
CitationDAI, Hanbo; LIM, Ee Peng; LAUW, Hady W.; and PANG, Hwee Hwa. Visual analytics for supporting entity relationship discovery ontext data. (2008). IEEE International Conference on Intelligence and Security Informatics, ISI 2008 Workshops: PAISI, PACCF, and SOCO2008, Taipei, Taiwan; 17 June 2008. 5075, 183-194. Research Collection School Of Information Systems.Available at: https://ink.library.smu.edu.sg/sis_research/292

Visual Analytics for Supporting EntityRelationship Discovery on Text Data
Hanbo Dai1 , Ee-Peng Lim1, Hady Wirawan Lauw1, and Hweehwa Pang2
1 School of Computer Engineering, Nanyang Technological University2 School of Information Systems, Singapore Management University
Abstract. To conduct content analysis over text data, one may lookout for important named objects and entities that refer to real worldinstances, synthesizing them into knowledge relevant to a given infor-mation seeking task. In this paper, we introduce a visual analytics toolcalled ER-Explorer to support such an analysis task. ER-Explorer con-sists of a data model known as TUBE and a set of data manipulationoperations specially designed for examining entities and relationships intext. As part of TUBE, a set of interestingness measures is defined tohelp exploring entities and their relationships. We illustrate the use ofER-Explorer in performing the task of finding associations between twogiven entities over a text data collection.
1 Introduction
1.1 Motivation
Information synthesis and analysis can be facilitated by a visual interface de-signed to support analytical processing and reasoning. Such an interactive vi-sualization approach is also known as visual analytics[1]. In this research, wespecifically focus on designing and implementing a visual analytics system tosupport the entity relationship discovery task that involves identifying entitiesand relationships from a document or a collection of documents so as to createa network of entities that are relevant to an entity relationship discovery task.
Consider the task of finding the person and organization entities that connecttwo terrorists from a given document collection. A domain expert will need aninteractive visual tool to help in extracting entities from the documents and therelationships among these entities, judging the relevance of these entities andrelationships by checking them up in documents containing them, and selectingthe relevant ones to be included in the results.
For a visual analytics system to support the above retrieval task, the followingsystem features are required.
– Network representation of information: Entity and relationship instances arebest represented using a graph or network, especially when path and con-nectivity properties of these instances are to be studied and visualized alongwith the documents containing them.

2 H. Dai et al.
– Interactive refinement of results: The above retrieval task, like many othersthat require expert judgement, will involve much user interaction in multipleiterations. Hence the visual analytics system will have to incorporate useroperations that may include or exclude entities and relationships from theretrieval results.
– Intelligent user assistance: Given the possibly large volume of document dataand many entity and relationship instances embedded in documents, userswill expect some intelligent assistance from the visual analytics system tohelp them gain more insight into the data. The exact form of assistance mayvery much depend on the task at hand. For example, entities (or relation-ships) may have to be ranked by their closeness to the two given terroristsso as to help user decision making.
The above are also the system features that distinguish visual analytic sys-tems from the other visual interface systems for analyzing networks of entityand relationship instances. In social network analysis, the state-of-art visual in-terface systems often assume that networks of entity and relationship instanceshave already been identified and verified, as well as can be studied separatelyfrom the documents containing them[2,6,7]. This assumption clearly does nothold for documents which are not pre-annotated. Even if the documents arealready pre-annotated, it is still challenging to determine the relevant entityand relationship instances. This often requires users to interpret text content indocuments containing these instances.
1.2 Research Objectives and Contributions
In this research, we therefore aim to design a visual analytic framework forentity relationship discovery under the assumption that (a) user judgement ondocument content is required for identifying relevant entity and relationshipinstances, and (b) the discovery is an iterative process with user involvement.
Our contribution in this paper can be summarized as follows:
– We present a visual analytics framework for discovering a network of re-lated entities found in text data. This framework consists mainly of a multi-dimensional data model and a visual interface tool for representing and ma-nipulating entity and relationship instances.
– We design a text cube representation of the entity and relationship instancesin document data. This representation, known as TUBE, supports semanticentity types, conceptual entity representation, inter-entity relationships andother data constructs useful for information analysis and synthesis.
– We develop a visual analytics system known as ER-Explorer to realize aset of user operations on a network of entities derived from a set of textdocuments so as to conduct entity relationship discovery.
– We illustrate our visual analytics system prototype using a case study wherethe entities and relationships linking two given entities can be discoveredthrough an interactive process.

Visual Analytics for Supporting Entity Relationship Discovery 3
1.3 Paper Organization
We organize the rest of the paper as follows. In Section 2, we cover the related re-search. In Section 3, our framework for entity relationship discovery using visualanalytics is presented. In Section 4, we describe the ER-Explorer, a visualiza-tion tool implemented based on our proposed framework. This is followed by acase study analysis in Section 5. We finally conclude the paper in Section 6.
2 Related Work
Visually analyzing social networks has been receiving growing attention and sev-eral visualization tools have been developed for this purpose. Vister[3] providesan environment to explore and analyze online social network, supporting au-tomatical identification and visualization of connections and community struc-tures. SocialAction[4] allows users to explore different social network analysismeasures to gain insights into the network properties, to filter nodes (represent-ing entities), and to find outliers. Users can interactively aggregate nodes toreduce complexity, find cohesive subgroups, and focus on communities of inter-est. However, the measures used in these systems are topological-oriented.
Xu and Chen [8] proposed a framework for automatic network analysis andvisualization. Their CrimeNet Explorer identifies relationships between personsbased on frequency of co-occurrence in crime incident summaries. Hierarchyclustering algorithm is then applied to partition the network based on relationalstrength.
The above systems while supporting network visualization, lack the measuresfor discovering associations among nodes. Their way of grouping entities is basedon centrality measure or relational strength, which does not allow user judgementand may fail to group semantically identical entities.
A visual analytic system Jigsaw[9] represents documents and their entitiesvisually in multiple views to illustrate connections between entities across thedifferent documents. It takes an incremental approach to suggest relevant re-ports to examine next by inspecting the co-occurred entities. However, it doesnot use measures other than frequency of entities in documents. When the listof co-occurred entities becomes very large, it would be quite cumbersome for ananalyst to find the interesting entities or documents, since considering the fre-quency measure alone may be restrictive. Moreover, in cases where co-occurrencerelationship between entity are not semantically meaningful, the analytics abilityof Jigsaw will be ineffective.
There is much research literature on path finding. Transitive association dis-covery was proposed to detect conceptual association graph in a text dataset[10].Interestingness measures based on co-occurrence are designed. A dynamic pro-gramming algorithm was developed to compute interesting paths of variouslengths from source to target entities. Document contexts of the paths are alsoprovided. People association finding in the ArnetMiner project[11] also aims todetect the good associations. Since the above approaches rely on algorithms to
4 H. Dai et al.
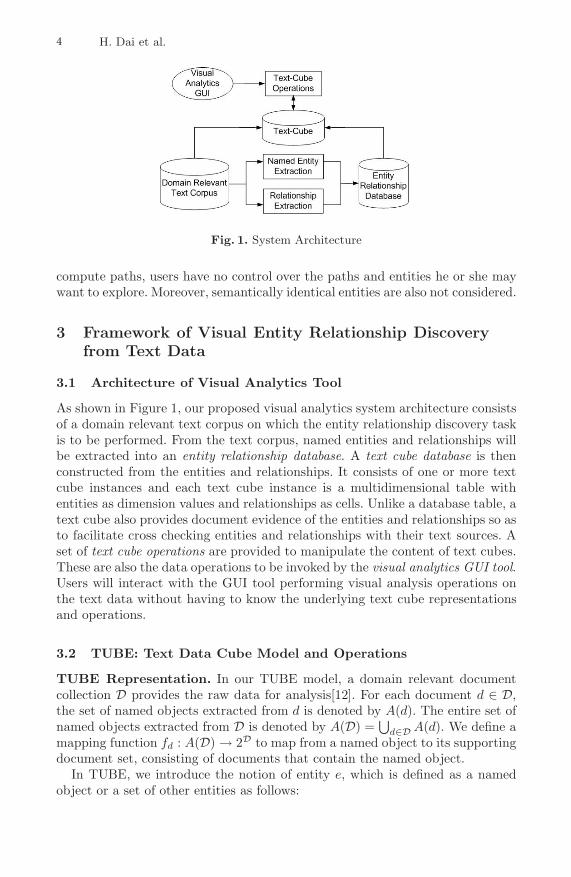
Fig. 1. System Architecture
compute paths, users have no control over the paths and entities he or she maywant to explore. Moreover, semantically identical entities are also not considered.
3 Framework of Visual Entity Relationship Discoveryfrom Text Data
3.1 Architecture of Visual Analytics Tool
As shown in Figure 1, our proposed visual analytics system architecture consistsof a domain relevant text corpus on which the entity relationship discovery taskis to be performed. From the text corpus, named entities and relationships willbe extracted into an entity relationship database. A text cube database is thenconstructed from the entities and relationships. It consists of one or more textcube instances and each text cube instance is a multidimensional table withentities as dimension values and relationships as cells. Unlike a database table, atext cube also provides document evidence of the entities and relationships so asto facilitate cross checking entities and relationships with their text sources. Aset of text cube operations are provided to manipulate the content of text cubes.These are also the data operations to be invoked by the visual analytics GUI tool.Users will interact with the GUI tool performing visual analysis operations onthe text data without having to know the underlying text cube representationsand operations.
3.2 TUBE: Text Data Cube Model and Operations
TUBE Representation. In our TUBE model, a domain relevant documentcollection D provides the raw data for analysis[12]. For each document d ∈ D,the set of named objects extracted from d is denoted by A(d). The entire set ofnamed objects extracted from D is denoted by A(D) =
⋃d∈D A(d). We define a
mapping function fd : A(D) → 2D to map from a named object to its supportingdocument set, consisting of documents that contain the named object.
In TUBE, we introduce the notion of entity e, which is defined as a namedobject or a set of other entities as follows:

Visual Analytics for Supporting Entity Relationship Discovery 5
e ={
a, a ∈ A(D){e1, e2, . . . , en}, ei is an entity.
We say a is a component of e, a ≺ e, if a = e or ∃ei ∈ e s.t. a ≺ ei. e is said tobe a conceptual entity if it is not a named object. The document evidence of e isdefined as fd(e) =
⋃a≺e fd(a).
We now define a n-dimensional TUBE as a tuple T = 〈S, B, M, D〉. S repre-sents the schema and S = {s1, s2, . . . , sn} where si denotes the list of entities ofdimension i. B is a mask with 0 or 1 values. M = {m1, m2, . . . , m|M|} is a set ofmeasures. Each mj is associated with a measure function mfj(). D represents adocument collection and D ⊆ D.
The TUBE T has |s1| × |s2| × . . . × |sn| cells. Each cell is denoted by c(e1, e2, . . . , en) where ei ∈ si for 1 ≤ i ≤ n. Without causing any ambiguity, wemay use c to denote a cell. A cell c is said to be present if B(c) = 1 or hiddenif B(c) = 0. The document evidence of c is defined by fd(c) =
⋂ni=1 fd(ei).
When fd(c) is not empty, we say that e1, . . . , en co-occur. This co-occurrencerelationship can be represented by c We also define the named object set of c asA(c) =
⋃ni=1
⋃a≺ei
{a}. The support value for a dk in fd(c) with respect to c isdefined by:
Sup(c, dk) =∑
a∈A(c) tfdk,a × idfa
where tfdk,a is the a’s frequency in dk
idfa = |D||fd(a)|
Given a cell c, c has a measure value c.mj = mfj(c) derived by applying themeasure function mfj.
TUBE Operations. We have also designed a set of operations on TUBE. Givena TUBE instance T = 〈S, B, M, D〉,
– Insert operation adds an entity to a selected dimension.– Remove operation removes an existing entity from a dimension.– SelectCell operation assigns 0 or 1 to a specified entry in B which corresponds
to a cell in T .– Cluster operation groups a subset of entities in a specified dimension into a
new conceptual entity and add this conceptual entity to that dimension.
TUBE Instances For Entity Relationship Discovery. Our entity relation-ship discovery uses two TUBE instances T1 and T2. T1 = 〈S1, B1, M1, D〉 andT2 = 〈S2, B2, M2, D〉 are 1-D and 2-D TUBE instances respectively. We initial-ize T1 to have S1 = {s1
1}, s11 = A(D) by Insert operation. In other words, T1 has a
dimension consisting of all named objects. T2 is initialized to have S2 = {s21, s
22}
where s21 = s2
2 = A(D). In other words, T1 is designed to maintain informationabout named objects and T2 for information about the relationships of pairs ofentities. Also note that any operations on one dimension of T2 will affect theother dimension the same way.
The masks B1 and B2 are initialized to return 0’s for all cells, making allnamed objects and relationships initially hidden from the network view of ourvisual tool.

6 H. Dai et al.
3.3 Entity Relationships Exploration Using T1 and T2
Given two entities of interest known as source entity (s) and target entity (t),a typical entity relationship discovery task would be finding interesting pathsbetween them. Each path denoted by e1 ↔ . . . ↔ ep represents a chain of rela-tionships. Each relationship denoted as ei−1 ↔ ei, for 1 < i ≤ p, and e1 and ep
are entities semantically equivalent to s and t respectively. Note that in this task,the relationships are non-directional. The roles of source and target are thereforeexchangeable. Nevertheless, we just distinguish them for easy discussion.
Our visual tool can incrementally add named objects and relationships intothe entity network presentation window as nodes and edges respectively by in-voking TUBE operations on the two TUBE instances T1 and T2, To display anentity in the visual tool, we set the respective cell in T to have B = 1. To displaya relationship, we set the corresponding cell in T2 to have B = 1. Hiding entitiesand relationships can be performed in a similar way. This interactive approachto construct entity networks can be assisted by interestingness measures definedfor the entity relationship discovery task.
3.4 Interestingness Measures for Entity Relationship Discovery
In this section, we define several measures to be used in T1 and T2 to sup-port entity relationship discovery. For T1, there is only one measure, i.e., M1 ={mpath strength}. For T2, we define M2 = {mname sim, mstrength, md entity}.
– mpath strength: the length of shortest path(s) between s and t going throughan entity (a named object, since it is defined on T1).
– mname sim: the similarity score between two entity names.– mstrength: the relationship strength between two entities.– md entity : the dominance of one entity over another.
Given a cell c(ei, ej) in T2,
mfname sim(c) = Avgau≺ei,av≺ej NameSimilarity(au, av)
where NameSimilarity is a name comparison function that returns a value be-tween 0 (unrelated name objects) and 1 (synonym). If ei and ej are conceptualentities, the measure value returned is an average of over name similarities be-tween named objects of ei and ej. With this measure, we now derive a set ofsynonyms for an entity ei, as denoted by
Synonym(ei) = {ej|mfname sim(c(ei, ej)) > λ}.
The synonym entities of ei are entities whose names are within λ edit distancefrom that of ei. The function Synonym is helpful to detect different spellingsof an entity. Grouping synonym entities together may discover new associations,since they may have different relationships with other entities.
The measure function of mstrength for a cell c(ei, ej) is denoted by mfstrength
(c(ei, ej)) which computes strength using Dice Coefficient, i.e.,
Visual Analytics for Supporting Entity Relationship Discovery 7
mfstrength(c(ei, ej)) = log (1 + 2 · |fd(c(ei,ej))||fd(ei)+|fd(ej)| )
The strength of a cell representing a pair of entities captures the likelihood ofa relationship between them. The more documents they co-occur in, the higherthe strength.
Given two entities ei and ej, the d entity measure determines if the documentscontaining ei are also those containing ei and ej. This happens when ei alwaysappears together with ej( This implies whenever ei appears, ej is always there),and we say that ej dominates over ei.
md entity(c(ei, ej)) ={
1 if fd(c(ei)) = fd(c(ei, ej))0 otherwise
For example, md entity(“9-11”,“New York”) = 1 when “9-11” appears in onlythose documents containing both “9-11” and “New York”.
For T1, the measure mpath strength(c(ei)) returns the strength of shortestpath(s) between s and t going through ei. Let s path(ei) denote this set ofshortest paths, mpath strength is defined as:
mpath strength(c(ei)) = Maxpik∈s path(ei)strength(pik)
where
strength(pik) =∏
(c(ex,ey)∈pikmfstrength(c(ex, ey))
When multiple shortest paths between s and t pass through entity ei,mpath strength(ei) will take the maximum path strength among them. A largempath strength(ei) suggests that there exists a path with edges that representstrong relationships. Hence, ei may be a good entity to explore to establishuseful linkages between s and t.
4 Visual Analytics Tool for Entity Relationship Discovery
In this section, we describe our Visual Analytics Tool, ER-Explorer (EntityRelationship Explorer) can be utilized. The named entity extraction in our sys-tem is performed by BBN Identifinder [13], which can extract entities of 24types including person, organization, GPE (Geo-political entities), date andothers. After extracting co-occurrence relationship extraction, Lucene is used toindex all documents by their extracted named entities. The visualization part ofour tool is built upon Chisio1 , a free Compound or Hierarchical Graph Visual-ization Tool based on eclipse Graphical Editing Framework.
Overview of User InterfaceER-Explorer is mainly made up of five views (see Figure 2), namely, a NetworkView, a Document View, a Related Entity View, a Synonym Entity View and aPath View.1 http://www.cs.bilkent.edu.tr/ ivis/chisio.html
8 H. Dai et al.
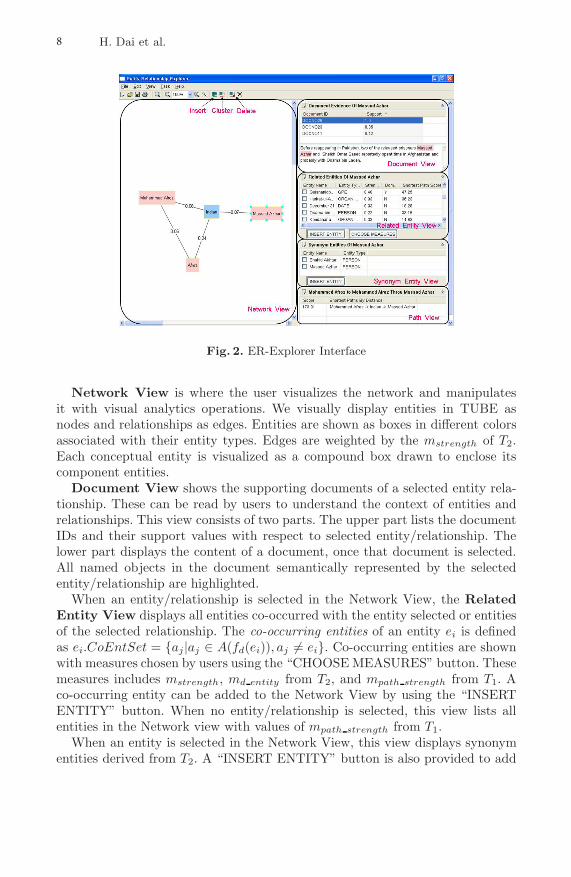
Fig. 2. ER-Explorer Interface
Network View is where the user visualizes the network and manipulatesit with visual analytics operations. We visually display entities in TUBE asnodes and relationships as edges. Entities are shown as boxes in different colorsassociated with their entity types. Edges are weighted by the mstrength of T2.Each conceptual entity is visualized as a compound box drawn to enclose itscomponent entities.
Document View shows the supporting documents of a selected entity rela-tionship. These can be read by users to understand the context of entities andrelationships. This view consists of two parts. The upper part lists the documentIDs and their support values with respect to selected entity/relationship. Thelower part displays the content of a document, once that document is selected.All named objects in the document semantically represented by the selectedentity/relationship are highlighted.
When an entity/relationship is selected in the Network View, the RelatedEntity View displays all entities co-occurred with the entity selected or entitiesof the selected relationship. The co-occurring entities of an entity ei is definedas ei.CoEntSet = {aj|aj ∈ A(fd(ei)), aj �= ei}. Co-occurring entities are shownwith measures chosen by users using the “CHOOSE MEASURES” button. Thesemeasures includes mstrength, md entity from T2, and mpath strength from T1. Aco-occurring entity can be added to the Network View by using the “INSERTENTITY” button. When no entity/relationship is selected, this view lists allentities in the Network view with values of mpath strength from T1.
When an entity is selected in the Network View, this view displays synonymentities derived from T2. A “INSERT ENTITY” button is also provided to add
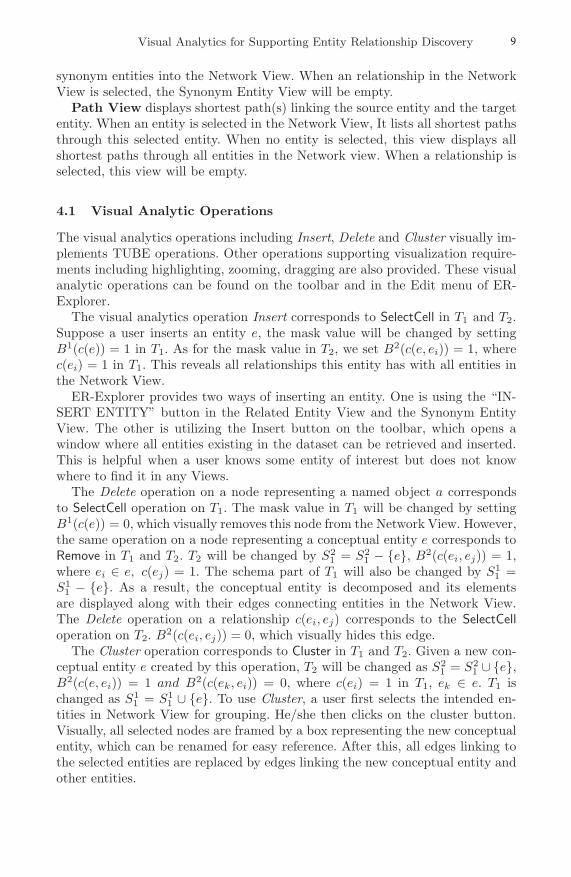
Visual Analytics for Supporting Entity Relationship Discovery 9
synonym entities into the Network View. When an relationship in the NetworkView is selected, the Synonym Entity View will be empty.
Path View displays shortest path(s) linking the source entity and the targetentity. When an entity is selected in the Network View, It lists all shortest pathsthrough this selected entity. When no entity is selected, this view displays allshortest paths through all entities in the Network view. When a relationship isselected, this view will be empty.
4.1 Visual Analytic Operations
The visual analytics operations including Insert, Delete and Cluster visually im-plements TUBE operations. Other operations supporting visualization require-ments including highlighting, zooming, dragging are also provided. These visualanalytic operations can be found on the toolbar and in the Edit menu of ER-Explorer.
The visual analytics operation Insert corresponds to SelectCell in T1 and T2.Suppose a user inserts an entity e, the mask value will be changed by settingB1(c(e)) = 1 in T1. As for the mask value in T2, we set B2(c(e, ei)) = 1, wherec(ei) = 1 in T1. This reveals all relationships this entity has with all entities inthe Network View.
ER-Explorer provides two ways of inserting an entity. One is using the “IN-SERT ENTITY” button in the Related Entity View and the Synonym EntityView. The other is utilizing the Insert button on the toolbar, which opens awindow where all entities existing in the dataset can be retrieved and inserted.This is helpful when a user knows some entity of interest but does not knowwhere to find it in any Views.
The Delete operation on a node representing a named object a correspondsto SelectCell operation on T1. The mask value in T1 will be changed by settingB1(c(e)) = 0, which visually removes this node from the Network View. However,the same operation on a node representing a conceptual entity e corresponds toRemove in T1 and T2. T2 will be changed by S2
1 = S21 − {e}, B2(c(ei, ej)) = 1,
where ei ∈ e, c(ej) = 1. The schema part of T1 will also be changed by S11 =
S11 − {e}. As a result, the conceptual entity is decomposed and its elements
are displayed along with their edges connecting entities in the Network View.The Delete operation on a relationship c(ei, ej) corresponds to the SelectCelloperation on T2. B2(c(ei, ej)) = 0, which visually hides this edge.
The Cluster operation corresponds to Cluster in T1 and T2. Given a new con-ceptual entity e created by this operation, T2 will be changed as S2
1 = S21 ∪ {e},
B2(c(e, ei)) = 1 and B2(c(ek, ei)) = 0, where c(ei) = 1 in T1, ek ∈ e. T1 ischanged as S1
1 = S11 ∪ {e}. To use Cluster, a user first selects the intended en-
tities in Network View for grouping. He/she then clicks on the cluster button.Visually, all selected nodes are framed by a box representing the new conceptualentity, which can be renamed for easy reference. After this, all edges linking tothe selected entities are replaced by edges linking the new conceptual entity andother entities.
10 H. Dai et al.
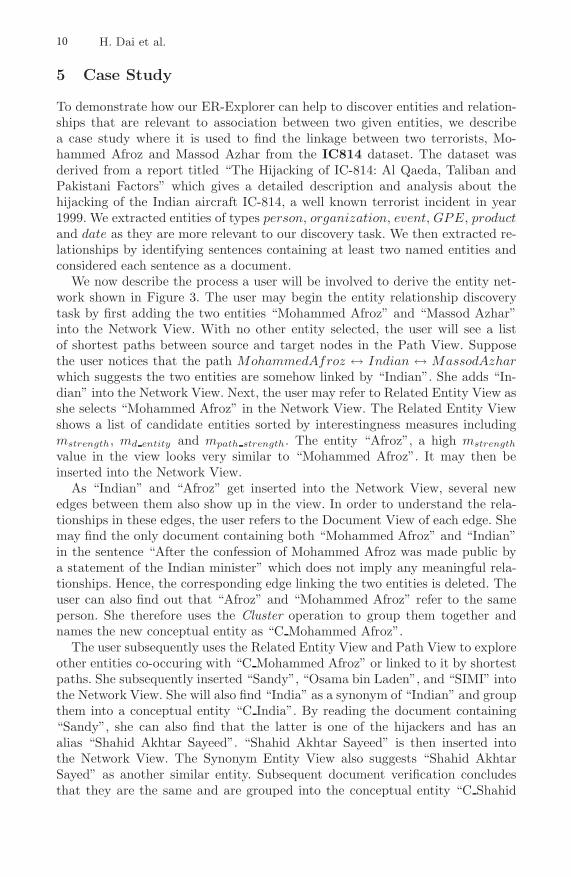
5 Case Study
To demonstrate how our ER-Explorer can help to discover entities and relation-ships that are relevant to association between two given entities, we describea case study where it is used to find the linkage between two terrorists, Mo-hammed Afroz and Massod Azhar from the IC814 dataset. The dataset wasderived from a report titled “The Hijacking of IC-814: Al Qaeda, Taliban andPakistani Factors” which gives a detailed description and analysis about thehijacking of the Indian aircraft IC-814, a well known terrorist incident in year1999. We extracted entities of types person, organization, event, GPE, productand date as they are more relevant to our discovery task. We then extracted re-lationships by identifying sentences containing at least two named entities andconsidered each sentence as a document.
We now describe the process a user will be involved to derive the entity net-work shown in Figure 3. The user may begin the entity relationship discoverytask by first adding the two entities “Mohammed Afroz” and “Massod Azhar”into the Network View. With no other entity selected, the user will see a listof shortest paths between source and target nodes in the Path View. Supposethe user notices that the path MohammedAfroz ↔ Indian ↔ MassodAzharwhich suggests the two entities are somehow linked by “Indian”. She adds “In-dian” into the Network View. Next, the user may refer to Related Entity View asshe selects “Mohammed Afroz” in the Network View. The Related Entity Viewshows a list of candidate entities sorted by interestingness measures includingmstrength, md entity and mpath strength. The entity “Afroz”, a high mstrength
value in the view looks very similar to “Mohammed Afroz”. It may then beinserted into the Network View.
As “Indian” and “Afroz” get inserted into the Network View, several newedges between them also show up in the view. In order to understand the rela-tionships in these edges, the user refers to the Document View of each edge. Shemay find the only document containing both “Mohammed Afroz” and “Indian”in the sentence “After the confession of Mohammed Afroz was made public bya statement of the Indian minister” which does not imply any meaningful rela-tionships. Hence, the corresponding edge linking the two entities is deleted. Theuser can also find out that “Afroz” and “Mohammed Afroz” refer to the sameperson. She therefore uses the Cluster operation to group them together andnames the new conceptual entity as “C Mohammed Afroz”.
The user subsequently uses the Related Entity View and Path View to exploreother entities co-occuring with “C Mohammed Afroz” or linked to it by shortestpaths. She subsequently inserted “Sandy”, “Osama bin Laden”, and “SIMI” intothe Network View. She will also find “India” as a synonym of “Indian” and groupthem into a conceptual entity “C India”. By reading the document containing“Sandy”, she can also find that the latter is one of the hijackers and has analias “Shahid Akhtar Sayeed”. “Shahid Akhtar Sayeed” is then inserted intothe Network View. The Synonym Entity View also suggests “Shahid AkhtarSayed” as another similar entity. Subsequent document verification concludesthat they are the same and are grouped into the conceptual entity “C Shahid

Visual Analytics for Supporting Entity Relationship Discovery 11
Fig. 3. The Result Network of Our Case Study
Akhtar Sayeed”. After checking the supporting document of “C Shahid AkhtarSayeed” and “Massod Azhar”, the user may find out that the two entities areindirectly linked by “Harkat-ul-Ansar”, an organization.
At this point, several entities and relationships have been found while thesemantics of the links among them can be summarized in three story threadsbetween Mohammed Afroz and Massod Azhar. The first involves MohammedAfroz’s trainning sponsored by SIMI group, which has a close relation withOsama bin Laden. The latter has ever spent some time with Massod Azhar. Thesecond conveys the information that Mohammed Afroz was active in severalplaces in India and was also arrested there, and so was Massod Azhar. The thirdsays that Mohammed Afroz was trained as a pilot together with Shahid AkhtarSayeed, who is a member of Harkat-ul-Ansar organization, of which MassodAzhar was the general secretary.
6 Conclusions
In this paper, we propose an interactive visual approach to discover entity andrelationships embedded in text data. We have developed a visual analytics toolcalled ER-Explorer which is equipped with a versatile data model known asTUBE to manipulate entity and relationship information and their supportingdocuments. We have demonstrated its capability on a hijacking event dataset todiscover relationships between two terrorists. For our future research, we plan toextend ER-Explorer to discover associations between more than two entities andto automate some of the exploration subtasks through some tunable parameters.We are also interested to study how concise textual summary of the constructedentity network can be generated from the supporting documents for easy reading.
Acknowledgments
This work was supported in part by A*STAR Public Sector R&D, Project Num-ber 062 101 0031.
12 H. Dai et al.
References
1. Thomas, J., Cook, K.: A Visual Analytics Agenda. IEEE Computer Graphics andApplications 26(1), 10–13 (2006)
2. Shen, Z., Ma, K.-L., Eliassi-Rad, T.: Visual Analysis of Large Heterogeneous SocialNetworks by Semantic and Structural Abstraction. IEEE Transactions on Visual-ization and Computer Graphics 12(6), 1427–1439 (2006)
3. Jeffrey Heer, D.B.: Vizster: Visualizing Online Social Networks. In: Proceedings ofthe IEEE Symposium on Information Visualization (October 2005)
4. Adam Perer, B.S.: Balancing Systematic and Flexible Exploration of Social Net-works. IEEE Transactions on Visualization and Computer Graphics 12(5), 693–700(2006)
5. Krebs, V.: Mapping networks of terrorist cells. Connections: the Journal of theInternational Network of Social Network Analysts 24(3), 43–52 (2002)
6. Bilgic, M., Licamele, L., Getoor, L., Shneiderman, B.: D-Dupe: An Interactive Toolfor Entity Resolution in Social Networks. In: Proceedings of the IEEE Symposiumon Visual Analytics Science And Technology, October 2006, pp. 43–50 (2006)
7. Yang, C.C., Liu, N., Sageman, M.: Analyzing the Terrorist Social Networks withVisualization Tools. In: Proceedings of the IEEE International Conference on In-telligence and Security Informatics (May 2006)
8. Xu, J., Chen, H.: CrimeNet Explorer: A Framework for Criminal Network Knowl-edge Discovery. ACM Transactions on Information Systems 23(2), 201–226 (2005)
9. Stasko, J., Gorg, C., Liu, Z., Singhal, K.: Jigsaw: Supporting Investigative Analy-sis through Interactive Visualization. In: Proceedings of the IEEE Symposium onVisual Analytics Science And Technology, October 2007, pp. 131–138 (2007)
10. Jin, W., Srihari, R.K., Wu, X.: Mining Concept Associations for Knowledge Discov-ery Through Concept Chain Queries. In: Proceedings of the Pacific Asia Conferenceon Knowledge Discovery and Data Mining (April 2007)
11. Tang, J., Zhang, J., Zhang, D., Yao, L., Zhu, C.: ArnetMiner: An Expertise Ori-ented Search System for Web Community. In: Proceedings of the 6th InternationalConference of Semantic Web (November 2007)
12. Lauw, H.W., Lim, E.-P., Pang, H.: TUBE (TextcUBE) for Discovering Documen-tary Evidence of Associations among Entities. In: Proceedings of the ACM Sym-posium of Applied Computing (March 2007)
13. Bikel, D., Schwartz, R., Weischedel, R.M.: An Algorithm that Learns What’s in aName. Machine Learning 34(1-3), 211–231 (1999)