Embed Size (px)
Citation preview
Eurographics Conference on Visualization (EuroVis) 2016K.-L. Ma, G. Santucci, and J. van Wijk(Guest Editors)
Volume 35 (2016), Number 3
Visual Analysis of Defects in Glass Fiber Reinforced Polymers for4DCT Interrupted In situ Tests
Alexander Amirkhanov1, Artem Amirkhanov1, Dietmar Salaberger1, Johann Kastner1, M. Eduard Gröller2,3, Christoph Heinzl1
1University of Applied Sciences Upper Austria, Campus Wels, Austria2Institute of Computer Graphics and Algorithms, Vienna University of Technology, Austria
3VRVis Research Center, Austria
AbstractMaterial engineers use interrupted in situ tensile testing to investigate the damage mechanisms in composite materials. Foreach subsequent scan, the load is incrementally increased until the specimen is completely fractured. During the interrupted insitu testing of glass fiber reinforced polymers (GFRPs) defects of four types are expected to appear: matrix fracture, fiber/matrixdebonding, fiber pull-out, and fiber fracture. There is a growing demand for the detection and analysis of these defects amongthe material engineers. In this paper, we present a novel workflow for the detection, classification, and visual analysis of defectsin GFRPs using interrupted in situ tensile tests in combination with X-ray Computed Tomography. The workflow is based on theautomatic extraction of defects and fibers. We introduce the automatic Defect Classifier assigning the most suitable type to eachdefect based on its geometrical features. We present a visual analysis system that integrates four visualization methods: 1) theDefect Viewer highlights defects with visually encoded type in the context of the original CT image, 2) the Defect Density Mapsprovide an overview of the defect distributions according to type in 2D and 3D, 3) the Final Fracture Surface estimates thematerial fracture’s location and displays it as a 3D surface, 4) the 3D Magic Lens enables interactive exploration by combiningdetailed visualizations in the region of interest with overview visualizations as context. In collaboration with material engineers,we evaluate our solution and demonstrate its practical applicability.
Categories and Subject Descriptors (according to ACM CCS): Image processing and computer vision [I.4.7]: FeatureMeasurement—Life Cycle; Image processing and computer vision [I.4.10]: Image Representation—; Computer graphics [I.3.0]:General—
1. Introduction
Currently, composite materials attract a lot of interest from in-dustry. Utilizing glass fiber reinforced polymers (GFRPs) enablesthe manufacture of cost-effective products with tailored mechani-cal properties. GFRPs consist of two components: glass fibers anda polymer matrix. Glass fibers provide the material with stiffnessand durability. The polymer matrix bonds the fibers, protects themfrom external damage, and provides resiliency to the material. Inorder to achieve improved material strength, the fibers are orientedduring the manufacturing process. Low weight and high durabil-ity of GFRPs make them especially suitable for production in ar-eas such as the aerospace and automotive industries. In order toproduce GFRPs that satisfy industrial requirements, material engi-neers are highly interested in finding and analyzing the correlationsbetween material features (e.g., the number of fibers, their direc-tions and diameters, etc.) and the resulting mechanical properties,such as strength and ability to withstand high loads. This researchknowledge is then utilized for optimizing the manufacturing pro-cess to produce superior composite materials.
3D X-ray Computed Tomography (3DCT) is an inspectionmethod that is widely used for the non-destructive testing of com-posite materials such as GFRPs. Typical 3DCT scanners comprisethree major components: X-ray tube, rotary plate, and detector. Theinspected specimen is placed on the rotary plate between the tubeand the detector, whereupon the scanning process starts. The X-ray tube directs X-rays through the specimen and onto the detec-tor. The detector registers a 2D X-ray attenuation image also calledprojection image. The rotary plate is then turned and the process isrepeated until a full 360◦ rotation of the specimen is completed. To-mographic reconstruction is performed using the set of 2D projec-tion images to produce a 3D (volumetric) attenuation image. 3DCThas two main advantages over other non-destructive methods: 1) itallows the user to explore all internal and external structures withjust one scan, and 2) it provides a high imaging resolution capableof resolving individual fibers and small defects. However, 3DCTcannot be directly used for the inspection of the specimen undervarious loads. The specimen has to be static during the scanningprocedure, which can last up to several hours. To circumvent thislimitation, interrupted in situ tensile 3DCT tests can be used.
c© 2016 The Author(s)Computer Graphics Forum c© 2016 The Eurographics Association and JohnWiley & Sons Ltd. Published by John Wiley & Sons Ltd.
DOI: 10.1111/cgf.12896

A. Amirkhanov et al. / Visual Analysis of Defects in Glass Fiber Reinforced Polymers for 4DCT Interrupted In situ Tests
Matrix fracture (a)
Fiber fracture (d)Fiber/matrix debonding (b)
Fiber pull-out (c)
1 mm
Final fracture (e)
Figure 1: Four defect types on a 2D slice of a 3DCT volume com-ing from an interrupted in situ tensile test.
Material engineers rely on interrupted in situ tensile testing tostudy on the damage mechanisms in composite materials. Duringinterrupted in situ tensile testing, a specimen is scanned under var-ious loads created by the loading tensile stage. Typically, the firstscan is performed without any load. For each subsequent scan, theload is incremented until the specimen is completely fractured. Theseries of 3DCT scans will henceforth be referred as 4DCT data,where the fourth dimension is the time or the amount of force ap-plied to the specimen during the scan. If interrupted in situ testingis performed, defects of four types are expected to appear in theGFRPs: matrix fractures, matrix/fiber debondings, fiber pull-outs,and fiber fractures (see figure 1). Detection, classification, and visu-alization of these defects is of a high interest for material engineers.Klaus Friedrich described and illustrated each defect type (failuremechanism) [FRI89]. However, the provided description does notformalize differences between defect types to an extent that is suf-ficient for an automatic defect classification. Therefore, in collab-oration with our industrial partner Borealis AG, a major supplierof plastic materials for engineering applications in the automotiveindustry, we further detailed the defects’ description. It resulted inthe following list of definitions for each defect type:
• Matrix fractures are mostly perpendicular to the force direction.They are often clustered and their shapes do not correlate withany shapes of fibers in the proximity (see figure 1a).
• Fiber/matrix debondings mostly affect fibers that are perpendic-ular to the force direction. They occur above or below fibers.Debondings have directions and shapes similar to neighboringfibers (see figure 1b).
• Fiber pull-outs mostly affect fibers that are aligned parallel tothe force direction. They only occur at the ends of fibers and arecylindrical in shape. Diameter and direction of a pull-out are thesame as those of the corresponding fiber (see figure 1c).
• Fiber fractures are located between two fiber pieces. They have acylindrical shape. The fracture diameter is approximately equalto the fiber diameter (see figure 1d).
If a force is applied, which is larger than a test specimen cansustain, individual defects of different types accumulate and thefinal fracture is formed as a result. The final fracture runs throughthe specimen and separates it into two parts (see figure 1e).
In this work, we investigate the Fibremod GD301 material pro-
duced by Borealis AG. This material is glass fiber reinforcedpolypropylene with a fiber in weight content of 30%. Due to itsstrong mechanical qualities this material is used in air bag hous-ings, pedal carriers, pump housings, etc. During interrupted in situtensile testing, a force inducing stress, strain, and failure was ap-plied to the material. The material’s failure is caused due to numer-ous individual defects that can be classified into the four previouslymentioned types.
In section 2 we proceed by deriving seven tasks that are impor-tant for the 4DCT analysis and present a workflow for solving thesetasks. In section 3 we provide a literature overview and discussthe related work. In section 4 we give a detailed description of thedatasets used in this work. Sections 5 and 6 describe the workflowin greater details, that is, defect classification and tools for visual-ization and analysis are presented. In section 7 we apply the pro-posed system and present use cases. We discuss the design choicesmade when implementing the presented visualization and analysismethods in section 9. In section 10 we provide conclusions.
2. Workflow and Task Analysis
Interrupted in situ tensile testing in combination with 3DCT is a rel-atively novel topic. Currently commercial available software suchas VGStudio Max [VGS] or Avizo 3D [Avi] provide a wide range offunctionalities such as segmentation, surface determination, featureextraction, porosity/inclusion analysis, and fiber analysis. However,the functionalities are not sufficient for 4DCT data analysis and donot cover the requirements of our domain specialists. To the au-thors’ knowledge, there is no tool currently available that can ex-tract and classify defects from tensile tests of GFRPs and performa visual analysis of these defects on the 4DCT data.
In the course of this project, we collaborated with a major sup-plier of plastic materials for engineering applications in the auto-motive industry: Borealis AG. They aim to use the 4DCT tensiletest data analysis to acquire new knowledge and insights on the cor-relation between fiber characteristics and resulting material prop-erties. This knowledge is then used to improve the in-house fibersimulation software. In particular, the dynamics of defect develop-ment under the load is of high interest. After several meetings anddiscussions, we identified the following list of tasks, which are ofhighest relevance for analyzing 4DCT data, and cannot be automat-ically implemented with existing software:
T1: Finding individual defects and calculating defect characteris-tics, such as size, the center of mass, and direction.
T2: Classification of each individual defect by type.T3: Visualization of individual defects.T4: Finding and visualizing regions with the highest defect densi-
ties.T5: Finding and visualizing the final fracture that appears when
the specimen is completely fractured.T6: Visualizing the history of the material destruction under the
influence of increasing load.T7: Presenting quantitative information on the final fracture and
defects.
The purpose of the work presented here is to overcome the lim-itations of existing analysis techniques and to present a workflow
c© 2016 The Author(s)Computer Graphics Forum c© 2016 The Eurographics Association and John Wiley & Sons Ltd.
202

A. Amirkhanov et al. / Visual Analysis of Defects in Glass Fiber Reinforced Polymers for 4DCT Interrupted In situ Tests
Defect Viewer
Defect Density Maps
Final Fracture Surface
3D Magic Lens
ClassificationMeasurments
Fiber extraction
Defect extraction
4DCT dataset Defect classificationFeature extraction Visualization and analysis
Figure 2: An overview of the workflow for 4DCT interrupted in situ tensile-test data-analysis.
and a system that address the tasks listed above. An overview of theworkflow is shown in figure 2.Defect and fiber extraction: The first stage of the workflow is toextract individual defects and fibers (T1). For the defect segmen-tation, we use binary thresholding on the data that is pre-filteredwith gradient anisotropic diffusion to reduce noise. For the fiberextraction, we employ the algorithm proposed by Salaberger etal. [SKK∗11].Defect classification: To classify defects (T1, T2), we introducean automatic defect classifier based on the assumptions we madetogether with material engineers. Using these assumptions, a typeis assigned to each defect in a 4DCT dataset. The complete list ofassumptions for each type concerning defect characteristics as wellas the details of classification process are provided in section 5.Visualization and analysis: As the last stage of the workflow, wepresent a visual analysis system that provides a set of visualizationtechniques that aim to address tasks T3 – T7. A detailed descriptionis given in section 6. The system comprises four different visualiza-tion methods that can be combined or used sequentially to achievethe analysis goals:
• The Defect Viewer (section 6.1) highlights defects (T3) in 2Dslices of the CT data and provides visual encodings for the vari-ous defect types.
• The Defect Density Maps (section 6.2) encode the defect distri-butions by type and provide visualizations of these distributionsin 2D and in 3D (T4). In addition, Defect Density Maps providequantitative information on the frequency of defect occurrencesin a region (T7).
• The Final Fracture Surface (section 6.3) estimates the shape andlocation of a final fracture as a 3D surface and displays it on topof the contextual information in a 3D view (T5).
• The 3D Magic Lens (section 6.4) is an interactive tool facilitatingthe analysis by combining detailed visualizations in the regionof interest with overview visualizations as context in a single 3Dscene. In addition, displaying data from different time-steps inthe same scene is possible (T6).
3. Related Work
Visualization of 3DCT data: One of the first works utilizing vi-sualization techniques for non-destructive testing using industrial3DCT data was done by Huang et al. [HMMW03]. The authorsfocused on feature extraction and visualized the data using direct
volume rendering with two-dimensional transfer functions. Heinzlet al. [HKG07] introduced a method for surface extraction frommulti-material components using dual energy CT. Hadwiger etal. [HLRS∗08] presented a method for analyzing 3DCT data withthe goal of interactively detecting, classifying, and quantifying fea-tures using a visualization-driven approach. The work by Fritzet al. [FHG∗09] focused on characterizing steel fiber-reinforcedconcrete by segmenting fibers and quantifying their properties. Adirection-sphere histogram provided an overview of the fiber ori-entations. Direction transfer functions defined to encode orienta-tions are used to color-code fibers. More recent publications ad-dressed the visualization of carbon- and glass-fiber reinforced com-posites using 3DCT scans. Weissenböck et al. [WAL∗14] presentedthe FiberScout tool for exploring and analyzing carbon fiber rein-forced polymers. The authors used 2D information visualizationmethods, such as parallel coordinates, coupled with a scatter plotmatrix as well as 3D visualization techniques, such as blob sur-faces and metadata visualization. Within the same framework Rehet al. [RGK∗13] implemented the mean object (MObject) techniquefor analyzing pores in carbon fiber reinforced polymers. The MOb-ject technique was used for the exploration of hierarchically clus-tered pores and the identification of common patterns in the poreshapes.Visualization of time-varying data: Havre et al. [HHN00] presentedthe ThemeRiver approach for visualizing thematic variations overtime within a large collection of documents. The work by Silver etal. [SW97] focused on tracking and visualizing features in compu-tational fluid dynamics datasets. The authors extract features fromeach individual step and use spatial overlap to determine match-ing. Feature properties and their evolution history are used to en-hance isosurface visualization and volume rendering. Van Pelt etal. [vPOBB∗10] presented a framework for analyzing blood-flowdynamics and visualizing essential characteristics.Segmentation and extraction of features and defects: Zhou etal. [ZYZ10] used images from a camera that is fixed on a vehi-cle for the analysis of an asphalt canvas. The authors presentedan illumination-invariant image-enhancement and segmentation al-gorithm for the extraction and classification of pavement cracks.Several approaches have been presented for an automatic crackdetection in industrial 3DCT data. The work by Landstrom etal. [LT12] focused on crack detection in steel slabs. The authorspresented an automated on-line system, based on 3D profile data ofsteel slab surfaces, which utilizes morphological image processing
c© 2016 The Author(s)Computer Graphics Forum c© 2016 The Eurographics Association and John Wiley & Sons Ltd.
203
A. Amirkhanov et al. / Visual Analysis of Defects in Glass Fiber Reinforced Polymers for 4DCT Interrupted In situ Tests
and statistical classification by logistic regression. Yamaguchi etal. [YNH08] proposed an efficient and high-speed method for auto-matic crack detection on concrete surfaces employing percolation-based image processing. In civil engineering, the corrosion of steelreinforcements in structural elements of concrete bares the riskof reduced stability. The work by Paetsch et al. [PBP∗15] ex-plored various image processing and visualization methods for3D corrosion detection in time-dependent 3DCT images of con-crete. Specimens are exposed to several cycles of electrochemi-cal pre-damaging to generate a large artificial crack. Bhowmik etal. [BMH∗14] introduced a method for the detection and segmenta-tion of cracks from 2D cross-sectional images of rock under com-pressive force. A two-dimensional matched filtering technique isfollowed by local entropy-based thresholding, morphological oper-ators, and length filtering.
All the works as mentioned above focused on a single type ofdefect and usage scenario. In these works, 3D or even only 2Ddatasets are processed. 4DCT data is considered in the work ofPaetsch et al. [PBP∗15] and is visualized using side-by-side views.Reh et al. [RAK∗15] presented a tool for evaluating 4DCT data. Atracking graph [WCBP12] was employed to relate pores in a spec-imen between scans. The system we are proposing provides meansfor the extraction and classification of four different defect types(matrix fractures, fiber pull-outs, debondings, and fractures) andmethods for the detailed integrated visual analysis of these defects.
Various image segmentation methods are employed in medi-cal and industrial 3DCT for feature detection and classification.These methods range from simple or automatic thresholding meth-ods, e.g., Otsu thresholding [Ots79], to more popular probabilisticmethods, such as random walks [Gra06]. The visual analysis in ourproposed system is not limited to a particular image segmentationalgorithm. Our flexible system allows users to apply any segmen-tation algorithm for defect detection. The system we are propos-ing determines fibers using an algorithm presented by Salabergeret al. [SKK∗11], which is designed for individual fiber extractionin fiber-reinforced composite materials.
4. Data Description
We performed series of measurements under load of three test spec-imens on a GE phoenix|xray nanotom R© device. The corresponding3DCT scans contain three components with different gray-valueranges (from high to low): fibers, matrix, and air.Dataset 1: The specimen is notched in order to ensure failure in apredefined region. This is important, as high resolution 3DCT scan-ning with high magnification is only possible if the scan volume isreduced to a particular region of the test object. The force directionand the main fiber orientation are parallel, which leads to charac-teristic failure modes. It is expected that fiber pull-outs occur morefrequently than fiber/matrix debondings. Four scans of a GD301-MiniNotched-OH1 object were performed with 0, 208, 224, 244,and 260 newton of force applied. The voxel size is 2 µm.Dataset 2: This specimen is notched as well, the main fiber ori-entation and the force direction are perpendicular. Therefore, it isexpected that fiber/matrix debondings will occur more frequentlythan fiber pull-outs. The scans were performed with 0, 187, 212,225, 230, and 235 newton. The voxel size is 2 µm.
Measurments
Defect
Decision maker
Matrixfracture (a)
Fiber/matrixdebonding (b)
Fiberpull-out (c)
Fiberfracture (d)
C1 C7C2 C3 C4 C5 C6Crit
eria
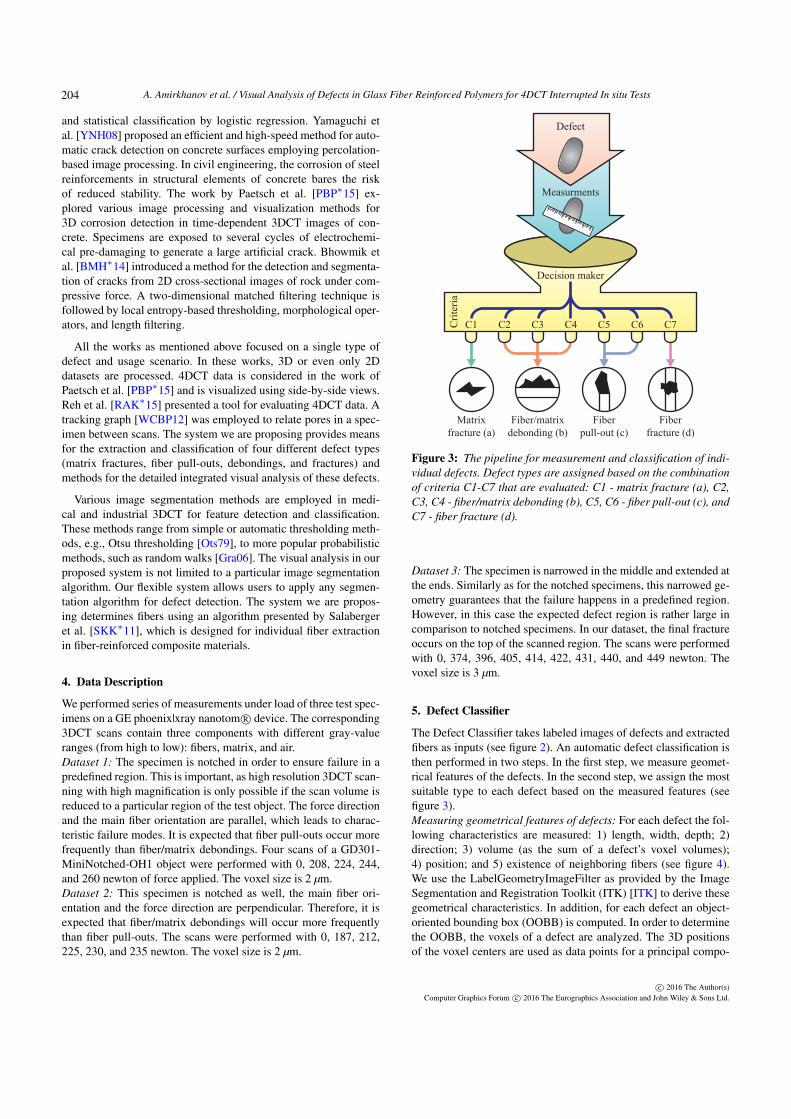
Figure 3: The pipeline for measurement and classification of indi-vidual defects. Defect types are assigned based on the combinationof criteria C1-C7 that are evaluated: C1 - matrix fracture (a), C2,C3, C4 - fiber/matrix debonding (b), C5, C6 - fiber pull-out (c), andC7 - fiber fracture (d).
Dataset 3: The specimen is narrowed in the middle and extended atthe ends. Similarly as for the notched specimens, this narrowed ge-ometry guarantees that the failure happens in a predefined region.However, in this case the expected defect region is rather large incomparison to notched specimens. In our dataset, the final fractureoccurs on the top of the scanned region. The scans were performedwith 0, 374, 396, 405, 414, 422, 431, 440, and 449 newton. Thevoxel size is 3 µm.
5. Defect Classifier
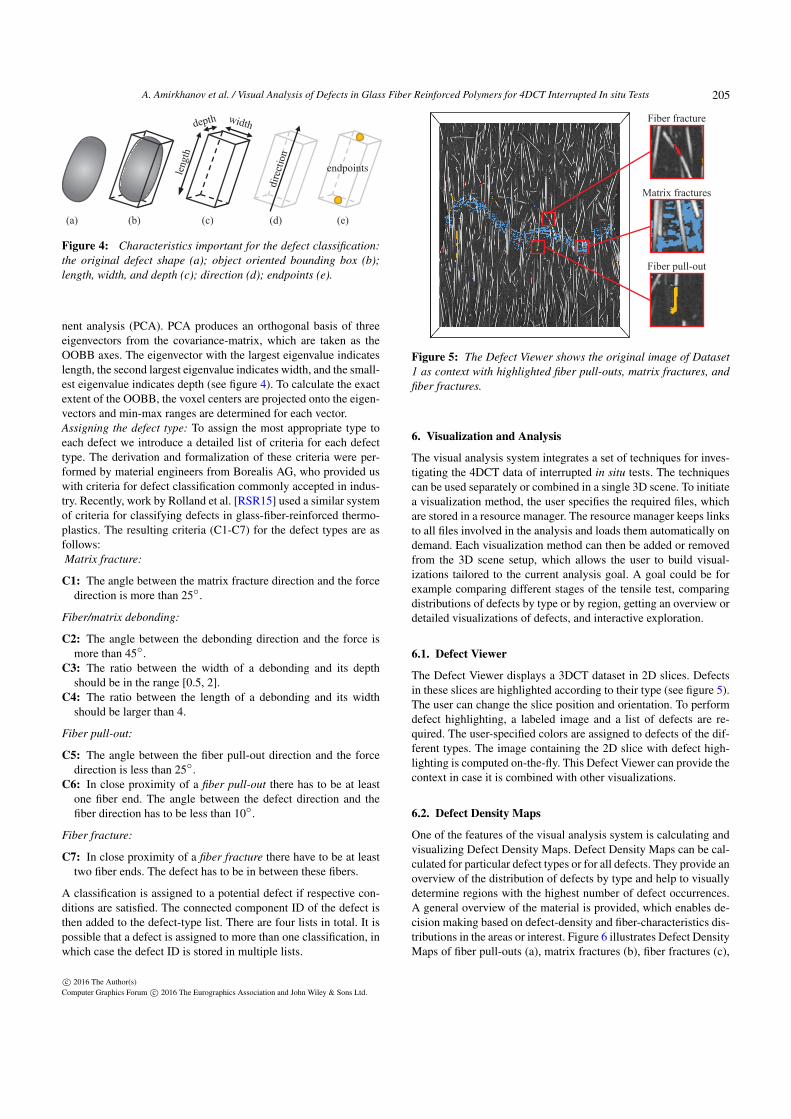
The Defect Classifier takes labeled images of defects and extractedfibers as inputs (see figure 2). An automatic defect classification isthen performed in two steps. In the first step, we measure geomet-rical features of the defects. In the second step, we assign the mostsuitable type to each defect based on the measured features (seefigure 3).Measuring geometrical features of defects: For each defect the fol-lowing characteristics are measured: 1) length, width, depth; 2)direction; 3) volume (as the sum of a defect’s voxel volumes);4) position; and 5) existence of neighboring fibers (see figure 4).We use the LabelGeometryImageFilter as provided by the ImageSegmentation and Registration Toolkit (ITK) [ITK] to derive thesegeometrical characteristics. In addition, for each defect an object-oriented bounding box (OOBB) is computed. In order to determinethe OOBB, the voxels of a defect are analyzed. The 3D positionsof the voxel centers are used as data points for a principal compo-
c© 2016 The Author(s)Computer Graphics Forum c© 2016 The Eurographics Association and John Wiley & Sons Ltd.
204
A. Amirkhanov et al. / Visual Analysis of Defects in Glass Fiber Reinforced Polymers for 4DCT Interrupted In situ Tests
widthdepth
leng
th
dire
ctio
n
endpoints
(a) (b) (c) (d) (e)
Figure 4: Characteristics important for the defect classification:the original defect shape (a); object oriented bounding box (b);length, width, and depth (c); direction (d); endpoints (e).
nent analysis (PCA). PCA produces an orthogonal basis of threeeigenvectors from the covariance-matrix, which are taken as theOOBB axes. The eigenvector with the largest eigenvalue indicateslength, the second largest eigenvalue indicates width, and the small-est eigenvalue indicates depth (see figure 4). To calculate the exactextent of the OOBB, the voxel centers are projected onto the eigen-vectors and min-max ranges are determined for each vector.Assigning the defect type: To assign the most appropriate type toeach defect we introduce a detailed list of criteria for each defecttype. The derivation and formalization of these criteria were per-formed by material engineers from Borealis AG, who provided uswith criteria for defect classification commonly accepted in indus-try. Recently, work by Rolland et al. [RSR15] used a similar systemof criteria for classifying defects in glass-fiber-reinforced thermo-plastics. The resulting criteria (C1-C7) for the defect types are asfollows:Matrix fracture:
C1: The angle between the matrix fracture direction and the forcedirection is more than 25◦.
Fiber/matrix debonding:
C2: The angle between the debonding direction and the force ismore than 45◦.
C3: The ratio between the width of a debonding and its depthshould be in the range [0.5, 2].
C4: The ratio between the length of a debonding and its widthshould be larger than 4.
Fiber pull-out:
C5: The angle between the fiber pull-out direction and the forcedirection is less than 25◦.
C6: In close proximity of a fiber pull-out there has to be at leastone fiber end. The angle between the defect direction and thefiber direction has to be less than 10◦.
Fiber fracture:
C7: In close proximity of a fiber fracture there have to be at leasttwo fiber ends. The defect has to be in between these fibers.
A classification is assigned to a potential defect if respective con-ditions are satisfied. The connected component ID of the defect isthen added to the defect-type list. There are four lists in total. It ispossible that a defect is assigned to more than one classification, inwhich case the defect ID is stored in multiple lists.
Fiber fracture
Matrix fractures
Fiber pull-out
Figure 5: The Defect Viewer shows the original image of Dataset1 as context with highlighted fiber pull-outs, matrix fractures, andfiber fractures.
6. Visualization and Analysis
The visual analysis system integrates a set of techniques for inves-tigating the 4DCT data of interrupted in situ tests. The techniquescan be used separately or combined in a single 3D scene. To initiatea visualization method, the user specifies the required files, whichare stored in a resource manager. The resource manager keeps linksto all files involved in the analysis and loads them automatically ondemand. Each visualization method can then be added or removedfrom the 3D scene setup, which allows the user to build visual-izations tailored to the current analysis goal. A goal could be forexample comparing different stages of the tensile test, comparingdistributions of defects by type or by region, getting an overview ordetailed visualizations of defects, and interactive exploration.
6.1. Defect Viewer
The Defect Viewer displays a 3DCT dataset in 2D slices. Defectsin these slices are highlighted according to their type (see figure 5).The user can change the slice position and orientation. To performdefect highlighting, a labeled image and a list of defects are re-quired. The user-specified colors are assigned to defects of the dif-ferent types. The image containing the 2D slice with defect high-lighting is computed on-the-fly. This Defect Viewer can provide thecontext in case it is combined with other visualizations.
6.2. Defect Density Maps
One of the features of the visual analysis system is calculating andvisualizing Defect Density Maps. Defect Density Maps can be cal-culated for particular defect types or for all defects. They provide anoverview of the distribution of defects by type and help to visuallydetermine regions with the highest number of defect occurrences.A general overview of the material is provided, which enables de-cision making based on defect-density and fiber-characteristics dis-tributions in the areas or interest. Figure 6 illustrates Defect DensityMaps of fiber pull-outs (a), matrix fractures (b), fiber fractures (c),
c© 2016 The Author(s)Computer Graphics Forum c© 2016 The Eurographics Association and John Wiley & Sons Ltd.
205
A. Amirkhanov et al. / Visual Analysis of Defects in Glass Fiber Reinforced Polymers for 4DCT Interrupted In situ Tests
(a) Fiber pull-outs (b) Matrix fractures (c) Fiber breakages (d) Fiber/matrix debondings
Figure 6: Four Defect Density Maps displaying distributions of fiber pull-outs (a), matrix fractures (b), fiber breakages (c), and fiber/matrixdebondings (d) in Dataset 1.
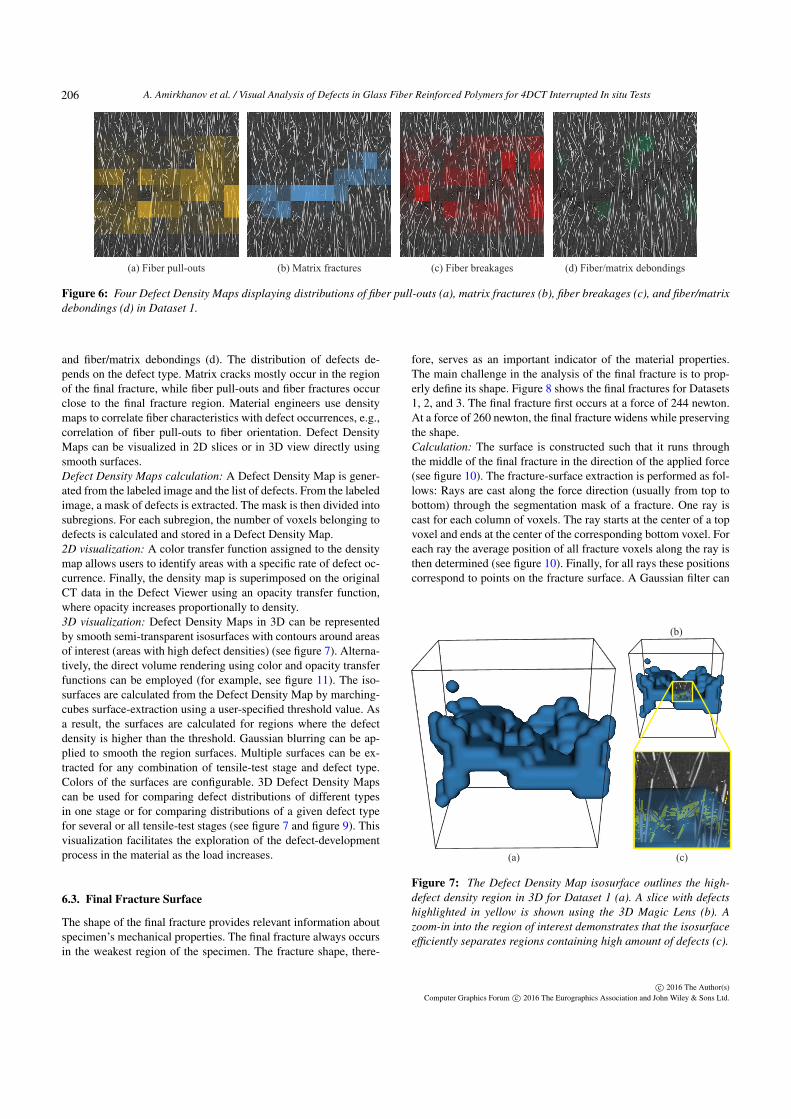
and fiber/matrix debondings (d). The distribution of defects de-pends on the defect type. Matrix cracks mostly occur in the regionof the final fracture, while fiber pull-outs and fiber fractures occurclose to the final fracture region. Material engineers use densitymaps to correlate fiber characteristics with defect occurrences, e.g.,correlation of fiber pull-outs to fiber orientation. Defect DensityMaps can be visualized in 2D slices or in 3D view directly usingsmooth surfaces.Defect Density Maps calculation: A Defect Density Map is gener-ated from the labeled image and the list of defects. From the labeledimage, a mask of defects is extracted. The mask is then divided intosubregions. For each subregion, the number of voxels belonging todefects is calculated and stored in a Defect Density Map.2D visualization: A color transfer function assigned to the densitymap allows users to identify areas with a specific rate of defect oc-currence. Finally, the density map is superimposed on the originalCT data in the Defect Viewer using an opacity transfer function,where opacity increases proportionally to density.3D visualization: Defect Density Maps in 3D can be representedby smooth semi-transparent isosurfaces with contours around areasof interest (areas with high defect densities) (see figure 7). Alterna-tively, the direct volume rendering using color and opacity transferfunctions can be employed (for example, see figure 11). The iso-surfaces are calculated from the Defect Density Map by marching-cubes surface-extraction using a user-specified threshold value. Asa result, the surfaces are calculated for regions where the defectdensity is higher than the threshold. Gaussian blurring can be ap-plied to smooth the region surfaces. Multiple surfaces can be ex-tracted for any combination of tensile-test stage and defect type.Colors of the surfaces are configurable. 3D Defect Density Mapscan be used for comparing defect distributions of different typesin one stage or for comparing distributions of a given defect typefor several or all tensile-test stages (see figure 7 and figure 9). Thisvisualization facilitates the exploration of the defect-developmentprocess in the material as the load increases.
6.3. Final Fracture Surface
The shape of the final fracture provides relevant information aboutspecimen’s mechanical properties. The final fracture always occursin the weakest region of the specimen. The fracture shape, there-
fore, serves as an important indicator of the material properties.The main challenge in the analysis of the final fracture is to prop-erly define its shape. Figure 8 shows the final fractures for Datasets1, 2, and 3. The final fracture first occurs at a force of 244 newton.At a force of 260 newton, the final fracture widens while preservingthe shape.Calculation: The surface is constructed such that it runs throughthe middle of the final fracture in the direction of the applied force(see figure 10). The fracture-surface extraction is performed as fol-lows: Rays are cast along the force direction (usually from top tobottom) through the segmentation mask of a fracture. One ray iscast for each column of voxels. The ray starts at the center of a topvoxel and ends at the center of the corresponding bottom voxel. Foreach ray the average position of all fracture voxels along the ray isthen determined (see figure 10). Finally, for all rays these positionscorrespond to points on the fracture surface. A Gaussian filter can
(a) (c)
(b)
Figure 7: The Defect Density Map isosurface outlines the high-defect density region in 3D for Dataset 1 (a). A slice with defectshighlighted in yellow is shown using the 3D Magic Lens (b). Azoom-in into the region of interest demonstrates that the isosurfaceefficiently separates regions containing high amount of defects (c).
c© 2016 The Author(s)Computer Graphics Forum c© 2016 The Eurographics Association and John Wiley & Sons Ltd.
206

A. Amirkhanov et al. / Visual Analysis of Defects in Glass Fiber Reinforced Polymers for 4DCT Interrupted In situ Tests
(a) (b) (c)
Figure 8: The Final Fracture Surfaces show differences betweenthe final fractures of Datasets 1 (a), 2 (b), and 3 (c). Dataset 2 hasthe fracture surface that is flatter than for Datasets 2 and 3.
then be used to reduce noise and smooth the surface, which can bethen stored as a height map.
6.4. 3D Magic Lens
To combine different visualization techniques together we imple-mented a 3D Magic Lens. The 3D Magic Lens is an interactive toolthat changes the object appearance in a selected region (see fig-ure 9). Any possible combinations of available visualization meth-ods and test stages can be chosen for the selected region and for thesurrounding area. This is achieved by rendering 3D scenes twicefrom the same camera position and then displaying a part of oneimage on top of the other one. The 3D Magic Lens has a rectangu-lar shape and the user can change its position and size. We assumethree usage scenarios of the 3D Magic Lens:
1. Analyzing and comparing differences between tensile teststages. For instance, it is possible to use an early stage of thetest for providing the context, while studying defects at a laterstage within the region of interest. The usage example is givenin figure 9a.
2. Applying a specific combination of visualization techniques inthe region of interest. For example, figure 9a demonstrates thatwith the 3D Magic Lens the user can interactively enable defecthighlighting with the Defect Viewer in a small region; in fig-ure 9b the Defect Density Map of all defects provides the con-text, while the Density Maps of individual defects are shown inthe region of interest.
3. Looking through the occluding visualizations such as DensityMaps by disabling them in the region of interest. This enablesan interactive visual analysis, where the overview is providedwith one set of techniques, and details are shown with other setof visualizations. The usage example is given in figure 9c.
The 3D Magic Lens visualization can be used in two modes: a side-by-side mode (figure 9a), and a conventional magic lens mode (fig-ure 9b,c).
7. Evaluation and Results
From the beginning of this work, we closely collaborated withmaterial engineers from the industrial company Borealis AG. Thecompany is focused on the production of polyolefins. During ourcollaboration, Borealis AG provided us with test specimens, whichare made of the Fibremod GD301 material. Our goal was to createapproaches for analyzing 4DCT data and to develop a tool, whichimplements these approaches. The tool was developed for and is
Average pointsFinal fracture surface
Ray
dire
ctio
n
(a)
(b)
Figure 10: To calculate the Final Fracture Surface rays are castedfrom top to bottom. An average position of defects is calculatedfor each ray (a). The resulting height-map is then smoothed andreconstructed into a 3D mesh (b).
mainly used by material engineers of UASUA. At the beginning ofthe project, we had several meetings with material engineers. Dur-ing these meetings we identified and specified the analysis tasksgiven in section 2. We then aimed to support the tasks with ourapproaches. We regularly had internal meetings with the materialengineers of UASUA. During these meetings, we discussed newideas and refined existing ones. We started from initial ideas anditeratively improved and developed them while staying in a closefeedback loop with the users. If we required additional input, wecontacted Borealis AG and discussed the open topics. For example,we learned that all the four defect types are interesting to the ma-terial engineers and there are no types, which we could ignore. Inaddition, we discussed where the transition limits between defectstypes are (e.g., when a fiber pull-out becomes a matrix fracture).Together with the partner, we frequently assessed the correctnessof our assumptions. In addition, we regularly demonstrated our ap-proaches and results. We got a positive feedback concerning resultsof the Defect Classifier tool. They were very much interested inthe automatic defect classification and found the tool as very usefulconcerning the description of the fracture mechanism. The utility ofthe Density Viewer tool was estimated highly as well. In the DefectDensity Maps, they appreciated that it highlighted regions of a highdensity and enables finding correlations between internal materialcharacteristics and these regions. In the 3D version of the DensityMaps they liked that it can provide a description of the materialdestruction process with a visualization technique that is easy tointerpret. Material engineers also appreciated the ability to quicklycompare different 4DCT datasets as well as different stages of asingle tensile test with each other.
Additionally, we interviewed a material engineer at UASUAwho is one of the main users of our software. We asked about thesoftware usability and the usefulness of the developed tools, andwhether they met the defined goals. In general, the user appreciatesthat the approach with a single 3D scene is interesting and agile.Regarding the individual visualization tools, we have got thefollowing feedback:Defect Classifier: Similar to the material engineers from BorealisAG we got a positive feedback about the tool. The intervieweethought that the provided defect extraction and classificationprovides important information for the 4DCT analysis.
c© 2016 The Author(s)Computer Graphics Forum c© 2016 The Eurographics Association and John Wiley & Sons Ltd.
207

A. Amirkhanov et al. / Visual Analysis of Defects in Glass Fiber Reinforced Polymers for 4DCT Interrupted In situ Tests
(a) (c)
Low defect density
High defect density
(b)
All defects
Fiber pull-outs
Fiber fracturesMatrix fractures
Fiber/matrixdebondings
Figure 9: The usage scenarios of the 3D Magic Lens: (a) Comparing two stages (244 N and 260 N) of Dataset 2 in the side-by-side mode.Defects are highlighted for the 260 N stage. (b) Comparing a Defect Density Map of all defects to the Density Maps for matrix fractures(blue), fiber/matrix debondings (green), fiber pull-outs (yellow), and fiber fractures (red). The 440 N stage of Dataset 3 is used. (c) Exploringthe Density Map isosurface with high density (red) together with the 2D slice of CT data in the context of isosurface with low density (blue).
Defect Viewer: The material engineer’s opinion is that the DefectViewer’s concept fits well into the visualization the toolbox.The tool integrates well into the 3D scene and is well suited forcombining and interacting with other tools in the toolbox.Defect Density Maps: The value of this tool was evaluated ashigh. The material engineer felt that Defect Density Maps help ingaining important information about the defects’ distribution aswell as finding a correspondence between internal characteristicsand the damage (final fracture shape and the number of defectsclose to it).Final Fracture Surface: The material engineer appreciated "anice overview of the fracture" that this tool provides. He alsomentioned that the possibility of measuring the distance betweenthe highest and the lowest points would be of use to him.3D Magic Lens: The tool was highly commended due to itsflexibility and ability to supplement many other tools in solving anumber of tasks. The interviewee appreciated that the interactivecomparative visualizations provided by the 3D Magic Lensallowed him to observe and analyze the fracture evolution.
8. Use cases
Use case 1: Using the Final Fracture Surface a material engineercompared fractures of specimens with different major fiber orien-tations, i.e., 0◦ orientation (Datasets 1 and 3) and 90◦ orientation(Dataset 2). Before the fracture extraction, material engineers as-sumed that the specimen with the 90◦ fiber orientation will havethe flattest fracture surface of all three. The visualization resultsprovided by the Final Fracture Surface confirmed this assumption(see figure 10). The results show that the 0◦ fiber orientation frac-ture has higher peaks, more variance, and a larger distance betweenthe maximum and minimum points.Use case 2: To evaluate defect distributions the users have built
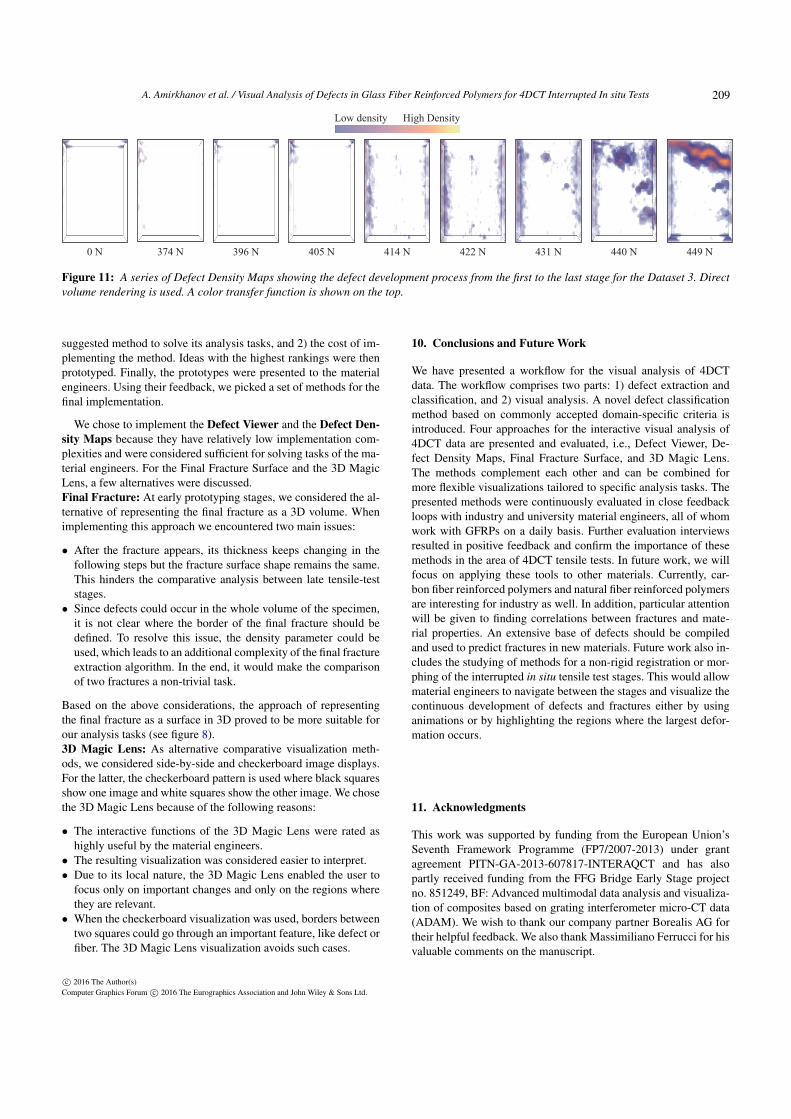
density maps for defects of each type (see figure 6). The visualiza-tions clearly show that matrix fractures are located mostly in theregion of the final fracture while fiber pull-outs and fiber fracturesare distributed in a wider region. However, a more detailed analysisusing the Defect Viewer and the 3D Magic Lens tools revealed thatall defects contributed to the development of the final fracture. Thefracture developed in the areas with the highest densities of matrixfractures, while several fibers adjacent to the final fracture had fiberfractures and fiber pull-outs on both ends. As fiber pull-outs oftenoccur at the fiber ends that point away from the final fracture, fiberpull-outs are characterized by a wider distribution.Use case 3: First, to get an overview, the user compares densitymaps of all defect types for all the stages of the tensile test (fig-ure 11). It can be seen that the 440 N stage is of high importance:defects accumulate critical mass before the final crack is formed.The user then chooses to investigate this stage in more detail usingthe 3D Magic Lens by visualizing distributions of individual de-fects in the context of the total defect density (figure 9b). It can beseen that there are many fiber/matrix debondings and matrix cracksin the center of the top area. Therefore, this is the weakest region,where the final crack will appear. Finally, the user applies the 3DMagic Lens showing areas with the highest defect density in thecontext of the CT data to study individual defects in the weakestregion after the final crack has formed (figure 9c).
9. Discussion of Design Choices
The aim of this work is to provide material engineers with methodsfor 4DCT visualization and analysis. We organized the design anddevelopment process in the following way. First, together with ma-terial engineers, we formalized their requirements and needs into aset of tasks (provided in section 2). Then, in a series of discussions,we defined the methods that would be prototyped. Each idea for anew method was ranked based on two criteria: 1) the ability of the
c© 2016 The Author(s)Computer Graphics Forum c© 2016 The Eurographics Association and John Wiley & Sons Ltd.
208
A. Amirkhanov et al. / Visual Analysis of Defects in Glass Fiber Reinforced Polymers for 4DCT Interrupted In situ Tests
0 N 374 N 396 N 405 N 414 N 422 N 431 N 440 N 449 N
Low density High Density
Figure 11: A series of Defect Density Maps showing the defect development process from the first to the last stage for the Dataset 3. Directvolume rendering is used. A color transfer function is shown on the top.
suggested method to solve its analysis tasks, and 2) the cost of im-plementing the method. Ideas with the highest rankings were thenprototyped. Finally, the prototypes were presented to the materialengineers. Using their feedback, we picked a set of methods for thefinal implementation.
We chose to implement the Defect Viewer and the Defect Den-sity Maps because they have relatively low implementation com-plexities and were considered sufficient for solving tasks of the ma-terial engineers. For the Final Fracture Surface and the 3D MagicLens, a few alternatives were discussed.Final Fracture: At early prototyping stages, we considered the al-ternative of representing the final fracture as a 3D volume. Whenimplementing this approach we encountered two main issues:
• After the fracture appears, its thickness keeps changing in thefollowing steps but the fracture surface shape remains the same.This hinders the comparative analysis between late tensile-teststages.
• Since defects could occur in the whole volume of the specimen,it is not clear where the border of the final fracture should bedefined. To resolve this issue, the density parameter could beused, which leads to an additional complexity of the final fractureextraction algorithm. In the end, it would make the comparisonof two fractures a non-trivial task.
Based on the above considerations, the approach of representingthe final fracture as a surface in 3D proved to be more suitable forour analysis tasks (see figure 8).3D Magic Lens: As alternative comparative visualization meth-ods, we considered side-by-side and checkerboard image displays.For the latter, the checkerboard pattern is used where black squaresshow one image and white squares show the other image. We chosethe 3D Magic Lens because of the following reasons:
• The interactive functions of the 3D Magic Lens were rated ashighly useful by the material engineers.
• The resulting visualization was considered easier to interpret.• Due to its local nature, the 3D Magic Lens enabled the user to
focus only on important changes and only on the regions wherethey are relevant.
• When the checkerboard visualization was used, borders betweentwo squares could go through an important feature, like defect orfiber. The 3D Magic Lens visualization avoids such cases.
10. Conclusions and Future Work
We have presented a workflow for the visual analysis of 4DCTdata. The workflow comprises two parts: 1) defect extraction andclassification, and 2) visual analysis. A novel defect classificationmethod based on commonly accepted domain-specific criteria isintroduced. Four approaches for the interactive visual analysis of4DCT data are presented and evaluated, i.e., Defect Viewer, De-fect Density Maps, Final Fracture Surface, and 3D Magic Lens.The methods complement each other and can be combined formore flexible visualizations tailored to specific analysis tasks. Thepresented methods were continuously evaluated in close feedbackloops with industry and university material engineers, all of whomwork with GFRPs on a daily basis. Further evaluation interviewsresulted in positive feedback and confirm the importance of thesemethods in the area of 4DCT tensile tests. In future work, we willfocus on applying these tools to other materials. Currently, car-bon fiber reinforced polymers and natural fiber reinforced polymersare interesting for industry as well. In addition, particular attentionwill be given to finding correlations between fractures and mate-rial properties. An extensive base of defects should be compiledand used to predict fractures in new materials. Future work also in-cludes the studying of methods for a non-rigid registration or mor-phing of the interrupted in situ tensile test stages. This would allowmaterial engineers to navigate between the stages and visualize thecontinuous development of defects and fractures either by usinganimations or by highlighting the regions where the largest defor-mation occurs.
11. Acknowledgments
This work was supported by funding from the European Union’sSeventh Framework Programme (FP7/2007-2013) under grantagreement PITN-GA-2013-607817-INTERAQCT and has alsopartly received funding from the FFG Bridge Early Stage projectno. 851249, BF: Advanced multimodal data analysis and visualiza-tion of composites based on grating interferometer micro-CT data(ADAM). We wish to thank our company partner Borealis AG fortheir helpful feedback. We also thank Massimiliano Ferrucci for hisvaluable comments on the manuscript.
c© 2016 The Author(s)Computer Graphics Forum c© 2016 The Eurographics Association and John Wiley & Sons Ltd.
209
A. Amirkhanov et al. / Visual Analysis of Defects in Glass Fiber Reinforced Polymers for 4DCT Interrupted In situ Tests
References[Avi] Avizo 3d software. http://www.fei.com/software/avizo3d/. Accessed: 2016-03-07. 2
[BMH∗14] BHOWMIK U., MANDALA D., HUDYMA N., KREIDL O.,HARRIS A.: Segmentation of cracks in X-ray CT images of testedmacroporous plaster specimens. In SOUTHEASTCON 2014, IEEE(March 2014), pp. 1–8. 4
[FHG∗09] FRITZ L., HADWIGER M., GEIER G., PITTINO G.,GRÖLLER M. E.: A Visual Approach to Efficient Analysis and Quan-tification of Ductile Iron and Reinforced Sprayed Concrete. IEEE TVCG15, 6 (October 2009), 1343–1350. 3
[FRI89] FRIEDRICH K.: Chapter 11 - fractographic analysis of poly-mer composites. In Application of Fracture Mechanics to CompositeMaterials, Friedrich K., (Ed.), vol. 6 of Composite Materials Series. El-sevier, 1989, pp. 425 – 487. 2
[Gra06] GRADY L.: Random walks for image segmentation. PatternAnalysis and Machine Intelligence, IEEE Transactions on 28, 11 (Nov2006), 1768–1783. 4
[HHN00] HAVRE S., HETZLER B., NOWELL L.: Themeriver: visualiz-ing theme changes over time. In Information Visualization, 2000. InfoVis2000. IEEE Symposium on (2000), pp. 115–123. 3
[HKG07] HEINZL C., KASTNER J., GRÖLLER M. E.: Surface Extrac-tion from Multi-Material Components for Metrology using Dual En-ergy CT. Tech. Rep. TR-186-2-07-06, Institute of Computer Graphicsand Algorithms, Vienna University of Technology, Favoritenstrasse 9-11/186, A-1040 Vienna, Austria, May 2007. human contact: [email protected]. 3
[HLRS∗08] HADWIGER M., LAURA F., REZK-SALAMA C., HÖLLT T.,GEIER G., PABEL T.: Interactive volume exploration for feature detec-tion and quantification in industrial ct data. Visualization and ComputerGraphics, IEEE Transactions on 14, 6 (Nov 2008), 1507–1514. 3
[HMMW03] HUANG R., MA K.-L., MCCORMICK P., WARD W.: Visu-alizing Industrial CT Volume Data for Nondestructive Testing Applica-tions. In IEEE Visualization 2003 Conference (October 2003), pp. 547–554. 3
[ITK] The insight segmentation and registration toolkit. www.itk.org.Accessed: 2016-03-07. 4
[LT12] LANDSTROM A., THURLEY M.: Morphology-based crack detec-tion for steel slabs. Selected Topics in Signal Processing, IEEE Journalof 6, 7 (Nov 2012), 866–875. 3
[Ots79] OTSU N.: A threshold selection method from gray level his-tograms. IEEE Trans. Systems, Man and Cybernetics 9 (1979), 62–66.4
[PBP∗15] PAETSCH O., BAUM D., PROHASKA S., EHRIG K., MEINELD., EBELL G.: 3D Corrosion Detection in Time-dependent CT Imagesof Concrete. In Digital Industrial Radiology and Computed Tomography(June 2015). 4
[RAK∗15] REH A., AMIRKHANOV A., KASTNER J., GRÖLLER E.,HEINZL C.: Fuzzy feature tracking: Visual analysis of industrial 4d-xctdata. Computers & Graphics 53, Part B (2015), 177 – 184. 4
[RGK∗13] REH A., GUSENBAUER C., KASTNER J., GRÖLLER M. E.,HEINZL C.: Mobjects - a novel method for the visualization and in-teractive exploration of defects in industrial xct data. Visualization andComputer Graphics, IEEE Transactions on 19, 12 (Dec. 2013), 2906–2915. 3
[RSR15] ROLLAND H., SAINTIER N., ROBERT G.: Fatigue Mecha-nisms Description in Short Glass Fibre Reinforced Thermoplastic ByMicrotomographic Observations. In Proc. 20th International Confer-ence on Composite Materials (2015), Thomsen O. T., (Ed.). 5
[SKK∗11] SALABERGER D., KANNAPPAN K. A., KASTNER J.,REUSSNER J., AUINGER T.: Evaluation of Computed Tomography Datafrom Fibre Reinforced Polymers to Determine Fibre Length Distribution.International Polymer Processing 26, 3 (July 2011), 283–291. 3, 4
[SW97] SILVER D., WANG X.: Tracking and visualizing turbulent 3dfeatures. Visualization and Computer Graphics, IEEE Transactions on3, 2 (Apr 1997), 129–141. 3
[VGS] VGStudio Max: basic functionality. http://www.volumegraphics.com/en/products/vgstudio-max/basic-functionality/. Accessed: 2016-03-07. 2
[vPOBB∗10] VAN PELT R., OLIVAN BESCOS J., BREEUWER M.,CLOUGH R., GRÖLLER E., TER HAAR ROMENIJ B., VILANOVA A.:Exploration of 4d mri blood flow using stylistic visualization. Visualiza-tion and Computer Graphics, IEEE Transactions on 16, 6 (Nov 2010),1339–1347. 3
[WAL∗14] WEISSENBÖCK J., AMIRKHANOV A., LI W., REH A.,AMIRKHANOV A., GRÖLLER M. E., KASTNER J., HEINZL C.: Fiber-scout: An interactive tool for exploring and analyzing fiber reinforcedpolymers. In Proceedings of 2014 IEEE Pacific Visualization Symposium(PacificVis) (2014) (Mar. 2014), IEEE Computer Society, pp. 153–160.3
[WCBP12] WIDANAGAMAACHCHI W., CHRISTENSEN C., BREMERP.-T., PASCUCCI V.: Interactive exploration of large-scale time-varyingdata using dynamic tracking graphs. In Large Data Analysis and Visual-ization (LDAV), 2012 IEEE Symposium on (Oct 2012), pp. 9–17. 4
[YNH08] YAMAGUCHI T., NAKAMURA S., HASHIMOTO S.: An effi-cient crack detection method using percolation-based image processing.In Industrial Electronics and Applications, 2008. ICIEA 2008. 3rd IEEEConference on (June 2008), pp. 1875–1880. 4
[ZYZ10] ZHOU H., YANG S., ZHU J.: Illumination Invariant En-hancement and Threshold Segmentation Algorithm for Asphalt Pave-ment Crack Image. In Wireless Communications Networking and Mo-bile Computing (WiCOM), 2010 6th International Conference on (Sept2010), pp. 1–4. 3
c© 2016 The Author(s)Computer Graphics Forum c© 2016 The Eurographics Association and John Wiley & Sons Ltd.
210