Embed Size (px)
Citation preview
CRC REEF RESEARCH TECHNICAL REPORT
VISITOR EXPERIENCES AND PERCEIVED CONDITIONS ON DAY
TRIPS TO THE GREAT BARRIER REEF
C. Scott Shafer, Graeme J. Inglis, Victoria Y. Johnson and Nadine A. Marshall
CRC Reef Research Centre A report funded by the CRC Reef Research Centre. The CRC Reef Research Centre was established under the Australian Government’s Cooperative Research Centres Program. The Centre, established in 1993, undertakes an integrated program of applied research and development, training and education, aimed at increasing opportunities for ecologically sustainable development of the Great Barrier Reef and providing an improved scientific basis for Reef management and regulatory decision making.
CRC Reef Research Centre c/- James Cook University TOWNSVILLE Q 4811 Phone: (07) 4781 4796 Fax: (07) 4781 4099
Email: [email protected]
? Cooperative Research Centre for Ecologically Sustainable Development of the Great Barrier Reef National Library of Australia Cataloguing-in-Publication entry C. Scott Shafer, Graeme J. Inglis, Victoria Y. Johnson & Nadine A. Marshall
Visitor experiences and perceived conditions on day trips to the Great Barrier Reef.
Bibliography. Includes index. ISBN 1 876054 75 1 1. Recreational surveys - Queensland - Great Barrier Reef. 2. Tourist trade - Environmental aspects - Queensland - Great Barrier Reef. 3. Great Barrier Reef (Qld.) - Recreational use. I. Shafer, C. Scott. II. Cooperative Research Centre for Ecologically Sustainable Development of the Great Barrier Reef (Australia). (Series: CRC Reef Research technical report; 21). 338.4791943 This publication should be cited as: C. Scott Shafer, Graeme J. Inglis, Victoria Y. Johnson & Nadine A. Marshall (1998) Visitor experiences and perceived conditions on day trips to the Great Barrier Reef. CRC Reef Research Centre Technical Report No. 21. Townsville; CRC Reef Research Centre, 76 pp. This work is copyright. The Copyright Act 1968 permits fair dealing for study, research, news reporting, criticism or review. Selected passages, tables or diagrams may be reproduced for such purposes provided acknowledgement of the source is included. Major extracts of the entire document may not be reproduced by any process without written permission of the Director, CRC Reef Research Centre. Published by the Cooperative Research Centre for Ecologically Sustainable Development of the Great Barrier Reef ? 1998 Further copies may be obtained from CRC Reef Research Centre, c/- James Cook University Post Office, Townsville, QLD 4811. Printed by James Cook University.
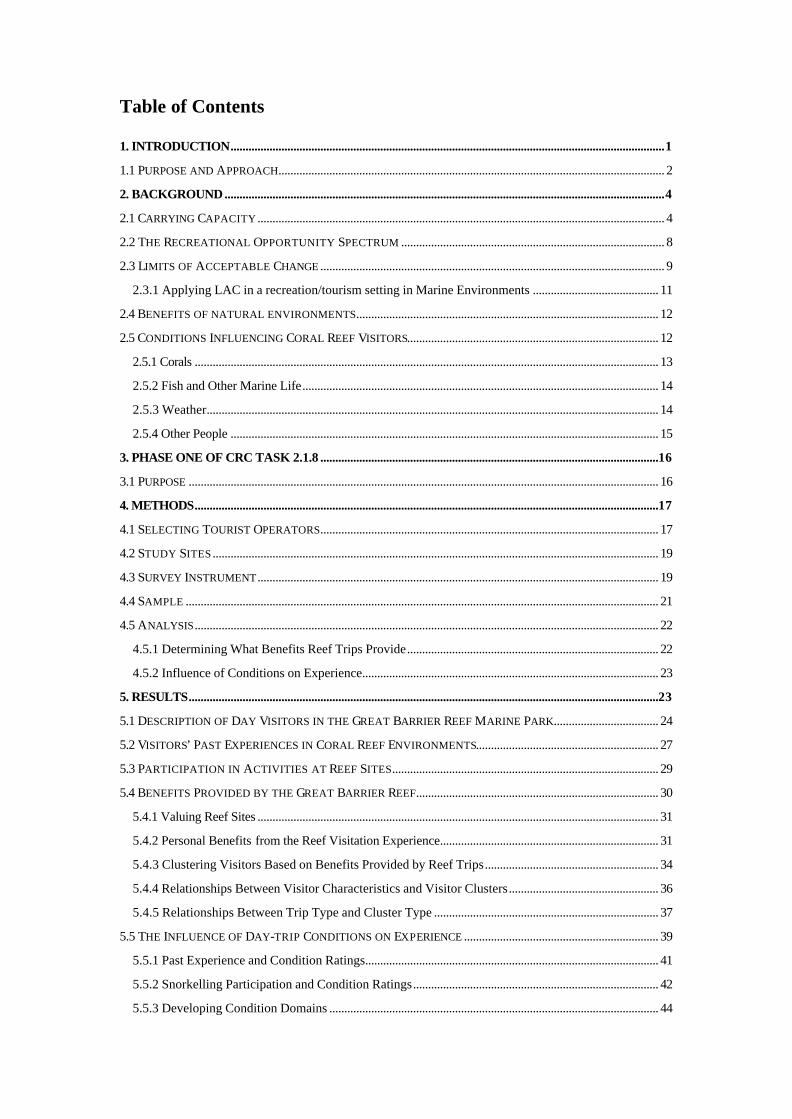
Table of Contents 1. INTRODUCTION.................................................................................................................................................1
1.1 PURPOSE AND APPROACH................................................................................................................................. 2
2. BACKGROUND...................................................................................................................................................4
2.1 CARRYING CAPACITY ........................................................................................................................................ 4
2.2 THE RECREATIONAL OPPORTUNITY SPECTRUM ........................................................................................ 8
2.3 LIMITS OF ACCEPTABLE CHANGE ................................................................................................................... 9
2.3.1 Applying LAC in a recreation/tourism setting in Marine Environments .......................................... 11
2.4 BENEFITS OF NATURAL ENVIRONMENTS..................................................................................................... 12
2.5 CONDITIONS INFLUENCING CORAL REEF VISITORS.................................................................................... 12
2.5.1 Corals ........................................................................................................................................................... 13
2.5.2 Fish and Other Marine Life....................................................................................................................... 14
2.5.3 Weather....................................................................................................................................................... 14
2.5.4 Other People ............................................................................................................................................... 15
3. PHASE ONE OF CRC TASK 2.1.8 .................................................................................................................16
3.1 PURPOSE ............................................................................................................................................................. 16
4. METHODS...........................................................................................................................................................17
4.1 SELECTING TOURIST OPERATORS................................................................................................................. 17
4.2 STUDY SITES ..................................................................................................................................................... 19
4.3 SURVEY INSTRUMENT ...................................................................................................................................... 19
4.4 SAMPLE .............................................................................................................................................................. 21
4.5 ANALYSIS........................................................................................................................................................... 22
4.5.1 Determining What Benefits Reef Trips Provide.................................................................................... 22
4.5.2 Influence of Conditions on Experience................................................................................................... 23
5. RESULTS.............................................................................................................................................................23
5.1 DESCRIPTION OF DAY VISITORS IN THE GREAT BARRIER REEF MARINE PARK................................... 24
5.2 VISITORS’ PAST EXPERIENCES IN CORAL REEF ENVIRONMENTS............................................................. 27
5.3 PARTICIPATION IN ACTIVITIES AT REEF SITES......................................................................................... 29
5.4 BENEFITS PROVIDED BY THE GREAT BARRIER REEF................................................................................. 30
5.4.1 Valuing Reef Sites ...................................................................................................................................... 31
5.4.2 Personal Benefits from the Reef Visitation Experience......................................................................... 31
5.4.3 Clustering Visitors Based on Benefits Provided by Reef Trips.......................................................... 34
5.4.4 Relationships Between Visitor Characteristics and Visitor Clusters.................................................. 36
5.4.5 Relationships Between Trip Type and Cluster Type ........................................................................... 37
5.5 THE INFLUENCE OF DAY-TRIP CONDITIONS ON EXPERIENCE ................................................................. 39
5.5.1 Past Experience and Condition Ratings.................................................................................................. 41
5.5.2 Snorkelling Participation and Condition Ratings.................................................................................. 42
5.5.3 Developing Condition Domains .............................................................................................................. 44
5.5.4 The Influence of Conditions Across Operators/Sites.......................................................................... 45
6. DISCUSSION......................................................................................................................................................50
6.1 COUNTRY OF CITIZENSHIP AND PAST VISITATION ................................................................................... 51
6.2 CONTRIBUTION OF ACTIVITY PARTICIPATION TO EXPERIENCE ........................................................... 53
6.3 TAKING AN EXPERIENCE-BASED APPROACH TO LAC ON THE GBR...................................................... 59
6.4 IMPLICATIONS FOR MANAGERS AND TOURIST OPERATORS .................................................................... 62
6.4.1 Opportunity Classes on Coral Reefs....................................................................................................... 62
6.4.2 Selecting Indicators ................................................................................................................................... 63
7. CONCLUSION ...................................................................................................................................................64
8. ACKNOWLEDGMENTS ..................................................................................................................................65
9. REFERENCES .....................................................................................................................................................66
10. APPENDICES ...................................................................................................................................................73
List of Tables Table 1. The gender of day-trip visitors to the GBRMP by operator.............................................................. 23
Table 2. The age distribution of day-trip visitors to the GBRPM by operator.............................................. 23
Table 3. The maximum level of education for day-trip visitors to the GBRMP by operator........................ 24
Table 4. The country of citizenship of day use visitors to the GBRMP......................................................... 24
Table 5. The states in which Australian day use visitors to the GBRMP resided ........................................ 25
Table 6. The types of groups that day use visitors to the GBRMP travelled with ....................................... 25
Table 7. Response of day use visitors to the GBRMP to the question: Had you ever visited the Great
Barrier Reef Marine Park before today?............................................................................................ 26
Table 8. Amount of time past since visitors’ last trip to a reef in the GBRMP.............................................. 27
Table 9. The sections of the GBRMP in which visitors had taken their most recent trip............................. 27
Table 10. Rates of visitors participation in on-site activities across the four operators in the sample...... 28
Table 11. Visitors’ perceptions of the importance of nine potential uses to the value of places in the
GBRMP.................................................................................................................................................. 30
Table 12. Visitors’ perceptions of how much their trip to the GBRMP provided 16 possible benefits...... 30
Table 13. Reef trip benefit domains resulting from a factor analysis of visitor scores on 16 benefit items 31
Table 14. Five GBRMP visitor clusters, based on how much of the four benefit domains were provided
by reef trips........................................................................................................................................... 32
Table 15. Comparisons of characteristics of visitors travelling to the outer Great Barrier Reef dependent
on benefit cluster membership........................................................................................................... 33
Table 16. Relationship between visitors benefit cluster membership and type of operator used to access
the GBRMP........................................................................................................................................... 35
Table 17. Comparison of visitors’ overall experience rating based on benefit cluster membership ........... 35
Table 18. Visitor perceptions of the influence of 24 conditions on their experience .................................... 36
Table 19. A comparison of ratings of the number of people on the trip by visitors who travelled with
small and large tourist operators in the GBRMP............................................................................. 37
Table 20. Comparisons of demographic characteristics between visitors who participated in snorkelling
and those who did not during day-trips to the outer Great Barrier Reef..................................... 39
Table 21. Comparisons of mean condition ratings between visitors who participated in snorkelling and
those who did not during day-trips to the outer Great Barrier Reef with operators who offered
“dry” viewing activities on-site. ........................................................................................................ 40
Table 22. Condition domains developed based on visitor perception of influence on their experience ... 42
Table 23. Comparison of the perceived influence of condition domains on enjoyment among visitors on
six different trips to reef areas on the GBR....................................................................................... 43
Table 24. Comparison of air temperature and wind speed measures among six different trips taken to reef
areas on the GBR.................................................................................................................................. 44
List of Figures Figure 1. The Great Barrier Reef Marine Park, Australia...................................................................................... 3
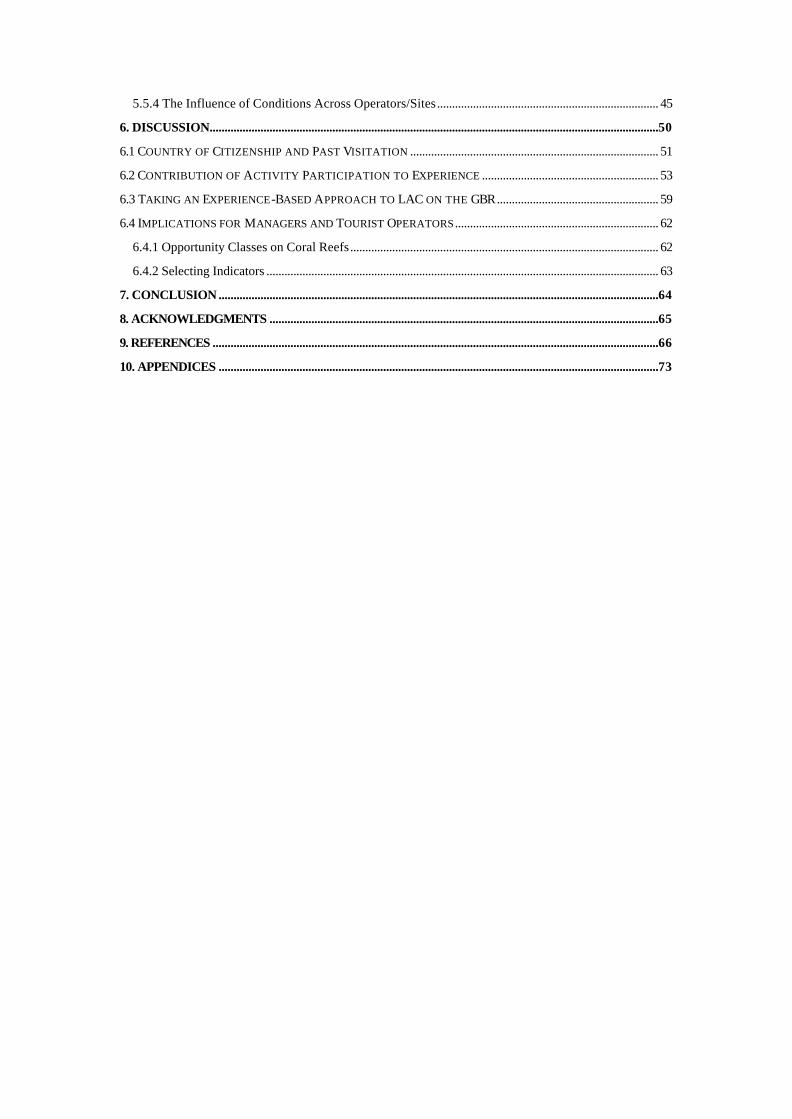
Figure 2. The Limits of Acceptable Change (LAC) planning system. (After Stankey et al. 1985).............. 10
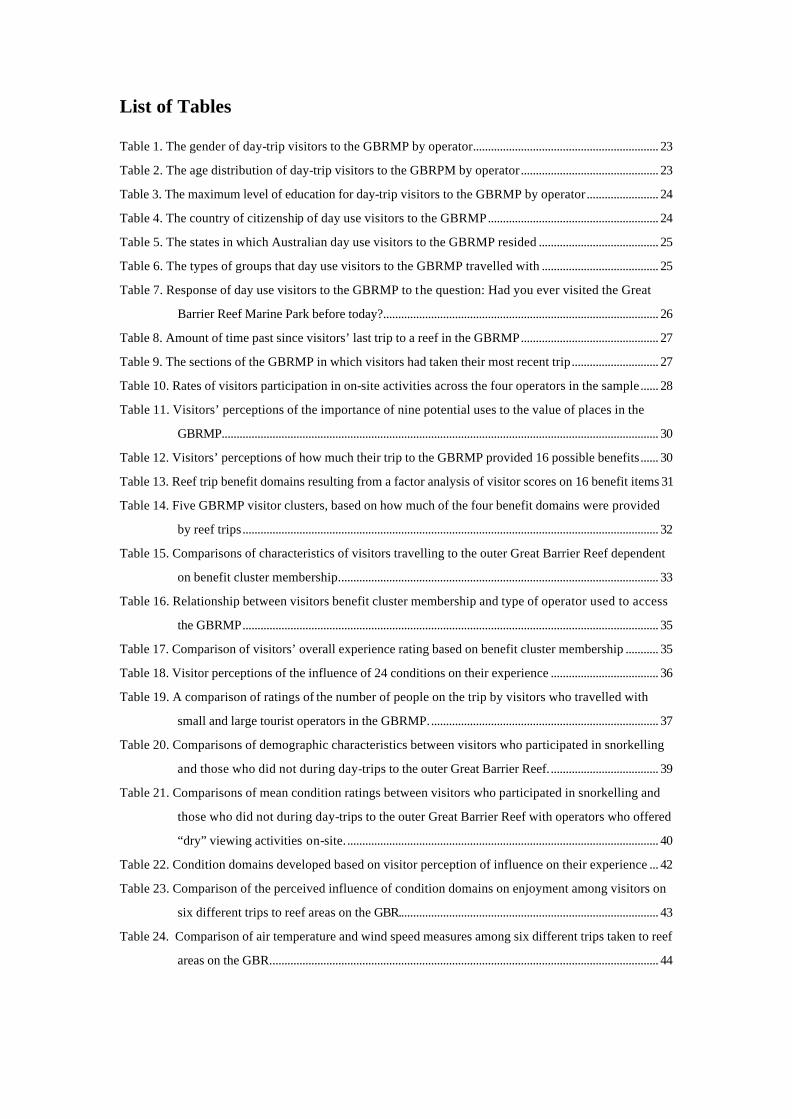
Figure 3. Comparison among mean values of influence for the “coral” and “fish” condition domains on
the experiences for visitors travelling on six different trips to reef areas on the GBR. Numerical
codes indicate the four operators used in the study. Alphabetic sub-codes denote the three
pontoon sites used by Operator 1..................................................................................................... 48
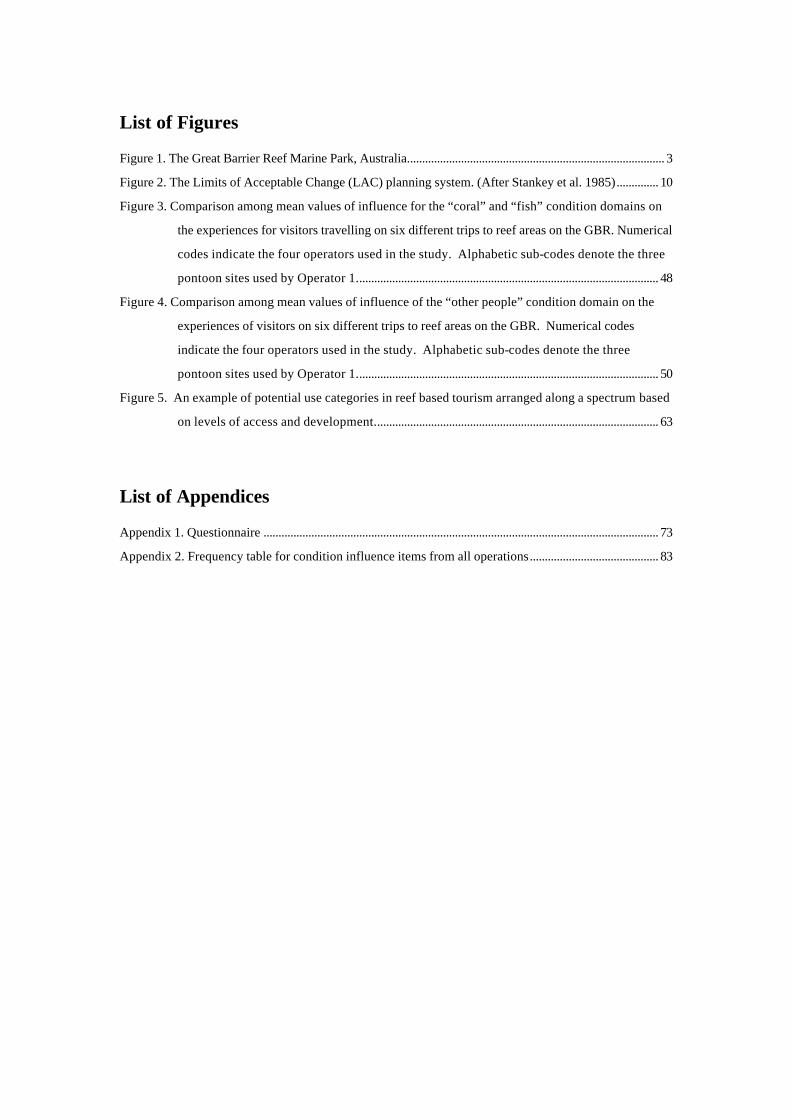
Figure 4. Comparison among mean values of influence of the “other people” condition domain on the
experiences of visitors on six different trips to reef areas on the GBR. Numerical codes
indicate the four operators used in the study. Alphabetic sub-codes denote the three
pontoon sites used by Operator 1..................................................................................................... 50
Figure 5. An example of potential use categories in reef based tourism arranged along a spectrum based
on levels of access and development............................................................................................... 63
List of Appendices Appendix 1. Questionnaire .................................................................................................................................... 73
Appendix 2. Frequency table for condition influence items from all operations........................................... 83
i
FOREWORD
The Great Barrier Reef Marine Park is the world’s largest marine protected area and is
among the world’s first marine protected areas. The Great Barrier Reef Marine Park
Authority’s responsibility to ensure the environmental well-being of the world’s largest coral
reef system requires not only that human activities are managed for sustainability, but also that
the Authority respond positively to changing patterns of human use.
When the Marine Park was started in 1978, most human activity was extractive - taking
natural resources from the environment in the form of fishing or collecting with little
consideration of sustainability. Now, 20 years later, fishing and collecting are managed with
the objective of ecological sustainability, there has been an increasing trend towards human
activities focussed on appreciation of the Great Barrier Reef environment in the form of
tourism and recreational cruising and boating. This trend complements the World Heritage
listing of the Great Barrier Reef, and has the potential to provide many avenues for productive,
collaborative relationships between Marine Park management and interests.
Much effort has been devoted during the life of the Marine Park to understanding the
ecological processes of the Great Barrier Reef and the effect of human activities on those
processes. While our understanding is far from complete (and it is unlikely ever to be
complete), over time we have learned generally to ask the right questions that lead to sufficient
information to make management decisions. We have developed a basis for understanding
ecological processes.
We are now embarking on a similar learning process in relation to human use and perceptions
of the Great Barrier Reef, but with two important differences. The first is that while the
Authority has a role in creating suitable conditions for a diversity of experiences and
appreciation of the Marine Park, it is a role that must necessarily be shared. Indeed it may
only be effective with the cooperation and active participation of other interests such as the
public and the marine tourism industry. The second is that most decisions required in this
process will necessarily be of the type this report refers to as “wicked” decisions, by which an
outcome is not necessarily ‘correct’ in an abstract sense, but is nevertheless useful. It is
desirable that Marine Park stakeholders and interests are participants in developing and
ii
implementing any management regime. It is essential that they are involved when the purpose
of managing human use is only or primarily how it affects other human use.
This report is an important contribution to the processes of understanding the more subtle
values people attribute to the Great Barrier Reef and of exploring systematically how that
understanding can be better developed, practically implemented; and to providing a common
basis for consideration of the issue by Marine Park stakeholders and managers. In particular,
it demonstrates that there is a need to consider factors affecting human ‘satisfaction’ with
their experience of the Great Barrier Reef. It highlights areas where the ‘right’ questions may
now be systematically asked in order to develop cohesive policies and management systems
based on ecological, social and economic issues.
Ian McPhail
Chair
Great Barrier Reef Marine Park Authority
iii
SUMMARY
Large growth in tourism and associated infrastructure development within the Great Barrier
Reef Marine Park over the past 10 years has prompted calls for research into the carrying
capacity of coral reefs for recreation and tourism. Past research has, however, shown clearly
that attempts to determine a single numerical limit to the use of natural environments are
misguided and inevitably subjective and that limiting use alone does not adequately protect the
natural and aesthetic qualities of the resource. Contemporary planning frameworks such as
the “Limits of Acceptable Change” (LAC) model rely instead on the use of indicators and
standards of environmental quality to direct management of natural environments. These are
determined on the basis of natural and aesthetic conditions desired for the quality of the
resource by stake-holders and managers. Establishing such a framework requires an
understanding of the range of opportunities sought by visitors and the conditions that influence
perceptions of environmental quality. To date, few studies have attempted to identify specific
conditions which could be used to develop standards for determining acceptable change in
coral reef environments.
In this report, we describe the types of experiences had by day-trip visitors to the GBR and
the conditions that influenced them. Our purpose was to examine the range of qualities (or
“benefits”) that visitors seek from a reef trip and how the attainment of these qualities is
modified by the natural and social environments experienced on the trips and by characteristics
of the respondents themselves. The study had seven principal objectives:
1) To determine the types of people who visit the GBR on day-trips and how they vary in the
way they perceive the GBR.
2) To determine if and how activities (particularly snorkelling), in which visitors were involved,
influenced their perceptions.
3) To determine what visitors value about reef sites.
4) To determine if visitors to natural marine areas receive similar levels of benefits and react
to environmental conditions in ways similar to those reported for terrestrial environments.
5) To determine the conditions present during the reef experience that were most influential
on visitors’ experiences and thus useful in the selection of indicators in a LAC process.
6) To determine the range of experiences that exists which might contribute to a “spectrum”
approach to managing tourist day-trips on the Great Barrier Reef.
iv
7) To determine the extent to which “large” and “small” tourism operations accessing the
GBR may be providing different types of experiences.
Self-administered questionnaires were completed by 1,922 day-trip visitors to the Great Barrier
Reef Marine Park, between June 1995 and February 1996. Respondents were passengers on
one of four tourism operations that visited reef sites in the Cairns or Central Sections of the
Marine Park. Two of the operations were based at offshore pontoons and transported up to
450 passengers per day (“large” operations), whilst the remaining two carried fewer than 50
passengers daily (“small” operations). Questionnaires were provided in three languages
(English, German and Japanese) and were administered on repeated trips with each operator
throughout the 9 month period to encompass a range of seasonal and weather conditions. The
questionnaire was designed to measure different attitudinal, behavioural and demographic
characteristics. Visitors were asked to rate how much the trip provided them with different
benefits as a part of their experiences (e.g., get some exercise, meet people, learn about a
coral reef) and the influence that different physical, biological and social conditions had on
their enjoyment of the trip. Demographic information was used to characterise the experience
according to different types of visitors.
The survey received a good response rate (97%). Respondents came from 33 different
countries, but were mostly from Australia (41%), Japan (14%), Britain (14%) and the USA
(13%). A large proportion of visitors (45%) on the trips had not previously visited a coral reef
and only 27 % had been to the Great Barrier Reef before. Of those who had, approximately
33 % had made their previous trip to the GBR within the preceding week.
Four main classes of benefits were identified from the responses: (1) experiencing nature, (2)
relaxing and escaping from normal routines, (3) excitement with family and friends, and (4)
being physically active. Experiencing nature generally rated as the most important benefit,
whilst social interactions and experiencing solitude were only moderately important. Five
general types of reef visitors were identified on the basis of these benefit classes: (1) people
who predominantly escaped from their normal routine and experienced nature, (2) visitors who
shared their experience of the natural environment with friends and family, (3) those who
experienced nature without taking part in physical activities (e.g. snorkelling), (4) people who
were very enthusiastic about all aspects of the trip, and (5) people who were generally not
enthusiastic about any particular part of the trip. The five groupings were characterised by
v
important demographic differences. For example, Japanese visitors were more likely to be
members of groups (2) and (5). The “enthusiasts” group (4) was generally younger than other
groups, more likely to have participated in snorkelling and contained a large proportion of
female Australian visitors. Both the less-active (group 3) and unenthusiastic visitors (group 5)
were more likely to be male and included a large proportion of people who did not snorkel.
Most of the questions on conditions experienced during the trip were rated as positive
influences on the visitors’ enjoyment. The most influential items related to natural features of
the environment (aspects of the corals and fishes) and services offered by the staff,
respectively. The more neutral, and in some cases negative, influences related to the number
of people or human-made structures present at the site and to the physical weather and water
conditions.
The influence of biophysical conditions on enjoyment was remarkably consistent across
operations with only slight, site-specific variations. There were, however, important
differences between the experiences offered by “small” and “large” operators. In general,
small operators carried a larger proportion of younger passengers and return visitors to the
GBRMP. Participation in snorkelling and diving was also generally greater on the small boats.
Visitors on small operations were also more likely to rate the social conditions of the trip,
including the number of other people, as a positive influence than were visitors to the pontoon
sites. The relative proportions of “enthusiastic” (group 3) and “indifferent” (group 5) reef
visitors also varied among small and large operations, with the former being most represented
on small boats and the latter on trips to pontoons.
This study reveals a range of reef experiences within and among different types of day-visits
to the GBRMP. Natural conditions at the visited sites were overridingly the most important
influences on enjoyment of the trips, but visitors showed little discrimination among sites with
substantially different coral assemblages and settings. There were, however, notable
differences between large and small operations in the benefits visitors received from travelling
to the reef and in their perceptions of a quality experience. These related mostly to the social
conditions present during the trip. Thus, there is a need for a greater understanding by reef
and industry managers of the range of opportunities and experiences that are sought by visitors
to the GBRMP, so that planning can incorporate measures to both protect and provide for the
existing diversity of opportunities. A comprehensive knowledge will only be possible following

vi
characterisation of the experiences sought on a broader range of trip types and geographic
settings than that used in the present study.
1
1. INTRODUCTION
Australia’s Great Barrier Reef Marine Park (GBRMP) was established in 1975 to protect the
unique natural values of the Great Barrier Reef, the world’s largest continuous complex of
coral reefs. Although the principle reason for its creation was conservation of the natural
environments of the reef (GBRMP Act, 1975), the GBRMP was established as a multiple use
protected area to allow for a range of existing activities within its boundaries, including
commercial fishing and shipping, maritime and island recreation, traditional hunting and tourism
(Kenchington 1990; Craik 1992). Management of the GBRMP, therefore, seeks to optimise a
range of natural, social, cultural and economic values that are placed on the environments of
the Great Barrier Reef and its islands by the local, national and international communities.
The natural features of the GBRMP have been the focus of considerable research over the
past 20 years (Fairweather 1989), but there is only limited information available on the social
and cultural environment of the Marine Park. Growth in coastal agriculture, urbanisation,
shipping, mining and tourism within and adjacent to the park has raised concerns that some of
the aesthetic and cultural values associated with popular areas of the park are being
compromised by increased human activities (Kenchington 1991; Craik 1992). Greatest growth
has occurred in tourism. In the past 14 years, tourist visits have increased by over 100%, from
around 150,000 visitor-days in the early 1980’s to more than 1.5 million visitor-days in 1994-95
(Williams 1996). This growth is expected to continue to increase at a rate of 10% annually into
the next century (BTR 1992; Driml 1994, Williams 1996).
Changes in ship technology and infrastructure have greatly increased the range of reefs that
are accessible by tourism operations and the number of people that can be transported daily to
individual locations. Nevertheless, > 95% of all visitor-days are currently spent within < 5% of
the Marine Park, on the reefs and islands off Cairns and the Whitsunday region (Williams
1996; Dinesen & Oliver 1997). The increase in visitation to these two areas, in particular, has
raised questions among managers and other users of the GBRMP about the ability of the park
to sustain desired levels of social and biophysical quality. More specifically, there are
concerns about how much visitation individual sites within the Marine Park can sustain and to
what level they should be developed and/or directly managed. Anecdotal information suggests
that there have been significant changes in community attitudes to the development of tourism
infrastructure in the GBRMP over the past 10 years (Alder 1996; Inglis 1997), with managers,
2
residents and tourists now beginning to call for limits on certain types of activities (Carey 1993;
McPhail 1995; Alder 1996). There is, however, a paucity of information on how different
users perceive and experience the natural and social resources of the GBRMP and, therefore,
how those experiences might change with further growth in tourism. To be able to manage
the GBRMP for a range of experiences, it is first necessary to understand what those
experiences consist of and how they are influenced by change in the social and biophysical
setting, including changes in the types and amount of use.
1.1 Purpose and Approach
In this study, we attempt to apply some of the concepts developed by research on visitor
experiences in terrestrial environments to a marine (coral reef) setting. A large number of
studies has been done to understand and manage visitor experiences in terrestrial and riparian
protected areas in National Forests or on Wild and Scenic Rivers in the USA, but it is unclear
how these concepts may be applied to tourism and recreation in marine environments. Three
related concepts were used to guide the research: (1) recreational carrying capacity (Wagar
1964; Graefe et al. 1984; Stankey & McCool 1984; Shelby and Heberlein 1986), (2) the
Recreational Opportunity Spectrum (ROS) (Driver & Brown 1978; Clark & Stankey 1979)
and (3) the Limits of Acceptable Change framework (Stankey et al. 1985).
This report contains two major parts. In the first (Chapter 2), we briefly review the three
guiding concepts outlined above and examine the potential for tourism management in the
GBR based on these approaches. The second major section (Chapter 3) describes an initial
phase of research conducted to determine the relationship between perceived environmental
conditions and the experiences of day visitors to the GBR. By studying visitor use in marine
environments in ways similar to previous terrestrial studies, there is the potential to combine
perception/experience data from visitors and ecological data to manage marine protected
areas such as the GBRMP.

3
Figure 1. The Great Barrier Reef Marine Park, Australia.
4
2. BACKGROUND
2.1 Carrying Capacity Ecological carrying capacity
The idea that natural resources have an innate capacity to withstand exploitation by humans (a
“carrying capacity” or “sustainable yield”) has been a fundamental concept in environmental
management for well over 30 years (Wagar 1964). The “carrying capacity” concept has its
origins in ecology and range management, where it was used to describe the maximum
stocking rates that could be applied to natural or agricultural environments without noticeable
deterioration in the quality of the resource or the stock (Odum 1959). As modern resource
management has struggled to deal with issues of human use of natural environments, the
concept has been expanded to other disciplines and, for the past 20 years, has been used as
the theoretical basis for establishing limits to the use of natural areas by humans (Shelby &
Heberlein 1986; Stankey 1991). In a very general sense, the carrying capacity of a park or
recreation area can be described as the “amount and type of visitor use that can be
appropriately accommodated within the area” (Manning et al. 1996). The concept has most
often been used by resource managers to deal with increased recreation and tourism in
terrestrial situations. Substantial increases in visitation to marine environments in many parts
of the world, however, have recently led to attempts to estimate the carrying capacity of coral
reefs for marine tourism (e.g. Salm 1986; Hawkins & Roberts 1993, in press; Scura & van’t
Hof 1993; Davis & Tisdell 1995). Such attempts to estimate a carrying capacity for marine
tourism ignore the substantial amount of social and ecological research in terrestrial
environments which suggests that simplistic notions of a single, objectively-defined level of use
are unrealistic.
Although the carrying capacity concept has considerable heuristic value, there are a number of
practical problems involved in its implementation. The most fundamental difficulty is how to
determine the threshold capacity for use of an area. Conceptual work by Wagar (1964)
suggested that recreational settings have many different carrying capacities depending on
which part of the environment was examined. The rate and severity of deterioration in natural
conditions within a protected environment are not simply a function of the number of visitors it
receives, but are influenced by a range of other natural and human factors, including the
sensitivity of the surrounding environment to disturbance, the types of activities pursued by
5
recreationists and their behaviour in the landscape. For example, the response of terrestrial
plant communities to the impacts of bush walking and camping is influenced by the type of
vegetation in the affected area, the soil on which it occurs, and the slope, drainage, aspect and
elevation of the site and whether or not the recreationist chooses to avoid contact with the
plants (Kuss 1986, Cole & Landres 1996). The extent and spatial distribution of impacts are
determined by the degree of correspondence between the distributions of sensitive areas and
the pattern of use of the landscape by bushwalkers and campers (Marion & Cole 1996).
Rouphael & Inglis (1995, in press) have shown that similar, complex relationships exist
between the use of underwater sites by SCUBA divers and changes in the natural resource.
The ecological impacts caused by SCUBA diving are strongly influenced by the behaviour of
the divers in the water and the physical and biological characteristics of the dive site. Recent
studies have also shown that the impacts of diving can be significantly mitigated by on-site
briefings that alert divers to the ecological consequences of their behaviour (Medio et al.
1997).
Most ecological changes associated with recreational use of terrestrial parks and wilderness
areas are relatively localised and have not involved extirpation of entire populations of plants
and animals (Cole & Landres 1996). Even if this was possible, it would be difficult to establish
absolute limits to use against a background of large spatial and temporal variation in the
abundances and life-histories of the affected species (Oliver 1995). There are no objective
criteria for when an ecological community is normal or healthy and, as a consequence, it is not
possible to set a goal for the management of natural resources that does not involve some
judgement about the acceptability of change in the surrounding conditions (Shrader-Frechette
& McCoy 1993).
6
Social carrying capacity
Much of the research on environmental carrying capacities over the past 20 years has
focussed on managing the experiential aspects of recreation. Wagar (1964) and Lucas (1964)
extended the notion of carrying capacity to include the social environment of natural areas.
Social carrying capacity was defined as a level of use beyond which a person’s experience in
an environment was negatively affected by other users. Thus, optimum levels of use were
sought by examining peoples’ perception of others using the recreational setting and how the
quality of their experience was affected by the presence of others (e.g., Stankey 1973),
including the effects others had on the natural environment. By the late 1970’s, research had
shown that there were also no consistent relationships between the number of people using an
outdoor environment and the influence (positive or negative) that they had on recreational
experiences (Graefe et al. 1984; Stankey & McCool 1984; Shelby & Heberlein 1984).
Variety in the activities pursued, settings and personal expectations of different users makes a
single desirable level of use very difficult to determine. Any given natural setting is likely to
have a range of potential capacities, but the appropriate one can only be determined with
reference to well-defined management objectives for the range of activities that are desired.
Establishing carrying capacities for recreational settings involves both descriptive and
evaluative components (Shelby and Heberlein 1986). That is, it is necessary to obtain
descriptions of the relationships between the behaviours or activities of recreationists
(including the number of users) and the consequences of those behaviours (e.g., change in
quality of the experience or the environment) as a first step in setting a limit to use. Deciding
on an actual limit to the amount of use requires judgements about the desirability of the
consequences of different behaviours within the management area. Such judgements are
inevitably value-laden (Shelby & Heberlein 1984).
Carrying capacity for tourism
In the context of tourism, carrying capacity has been used to describe relationships between
use and environmental change at two different scales. The first, at a regional scale, concerns
changes in the character of destinations associated with increasing demand and development
in the region. According to Butler (1980), tourism destinations pass through six recognisable
stages of development: “exploration”, “involvement”, “development”, “consolidation”,
7
“stagnation” and “decline”. The tourism “life-cycle”, as these stages have become known,
describes changes in the market and image of a destination from its discovery and use by
small numbers of adventurous travellers, through a period of rapid growth and infrastructure
development, to a point where the number of visitors begins to stabilise and, eventually, to
decline. Recent literature (Martin & Uysal 1990) has associated the phase of decline with
exceedence of the destination’s carrying capacity for tourism, because it is often associated
with substantial changes in the surrounding natural and social environment and visitor
experiences.
The carrying capacity concept has also been used to describe relationships between individual
tourist activities and patterns of change in the physical and social environments of particular
sites, in much the same way that it has been used in studies of wildland recreation (e.g., Wall
1982; Martin & Uysal 1990; Pearce & Kirk 1986; Hall 1974; Inskeep 1987; Coccossis &
Parpairis 1992, Clark 1991). Such studies are usually smaller in scale and scope, in that they
involve a limited number of activities and do not include regional changes in the economic or
political setting of the activities.
Carrying capacity has consistently been used as the framework to discuss the potential for
limits on visitation in order to protect local social qualities (e.g., culture, friendly atmosphere)
and the natural environment (flora and fauna), but has rarely been implemented effectively as
a management strategy, because the point at which deterioration occurs is not easily measured
nor predicted, but is determined by a complex set of ecological and social conditions. The
question of how many people is too many is a complex one and simple answers do not exist.
Contemporary approaches to this issue have abandoned attempts to measure limits to use and
rely instead on indicators and standards of environmental quality (Stankey et al. 1985, Shelby
& Heberlein 1986, Graefe et al. 1990). These are chosen to reflect the conditions of resource
protection and visitor experience that are desired in the setting. Thus, the theoretical “carrying
capacity” is said to be exceeded when the standards of quality have been breached. A
number of prescriptive frameworks has been formulated to guide the development of
standards for recreational settings. To date, these have mostly been used in terrestrial
environments. Two are outlined below:
8
2.2 The Recreational Opportunity Spectrum
The recreational opportunity spectrum concept was developed by U.S. Forest Service in the
1970’s to manage increasing and diverse recreational use of its wildland areas. Understanding
the diversity of experiences sought (Driver & Brown 1978) in a wide range of environments
(Clark & Stankey 1979) was seen as a necessary first step to managing recreation resources
in a democratic fashion. In providing for high density, intensely managed experiences in
developed areas at one end of the spectrum and for solitude and freedom in preserved
wilderness landscapes at the other end, researchers stressed the benefits of providing
opportunities for everyone and not simply managing for the average experience (Shafer 1969).
In terrestrial environments, the ROS is a framework that includes six land management
classes based on the amount and type of human modification and use: 1) primitive = non-
motorised, low intensity of use, remote and undeveloped; 2) semiprimitive non-motorised; 3)
semiprimitive motorised; 4) roaded natural; 5) rural; and 6) urban = motorised, high
intensity, near to population center and highly developed. Thus, separate parks and, in some
cases, separate areas of the same park were zoned according to the land management class
that had been assigned to it. The classes were based largely on the degree of human
technology, use and modification of the park. While these classifications have provided an
easily understood management framework, research on the concept has revealed mixed
results (e.g., Virden & Knopf 1989; Yuan & McEwen 1989). It appears that recreationists
vary in the experience they seek within the opportunity spectrum depending upon the activities
they engage in. That is, the six classes that are currently specified do not appear to reflect
real and consistent classes of recreational experience.
ROS in the GBRMP
The need for a ROS-type approach to regional tourism planning in the GBRMP was identified
as early as 1980-81. A tourism workshop convened by the GBRMPA recommended that “a
variety of reef experiences be made available” and that “differences in scale and cost of
facilities will correspond to differences in function and location” (GBRMPA 1981).
Subsequent authors (Kenchington 1991, Scherl, Valentine & Millard 1993) have also proposed
the use of ROS in the GBRMP, but the concept has not been purposefully applied in the
management of marine recreation. An ROS type situation exists de facto among tourist
9
operations currently using the GBRMP, with highly developed, large volume operations and
smaller tourist boats, often accessing different sites. This has evolved without formal planning
for both recreational experience and conservation. Little work has been done to understand
the potential for systematic management of recreational or tourist activities based on such a
concept.
The ROS provides a framework for the designation and subsequent management of marine
environments with no to low use at one extreme (e.g., science reserves, wilderness areas) to
those set aside to accommodate high use at the other (e.g. floating hotels, island resorts). It is
generally assumed that, within each given classification, different environmental (social and
biophysical) conditions may be more or less important to users and/or different standards of
acceptable conditions may exist. It was this notion that led to the integration of the ROS
concept into the more current Limits of Acceptable Change (LAC) planning system. In the
LAC system, the development of opportunity classes is identified as a precursor to selecting
important conditions as indicators of an environment and the experience it offers. That is,
unlike the ROS system, opportunity classes are not prescribed, but are identified as part of the
planning process.
2.3 Limits of Acceptable Change
The Limits of Acceptable Change (LAC) (Stankey et al. 1985), Visitor Impact Management
(VIM) (Graefe et al. 1990) Carrying Capacity Assessment Process (C-CAP) (Shelby &
Heberlein 1986) and Quality Upgrading and Learning (QUAL) (Chilman, Foster and Everson
1990) have evolved as a result of the difficulties with the conventional carrying capacity
approach. These systems take very similar approaches in planning for the use of natural areas
for recreation and tourism and vary only slightly in the way they are implemented. In the
following sections, the LAC approach will be used as the basis for discussion in order to
clarify the process, without getting lost in a comparison of the different approaches.
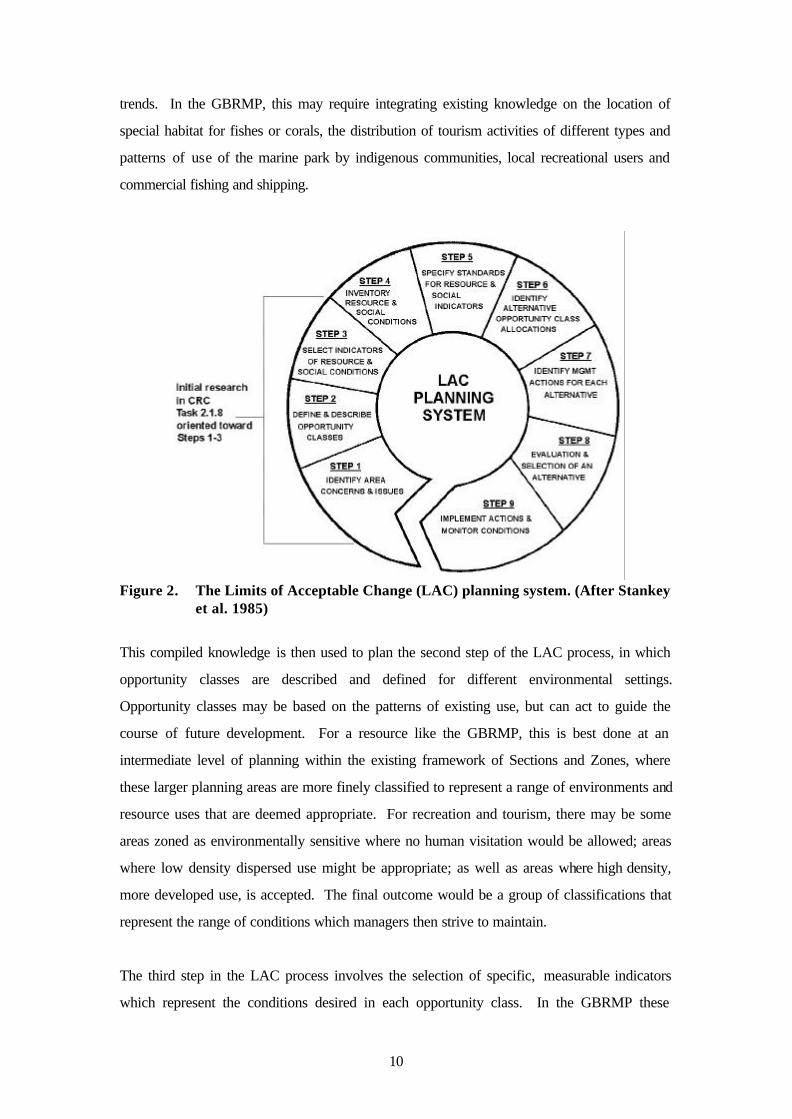
The LAC process formulated by Stankey et al. (1985) consists of nine major stages
(summarised in Fig. 2). The first involves the identification of public issues or concerns in an
area. This might, for example, involve the identification of important distinctive natural
features of the park or characteristics of human use of the park’s resources. For example, the
existence of attractive features or unusual species habitat, current use and projected use
(recreation/tourism and heavier industry) based on access to population centres or economic
10
trends. In the GBRMP, this may require integrating existing knowledge on the location of
special habitat for fishes or corals, the distribution of tourism activities of different types and
patterns of use of the marine park by indigenous communities, local recreational users and
commercial fishing and shipping.
Figure 2. The Limits of Acceptable Change (LAC) planning system. (After Stankey et al. 1985)
This compiled knowledge is then used to plan the second step of the LAC process, in which
opportunity classes are described and defined for different environmental settings.
Opportunity classes may be based on the patterns of existing use, but can act to guide the
course of future development. For a resource like the GBRMP, this is best done at an
intermediate level of planning within the existing framework of Sections and Zones, where
these larger planning areas are more finely classified to represent a range of environments and
resource uses that are deemed appropriate. For recreation and tourism, there may be some
areas zoned as environmentally sensitive where no human visitation would be allowed; areas
where low density dispersed use might be appropriate; as well as areas where high density,
more developed use, is accepted. The final outcome would be a group of classifications that
represent the range of conditions which managers then strive to maintain.
The third step in the LAC process involves the selection of specific, measurable indicators
which represent the conditions desired in each opportunity class. In the GBRMP these
11
indicators might represent biophysical conditions relating to the natural environment or social
conditions related to the presence of structures or other people, or conflicts between different
types of users of the marine park. It is important to select indicators that reflect relevant
change in conditions and which managers can quantify and monitor effectively (Merigliano
1990).
Step four of the LAC planning process is simply the construction of an inventory of the current
condition of the environment, as reflected by the indicators identified in the previous step.
Thus, baseline conditions in the indicators are determined against which any subsequent
change can be assessed (Step 5). Determining the acceptability of such change involves the
development of standards for each indicator (e.g., How many more or fewer people
encountered on a trip are acceptable? How many additional or fewer broken coral colonies at
pontoon sites are acceptable?). The overall approach requires collaborative identification of
indicators and setting of standards by scientists, stake-holders and resource managers and
requires a commitment to monitoring changes in the chosen indicators.
The first five steps in the LAC model were intended to address the inadequacies of a
“straight” carrying capacity approach to visitor management in natural areas. The final four
deal with implementing standards where they are appropriate and then monitoring the specified
conditions to determine when and if change becomes unacceptable.
2.3.1 Applying LAC in a recreation/tourism setting in marine environments Although Stankey (1991) addressed the issue of Limits of Acceptable Change in marine
environments, he stopped short of indicating what opportunity spectra might exist or what
conditions could be of use as indicators when actually implementing the system in a marine
setting. Apparently few researchers have attempted to develop specific conditions which
could be used in developing standards for use levels and change in coral reef environments.
Oliver’s (1995) application of a LAC approach to a port dredging project provides one
example of how key steps in the process were used to determine the acceptability of
environmental changes associated with a major development activity. An interdisciplinary
group of scientists and natural resource managers developed indicators and standards for
corals near the dredge site and decided upon appropria te actions to be taken if the standards
were exceeded.
12
In terrestrial environments, research on visitor experiences and impacts has resulted in
extensive lists of items that can be used as indicators of the condition of the natural and social
resource (e.g., Whittaker 1992; Watson & Cole 1993). No such lists exist for coral reef
environments. In the following sections, we propose a range of conditions that may interact to
influence both the experience of the visitors and changes in the biophysical environment of
coral reefs.
A LAC-type approach to the management of visitors requires a good understanding of how
people perceive the resource they are using. The challenge is to measure how visitors feel
about an experience and place, so that parts of the experience and/or environment can be
selected and monitored for acceptable change over time. This presumes that at least some of
the “important” aspects of the environment should be determined by visitors (lay people). In
coral reef environments, activities take place in natural settings above and below the surface
of the water. The impacts caused in and reactions to these different components of the
environment are likely to be quite different and there will be a range of conditions in each
setting which influence peoples’ experiences and, in turn, their behaviour.
2.4 Benefits of natural environments In order to meet the ROS requirement in step 2 of the LAC system it is helpful to measure
what it is people are getting from an experience. Again, theory holds that different settings
provide different experiences. Measuring what people receive from a trip to a natural place
like the GBR has most often been accomplished in terms of benefits received (Driver &
Brown 1978; Driver et al. 1987). Being close to nature, spending time with family, escaping a
routine, sharpening skills and having some excitement are examples of benefits that people
might receive from such experiences (Driver et al. 1987). If people are receiving different
amounts of these benefits in different environmental settings, then there may be some
justification for maintaining these differences through the spatial designations of areas or
resources that best provide each of these benefit groups.
2.5 Conditions Influencing Coral Reef Visitors
Different settings are likely to require that different indicator conditions be selected or that
different standards be set for the same indicator conditions. In step 3 of the LAC system
specific indicator conditions must be defined in order to select those that are feasible for use in
13
the setting of standards for reliable monitoring. In a coral reef environment, the broad classes
of conditions will be much the same as those of terrestrial environments. That is, the
experience of the visitor and state of the resource will be determined by the condition of the
natural, social, managerial and physical components of the resource (Scherl et al. 1993).
Corals, fish and other marine life represent the natural conditions. The numbers and types of
people one travels with and/or encounters comprise elements of the social condition. The
restrictions or liberties allowed by resource managers or operator staff represent the
conditions of on-site management. Physical conditions of the setting, such as weather and
water conditions, may also influence the experience. The uniquely marine aspects of the
setting (e.g. corals, fish, waves and currents) are less a part of most people’s day to day
experience than are the conditions on land or above the water and it is likely that people will
perceive the two settings quite differently (e.g., different levels of acceptability).
2.5.1 Corals Corals are a dominant visual feature of the underwater landscape of coral reefs. Corals of
different shapes, sizes and colours grow together giving form, texture and colour to the
underwater landscape. In many ways, they are similar to the plants and forests on land, which
provide texture and form in terrestrial settings. They are also similar to vegetation in that they
provide habitat for many of the other animals that live on the reef. Individual aspects of corals
(size, shape, colour) may be perceived in different ways by those viewing it and may have
different amounts of influence on the marine experience of visitors to the setting. For
example, concerns are often raised about the colour of coral as portrayed in light enhanced
photography compared to that which is viewed under “natural” light conditions. Natural light
often produces less brilliant colour in corals. In a related study, Fenton & Johnson (submitted)
have shown how day-trip visitors to the GBRMP, who have limited prior experience of these
environments, associated the health of coral reefs with the colourful, idealised representations
of these settings that they see on tourism brochures and other media.
We know little about peoples’ ability to perceive different types (species) of coral. The most
obvious distinctions are among corals of different morphologies (shapes), commonly described
with words like plate, branching and boulder. These shapes are primary in providing texture
and form. Corals can also vary in size. Older coral colonies may grow to be quite large and
may dominate the attention of viewers. Sites dominated by large plate and boulder colonies
have been compared to old-growth forests (Done 1995) and may be particularly attractive to
14
those with experience in looking at coral reef environments. The composition of these
features may also be important to their impact on viewers. In some cases, corals grow in
diverse assemblages with a variety of shapes, sizes and colours creating a complex image. In
other instances “gardens” of a single species (or very similar species) will extend for many
meters across the reef. We know little about how these different coral assemblage
characteristics influence those viewing an underwater landscape.
2.5.2 Fish and Other Marine Life
Fish, marine mammals, and animals like echinoderms and molluscs are also present on coral
reefs and one may easily see 50 different species during a brief snorkel or SCUBA dive.
There are few nature based experiences which allow people to see so many different animal
species in a relatively small area or over such a short period of time. Roggenbuck et al.
(1993) found that, among wilderness recreationists, the number of wild animals seen was rated
as very influential and surmised that this condition was “critical to the experience...” (p. 191).
Shafer and Hammitt (1995) found that recreationists were very concerned with the number of
different species seen and seeing specific types of wildlife and that they often behaved in
ways to increase their chances of seeing wildlife.
As with corals, the more than 1100 species of fish present in the GBRMP (Randall et al.
1990) encompass many different shapes, sizes, colours and assemblages. Because of most
peoples’ unfamiliarity with reef wildlife and a lack of research on it we know little about its
influence. The size of fish may influence people in much the same way that it does with
terrestrial wildlife. Larger species are more conspicuous and garner more attention. The
colours of fish can be quite brilliant and varied making them more attractive. Schooling
species can also be of interest because of their sheer magnitude and movement. A better
understanding of the relative influence of marine wildlife on visitors and what aspects of it are
most important is needed.
2.5.3 Weather Physical conditions related to weather have never played much of a role in studies of
recreation or tourism experiences. Driver’s (1977) motivation scales included items related to
temperature but few studies have tried to measure the importance of such conditions, probably
because they cannot come under the control of resource managers. Marine tourism situations
15
differ slightly in that a decision can be made about whether to travel to reefs under certain
weather conditions or how to advise customers about the choice of a trip. In marine
environments, weather conditions may have a higher degree of influence on recreation and
tourism experiences than in terrestrial environments. This may be particularly true on day-
trips comprised largely of people with little experience of travelling on the open ocean.
Conditions are most evident in the surface of the ocean which serves as the travel medium.
Winds are common at sea and equate with waves and swells which, in turn, makes travel
uncomfortable for some people. Tour operators post wind speeds and related surface
conditions daily as an indicator of what one can expect during the trip. Air and water
temperatures influence the comfort of those snorkelling or diving. Visibility in the water is
influenced by winds and currents associated with weather conditions and can have a direct
affect on how much people see during their visit.
2.5.4 Other People The number of boats or other human-made structures in the water, the distances between
them, the types of boats or activities they support and the number of people on a boat or
participating in an activity are all “social” conditions which may influence both user
experiences and the marine life (Manning et al. 1996). These conditions have been at the
center of research dealing with social carrying capacity (e.g., Graefe et al. 1984; Vaske et al
1986; Shelby 1980). This research has shown that the number of people, what they do and
where they are encountered are important influences on visitor experiences (e.g., Stankey
1973, Roggenbuck et al. 1993) Research has also indicated that visitors are more highly
influenced by evidence of inappropriate human behaviour (e.g., litter, damaged vegetation,
noise) than any other conditions (Roggenbuck et al. 1993; Shafer and Hammitt 1995).
In marine recreation and tourism settings, social conditions similar to those in non-marine
settings exist and need to be better understood in the carrying capacity and LAC frameworks.
We must learn more about the way that people perceive others whether they are travelling
with them or observe another party across the reef. The key question is: Does the number of
people one encounters matter in this environment?
The level of technology needed to transport and care for groups of people in marine settings is
high. Large motorised boats, pontoons and elaborate moorings are a common part of many
16
tourist’s experiences in the GBRMP. How do people perceive this human technology? Are
they happy that these things exist for their safety and convenience or would they rather see
less of it amongst the natural environment they have come to experience?
This range of conditions interacts to influence human experiences on the GBR. In the
remainder of this report, we have attempted to measure some of the relative influence of each
set of conditions as a preliminary step toward application of an LAC framework.
3. PHASE ONE OF CRC TASK 2.1.8
3.1 Purpose
The first phase of this research was designed as an investigation of the relationships between
use and resources in marine settings. The purpose was to understand the types of
experiences had by visitors to the GBR and the conditions that influence such experiences.
Coral reef sites used for day-trip tourism were selected as the focus for the research.
Operations where snorkelling was a primary activity were selected in order to integrate
research on social and physical impacts at specific sites. Within the GBRMP, snorkelling has,
perhaps, the greatest participation rate of all active marine tourism pursuits. Bureau of
Tourism Research (1995) figures indicate that approximately 13% of inbound tourists to
Australia go snorkelling, most of whom do so on the Great Barrier Reef. This number has
been growing steadily over the past eight years, with a 53% increase in the total numbers of
visitors going snorkelling and SCUBA diving since 1989 (BTR 1995). Recent studies by CRC
Reef researchers have suggested that 34% of first time visitors and 12% of return visitors to
the GBR see the reef from permanently moored pontoons (Pierce et al. 1997), where the
principal activity is snorkelling.
We wanted to learn more about visitors’ experiences on the reef and about their interactions
with the biophysical environment. Looking at day-use visitors and, more specifically, at the
subset of snorkellers was selected to meet that purpose. This portion of the study was
designed to acquire data of a social nature by measuring visitor perceptions and behaviours.
Data related to actual change in the biophysical resource (i.e., corals) due to visitor behaviour
will be reported elsewhere. The following objectives guided this portion of the study in an
effort to gain information to support a LAC approach to planning.
17
1) To determine the types of people who visit the GBR on day-trips and how they vary in the
way they perceive the GBR.
2) To determine if and how activities (particularly snorkelling), in which visitors were involved,
influenced their perceptions.
3) To determine what value visitors place on reef sites.
4) To determine if visitors to natural marine areas receive similar levels of benefits and react
to environmental conditions in ways similar to those reported in terrestrial environments.
5) To determine the conditions present during the reef experience that were most influential
on visitors’ experiences and thus useful in the selection of indicators in a LAC process.
6) To determine the range of experiences (as measured through benefits provided and the
perception of conditions) that exists which might contribute to a “spectrum” approach to
managing tourist day-trips on the Great Barrier Reef.
7) To determine the extent to which different types of tourism operations accessing the GBR
may be providing different types of experiences to visitors.
The first two objectives were intended to provide basic information for tourist operators or
managers about differences in activities and visitors. The final three objectives also deal with
visitor differences but specifically address steps in the LAC planning process related to
defining opportunity classes and developing useable indicators.
4. METHODS 4.1 Selecting Tourist Operators
The cooperation of the tourism industry was necessary for the completion of this research.
Several criteria were used to select the tourism operations used in this research: 1) the number
of tourists they were carrying to reef use sites and thus the intensity of use they represented,
2) the types of activities offered (i.e., snorkelling), and, 3) the type of site they used (e.g., outer
reef, island/reef). Four companies agreed to cooperate in the research by allowing us access
to their customers.
Two of the companies (hereafter referred to as Oper 1 and Oper 2) represented larger, high
intensity use operations capable of carrying up to 450 passengers daily to reef sites. The other
two operators (Oper 3 and Oper 4) represented smaller, lower intensity use, operators. Oper
3 and Oper 4 used vessels capable of carrying between 20 and 50 passengers daily to reef

18
sites. In all four cases these operators provided visitors approximately 4 hours of on-site
activity time through the middle of the day (eg., 11 am to 3 pm). All four operators offered
snorkelling as their primary in-water activity, while three of the four also offered scuba diving.
All four operations offered guided snorkelling tours as a supplement to the regular snorkelling
activity. Oper 1 and Oper 2 travelled to “pontoon sites” where their vessels were moored to a
permanent, anchored pontoon structure. These facilities also offered the opportunity for “dry”
underwater observation through submerged observation decks and semi-submersible boat
rides.
19
4.2 Study Sites
Operators 1, 2 and 3 used “outer reef” sites. These varied in the underwater features present.
Generally, the sites used by Oper 1 and 3 were back-reef lagoons with depths that ranged
from 2 to 15 meters below the reef flat. Oper 3 differed from the other three operators in that
they moved among three different snorkelling sites during the day, whereas each of the other
operators travelled only to a single site. The site of Oper 2 was within a deep channel between
two mid-shelf reefs. The pontoon was moored close to the reef edge which dropped away
steeply from the reef flat to a depth of 40 - 50 meters at the outer edge of the platform. Oper
4 used an island and fringing reef site approximately 11 km from the mainland coast. The
snorkelling area at Oper 4’s island/reef site ranged in depth from 1 to 8 meters depending on
tides. Each site had a substantial cover of hard corals (> 10%) comprised of a variety of
morphological types (e.g., branching, massive). Differences in the types of sites visited by the
operations posed limitations in portions of the analysis where specific comparisons are made
among “sites”. However, we were more concerned (in this portion of the study) with looking
at different experiences associated with different types of operation. Each “day on the reef”
was thus treated as a separate entity in parts of the analysis. In most cases that “day” was
limited to a single site, but in one case included three sites.
4.3 Survey Instrument
The survey instrument was designed as a self administered questionnaire. This method was
selected for several reasons. Previous work had been carried out on similar day use reef
visitors at an island/reef site by Scherl et al. (1993) using interpretive (personal interview)
methods. Their research provided a good basis for the development of a more quantitative
survey instrument that could be distributed across a greater number of respondent at more
sites. We felt that this method would provide results that were able to be more generalised for
day use tourism on the GBR while meeting logistical constraints imposed by the time and
money available for data collection.
The instrument (see Appendix 1) contained six sections, each designed to measure different
attitudinal, behavioural and demographic characteristics. The first section asked visitors to
respond to open ended questions regarding things that “added to” or “detracted from” their
reef experience. This allowed visitors to express thoughts without being “led” to do so before
20
they were asked to respond to a series of closed ended questions that asked similar questions
about influences on the experience. The second section of the survey asked visitors to provide
information about past visitation/experience on the GBR and/or at other reef sites.
The third and fourth sections of the questionnaire queried visitor perceptions about the reef site
and the nature of the experience they had enjoyed. Section three presented a list of nine
reasons that humans might value places on the GBR. The list was constructed based on
wording in legislation surrounding the formation of the GBRMP and designated park/protected
areas in general. Visitors were asked to rate how important each item was to the value of the
site they visited using a five point scale ranging from “not at all” to “extremely.” Also included
in this section was a list of 16 potential benefits (Driver 1977) that the trip may have provided.
Respondents were asked “how much the trip provided” each of the 16 items (e.g., get some
exercise, meet people, learn about a coral reef) again using a five point response scale ranging
from “not at all” to “extremely.” These personal benefit items were used to measure specific
aspects of “experience.” Past research (eg., Brown & Haas 1980; Manfredo et al. 1983;
Kaltenborn & Emmelin 1993) indicates that these types of benefits represent important
aspects of peoples’ experience in natural environments.
Section four presented respondents with a more extensive and specific list of 24 items related
to physical, biological and social conditions present on this type of trip. Items were generated
to represent attributes of coral and fish conditions (e.g., colour of coral I saw, total amount of
coral I saw, size of the fish I saw, types of fish I saw), attributes related to physical conditions
(e.g., temperature of the water, depth of the water) attributes related to social conditions (e.g.,
number of other people on the vessel) and, attributes of the operator’s staff (e.g., information
provided by the staff). Respondents were asked to judge how much each of the items
influenced their enjoyment of the trip and to indicate this by ticking a seven point scale . The
scale ranged from “very negatively” to “very positively” and included a mid point labelled “no
influence either way.” Respondents were also asked: 1) to rate eight specific conditions (e.g.,
the total amount of coral, the number of people) on a three point response format “too
few/little, about right, too much/many;” 2) to rate the condition of corals and fishes at the site
using a five point format from “poor” to “excellent” and; 3) to score a single item to rate the
trip as a whole using a ten point format ranging from “poor” to “excellent.”
21
The final two sections of the survey asked about behavioural and demographic characteristics.
Section five asked respondents to indicate what activities they had participated in during their
time at the reef site. More specifically, it asked those who snorkelled and dived how often
they had previously participated in these activities, if they touched any coral and why. Finally,
section six completed the questions with several demographic items (e.g. gender, age, country
of citizenship). The questionnaire was made available in three languages: German, Japanese
and English. (see Appendix 1.)
4.4 Sample
There were three primary concerns in obtaining a representative sample of day use visitors
who were travelling to the GBR. The first was temporal representativeness based on times of
year and days of the week. This was of importance because conditions such as temperatures,
winds and rain vary across the “wet” and “dry” seasons in which visitation occurs. Sampling
across different days of the week was also important as records of operators indicated that
the number of visitors travelling on a given vessel vary systematically by the day of the week.
The second consideration was related to the state of the tide at the destination sites. This
study was integrated with observational research on snorkellers to determine the frequency
and types of interactions (impacts) with coral that were occurring. It was hypothesised that
tide levels would be an important variable in these interactions because they determine the
distance between a floating snorkeller and the coral substratum. That is, a high tide would
potentially have a stronger “buffering” effect between snorkellers and the corals below than
would a low tide. Given logistical limitations, it was decided that blocks of four consecutive
days would be selected to represent seasons of the year and days of the week. These four
day blocks were also chosen using tide tables so that low, medium or high tide levels were
distributed among the blocks to be sampled. Blocks of days were selected over a nine month
period from June 1995 to February 1996. Seventy five days, representing 18 blocks of days,
were used for sampling during this period.
The third concern was for representativeness of the sample within a given trip (i.e., on a given
vessel). On the larger vessels of Oper 1 and Oper 2 visitors were dispersed across seating on
upper and lower decks, some of which were inside (air conditioned) some outside. A
complete census of a these large vessels was not possible, so we attempted to obtain a sample
of 12 - 15% of the number of visitors on each trip. Seating areas were randomly selected
22
based on the proportion of seats in a given section of the vessel. For example, if 100 - 150
people were seated in the main cabin then approximately 10 to 15 were sampled while the
upper deck might seat 20 requiring that only two or three be sampled there. Seats used as the
starting point to approach passengers in this scheme were selected to represent an even
spatial distribution within a given seating area.
The smaller vessels were sampled slightly differently. Oper 3 carried a maximum of 20
passengers who could be censussed by a single member of the research team. Oper 4 agreed
to distribute the survey to passengers themselves (CRC staff distributed surveys on each of
the other 3 operations). The vessel carried a maximum of 50 passengers and about 20% of the
boat-load was surveyed on each trip.
The questionnaire was administered on the return trip from the reef. On larger vessels, the
captain made a general announcement that CRC research staff were on board and that some
passengers would be approached by one of the researchers and asked (on a voluntary basis)
to complete a short survey about their day on the reef. This procedure was also followed on
the smaller vessels, however, researchers and/or staff members made their own requests for
participation in the survey. Where only a percentage of the boat-load was being sampled, if a
chosen passenger declined to participate, a person sitting next to them was asked to participate
until a positive response was given.
Using these methods, 1,985 potential respondents were approached and asked to participate in
the study. Most (97%, n = 1,922) accepted a questionnaire. Ninety five percent of the
questionnaires collected (n = 1,818) were useable while 5% (104) were incomplete and not
used in the analysis. The final sample of 1818 was distributed among operations as follows:
Oper 1, n= 800; Oper 2, n=462; Oper 3, n= 290; Oper 4, n= 266.
4.5 Analysis
4.5.1 Determining What Benefits Reef Trips Provide
Several analytical steps were carried out to understand the benefits provided to visitors by
day-trip to the reef. The 16 benefit items were evaluated by Factor Analysis to simplify
additional analysis and interpretation. Principle components with a varimax rotation was used
to extract factors. Factors were only interpreted as part of the solution if they had an
23
eigenvalue of at least 1 and explained at least 5 percent of the variance. Items were
interpreted as belonging in a factor (domain) if they had a loading of at least 0.30 and did not
load similarly on any other factors. A K-Means Cluster Analysis was then used to group
respondents using the factored benefit domains as independent variables. As Romesburg
(1979) has pointed out, selecting a proper cluster solution (i.e., number of clusters) based on
attitudinal data is largely dependent on its usefulness in light of the study objectives. The
cluster solution used here was determined to provide an interpretable typology of visitors while
maintaining a statistically significant separation among cluster means, for scores on all four
benefit domain (dependent) variables. These visitor types were then compared across
demographic, participation and perception variables to examine relationships between benefits
received and other aspects of the reef experience.
To examine in more detail the different types of visitors on day-trip operations and how they
perceive and use the reef (Objectives 1 & 2), we looked at the relationships between the
experiences had by different groups of visitors, how those groups were comprised and how
active they were on the trip (i.e. participation in different activities). Differences in the
demographic and behavioural characteristics (including participation in snorkelling and diving)
of groups resolved in the benefit clusters were examined by ANOVA and chi-square tests.
Finally, using benefit cluster membership as a dependent measure of the recreational
experience, a chi-square test was used to determine if visitors within the different clusters
were associated with different types of reef trip operations (e.g. large vs small operations).
4.5.2 Influence of Conditions on Experience In order to develop indicators useful to the LAC process and to understand how conditions
influenced visitors, the responses to 24 condition items were measured. These condition items
were then analysed by Factor Analysis to group sets of variables that reflected different visitor
experiences. The resulting factors were then used as independent variables in several
analyses (ANOVA and t-test) designed to determine how conditions were related to
experience. An important part of this analysis was to determine if visitors were receiving
different benefits, and/or were being influenced in different ways by different types of
operations and trip conditions.
5. RESULTS
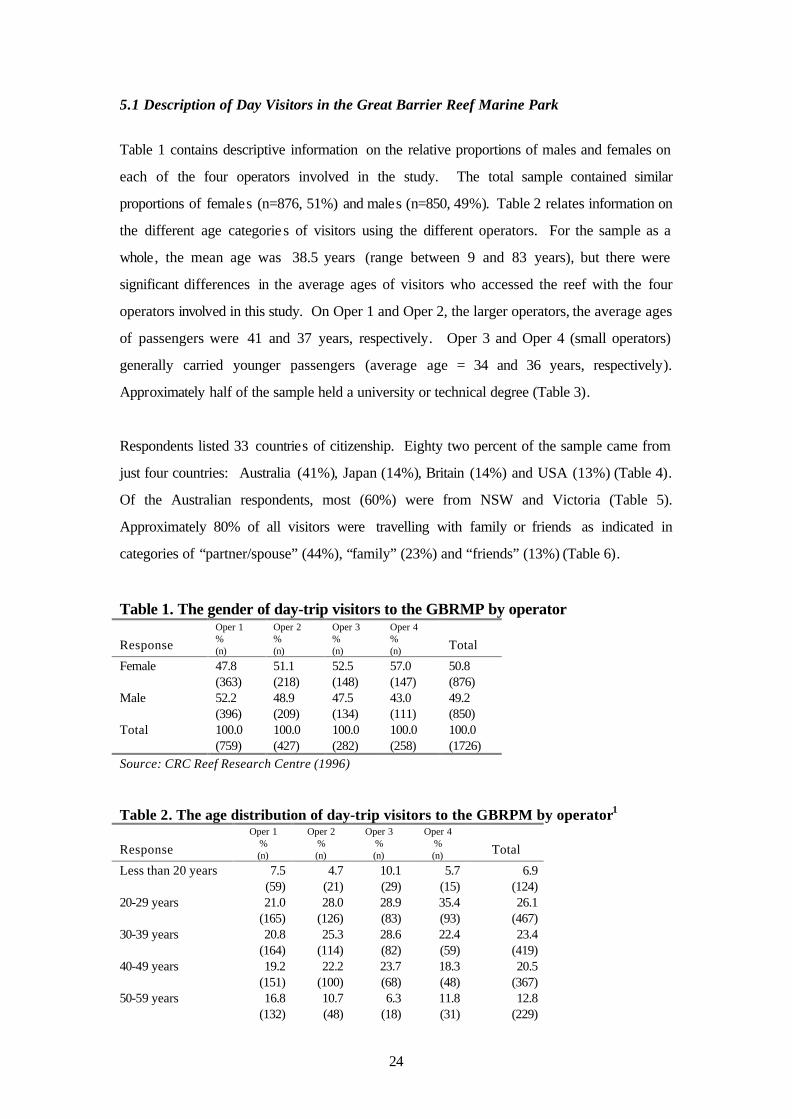
24
5.1 Description of Day Visitors in the Great Barrier Reef Marine Park
Table 1 contains descriptive information on the relative proportions of males and females on
each of the four operators involved in the study. The total sample contained similar
proportions of females (n=876, 51%) and males (n=850, 49%). Table 2 relates information on
the different age categorie s of visitors using the different operators. For the sample as a
whole, the mean age was 38.5 years (range between 9 and 83 years), but there were
significant differences in the average ages of visitors who accessed the reef with the four
operators involved in this study. On Oper 1 and Oper 2, the larger operators, the average ages
of passengers were 41 and 37 years, respectively. Oper 3 and Oper 4 (small operators)
generally carried younger passengers (average age = 34 and 36 years, respectively).
Approximately half of the sample held a university or technical degree (Table 3).
Respondents listed 33 countries of citizenship. Eighty two percent of the sample came from
just four countries: Australia (41%), Japan (14%), Britain (14%) and USA (13%) (Table 4).
Of the Australian respondents, most (60%) were from NSW and Victoria (Table 5).
Approximately 80% of all visitors were travelling with family or friends as indicated in
categories of “partner/spouse” (44%), “family” (23%) and “friends” (13%) (Table 6).
Table 1. The gender of day-trip visitors to the GBRMP by operator Response
Oper 1 % (n)
Oper 2 % (n)
Oper 3 % (n)
Oper 4 % (n)
Total
Female 47.8 51.1 52.5 57.0 50.8 (363) (218) (148) (147) (876) Male 52.2 48.9 47.5 43.0 49.2 (396) (209) (134) (111) (850) Total 100.0 100.0 100.0 100.0 100.0 (759) (427) (282) (258) (1726) Source: CRC Reef Research Centre (1996) Table 2. The age distribution of day-trip visitors to the GBRPM by operator1 Response
Oper 1 % (n)
Oper 2 % (n)
Oper 3 % (n)
Oper 4 % (n)
Total
Less than 20 years 7.5 4.7 10.1 5.7 6.9 (59) (21) (29) (15) (124) 20-29 years 21.0 28.0 28.9 35.4 26.1 (165) (126) (83) (93) (467) 30-39 years 20.8 25.3 28.6 22.4 23.4 (164) (114) (82) (59) (419) 40-49 years 19.2 22.2 23.7 18.3 20.5 (151) (100) (68) (48) (367) 50-59 years 16.8 10.7 6.3 11.8 12.8 (132) (48) (18) (31) (229)

25
60 years or more 14.7 9.1 2.4 6.5 10.1 (116) (41) (7) (17) (181) Total 100.0 100.0 100.0 100.0 100.0 (787) (450) (287) (263) (1787) Mean age = 38.5 years 1Age was measured as a ratio level variable but is presented here in categories for comparison purposes. Source: CRC Reef Research Centre (1996)
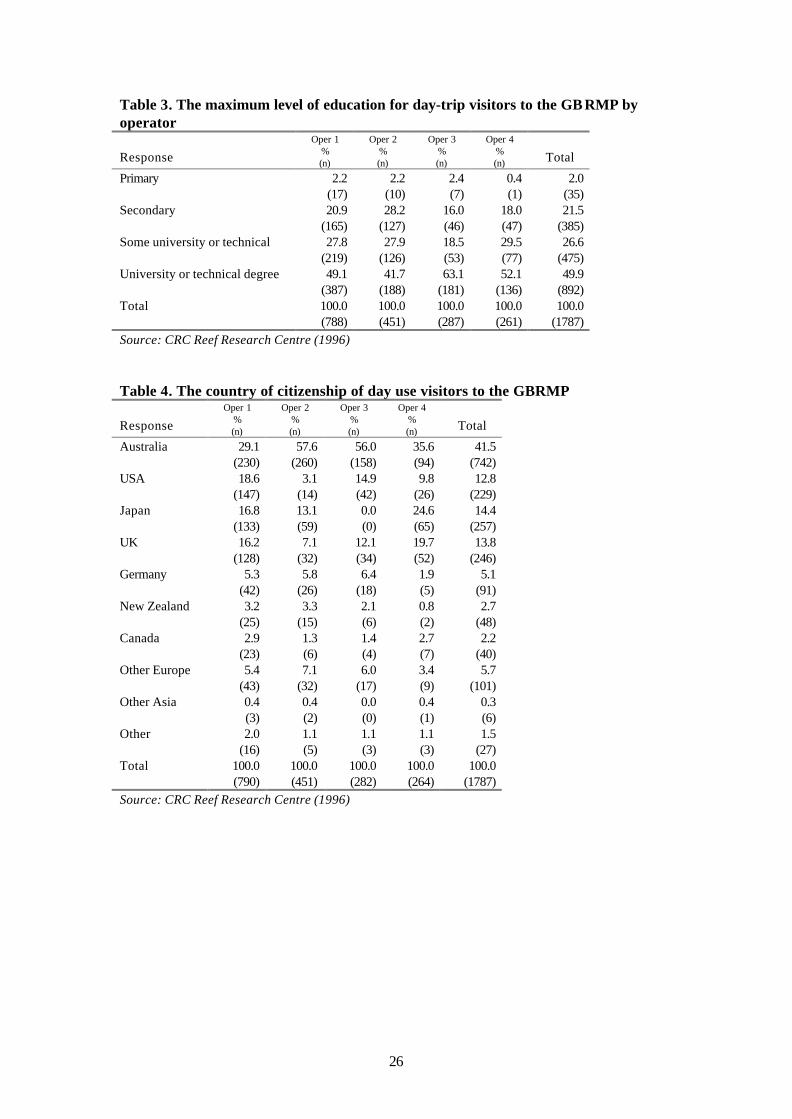
26
Table 3. The maximum level of education for day-trip visitors to the GB RMP by operator Response
Oper 1 % (n)
Oper 2 % (n)
Oper 3 % (n)
Oper 4 % (n)
Total
Primary 2.2 2.2 2.4 0.4 2.0 (17) (10) (7) (1) (35) Secondary 20.9 28.2 16.0 18.0 21.5 (165) (127) (46) (47) (385) Some university or technical 27.8 27.9 18.5 29.5 26.6 (219) (126) (53) (77) (475) University or technical degree 49.1 41.7 63.1 52.1 49.9 (387) (188) (181) (136) (892) Total 100.0 100.0 100.0 100.0 100.0 (788) (451) (287) (261) (1787) Source: CRC Reef Research Centre (1996)
Table 4. The country of citizenship of day use visitors to the GBRMP Response
Oper 1 % (n)
Oper 2 % (n)
Oper 3 % (n)
Oper 4 % (n)
Total
Australia 29.1 57.6 56.0 35.6 41.5 (230) (260) (158) (94) (742) USA 18.6 3.1 14.9 9.8 12.8 (147) (14) (42) (26) (229) Japan 16.8 13.1 0.0 24.6 14.4 (133) (59) (0) (65) (257) UK 16.2 7.1 12.1 19.7 13.8 (128) (32) (34) (52) (246) Germany 5.3 5.8 6.4 1.9 5.1 (42) (26) (18) (5) (91) New Zealand 3.2 3.3 2.1 0.8 2.7 (25) (15) (6) (2) (48) Canada 2.9 1.3 1.4 2.7 2.2 (23) (6) (4) (7) (40) Other Europe 5.4 7.1 6.0 3.4 5.7 (43) (32) (17) (9) (101) Other Asia 0.4 0.4 0.0 0.4 0.3 (3) (2) (0) (1) (6) Other 2.0 1.1 1.1 1.1 1.5 (16) (5) (3) (3) (27) Total 100.0 100.0 100.0 100.0 100.0 (790) (451) (282) (264) (1787) Source: CRC Reef Research Centre (1996)
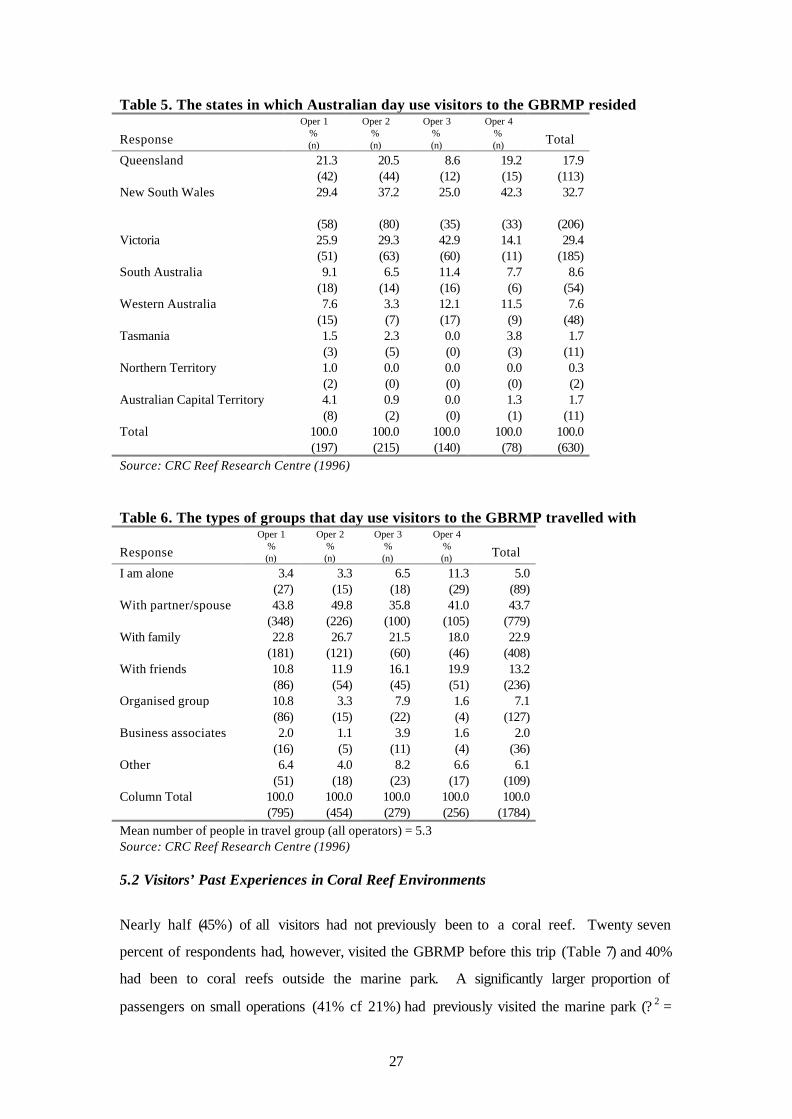
27
Table 5. The states in which Australian day use visitors to the GBRMP resided Response
Oper 1 % (n)
Oper 2 % (n)
Oper 3 % (n)
Oper 4 % (n)
Total
Queensland 21.3 20.5 8.6 19.2 17.9 (42) (44) (12) (15) (113) New South Wales 29.4 37.2 25.0 42.3
32.7
(58) (80) (35) (33) (206) Victoria 25.9 29.3 42.9 14.1 29.4 (51) (63) (60) (11) (185) South Australia 9.1 6.5 11.4 7.7 8.6 (18) (14) (16) (6) (54) Western Australia 7.6 3.3 12.1 11.5 7.6 (15) (7) (17) (9) (48) Tasmania 1.5 2.3 0.0 3.8 1.7 (3) (5) (0) (3) (11) Northern Territory 1.0 0.0 0.0 0.0 0.3 (2) (0) (0) (0) (2) Australian Capital Territory 4.1 0.9 0.0 1.3 1.7 (8) (2) (0) (1) (11) Total 100.0 100.0 100.0 100.0 100.0 (197) (215) (140) (78) (630) Source: CRC Reef Research Centre (1996) Table 6. The types of groups that day use visitors to the GBRMP travelled with Response
Oper 1 % (n)
Oper 2 % (n)
Oper 3 % (n)
Oper 4 % (n)
Total
I am alone 3.4 3.3 6.5 11.3 5.0 (27) (15) (18) (29) (89) With partner/spouse 43.8 49.8 35.8 41.0 43.7 (348) (226) (100) (105) (779) With family 22.8 26.7 21.5 18.0 22.9 (181) (121) (60) (46) (408) With friends 10.8 11.9 16.1 19.9 13.2 (86) (54) (45) (51) (236) Organised group 10.8 3.3 7.9 1.6 7.1 (86) (15) (22) (4) (127) Business associates 2.0 1.1 3.9 1.6 2.0 (16) (5) (11) (4) (36) Other 6.4 4.0 8.2 6.6 6.1 (51) (18) (23) (17) (109) Column Total 100.0 100.0 100.0 100.0 100.0 (795) (454) (279) (256) (1784) Mean number of people in travel group (all operators) = 5.3 Source: CRC Reef Research Centre (1996) 5.2 Visitors’ Past Experiences in Coral Reef Environments
Nearly half (45%) of all visitors had not previously been to a coral reef. Twenty seven
percent of respondents had, however, visited the GBRMP before this trip (Table 7) and 40%
had been to coral reefs outside the marine park. A significantly larger proportion of
passengers on small operations (41% cf 21%) had previously visited the marine park (? 2 =
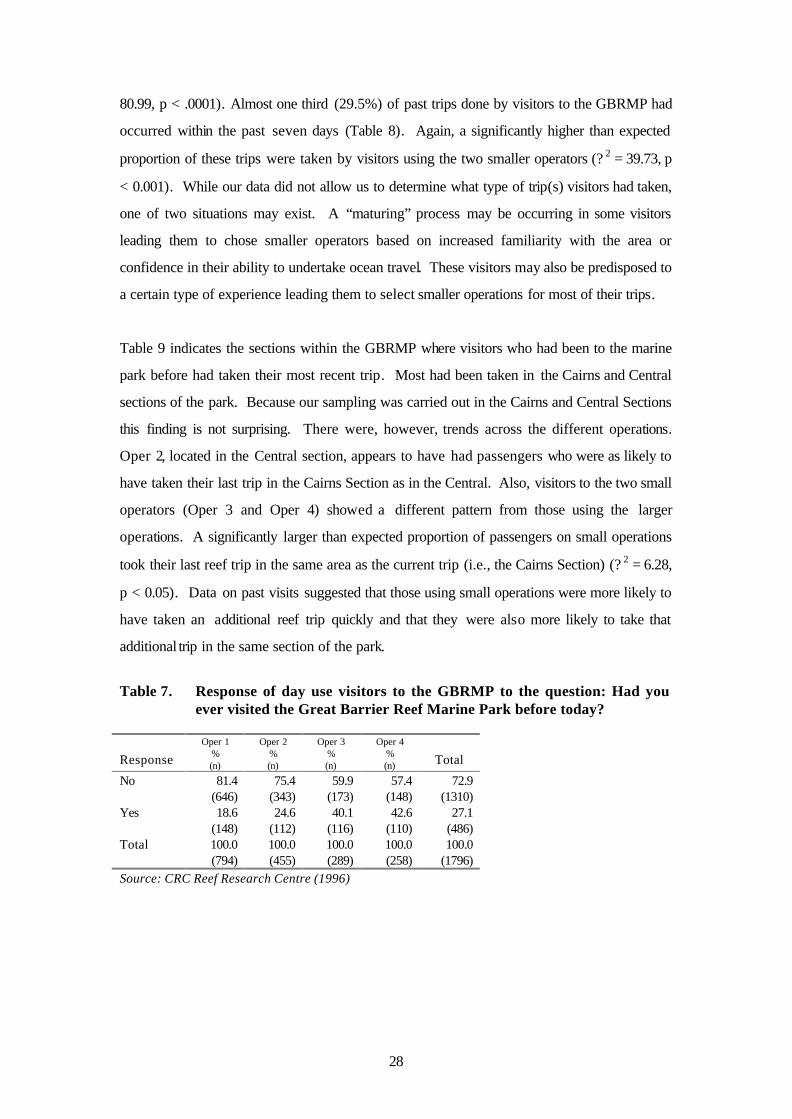
28
80.99, p < .0001). Almost one third (29.5%) of past trips done by visitors to the GBRMP had
occurred within the past seven days (Table 8). Again, a significantly higher than expected
proportion of these trips were taken by visitors using the two smaller operators (? 2 = 39.73, p
< 0.001). While our data did not allow us to determine what type of trip(s) visitors had taken,
one of two situations may exist. A “maturing” process may be occurring in some visitors
leading them to chose smaller operators based on increased familiarity with the area or
confidence in their ability to undertake ocean travel. These visitors may also be predisposed to
a certain type of experience leading them to select smaller operations for most of their trips.
Table 9 indicates the sections within the GBRMP where visitors who had been to the marine
park before had taken their most recent trip. Most had been taken in the Cairns and Central
sections of the park. Because our sampling was carried out in the Cairns and Central Sections
this finding is not surprising. There were, however, trends across the different operations.
Oper 2, located in the Central section, appears to have had passengers who were as likely to
have taken their last trip in the Cairns Section as in the Central. Also, visitors to the two small
operators (Oper 3 and Oper 4) showed a different pattern from those using the larger
operations. A significantly larger than expected proportion of passengers on small operations
took their last reef trip in the same area as the current trip (i.e., the Cairns Section) (? 2 = 6.28,
p < 0.05). Data on past visits suggested that those using small operations were more likely to
have taken an additional reef trip quickly and that they were also more likely to take that
additional trip in the same section of the park.
Table 7. Response of day use visitors to the GBRMP to the question: Had you
ever visited the Great Barrier Reef Marine Park before today? Response
Oper 1 % (n)
Oper 2 % (n)
Oper 3 % (n)
Oper 4 % (n)
Total
No 81.4 75.4 59.9 57.4 72.9 (646) (343) (173) (148) (1310) Yes 18.6 24.6 40.1 42.6 27.1 (148) (112) (116) (110) (486) Total 100.0 100.0 100.0 100.0 100.0 (794) (455) (289) (258) (1796) Source: CRC Reef Research Centre (1996)
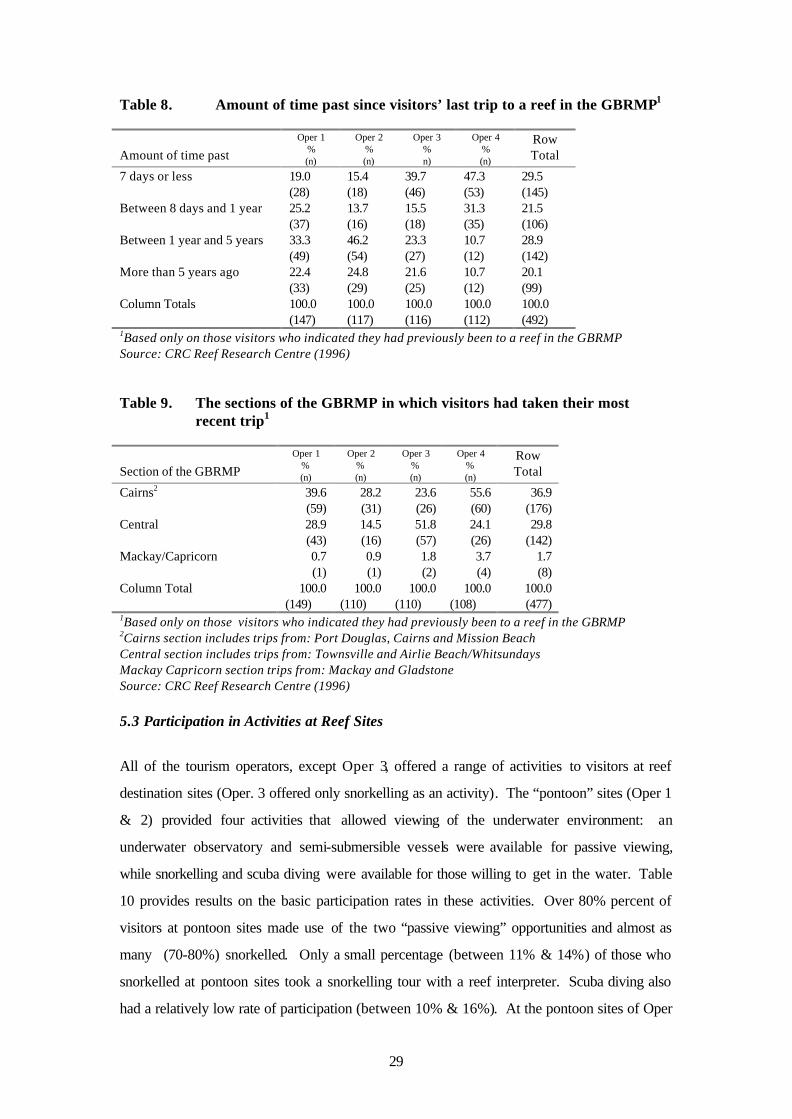
29
Table 8. Amount of time past since visitors’ last trip to a reef in the GBRMP1
Amount of time past
Oper 1 % (n)
Oper 2 % (n)
Oper 3 % n)
Oper 4 % (n)
Row Total
7 days or less 19.0 15.4 39.7 47.3 29.5 (28) (18) (46) (53) (145) Between 8 days and 1 year 25.2 13.7 15.5 31.3 21.5 (37) (16) (18) (35) (106) Between 1 year and 5 years 33.3 46.2 23.3 10.7 28.9 (49) (54) (27) (12) (142) More than 5 years ago 22.4 24.8 21.6 10.7 20.1 (33) (29) (25) (12) (99) Column Totals 100.0 100.0 100.0 100.0 100.0 (147) (117) (116) (112) (492) 1Based only on those visitors who indicated they had previously been to a reef in the GBRMP Source: CRC Reef Research Centre (1996) Table 9. The sections of the GBRMP in which visitors had taken their most
recent trip1
Section of the GBRMP
Oper 1 % (n)
Oper 2 % (n)
Oper 3 % (n)
Oper 4 % (n)
Row Total
Cairns2 39.6 28.2 23.6 55.6 36.9 (59) (31) (26) (60) (176) Central 28.9 14.5 51.8 24.1 29.8 (43) (16) (57) (26) (142) Mackay/Capricorn 0.7 0.9 1.8 3.7 1.7 (1) (1) (2) (4) (8) Column Total 100.0 100.0 100.0 100.0 100.0 (149) (110) (110) (108) (477) 1Based only on those visitors who indicated they had previously been to a reef in the GBRMP 2Cairns section includes trips from: Port Douglas, Cairns and Mission Beach Central section includes trips from: Townsville and Airlie Beach/Whitsundays Mackay Capricorn section trips from: Mackay and Gladstone Source: CRC Reef Research Centre (1996) 5.3 Participation in Activities at Reef Sites
All of the tourism operators, except Oper 3, offered a range of activities to visitors at reef
destination sites (Oper. 3 offered only snorkelling as an activity). The “pontoon” sites (Oper 1
& 2) provided four activities that allowed viewing of the underwater environment: an
underwater observatory and semi-submersible vessels were available for passive viewing,
while snorkelling and scuba diving were available for those willing to get in the water. Table
10 provides results on the basic participation rates in these activities. Over 80% percent of
visitors at pontoon sites made use of the two “passive viewing” opportunities and almost as
many (70-80%) snorkelled. Only a small percentage (between 11% & 14%) of those who
snorkelled at pontoon sites took a snorkelling tour with a reef interpreter. Scuba diving also
had a relatively low rate of participation (between 10% & 16%). At the pontoon sites of Oper
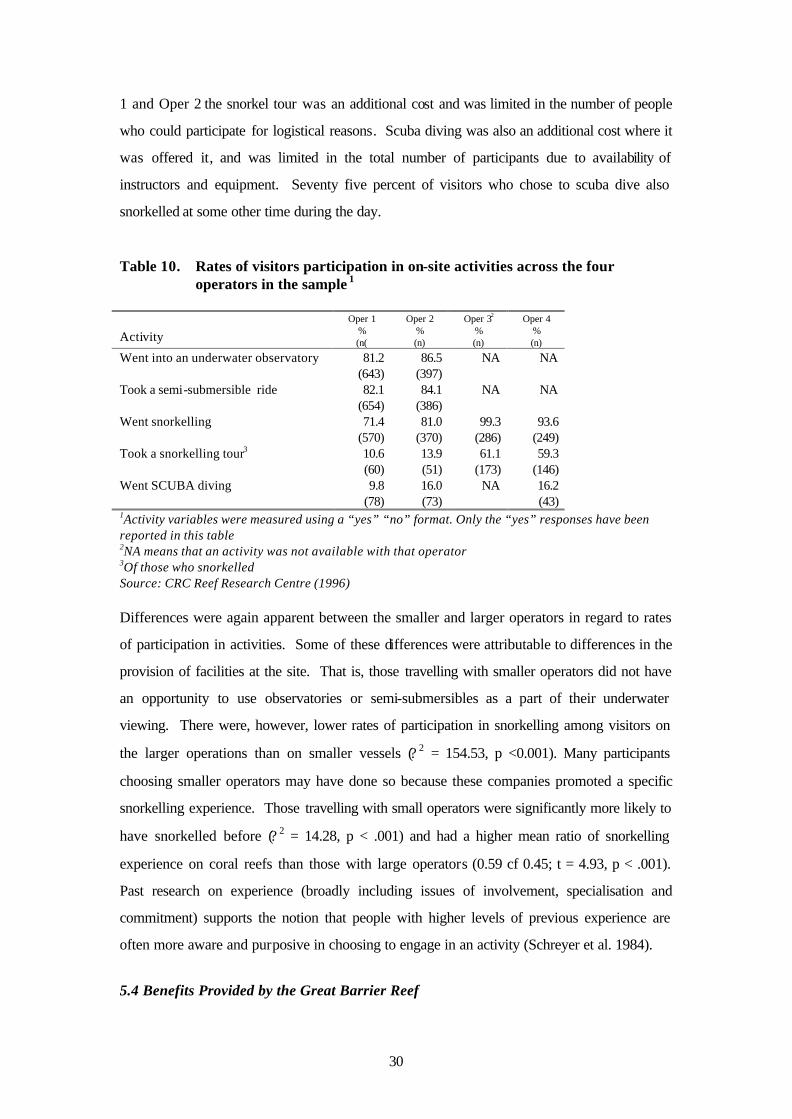
30
1 and Oper 2 the snorkel tour was an additional cost and was limited in the number of people
who could participate for logistical reasons. Scuba diving was also an additional cost where it
was offered it, and was limited in the total number of participants due to availability of
instructors and equipment. Seventy five percent of visitors who chose to scuba dive also
snorkelled at some other time during the day.
Table 10. Rates of visitors participation in on-site activities across the four operators in the sample 1
Activity
Oper 1 % (n(
Oper 2 % (n)
Oper 32 % (n)
Oper 4 % (n)
Went into an underwater observatory 81.2 86.5 NA NA (643) (397) Took a semi-submersible ride 82.1 84.1 NA NA (654) (386) Went snorkelling 71.4 81.0 99.3 93.6 (570) (370) (286) (249) Took a snorkelling tour3 10.6 13.9 61.1 59.3 (60) (51) (173) (146) Went SCUBA diving 9.8 16.0 NA 16.2 (78) (73) (43) 1Activity variables were measured using a “yes” “no” format. Only the “yes” responses have been reported in this table 2NA means that an activity was not available with that operator 3Of those who snorkelled Source: CRC Reef Research Centre (1996) Differences were again apparent between the smaller and larger operators in regard to rates
of participation in activities. Some of these differences were attributable to differences in the
provision of facilities at the site. That is, those travelling with smaller operators did not have
an opportunity to use observatories or semi-submersibles as a part of their underwater
viewing. There were, however, lower rates of participation in snorkelling among visitors on
the larger operations than on smaller vessels (? 2 = 154.53, p <0.001). Many participants
choosing smaller operators may have done so because these companies promoted a specific
snorkelling experience. Those travelling with small operators were significantly more likely to
have snorkelled before (? 2 = 14.28, p < .001) and had a higher mean ratio of snorkelling
experience on coral reefs than those with large operators (0.59 cf 0.45; t = 4.93, p < .001).
Past research on experience (broadly including issues of involvement, specialisation and
commitment) supports the notion that people with higher levels of previous experience are
often more aware and purposive in choosing to engage in an activity (Schreyer et al. 1984).
5.4 Benefits Provided by the Great Barrier Reef
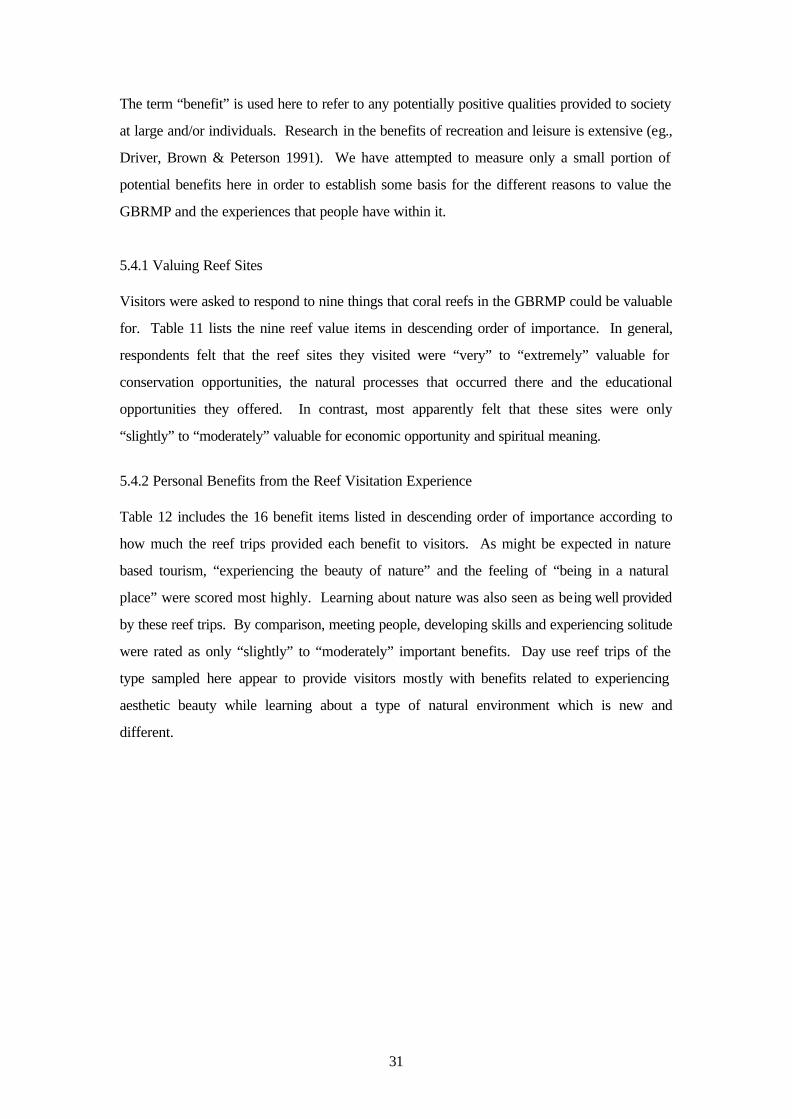
31
The term “benefit” is used here to refer to any potentially positive qualities provided to society
at large and/or individuals. Research in the benefits of recreation and leisure is extensive (eg.,
Driver, Brown & Peterson 1991). We have attempted to measure only a small portion of
potential benefits here in order to establish some basis for the different reasons to value the
GBRMP and the experiences that people have within it.
5.4.1 Valuing Reef Sites Visitors were asked to respond to nine things that coral reefs in the GBRMP could be valuable
for. Table 11 lists the nine reef value items in descending order of importance. In general,
respondents felt that the reef sites they visited were “very” to “extremely” valuable for
conservation opportunities, the natural processes that occurred there and the educational
opportunities they offered. In contrast, most apparently felt that these sites were only
“slightly” to “moderately” valuable for economic opportunity and spiritual meaning.
5.4.2 Personal Benefits from the Reef Visitation Experience Table 12 includes the 16 benefit items listed in descending order of importance according to
how much the reef trips provided each benefit to visitors. As might be expected in nature
based tourism, “experiencing the beauty of nature” and the feeling of “being in a natural
place” were scored most highly. Learning about nature was also seen as being well provided
by these reef trips. By comparison, meeting people, developing skills and experiencing solitude
were rated as only “slightly” to “moderately” important benefits. Day use reef trips of the
type sampled here appear to provide visitors mostly with benefits related to experiencing
aesthetic beauty while learning about a type of natural environment which is new and
different.
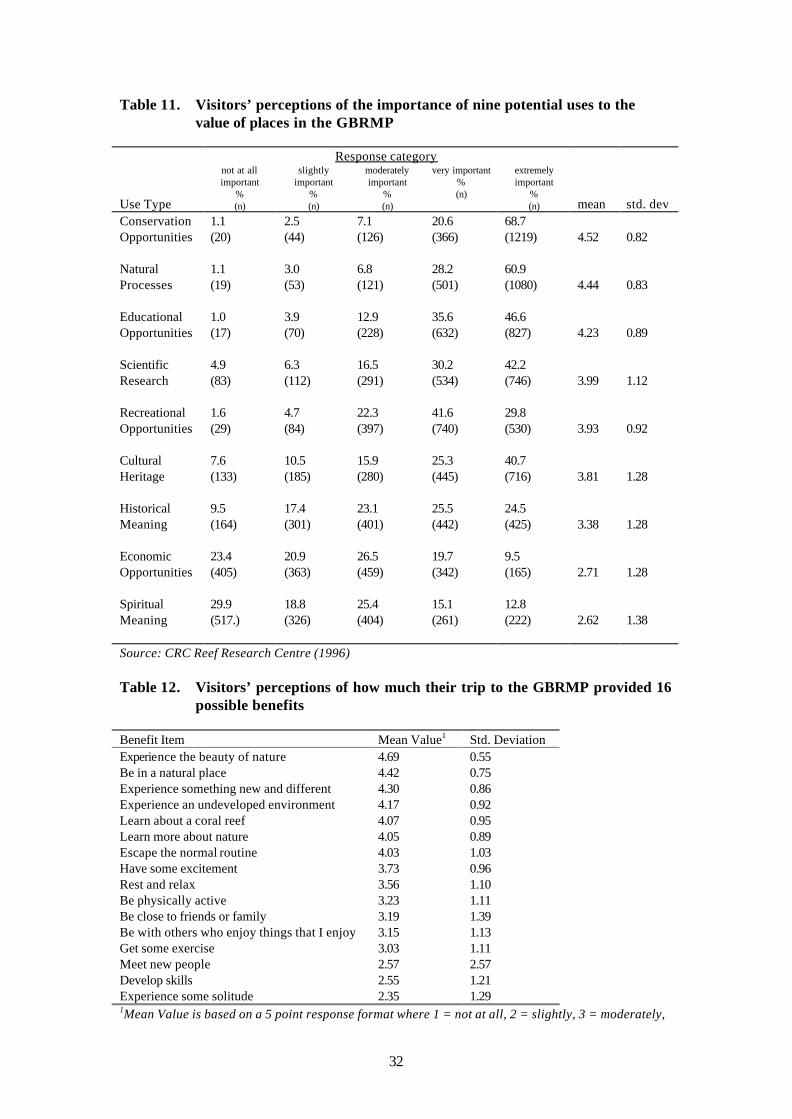
32
Table 11. Visitors’ perceptions of the importance of nine potential uses to the value of places in the GBRMP
Response category Use Type
not at all important
% (n)
slightly important
% (n)
moderately important
% (n)
very important % (n)
extremely important
% (n)
mean
std. dev
Conservation Opportunities
1.1 (20)
2.5 (44)
7.1 (126)
20.6 (366)
68.7 (1219)
4.52
0.82
Natural Processes
1.1 (19)
3.0 (53)
6.8 (121)
28.2 (501)
60.9 (1080)
4.44
0.83
Educational Opportunities
1.0 (17)
3.9 (70)
12.9 (228)
35.6 (632)
46.6 (827)
4.23
0.89
Scientific Research
4.9 (83)
6.3 (112)
16.5 (291)
30.2 (534)
42.2 (746)
3.99
1.12
Recreational Opportunities
1.6 (29)
4.7 (84)
22.3 (397)
41.6 (740)
29.8 (530)
3.93
0.92
Cultural Heritage
7.6 (133)
10.5 (185)
15.9 (280)
25.3 (445)
40.7 (716)
3.81
1.28
Historical Meaning
9.5 (164)
17.4 (301)
23.1 (401)
25.5 (442)
24.5 (425)
3.38
1.28
Economic Opportunities
23.4 (405)
20.9 (363)
26.5 (459)
19.7 (342)
9.5 (165)
2.71
1.28
Spiritual Meaning
29.9 (517.)
18.8 (326)
25.4 (404)
15.1 (261)
12.8 (222)
2.62
1.38
Source: CRC Reef Research Centre (1996) Table 12. Visitors’ perceptions of how much their trip to the GBRMP provided 16
possible benefits Benefit Item Mean Value1 Std. Deviation Experience the beauty of nature 4.69 0.55 Be in a natural place 4.42 0.75 Experience something new and different 4.30 0.86 Experience an undeveloped environment 4.17 0.92 Learn about a coral reef 4.07 0.95 Learn more about nature 4.05 0.89 Escape the normal routine 4.03 1.03 Have some excitement 3.73 0.96 Rest and relax 3.56 1.10 Be physically active 3.23 1.11 Be close to friends or family 3.19 1.39 Be with others who enjoy things that I enjoy 3.15 1.13 Get some exercise 3.03 1.11 Meet new people 2.57 2.57 Develop skills 2.55 1.21 Experience some solitude 2.35 1.29 1Mean Value is based on a 5 point response format where 1 = not at all, 2 = slightly, 3 = moderately,

33
4 = very much, 5 = extremely Source: CRC Reef Research Centre (1996)
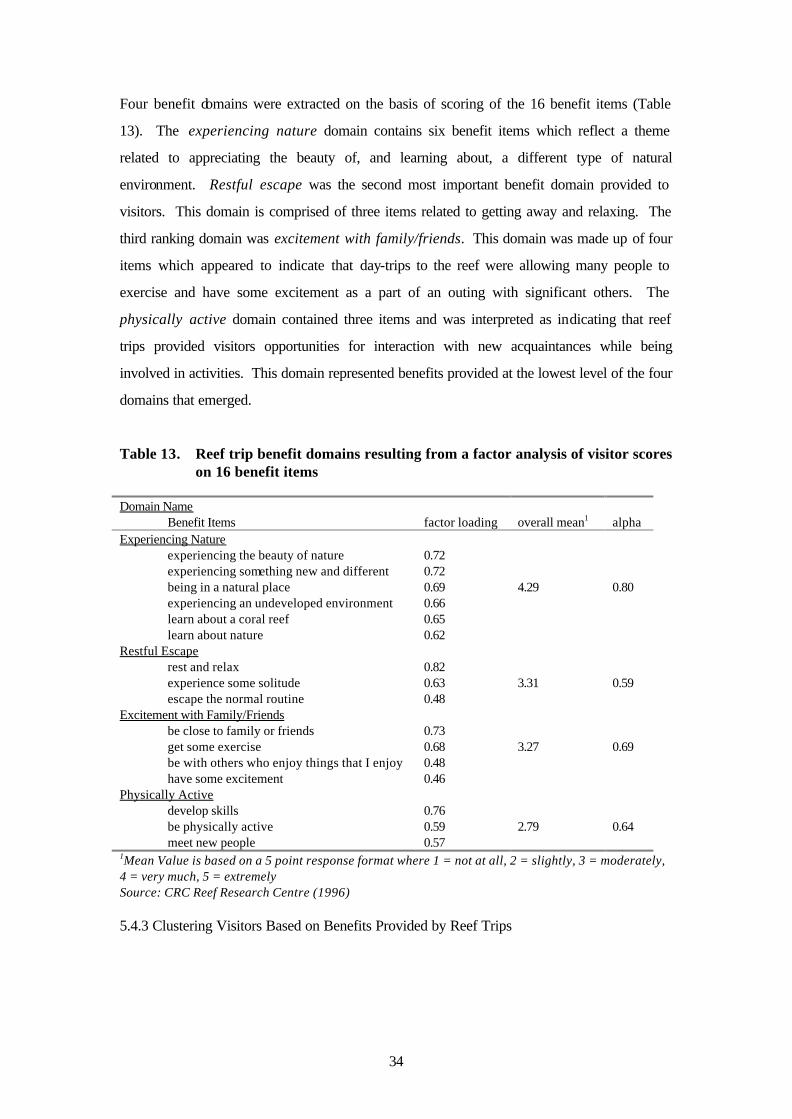
34
Four benefit domains were extracted on the basis of scoring of the 16 benefit items (Table
13). The experiencing nature domain contains six benefit items which reflect a theme
related to appreciating the beauty of, and learning about, a different type of natural
environment. Restful escape was the second most important benefit domain provided to
visitors. This domain is comprised of three items related to getting away and relaxing. The
third ranking domain was excitement with family/friends. This domain was made up of four
items which appeared to indicate that day-trips to the reef were allowing many people to
exercise and have some excitement as a part of an outing with significant others. The
physically active domain contained three items and was interpreted as indicating that reef
trips provided visitors opportunities for interaction with new acquaintances while being
involved in activities. This domain represented benefits provided at the lowest level of the four
domains that emerged.
Table 13. Reef trip benefit domains resulting from a factor analysis of visitor scores on 16 benefit items
Domain Name Benefit Items
factor loading
overall mean1
alpha
Experiencing Nature experiencing the beauty of nature 0.72 experiencing something new and different 0.72 being in a natural place 0.69 4.29 0.80 experiencing an undeveloped environment 0.66 learn about a coral reef 0.65 learn about nature 0.62 Restful Escape rest and relax 0.82 experience some solitude 0.63 3.31 0.59 escape the normal routine 0.48 Excitement with Family/Friends be close to family or friends 0.73 get some exercise 0.68 3.27 0.69 be with others who enjoy things that I enjoy 0.48 have some excitement 0.46 Physically Active develop skills 0.76 be physically active 0.59 2.79 0.64 meet new people 0.57 1Mean Value is based on a 5 point response format where 1 = not at all, 2 = slightly, 3 = moderately, 4 = very much, 5 = extremely Source: CRC Reef Research Centre (1996) 5.4.3 Clustering Visitors Based on Benefits Provided by Reef Trips
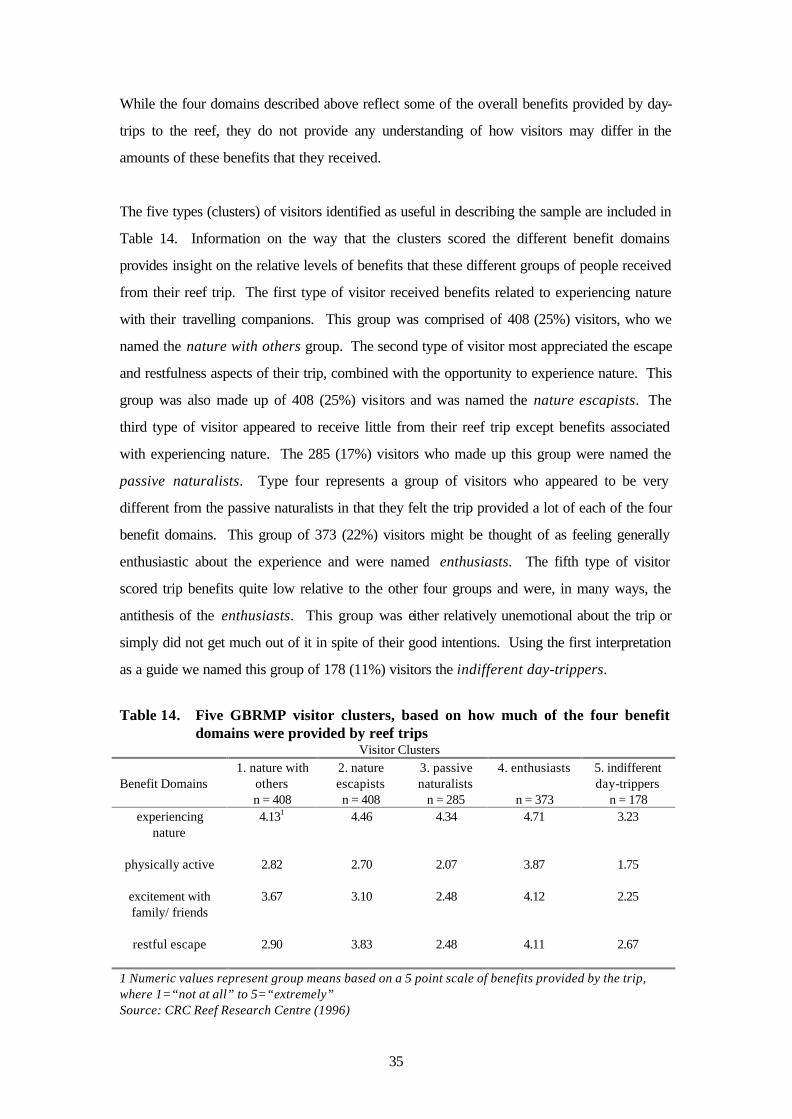
35
While the four domains described above reflect some of the overall benefits provided by day-
trips to the reef, they do not provide any understanding of how visitors may differ in the
amounts of these benefits that they received.
The five types (clusters) of visitors identified as useful in describing the sample are included in
Table 14. Information on the way that the clusters scored the different benefit domains
provides insight on the relative levels of benefits that these different groups of people received
from their reef trip. The first type of visitor received benefits related to experiencing nature
with their travelling companions. This group was comprised of 408 (25%) visitors, who we
named the nature with others group. The second type of visitor most appreciated the escape
and restfulness aspects of their trip, combined with the opportunity to experience nature. This
group was also made up of 408 (25%) visitors and was named the nature escapists. The
third type of visitor appeared to receive little from their reef trip except benefits associated
with experiencing nature. The 285 (17%) visitors who made up this group were named the
passive naturalists. Type four represents a group of visitors who appeared to be very
different from the passive naturalists in that they felt the trip provided a lot of each of the four
benefit domains. This group of 373 (22%) visitors might be thought of as feeling generally
enthusiastic about the experience and were named enthusiasts. The fifth type of visitor
scored trip benefits quite low relative to the other four groups and were, in many ways, the
antithesis of the enthusiasts. This group was either relatively unemotional about the trip or
simply did not get much out of it in spite of their good intentions. Using the first interpretation
as a guide we named this group of 178 (11%) visitors the indifferent day-trippers.
Table 14. Five GBRMP visitor clusters, based on how much of the four benefit
domains were provided by reef trips Visitor Clusters Benefit Domains
1. nature with others n = 408
2. nature escapists n = 408
3. passive naturalists
n = 285
4. enthusiasts
n = 373
5. indifferent day-trippers
n = 178 experiencing
nature
4.131 4.46 4.34 4.71 3.23
physically active
2.82 2.70 2.07 3.87 1.75
excitement with family/ friends
3.67 3.10 2.48 4.12 2.25
restful escape
2.90 3.83 2.48 4.11 2.67
1 Numeric values represent group means based on a 5 point scale of benefits provided by the trip, where 1=“not at all” to 5=“extremely” Source: CRC Reef Research Centre (1996)
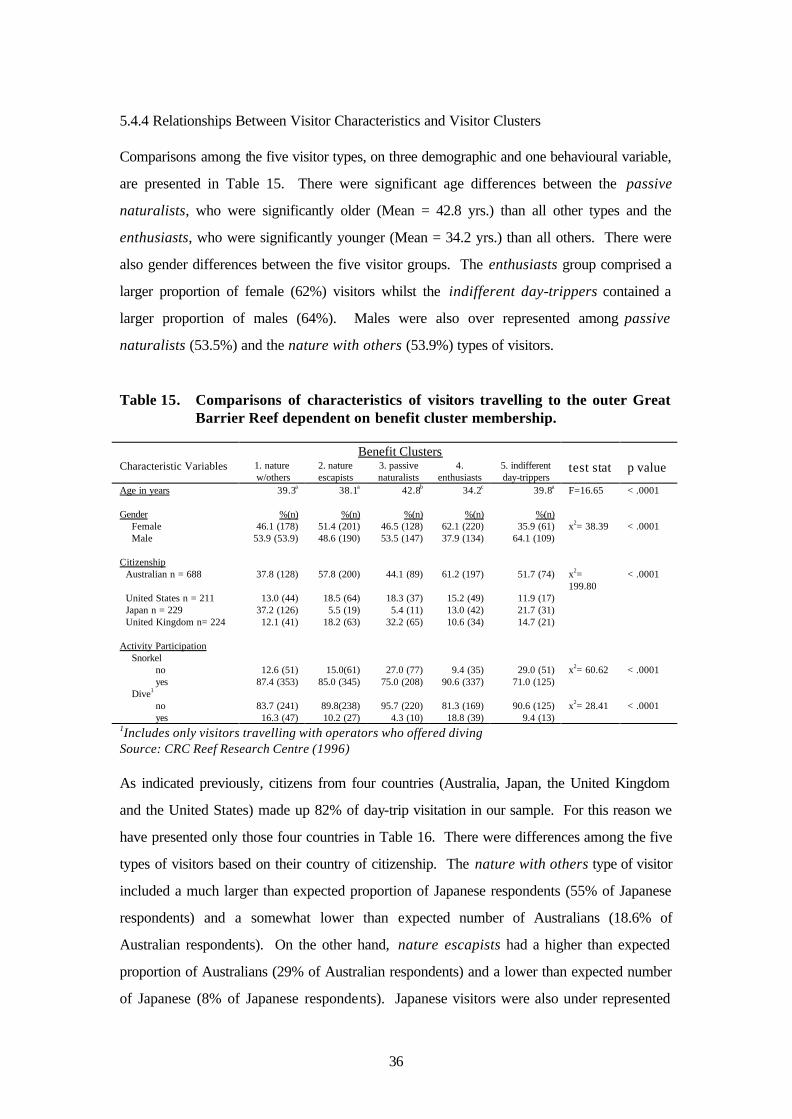
36
5.4.4 Relationships Between Visitor Characteristics and Visitor Clusters Comparisons among the five visitor types, on three demographic and one behavioural variable,
are presented in Table 15. There were significant age differences between the passive
naturalists, who were significantly older (Mean = 42.8 yrs.) than all other types and the
enthusiasts, who were significantly younger (Mean = 34.2 yrs.) than all others. There were
also gender differences between the five visitor groups. The enthusiasts group comprised a
larger proportion of female (62%) visitors whilst the indifferent day-trippers contained a
larger proportion of males (64%). Males were also over represented among passive
naturalists (53.5%) and the nature with others (53.9%) types of visitors.
Table 15. Comparisons of characteristics of visitors travelling to the outer Great Barrier Reef dependent on benefit cluster membership.
Benefit Clusters Characteristic Variables 1. nature
w/others 2. nature escapists
3. passive naturalists
4. enthusiasts
5. indifferent day-trippers
test stat p value
Age in years
39.3a 38.1a 42.8b 34.2c 39.8a F=16.65 < .0001
Gender %(n) %(n) %(n) %(n) %(n) Female 46.1 (178) 51.4 (201) 46.5 (128) 62.1 (220) 35.9 (61) x2= 38.39 < .0001 Male 53.9 (53.9) 48.6 (190) 53.5 (147) 37.9 (134) 64.1 (109) Citizenship
Australian n = 688 37.8 (128) 57.8 (200) 44.1 (89) 61.2 (197) 51.7 (74) x2= 199.80
< .0001
United States n = 211 13.0 (44) 18.5 (64) 18.3 (37) 15.2 (49) 11.9 (17) Japan n = 229 37.2 (126) 5.5 (19) 5.4 (11) 13.0 (42) 21.7 (31) United Kingdom n= 224 12.1 (41) 18.2 (63) 32.2 (65) 10.6 (34) 14.7 (21) Activity Participation
Snorkel no 12.6 (51) 15.0(61) 27.0 (77) 9.4 (35) 29.0 (51) x2= 60.62 < .0001 yes 87.4 (353) 85.0 (345) 75.0 (208) 90.6 (337) 71.0 (125) Dive1 no 83.7 (241) 89.8(238) 95.7 (220) 81.3 (169) 90.6 (125) x2= 28.41 < .0001 yes 16.3 (47) 10.2 (27) 4.3 (10) 18.8 (39) 9.4 (13) 1Includes only visitors travelling with operators who offered diving Source: CRC Reef Research Centre (1996) As indicated previously, citizens from four countries (Australia, Japan, the United Kingdom
and the United States) made up 82% of day-trip visitation in our sample. For this reason we
have presented only those four countries in Table 16. There were differences among the five
types of visitors based on their country of citizenship. The nature with others type of visitor
included a much larger than expected proportion of Japanese respondents (55% of Japanese
respondents) and a somewhat lower than expected number of Australians (18.6% of
Australian respondents). On the other hand, nature escapists had a higher than expected
proportion of Australians (29% of Australian respondents) and a lower than expected number
of Japanese (8% of Japanese respondents). Japanese visitors were also under represented
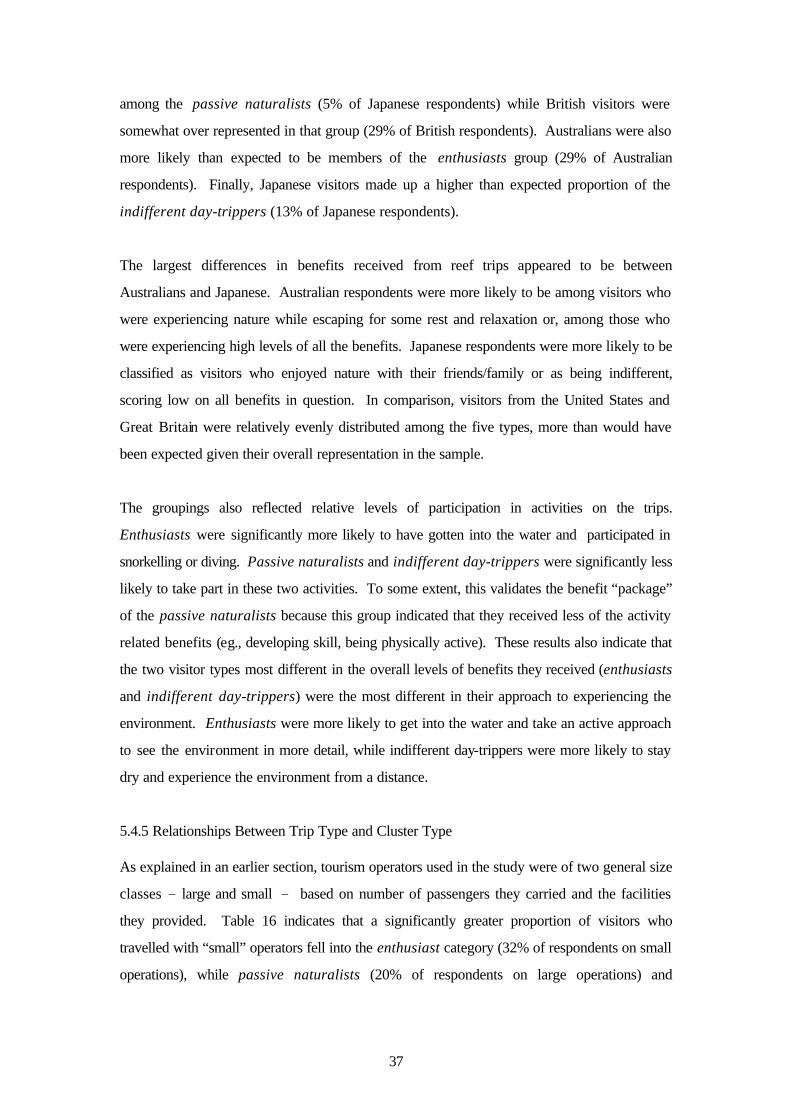
37
among the passive naturalists (5% of Japanese respondents) while British visitors were
somewhat over represented in that group (29% of British respondents). Australians were also
more likely than expected to be members of the enthusiasts group (29% of Australian
respondents). Finally, Japanese visitors made up a higher than expected proportion of the
indifferent day-trippers (13% of Japanese respondents).
The largest differences in benefits received from reef trips appeared to be between
Australians and Japanese. Australian respondents were more likely to be among visitors who
were experiencing nature while escaping for some rest and relaxation or, among those who
were experiencing high levels of all the benefits. Japanese respondents were more likely to be
classified as visitors who enjoyed nature with their friends/family or as being indifferent,
scoring low on all benefits in question. In comparison, visitors from the United States and
Great Britain were relatively evenly distributed among the five types, more than would have
been expected given their overall representation in the sample.
The groupings also reflected relative levels of participation in activities on the trips.
Enthusiasts were significantly more likely to have gotten into the water and participated in
snorkelling or diving. Passive naturalists and indifferent day-trippers were significantly less
likely to take part in these two activities. To some extent, this validates the benefit “package”
of the passive naturalists because this group indicated that they received less of the activity
related benefits (eg., developing skill, being physically active). These results also indicate that
the two visitor types most different in the overall levels of benefits they received (enthusiasts
and indifferent day-trippers) were the most different in their approach to experiencing the
environment. Enthusiasts were more likely to get into the water and take an active approach
to see the environment in more detail, while indifferent day-trippers were more likely to stay
dry and experience the environment from a distance.
5.4.5 Relationships Between Trip Type and Cluster Type As explained in an earlier section, tourism operators used in the study were of two general size
classes - large and small - based on number of passengers they carried and the facilities
they provided. Table 16 indicates that a significantly greater proportion of visitors who
travelled with “small” operators fell into the enthusiast category (32% of respondents on small
operations), while passive naturalists (20% of respondents on large operations) and

38
indifferent day-trippers (12% of respondents on large operations) were more likely to have
travelled with a “large operator.”
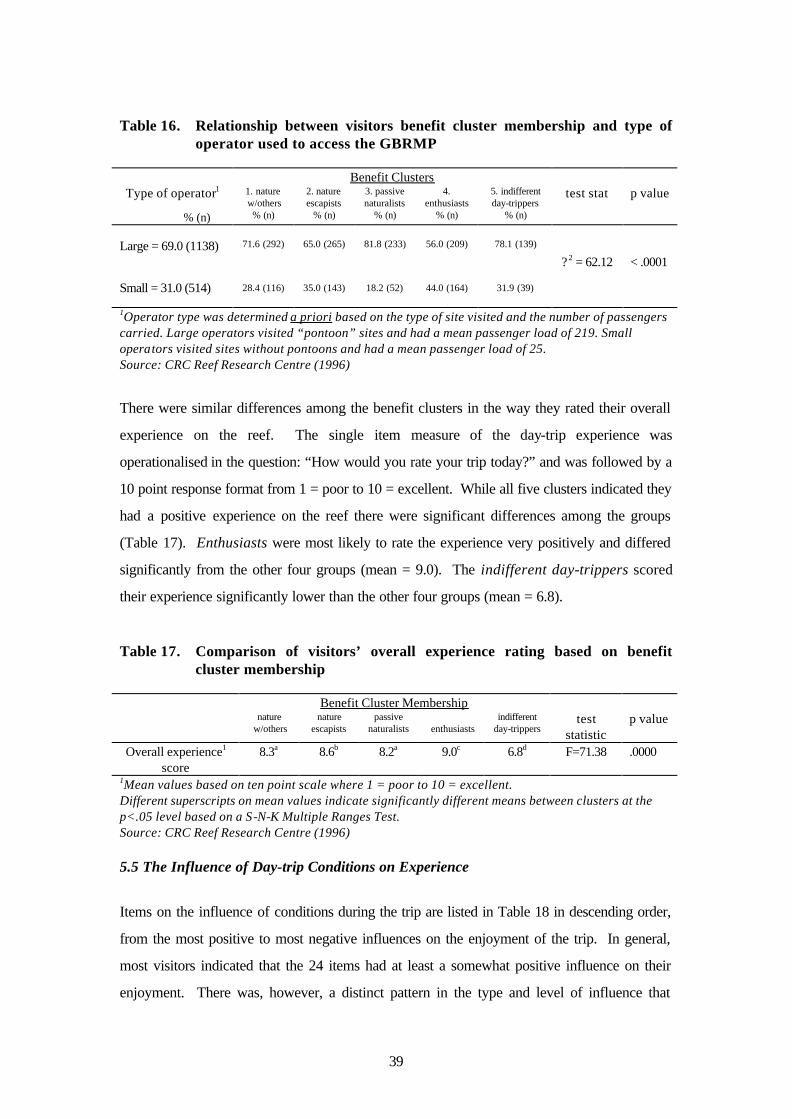
39
Table 16. Relationship between visitors benefit cluster membership and type of operator used to access the GBRMP
Benefit Clusters Type of operator1 1. nature
w/others 2. nature escapists
3. passive naturalists
4. enthusiasts
5. indifferent day-trippers
test stat p value
% (n) % (n) % (n) % (n) % (n) % (n) Large = 69.0 (1138) 71.6 (292) 65.0 (265) 81.8 (233) 56.0 (209) 78.1 (139)
? 2 = 62.12 < .0001
Small = 31.0 (514) 28.4 (116)
35.0 (143)
18.2 (52)
44.0 (164)
31.9 (39)
1Operator type was determined a priori based on the type of site visited and the number of passengers carried. Large operators visited “pontoon” sites and had a mean passenger load of 219. Small operators visited sites without pontoons and had a mean passenger load of 25. Source: CRC Reef Research Centre (1996)
There were similar differences among the benefit clusters in the way they rated their overall
experience on the reef. The single item measure of the day-trip experience was
operationalised in the question: “How would you rate your trip today?” and was followed by a
10 point response format from 1 = poor to 10 = excellent. While all five clusters indicated they
had a positive experience on the reef there were significant differences among the groups
(Table 17). Enthusiasts were most likely to rate the experience very positively and differed
significantly from the other four groups (mean = 9.0). The indifferent day-trippers scored
their experience significantly lower than the other four groups (mean = 6.8).
Table 17. Comparison of visitors’ overall experience rating based on benefit cluster membership
Benefit Cluster Membership
nature w/others
nature escapists
passive naturalists
enthusiasts
indifferent day-trippers
test statistic
p value
Overall experience1 score
8.3a 8.6b 8.2a 9.0c 6.8d F=71.38 .0000
1Mean values based on ten point scale where 1 = poor to 10 = excellent. Different superscripts on mean values indicate significantly different means between clusters at the p<.05 level based on a S-N-K Multiple Ranges Test. Source: CRC Reef Research Centre (1996) 5.5 The Influence of Day-trip Conditions on Experience
Items on the influence of conditions during the trip are listed in Table 18 in descending order,
from the most positive to most negative influences on the enjoyment of the trip. In general,
most visitors indicated that the 24 items had at least a somewhat positive influence on their
enjoyment. There was, however, a distinct pattern in the type and level of influence that
40
individual condition items had on the sample as a whole. Nine of the thirteen most positively
influential items dealt with the natural attributes (coral and fish) at the reef site. The
service(s) offered by the staff of the operations were also among the most positive influences
on the day. Items ranking 14th through to 19th were predominantly related to weather
conditions such as temperature and wind that were present during the trip. Items relating to
weather condition were generally scored as less positive (in some cases as negative)
influences on enjoyment. Four of the five least influential items represented what we have
referred to as social conditions. These items related to the number of people present in
different places during the trip and were items scored as having a neutral influence for the
sample as a whole.
Table 18. Visitor perceptions of the influence of 24 conditions on their experience Condition Item mean1 std. deviation Helpfulness of the staff 6.14 .91 Types of fish I saw 6.12 .95 Size of the coral I saw 6.11 .95 Total amount of coral I saw 6.09 .94 Number of different kinds of coral 6.03 .98 Information provided by the staff 5.98 1.01 Colour of the fish I saw 5.90 1.08 Clarity (visibility) of the ocean water 5.88 1.22 Colour of the corals I saw 5.85 1.17 Appearance of the staff 5.81 1.05 Total number of fish I saw 5.80 1.18 Behaviour of the fish 5.64 1.15 Size of the fish I saw 5.62 1.12 Temperature of the air 5.29 1.44 Depth of the water 5.28 1.23 Temperature of the water 5.20 1.46 Number of animals other than coral or fish that I saw 5.16 1.39 Sea conditions during the trip from/to shore 5.05 1.60 Number of people on the main boat 4.65 1.33 Number of people snorkelling 4.65 1.40 Currents in the water around the reef 4.62 1.26 Number of people on the pontoon 4.61 1.35 Amount of wind 4.50 1.45 Number of human-made objects in the water 4.34 1.47 1Mean was calculated based on a seven point response format where 1= very negatively, 2= negatively, 3= somewhat negatively, 4= no influence either way, 5= somewhat positively, 6= positively, 7= very positively Source: CRC Reef Research Centre (1996) While the overall mean values suggested a neutral influence for items with lower rankings,
frequency distributions of physical and social items (see Appendix 2) indicated that these
conditions were those with the highest percentages of negative influence responses. For
example, the “amount of wind” and the “number of human made objects in the water” were
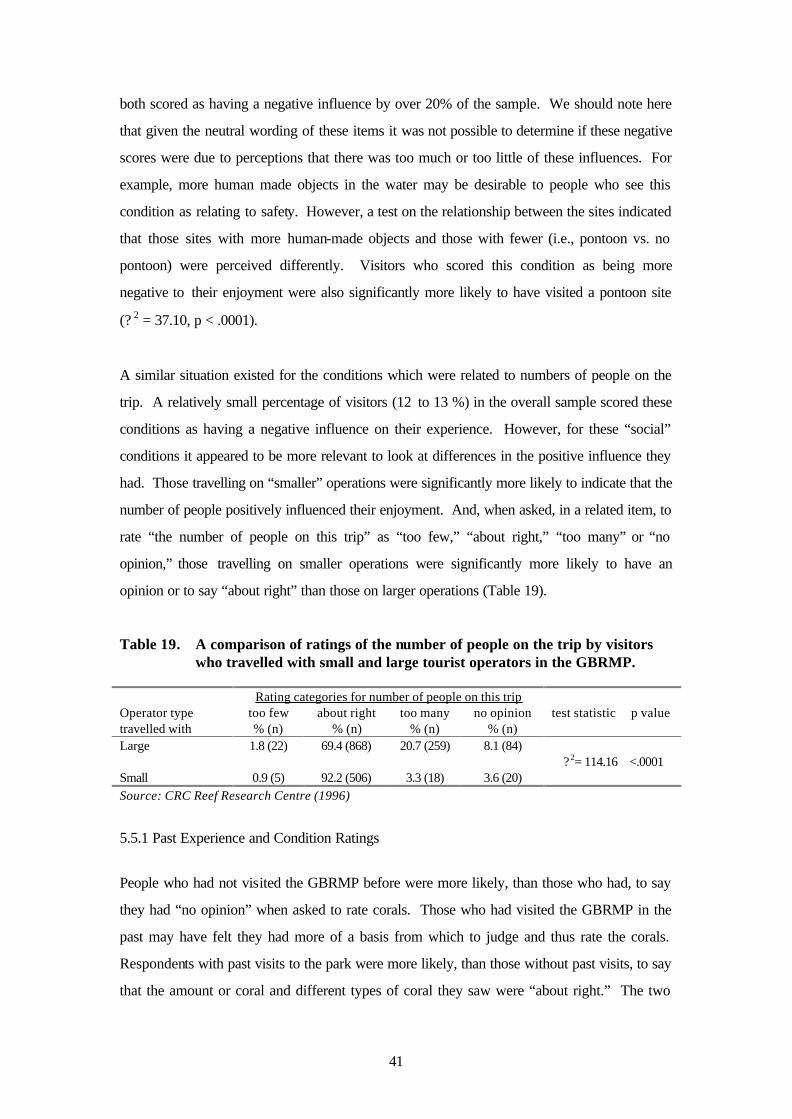
41
both scored as having a negative influence by over 20% of the sample. We should note here
that given the neutral wording of these items it was not possible to determine if these negative
scores were due to perceptions that there was too much or too little of these influences. For
example, more human made objects in the water may be desirable to people who see this
condition as relating to safety. However, a test on the relationship between the sites indicated
that those sites with more human-made objects and those with fewer (i.e., pontoon vs. no
pontoon) were perceived differently. Visitors who scored this condition as being more
negative to their enjoyment were also significantly more likely to have visited a pontoon site
(? 2 = 37.10, p < .0001).
A similar situation existed for the conditions which were related to numbers of people on the
trip. A relatively small percentage of visitors (12 to 13 %) in the overall sample scored these
conditions as having a negative influence on their experience. However, for these “social”
conditions it appeared to be more relevant to look at differences in the positive influence they
had. Those travelling on “smaller” operations were significantly more likely to indicate that the
number of people positively influenced their enjoyment. And, when asked, in a related item, to
rate “the number of people on this trip” as “too few,” “about right,” “too many” or “no
opinion,” those travelling on smaller operations were significantly more likely to have an
opinion or to say “about right” than those on larger operations (Table 19).
Table 19. A comparison of ratings of the number of people on the trip by visitors who travelled with small and large tourist operators in the GBRMP.
Rating categories for number of people on this trip Operator type travelled with
too few % (n)
about right % (n)
too many % (n)
no opinion % (n)
test statistic p value
Large 1.8 (22) 69.4 (868) 20.7 (259) 8.1 (84) ? 2= 114.16 <.0001 Small 0.9 (5) 92.2 (506) 3.3 (18) 3.6 (20) Source: CRC Reef Research Centre (1996)
5.5.1 Past Experience and Condition Ratings
People who had not visited the GBRMP before were more likely, than those who had, to say
they had “no opinion” when asked to rate corals. Those who had visited the GBRMP in the
past may have felt they had more of a basis from which to judge and thus rate the corals.
Respondents with past visits to the park were more likely, than those without past visits, to say
that the amount or coral and different types of coral they saw were “about right.” The two
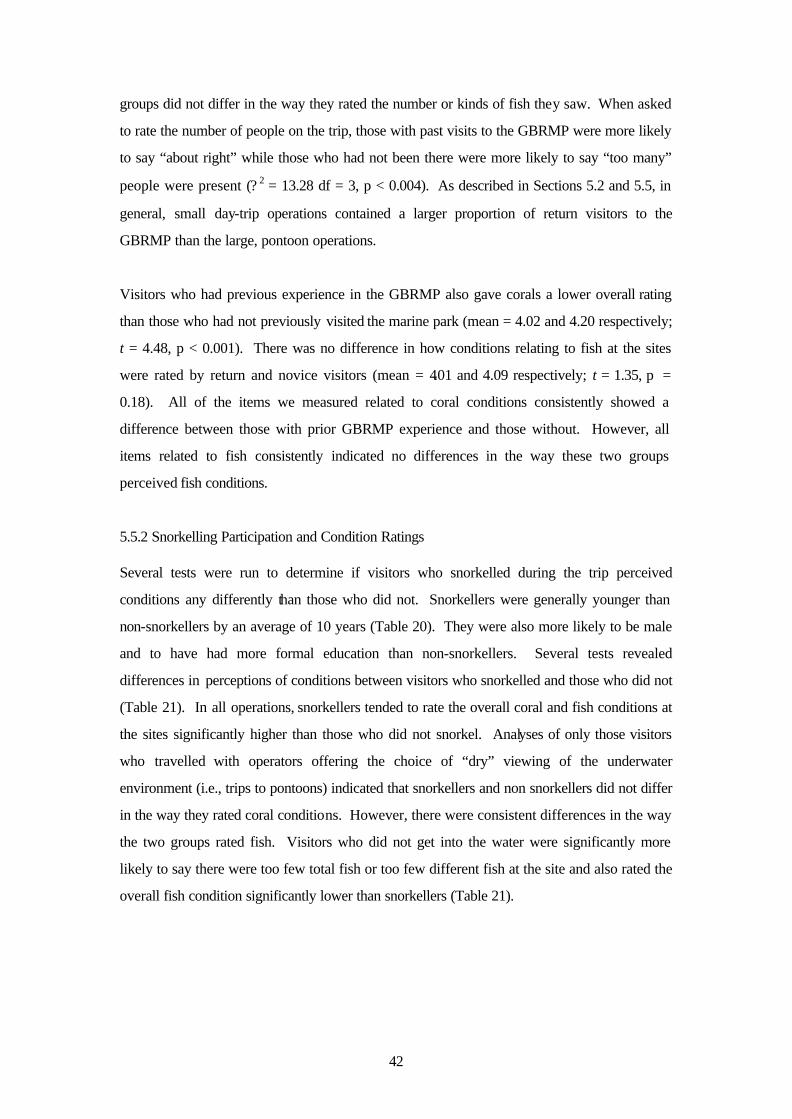
42
groups did not differ in the way they rated the number or kinds of fish they saw. When asked
to rate the number of people on the trip, those with past visits to the GBRMP were more likely
to say “about right” while those who had not been there were more likely to say “too many”
people were present (? 2 = 13.28 df = 3, p < 0.004). As described in Sections 5.2 and 5.5, in
general, small day-trip operations contained a larger proportion of return visitors to the
GBRMP than the large, pontoon operations.
Visitors who had previous experience in the GBRMP also gave corals a lower overall rating
than those who had not previously visited the marine park (mean = 4.02 and 4.20 respectively;
t = 4.48, p < 0.001). There was no difference in how conditions relating to fish at the sites
were rated by return and novice visitors (mean = 4.01 and 4.09 respectively; t = 1.35, p =
0.18). All of the items we measured related to coral conditions consistently showed a
difference between those with prior GBRMP experience and those without. However, all
items related to fish consistently indicated no differences in the way these two groups
perceived fish conditions.
5.5.2 Snorkelling Participation and Condition Ratings Several tests were run to determine if visitors who snorkelled during the trip perceived
conditions any differently than those who did not. Snorkellers were generally younger than
non-snorkellers by an average of 10 years (Table 20). They were also more likely to be male
and to have had more formal education than non-snorkellers. Several tests revealed
differences in perceptions of conditions between visitors who snorkelled and those who did not
(Table 21). In all operations, snorkellers tended to rate the overall coral and fish conditions at
the sites significantly higher than those who did not snorkel. Analyses of only those visitors
who travelled with operators offering the choice of “dry” viewing of the underwater
environment (i.e., trips to pontoons) indicated that snorkellers and non snorkellers did not differ
in the way they rated coral conditions. However, there were consistent differences in the way
the two groups rated fish. Visitors who did not get into the water were significantly more
likely to say there were too few total fish or too few different fish at the site and also rated the
overall fish condition significantly lower than snorkellers (Table 21).
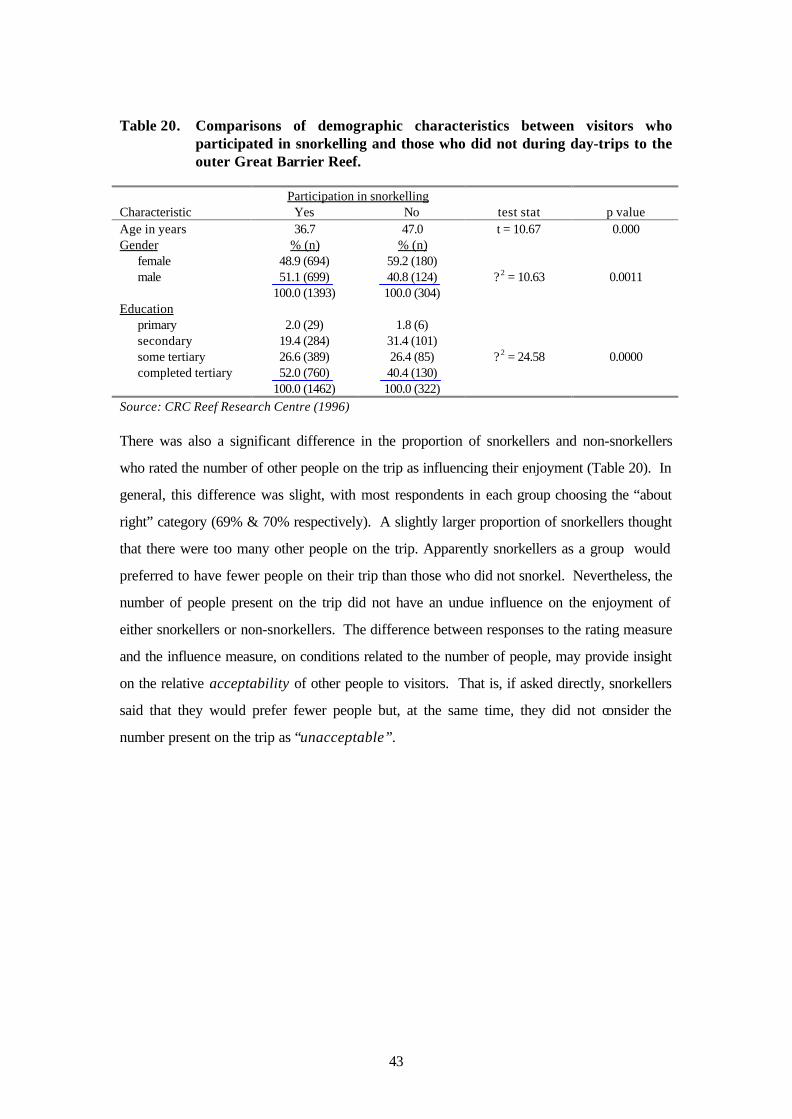
43
Table 20. Comparisons of demographic characteristics between visitors who participated in snorkelling and those who did not during day-trips to the outer Great Barrier Reef.
Participation in snorkelling Characteristic Yes No test stat p value Age in years 36.7 47.0 t = 10.67 0.000 Gender % (n) % (n) female 48.9 (694) 59.2 (180) male 51.1 (699) 40.8 (124) ? 2 = 10.63 0.0011 100.0 (1393) 100.0 (304) Education primary 2.0 (29) 1.8 (6) secondary 19.4 (284) 31.4 (101) some tertiary 26.6 (389) 26.4 (85) ? 2 = 24.58 0.0000 completed tertiary 52.0 (760) 40.4 (130) 100.0 (1462) 100.0 (322) Source: CRC Reef Research Centre (1996) There was also a significant difference in the proportion of snorkellers and non-snorkellers
who rated the number of other people on the trip as influencing their enjoyment (Table 20). In
general, this difference was slight, with most respondents in each group choosing the “about
right” category (69% & 70% respectively). A slightly larger proportion of snorkellers thought
that there were too many other people on the trip. Apparently snorkellers as a group would
preferred to have fewer people on their trip than those who did not snorkel. Nevertheless, the
number of people present on the trip did not have an undue influence on the enjoyment of
either snorkellers or non-snorkellers. The difference between responses to the rating measure
and the influence measure, on conditions related to the number of people, may provide insight
on the relative acceptability of other people to visitors. That is, if asked directly, snorkellers
said that they would prefer fewer people but, at the same time, they did not consider the
number present on the trip as “unacceptable”.
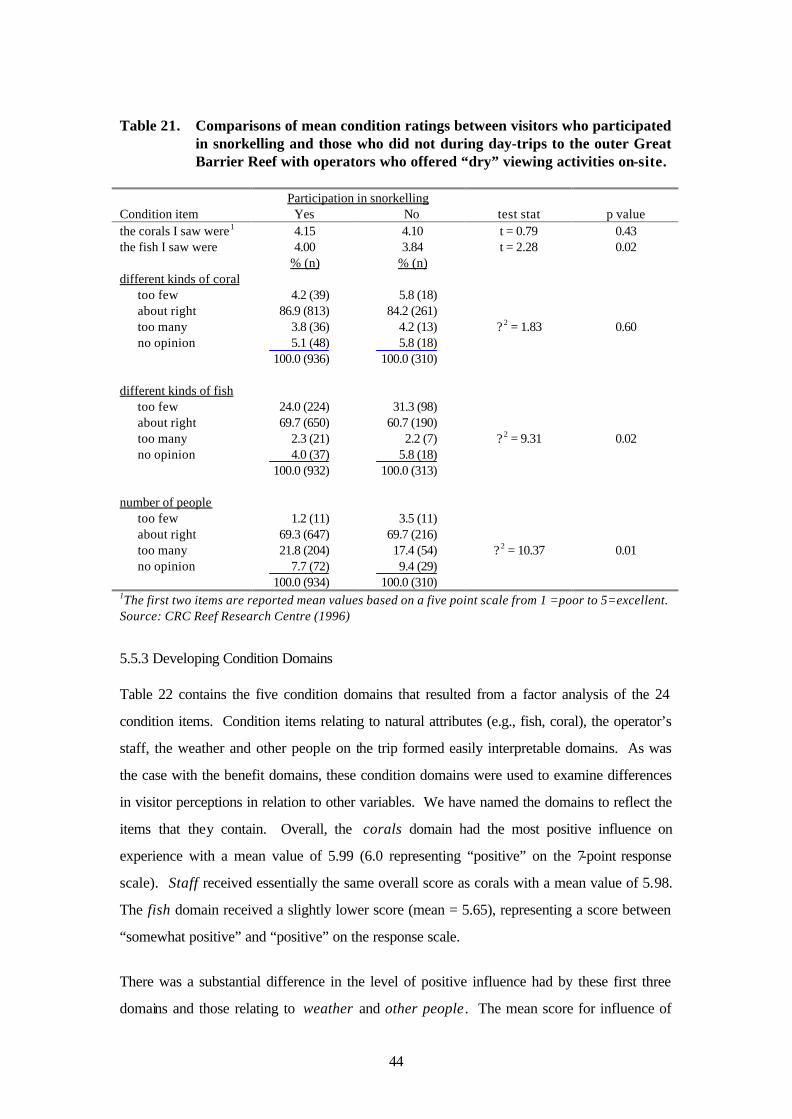
44
Table 21. Comparisons of mean condition ratings between visitors who participated in snorkelling and those who did not during day-trips to the outer Great Barrier Reef with operators who offered “dry” viewing activities on-site.
Participation in snorkelling Condition item Yes No test stat p value the corals I saw were1 4.15 4.10 t = 0.79 0.43 the fish I saw were 4.00 3.84 t = 2.28 0.02 % (n) % (n) different kinds of coral too few 4.2 (39) 5.8 (18) about right 86.9 (813) 84.2 (261) too many 3.8 (36) 4.2 (13) ? 2 = 1.83 0.60 no opinion 5.1 (48) 5.8 (18) 100.0 (936) 100.0 (310) different kinds of fish too few 24.0 (224) 31.3 (98) about right 69.7 (650) 60.7 (190) too many 2.3 (21) 2.2 (7) ? 2 = 9.31 0.02 no opinion 4.0 (37) 5.8 (18) 100.0 (932) 100.0 (313) number of people too few 1.2 (11) 3.5 (11) about right 69.3 (647) 69.7 (216) too many 21.8 (204) 17.4 (54) ? 2 = 10.37 0.01 no opinion 7.7 (72) 9.4 (29) 100.0 (934) 100.0 (310) 1The first two items are reported mean values based on a five point scale from 1 =poor to 5=excellent. Source: CRC Reef Research Centre (1996)
5.5.3 Developing Condition Domains Table 22 contains the five condition domains that resulted from a factor analysis of the 24
condition items. Condition items relating to natural attributes (e.g., fish, coral), the operator’s
staff, the weather and other people on the trip formed easily interpretable domains. As was
the case with the benefit domains, these condition domains were used to examine differences
in visitor perceptions in relation to other variables. We have named the domains to reflect the
items that they contain. Overall, the corals domain had the most positive influence on
experience with a mean value of 5.99 (6.0 representing “positive” on the 7-point response
scale). Staff received essentially the same overall score as corals with a mean value of 5.98.
The fish domain received a slightly lower score (mean = 5.65), representing a score between
“somewhat positive” and “positive” on the response scale.
There was a substantial difference in the level of positive influence had by these first three
domains and those relating to weather and other people . The mean score for influence of
45
weather, was closer to “somewhat positive.” This indicates a majority still scored weather as
a positive influence, but a sizeable proportion of respondents (ca. 16%) scored the items in this
domain as having some negative influence. Weather conditions varied over the 9 month
sampling period with some days being cooler, windier and rainier than many would have
preferred. Finally, the other people domain received the lowest mean score. The mean
score for this domain (4.52) was in the “no influence” to “somewhat positive influence” range.
The item “number of people on the pontoon” was removed from the final factor analysis
(although it did factor in this domain when included) because not all respondents had used
pontoon sites during their trip.
There were differences in the way that visitors scored these domains based on percentages
within a given response category. Most aspects of the trips were typically rated as positive.
A more specific break down helps to understand where negative influences may exist. This
information can be helpful in determining points of concentration for operators, planners and
managers. Frequency distributions for the three most positive condition domains (corals, staff
and fish) indicated that only one or two percent of the entire sample scored these conditions
below four (i.e., in the negative influence range). However, for the domain of weather, over
16% of respondents scored in the negative range. The influence of other people was even
more negative, with 25% of visitors scoring this domain in the negative range. It appears that
weather and other people were the only two types of conditions measured in this study that
had much potential for a negative influence on enjoyment of the reef.
5.5.4 The Influence of Conditions Across Operators/Sites The final part of the results presents a summary of findings on the influences of conditions in
each of the trips used in the study on visitor experience. Mean influence values shown in
Table 23 indicate that significant differences existed among all trips on all five condition
domains. Of particular interest are some of the trends in these influence scores. For example,
Oper 3 scored a significantly more positive level of influence on the two biophysical condition
domains of coral and fish than any other trip. Part of this positive influence may be
attributable to the fact that this operator visited two or three reef sites on a given trip while all
others had a single site destination. Thus, visitors on Oper 3 may have experienced a wider
variety of fish and coral by visiting additional sites.
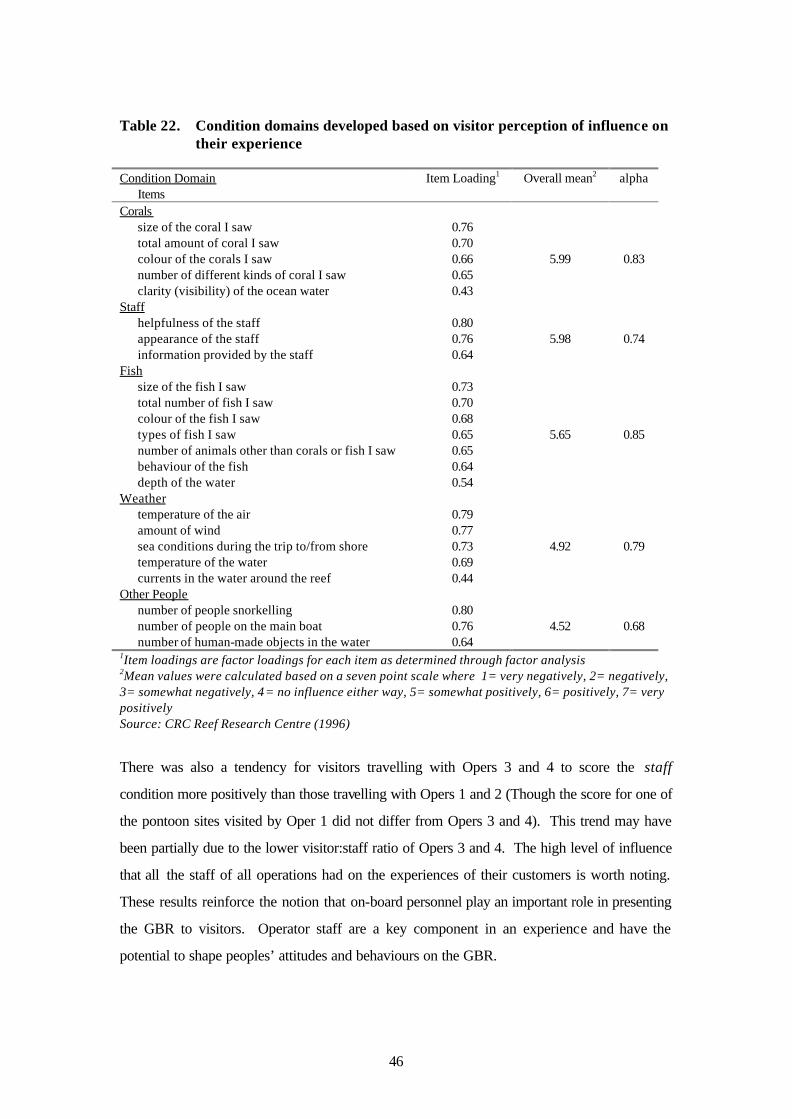
46
Table 22. Condition domains developed based on visitor perception of influence on their experience
Condition Domain Items
Item Loading1 Overall mean2 alpha
Corals size of the coral I saw 0.76 total amount of coral I saw 0.70 colour of the corals I saw 0.66 5.99 0.83 number of different kinds of coral I saw 0.65 clarity (visibility) of the ocean water 0.43 Staff helpfulness of the staff 0.80 appearance of the staff 0.76 5.98 0.74 information provided by the staff 0.64 Fish size of the fish I saw 0.73 total number of fish I saw 0.70 colour of the fish I saw 0.68 types of fish I saw 0.65 5.65 0.85 number of animals other than corals or fish I saw 0.65 behaviour of the fish 0.64 depth of the water 0.54 Weather temperature of the air 0.79 amount of wind 0.77 sea conditions during the trip to/from shore 0.73 4.92 0.79 temperature of the water 0.69 currents in the water around the reef 0.44 Other People number of people snorkelling 0.80 number of people on the main boat 0.76 4.52 0.68 number of human-made objects in the water 0.64 1Item loadings are factor loadings for each item as determined through factor analysis 2Mean values were calculated based on a seven point scale where 1= very negatively, 2= negatively, 3= somewhat negatively, 4= no influence either way, 5= somewhat positively, 6= positively, 7= very positively Source: CRC Reef Research Centre (1996)
There was also a tendency for visitors travelling with Opers 3 and 4 to score the staff
condition more positively than those travelling with Opers 1 and 2 (Though the score for one of
the pontoon sites visited by Oper 1 did not differ from Opers 3 and 4). This trend may have
been partially due to the lower visitor:staff ratio of Opers 3 and 4. The high level of influence
that all the staff of all operations had on the experiences of their customers is worth noting.
These results reinforce the notion that on-board personnel play an important role in presenting
the GBR to visitors. Operator staff are a key component in an experience and have the
potential to shape peoples’ attitudes and behaviours on the GBR.
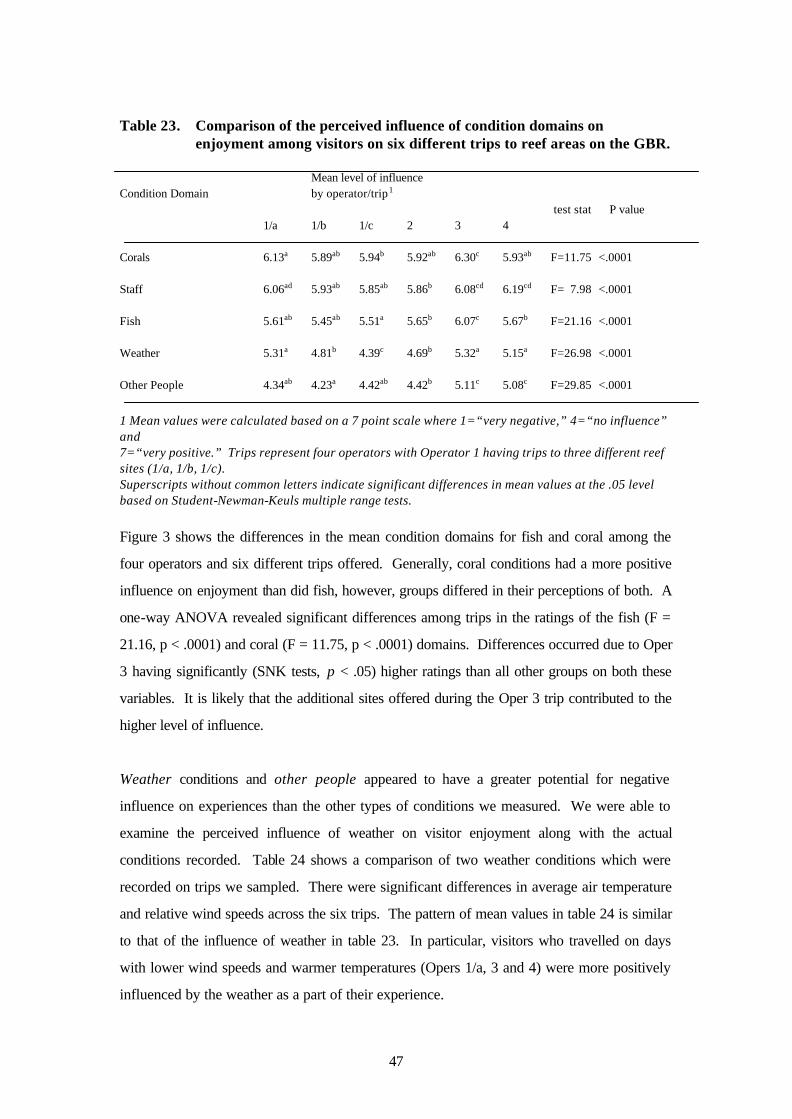
47
Table 23. Comparison of the perceived influence of condition domains on enjoyment among visitors on six different trips to reef areas on the GBR.
Mean level of influence Condition Domain by operator/trip1 test stat P value 1/a 1/b 1/c 2 3 4 Corals 6.13a 5.89ab 5.94b 5.92ab 6.30c 5.93ab F=11.75 <.0001 Staff 6.06ad 5.93ab 5.85ab 5.86b 6.08cd 6.19cd F= 7.98 <.0001 Fish 5.61ab 5.45ab 5.51a 5.65b 6.07c 5.67b F=21.16 <.0001 Weather 5.31a 4.81b 4.39c 4.69b 5.32a 5.15a F=26.98 <.0001 Other People 4.34ab 4.23a 4.42ab 4.42b 5.11c 5.08c F=29.85 <.0001
1 Mean values were calculated based on a 7 point scale where 1=“very negative,” 4=“no influence” and 7=“very positive.” Trips represent four operators with Operator 1 having trips to three different reef sites (1/a, 1/b, 1/c). Superscripts without common letters indicate significant differences in mean values at the .05 level based on Student-Newman-Keuls multiple range tests. Figure 3 shows the differences in the mean condition domains for fish and coral among the
four operators and six different trips offered. Generally, coral conditions had a more positive
influence on enjoyment than did fish, however, groups differed in their perceptions of both. A
one-way ANOVA revealed significant differences among trips in the ratings of the fish (F =
21.16, p < .0001) and coral (F = 11.75, p < .0001) domains. Differences occurred due to Oper
3 having significantly (SNK tests, p < .05) higher ratings than all other groups on both these
variables. It is likely that the additional sites offered during the Oper 3 trip contributed to the
higher level of influence.
Weather conditions and other people appeared to have a greater potential for negative
influence on experiences than the other types of conditions we measured. We were able to
examine the perceived influence of weather on visitor enjoyment along with the actual
conditions recorded. Table 24 shows a comparison of two weather conditions which were
recorded on trips we sampled. There were significant differences in average air temperature
and relative wind speeds across the six trips. The pattern of mean values in table 24 is similar
to that of the influence of weather in table 23. In particular, visitors who travelled on days
with lower wind speeds and warmer temperatures (Opers 1/a, 3 and 4) were more positively
influenced by the weather as a part of their experience.
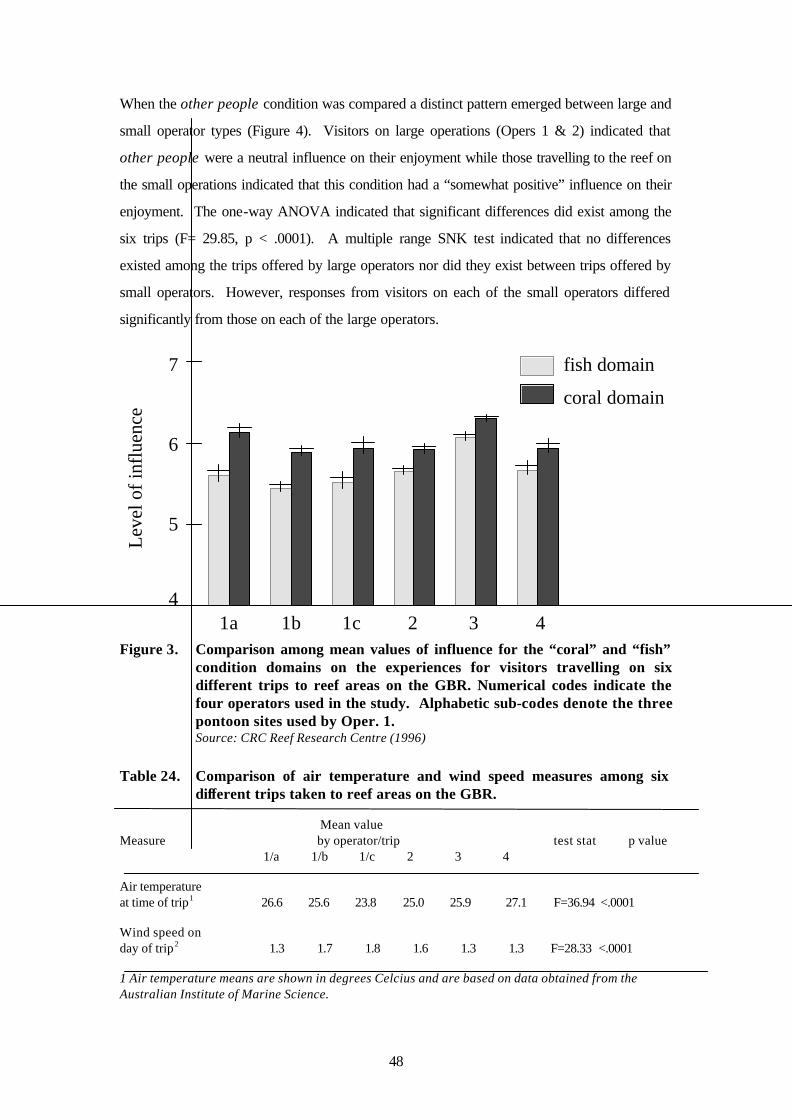
48
When the other people condition was compared a distinct pattern emerged between large and
small operator types (Figure 4). Visitors on large operations (Opers 1 & 2) indicated that
other people were a neutral influence on their enjoyment while those travelling to the reef on
the small operations indicated that this condition had a “somewhat positive” influence on their
enjoyment. The one-way ANOVA indicated that significant differences did exist among the
six trips (F= 29.85, p < .0001). A multiple range SNK test indicated that no differences
existed among the trips offered by large operators nor did they exist between trips offered by
small operators. However, responses from visitors on each of the small operators differed
significantly from those on each of the large operators.
7
6
5
41a 1b 1c 2 3 4
Leve
l of i
nflu
ence
fish domain
coral domain
Figure 3. Comparison among mean values of influence for the “coral” and “fish”
condition domains on the experiences for visitors travelling on six different trips to reef areas on the GBR. Numerical codes indicate the four operators used in the study. Alphabetic sub-codes denote the three pontoon sites used by Oper. 1. Source: CRC Reef Research Centre (1996)
Table 24. Comparison of air temperature and wind speed measures among six different trips taken to reef areas on the GBR.
Mean value Measure by operator/trip test stat p value 1/a 1/b 1/c 2 3 4 Air temperature at time of trip1 26.6 25.6 23.8 25.0 25.9 27.1 F=36.94 <.0001 Wind speed on day of trip2 1.3 1.7 1.8 1.6 1.3 1.3 F=28.33 <.0001 1 Air temperature means are shown in degrees Celcius and are based on data obtained from the Australian Institute of Marine Science.

49
2 Mean values for wind speed are based on a three point interval scale where 1=0-10 knots, 2=11-20 knots and 3=21-30 knots.
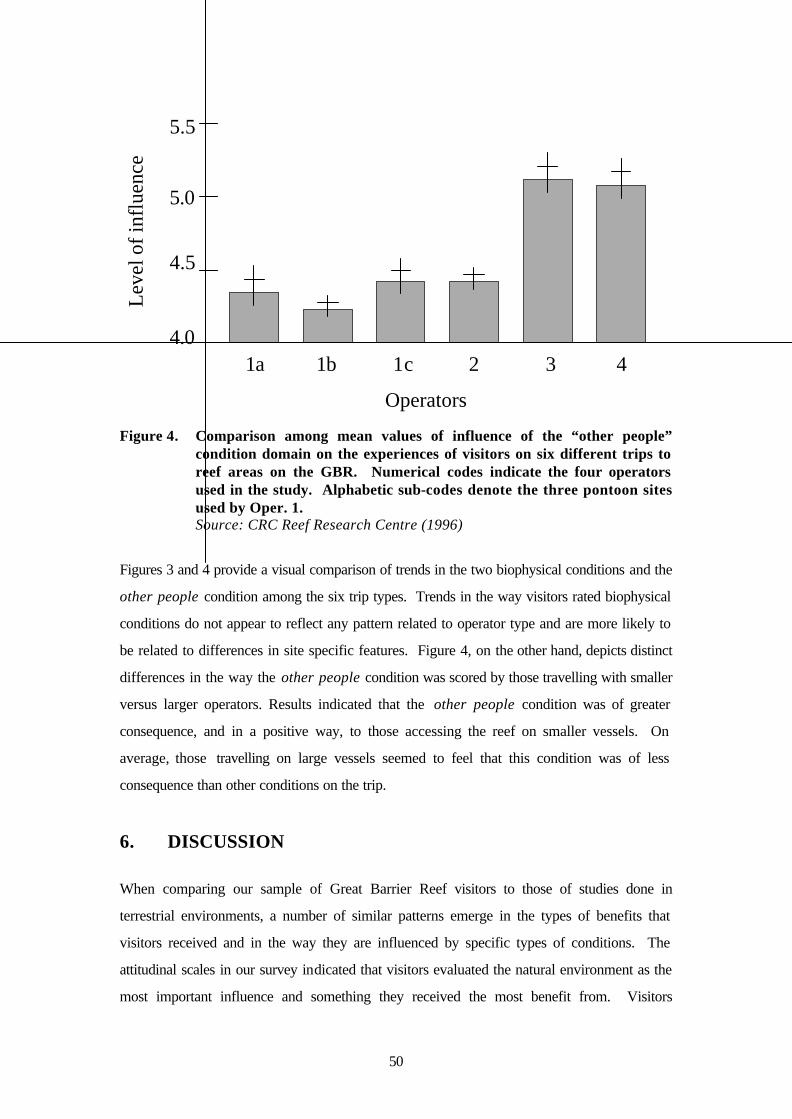
50
4.0
4.5
5.0
5.5
1a 1b 1c 2 3 4
Operators
Lev
el o
f inf
luen
ce
Figure 4. Comparison among mean values of influence of the “other people” condition domain on the experiences of visitors on six different trips to reef areas on the GBR. Numerical codes indicate the four operators used in the study. Alphabetic sub-codes denote the three pontoon sites used by Oper. 1. Source: CRC Reef Research Centre (1996)
Figures 3 and 4 provide a visual comparison of trends in the two biophysical conditions and the
other people condition among the six trip types. Trends in the way visitors rated biophysical
conditions do not appear to reflect any pattern related to operator type and are more likely to
be related to differences in site specific features. Figure 4, on the other hand, depicts distinct
differences in the way the other people condition was scored by those travelling with smaller
versus larger operators. Results indicated that the other people condition was of greater
consequence, and in a positive way, to those accessing the reef on smaller vessels. On
average, those travelling on large vessels seemed to feel that this condition was of less
consequence than other conditions on the trip.
6. DISCUSSION
When comparing our sample of Great Barrier Reef visitors to those of studies done in
terrestrial environments, a number of similar patterns emerge in the types of benefits that
visitors received and in the way they are influenced by specific types of conditions. The
attitudinal scales in our survey indicated that visitors evaluated the natural environment as the
most important influence and something they received the most benefit from. Visitors
51
indicated that benefits and conditions related to the presence of other people were less
important and less influential than those relating to nature. This trend has been found
consistently in terrestrial environments. There are management and marketing issues related
to this pattern which deserve more attention and which are discussed below.
As could be expected of an international tourist destination such as the GBR, there is diversity
among visitors and within the range of options for them to access reef sites. Our results
indicate that there are different profiles of people travelling with different operators to sites on
the outer GBR. Although, in many cases, these people are travelling to broadly similar settings
each type of visitor is engaging in different activities, perceiving conditions differently and,
ultimately, experiencing the reef in different ways. Findings related to differences in
experiences provide preliminary support for the concept of a spectrum approach to the
designation of areas for different levels and types of use, as suggested by the Limits of
Acceptable Change concept. However, more broad-based research across a greater range of
operations and environments is needed to direct management actions of this type.
6.1 Country of Citizenship and Past Visitation
The first objective of this study was to determine if different types of people differed in their
perceptions of the reef. Australia, Japan, Britain and the USA were the top four countries
represented among our sample of day use visitors. The most prominent differences occurred
between Japanese and Australians. In contrast to Australians, the experiences of Japanese
visitors seem to have been particularly enhanced by the benefits of time spent with family and
friends. Japanese were also more likely than Australians to indicate low levels of all possible
trip benefits. Receiving more of a benefit from family and friends may occur due to the
relative isolation that any non-English speaking culture would encounter on board a vessel
dominated by English-speaking passengers. It is likely to be harder for Japanese visitors to
interact with people outside their travel group causing them to rely more closely on friends and
family for social interaction. The lower rating of the overall reef experience by Japanese
visitors may occur because many Japanese travel to the GBR as a part of a travel package
that includes other destinations within Australia. A reef trip may, therefore, not be as high a
priority to some of these visitors. It is also possible that limitations in the measurement
instrument led to some of the these differences. While we used professional translators to
equate meanings of the questions in other languages with those in the English survey, there is
always the possibility of error introduced upon translation by slight changes in meaning.
52
Australian visitors were more likely to have made the GBR a specific destination. Recent
research conducted for GBRMPA (Huf & Douglas 1995) indicated that the GBR was a well
recognised and important symbol in the eyes of the Australian public. Many Australians have
indicated that the GBR is a place they plan to visit. Choosing to visit the GBR specifically and
recognising it as an icon of Australia may help explain why Australians were most likely to
receive higher levels of all benefits from their reef experience. Bureau of Tourism Research
(1995) statistics indicate that international visitors to Australia most frequently nominate the
Great Barrier Reef as the thing they most want to experience before leaving the country.
In general, tourists who had previously visited the GBR were more likely to rate the condition
of corals lower than first time visitors. Other research in outdoor recreation has shown that
higher levels of prior experience result in a higher level of sensitivity to the setting (Hammitt &
McDonald 1983; Virden & Schreyer 1988). In this study, return visitors were more likely to
feel that they did not see enough coral and they did not rate overall coral conditions as well as
first time visitors. Past visitors were significantly less likely to say that too many people were
on their trip. Visitation on the GBR has been increasing steadily and rapidly (as much as 30%
per annum in some areas) over the past 20 years with the most dramatic increases occurring
in the past 5 years (Carey 1993; Craik 1993; Driml 1994). Return visitors to the GBRMP
were, however, more likely to travel on smaller vessels and, therefore, were more likely to
experience smaller numbers of people on their current trip than on the previous one. While
12% of past visitors did indicate there were too many people on their trip, a higher percentage
(17%) of first time visitors felt this way. First time visitors may also have come with
expectations of lower use on the GBR. Promotional information depicting a coral reef
environment where few people are encountered may cause unrealistic expectations among
some visitors (Fenton & Johnson, submitted).
It is beyond the scope of this study to determine why these perceptions existed but change in
corals and increased reef visitation are often anecdotally cited as important impacts on the
GBR associated with tourism development. Those who had visited before may be reacting to
situations which they perceive as different from the past. Dustin and McAvoy (1982) have
pointed out that people often adapt to changing conditions or are displaced to different
environments in search of the conditions they once experienced. Even small differences in
visitor perceptions of conditions between past visitors and first timers are worth noting
53
because many may already have been displaced to other settings. A “product shift” may be
occurring in some reef visitors. This is a process in which they psychologically redefine what
a day-trip to the outer barrier reef is in terms of coral conditions and numbers of people
(Shelby et al. 1988; Shindler & Shelby 1995). For example, visitors with more experience may
have “shifted” their perception regarding the number of people to better match the current
situation on the reef because they were more aware of it and have adjusted their expectation.
Others may have been displaced from the larger operators to smaller ones. They may have
“coped” with what they perceive to be increasing numbers of visitors on large vessels and
pontoons by selecting smaller operators to achieve a desired experience.
6.2 Contribution of Activity Participation to Experience
A large proportion of all tourists in the survey (70-80%) participated in “wet” activities at the
reef sites they visited. Results indicated that those who snorkelled or dived were significantly
more likely to have received greater levels of benefits from the trip. On trips with pontoons as
destinations, snorkellers rated corals, fish and their overall day on the reef as better than those
who did not snorkel. Such ratings are likely to have occurred because snorkellers came in
closer contact with the corals and fish, more fully experiencing the environment in which they
live. At pontoon sites where some visitors chose to view corals from a vessel or observatory,
they were less likely to see as much of the texture and colour present in the coral or see as
many different kinds of fish as someone who snorkelled the area.
The primary aim of nature-based recreation and tourism is to provide experiences in the
natural environment and it appears that day use reef visitors who explored the environment
more closely more fully realised that aim. Snorkelling represented a new and different
experience for many of these visitors which may have enhanced feelings of learning and skill
development that other visitors did not receive. A comparison of benefit cluster groups
showed that those who were most enthusiastic about their experience on the GBR (the
enthusiast group) received the highest levels of all benefits and were more likely to have
snorkelled. Passive naturalists on the other hand were significantly less likely to have
snorkelled. Those more passive in their encounter with the reef obtained high levels of
benefits associated with seeing and learning about nature but received much lower levels of
benefits related to being active, excitement with family/friends and escape. Snorkelling may
help bring people closer to the natural environment but it may be contributing even more to

54
individual experiences by providing a vehicle for being physically active and sharing a new
experience with others.
55
How Visitors Value the Reef
Understanding reasons for valuing reef sites within the GBRMP is important to making
decisions about how to designate and manage such sites. The nine items presented in Table
11 were intended to measure individuals’ perceptions of the reasons humans may value the
Great Barrier Reef. The meanings that people assign to places in the environment are often
related to how strongly they feel about how it changes. The more that public and private
managers of natural resources can understand about such meanings the more they can
prepare for how to implement change (or the lack there of) that will be agreeable to users and
the public at large. Overall, visitors felt that the reef sites they visited were most important for
conservation, the natural processes that existed there and the opportunities to learn. Of least
importance were economic opportunities and potential spiritual meanings associated with the
sites. It is noteworthy that visitors placed a low level of importance on economic values as
they travelled with operators who derive such value from reef use. This item may have been
somewhat confounded by its interpretation as an issue that related to other forms of
exploitation of natural resources, such as mineral extraction or commercial fishing. The low
rating of spiritual value may need more research from the standpoint of indigenous people.
Aboriginal and Torres Strait Islander people have had a long-standing spiritual relationship to
sites on the GBR. It is likely that day use visitors on the GBR have a low level of awareness
about this spiritual relationship with reef places and, therefore, rated it as of less value.
The list suggested to respondents was necessarily limited in scope but, results provide some
orientation toward more specific questions that could be raised about reasons to value coral
reef environments. For example: “How does the way day tourists valued the sites they visited
compare to the perceptions of those who frequent reef sites for recreational or commercial
reasons?”, “Why are tourists assigning these levels of value to the reef sites they visit and
what do these values really mean?” (i.e., What are “conservation opportunities” and/or
“economic and spiritual meanings”?). The answers to these questions can inform decisions
about marine park zoning designations based on social values expressed in legislation at the
federal (GBRMP Act) and at International (World Heritage) levels.
The mapping of these values (as well as other attitudes about human use of the environment)
has strong potential as a management tool. Maps portraying human values of reefs, by site,
would add a useful layer of information to the decision making process. The mapping tool has
56
the potential to help legitimise the meanings that users assign to reefs. Meanings associated
with natural environments can be as important to the sociopolitical component of management
as types of corals and fish inhabiting an area are to the biophysical component (Williams &
Patterson 1996).
Benefits of Day Use Visitation on the GBR The broad benefits provided to visitors through experiences in land- and water-based natural
environments appear to be very similar. Research on terrestrial environments, much of it
conducted in land based parks and forests, has indicated that people visiting such areas do so
predominantly to experience and learn about nature. Most visitors in such studies had been
experiencing undeveloped mountains, forests and rivers (e.g., Brown & Haas 1980; Lucas
1985; Manfedo, Driver & Brown 1983; Schreyer & Roggenbuck 1978). The visitors we
questioned on the GBR were experiencing a marine environment but, as with other natural
environments, the benefits they received were mostly related to experiencing nature and
learning about it. The second greatest benefit on reef trips was related to rest/relaxation and
escape. Almost without exception, past research in terrestrial areas has also revealed that
benefits related to rest, relaxation and escape have been next in importance behind
experiencing and learning about nature.
In general, our findings on the benefits of visiting a reef site on the GBR mimic those of land
based environments. This may be partly due to the fact that items presented to visitors were
based on those used in research in land based environments. However, respondents scored
the items in a way which revealed that reef trips appear to provide the same pattern of
benefits as trips into national forests. Research conducted by Scherl et al. (1993) on the
GBR’s Lady Musgrave Island and Reef, revealed a similar pattern of benefits using a
different methodology. For example, Scherl et al. found that when they asked visitors to talk
about their reef/island experience the highest percentages of topics mentioned dealt with
positive evaluations of the physical environment, contemplating nature, and the reef and island
ecosystems.
The fact that visitors to the GBR are provided with benefits related to seeing and learning
about nature, and an escape from the usual day-trip experiences, provides additional
justification for the need to understand how the natural and social environment is providing
these benefits and what changes in the environment might detract from them. The benefits
57
that people take away from their trip to the Great Barrier Reef form the core of their
experience. Their experience is used to assign meaning to the resource and that meaning has
implications for people’s reaction to change and the management policy which directs why and
how change will occur.
Conditions Influencing Day-trips to the Great Barrier Reef When asked about specific conditions, visitors indicated they were most influenced, and in a
positive way, by corals, fish and the professional staff in charge of their trip. As with benefits,
visitor reactions to more specific conditions showed that components of the natural
(biophysical) environment were most influenced their enjoyment. In particular, the influence
of corals received the highest influence score. Corals are largely responsible for the form of
the landscape which is viewed in the underwater environment of a reef much as geological
features and vegetation are in terrestrial environments. Research in terrestrial landscapes has
investigated the influence of complexity, texture, mystery, legibility and coherence on peoples’
visual preferences (for a review see Kaplan & Kaplan 1989). Visual preference in terrestrial
environments is believed to be dependent on the human ability to understand and the desire to
explore. Complexity and texture are components of environmental exploration that have been
positively related to preference for landscapes (e.g., Herzog 1987). The complexity and
texture of a coral reef may play a large part in the strong positive influence that corals had on
visitor enjoyment. Visual preference research with underwater environments in general, and
corals in particular, will be important as visitor perceptions of reefs are included in the
management process.
In recent studies of wilderness users, condition items related to negative impacts on the natural
environment (trees, soils, litter) due to visitor behaviour have been most important, or of most
concern, to respondents (Roggenbuck et al. 1993, Shafer & Hammitt 1995). Visual
preference research can help in determining how people perceive coral reefs and thus how
they might perceive changes in them. Research in terrestrial environments suggests that users
are able to detect various levels of damage to trees, soil compaction and pieces of litter in the
environment. The ability to detect damage on a coral reef is much less clear but may be every
bit if not more influential to visitor experiences than items measured here. Preliminary
investigations by CRC Reef researchers suggest that inexperienced reef visitors lack an
appropriate cognitive framework to distinguish the condition of reef sites based on natural
features or damage to natural features (Fenton & Johnson, submitted; Rouphael, unpubl. data).
58
For example, Rouphael (unpubl. data) found no difference in perceptions of the condition of
coral reef sites by SCUBA divers despite substantial differences in coral cover between the
sites (> 15% difference in the cover of hard corals) and a 4-fold change in the number of
broken colonies at the same sites over the 12 months that the study took place.
Another condition that is rated very positively by people in terrestrial environments is
encounters with wildlife. Although corals are animals, fish are more likely to be associated
with “wildlife” by visitors to the reef. While fish were scored as one of the most positive
influences they were less positive in their influence than coral at every site in this study.
Almost 25% of visitors who got in the water to snorkel indicated that they saw too few fish
and 31% of people who only engaged in “dry” viewing activities indicated seeing too few fish.
Seeing fish may be highly important to people and the fact that many visitors felt they saw too
few may have resulted in this less positive overall influence for conditions related to fish.
Certainly, larger species such as Maori Wrasse, reef sharks, rays and groupers attract special
attention and may heighten an individual’s experience just as a koala, moose or giraffe might in
their respective terrestrial environments.
The staff of the tourist vessels also had a very positive influence on visitor enjoyment. In
particular staff helpfulness was scored as the highest condition item of the 24 that were posed.
Scores for these items generally were very positive about the staff on the operations that
assisted in this study and they should also indicate that operational conditions are very
influential on the way that visitors experience the GBR. The current training and licensing
programmes in place for operators and their staff are important. It may be especially
important to continue staff development training on the latest knowledge of the GBR
ecosystem and it management. Our results indicate that staff have the potential to be very
influential with such knowledge.
Physical conditions that were part of peoples’ trips were more variable in their level of
influence on enjoyment. For example, items related to temperature were scored by 13% of all
respondents as having some level of negative influence. Larger numbers of people indicated
that sea conditions and wind had a negative influence on them. Sea sickness adversely affects
some reef visitors and is likely to be the reason for the negative influence. While weather can
certainly play a part in the enjoyment of terrestrial environments, the sea conditions that result
from high winds have the added potential for negative influence through motion sickness.
59
Other people present, and evidence of human development, were also variable in the way they
seemed to influence people. We sought to examine components of social carrying capacity
which has been based on the assumption that other people are an important influence on
experiences in natural environments. Conditions related to numbers of other people tended to
elicit the highest percentages of neutral and negative responses from visitors. There is some
question about the relevance of number of people in the mind of many visitors. Snorkellers
appeared to be more influenced by the number of people than people who did not go
snorkelling, but these ratings were confounded by differences in the relative proportions of
people who went snorkelling on large and small operations. It is possible that the behaviour of
some snorkellers in the water affected perceptions of crowding, as on busy days, when many
people are present in the confined snorkelling areas they often bump into each other and/or
find themselves needing to navigate among the less experienced. Although the numbers of
people item was rated quite neutrally across the sample as a whole, it did appear to have
different potentials for positive influence on reefs trips among those who chose different types
of trips (see below). Finally, items relating to the number of human made objects in the water
received the highest percentage of negative responses among the 24 items and seemed to
indicate that some people were particularly sensitive to infrastructure at reef sites. Terrestrial
wilderness users react very negatively to obvious human impacts like litter, worn campsites
and other visual intrusions on the naturalness of the landscape. This issue of human behaviour
and presence on the reef deserves future attention so that specifics about perceptions of
change can be better understood.
6.3 Taking an Experience-Based Approach to LAC on the GBR
Increases in day use visitation on the outer Great Barrier Reef have been the source of
conflict between operators and managers and between different types of users. One of the
primary concerns among managers has been the potential degradation of coral reef sites due
to the increase in use. Actual physical changes in corals and fish are difficult to measure and
even more difficult to relate to specific human activities. As a part of this research we have
attempted to gain insight to these relationships at a site specific scale and will address the
findings elsewhere. Corals are touched, abraded and broken and fish are attracted to tourist
locations from other parts of the reef (Sweatman 1996; Nelson & Mapstone 1998). In the
short- to medium term (<5 years), it appears that there is no significant net change in reef
community structure associated with these activities, but, it is unclear if there are any long-
60
term consequences of these changes in corals and fish. Existing information suggests
relatively rapid recovery upon removal of the tourism operation (Inglis 1997).
An experience-based approach to designating use (types and amounts) and selecting indicators
in a LAC process can provide a systematic method for meeting the goals of natural resource
managers and tourism operations. Both seek to maintain a diversity of opportunities for
visitors to the marine park. The last three objectives of this study were intended to address
issues that more directly apply to implementing a LAC approach to managing tourist day use
on the GBR. We wanted to determine if visitors were having different experiences on the
reef and if different conditions were having different levels of influence on them.
The type of experience visitors had differed based on the “packages” of benefits they
received from their reef trips. When those benefit packages were compared across operators
it was apparent that different experiences were related to different types of trips. While all
the operators in our sample offered high levels of benefits relating to nature and learning, large
operators allowed some visitors to be more passive in their enjoyment of the reef by offering a
wider range of activities and a more developed on-site setting. Visitors travelling with smaller
operators were more likely to have received benefits associated with active participation and
escape from others. Through lower levels of development, smaller operators required their
visitors to pursue “wet” activities if they wanted to see the underwater environment, while
their smaller passenger loads may be helping to provide more of the escape benefit.
While many passengers book passage on trips from a distance or as a part of a package tour,
it is still likely that the type of operators available play a role in that choice. Some visitors no
doubt choose larger operators because they offer more variety in activities (e.g., wet and dry)
to access the underwater environment. Facilities on larger vessels, the development at their
destination sites (e.g., pontoons), and the larger loads of passengers may be perceived as safer
and more comfortable than those of smaller vessels. Smaller operators on the other hand
offer the option of lower levels of development and a more intimate group experience.
Importantly, a large proportion of return visitors to the GBRMP appear to choose smaller
operations. This same pattern has been found in a broader CRC Reef study on market
segmentation within the marine tourism industry (Pierce et al. 1997). Perceptions of
conditions support the differences found in benefits packages and indicate that the two types

61
of operation in this study represent two different points in a spectrum of ways to experience
the GBR.
62
6.4 Implications for Managers and Tourist Operators
The primary implication of this study is obvious. If managers and operators wish to continue
to provide a sustainable resource, which meets human expectations as one of the great natural
wonders, the biophysical environment and the social environment must be well cared for.
Visitors of all nationalities and with various feelings about their experience overwhelmingly
agreed that seeing and learning about the natural resource was what they took away from this
experience and that natural resource conditions had the most positive influence on their
enjoyment.
Future research must continue to examine changes that occur to components of the natural
environment as a result of different uses of the GBRMP in order to balance use with resource
conservation goals. Greater attention to behaviour management and site design could help
accommodate large numbers of visitors at individual sites. For example, systematic site
analysis for the purpose of placing flotation devises or platforms for snorkellers and well
designed interpretive trails, for use by diver and snorkellers, could assist in making sites more
durable. Some pontoon operations have already embarked on such exercises.
Managers and operators should also be conscious of the fact that accessing the reef under
different “social” conditions is of consequence to some visitors. Diversity currently exists in
the day use visitation system on the GBR and appears to be appreciated by those using it.
Such diversity should be maintained for the purpose of offering different experiences to suit
different tastes and research is needed on the best ways to achieve this.
6.4.1 Opportunity Classes on Coral Reefs While more information is needed, there is potential for extending the findings of this study to
the designation of tourist zones or opportunity classes on the GBR. The development of zones
that designate levels of use, types of use, level of development, and method of access can
provide for a range of opportunities to suit different experiences sought by visitors while
helping to protect biophysical resources within the GBR. This is the first step toward
expanding on the simple carrying capacity concept.
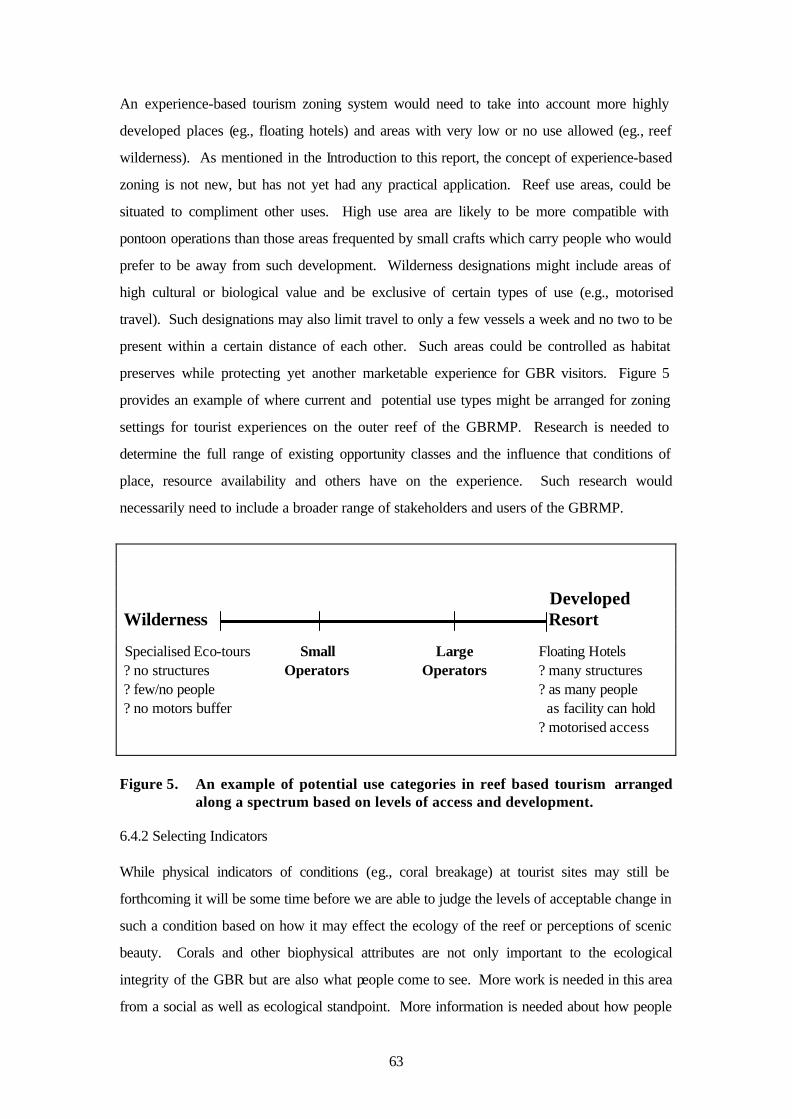
63
An experience-based tourism zoning system would need to take into account more highly
developed places (eg., floating hotels) and areas with very low or no use allowed (eg., reef
wilderness). As mentioned in the Introduction to this report, the concept of experience-based
zoning is not new, but has not yet had any practical application. Reef use areas, could be
situated to compliment other uses. High use area are likely to be more compatible with
pontoon operations than those areas frequented by small crafts which carry people who would
prefer to be away from such development. Wilderness designations might include areas of
high cultural or biological value and be exclusive of certain types of use (e.g., motorised
travel). Such designations may also limit travel to only a few vessels a week and no two to be
present within a certain distance of each other. Such areas could be controlled as habitat
preserves while protecting yet another marketable experience for GBR visitors. Figure 5
provides an example of where current and potential use types might be arranged for zoning
settings for tourist experiences on the outer reef of the GBRMP. Research is needed to
determine the full range of existing opportunity classes and the influence that conditions of
place, resource availability and others have on the experience. Such research would
necessarily need to include a broader range of stakeholders and users of the GBRMP.
Developed Wilderness Resort
Specialised Eco-tours Small Large Floating Hotels ? no structures Operators Operators ? many structures ? few/no people ? as many people ? no motors buffer as facility can hold ? motorised access Figure 5. An example of potential use categories in reef based tourism arranged
along a spectrum based on levels of access and development. 6.4.2 Selecting Indicators While physical indicators of conditions (eg., coral breakage) at tourist sites may still be
forthcoming it will be some time before we are able to judge the levels of acceptable change in
such a condition based on how it may effect the ecology of the reef or perceptions of scenic
beauty. Corals and other biophysical attributes are not only important to the ecological
integrity of the GBR but are also what people come to see. More work is needed in this area
from a social as well as ecological standpoint. More information is needed about how people
64
perceive corals and other components of these reef environments. We need to continue to
work toward understanding how visitor use causes changes in assemblages of corals and/or
fish given the prominence that these attributes hold in the minds of managers and users.
The most promising indicator condition which came out of this study was the number of other
people on a trip. This condition indicator has the potential to be quantified in a number of ways
based on needs for acceptability to reef visitors in different settings. In situations where the
number of people is determined to significantly impact experiences it may be feasible for
managers to negotiate passenger limits at a level which is acceptable. On the larger
operations studied here, there were some negative influences when vessels were running
closer to capacity however, most passengers indicated a “neutral” to “somewhat positive”
influence for this condition. Findings related to this “number of other people” indicator suggest
that more thought should be directed toward understanding the effect that zones, for different
sizes of vessels and concentrations of people, could have in helping to maintain acceptable
experiences and resources. If zones were established to accommodate certain use levels then
larger vessels could be prohibited from lower use zones where smaller numbers of people
appear to have a positive influence on enjoyment. This condition needs more clarification
through direct questions of visitors on how many people they feel are acceptable on their trip.
Questions regarding acceptable numbers within activities such as snorkelling and diving need
to be asked in order to quantify numbers at which experiences may be negatively impacted.
Operators could use such activity-based information to develop and manage a range of
snorkelling areas at one site to suit different tastes. Additional “people” conditions that need to
be more carefully investigated include the acceptability of other vessels (commercial operators
or private recreational) in the area and how their sizes, types and distances between (spacing)
influences the visitor experience.
7. CONCLUSION
The Great Barrier Reef Marine Park is a natural resource of regional, national and global
importance. Its designations as a Marine Park and World Heritage Area indicate that special
feelings are held about it by the national and international community. Demand for increasing
visitation to the area is occurring because of the natural values for which it has been
recognised. Park planners and managers, tourist operators and the Australian public face the
task of determining what type of park it will become in the next 20, or even 100, years of its
65
existence. Part of this involves determining how visitors will experience the reefs and islands.
The tourism industry has called for the development of additional destinations and
diversification of opportunities to serve “a more specialised nature tourism market, such as
ecotourism, scientific/research tours, remote location holidays.” (Office of the Co-ordinator
General, 1994, p. 26). Planners and managers are concerned with increasing use, conflicts
between uses and potential damage to the biophysical resource. The designation of zones to
provide and protect different experiences (specialised markets) can also act to protect special
biophysical settings.
Decisions about how to use and manage the GBRMP for tourism can be classified as
“wicked” problems (Allen & Gould 1986). As Stankey (1991) pointed out, “wicked problems
have no ‘correct’ solution, only answers that are more or less useful.” (p.12) Developing
tourism on the GBR in a sustainable manner will require that a full spectrum of use be taken
into account. Decisions which limit uses in some areas and favour use in others often fall
under the “wicked” heading, but greater input from all stakeholders should help point the way
to solutions that are more, rather than less, useful.
8. ACKNOWLEDGMENTS
We would like to thank all of the operators involved in the study. The support from staff at all
levels in each company was overwhelming. In particular, our thanks go to the crew on all the
operations who kept us all in good spirits even through the roughest weather. Thanks also to
Sharon Carr for help with the final editing. This research was supported by the CRC Reef
Research Centre.
66
9. REFERENCES
Alder, J. (1996) Costs and effectiveness of education and enforcement, Cairns Section and the
Great Barrier Reef Marine Park. Environmental Management, 4, 541-551.
Allen, G.M. & Gould, E.M. Jr. (1986) Complexity, wilderness, and public forests. Journal of
Forestry, 84 (4), 20-23.
Brown, P.J., & Hass, G.E. (1980) Wilderness recreation experiences: The Rawah case.
Journal of Leisure Research, 12, 229-241.
Bureau of Tourism Research (BTR) (1992) Australian tourism trends, BTR, Canberra.
Butler, R.W. (1980) The concept of a tourist area cycle of evolution: implications for
management of resources. Canadian Geographer, 24, 5-12.
Carey, J. (1993) Review of management of impacts of commercial tourism and private
recreation in the Great Barrier Reef Marine Park. Unpublished report to the Great
Barrier Reef Marine Park Authority, August 1993.
Chilman, K., Foster, D. & Everson, A. (1990) Updating the recreation carrying capacity
process: Recent refinements. In: Managing Americas Enduring Wilderness Resource.
St Paul: University of Minnesota, 234-238.
Clark, J.R. (1991) Carrying capacity and tourism in coastal and marine areas. Parks, 2(3), 13-
17.
Clark, R.N. & Stankey, G.H. (1979) The recreation opportunity spectrum: A framework
for planning, management and research. USDA Forest Service Res. Paper PNW-98.
Coccossis, H. & Parpairis, A. (1992) Tourism and the environment - some observations on the
concept of carrying capacity. In: Briassoulis, H; Dordrecht, K. & van der Straaten, J.
(Eds). Tourism and the Environment, 9 (1), 3-6.
Cole, D.N. & Landers, P.B. (1996) Threats to wilderness ecosystems: Impacts and research
needs. Ecological Applications, 6 (1), 168-184.
Craik, W. (1992) The Great Barrier Reef Marine Park: Its establishment, development and
current status. Marine Pollution Bulletin, 25,5-8, 122-133.
Craik, W. (1993) The Great Barrier Reef Marine Park as a model of ecologically sustainable
development. Paper given at the EIA 1993 National Conference.
Davis, D. & Tisdell, C.(1995) Recreational scuba-diving and carrying capacity in marine
protected areas. Ocean & Coastal Management, 1, 19-40.
Dinesen, Z. & Oliver, J.(1997) Tourism Impacts. In: Wachenfeld, D., Oliver, J. & Davis, K.
(Eds.), Proceedings of the State of the GBR World Heritage Area Workshop,
GBRMPA Workshop Series 23, GBRMPA, Townsville, pp. 414-427.
67
Done, T.J. (1995) Ecological criteria for evaluating coral reefs for managers and researchers.
Coral Reefs, 14, 183-192.
Driml, S. (1994) Protection for profit: Economic and financial values of the Great
Barrier Reef World Heritage Area and other protected areas. Research Publication
No. 35, Great Barrier Reef Marine Park Authority, Townsville AU, 83 pages.
Driver, B.L. (1977) Item pool for scales designed to quantify the psychological outcomes
desired and expected from recreation participation. Unpublished research paper,
Rocky Mountain Forest and Range Experiment Station, Ft. Collins, CO, 31 pages.
Driver, B.L. & Brown, P.J. (1978) The opportunity spectrum concept in outdoor recreation
supply inventories: A rationale. In: Proceedings of the Integrated Renewable
Resources Inventories Workshop (pp. 24-31) USDA Forest Service Gen. Tech. Rep.
RM-55.
Driver, B.L., Brown, P.J. & Peterson, G.L. (1991) Benefits of leisure. State College, PA:
Venture Publishing.
Driver, B. L., Brown, P.J., Stankey, G.H., & Gregoire, T.G. (1987) The ROS planning system:
Evolution, basic concepts and research needed. Leisure Sciences, 9, 201-212.
Dustin, D.L. & McAvoy, L.H. (1982) The decline and fall of quality recreation opportunities
and environments. Environmental Ethics, 4, 49-57.
Fairweather, P. G. (1989) Ecological changes due to our use of the coast: research needs
versus efforts. Proc. Ecol. Soc. Aust. 1990,16:71-77.
Fenton, D.M. & Johnson, V.Y. (submitted) Re-Presenting the Great Barrier Reef to tourists:
Implications for tourists experience and evaluation of coral reef environments. Leisure
Sciences.
Graefe, A.R., Kuss, F.R. & Vaske, J.J. (1990) Visitor Impact Management: The planning
framework. Washington, D.C.: National Parks and Conservation Association.
Graefe, A.R., Vaske, J.J. & Kuss, F.R. (1984) Social carrying capacity: an integration and
synthesis of twenty years of research. Leisure Sciences, 6, 395-431.
Hall, J.M. (1974). The capacity to absorb tourists. Built Environment, 3.
Hammitt, W.E. & McDonald, C.D. (1983) Past on-site experience and its relationship to
managing river recreation resources. Forest Science, 29, 262-266.
Hawkins, J.P. & Roberts, C.M. (1993) Can Egypt’s coral reefs support ambitious plans for
diving tourism? Proceedings of the Seventh International Coral Reef Symposium,
University of Guam.
68
Hawkins, J.P & Roberts, C.M. (in press) Estimating the carrying capacity of coral reefs for
SCUBA diving. Proceedings of the 8th International Coral Reef Symposium, Panama
City, Panama. June 24 - 29.
Herzog, T.R. (1987) A cognitive analysis of preference for natural environments: Mountains,
canyons and deserts. Landscape Journal, 6, 140-152.
Huf, S. & Douglas, A. (1995) Community attitudes toward wilderness-based recreation on
the Great Barrier Reef. Unpublished report to the Great Barrier Reef Marine Park
Authority. AGB McNair Pty. Ltd. August 1995, 71 pages.
Inglis, G.J. (1997) Science and tourism infrastructure on the Great Barrier Reef: learning from
experience or just ‘muddling through’? In Proceedings of the Great Barrier Reef
Science, Use and Management Conference, November 1996, Townsville. pp. 319-334.
Inskeep, E. (1987) Environmental planning for tourism. Annals of Tourism Research, 14, 118-
135.
Kaplan, R. & Kaplan, S. (1989) The Experience of Nature: A Psychological Perspective.
Cambridge University Press: Cambridge.
Kenchington, R.A. (1990) Managing marine and environments. Taylor & Francis: New
York.
Kenchington, R.A. (1991) Tourism and marine environments: A recreational perspective. In:
Miller, M.L. & Aulyong, J. (Eds.) Congress on Coastal and Marine Tourism, 1990,
Honolulu, HI. Newport Oregon: National Coastal Resources Research and Development
Institute: 23-30.
Klatenborn, B.P. & Emmelin, L. (1993) Tourism in the high north: Management challenges
and recreation opportunity spectrum planning in Svalbard, Norway. Environmental
Management, 17, 41-50.
Kruss, F.R. (1996) A review of major factors influencing plant responses to recreation
impacts. Environmental Management, 5, 637-650.
Lucas, R.C. (1964) Recreational capacity of the Quentico-Superior area. USDA Forest
Service Res. Paper LS-15.
Lucas, R.C. (1985) Visitor characteristics, attitudes and use patterns in the Bob Marshall
Wilderness Complex, 1970 - 1982. USDA Forest Service Research Paper, INT-345.
Manfredo, M.J., Driver, B.L. & Brown, P.J. (1983) A test of concepts inherent in experience
based setting management for outdoor recreation areas. Journal of Leisure Research,
15, 263-283.
69
Manning, R., Johnson, D. & Vande Kamp, M. (1996) Norm congruence among tour boat
passengers to Glacier Bay National Park. Leisure Sciences, 18, 125-141.
Marion, J.L. & Cole, D.N. (1996) Spatial and Temporal variation in soil and vegetation
impacts on campsites. Ecological Applications, 6 (2), 520-530.
Marion, J.L. & Rogers, C.S. (1994) The applicability of terrestrial visitor impact management
strategies to the protection of coral reefs. Ocean and Coastal Management, 22, 153-
163.
Martin, B.S. & Uysal, M. (1990) An examination of the relationship between carrying
capacity and tourism lifecycle: Management and policy implications. Journal of
Environmental Management, 31, 327-333.
McPhail, I. (1995) Future directions for the GBRMP. Unpublished paper delivered at the
Socio Cultural and Economic Program Seminar Series, May 1995, 8 pages.
Medio, D., Ormond, R.F.G. & Pearson, M. (1996) Effect of briefings on rates of damage to
corals by scuba divers. Biological Conservation,79, 91-95.
Merigliano, L.L. (1990) Indicators to monitor wilderness conditions. In D.W. Lime (Ed.),
Managing America’s Enduring Wilderness Resource (pp. 205-209). St Paul:
University of Minnesota.
Nelson, V. & Mapstone, B. (1998) A review of environmental impact monitoring of pontoon
installations in the Great Barrier Reef Marine Park. CRC Reef Research Centre
Technical Report No. 13, CRC Reef Research Centre, Townsville, 85 pp.
Odum, E.P. (1959) Fundamentals of Ecology, Philadelphia: W.B. Saunders Co. 546 pages.
Office of Coordinator General. (1994) Cairns Regional Tourism Strategy. Far North
Queensland Promotion Bureau, 93 pages.
Oliver, J. (1995) Is the “Limits of Acceptable Change” concept useful for environmental
managers? A case study from the Great Barrier Reef Marine Park. In: Grigg, G.C., Hale,
P.T. & Lunney, D. (Eds.). Conservation Through Sustainable Use of Wildlife, Centre
for Conservation Biology, University of Queensland: Brisbane AU: 131-139.
Pearce, D.G. & Kirk, R.M. (1986) Carrying capacities for coastal tourism. Industry and
Environment, 9 (1), 3-6.
Pearce, P.L., Moscardo, G., & Woods, B. (1997) Understanding the tourist market. In
Proceedings of the Great Barrier Reef Science, Use and Management Conference,
November 1996, Townsville. pp. 343-352.
70
Randall, J.E., Allen, G.R., & Steene, R.C. (1990) The complete divers’ and fisherman’s
guide to fishes of the Great Barrier Reef and Coral Sea. Bathurst, NSW: Crawford
House Press.
Roggenbuck, J.W., Williams, D.R. & Watson, A.E. (1993) Defining acceptable conditions in
wilderness. Environmental Management, 17, 87-197.
Romesburg, C.H. (1979) Use of cluster analysis in leisure research. Journal of Leisure
Research, 11, 144-153.
Rouphael, A. & Inglis, G. (1995) The effects of qualified recreational SCUBA divers on coral
reefs. CRC Reef Research Centre Technical Report No. 4, CRC Reef Research Centre,
Townsville, 39 pp.
Rouphael, A.B. & Inglis, G.J. (1997) Impacts of recreational SCUBA diving at sites with
different reef topographies. Biological Conservation., 82, pp. 329-336.
Salm, R.V. (1986). Coral reefs and tourist carrying capacity: The Indian Ocean experience.
Industry and Environment, 9 (1), 11-13.
Scherl, L.M., Valentine, P.S., & Millard, M. (1993) Great Barrier Reef visitor experiences:
Lady Musgrave Island and Reef. Unpublished report to the Great Barrier Reef Marine
Park Authority, Townsville.
Schreyer, R., Lime, D.W. & Williams, D.R. (1984) Characterizing the influence of past
experience on recreation behaviour. Journal of Leisure Research, 16, 34-50.
Schreyer, R. & Roggenbuck, J.W. (1978) The influence of experience expectations on
crowding perceptions and social-psychological carrying capacities. Leisure Sciences, 1,
373-394.
Scura, L.F. & vant Huf, T. (1993) The ecology and economics of Bonaire Marine Park.
Divisional Paper No. 1993-44, The World Bank Environment Department, Land,
Water and Natural Habitats Division, 48 pages.
Shafer, C.S. & Hammitt, W.E. (1995) Congruency among experience dimensions, condition
indicators, and coping behaviours in wilderness. Leisure Sciences, 17, 263-279.
Shafer, E. (1969) The average camper who doesn’t exist. USDA Forest Service Res. Paper
NE-142.
Shelby, B. (1980) Crowding models for backcountry recreation. Land Economics, 56, 43-55.
Shelby, B., Bregenzer, N., & Johnson, R. (1988) Displacement and product shift: empirical
evidence from two Oregon rivers. Journal of Leisure Research, 20, 274-288.
Shelby, B., & Heberlein, T.A. (1984) A conceptual framework for carrying capacity
determination. Leisure Sciences, 6, 433-451.
71
Shelby, B. & Heberlein, T.A (1986) Carrying capacity in recreation settings. Corvallis:
Oregon State University Press.
Shindler, B. & Shelby, B. (1995) Product shift in recreation settings: Findings and implications
from panel research. Leisure Sciences, 17, 91-107.
Shrader-Frechette, K.S. & McCoy, E.D. (1993) Method in ecology: strategies for
conservation. Cambridge University Press, Cambridge, England. 329pp.
Stankey, G.H. (1973) Visitor perception of wilderness recreation carrying capacity .
USDA Forest Service Res. Paper INT-142.
Stankey, G.H., Cole, D.N., Lucas R.C., Petersen, M.E. & Frissell, S.S. (1995) The limits of
acceptable change (LAC) system for wilderness planning. USADA Forest Service
Res Paper INT-176.
Stankey, G.H. (1991) Conservation, recreation and tourism in marine settings: The good, the
bad and the ugly? In: Miller, M.L. & Aulyong, J. (Eds.) Congress on Coastal and
Marine Tourism, 1990, Honolulu, HI. Newport Oregon: National Coastal Resources
Research and Development Institute: 12-17.
Stankey, G.H. & McCool, S.F. (1984) Carrying capacity in recreational settings: Evolution,
appraisal and application. Leisure Sciences, 6, 453-473.
Sweatman, H.P. (1996) Impact of tourist pontoons on fish assemblages on the Great Barrier
Reef. CRC Reef Research Centre Technical Report No. 5, CRC Reef Research Centre,
Townsville, 54 pp.
Vaske, J.J., Donnelly, M.P., and Heberlein, T.A. (1980) Perceptions of crowding between
early and more recent visitors. Leisure Sciences, 3, 311-323.
Vaske, J.J., Graefe, A. R., Shelby, B. & Heberlein, T. (1986) Backcountry encounter norms:
Theory, method and empirical evidence. Journal of Leisure Research, 18 (3), 137-153.
Virden, R.J. & Knopf, R.C. (1989) Activities, experiences, and environmental settings: A case
study of recreation opportunity spectrum relationships. Leisure Sciences, 11, 159-176.
Virden, R.J. & Schreyer, R. (1988) Recreation specialization as an indicator of environmental
preference. Environment and Behaviour, 20, 721-739.
Wagar, J.A. (1964) The carrying capacity of wild lands for recreation. Forest Service
Monograph 7, Society of American Foresters, Washington, D.C.
Watson, A.E. & Cole, D.N. (1993) LAC indicators: An evaluation of progress and list of
proposed indicators. In LAC Ideas Book . Washington D.C.: U.S. Department of
Agriculture, Forest Service.
72
Wall, G. (1982) Cycles and capacity: Incipient theory or conceptual contradiction? Tourism
Management, September, 188-193.
Whittaker, D. (1992) Selecting indicators: Which impacts matter more? In: Proceedings,
Defining Wilderness Quality: The Role of Standards in Wilderness Management.
U.S. Forest Service, General Technical Report PNW-6TR-305.
Williams A. (1996) Managing tourism use in Australia’s Great Barrier Reef Marine park. In:
Proceedings of Planning Sustainable Tourism Seminar 1996, Bandung, Indonesia.
Williams, D.R. & Patterson, M.E. (1996) Environmental meaning and ecosystem
management: perspectives from environmental psychology and human geography.
Society & Natural Resources, 9, 507-521.
Yvan, M.S. & McEwen, D. (1989) Test for camper’s experience preference differences
among three ROS setting classes. Leisure Sciences, 11, 177-185.
73
10. APPENDICES
Appendix 1. Questionnaire
Environment and Experience on the Great Barrier Reef
A Study Conducted by:
The Cooperative Research Centre for the Great Barrier Reef
The Association of Marine Park Tourism Operators
The Great Barrier Reef Marine Park Authority
The Australian Institute of Marine Science
The Department of Primary Industries
James Cook University
74
The Cooperative Research Centre for the Great Barrier Reef has been established to assist in the ecologically sustainable development of the Great Barrier Reef World Heritage Area. As a part of managing for quality in the environment and in visitor experiences, the Cooperative Research Centre is collecting information from visitors like you. The purpose of the study is to gain a better understanding of how different aspects of the Great Barrier Reef environment influence visitors. By providing information about your experience today you will help to ensure proper management of this unique natural resource. Your participation in this study is voluntary. However, only a select number of reef visitors will be asked to complete a survey so your help is very important. This questionnaire will take about 10 to 15 minutes to complete. All answers you give are confidential. If you have any questions about this study please contact us at the Cooperative Research Centre: Dr Scott Shafer Dr Graeme Inglis Environment and Experience Study CRC Reef Research Centre James Cook University Townsville, QLD 4811 Tel: (077) 81 4976 Fax: (077) 81 4099 Email: [email protected]
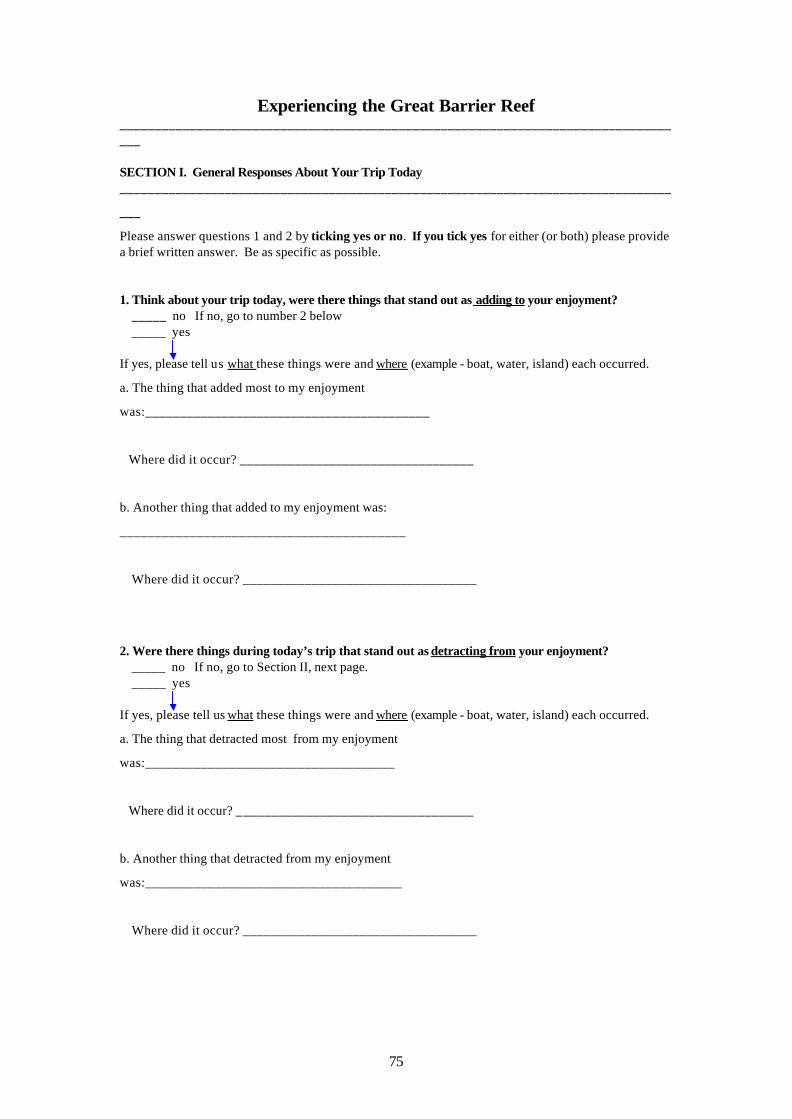
75
Experiencing the Great Barrier Reef __________________________________________________________________________________ SECTION I. General Responses About Your Trip Today _______________________________________________________________________________
___
Please answer questions 1 and 2 by ticking yes or no. If you tick yes for either (or both) please provide a brief written answer. Be as specific as possible. 1. Think about your trip today, were there things that stand out as adding to your enjoyment? _____ no If no, go to number 2 below _____ yes If yes, please tell us what these things were and where (example - boat, water, island) each occurred.
a. The thing that added most to my enjoyment
was:_________________________________________
Where did it occur? __________________________________
b. Another thing that added to my enjoyment was:
_________________________________________
Where did it occur? __________________________________
2. Were there things during today’s trip that stand out as detracting from your enjoyment? _____ no If no, go to Section II, next page. _____ yes If yes, please tell us what these things were and where (example - boat, water, island) each occurred.
a. The thing that detracted most from my enjoyment
was:____________________________________
Where did it occur? __________________________________
b. Another thing that detracted from my enjoyment
was:_____________________________________
Where did it occur? __________________________________

76
Please answer all questions on the pages that follow even though some may appear similar to what you have told us in Section I above. Your participation is appreciated.
77
__________________________________________________________________________________ SECTION II. Visiting the Great Barrier Reef _______________________________________________________________________________
___
Please tick the space that best represents your answer. 1. Had you visited the Great Barrier Reef Marine Park before today? ____ no If no, go to question 2 below ____ yes 1a. About how many times have you been to a reef in the Marine Park before today? _____ times before
1b. When was your last trip to a reef in the Marine Park?
____ in the last 7 days ____ between 8 days and 1 month ago ____ between 1 month and 1 year ago ____ between 1 year and 5 years ago ____ more than 5 years ago
1c. What area was your last trip to a reef in the Marine Park taken from? (tick one)
____ Cairns ____ Port Douglas ____ Mission Beach ____ Townsville ____ Airlie Beach/Whitsundays ____ Mackay ____ Gladstone ____ other -specify _______________
2. Have you ever visited coral reefs other than those of the Great Barrier Reef Marine Park?
____ no ____ yes If yes, about how many others ______
2a. How do you feel other coral reefs you have visited compare to what you have seen here? (tick one)
____ Today’s reef was better than others I have seen ____ Today’s reef was about the same as others I have seen ____ Today’s reef was not as good as other’s I have seen __________________________________________________________________________________ Section III. Importance of the Great Barrier Reef to People __________________________________________________________________________________ Places on the Great Barrier Reef may be important for many reasons. Thinking about your main destination (reef, island, etc.) today, how important are each of the following to the value of that place? Please tick a space for each item. For example..........................( ) ( ) (?) ( ) ( ) The destination today is valuable for: scientific research. ............................................................... ( ) ...... ( ) ...... ( ) ...... ( ) ...... ( )
78
recreational opportunities. .................................................... ( ) ...... ( ) ...... ( ) ...... ( ) ...... ( )
cultural heritage. ................................................................ ( ) ...... ( ) ...... ( ) ...... ( ) ...... ( )
Section III continued
_______________________________________________________________________________
___
The destination today is valuable for:
natural/ecological processes. ................................................. ( ) ...... ( ) ...... ( ) ...... ( ) ...... ( )
spiritual values. ................................................................. ( ) ...... ( ) ...... ( ) ...... ( ) ...... ( )
economic opportunities. ........................................................ ( ) ...... ( ) ...... ( ) ...... ( ) ...... ( )
historical meaning. .............................................................. ( ) ...... ( ) ...... ( ) ...... ( ) ...... ( )
educational opportunities. ..................................................... ( ) ...... ( ) ...... ( ) ...... ( ) ...... ( )
conservation opportunities. .................................................... ( ) ...... ( ) ...... ( ) ...... ( ) ...... ( )
_______________________________________________________________
Some things that visitors might get from today’s trip are listed below. Please indicate how much the trip provided each of these for you by ticking a space. This trip allowed me to: be close to friends or family. ................................................ ( ) ...... ( ) ...... ( ) ...... ( ) ...... ( )
get some exercise. ................................................................ ( ) ...... ( ) ...... ( ) ...... ( ) ...... ( )
experience the beauty of nature. ........................................... ( ) ...... ( ) ...... ( ) ...... ( ) ...... ( )
meet new people. ................................................................. ( ) ...... ( ) ...... ( ) ...... ( ) ...... ( )
have some excitement. ......................................................... ( ) ...... ( ) ...... ( ) ...... ( ) ...... ( )
experience an undeveloped environment. ............................. ( ) ...... ( ) ...... ( ) ...... ( ) ...... ( )
rest and relax. ....................................................................... ( ) ...... ( ) ...... ( ) ...... ( ) ...... ( )
learn more about nature. ....................................................... ( ) ...... ( ) ...... ( ) ...... ( ) ...... ( )
experience some solitude. ..................................................... ( ) ...... ( ) ...... ( ) ...... ( ) ...... ( )
be with others who enjoy things that I enjoy. ........................ ( ) ...... ( ) ...... ( ) ...... ( ) ...... ( )
develop skills. ...................................................................... ( ) ...... ( ) ...... ( ) ...... ( ) ...... ( )
escape the normal routine. .................................................... ( ) ...... ( ) ...... ( ) ...... ( ) ...... ( )
be in a natural place. ............................................................ ( ) ...... ( ) ...... ( ) ...... ( ) ...... ( )
experience something new and different. .............................. ( ) ...... ( ) ...... ( ) ...... ( ) ...... ( )
learn about a coral reef. ........................................................ ( ) ...... ( ) ...... ( ) ...... ( ) ...... ( )
be physically active. .............................................................. ( ) ...... ( ) ...... ( ) ...... ( ) ...... ( ) __________________________________________________________________________________
79
__________________________________________________________________________________ SECTION IV. Evaluating of Some Conditions During Your Visit _______________________________________________________________________________
___
Items listed below may have influenced your enjoyment today in a positive or negative way. Please indicate how each of these items influenced your enjoyment by ticking a space from very negatively to very positively for each. I was influenced by the: types of fish I saw. .................................................. ( ) ..... ( ) ..... ( ) ..... ( ) ..... ( ) ..... ( ) ..... ( )
clarity (visibility) of the ocean water. ...................... ( ) ..... ( ) ..... ( ) ..... ( ) ..... ( ) ..... ( ) ..... ( )
number of people snorkelling. ................................. ( ) ..... ( ) ..... ( ) ..... ( ) ..... ( ) ..... ( ) ..... ( )
size of the coral I saw. ............................................ ( ) ..... ( ) ..... ( ) ..... ( ) ..... ( ) ..... ( ) ..... ( )
information provided by the staff. ........................... ( ) ..... ( ) ..... ( ) ..... ( ) ..... ( ) ..... ( ) ..... ( )
number of people on the pontoon. ........................... ( ) ..... ( ) ..... ( ) ..... ( ) ..... ( ) ..... ( ) ..... ( )
total number of fis h I saw. ...................................... ( ) ..... ( ) ..... ( ) ..... ( ) ..... ( ) ..... ( ) ..... ( )
colour of the corals I saw. ....................................... ( ) ..... ( ) ..... ( ) ..... ( ) ..... ( ) ..... ( ) ..... ( )
sea conditions during the trip from/to shore. ........... ( ) ..... ( ) ..... ( ) ..... ( ) ..... ( ) ..... ( ) ..... ( )
behaviour of the fish. .............................................. ( ) ..... ( ) ..... ( ) ..... ( ) ..... ( ) ..... ( ) ..... ( )
number of human-made objects in the water. .......... ( ) ..... ( ) ..... ( ) ..... ( ) ..... ( ) ..... ( ) ..... ( )
total amount of coral I saw. ..................................... ( ) ..... ( ) ..... ( ) ..... ( ) ..... ( ) ..... ( ) ..... ( )
temperature of the water. ........................................ ( ) ..... ( ) ..... ( ) ..... ( ) ..... ( ) ..... ( ) ..... ( )
appearance of the staff. ........................................... ( ) ..... ( ) ..... ( ) ..... ( ) ..... ( ) ..... ( ) ..... ( )
size of the fish I saw. ............................................. ( ) ..... ( ) ..... ( ) ..... ( ) ..... ( ) ..... ( ) ..... ( )
currents in the water around the reef. ...................... ( ) ..... ( ) ..... ( ) ..... ( ) ..... ( ) ..... ( ) ..... ( )
number of people on the main boat. ........................ ( ) ..... ( ) ..... ( ) ..... ( ) ..... ( ) ..... ( ) ..... ( )
colour of the fish I saw. .......................................... ( ) ..... ( ) ..... ( ) ..... ( ) ..... ( ) ..... ( ) ..... ( )
temperature of the air. ............................................ ( ) ..... ( ) ..... ( ) ..... ( ) ..... ( ) ..... ( ) ..... ( )
number of animals other than coral or fish (clams, sea stars) that I saw . ................................ ( ) ..... ( ) ..... ( ) ..... ( ) ..... ( ) ..... ( ) ..... ( )
depth of the water. .................................................. ( ) ..... ( ) ..... ( ) ..... ( ) ..... ( ) ..... ( ) ..... ( )
helpfulness of the staff. ........................................... ( ) ..... ( ) ..... ( ) ..... ( ) ..... ( ) ..... ( ) ..... ( )
amount of wind.. .................................................... ( ) ..... ( ) ..... ( ) ..... ( ) ..... ( ) ..... ( ) ..... ( )
number of different kinds of coral I saw. ................. ( ) ..... ( ) ..... ( ) ..... ( ) ..... ( ) ..... ( ) ..... ( )
__________________________________________________________________________________
80
Section IV continued __________________________________________________________________________________ Now , please rate some conditions that may have influenced your experience today. Rate each item as indicated by ticking one of the spaces provided. I feel: the total amount of coral I saw was ................................... ( ) ...... ( ) ...... ( ) ( )
the total amount of fish I saw was ..................................... ( ) ...... ( ) ...... ( ) ( )
the total amount of animals other than
coral and fish (clams, sea stars, etc.) I saw was................. ( ) ...... ( ) ...... ( ) ( )
the visibility in the water was............................................. ( ) ...... ( ) ...... ( ) ( )
the depth of the water was.................................................. ( ) ...... ( ) ...... ( ) ( )
the number of different kinds of coral I saw was................. ( ) ...... ( ) ...... ( ) ( )
the number of different kinds of fish I saw was................... ( ) ...... ( ) ...... ( ) ( )
the number of people on this trip was................................. ( ) ...... ( ) ...... ( ) ( )
overall, the coral I saw was............................... ( ) ...... ( ) ...... ( ) ...... ( ) ...... ( ) ( )
overall, the fish I saw were................................ ( ) ...... ( ) ...... ( ) ...... ( ) ...... ( ) ( )
How would you rate your trip today? (Please circle a number that best represents your feeling.) 1 -------- 2 -------- 3 -------- 4 -------- 5 -------- 6 --------- 7 -------- 8 -------- 9 -------- 10 poor fair good very good excellent ______________________________________________________________________________ SECTION V. What You Did Today ______________________________________________________________________________
Please indicate which activities you were involved in today. (tick the appropriate spaces)
1. Did you go into an underwater observatory on a pontoon today?
_____ no _____ yes, If yes, how many? _____ time(s) today
2. Did you take a semi-sub/glass bottom boat trip?
____ no ____ yes If yes, how many? _____ trip(s) today
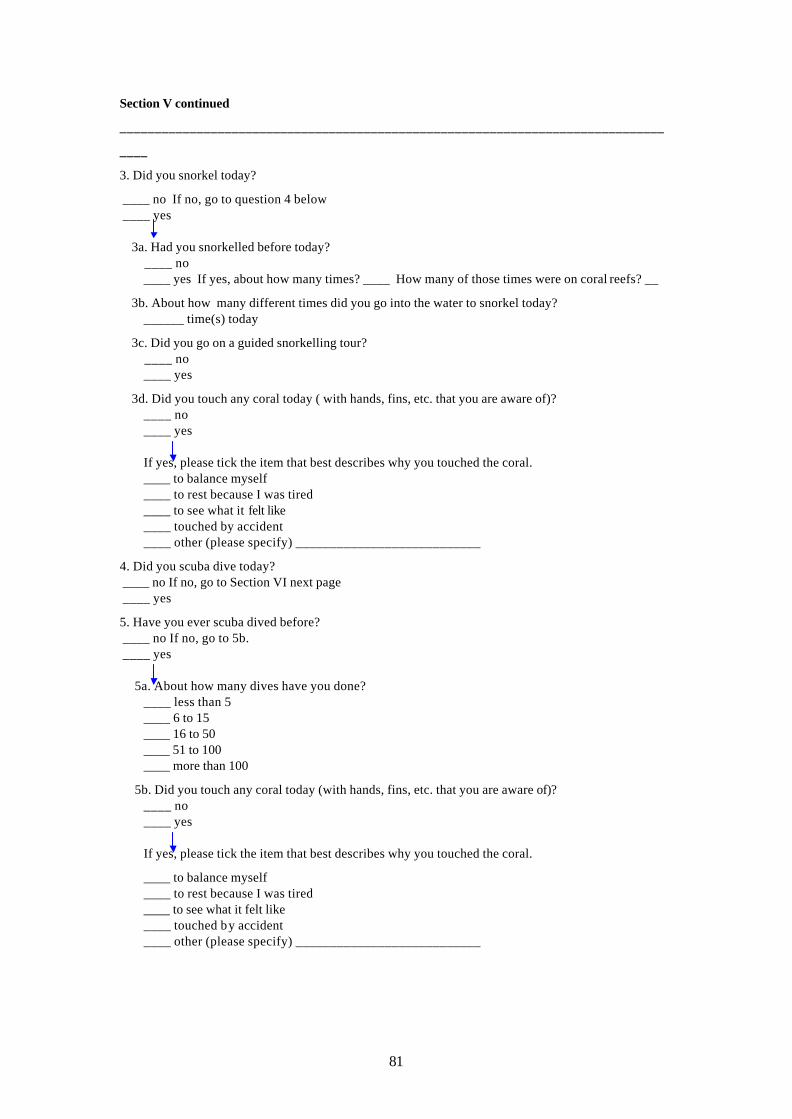
81
Section V continued
______________________________________________________________________________
____
3. Did you snorkel today?
____ no If no, go to question 4 below ____ yes 3a. Had you snorkelled before today? ____ no ____ yes If yes, about how many times? ____ How many of those times were on coral reefs? __
3b. About how many different times did you go into the water to snorkel today? ______ time(s) today
3c. Did you go on a guided snorkelling tour? ____ no ____ yes
3d. Did you touch any coral today ( with hands, fins, etc. that you are aware of)? ____ no ____ yes If yes, please tick the item that best describes why you touched the coral. ____ to balance myself ____ to rest because I was tired ____ to see what it felt like ____ touched by accident ____ other (please specify) ___________________________
4. Did you scuba dive today? ____ no If no, go to Section VI next page ____ yes
5. Have you ever scuba dived before? ____ no If no, go to 5b. ____ yes 5a. About how many dives have you done? ____ less than 5 ____ 6 to 15 ____ 16 to 50 ____ 51 to 100 ____ more than 100
5b. Did you touch any coral today (with hands, fins, etc. that you are aware of)? ____ no ____ yes If yes, please tick the item that best describes why you touched the coral.
____ to balance myself ____ to rest because I was tired ____ to see what it felt like ____ touched by accident ____ other (please specify) ___________________________
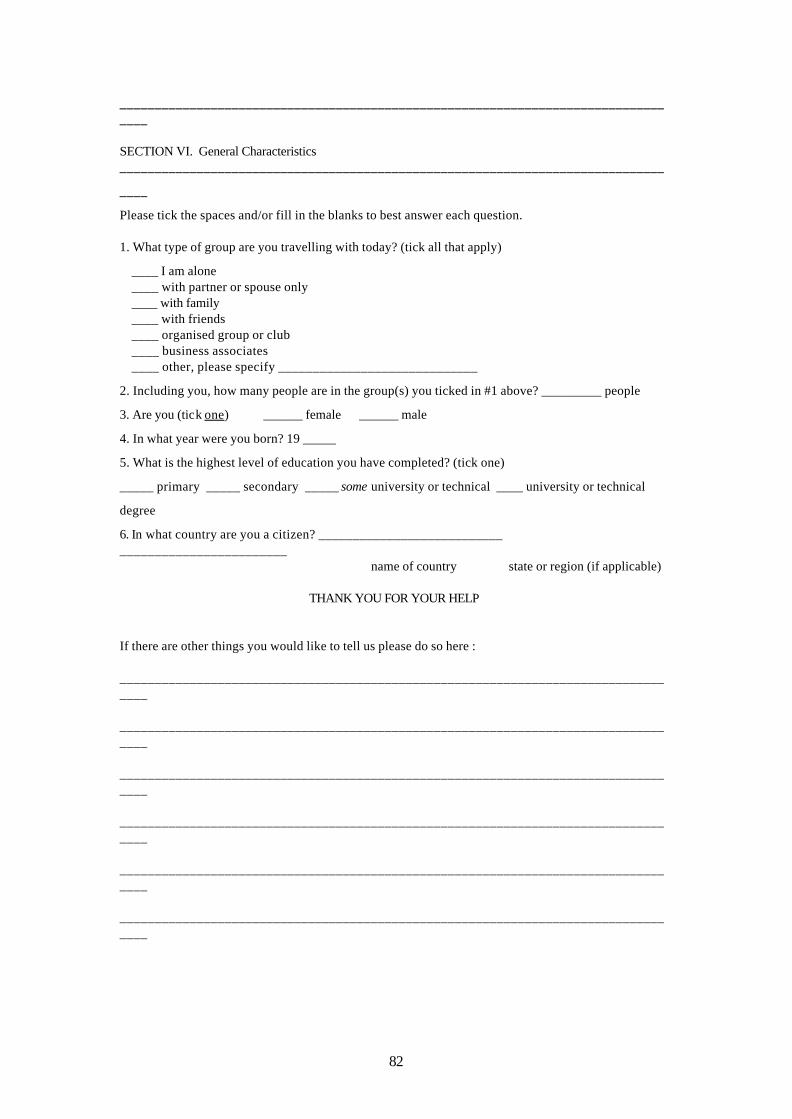
82
__________________________________________________________________________________ SECTION VI. General Characteristics ______________________________________________________________________________
____
Please tick the spaces and/or fill in the blanks to best answer each question. 1. What type of group are you travelling with today? (tick all that apply)
____ I am alone ____ with partner or spouse only ____ with family ____ with friends ____ organised group or club ____ business associates ____ other, please specify _____________________________
2. Including you, how many people are in the group(s) you ticked in #1 above? _________ people
3. Are you (tick one) ______ female ______ male
4. In what year were you born? 19 _____
5. What is the highest level of education you have completed? (tick one)
_____ primary _____ secondary _____ some university or technical ____ university or technical
degree
6. In what country are you a citizen? ___________________________ ________________________ name of country state or region (if applicable)
THANK YOU FOR YOUR HELP
If there are other things you would like to tell us please do so here : __________________________________________________________________________________ __________________________________________________________________________________ __________________________________________________________________________________ __________________________________________________________________________________ __________________________________________________________________________________ __________________________________________________________________________________
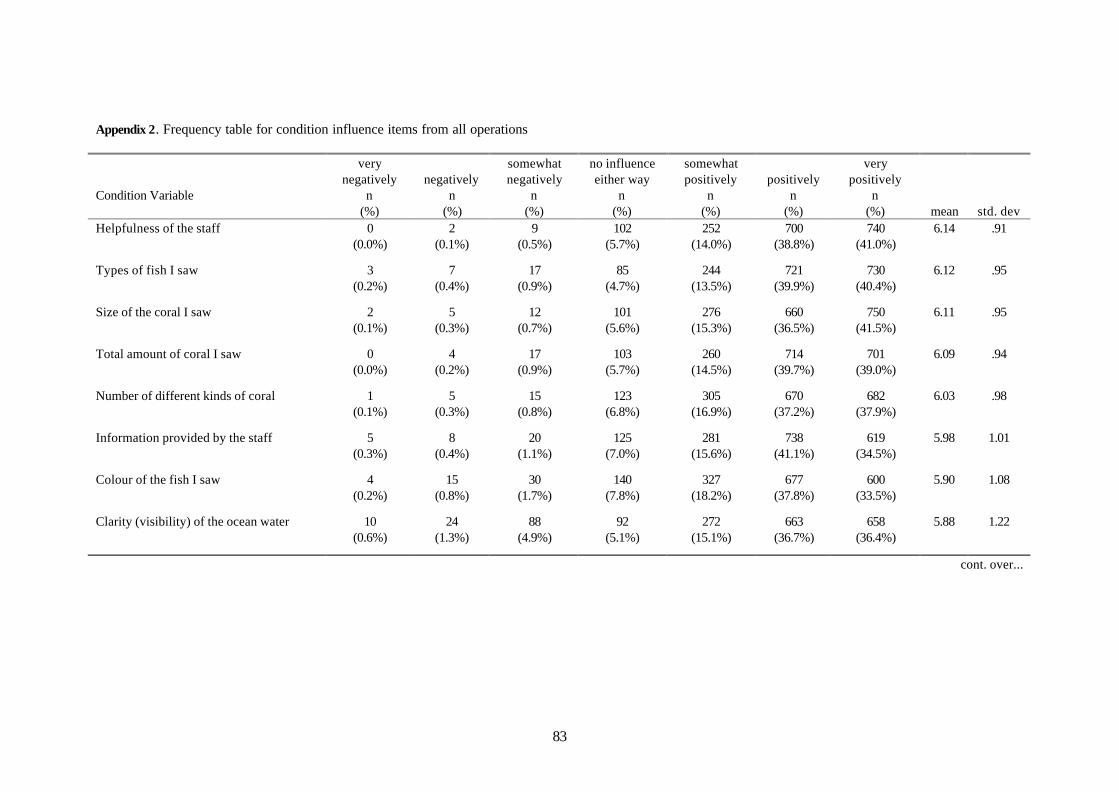
83
Appendix 2. Frequency table for condition influence items from all operations Condition Variable
very negatively
n (%)
negatively
n (%)
somewhat negatively
n (%)
no influence either way
n (%)
somewhat positively
n (%)
positively
n (%)
very positively
n (%)
mean
std. dev Helpfulness of the staff
0 (0.0%)
2 (0.1%)
9 (0.5%)
102 (5.7%)
252 (14.0%)
700 (38.8%)
740 (41.0%)
6.14 .91
Types of fish I saw
3 (0.2%)
7 (0.4%)
17 (0.9%)
85 (4.7%)
244 (13.5%)
721 (39.9%)
730 (40.4%)
6.12 .95
Size of the coral I saw
2 (0.1%)
5 (0.3%)
12 (0.7%)
101 (5.6%)
276 (15.3%)
660 (36.5%)
750 (41.5%)
6.11 .95
Total amount of coral I saw
0 (0.0%)
4 (0.2%)
17 (0.9%)
103 (5.7%)
260 (14.5%)
714 (39.7%)
701 (39.0%)
6.09 .94
Number of different kinds of coral
1 (0.1%)
5 (0.3%)
15 (0.8%)
123 (6.8%)
305 (16.9%)
670 (37.2%)
682 (37.9%)
6.03 .98
Information provided by the staff
5 (0.3%)
8 (0.4%)
20 (1.1%)
125 (7.0%)
281 (15.6%)
738 (41.1%)
619 (34.5%)
5.98 1.01
Colour of the fish I saw
4 (0.2%)
15 (0.8%)
30 (1.7%)
140 (7.8%)
327 (18.2%)
677 (37.8%)
600 (33.5%)
5.90 1.08
Clarity (visibility) of the ocean water
10 (0.6%)
24 (1.3%)
88 (4.9%)
92 (5.1%)
272 (15.1%)
663 (36.7%)
658 (36.4%)
5.88 1.22
cont. over...
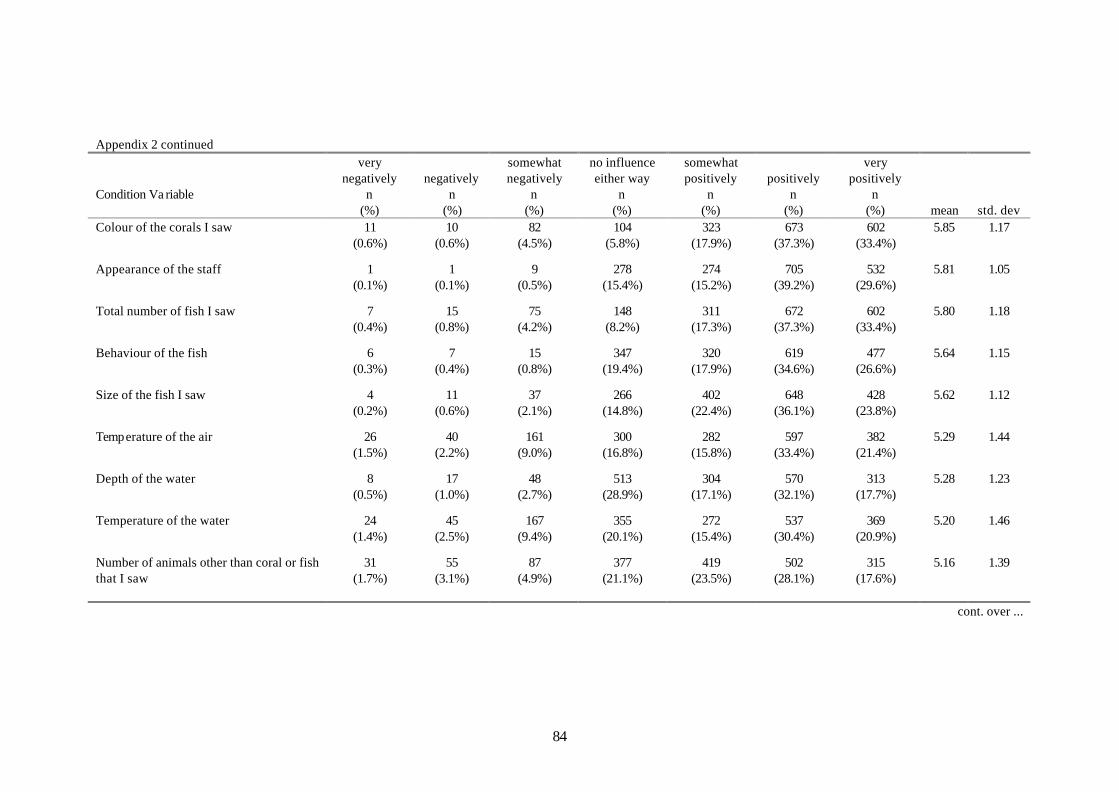
84
Appendix 2 continued Condition Va riable
very negatively
n (%)
negatively
n (%)
somewhat negatively
n (%)
no influence either way
n (%)
somewhat positively
n (%)
positively
n (%)
very positively
n (%)
mean
std. dev Colour of the corals I saw
11 (0.6%)
10 (0.6%)
82 (4.5%)
104 (5.8%)
323 (17.9%)
673 (37.3%)
602 (33.4%)
5.85 1.17
Appearance of the staff
1 (0.1%)
1 (0.1%)
9 (0.5%)
278 (15.4%)
274 (15.2%)
705 (39.2%)
532 (29.6%)
5.81 1.05
Total number of fish I saw
7 (0.4%)
15 (0.8%)
75 (4.2%)
148 (8.2%)
311 (17.3%)
672 (37.3%)
602 (33.4%)
5.80 1.18
Behaviour of the fish
6 (0.3%)
7 (0.4%)
15 (0.8%)
347 (19.4%)
320 (17.9%)
619 (34.6%)
477 (26.6%)
5.64 1.15
Size of the fish I saw
4 (0.2%)
11 (0.6%)
37 (2.1%)
266 (14.8%)
402 (22.4%)
648 (36.1%)
428 (23.8%)
5.62 1.12
Temperature of the air
26 (1.5%)
40 (2.2%)
161 (9.0%)
300 (16.8%)
282 (15.8%)
597 (33.4%)
382 (21.4%)
5.29 1.44
Depth of the water
8 (0.5%)
17 (1.0%)
48 (2.7%)
513 (28.9%)
304 (17.1%)
570 (32.1%)
313 (17.7%)
5.28 1.23
Temperature of the water
24 (1.4%)
45 (2.5%)
167 (9.4%)
355 (20.1%)
272 (15.4%)
537 (30.4%)
369 (20.9%)
5.20 1.46
Number of animals other than coral or fish that I saw
31 (1.7%)
55 (3.1%)
87 (4.9%)
377 (21.1%)
419 (23.5%)
502 (28.1%)
315 (17.6%)
5.16 1.39
cont. over ...
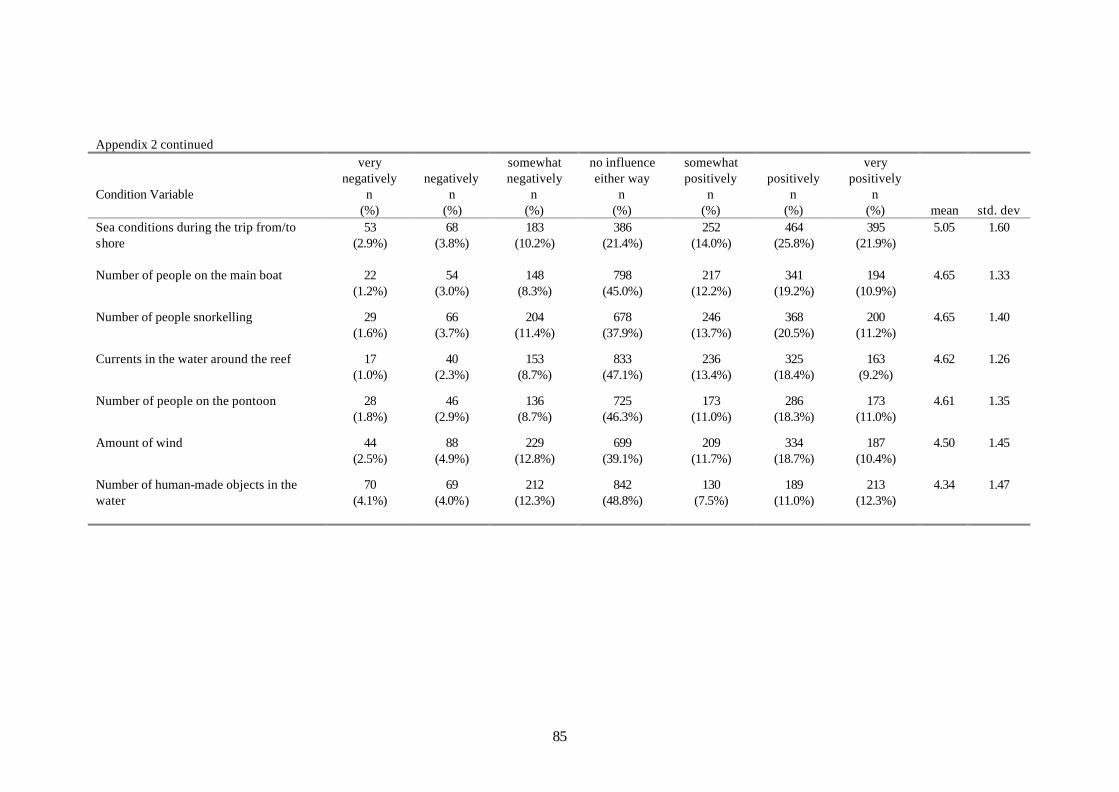
85
Appendix 2 continued Condition Variable
very negatively
n (%)
negatively
n (%)
somewhat negatively
n (%)
no influence either way
n (%)
somewhat positively
n (%)
positively
n (%)
very positively
n (%)
mean
std. dev Sea conditions during the trip from/to shore
53 (2.9%)
68 (3.8%)
183 (10.2%)
386 (21.4%)
252 (14.0%)
464 (25.8%)
395 (21.9%)
5.05 1.60
Number of people on the main boat
22 (1.2%)
54 (3.0%)
148 (8.3%)
798 (45.0%)
217 (12.2%)
341 (19.2%)
194 (10.9%)
4.65 1.33
Number of people snorkelling
29 (1.6%)
66 (3.7%)
204 (11.4%)
678 (37.9%)
246 (13.7%)
368 (20.5%)
200 (11.2%)
4.65 1.40
Currents in the water around the reef
17 (1.0%)
40 (2.3%)
153 (8.7%)
833 (47.1%)
236 (13.4%)
325 (18.4%)
163 (9.2%)
4.62 1.26
Number of people on the pontoon
28 (1.8%)
46 (2.9%)
136 (8.7%)
725 (46.3%)
173 (11.0%)
286 (18.3%)
173 (11.0%)
4.61 1.35
Amount of wind
44 (2.5%)
88 (4.9%)
229 (12.8%)
699 (39.1%)
209 (11.7%)
334 (18.7%)
187 (10.4%)
4.50 1.45
Number of human-made objects in the water
70 (4.1%)
69 (4.0%)
212 (12.3%)
842 (48.8%)
130 (7.5%)
189 (11.0%)
213 (12.3%)
4.34 1.47